graduating senior survey 2009-2010 uni graduating senior survey was given to all uni graduates prior...
TRANSCRIPT
UNI Graduating Senior Survey Report
December 2009 ● May 2010
Office of Institutional Research
August 2010

Survey Administration
This report provides a summary of the data collected with the administration of the
University of Northern Iowa (UNI) Graduating Senior Survey. The purpose of this report
is to provide an overview of several critical components regarding the academic and
social experiences of UNI students.
The UNI Graduating Senior Survey was given to all UNI graduates prior to
commencement exercises in December 2009 and May 2010. The survey was
completed by 417 students in December 2009 and 1,076 in May and Summer 2010, for
a total of 1,493 respondents (see Table 1 for an illustration of response rates). Students
who chose not to attend the commencement exercises or students who arrived late to
their respective ceremonies were not included in the survey administration.
Table 1. Response Rates for Undergraduate Graduation Sessions
Survey
Respondents All Graduating
Seniors Response Rate
(%) December 2009 417 760 54.9% May and Sum 2010 1076 1436 86.1% 1493 2196 68.0% Total
Survey Highlights
Upon examination of the overall responses to the UNI Graduating Senior Survey,
certain patterns of response emerged. These survey response sets highlight key issues
of importance for UNI students and graduates. The following list presents some of the
key observations of the survey. Agreement is presented in terms of individuals who
responded either “agree” or “strongly agree” to the Academic and Social Environment
2

items and “good” or “excellent” to questions in the Educational Experience and Skills
section.
1) Students reported that they received a premium educational experience at UNI.
o Nearly all students felt they had received a high quality education at UNI
(97.0%).
o 93.0% of students stated that the courses they took at UNI were
intellectually demanding.
o Most students would recommend UNI to prospective students (95.3%).
2) Students had positive interactions and exchanges with faculty members during
their time at UNI.
o Most students said that the faculty they had contact with were dedicated to
their charge and committed to advancing student learning (96.2%).
o Students felt that their professors were intellectually stimulating (92.5%).
o A large percentage of students said that at least one faculty member
showed an active interest in their educational or career goals (97.0%).
o Students agreed that the overall quality of teaching at UNI is excellent
(93.1%).
3) Many students indicate the UNI is a welcoming community where they have had
exposure to cultures and ideas different from their own.
o Just over three-fourths of graduates (77.5%) felt that they have been
prepared for working with people of diverse backgrounds.
o The majority of respondents (83.4%) believed that most UNI students are
tolerant of people whose lifestyles are different from their own.
3
o 88.3% of respondents indicated that the UNI community encourages the
examination of diverse and controversial ideas.
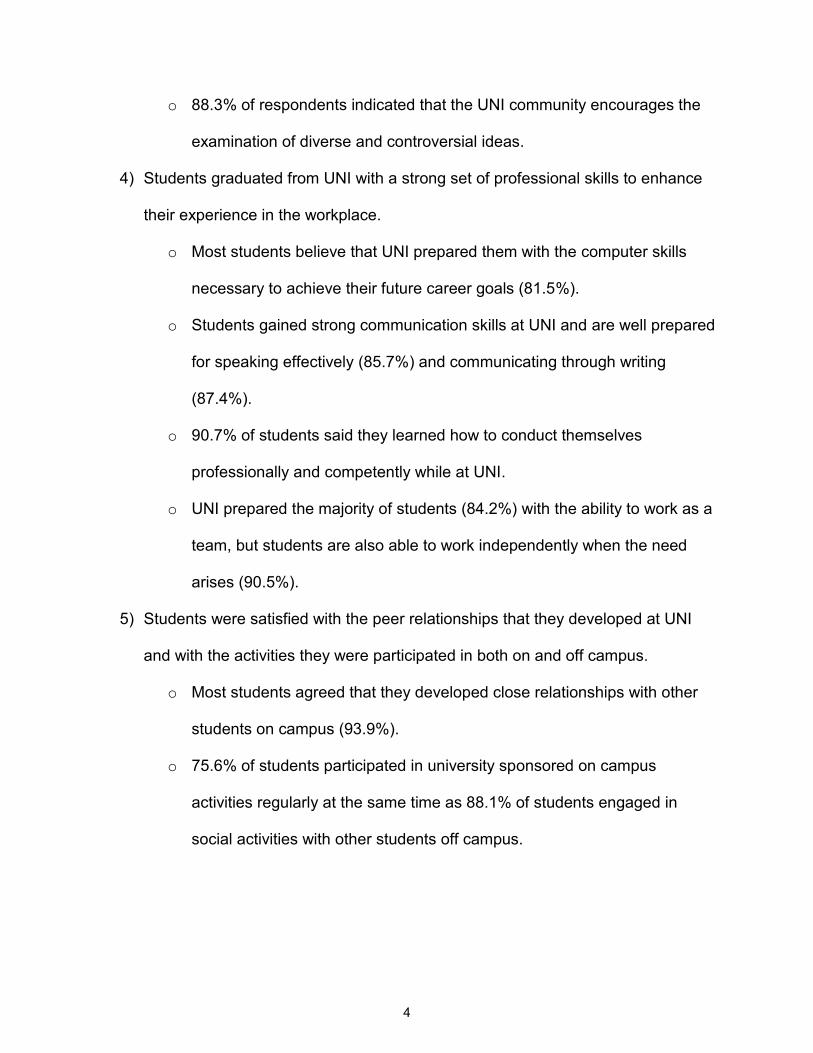
4) Students graduated from UNI with a strong set of professional skills to enhance
their experience in the workplace.
o Most students believe that UNI prepared them with the computer skills
necessary to achieve their future career goals (81.5%).
o Students gained strong communication skills at UNI and are well prepared
for speaking effectively (85.7%) and communicating through writing
(87.4%).
o 90.7% of students said they learned how to conduct themselves
professionally and competently while at UNI.
o UNI prepared the majority of students (84.2%) with the ability to work as a
team, but students are also able to work independently when the need
arises (90.5%).
5) Students were satisfied with the peer relationships that they developed at UNI
and with the activities they were participated in both on and off campus.
o Most students agreed that they developed close relationships with other
students on campus (93.9%).
o 75.6% of students participated in university sponsored on campus
activities regularly at the same time as 88.1% of students engaged in
social activities with other students off campus.
4
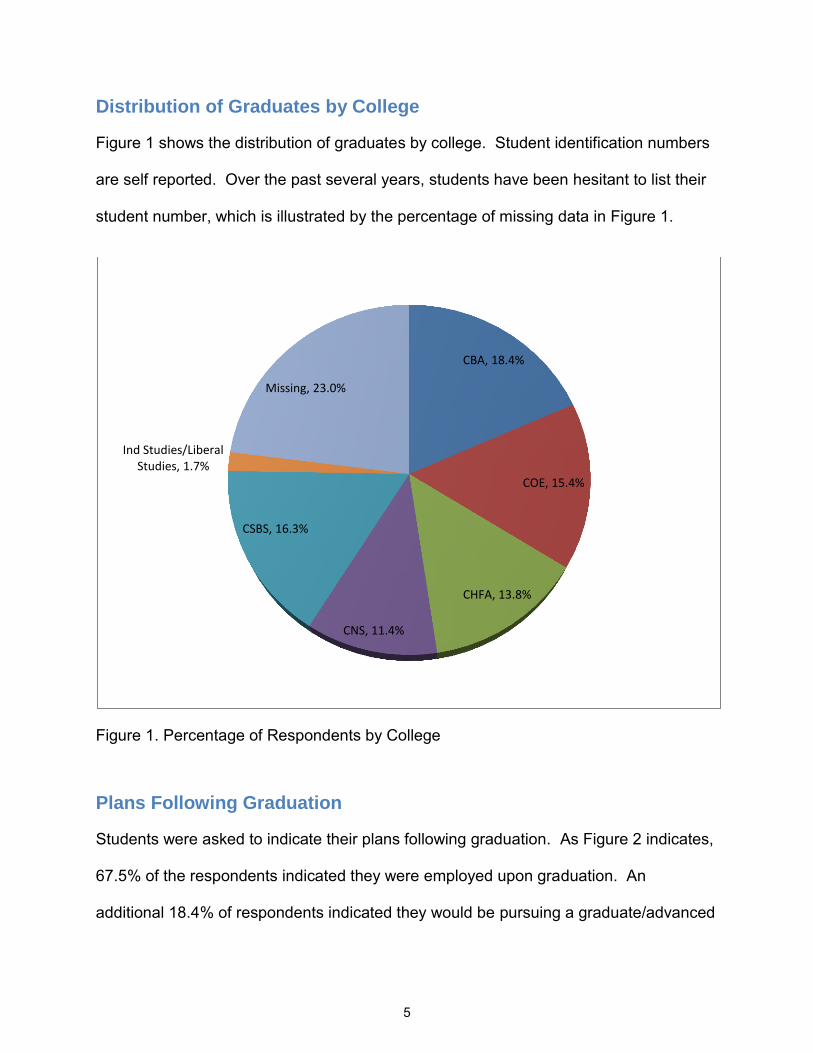
Distribution of Graduates by College
Figure 1 shows the distribution of graduates by college. Student identification numbers
are self reported. Over the past several years, students have been hesitant to list their
student number, which is illustrated by the percentage of missing data in Figure 1.
Figure 1. Percentage of Respondents by College
Plans Following Graduation
Students were asked to indicate their plans following graduation. As Figure 2 indicates,
67.5% of the respondents indicated they were employed upon graduation. An
additional 18.4% of respondents indicated they would be pursuing a graduate/advanced
CBA, 18.4%
COE, 15.4%
CHFA, 13.8%
CNS, 11.4%
CSBS, 16.3%
Ind Studies/Liberal Studies, 1.7%
Missing, 23.0%
5
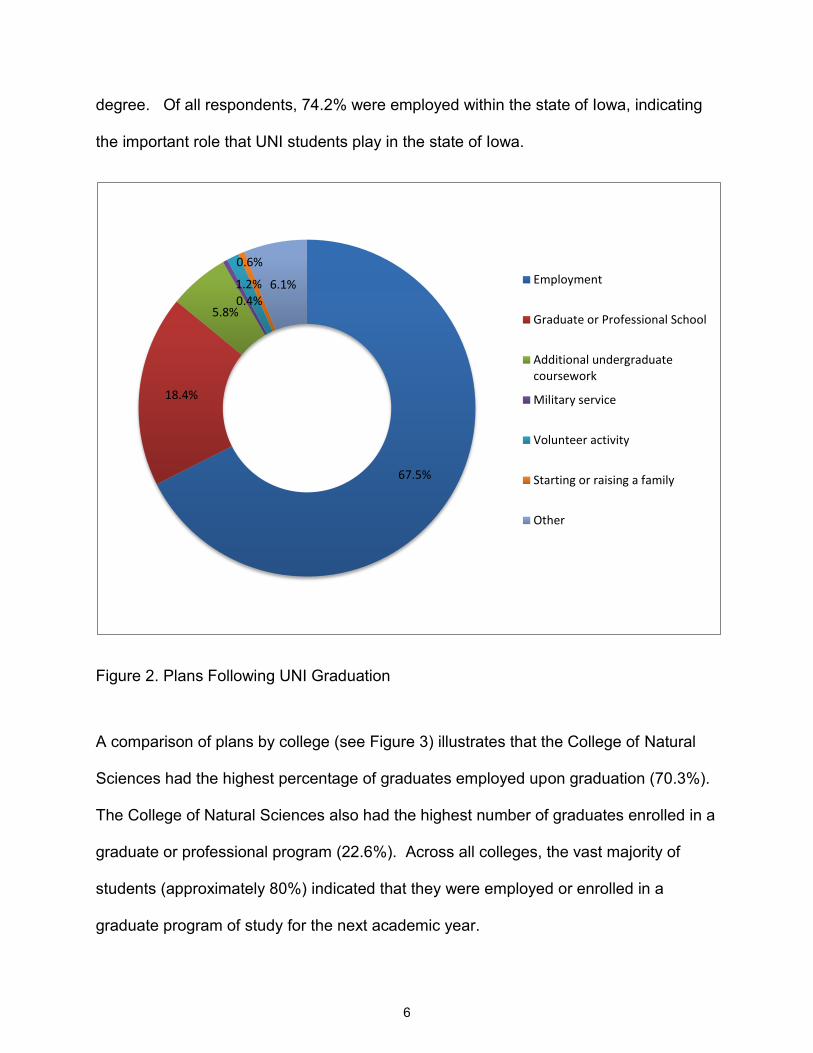
degree. Of all respondents, 74.2% were employed within the state of Iowa, indicating
the important role that UNI students play in the state of Iowa.
Figure 2. Plans Following UNI Graduation
A comparison of plans by college (see Figure 3) illustrates that the College of Natural
Sciences had the highest percentage of graduates employed upon graduation (70.3%).
The College of Natural Sciences also had the highest number of graduates enrolled in a
graduate or professional program (22.6%). Across all colleges, the vast majority of
students (approximately 80%) indicated that they were employed or enrolled in a
graduate program of study for the next academic year.
67.5%
18.4%
5.8% 0.4%
1.2%
0.6%
6.1% Employment
Graduate or Professional School
Additional undergraduatecoursework
Military service
Volunteer activity
Starting or raising a family
Other
6
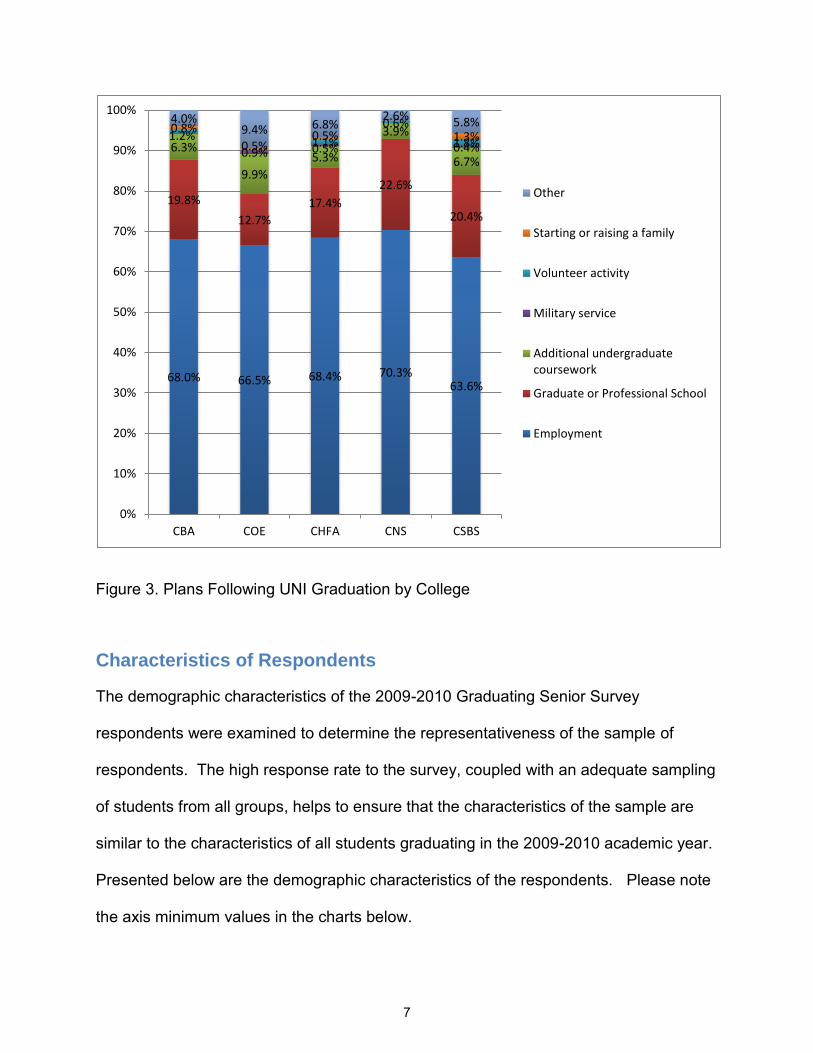
Figure 3. Plans Following UNI Graduation by College
Characteristics of Respondents
The demographic characteristics of the 2009-2010 Graduating Senior Survey
respondents were examined to determine the representativeness of the sample of
respondents. The high response rate to the survey, coupled with an adequate sampling
of students from all groups, helps to ensure that the characteristics of the sample are
similar to the characteristics of all students graduating in the 2009-2010 academic year.
Presented below are the demographic characteristics of the respondents. Please note
the axis minimum values in the charts below.
68.0% 66.5% 68.4% 70.3% 63.6%
19.8%
12.7%
17.4%
22.6%
20.4%
6.3%
9.9%
5.3%
3.9%
6.7% 0.9% 0.5% 0.4%
1.2% 1.1%
0.6%
1.8% 0.8%
0.5% 0.5% 1.3%
4.0% 9.4% 6.8%
2.6% 5.8%
0%
10%
20%
30%
40%
50%
60%
70%
80%
90%
100%
CBA COE CHFA CNS CSBS
Other
Starting or raising a family
Volunteer activity
Military service
Additional undergraduatecoursework
Graduate or Professional School
Employment
7
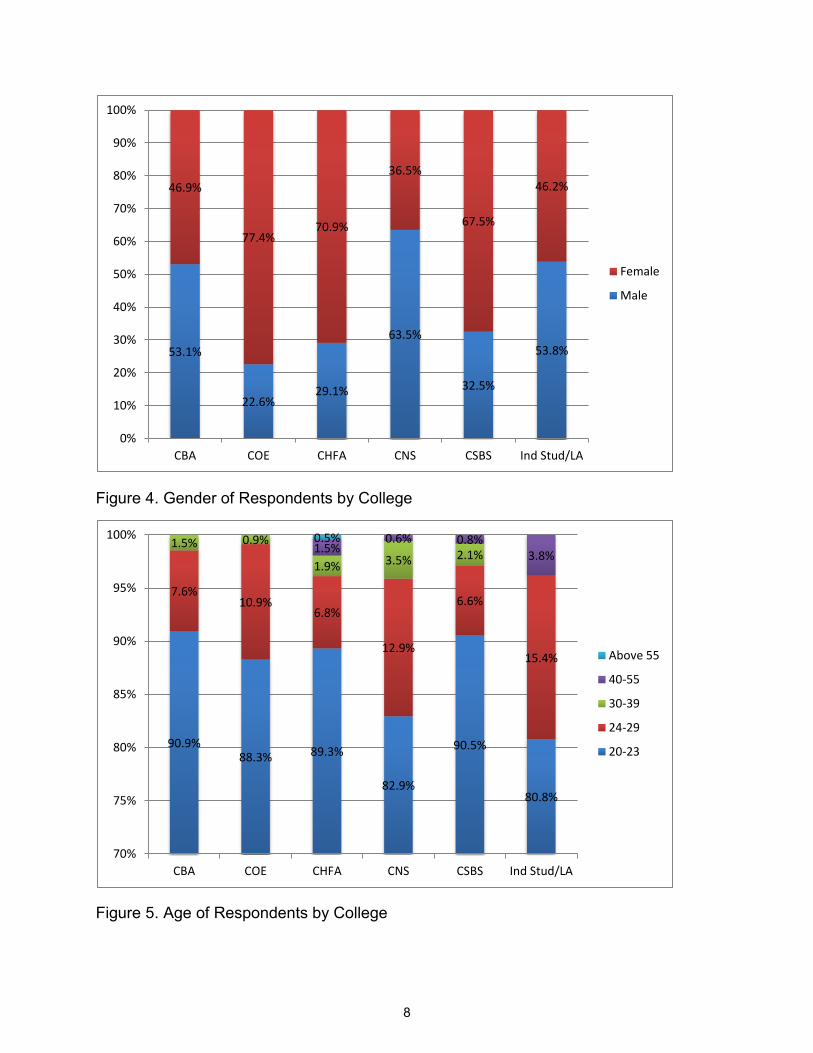
Figure 4. Gender of Respondents by College
Figure 5. Age of Respondents by College
53.1%
22.6% 29.1%
63.5%
32.5%
53.8%
46.9%
77.4% 70.9%
36.5%
67.5%
46.2%
0%
10%
20%
30%
40%
50%
60%
70%
80%
90%
100%
CBA COE CHFA CNS CSBS Ind Stud/LA
Female
Male
90.9% 88.3% 89.3%
82.9%
90.5%
80.8%
7.6% 10.9%
6.8%
12.9%
6.6%
15.4%
1.5% 0.9%
1.9% 3.5% 2.1% 1.5%
0.6% 0.8% 3.8%
0.5%
70%
75%
80%
85%
90%
95%
100%
CBA COE CHFA CNS CSBS Ind Stud/LA
Above 55
40-55
30-39
24-29
20-23
8

Figure 6. Race/Ethnicity of Respondents by College
Institutional Summary of Results
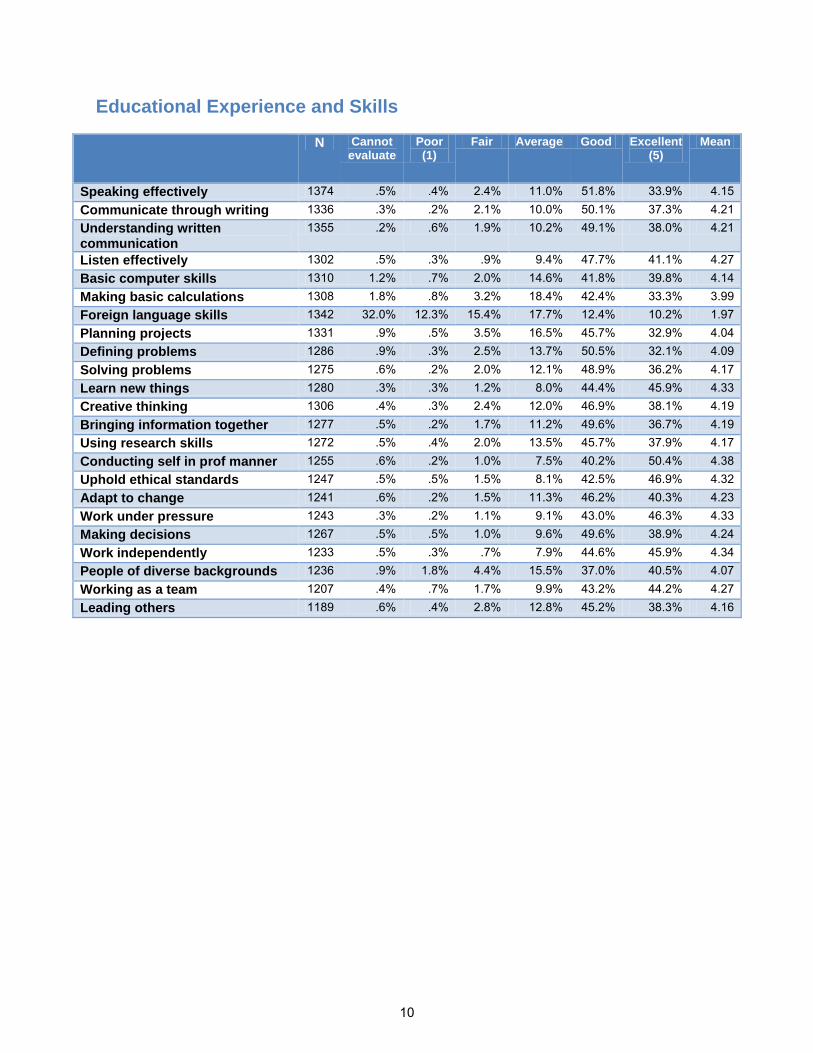
Respondents were asked to indicate how well UNI prepared them for 23 different critical
skills and experiences on a scale from 1 (poor) to 5 (excellent). A “cannot evaluate”
option was also available. They were also asked to indicate the extent to which they
agreed or disagreed to 27 statements regarding the academic and social environment
at UNI on a scale from 1 (strongly disagree) to 4 (strongly agree), with a “not sure”
category available in addition to the other options. A summary of the overall responses
is seen in the tables below, followed by a breakdown of the responses by college.
93.4% 93.4%
88.7%
94.0%
90.0% 88.5%
1.5%
2.0%
1.2%
2.1%
11.5% 0.4%
0.6% 0.4%
1.3%
1.5%
2.5%
0.7%
3.5%
4.4%
0.6% 2.9%
2.2%
0.9%
1.5% 1.8%
1.7% 0.4% 0.7%
1.0%
0.8% 0.7% 0.4% 1.0% 1.8%
82%
84%
86%
88%
90%
92%
94%
96%
98%
100%
CBA COE CHFA CNS CSBS IndStud/LA
No Response
Two or more
Native Hawaiian/Pacific Islander
Non-Resident Alien
Hispanic
Asian
American Indian/Alaskan Native
African American/Black
White
9
Educational Experience and Skills
N Cannot evaluate
Poor (1)
Fair Average Good Excellent (5)
Mean
Speaking effectively 1374 .5% .4% 2.4% 11.0% 51.8% 33.9% 4.15 Communicate through writing 1336 .3% .2% 2.1% 10.0% 50.1% 37.3% 4.21 Understanding written communication
1355 .2% .6% 1.9% 10.2% 49.1% 38.0% 4.21
Listen effectively 1302 .5% .3% .9% 9.4% 47.7% 41.1% 4.27 Basic computer skills 1310 1.2% .7% 2.0% 14.6% 41.8% 39.8% 4.14 Making basic calculations 1308 1.8% .8% 3.2% 18.4% 42.4% 33.3% 3.99 Foreign language skills 1342 32.0% 12.3% 15.4% 17.7% 12.4% 10.2% 1.97 Planning projects 1331 .9% .5% 3.5% 16.5% 45.7% 32.9% 4.04 Defining problems 1286 .9% .3% 2.5% 13.7% 50.5% 32.1% 4.09 Solving problems 1275 .6% .2% 2.0% 12.1% 48.9% 36.2% 4.17 Learn new things 1280 .3% .3% 1.2% 8.0% 44.4% 45.9% 4.33 Creative thinking 1306 .4% .3% 2.4% 12.0% 46.9% 38.1% 4.19 Bringing information together 1277 .5% .2% 1.7% 11.2% 49.6% 36.7% 4.19 Using research skills 1272 .5% .4% 2.0% 13.5% 45.7% 37.9% 4.17 Conducting self in prof manner 1255 .6% .2% 1.0% 7.5% 40.2% 50.4% 4.38 Uphold ethical standards 1247 .5% .5% 1.5% 8.1% 42.5% 46.9% 4.32 Adapt to change 1241 .6% .2% 1.5% 11.3% 46.2% 40.3% 4.23 Work under pressure 1243 .3% .2% 1.1% 9.1% 43.0% 46.3% 4.33 Making decisions 1267 .5% .5% 1.0% 9.6% 49.6% 38.9% 4.24 Work independently 1233 .5% .3% .7% 7.9% 44.6% 45.9% 4.34 People of diverse backgrounds 1236 .9% 1.8% 4.4% 15.5% 37.0% 40.5% 4.07 Working as a team 1207 .4% .7% 1.7% 9.9% 43.2% 44.2% 4.27 Leading others 1189 .6% .4% 2.8% 12.8% 45.2% 38.3% 4.16
10

Academic and Social Environment
N Not Sure
Strongly Disagree
(1)
Disagree Agree Strongly Agree
(4)
Mean
Courses intellectually demanding 1447 .7% .8% 5.5% 72.5% 20.5% 3.11 Instructors intellectually stimulating 1444 1.0% .5% 6.0% 69.5% 23.0% 3.13 Integrated subject matter 1435 1.6% .5% 7.5% 67.5% 22.9% 3.10 Cumulative learning 1433 1.0% .3% 2.0% 66.6% 30.1% 3.24 Lifelong learner 1435 2.4% .8% 6.8% 55.9% 34.1% 3.18 Peers valued achievement 1436 2.6% .8% 7.5% 64.5% 24.7% 3.08 Excellent teaching quality at UNI 1428 1.3% .6% 5.0% 64.7% 28.4% 3.18 Courses in major available 1426 .5% 2.1% 10.2% 57.9% 29.2% 3.13 LAC quality excellent 1428 8.2% 2.7% 16.9% 56.9% 15.3% 2.68 LAC purposes clear 1423 7.4% 3.4% 18.3% 54.5% 16.4% 2.69 LAC intellectually demanding 1426 6.8% 4.2% 18.2% 55.2% 15.6% 2.69 LAC teaching excellent 1423 8.6% 2.5% 13.9% 58.2% 16.7% 2.72 LAC important 1423 7.2% 5.5% 16.5% 51.6% 19.3% 2.70 Faculty committed to learning 1431 .6% .2% 3.0% 58.2% 38.0% 3.33 Faculty interest in goals 1431 .3% .3% 2.4% 43.8% 53.2% 3.49 Close relationships w/ students 1426 .4% .5% 5.2% 50.6% 43.3% 3.36 Off campus social activities 1422 1.0% 1.6% 9.5% 49.2% 38.7% 3.23 On campus activities 1429 1.2% 4.5% 18.6% 50.2% 25.4% 2.94 Alcohol abuse a problem 1433 9.8% 11.0% 42.9% 27.1% 9.3% 2.15 Students tolerant of differences 1428 5.0% 2.4% 9.2% 67.2% 16.2% 2.87 Sexual harassment a problem 1417 12.1% 20.7% 41.2% 19.6% 6.4% 1.87 UNI values excellence 1420 3.9% 1.0% 5.1% 66.8% 23.3% 3.05 UNI values intellectual vitality 1428 3.4% .6% 3.6% 69.3% 23.1% 3.08 Examines diverse ideas 1426 3.9% 1.3% 6.5% 67.2% 21.1% 3.00 High quality education at UNI 1417 .9% .5% 1.6% 52.2% 44.8% 3.39 Recommend major to student 1418 1.8% 1.1% 3.9% 44.1% 48.9% 3.37 Recommend UNI to student 1417 1.4% .8% 2.5% 42.4% 52.9% 3.44
11
Summary of Responses by College
12
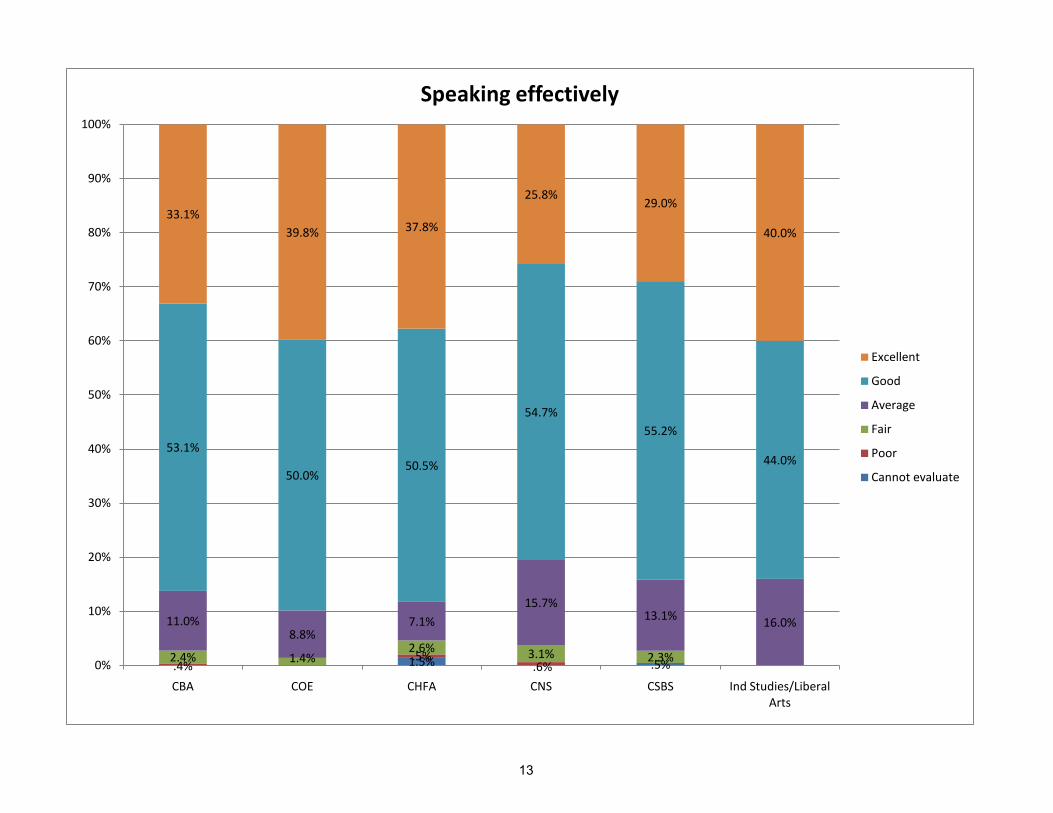
1.5% .5%.4%.5%
.6%2.4% 1.4%
2.6% 3.1% 2.3%
11.0%8.8%
7.1%15.7%
13.1% 16.0%
53.1%
50.0%50.5%
54.7%55.2%
44.0%
33.1%39.8% 37.8%
25.8%29.0%
40.0%
0%
10%
20%
30%
40%
50%
60%
70%
80%
90%
100%
CBA COE CHFA CNS CSBS Ind Studies/Liberal Arts
Speaking effectively
Excellent
Good
Average
Fair
Poor
Cannot evaluate
13
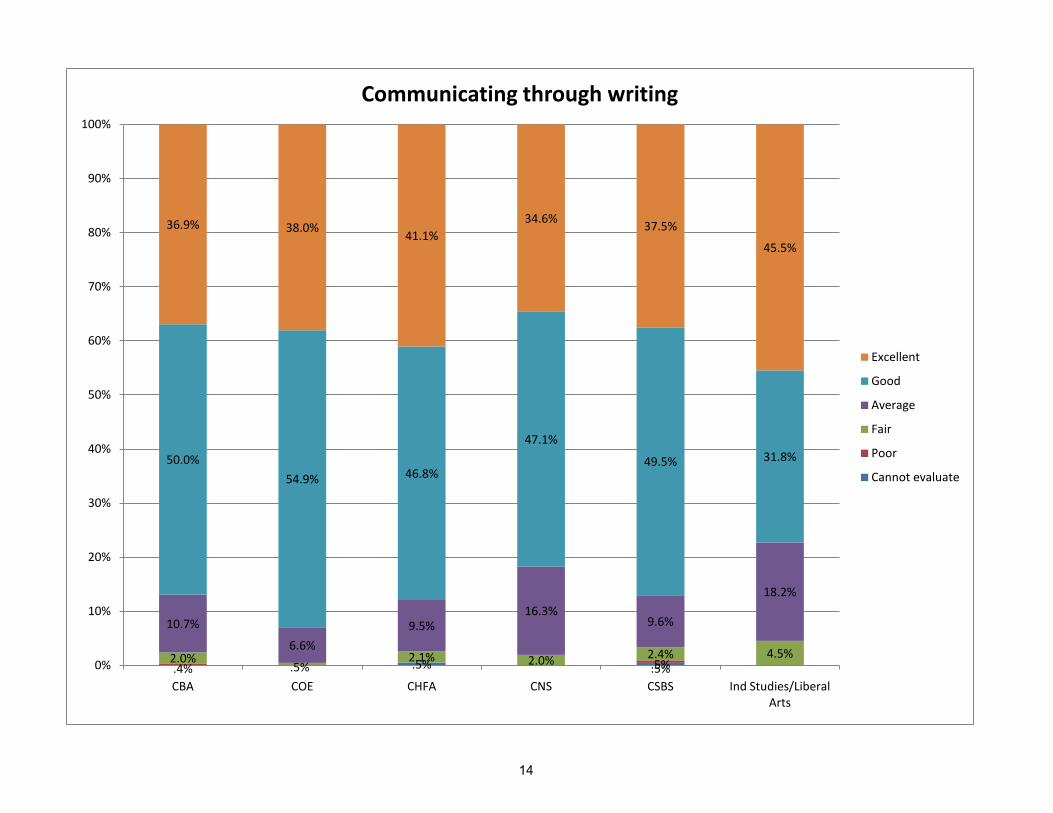
.5% .5%.4% .5%2.0%
.5%2.1% 2.0% 2.4% 4.5%
10.7%
6.6%9.5%
16.3%9.6%
18.2%
50.0%54.9% 46.8%
47.1%
49.5% 31.8%
36.9% 38.0% 41.1%34.6% 37.5%
45.5%
0%
10%
20%
30%
40%
50%
60%
70%
80%
90%
100%
CBA COE CHFA CNS CSBS Ind Studies/Liberal Arts
Communicating through writing
Excellent
Good
Average
Fair
Poor
Cannot evaluate
14

.5% .5%.4% 1.3% .5%2.0% 1.9% 1.1% 1.9% 1.9% 4.3%
7.9% 6.0%11.1%
13.8% 12.2% 8.7%
48.0% 50.0%
48.1%
52.8%
43.2%52.2%
41.7% 42.1% 39.2%
30.2%
41.8%34.8%
0%
10%
20%
30%
40%
50%
60%
70%
80%
90%
100%
CBA COE CHFA CNS CSBS Ind Studies/Liberal Arts
Understanding written communication
Excellent
Good
Average
Fair
Poor
Cannot evaluate
15
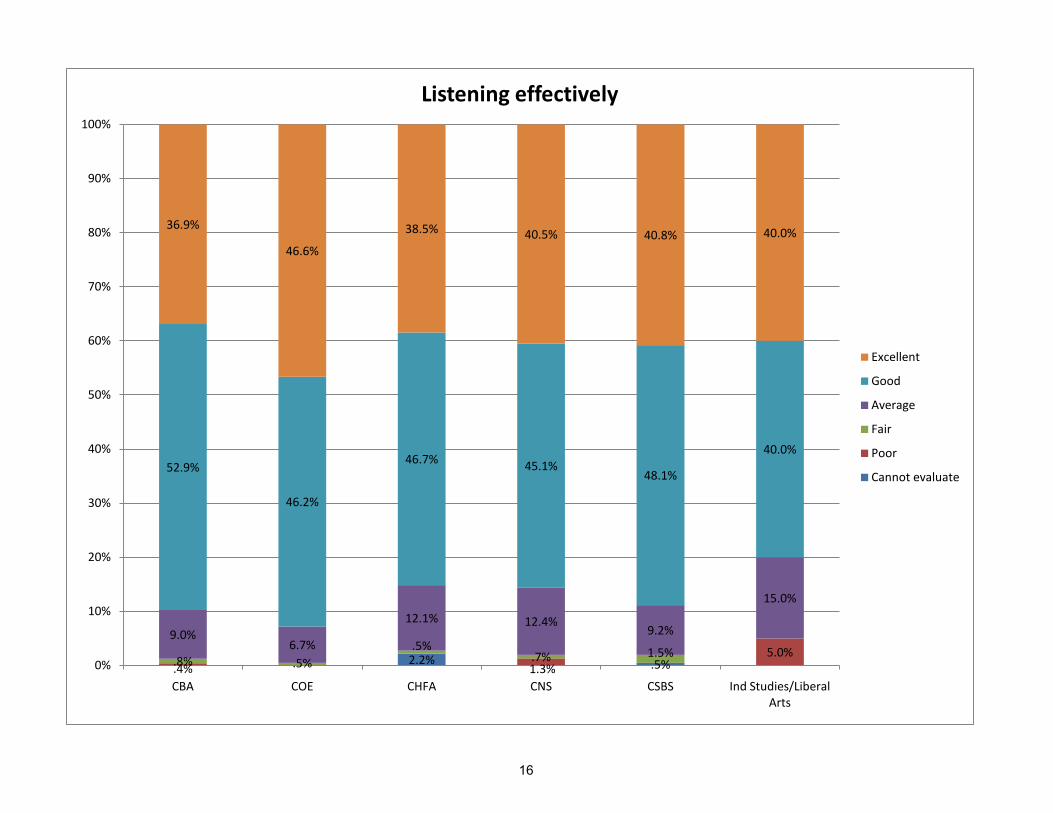
2.2% .5%.4% 1.3%5.0%
.8% .5%.5%
.7% 1.5%9.0%
6.7%
12.1% 12.4%9.2%
15.0%
52.9%
46.2%
46.7% 45.1%48.1%
40.0%
36.9%
46.6%
38.5% 40.5% 40.8% 40.0%
0%
10%
20%
30%
40%
50%
60%
70%
80%
90%
100%
CBA COE CHFA CNS CSBS Ind Studies/Liberal Arts
Listening effectively
Excellent
Good
Average
Fair
Poor
Cannot evaluate
16

.4% 1.4% 4.4%1.0%
1.6%
.7%1.0%.8% .9%
3.3%
2.1%3.4% 9.1%
14.4%16.5%
14.8%
14.0%14.5% 9.1%
39.2%38.7%
36.8%
37.1%
43.0%40.9%
44.8% 42.5%39.0%
46.2%
37.2%40.9%
0%
10%
20%
30%
40%
50%
60%
70%
80%
90%
100%
CBA COE CHFA CNS CSBS Ind Studies/Liberal Arts
Using basic computer skills (word processing, spreadsheets, etc.)
Excellent
Good
Average
Fair
Poor
Cannot evaluate
17

.8% 1.0%5.9%
.7% 1.9% 4.8%.4%
1.1%
2.0% 1.5%
4.8%2.0% 2.4%
5.4%
2.0%5.3%
9.5%
13.8%17.5%
23.8%
14.1%
22.3%
19.0%
39.1%
43.2%
38.4%
38.3%
45.6% 33.3%
43.9%
35.9%
25.4%
43.0%
23.3%28.6%
0%
10%
20%
30%
40%
50%
60%
70%
80%
90%
100%
CBA COE CHFA CNS CSBS Ind Studies/Liberal Arts
Making basic calculations and computations
Excellent
Good
Average
Fair
Poor
Cannot evaluate
18

36.0%30.7%
35.1%30.9% 29.9%
26.1%
8.7%13.5%
10.3% 16.1% 15.9% 21.7%
16.2%14.0% 13.4% 12.8% 14.5%
26.1%
18.6%19.5% 16.5%
21.5%16.8%
4.3%
10.3% 13.0%12.9%
6.7% 13.6% 8.7%
10.3% 9.3% 11.9% 12.1% 9.3%13.0%
0%
10%
20%
30%
40%
50%
60%
70%
80%
90%
100%
CBA COE CHFA CNS CSBS Ind Studies/Liberal Arts
Using foreign language skills
Excellent
Good
Average
Fair
Poor
Cannot evaluate
19

.4% .9% 1.6% 1.3% 1.4%.5% 1.3% 1.0% 4.5%2.4% 2.3%3.7% 5.2% 6.2% 4.5%
19.2%12.1%
18.9%20.8%
14.8%
27.3%
45.2%
41.4%
42.6%
43.5%47.1%
40.9%
32.8%
43.3%
32.6%27.9% 29.5%
22.7%
0%
10%
20%
30%
40%
50%
60%
70%
80%
90%
100%
CBA COE CHFA CNS CSBS Ind Studies/Liberal Arts
Planning projects
Excellent
Good
Average
Fair
Poor
Cannot evaluate
20

.4% 1.0% 1.6% 1.5%1.4% 1.0%.8% 2.4% 2.2% 3.4% 3.9%13.6%
14.2% 8.3%
20.4%14.4% 13.1%
18.2%
50.6%53.7%
50.5%
45.9%48.5%
36.4%
33.9% 34.6%
25.3%
34.9% 32.0% 31.8%
0%
10%
20%
30%
40%
50%
60%
70%
80%
90%
100%
CBA COE CHFA CNS CSBS Ind Studies/Liberal Arts
Defining problems
Excellent
Good
Average
Fair
Poor
Cannot evaluate
21
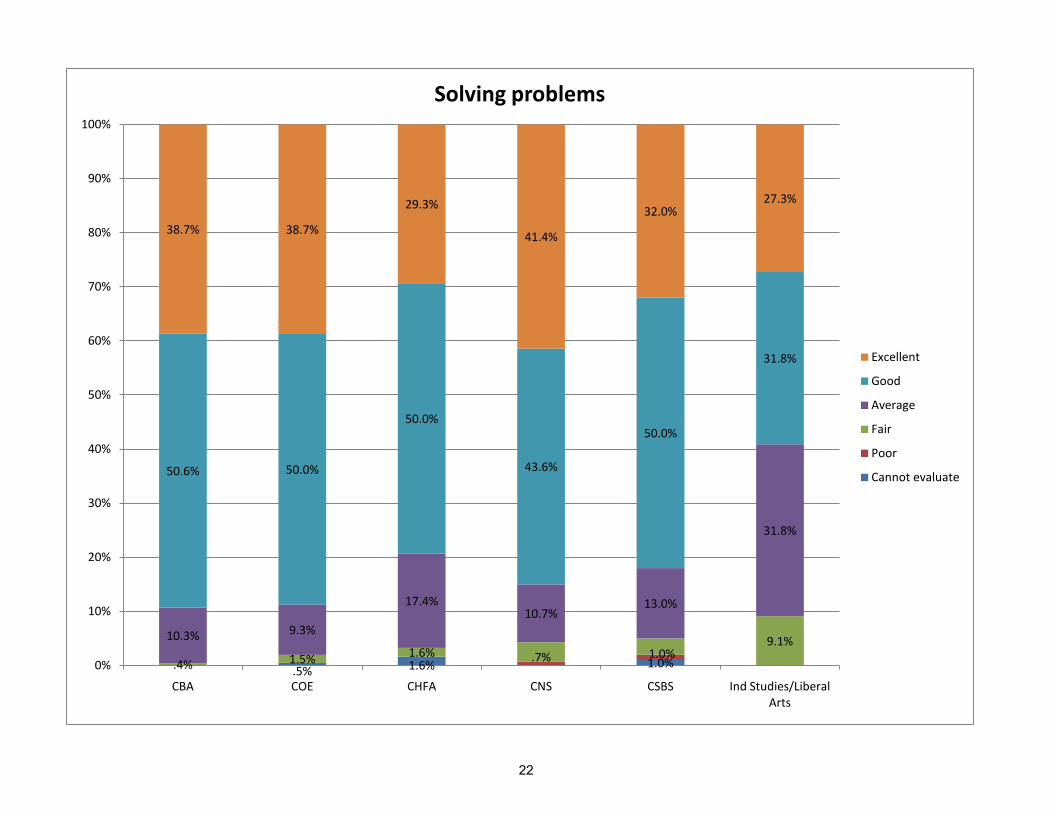
.5% 1.6% 1.0%.7% 1.0%.4% 1.5% 1.6%
9.1%10.3% 9.3%
17.4%10.7%
13.0%
31.8%
50.6% 50.0%
50.0%
43.6%
50.0%
31.8%
38.7% 38.7%
29.3%
41.4%
32.0%27.3%
0%
10%
20%
30%
40%
50%
60%
70%
80%
90%
100%
CBA COE CHFA CNS CSBS Ind Studies/Liberal Arts
Solving problems
Excellent
Good
Average
Fair
Poor
Cannot evaluate
22
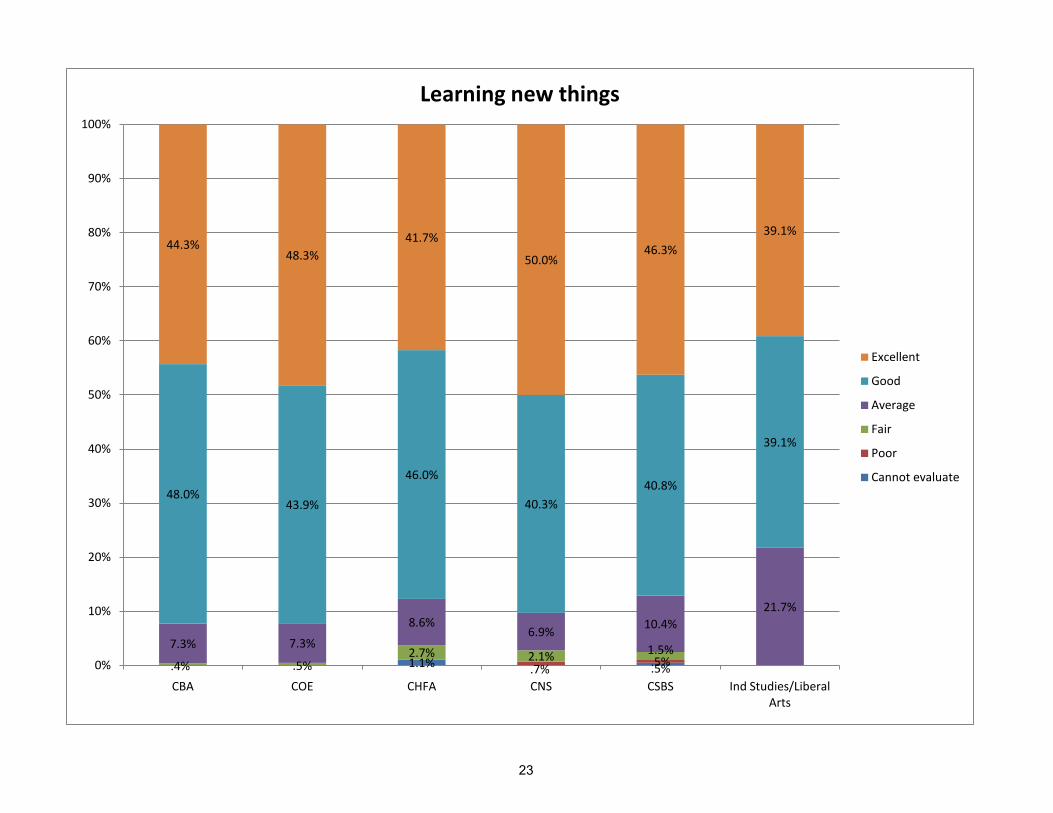
1.1% .5%.7% .5%.4% .5%2.7% 2.1% 1.5%7.3% 7.3%
8.6%6.9% 10.4%
21.7%
48.0%43.9%
46.0%
40.3%40.8%
39.1%
44.3%48.3%
41.7%
50.0%46.3%
39.1%
0%
10%
20%
30%
40%
50%
60%
70%
80%
90%
100%
CBA COE CHFA CNS CSBS Ind Studies/Liberal Arts
Learning new things
Excellent
Good
Average
Fair
Poor
Cannot evaluate
23

.5% .5% .5%.4%.5% .7%2.0% 2.4% .5% 4.1% 3.8%
9.1%
18.2%
7.1% 11.5%
15.6%
8.2%
9.1%
47.4%
46.2%44.5%
40.8%50.0%
45.5%
32.0%
43.8% 42.4%38.8% 37.5% 36.4%
0%
10%
20%
30%
40%
50%
60%
70%
80%
90%
100%
CBA COE CHFA CNS CSBS Ind Studies/Liberal Arts
Thinking creatively
Excellent
Good
Average
Fair
Poor
Cannot evaluate
24

1.1% .7% 1.0%1.4%1.7% 1.0%.6% 2.1% 2.5%
9.1%11.4%
6.3%12.2%
13.8%9.4%
31.8%
51.1%56.3%
51.4% 42.1% 50.2%
27.3%
35.9% 36.4% 34.8%40.0% 36.9%
31.8%
0%
10%
20%
30%
40%
50%
60%
70%
80%
90%
100%
CBA COE CHFA CNS CSBS Ind Studies/Liberal Arts
Bringing information/ideas together from different areas
Excellent
Good
Average
Fair
Poor
Cannot evaluate
25

.5% .5% .5%
.5%.7% 1.0% 4.8%
1.7%2.0% 1.1% 2.8% 2.5%
12.4% 12.7% 17.6% 12.5% 11.3%
23.8%
46.3% 42.4%
44.0%46.5% 45.1%
38.1%
39.7% 42.0%36.8% 37.5% 39.7%
33.3%
0%
10%
20%
30%
40%
50%
60%
70%
80%
90%
100%
CBA COE CHFA CNS CSBS Ind Studies/Liberal Arts
Using research skills
Excellent
Good
Average
Fair
Poor
Cannot evaluate
26
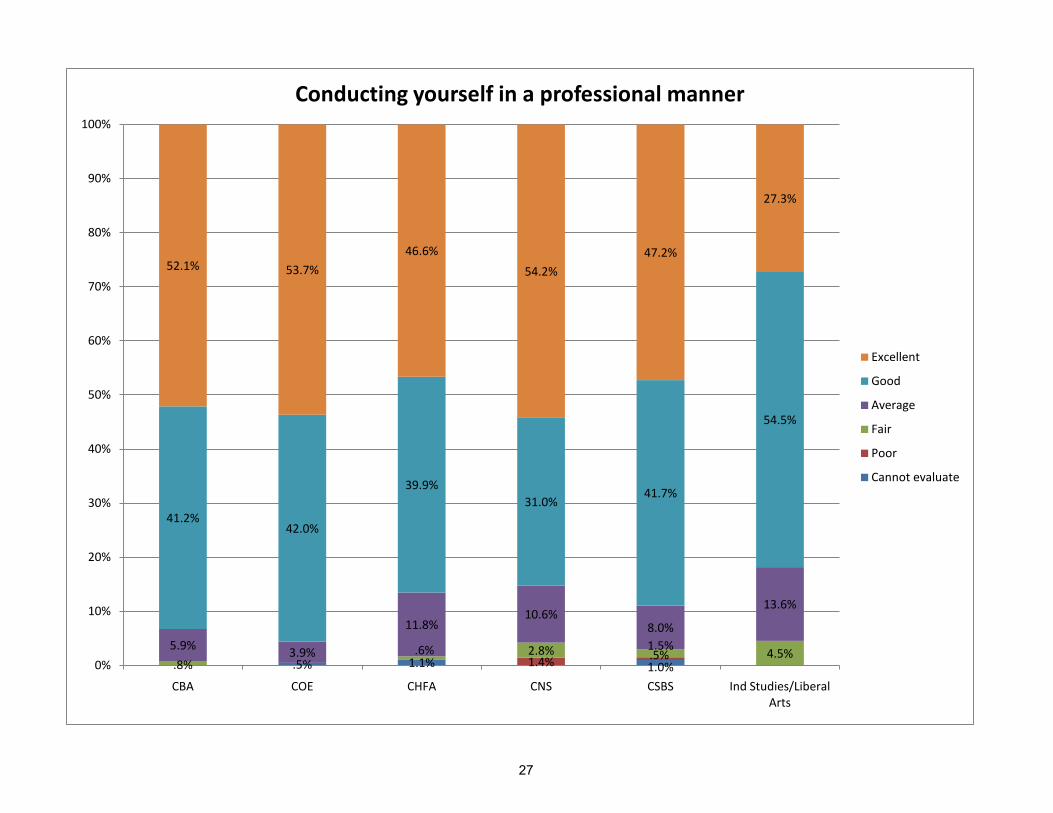
.5% 1.1% 1.0%1.4% .5%.8%
.6% 2.8% 1.5% 4.5%5.9% 3.9%
11.8%10.6%
8.0%
13.6%
41.2%42.0%
39.9%31.0%
41.7%
54.5%
52.1% 53.7%46.6%
54.2%47.2%
27.3%
0%
10%
20%
30%
40%
50%
60%
70%
80%
90%
100%
CBA COE CHFA CNS CSBS Ind Studies/Liberal Arts
Conducting yourself in a professional manner
Excellent
Good
Average
Fair
Poor
Cannot evaluate
27
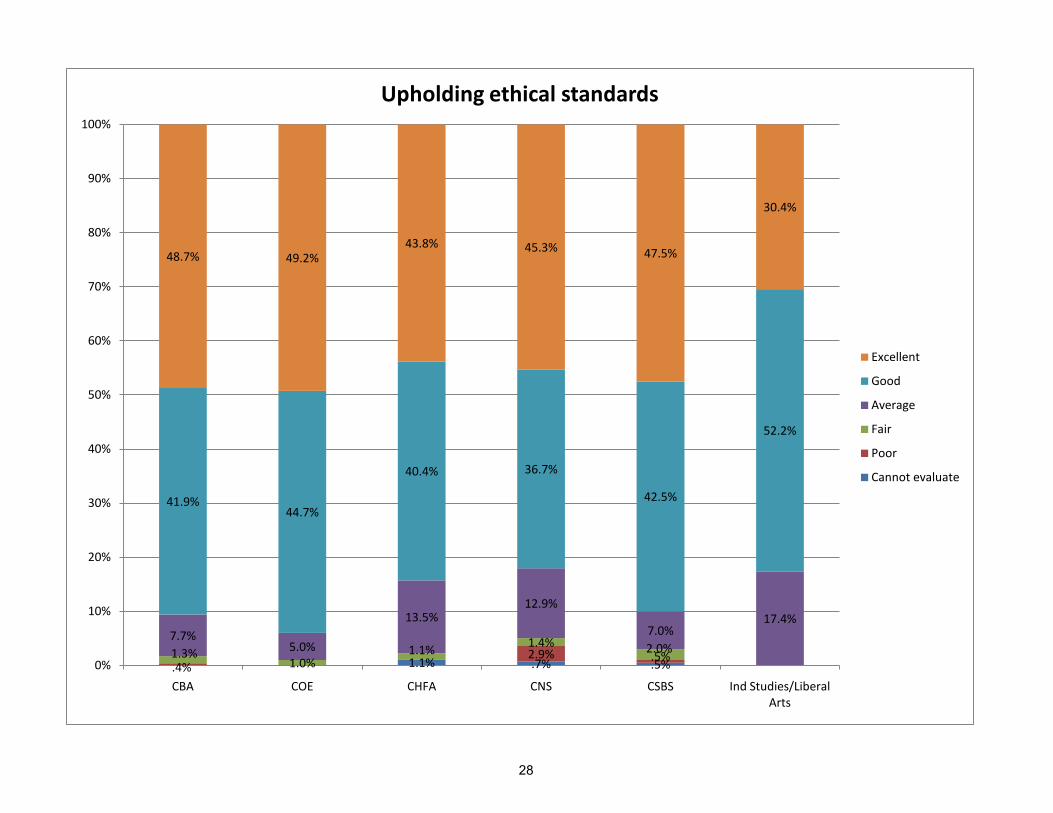
1.1% .7% .5%.4%2.9% .5%1.3%
1.0%1.1% 1.4% 2.0%
7.7%5.0%
13.5%12.9%
7.0%17.4%
41.9%44.7%
40.4% 36.7%
42.5%
52.2%
48.7% 49.2%43.8% 45.3% 47.5%
30.4%
0%
10%
20%
30%
40%
50%
60%
70%
80%
90%
100%
CBA COE CHFA CNS CSBS Ind Studies/Liberal Arts
Upholding ethical standards
Excellent
Good
Average
Fair
Poor
Cannot evaluate
28
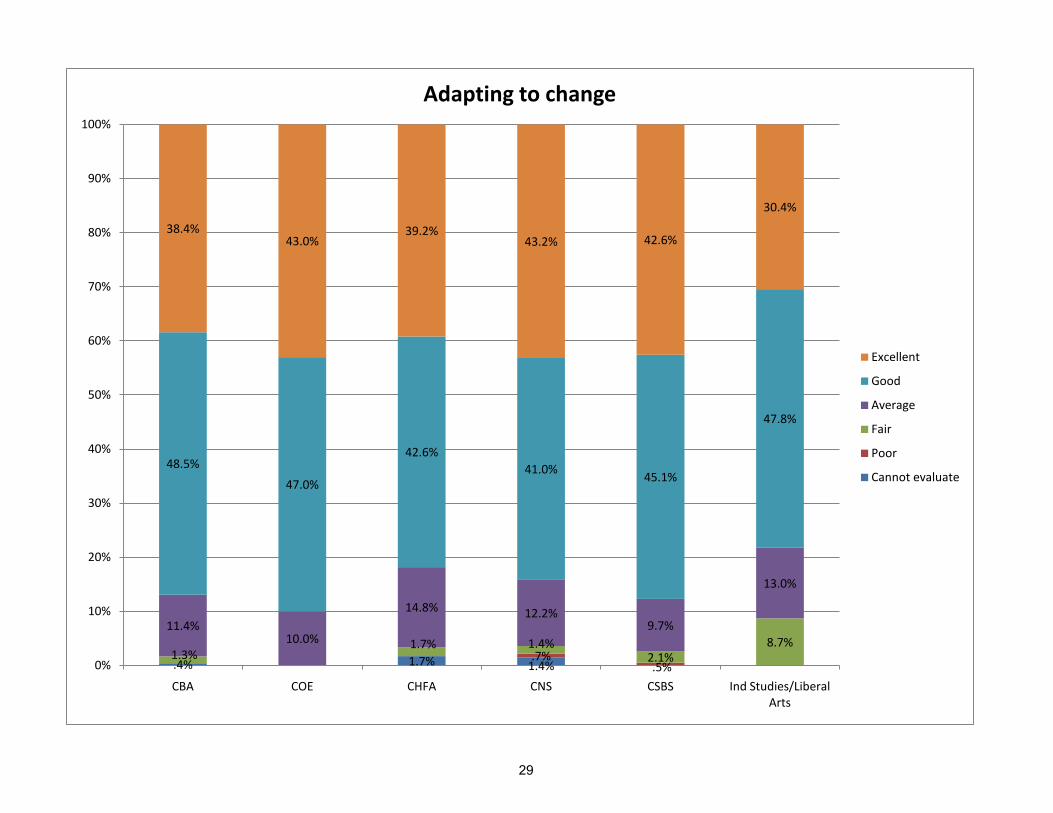
11.4%10.0%
14.8% 12.2%9.7%
13.0%
48.5%47.0%
42.6%41.0% 45.1%
47.8%
38.4%43.0%
39.2%43.2% 42.6%
30.4%
.4% 1.7% 1.4%.7%
.5%1.3%
1.7% 1.4%2.1%
8.7%
0%
10%
20%
30%
40%
50%
60%
70%
80%
90%
100%
CBA COE CHFA CNS CSBS Ind Studies/Liberal Arts
Adapting to change
Excellent
Good
Average
Fair
Poor
Cannot evaluate
29
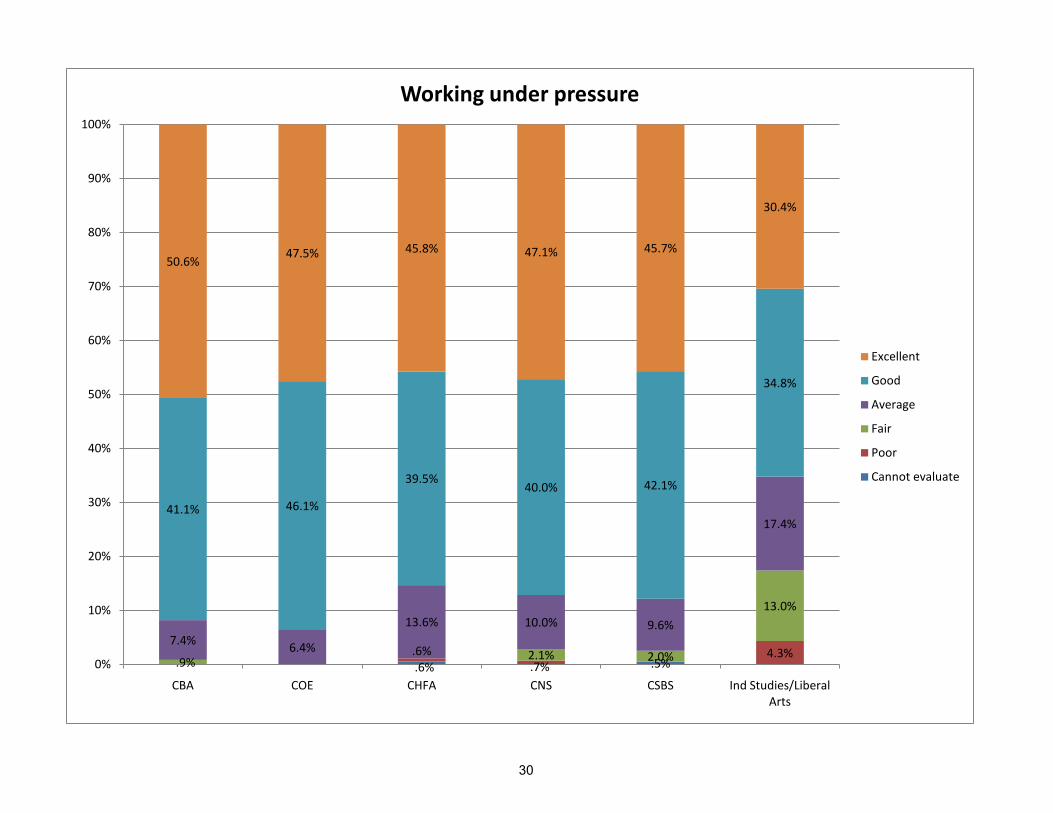
.6% .5%.6%
.7%4.3%
.9% 2.1% 2.0%
13.0%
7.4% 6.4%
13.6% 10.0% 9.6%
17.4%41.1% 46.1%
39.5%40.0% 42.1%
34.8%
50.6% 47.5% 45.8% 47.1% 45.7%
30.4%
0%
10%
20%
30%
40%
50%
60%
70%
80%
90%
100%
CBA COE CHFA CNS CSBS Ind Studies/Liberal Arts
Working under pressure
Excellent
Good
Average
Fair
Poor
Cannot evaluate
30
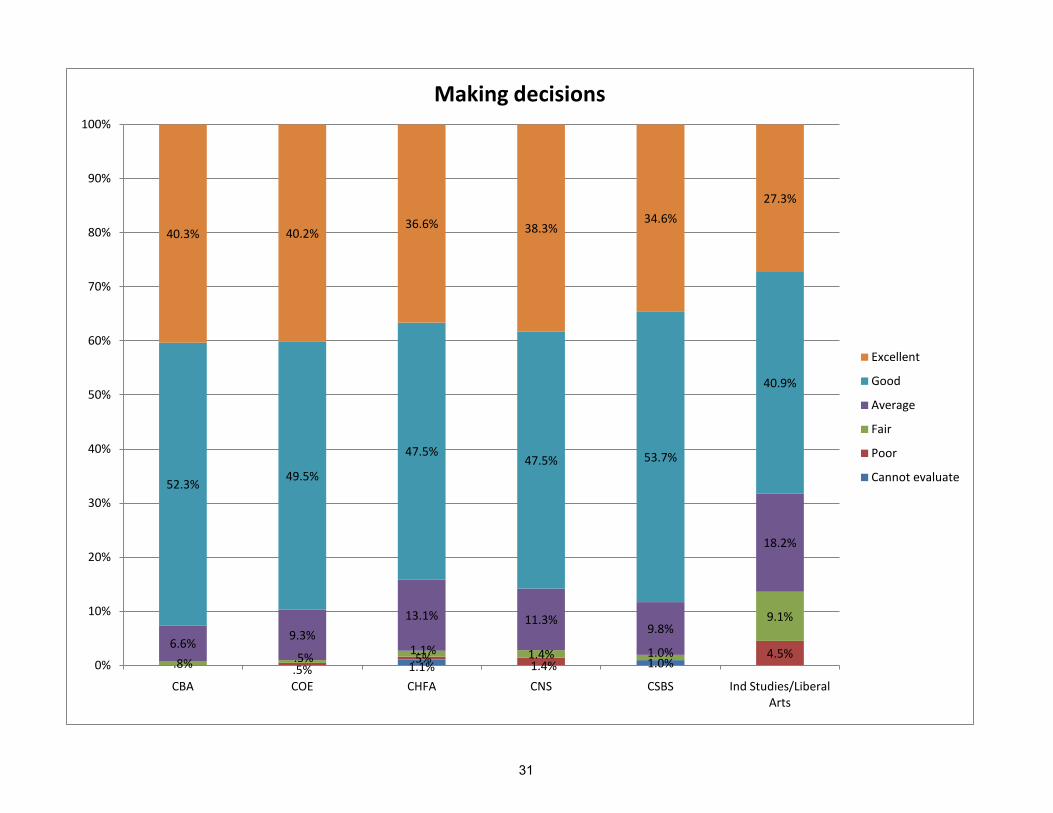
1.1% 1.0%.5% .5% 1.4%4.5%
.8% .5%1.1% 1.4% 1.0%
9.1%
6.6% 9.3%13.1% 11.3%
9.8%
18.2%
52.3% 49.5%
47.5%47.5% 53.7%
40.9%
40.3% 40.2%36.6% 38.3%
34.6%27.3%
0%
10%
20%
30%
40%
50%
60%
70%
80%
90%
100%
CBA COE CHFA CNS CSBS Ind Studies/Liberal Arts
Making decisions
Excellent
Good
Average
Fair
Poor
Cannot evaluate
31

1.7% .5%.6%
.7% .5%.8% .5% 1.5% 1.0%5.0% 7.2%9.6% 8.8% 7.0%
33.3%
45.4%46.4%
44.6%39.4% 44.7%
33.3%
48.7% 45.9% 43.5%49.6%
46.2%
33.3%
0%
10%
20%
30%
40%
50%
60%
70%
80%
90%
100%
CBA COE CHFA CNS CSBS Ind Studies/Liberal Arts
Working independently
Excellent
Good
Average
Fair
Poor
Cannot evaluate
32

1.1% 1.4% 1.5%2.6% 1.0% 1.1% 1.4% 3.1% 4.8%4.3% 4.5% 3.4%
5.8% 3.6%9.5%
14.5%12.9%
17.4% 14.4% 16.3%
23.8%
37.9%40.6%
38.2% 36.0% 34.2%
23.8%
40.9% 41.1% 38.8% 41.0% 41.3%38.1%
0%
10%
20%
30%
40%
50%
60%
70%
80%
90%
100%
CBA COE CHFA CNS CSBS Ind Studies/Liberal Arts
Working with people of diverse backgrounds
Excellent
Good
Average
Fair
Poor
Cannot evaluate
33

.5% 1.1%.5% 1.6% 1.0%
9.5%1.3%
1.7% 1.6% 3.7%
9.5%
6.4% 7.1%
13.6% 14.0% 7.9%
14.3%
47.0% 44.2%
41.8% 38.0% 47.6%
38.1%
45.3% 47.7%41.8%
45.0%39.8%
28.6%
0%
10%
20%
30%
40%
50%
60%
70%
80%
90%
100%
CBA COE CHFA CNS CSBS Ind Studies/Liberal Arts
Working as a team
Excellent
Good
Average
Fair
Poor
Cannot evaluate
34

.5% 1.2% .8% 1.0%.5% .6% .8% 5.6%1.7% 2.1% 2.4% 3.8% 3.7%
16.7%
10.0% 9.9%
15.7% 14.3% 13.1%
22.2%48.5% 44.8%
42.8% 45.9% 47.6%
22.2%
39.7% 42.2%37.3% 34.6% 34.6% 33.3%
0%
10%
20%
30%
40%
50%
60%
70%
80%
90%
100%
CBA COE CHFA CNS CSBS Ind Studies/Liberal Arts
Leading others
Excellent
Good
Average
Fair
Poor
Cannot evaluate
35

.8% 1.5% .9%.4% .4% 2.4% .9%4.2% 4.4%7.4% 7.1%
4.3% 8.3%
74.7% 77.1% 71.3% 67.3% 72.8% 66.7%
20.0% 18.1% 19.8%23.2% 21.3%
25.0%
0%
10%
20%
30%
40%
50%
60%
70%
80%
90%
100%
CBA COE CHFA CNS CSBS Ind Studies/Liberal Arts
Most of the courses I took at UNI were intellectually demanding
Strongly agree
Agree
Disagree
Strongly disagree
Not sure
36

1.9% .9% .5% .9%.8%
1.2%
5.7%4.9% 6.9% 5.4% 6.8%
16.7%
71.7%73.5% 67.3% 69.6% 67.5%
58.3%
20.0% 20.8%25.2% 23.8% 24.8% 25.0%
0%
10%
20%
30%
40%
50%
60%
70%
80%
90%
100%
CBA COE CHFA CNS CSBS Ind Studies/Liberal Arts
Most of my instructors were intellectually stimulating
Strongly agree
Agree
Disagree
Strongly disagree
Not sure
37

2.3% .9% 2.0% 1.2% 1.3%.5% 2.4%
7.2%6.6%
8.5% 7.7%7.7%
16.7%
66.9% 70.5%67.5% 65.5% 68.7%
50.0%
23.6% 22.0% 21.5% 23.2% 22.3%
33.3%
0%
10%
20%
30%
40%
50%
60%
70%
80%
90%
100%
CBA COE CHFA CNS CSBS Ind Studies/Liberal Arts
Most of my courses required integration of subject matter from several academic areas
Strongly agree
Agree
Disagree
Strongly disagree
Not sure
38
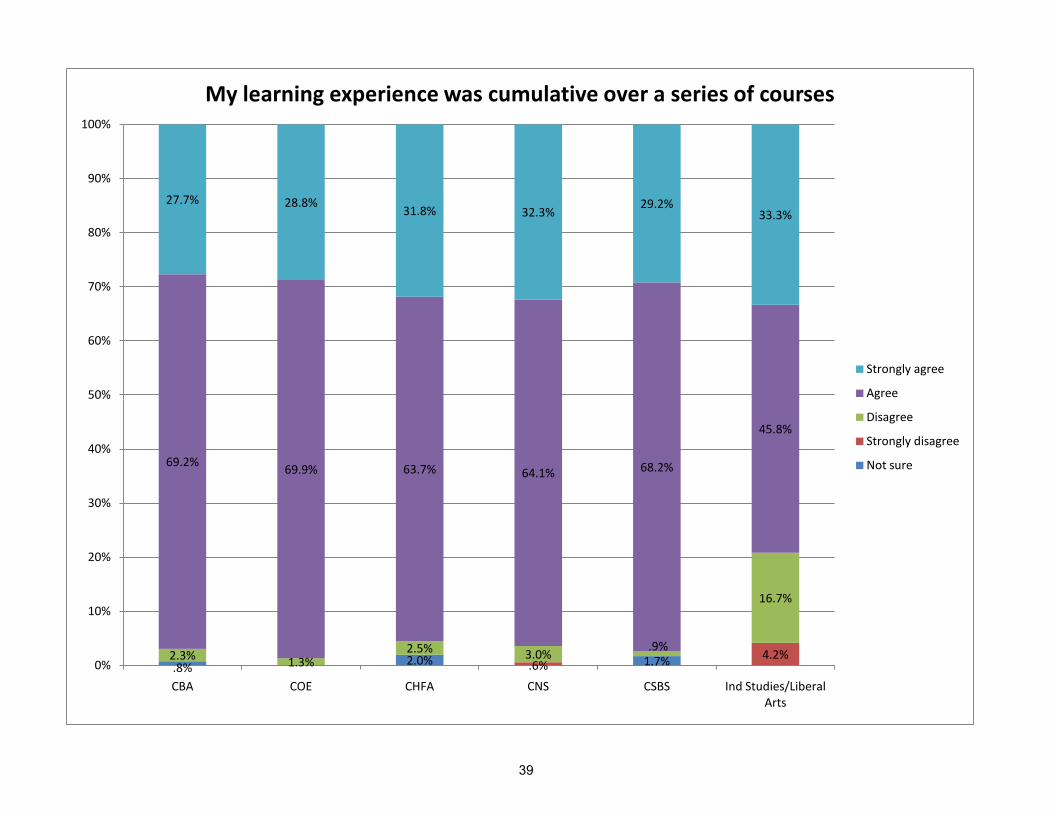
.8% 2.0% 1.7%.6%4.2%2.3% 1.3%
2.5% 3.0% .9%
16.7%
69.2% 69.9% 63.7% 64.1% 68.2%
45.8%
27.7% 28.8% 31.8% 32.3%29.2%
33.3%
0%
10%
20%
30%
40%
50%
60%
70%
80%
90%
100%
CBA COE CHFA CNS CSBS Ind Studies/Liberal Arts
My learning experience was cumulative over a series of courses
Strongly agree
Agree
Disagree
Strongly disagree
Not sure
39
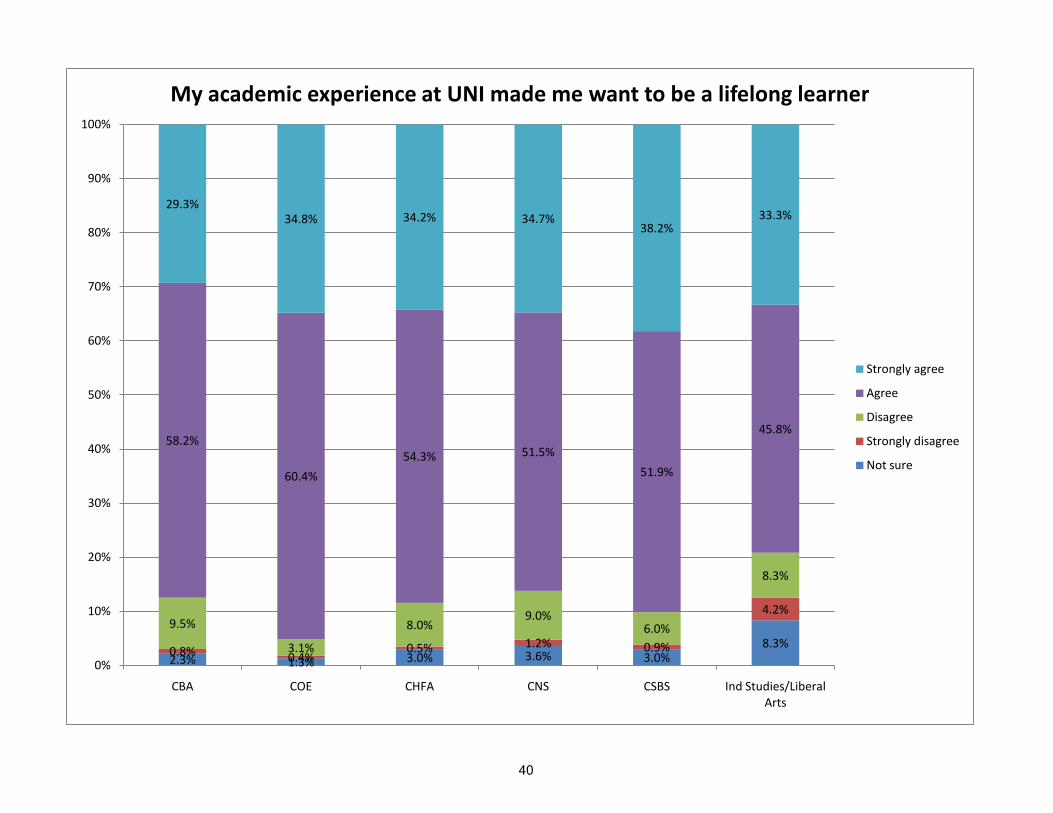
2.3% 1.3% 3.0% 3.6% 3.0%8.3%0.8% 0.4%
0.5% 1.2% 0.9%
4.2%9.5%
3.1%
8.0%9.0%
6.0%
8.3%
58.2%
60.4%54.3% 51.5%
51.9%
45.8%
29.3%34.8% 34.2% 34.7%
38.2%33.3%
0%
10%
20%
30%
40%
50%
60%
70%
80%
90%
100%
CBA COE CHFA CNS CSBS Ind Studies/Liberal Arts
My academic experience at UNI made me want to be a lifelong learner
Strongly agree
Agree
Disagree
Strongly disagree
Not sure
40

1.5% 1.3% 3.5% 3.6% 4.7%8.3%.8% .5% 1.2% 1.3%
8.3%
7.2%3.5%
8.5%11.3% 8.2%
12.5%
66.9%
68.3%
65.8% 58.9% 60.5%
45.8%
23.6%26.9%
21.6%25.0% 25.3% 25.0%
0%
10%
20%
30%
40%
50%
60%
70%
80%
90%
100%
CBA COE CHFA CNS CSBS Ind Studies/Liberal Arts
Most of my students peers valued high academic achievement
Strongly agree
Agree
Disagree
Strongly disagree
Not sure
41

1.1% 1.3% 1.5% 1.2% .9%4.2%.4% .9% 1.8%
6.1% 1.3% 4.0%4.2% 8.2% 4.2%
66.5%
65.3% 63.6%
68.7% 63.4%58.3%
25.9%31.1% 30.8%
24.1%27.6%
33.3%
0%
10%
20%
30%
40%
50%
60%
70%
80%
90%
100%
CBA COE CHFA CNS CSBS Ind Studies/Liberal Arts
The overall quality of teaching at UNI is excellent
Strongly agree
Agree
Disagree
Strongly disagree
Not sure
42

.4% .9% .5% .4%1.5% 1.3% 2.5% 4.3% 2.1% 8.3%7.6% 7.1%
15.7% 14.6%11.6%
12.5%
63.3% 63.7%49.7%
53.7%56.7%
50.0%
27.3% 27.0%31.5%
27.4% 29.2% 29.2%
0%
10%
20%
30%
40%
50%
60%
70%
80%
90%
100%
CBA COE CHFA CNS CSBS Ind Studies/Liberal Arts
Most of the courses in my major were readily available when I wanted to take them
Strongly agree
Agree
Disagree
Strongly disagree
Not sure
43
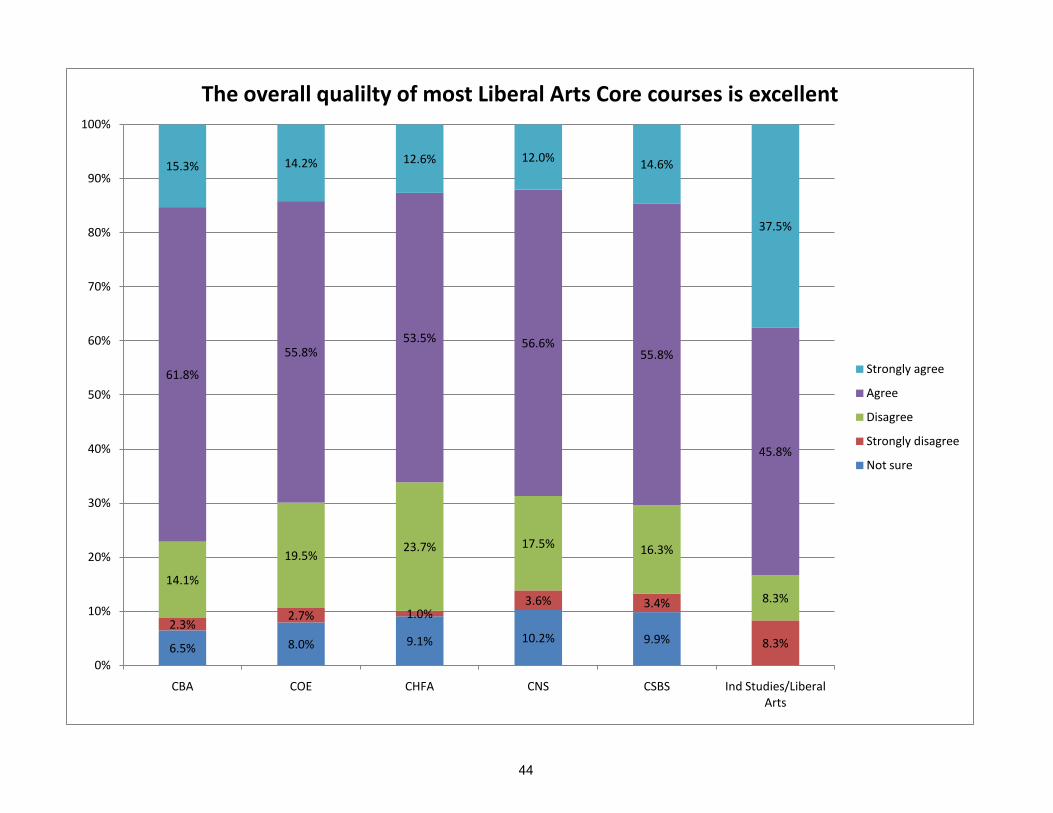
6.5% 8.0% 9.1% 10.2% 9.9%2.3%
2.7% 1.0%3.6% 3.4%
8.3%
14.1%
19.5%23.7% 17.5% 16.3%
8.3%
61.8%
55.8%53.5% 56.6%
55.8%
45.8%
15.3% 14.2% 12.6% 12.0% 14.6%
37.5%
0%
10%
20%
30%
40%
50%
60%
70%
80%
90%
100%
CBA COE CHFA CNS CSBS Ind Studies/Liberal Arts
The overall qualilty of most Liberal Arts Core courses is excellent
Strongly agree
Agree
Disagree
Strongly disagree
Not sure
44

5.3%8.9% 7.0% 7.8% 8.6%
3.4%3.1%
2.5% 3.6% 3.9%
8.3%
17.6%16.4% 22.1% 17.5% 17.2%
12.5%
56.9%56.4%
55.8% 59.6%51.7%
54.2%
16.8% 15.1% 12.6% 11.4%18.5%
25.0%
0%
10%
20%
30%
40%
50%
60%
70%
80%
90%
100%
CBA COE CHFA CNS CSBS Ind Studies/Liberal Arts
The purposes of most Liberal Arts Core courses are very clear
Strongly agree
Agree
Disagree
Strongly disagree
Not sure
45
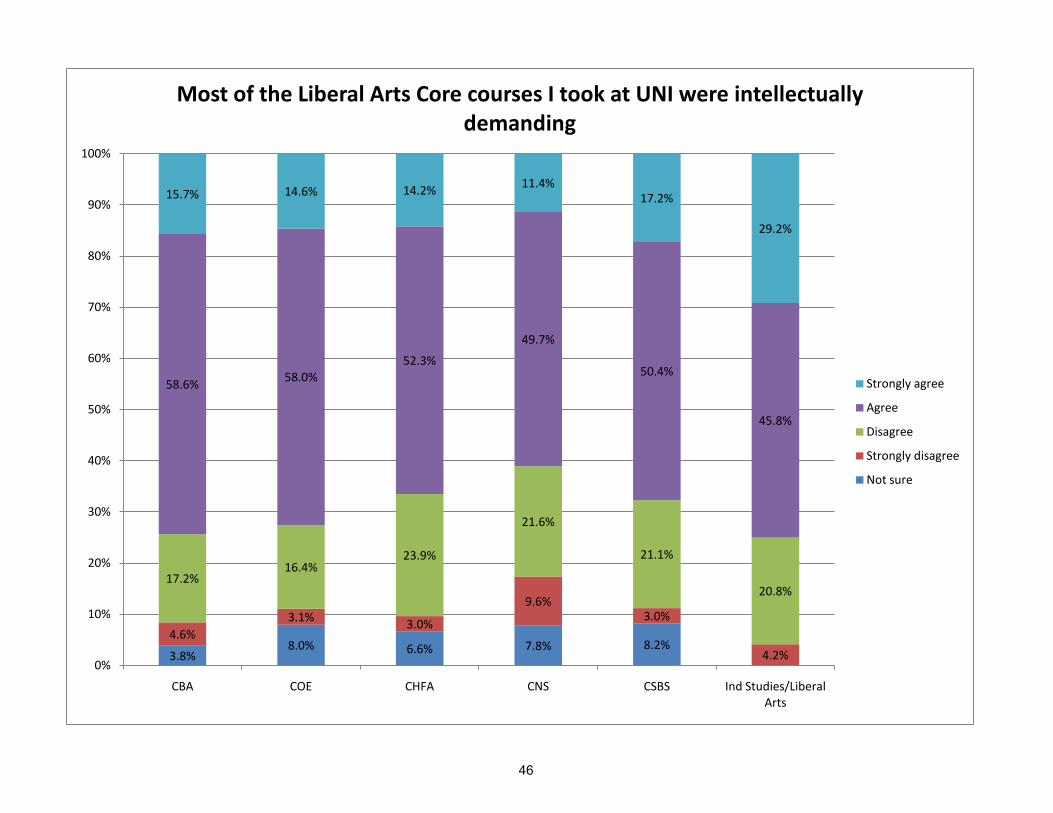
3.8%8.0% 6.6% 7.8% 8.2%
4.6%3.1% 3.0%
9.6%3.0%
4.2%
17.2%16.4%
23.9%
21.6%
21.1%
20.8%
58.6% 58.0%52.3%
49.7%
50.4%
45.8%
15.7% 14.6% 14.2% 11.4%17.2%
29.2%
0%
10%
20%
30%
40%
50%
60%
70%
80%
90%
100%
CBA COE CHFA CNS CSBS Ind Studies/Liberal Arts
Most of the Liberal Arts Core courses I took at UNI were intellectually demanding
Strongly agree
Agree
Disagree
Strongly disagree
Not sure
46
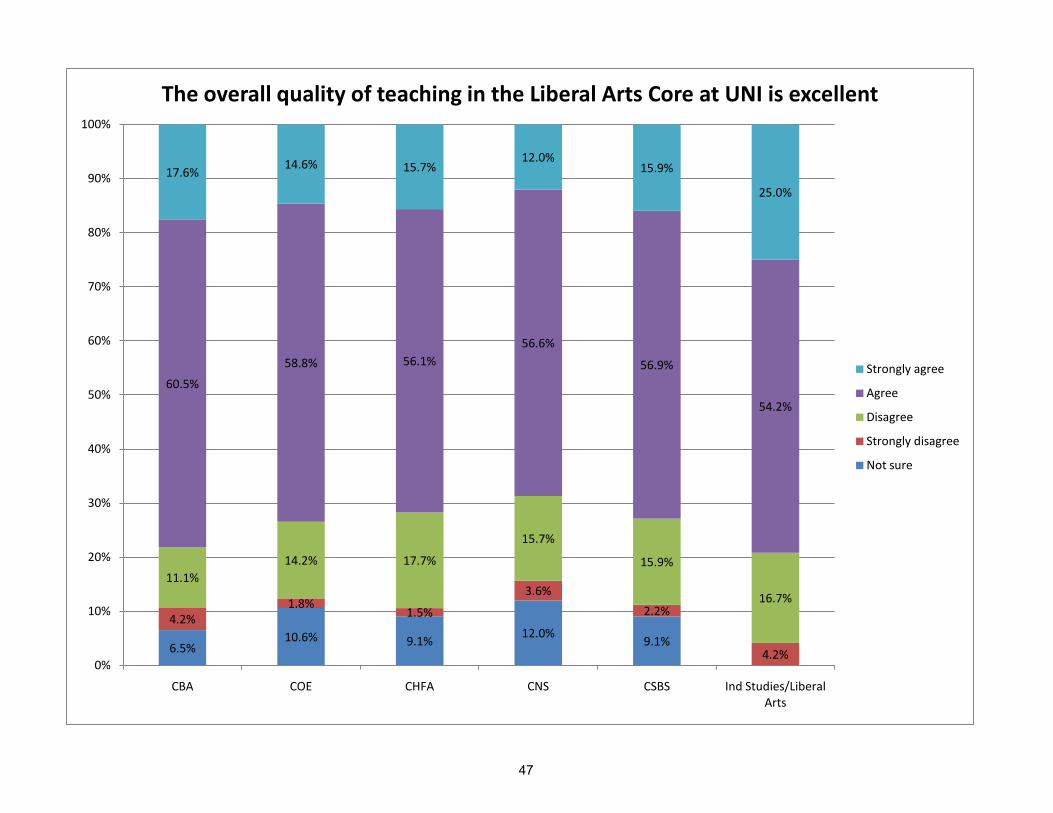
6.5%10.6% 9.1% 12.0% 9.1%
4.2%1.8%
1.5%
3.6%2.2%
4.2%
11.1%14.2% 17.7%
15.7%
15.9%
16.7%
60.5%58.8% 56.1%
56.6%
56.9%
54.2%
17.6% 14.6% 15.7%12.0%
15.9%
25.0%
0%
10%
20%
30%
40%
50%
60%
70%
80%
90%
100%
CBA COE CHFA CNS CSBS Ind Studies/Liberal Arts
The overall quality of teaching in the Liberal Arts Core at UNI is excellent
Strongly agree
Agree
Disagree
Strongly disagree
Not sure
47

5.0% 8.0% 9.1% 7.2% 6.9% 4.2%
4.2%4.9% 4.6% 5.4% 6.4% 12.5%
17.6%15.2%
19.3%16.9%
18.9%4.2%
53.1%56.3% 48.2% 52.4% 48.9%
45.8%
20.2%15.6% 18.8% 18.1% 18.9%
33.3%
0%
10%
20%
30%
40%
50%
60%
70%
80%
90%
100%
CBA COE CHFA CNS CSBS Ind Studies/Liberal Arts
I believe the Liberal Arts Core has been an important part of my education
Strongly agree
Agree
Disagree
Strongly disagree
Not sure
48

.8% 1.0% .6% .4%.4%.4%
.6%3.0%
1.8% 3.0% 4.2%3.0%
8.3%
61.0% 62.6%53.3% 49.7% 56.5%
50.0%
34.8% 35.2%42.7% 44.9%
40.1% 41.7%
0%
10%
20%
30%
40%
50%
60%
70%
80%
90%
100%
CBA COE CHFA CNS CSBS Ind Studies/Liberal Arts
The faculty I had contact with were very committed to advancing student learning
Strongly agree
Agree
Disagree
Strongly disagree
Not sure
49

.4% .5%.4%.9%
2.7%2.2% 2.0% 1.8% 1.7%
12.5%
47.3%45.6%
39.2%36.9%
41.8%
37.5%
49.2% 52.2%58.3% 61.3%
55.6%50.0%
0%
10%
20%
30%
40%
50%
60%
70%
80%
90%
100%
CBA COE CHFA CNS CSBS Ind Studies/Liberal Arts
At least one faculty member showed an active interest in my educational/career goals
Strongly agree
Agree
Disagree
Strongly disagree
Not sure
50

.4% 1.0% .4%.4% .4% 1.2% 4.2%5.3% 3.5% 4.6% 6.0% 7.8%
8.3%
56.5%
48.9%42.9%
43.5%
50.4%
50.0%
37.8%
46.7%51.5% 49.4%
41.4%37.5%
0%
10%
20%
30%
40%
50%
60%
70%
80%
90%
100%
CBA COE CHFA CNS CSBS Ind Studies/Liberal Arts
I developed close relationships with other students
Strongly agree
Agree
Disagree
Strongly disagree
Not sure
51
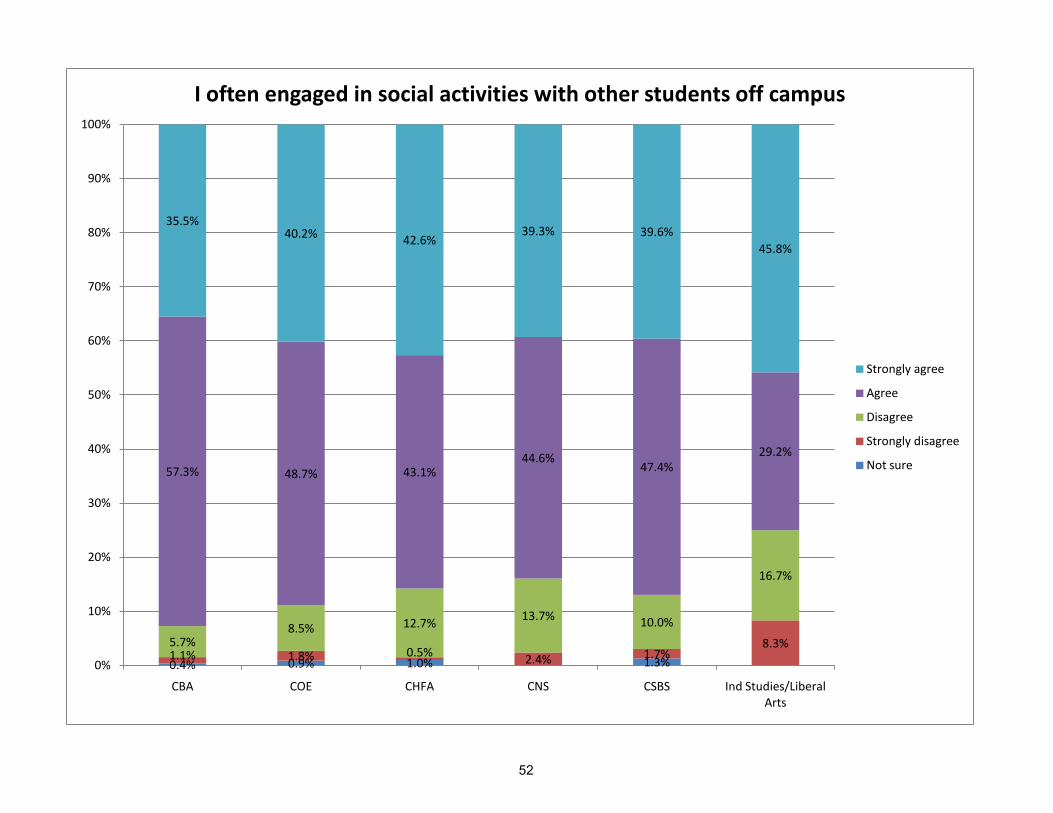
0.4% 0.9% 1.0% 1.3%1.1% 1.8% 0.5% 2.4% 1.7%8.3%5.7%
8.5% 12.7% 13.7% 10.0%
16.7%
57.3% 48.7% 43.1%44.6%
47.4%29.2%
35.5%40.2% 42.6%
39.3% 39.6%45.8%
0%
10%
20%
30%
40%
50%
60%
70%
80%
90%
100%
CBA COE CHFA CNS CSBS Ind Studies/Liberal Arts
I often engaged in social activities with other students off campus
Strongly agree
Agree
Disagree
Strongly disagree
Not sure
52

.4% 2.6% .5% .6% .4%2.3%1.8% 7.0% 8.3%
4.3%
17.4%19.0% 15.4%
16.1%
28.0%
21.6%
17.4%
54.4% 55.5% 45.2%
38.7%
47.2%
47.8%
24.0% 24.7%31.2%
24.4% 26.4%
17.4%
0%
10%
20%
30%
40%
50%
60%
70%
80%
90%
100%
CBA COE CHFA CNS CSBS Ind Studies/Liberal Arts
I often participated in University or student sponsored activities on campus
Strongly agree
Agree
Disagree
Strongly disagree
Not sure
53

8.8% 10.6% 9.5% 8.9% 9.0%
17.4%
11.9% 9.3% 13.0%10.1% 8.2%
8.7%
42.5% 43.2%42.0%
41.7% 47.2%
43.5%
26.1% 29.1% 29.0%31.0% 25.3%
21.7%
10.7% 7.9% 6.5% 8.3% 10.3% 8.7%
0%
10%
20%
30%
40%
50%
60%
70%
80%
90%
100%
CBA COE CHFA CNS CSBS Ind Studies/Liberal Arts
Alcohol abuse is a major problem among students at UNI
Strongly agree
Agree
Disagree
Strongly disagree
Not sure
54

3.1% 5.3% 6.0%2.4% 4.7%
8.3%2.3%1.3% 3.0%
1.8%2.2%
8.3%8.1% 8.8%
7.5%10.7% 7.8%
8.3%
69.6%70.9% 69.0% 69.6%
65.9%50.0%
16.9% 13.7% 14.5% 15.5%19.4%
25.0%
0%
10%
20%
30%
40%
50%
60%
70%
80%
90%
100%
CBA COE CHFA CNS CSBS Ind Studies/Liberal Arts
Most UNI students are tolerant of people whose lifestyles are different from their own
Strongly agree
Agree
Disagree
Strongly disagree
Not sure
55
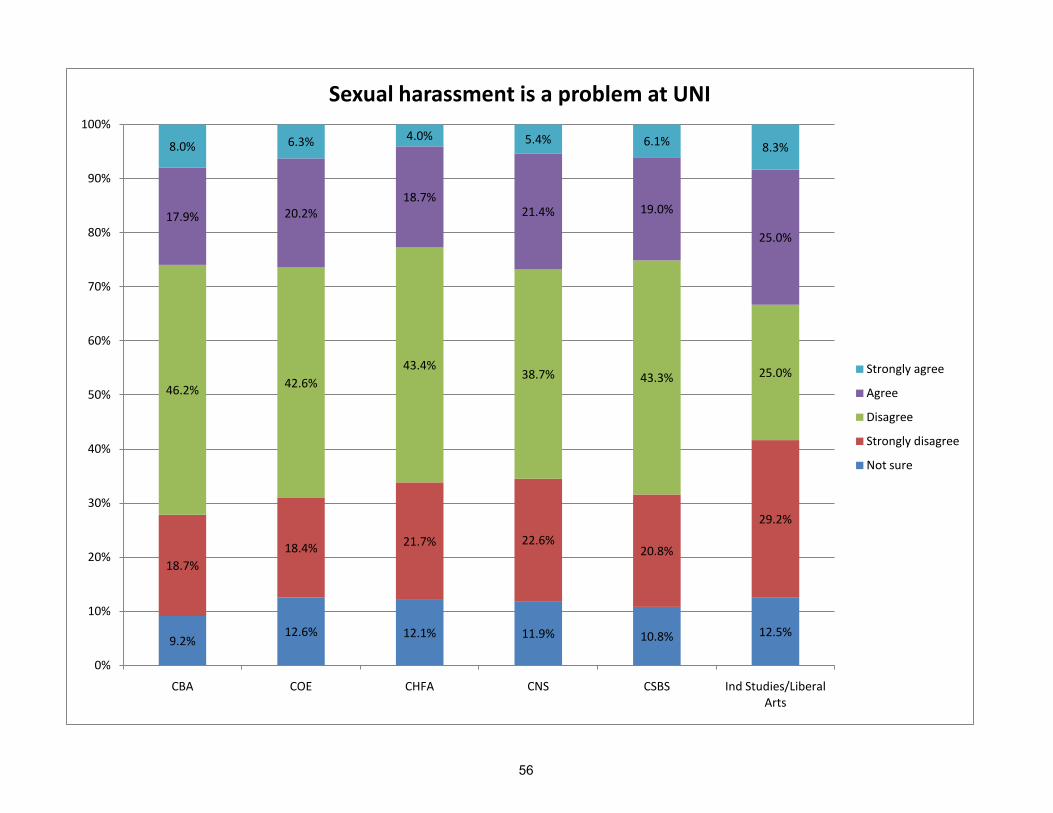
9.2%12.6% 12.1% 11.9% 10.8% 12.5%
18.7%18.4% 21.7% 22.6%
20.8%
29.2%
46.2% 42.6%43.4%
38.7% 43.3% 25.0%
17.9% 20.2%18.7%
21.4% 19.0%
25.0%
8.0% 6.3% 4.0% 5.4% 6.1% 8.3%
0%
10%
20%
30%
40%
50%
60%
70%
80%
90%
100%
CBA COE CHFA CNS CSBS Ind Studies/Liberal Arts
Sexual harassment is a problem at UNI
Strongly agree
Agree
Disagree
Strongly disagree
Not sure
56

3.5% 3.1% 5.6% 4.2% 2.2%
12.5%.4% .4%
1.5% 1.2%.9%
4.2%
3.5% 3.1%
4.6% 6.6%6.1%
8.3%
70.8%68.4%
65.5% 66.9%67.4%
41.7%
21.9% 24.9% 22.8% 21.1% 23.5%
33.3%
0%
10%
20%
30%
40%
50%
60%
70%
80%
90%
100%
CBA COE CHFA CNS CSBS Ind Studies/Liberal Arts
The UNI community values excellence in all of its endeavors
Strongly agree
Agree
Disagree
Strongly disagree
Not sure
57

2.7% 3.5% 5.0% 2.4% 2.2% 4.2%.4%.5%
1.2% .4%1.9% 2.2%
3.0% 4.8% 4.8%
12.5%
70.9% 70.5% 67.0%73.8%
70.1%58.3%
24.1% 23.8% 24.5%17.9%
22.5% 25.0%
0%
10%
20%
30%
40%
50%
60%
70%
80%
90%
100%
CBA COE CHFA CNS CSBS Ind Studies/Liberal Arts
The UNI community values intellectual vitality
Strongly agree
Agree
Disagree
Strongly disagree
Not sure
58

3.5% 4.0% 4.0% 4.2% 2.6%8.3%.8% .4% .5% 1.8% 1.7%
8.3%
5.8% 4.9% 5.0%10.1%
7.4%
12.5%
69.2% 69.9% 68.0%
64.3%68.3%
41.7%
20.8% 20.8% 22.5% 19.6% 20.0%
29.2%
0%
10%
20%
30%
40%
50%
60%
70%
80%
90%
100%
CBA COE CHFA CNS CSBS Ind Studies/Liberal Arts
The UNI community encourages the examination of diverse and controversial ideas
Strongly agree
Agree
Disagree
Strongly disagree
Not sure
59

.8% .4% 1.5% 1.3%4.2%.4%
.4%.5%
.6% .4%1.2% .9% 2.0%
2.4%.9%
53.3% 52.0% 47.0%55.8%
51.9%
58.3%
44.3% 46.3% 49.0%
41.2%45.5%
37.5%
0%
10%
20%
30%
40%
50%
60%
70%
80%
90%
100%
CBA COE CHFA CNS CSBS Ind Studies/Liberal Arts
I believe I have received a high quality education from UNI
Strongly agree
Agree
Disagree
Strongly disagree
Not sure
60
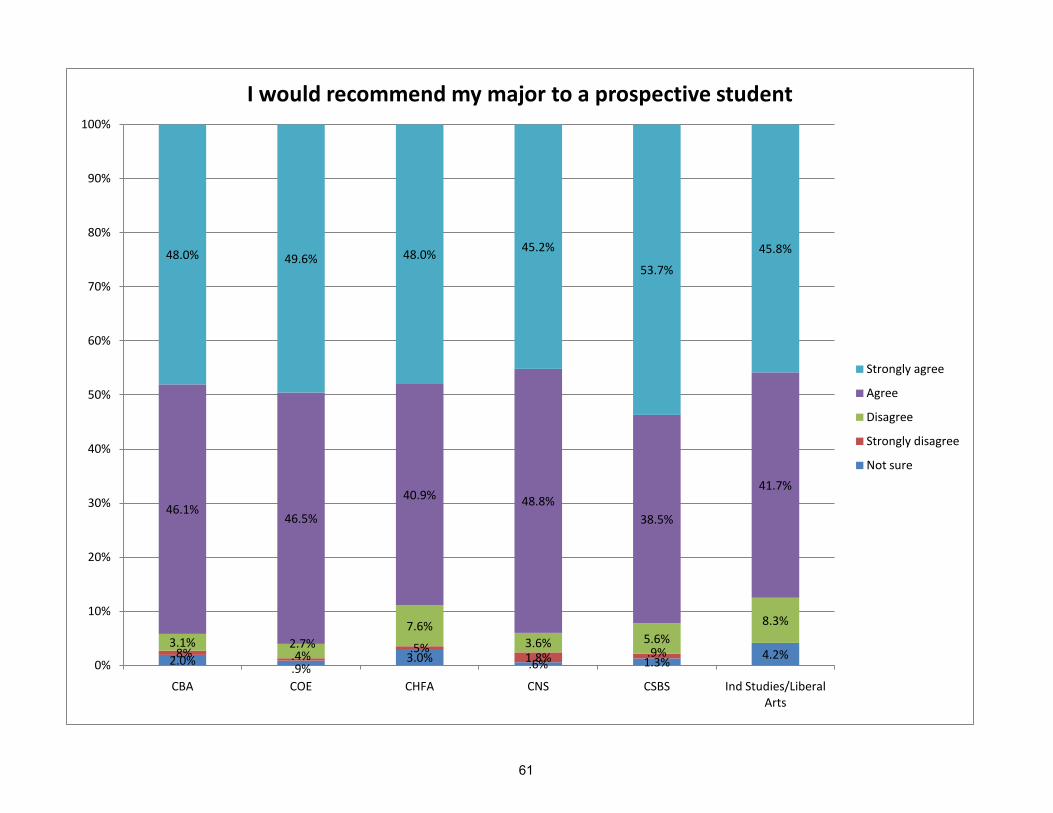
2.0% .9%3.0% .6% 1.3% 4.2%.8% .4% .5%
1.8% .9%3.1% 2.7%
7.6%3.6% 5.6%
8.3%
46.1%46.5%
40.9% 48.8%38.5%
41.7%
48.0% 49.6% 48.0% 45.2%
53.7%
45.8%
0%
10%
20%
30%
40%
50%
60%
70%
80%
90%
100%
CBA COE CHFA CNS CSBS Ind Studies/Liberal Arts
I would recommend my major to a prospective student
Strongly agree
Agree
Disagree
Strongly disagree
Not sure
61
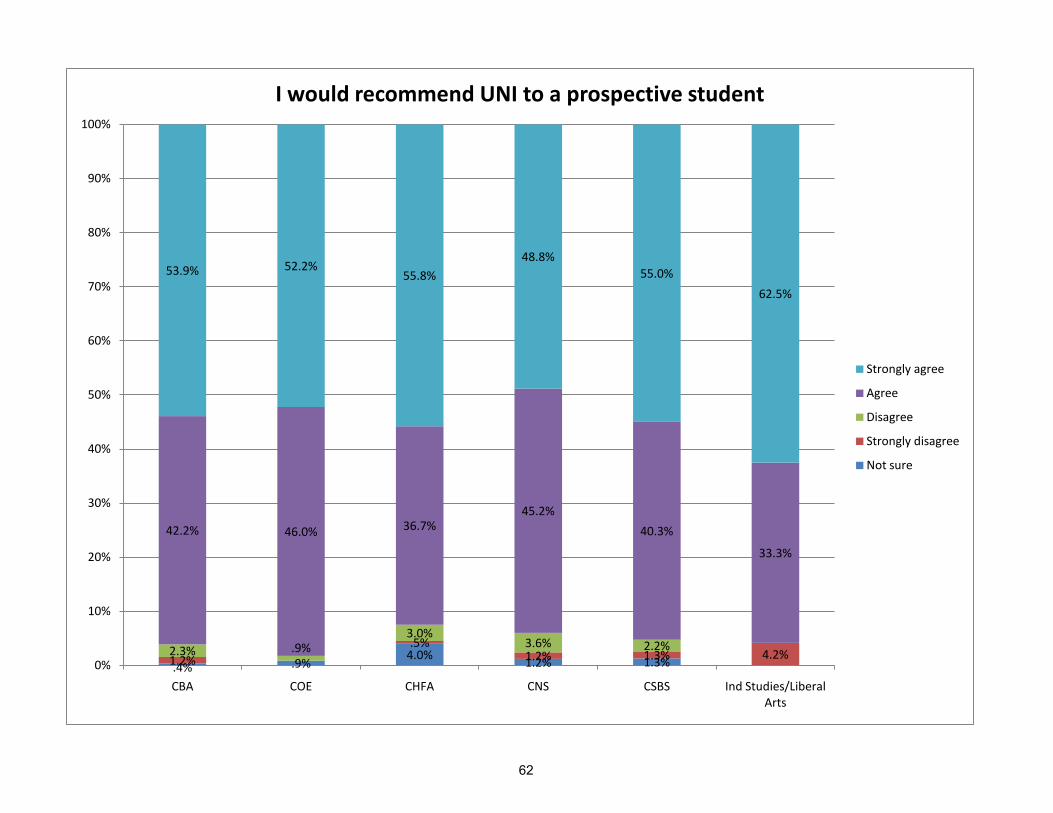
.4% .9%4.0% 1.2% 1.3%1.2%.5%
1.2% 1.3% 4.2%2.3% .9%3.0%
3.6% 2.2%
42.2% 46.0% 36.7%45.2%
40.3%
33.3%
53.9% 52.2%55.8%
48.8%55.0%
62.5%
0%
10%
20%
30%
40%
50%
60%
70%
80%
90%
100%
CBA COE CHFA CNS CSBS Ind Studies/Liberal Arts
I would recommend UNI to a prospective student
Strongly agree
Agree
Disagree
Strongly disagree
Not sure
62

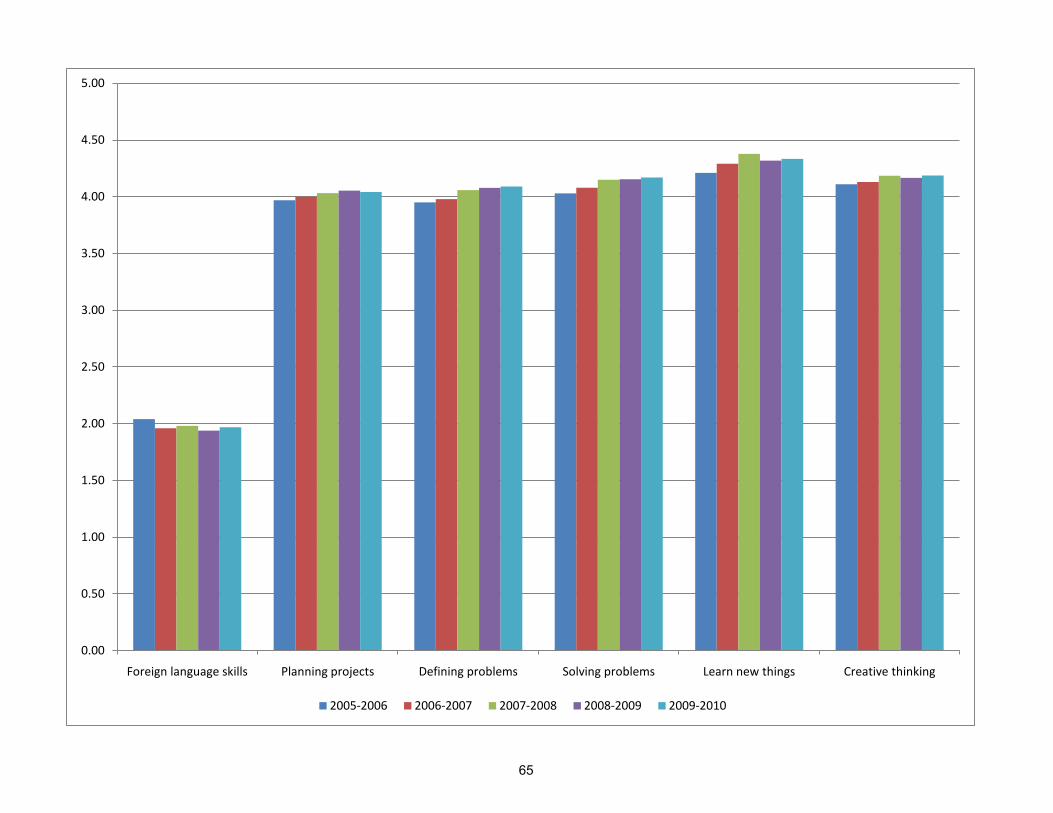
Multiple Year Comparison of the UNI Graduating Senior Survey:
2005-2010
63

0.00
0.50
1.00
1.50
2.00
2.50
3.00
3.50
4.00
4.50
5.00
Speaking effectively Communicate through writing
Understanding written communication
Listen effectively Basic computer skills Making basic calculations
2005-2006 2006-2007 2007-2008 2008-2009 2009-2010
64
0.00
0.50
1.00
1.50
2.00
2.50
3.00
3.50
4.00
4.50
5.00
Foreign language skills Planning projects Defining problems Solving problems Learn new things Creative thinking
2005-2006 2006-2007 2007-2008 2008-2009 2009-2010
65

0.00
0.50
1.00
1.50
2.00
2.50
3.00
3.50
4.00
4.50
5.00
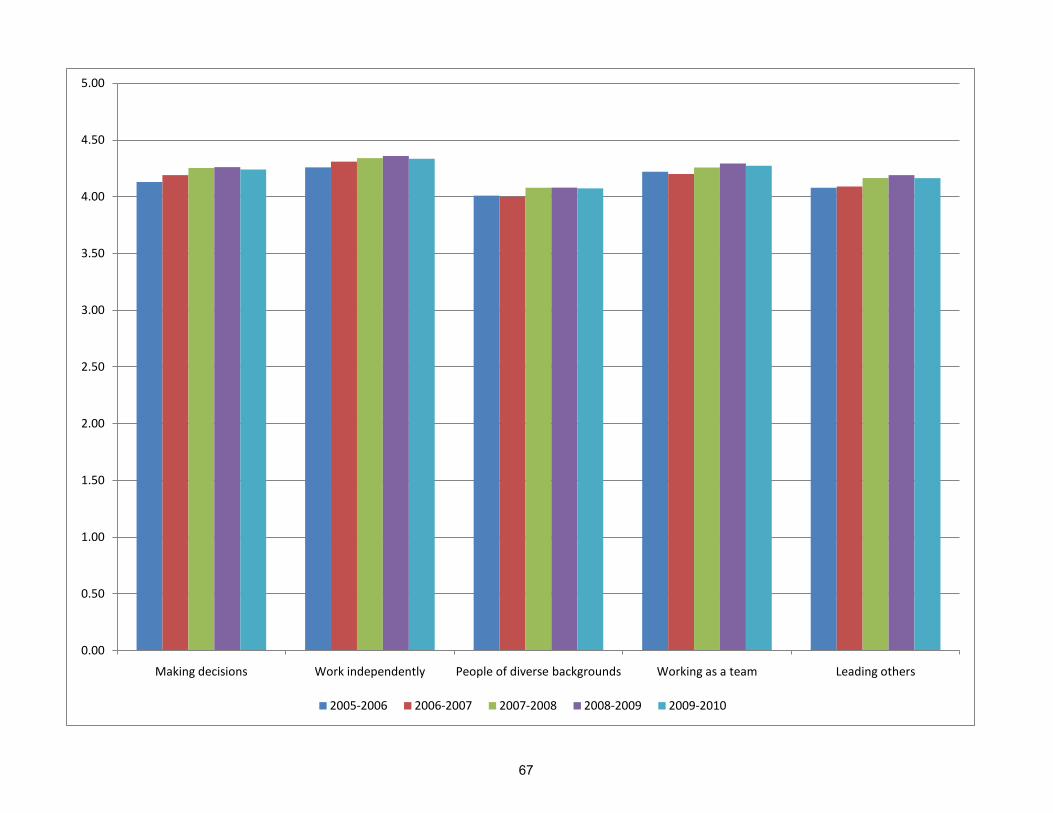
Making decisions Work independently People of diverse backgrounds Working as a team Leading others
2005-2006 2006-2007 2007-2008 2008-2009 2009-2010
66
0.00
0.50
1.00
1.50
2.00
2.50
3.00
3.50
4.00
4.50
5.00
Making decisions Work independently People of diverse backgrounds Working as a team Leading others
2005-2006 2006-2007 2007-2008 2008-2009 2009-2010
67

0.00
0.50
1.00
1.50
2.00
2.50
3.00
3.50
4.00
4.50
5.00
Courses intellectually demanding
Instructors intellectually stimulating
Integrated subject matter Cumulative learning Lifelong learner Peers valued achievement
2005-2006 2006-2007 2007-2008 2008-2009 2009-2010
68

0.00
0.50
1.00
1.50
2.00
2.50
3.00
3.50
4.00
4.50
5.00
Excellent teaching quality at UNI
Courses in major available
LAC quality excellent LAC purposes clear LAC intellectually demanding
LAC teaching excellent
LAC important
2005-2006 2006-2007 2007-2008 2008-2009 2009-2010
69
0.00
0.50
1.00
1.50
2.00
2.50
3.00
3.50
4.00
4.50
5.00
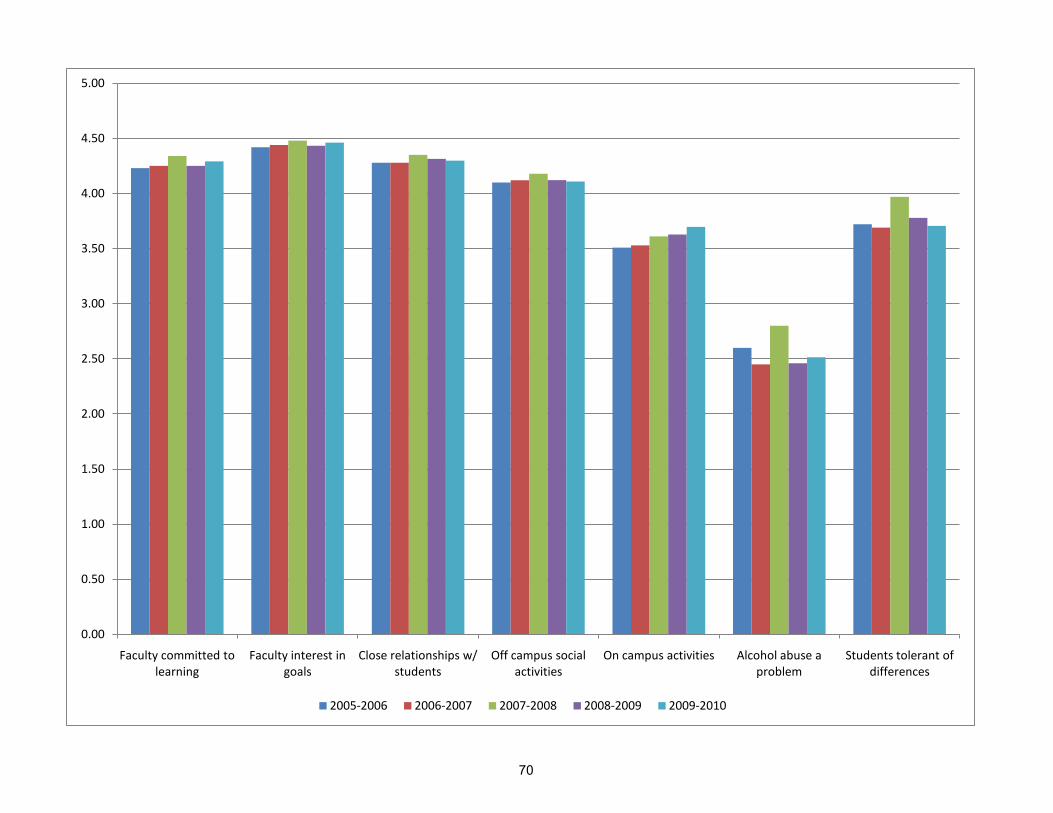
Faculty committed to learning
Faculty interest in goals
Close relationships w/ students
Off campus social activities
On campus activities Alcohol abuse a problem
Students tolerant of differences
2005-2006 2006-2007 2007-2008 2008-2009 2009-2010
70
0.00
0.50
1.00
1.50
2.00
2.50
3.00
3.50
4.00
4.50
5.00
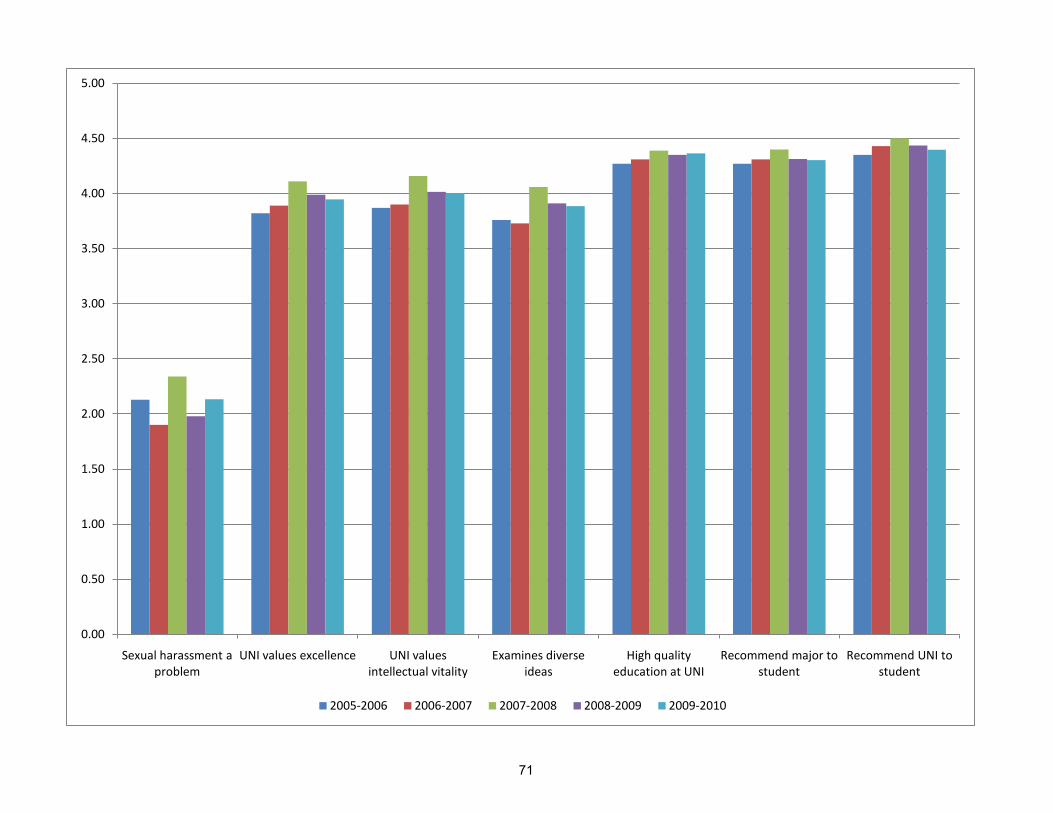
Sexual harassment a problem
UNI values excellence UNI values intellectual vitality
Examines diverse ideas
High quality education at UNI
Recommend major to student
Recommend UNI to student
2005-2006 2006-2007 2007-2008 2008-2009 2009-2010
71
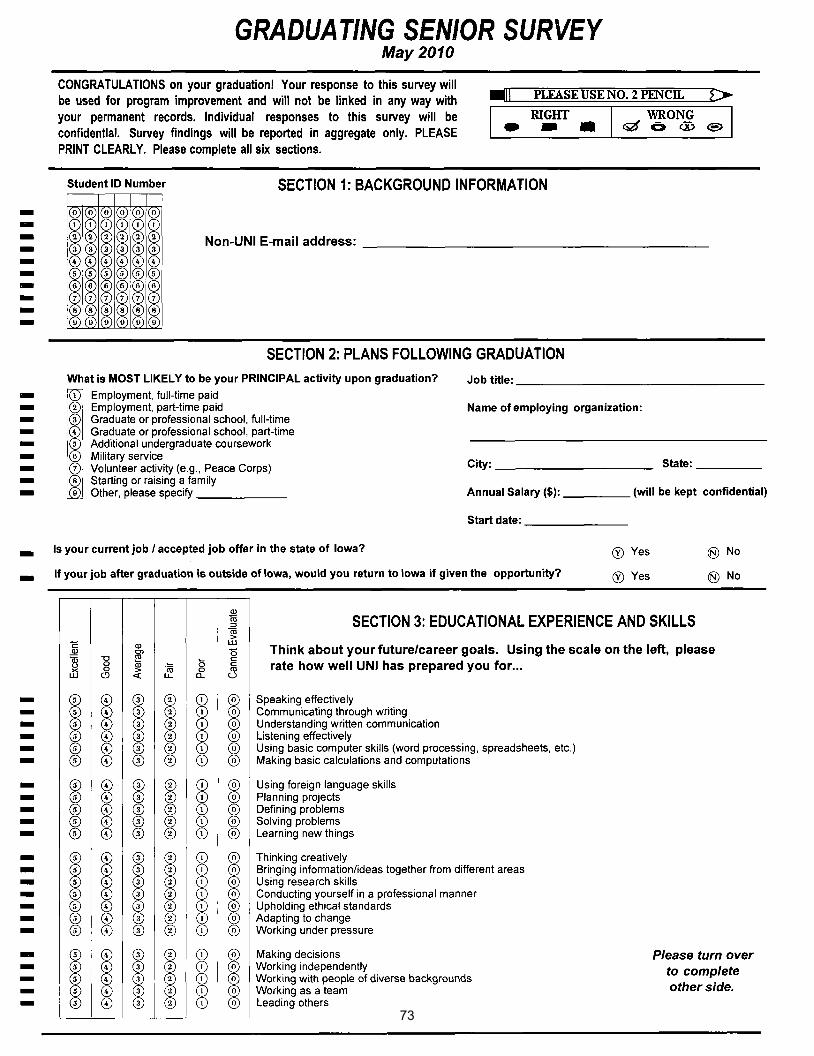
Appendix A
UNI Graduating Senior Survey Instrument
72
73

74

http://www.ir.uni.edu
101 Seerley Hall
Cedar Falls, Iowa 50614-0005
(319) 273-3050
Report compiled by Kristin Moser
in collaboration with Scott Busche and Pat Hart.
75