graduation rates and dropout prevention in indiana interim study committee on education issues terry...
TRANSCRIPT

Graduation Rates and Dropout Prevention in Indiana
Interim Study Committee on Education Issues
Terry SpradlinDirector for Education Policy
Stephen Hiller, Dingjing Shi, and Ming ChenGraduate Research Assistants
August 25, 2011
1

Center for Evaluation andEducation Policy (CEEP)
• CEEP is a client-focused, self-funded research center associated with the Consortium for Education & Social Science Research (CESSR) and the School of Education on the Indiana University Bloomington campus.
• CEEP promotes and supports rigorous program evaluation and nonpartisan policy research primarily, but not exclusively, for education, human service and non-profit organizations.
• In the area of P-16 education policy, CEEP’s mission is to help inform, influence and shape sound policy through effective, nonpartisan research and analysis.
• For more information about CEEP, go to: http://ceep.indiana.edu
2

Table of Contents
I. Graduation Requirements in Indiana
II. Background and Policy on Graduation Rate Formulas
III. Indiana Graduation Rate Data
IV. Early Warning Indicators and Dropout Factors
V. Dropout Prevention Strategies and Programs
3

I. Graduation Requirements in Indiana
4

Indiana Graduation Requirements
• Former graduation requirements centered on the completion of the requirements of one of the diploma types (General, Core 40, Honors) and the passing of the GQE (10th Grade ISTEP+)– An “evidence-based” waiver was available for students not
passing the GQE if they:1. Took the GQE at least once per year2. Completed all remediation opportunities3. Maintained a 95% attendance rate4. Maintained a “C” average in all required courses5. Obtained a written recommendation from a teacher in each subject
area of the GQE that the student did not pass6. Completed all other state or local graduation requirements
5

Indiana’s New Graduation Requirements
• Legislation passed by the Indiana General Assembly in 2005 and 2006 changed the graduation requirements
• Effective with the Class of 2012, students no longer take the GQE, but must pass the Algebra I and English 10 End-of-Course Assessments (ECAs)– The “evidence-based” waiver still applies and a “work-readiness”
waiver was added– The requirements of this new waiver are the same except that instead
of the written recommendation, students must complete the credit requirements for the General Diploma, a workforce readiness assessment, and at least one career exploration opportunity (internship, etc.)
6

Indiana’s New Graduation Requirements (continued)
• Effective with the Class of 2010, there are four diploma types: General, Core 40, Core 40 with Honors, or Core 40 with Technical Honors
• Effective with the Class of 2011, the graduation requirement changed from the General Diploma to the Core 40 Diploma– There is an opt-out provision to allow student to graduate with the
General Diploma which is initiated:1. Upon the parents’ request2. If a student does not pass 3 courses required under Core 403. If a student receives a score in the 25th percentile or lower the
first time they take the Algebra I or English 10 ECAs
• A decision whether special education students are subject to the Core 40 requirement is made in accordance to their IEP and federal law
7
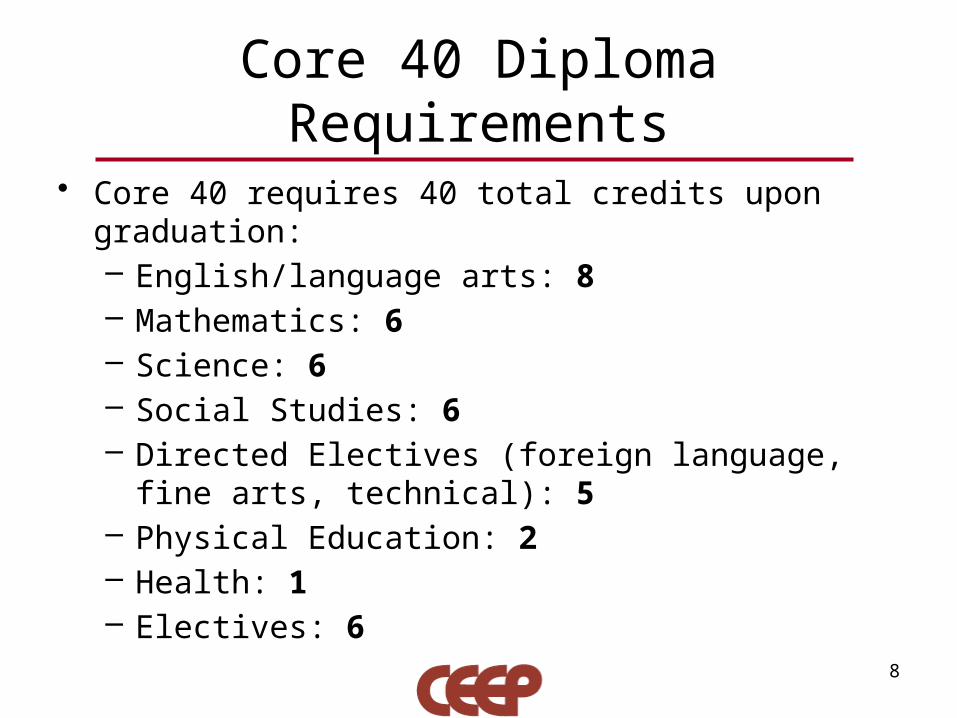
Core 40 Diploma Requirements
• Core 40 requires 40 total credits upon graduation:– English/language arts: 8– Mathematics: 6– Science: 6– Social Studies: 6– Directed Electives (foreign language, fine arts, technical): 5– Physical Education: 2– Health: 1– Electives: 6
8

Core 40 with Academic Honors
• Students must complete at least 47 credits with these additional requirements beyond the Core 40:– Earn 2 additional math credits– Earn 6-8 foreign language credits– Earn 2 fine arts credits– Earn a “C” or better in courses that count toward the Core 40– Have an overall GPA of “B” or better– Complete one of the following:
• Complete AP course and exams (4 credits)• Complete IB courses and exams (4 credits)• Earn a combined score of 1200 on the SAT critical reading and mathematics sections• Earn of composite score of 26 or higher on the ACT• Complete dual-credit courses (6 transferable college credits)• Complete a combination of AP (2), IB (2), and dual-credit (3) courses
9

Core 40 with Technical Honors
• Students must complete at least 47 credits with these additional requirements beyond the Core 40:– Complete a career-technical program (8 or more related credits)– Earn a “C” or better in courses that count towards Core 40– Have an overall GPA of “B” or better– Recommended: 2 additional math and 4-8 foreign language credits for four-year college
entrance– Complete two of the following (one must of one of the first two options):
• Score at or above the following levels on WorkKeys: Reading for Information – 6, Applied Math – 6, Locating Information – 5
• Complete dual credit courses in a technical area (6 transferable college credits)• Complete a Professional Career Internship Course or Cooperative Education Course
(2 credits)• Complete an industry-based work experience as part of a career-technical program
(140 hours)• Earn a state-approved, industry-recognized certification
10

II. Background and Policy on Graduation Rate Formulas
11

Calculating Graduation Rates: Indiana Takes the Lead
• 1999: the Indiana General Assembly passed legislation that allowed the IDOE to begin tracking individual student progress through Indiana’s Student Test Number system
• 2002: a pilot project of the STN system statewide was implemented
• 2003: the Indiana General Assembly passed legislation that instructed the IDOE to begin using the adjusted cohort method for calculating high school graduation rates starting with Class of 2006
• 2010, 33 states using adjusted cohort graduation rate calculation methodology; number to grow this year
6
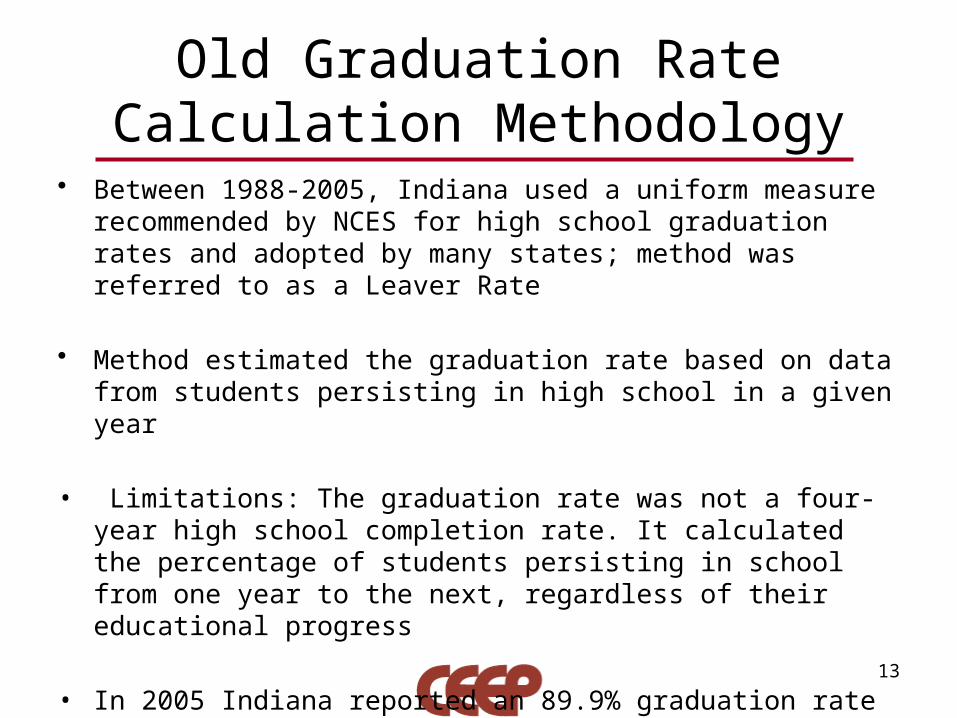
Old Graduation Rate Calculation Methodology
13
• Between 1988-2005, Indiana used a uniform measure recommended by NCES for high school graduation rates and adopted by many states; method was referred to as a Leaver Rate
• Method estimated the graduation rate based on data from students persisting in high school in a given year
• Limitations: The graduation rate was not a four-year high school completion rate. It calculated the percentage of students persisting in school from one year to the next, regardless of their educational progress
• In 2005 Indiana reported an 89.9% graduation rate

A group Grade 9 enrollment at the beginning of the reporting year
B group The number of students enrolled after the beginning data
C group The number of students left the cohort after the reporting date
D group The total number of students graduated during one academic year
Determine Group A
A + B group
A + B – C group
Determine D groupD/(A+B-C)
STEP 1 STEP 2 STEP 3
STEP 4STEP 514
New Methodology: Adjusted Cohort Rate

Advantages of the new methodology
• Emphasize the educational progress of students
• Follows the individual student data from entry into Grade 9 through graduation
• Note: law requires that all students that have not reported to the school in which they were enrolled, but also have not proven to have graduated or transferred, must be reported as a dropout
• One primary disadvantage is use of mobility code 20 to remove students from cohort and not count against grad rate
15

16
• The dropout and mobility (DM) codes report high school students’ status of either dropout (e.g., withdrawing) or in mobility (e.g., transferring to another school)
• The DM report affects corporations and school buildings mobility rates as well as affects the graduation rate
• Improperly coding certain students will result in inaccurate dropout rate
• Codes for student dropout: 1-18; codes for student mobility: 9-31
Student Dropout/Mobility Codes

1 Record of School Failure
9 Pregnancy 17 Missing but located
25 Transferred out of state
2 Disinterest in Curriculum
10 Poor Health 18 Failure of GQE 26 Missing but not located
3 Interpersonal Problems
11 Friends or Peer Pressure
19 Transferred 27 Foreign exchange student
4 Incorrigibility 12 Armed Services Enlistment
20 Removed by parents
28 Religious beliefs
5 Need to Earn Money
13 Court Ordered 21 Deceased 29 Special education
6 Poor Home Environment
14 Unknown or No Shows
22 Incarcerated 30 Earned GED
7 Drug Abuse 15 Truancy (Underage No
Shows)
23 Placement by court order
31 Transferred to a non-accredited
non-public school
8 Marriage 16 Expulsion 24 Enrollment in a virtual school
Dropout and Mobility Codes
17

2010 School Mobility Report
18
Cohort Size Cohort Proportion
Mobile Students
Deceased 134
14749
0.15%
16.8%
< 1 Yr in IN 236 0.27%Enrolled in Virtual
Sch62 0.07%
Foreign Exchange 685 0.78%Incarcerated 110 0.13%
Missing and Reported 471 0.54%
Placed by Court Order 102 0.12%
Poor Health 90 0.10%Religious beliefs 5 0.01%
Home School 4951 5.63%
Aged out of Spec Ed 9 0.01%
Transfer to Non-Accredit/Non-Pub
56 0.06%
Transfer In State 3250 3.70%
Transfer Out of State 4588 5.22%
Total in Cohort(exclude mobile) 73161 83.2%Total in Cohort (include mobile) 87910 100%

III. Indiana Graduation Rate Data
19

State Graduation Rate (4-year)
20
2004-05 2005-06 2006-07 2007-08 2008-09 2009-1050.0%
55.0%
60.0%
65.0%
70.0%
75.0%
80.0%
85.0%
90.0%
95.0%
100.0%
89.8%
76.1% 76.4%77.8%
81.5%84.1%
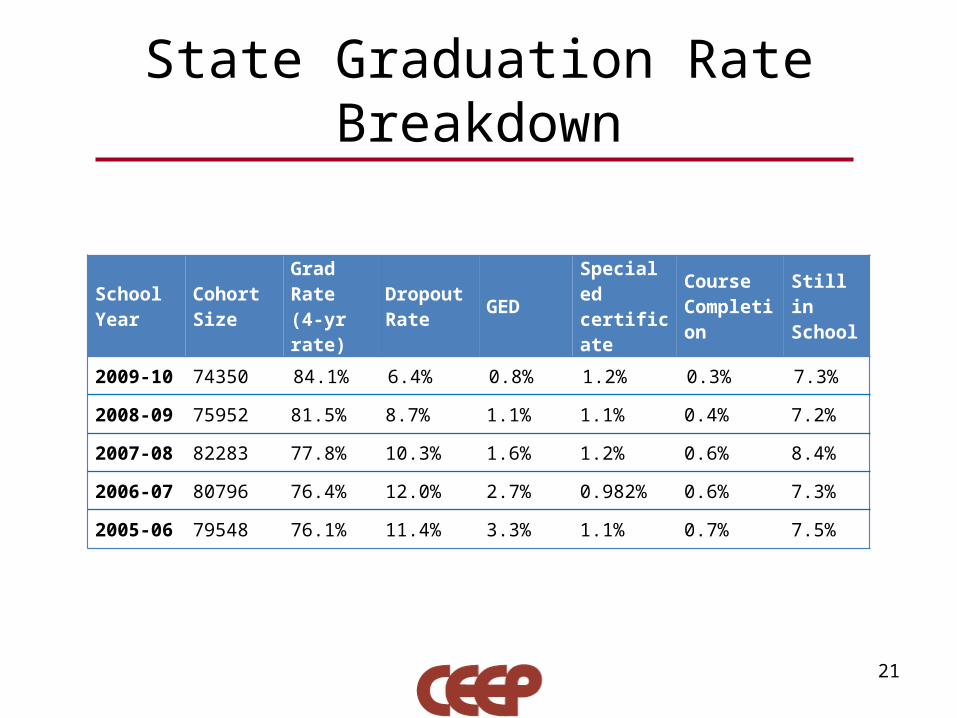
State Graduation Rate Breakdown
21
School Year
Cohort Size
Grad Rate (4-yr rate)
Dropout Rate GED Special ed
certificateCourse Completion
Still in School
2009-10 74350 84.1% 6.4% 0.8% 1.2% 0.3% 7.3%
2008-09 75952 81.5% 8.7% 1.1% 1.1% 0.4% 7.2%
2007-08 82283 77.8% 10.3% 1.6% 1.2% 0.6% 8.4%
2006-07 80796 76.4% 12.0% 2.7% 0.982% 0.6% 7.3%
2005-06 79548 76.1% 11.4% 3.3% 1.1% 0.7% 7.5%

State Graduation Rate Breakdown (continued)
22
School Year Black Hispanic White Free/Reduced Lunch
Limited English
Special Education
2009-10 72.3% 76.9% 86.9% 78.8% 68.3% 61.7%
2008-09 66.0% 69.8% 84.4% 68.0% 61.5% 58.6%
2007-08 59.5% 65.4% 81.2% 61.0% 58.8% 53.2%
2006-07 56.7% 64.0% 79.8% 58.4% 58.7% 52.5%
2005-06 57.4% 62.1% 79.3% 59.4% 59.9% 53.5%

Public High School Comparison by Graduation Rate (n=371)
23
90-100% Graduation
Rate
80-89.9% Graduation
Rate
70-79.9% Graduation
Rate
60-69.9% Graduation
Rate
50-59.9% Graduation
Rate
< 50% Graduation
Rate
0%
5%
10%
15%
20%
25%
30%
35%
40%
45%
50%
27%
43%
19%
3% 3% 4%
36%
43%
13%
4% 2% 2%
2009 2010

Indiana’s Non-waiver Graduation Rate from 2009 to 2010
24
2009 201070.0%
72.0%
74.0%
76.0%
78.0%
80.0%
82.0%
84.0%
86.0%
75.6%
78.1%
81.5%
84.1%
Non-waiver Graduation Rate Statutory Rate

Breakdown of Indiana’s Statutory Graduation Rate in 2010
25
92.90%
1.00%
5.70%0.30%
No WaiversCore 40 WaiverGQE AppealWorkforce Readiness Waiver

Indiana’s Disaggregated Graduation Rate by Gender
26
2009 2010
Female 85.3% 87.7%
Male 77.7% 80.5%

Indiana’s Disaggregated Graduation Rate by Locale
27
Locale Number of Schools
Average Graduation Rate
2004 2005 2006 2007 2008 2009 2010
Urban 67 87.9% 88.6% 68.4% 69.1% 67.7% 71.8% 77.9%
Suburban 97 90.4% 91.4% 79.5% 77.9% 79.3% 83.6% 85.6%
Town 47 90.7% 89.6% 78.2% 79.2% 80.7% 83.5% 85.2%
Rural 168 91.0% 92.2% 81.9% 82.4% 82.9% 86.1% 86.9%
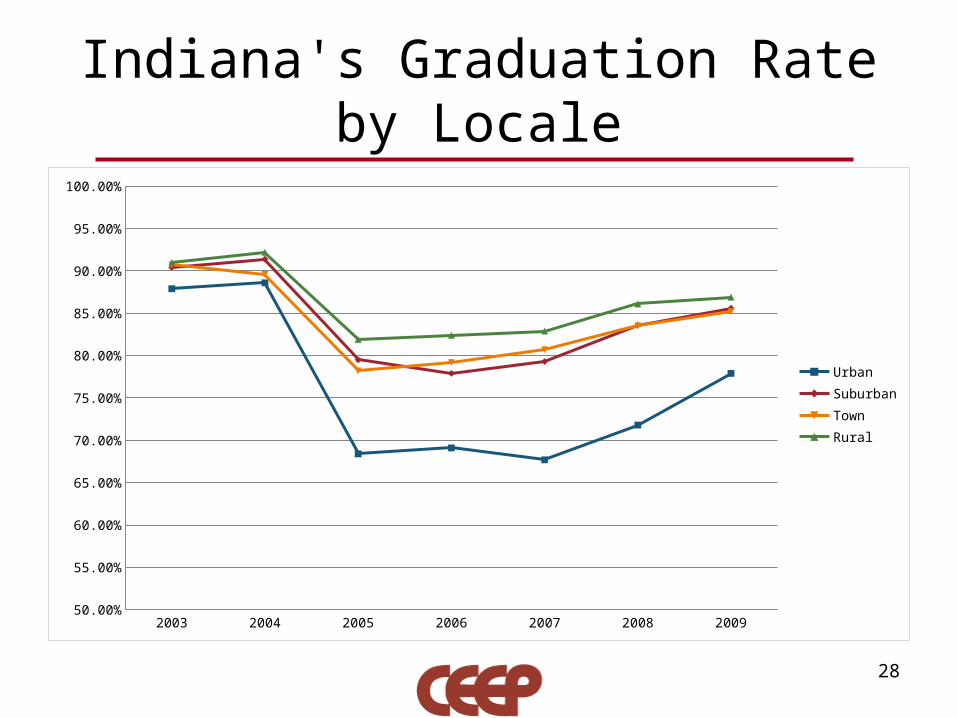
Indiana's Graduation Rate by Locale
2003 2004 2005 2006 2007 2008 200950.00%
55.00%
60.00%
65.00%
70.00%
75.00%
80.00%
85.00%
90.00%
95.00%
100.00%
UrbanSuburbanTownRural
28

Indiana’s Overall Diploma Types in 2010
29
31.80%
41.50%
26.70%
HonorsCore 40General

Indiana’s Disaggregated Diploma Types By Ethnicity
30
Ethnicity Diploma TypeSchool Year
2006 2007 2008 2009 2010
WhiteHonors 34.1% 34.8% 35.0% 36.0% 33.1%Core 40 38.0% 39.9% 40.9% 42.0% 46.8%General 27.9% 25.3% 24.1% 22.0% 20.1%
BlackHonors 11.5% 12.7% 12.1% 13.1% 12.2%Core 40 43.7% 48.0% 50.9% 53.0% 57.7%General 44.9% 39.3% 37.0% 33.9% 30.1%
HispanicHonors 16.5% 19.0% 19.4% 18.8% 18.3%Core 40 42.2% 44.7% 49.2% 51.2% 52.9%General 41.3% 36.3% 31.4% 30.0% 28.8%
American IndianHonors 20.1% 23.0% 24.1% 25.2% 19.9%Core 40 38.2% 40.5% 46.8% 38.8% 47.2%General 41.7% 36.5% 29.1% 36.0% 33.0%
AsianHonors 54.4% 52.3% 55.2% 54.2% 55.1%Core 40 31.1% 32.0% 34.3% 36.5% 35.4%General 14.4% 15.7% 10.5% 9.3% 9.5%
MultiracialHonors 27.1% 25.8% 27.1% 26.6% 23.4%Core 40 41.9% 43.4% 46.5% 48.4% 51.6%General 31.1% 30.8% 26.4% 24.9% 25.0%
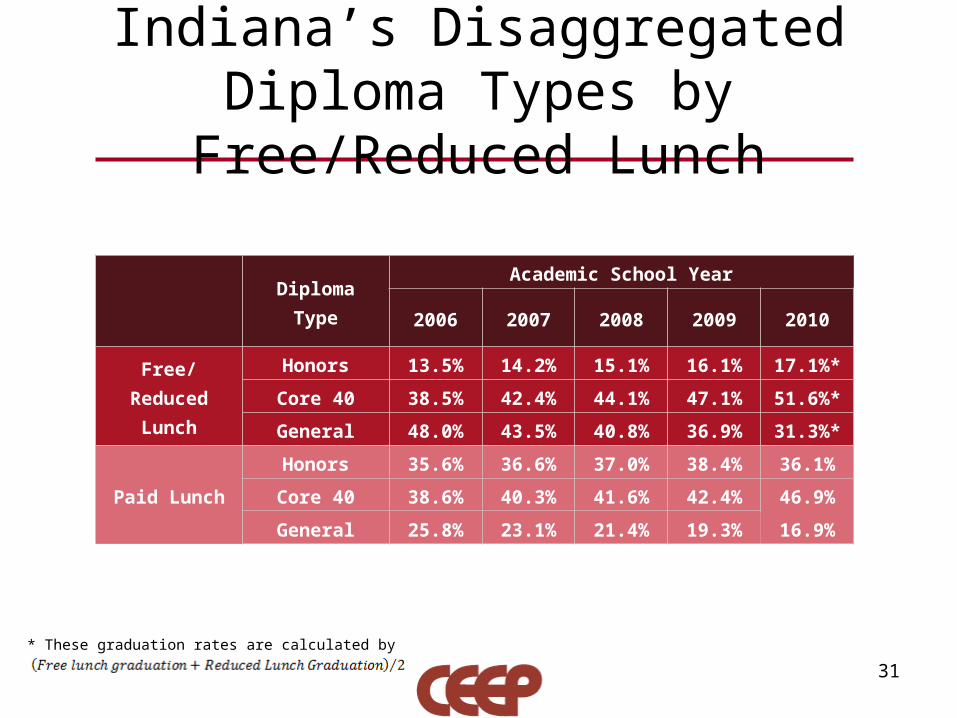
Indiana’s Disaggregated Diploma Types by Free/Reduced Lunch
31
Diploma TypeAcademic School Year
2006 2007 2008 2009 2010
Free/Reduced Lunch
Honors 13.5% 14.2% 15.1% 16.1% 17.1%*
Core 40 38.5% 42.4% 44.1% 47.1% 51.6%*
General 48.0% 43.5% 40.8% 36.9% 31.3%*
Paid Lunch
Honors 35.6% 36.6% 37.0% 38.4% 36.1%
Core 40 38.6% 40.3% 41.6% 42.4% 46.9%
General 25.8% 23.1% 21.4% 19.3% 16.9%
* These graduation rates are calculated by

Indiana's Honors Diploma by Free/Reduced Lunch
2006 2007 2008 2009 2010
0.00%
5.00%
10.00%
15.00%
20.00%
25.00%
30.00%
35.00%
40.00%
45.00%
50.00%
55.00%
60.00%
F/R LunchPaid Lunch
32

Indiana's Core 40 Diploma by Free/Reduced Lunch
2006 2007 2008 2009 2010
0.00%
5.00%
10.00%
15.00%
20.00%
25.00%
30.00%
35.00%
40.00%
45.00%
50.00%
55.00%
60.00%
F/R LunchPaid Lunch
33

Indiana's General Diploma by Free/Reduced Lunch
2006 2007 2008 2009 2010
0.00%
5.00%
10.00%
15.00%
20.00%
25.00%
30.00%
35.00%
40.00%
45.00%
50.00%
55.00%
60.00%
F/R Lunch
Paid Lunch
34
IV. Early Warning Indicators and Dropout Factors
35

Four Primary Reasons Students Dropout of H.S.
According to the NGA Achieving Graduation for All (2009 Report) there are four primary reasons students dropout of H.S.: 1) Academic Failure: key indicators include failing core courses, poor attendance, low GPA, low credit accumulation, and failing exit exams2) Disinterest in School: a lack of engagement in academic or social aspects of school which often leads to poor attendance3) Problematic Behavior: inside or outside of school4) Life events: pregnancy, economic need, family illness, etc.
36

Early Warning Indicators
• What: using indicators to help educators predict which students may be in danger of dropping out of high school
• Why: Schools – support students who are at risk of dropping out with strategies and interventions Districts – examine school-level patterns to address systemic issues Educators – better predict which students may be in danger to provide dropout prevention supports
37

Indicators and Thresholds
• If a student’s performance falls below a given threshold, the
student is flagged as being “at risk”.
Source: Early Warning System Brochure, National High School Center
Risk Indicator Risk Indicator Threshold
Attendance Missed 10% or more of instructional time
Course failures Failed one or more semester course
GPA Achieved 2.0 or lower
38

Implementation of the EWS tool
The at-risk students’ names are highlighted in red, as well as the indicators and time frames
39

The Silent Epidemic
• Published in 2006, researchers of this report conducted a survey and a series of focus groups with 16-25 year olds who identified as high school dropouts
• The report focuses exclusively on the dropout issue: who drops out, why, and what might help those students
• Of respondents, 47% said a major reason for dropping out was that “classes were not interesting”– This was a top reason especially among those drop outs who had high
GPAs and by those who reported being motivated students
40Source: The Silent Epidemic (2006). Perspectives of High School Dropouts

The Silent Epidemic (continued)
• The report also makes it clear that many (although not a majority) drop out due to significant academic challenges– 35% reported failing in school as a major factor in their decision– 43% reported missing too many days of school and not being able to
keep up– 45% reported not being prepared for high school by previous
schooling; they reported that additional supports (e.g. tutoring) would have helped
– 32% were required to repeat a grade before they decided to drop out– 29% expressed doubt that they could have kept up with graduation
requirements even if they tried
41Source: The Silent Epidemic (2006). Perspectives of High School Dropouts

The Silent Epidemic (continued)
• 69% of respondents said they were not inspired or motivated to work hard– 80% did homework for one hour or less each night– Approximately 67% said they would have worked harder if the school
and teachers had demanded it– 70% believe they could have graduated if they had tried
• Student also provided personal reasons for dropping out:– 32% reported needing a job to make money– 26% reported becoming a parent– 22% reported needing to care for a family member– Many of these respondents believe they could have finished high
school if they stayed in
42Source: The Silent Epidemic (2006). Perspectives of High School Dropouts
The Silent Epidemic (continued)
• The report also noted the importance of attendance:– 59-65% of respondents missed class “often” the year before dropping
out– 38% believed they had too much freedom and needed more rules
• Parental involvement was also a factor:– Only 59% reported parents or guardians being involved in their
schooling– More than half of those were involved for discipline reasons– 68% reported that their parents/guardians only became involved just
as the student was about to drop out
43Source: The Silent Epidemic (2006). Perspectives of High School Dropouts
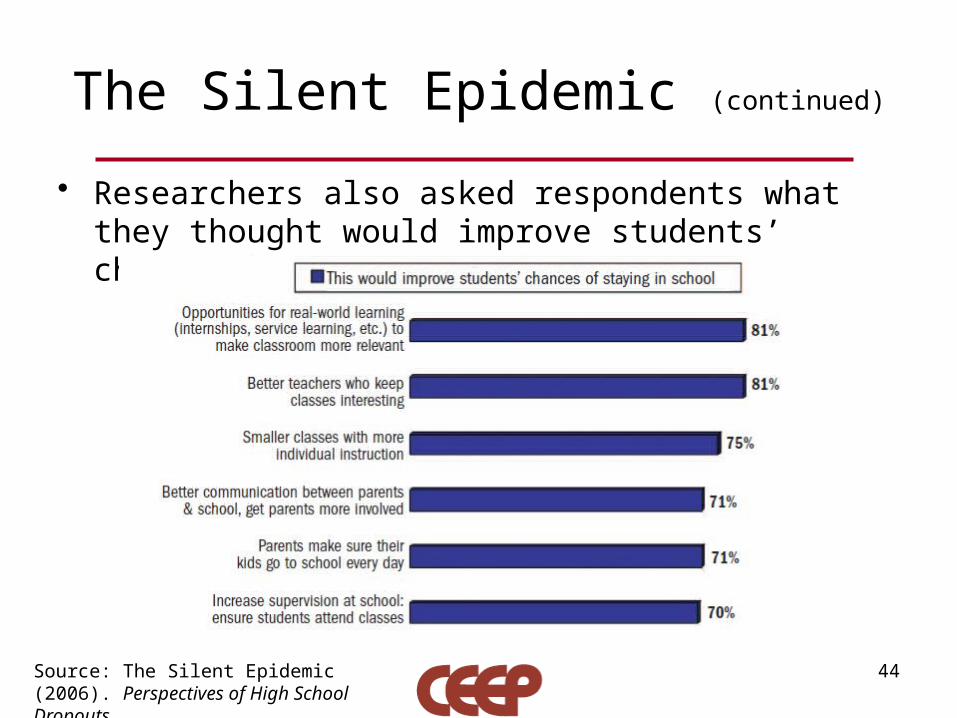
The Silent Epidemic (continued)
• Researchers also asked respondents what they thought would improve students’ chances of staying in school:
44Source: The Silent Epidemic (2006). Perspectives of High School Dropouts

High School Survey of Student Engagement (HSSSE)
• HSSSE, available since 2004, serves, in part, as a tool to participating schools to better understand the underpinnings of student engagement
• Data from the survey help explore the causes and conditions that lead to student engagement or disengagement and persistence or dropping out
• Since 2006, over 350,000 students in 40 states have participated in the survey, administered every spring and fall
45

2009 HSSSE Participants
• In 2009, 103 schools from 27 states participated in the survey with a mean student enrollment of 787 and a range from 20 to 3,143– By locale, 53% were urban, 31% suburban, 12% rural, and
4% town
• 42,754 students participated in the survey– 30% were in 9th grade, 27% in 10th, 23% in 11th, and 20% in
12th
– 88% began attending their current school in 9th grade
46

2009 HSSSE Data on Boredom and Engagement
• Boredom can be seen as a temporary form of disengagement• The survey asked two questions related to boredom:
– Have you ever been bored in class in high school?– If you have been bored in class, why?
• 66% of respondents stated they were bored at least every day in class in high school, of those:– 49% are bored ever day– 17% are bored in every class
• Only 6% reported never being bored or only being bored “once or twice”
47

2009 HSSSE Data on Boredom and Engagement (continued)
• On why students were bored, participants were able to select all responses that applied
• Of students reporting being bored, class material was a significant issue:– 81% thought the “Material wasn’t interesting”– 42% said the material lacked relevance
• 33% were bored because work wasn’t challenging enough• 26% because work was too difficult• 35% were bored because there was no interaction with the teacher• These responses have been consistent over four years of survey
administration
48

2009 HSSSE Data on Dropping Out
• Dropping out can be viewed as a permanent form of disengagement
• The survey asked three questions regarding dropping out and skipping school (addressing attendance, an indicator for dropping out)– Have you ever skipped school?– Have you ever considered dropping out of high school?– If you have thought about dropping out of high school,
why?
49
2009 HSSSE Data on Dropping Out (continued)
• In 2009, 50% of students reported having skipped school either “once or twice” or “many times”– 16% reported skipping school “many times”
• Unsurprisingly, students have most often skipped school, most often considered dropping out
• 21% of students considered dropping out at some point in high school– 7% considered dropping out “many times”
50

2009 HSSSE Data on Dropping Out (continued)
• The top three reasons students cited for considering dropping out were school-related factors:– 50% said “I didn’t like the school”– 42% said “I didn’t see the value in the work I was being
asked to do”– 39% said “I didn’t like the teachers”
• 35% considered dropping out because the work was too difficult
• Alternatively, 13% considered dropping out because the work was too easy
51

2009 HSSSE Data on Dropping Out (continued)
• Adults also played a significant role in students’ consideration of dropping out– 16% of students said “No adults in the school cared about
me”– 9% said “Adults in the school encouraged me to drop out”
(Whether that was communicated to students intentionally or unintentionally is not clear)
• 16% of students thought about dropping out because they were picked on or bullied
• Students’ reasons for considering dropping out have largely been consistent over the four years of survey administration
52

V. Dropout Prevention Strategies and Programs
53

NGA Policy Recommendations
1) Promote H.S. Graduation for All: increase maximum compulsory attendance age to 18 (IN has; 29 other states haven’t), include grad rates heavily in state accountability systems, champion higher rates, assign responsibility for dropout prevention and recovery (designate staff, coalitions, interagency cabinets, etc.);
2) Target Youth At Risk of Dropping Out: support the development of early warning systems, invest in promising strategies, connect students to existing supports (grad coaches, personalized learning plans, etc.)
3) Reengage Dropouts: develop reentry and recovery initiatives, including for juvenile offenders
4) Provide Rigorous, Relevant Options for H.S. Diploma: 21 states including IN require all H.S. students to complete college prep curriculum; dual credit, AP, apprenticeships, Career and Tech Ed
54

National High School Center: 8 Elements of H.S. Improvement
1) Rigorous curriculum and instruction2) Teacher effectiveness and professional growth3) Stakeholder engagement4) Organization and structure5) Assessment and accountability6) Effective leadership7) Student and Family Involvement8) Sustainability
55

National Dropout Prevention Center: Effective Strategies
• Systemic renewal of school focus
• School/Community Collaboration
• Safe learning environments• Family engagement• Early Childhood Education• Early Literacy Development• Mentoring and Tutoring• Service Learning
• Alternative Schools• After School Opportunities• Professional Development• Active Learning• Education Technology• Individualized Instruction• Career and Tech Education
56

Overview of Effective Programs
• The What Works Clearinghouse (WWC) at the Institute of Education Sciences (IES) at the US Department of Education has identified 13 dropout prevention programs which it has labeled as effective
• The WWC evaluates independent studies conducted on the programs to determine whether the evidence indicates if the programs are effective in three categories: completing school, staying in school, and progressing in school
57

Overview of Effective Programs (continued)
• The following slides highlight the most effective programs identified by the WWC in each category
• Three interventions for completing school are examined: National Guard Youth ChalleNGe Program, Talent Search, and Job Corps
• The top three interventions for staying in school and progressing in school were the same: Accelerated Middle Schools, Check and Connect, and ALAS
58

Interventions for Completing School
National Guard Youth ChalleNGe Program
59
• Designed for youth ages 16-18 who have dropped out or were expelled
• Consists of a quasi-military 22-week residency period followed by one-year mentoring program
• Participants take GED preparation classes and other programs to promote leadership, job skill, community service development
• Offered in 27 states, including Indiana, and in Dec. 2009, 92,000 youth graduated from the program
• Only one study met WWC evidence standards
• The study included 1,196 youth in 10 states
• WWC observed a statistically significant positive difference in program participants; 61% received their diploma or GED compared with 36% of control group members

Interventions for Completing School (continued)
Talent Search
60
• Helps low-income and first generation college students complete high school and gain access to college
• Services include test taking and study skill assistance, academic advising, career development, and financial aid application assistance
• Established and funded through the Higher Education Act of 1965
• Serves 380,000 students through more than 400 sponsored projects
• Two studies met WWC standards• One study in Texas included 4,027
participants and 30,842 control group members; another in Florida included 900 participants and 42,514 control group members
• Participants in both studies were more likely to receive their diploma or GED within five years (86% vs. 77% in Texas, 84% vs. 70% in Florida)

Interventions for Completing School (continued)
Job Corps
61
• Serves economically disadvantaged youth
• Services include remedial education, GED preparation, vocational training and job placement assistance, among others
• Participants often reside in a Job Corps center and can remain in the program up to two years
• Established by the Economic Opportunity Act of 1964
• Serves about 62,000 youth with 122 Job Corps centers in 48 states
• One study met WWC standards• The study includes a
representative sample of 11,313 students from over 100 Job Corps centers nationwide and a control group of 4,485 students
• There was a statistically significant positive effect for participants; 43% of Job Corps students earned a GED compared to 26% of control group students

Interventions for Staying and Progressing in School
Accelerated Middle Schools
62
• Helps middle school students who are one to two years behind grade level to catch up to their age peers
• Covers an additional year of core curriculum material by offering few student electives
• Instruction is more hands on, classes sizes are smaller, and additional academic support is offered
• Many accelerated middle schools exist, but the full scope is unknown as there is no single program they operate under
• Three studies met WWC standards• These studies included more than
800 students in Georgia, Michigan, and New Jersey school districts
• For “staying in school” WWC finds potentially positive effects
• For “progressing in school” WWC finds positive effects

Interventions for Staying and Progressing in School
Check and Connect
63
• “Check” component consists of continually monitoring student engagement through performance and progress indicators
• “Connect” component consists of program staff giving individualized attention to participants in coordination with the school
• Each student is assigned a “monitor” who reviews their performance and intervenes when problems are seen
• Two studies met WWC standards• The studies included over 200
students who began the program in 9th grade at Minneapolis high schools
• For “staying in school” WWC finds positive effects, with participants significantly less likely to drop out by senior year
• For “progressing in school” WWC finds potentially positive effects with participants earning more credits than control group students

Interventions for Staying and Progressing in School
ALAS
64
• Serves middle and high school students and designed to address factors that affect dropping out (school, family, etc.)
• Mentors are assigned to each student attendance, behavior, and achievement; interventions are coordinated when necessary
• Parents are also trained in parent-child problem solving and school involvement
• Originally implemented in Los Angeles, it has recently been used in Glendale, CA schools
• One study met WWC standards• The study includes 94 at-risk Latino
students entering 7th grade in an urban, southern California school
• Outcomes were measured in 9th grade when intervention ended and in a follow-up in 11th grade
• For “staying in school” WWC finds potentially positive effects with participants more likely than control group student to remain in school
• For “progressing in school” WWC finds potentially positive effects

IDOE Dropout Prevention Efforts
• As part of its goal to see at least 90% of Indiana students graduate from high school, the IDOE dedicates several resources to dropout prevention
• The IDOE Dropout Prevention Portal (http://www.doe.in.gov/dropoutprevention/) primarily serves as a warehouse of resources from the IDOE and state and national organizations
• Resources include grant opportunities, professional development resources (such as webinars), information on local dropout prevention efforts, and information regarding the upcoming 2011 Dropout Prevention Summit
65

2009 Dropout Prevention Summit
• On Sept. 25, 2009, the IDOE along with State Farm Insurance and America’s Promise Alliance co-hosted the first Dropout Prevention Summit in Indianapolis
• Each of Indiana county was invited to send a team consisting of educators, parents, youth, community leaders, and business leaders
• The teams heard keynote speakers with expertise in dropout prevention and attended breakout sessions; the teams continue to meet to discuss local dropout prevention strategies and efforts
66

2011 Dropout Prevention Summit
• The second Indiana Dropout Prevention Summit will take place on Sept. 28, 2011, at the Indiana Convention Center with Indiana State University replacing America’s Promise as co-sponsor
• Indiana State University and State Farm Insurance also co-host a website for the Indiana Dropout Prevention Summit (http://www.indianadropoutprevention.org/)
• The website contains a “Documents” section which contains various resource materials, including documents on localized dropout prevention efforts, for example, those efforts in Blackford, Putnam, and Monroe counties
67

CEEP Contact Information
Terry E. Spradlin, MPADirector for Education Policy
1900 East Tenth StreetBloomington, Indiana 47406-7512
812-855-4438Fax: 812-856-5890http://ceep.indiana.edu
68