graft copolymer stabilized gold nanoparticles and their
TRANSCRIPT

Graft Copolymer Stabilized Gold Nanoparticles and Their
Applications and Chemically Cleavable Linkers and Their
Applications
A THESIS
SUBMITTED TO THE FACULTY OF THE GRADUATE SCHOOL
OF THE UNIVERSITY OF MINNESOTA
BY
Jun Sung Kang
IN PARTIAL FULFILLMENT OF THE REQUIREMENTS
FOR THE DEGREE OF
DOCTOR OF PHILOSOPHY
T. Andrew Taton, Advisor
May 2013

© Jun Sung Kang 2013

i
Acknowledgements
I would like to thank all those who have helped, advised, supported, encouraged,
and motivated me. With them, the time in University of Minnesota is valuable and
unforgettable to me.
I would like to thank my advisor, T. Andrew Taton for his advices and supports.
His distinguished insight, advice, and suggestion, from the beginning of my Ph.D course,
have given me many opportunities to learn a lot of science, chemistry, and culture.
Without him, I would not have been able to finish my Ph.D. I would also like to thank
Prof. Distefano and Prof. Seelig for their valuable time and advice. I want to express my
thanks to Barbara Beers for her help in my English improvement.
I would like to thank my past and present group members who have helped me,
communicated with me, and contributed to my work. In particular, I am very grateful to
Alexi Young, Walt Partlo, and Chandru Ramasubramanian, who have spent their
valuable time for research discussion, great friendship, and memorable cheer. I would
also like to thank my colleagues, including Santosh Khatwani, Kevin Landmark, Amanda
Maxwell, Min Woo Jang, Jin-Hwa Chung, and Isaac Marks. I would like to express my
gratitude for Aleardo Morelli in Prof. Seelig group who helped me for degradable PAGE.
I have had a wonderful time with many Korean friends in Chemistry and CEMS.
Particularly, I want to show my thanks to Juhee Cho, Sungjun Hong, Bong Soo Kim,
Junha Jeon, Seongho Choi, Won Cheol Yoo, Jaebeom Han, Changyub Paek, Yong Wook
Kim, Myungeun Seo, Youngmin Lee, Donghyuk Kim, and Soon Yong So, who have
given productive discussion and broader insights into other chemical fields.
Most of all, I am really indebted to my parents, my wife, my sister, and my twin
brother. I always feel that I have not got enough chance to show my gratitude to them.
With their support and dedication, I can finish this work. I really thank all of them.

ii
Abstract
This thesis consists of two parts: (1) graft copolymer stabilized gold nanoparticles
(AuNPs) and their biological application in chapter 1~3 and (2) chemically cleavable -
azido ether and its biological application in chapter 4~6.
In the first part, poly(L-lysine)-graft-poly(ethylene glycol) (PLL-g-PEG)
copolymers that bear multiple thiol groups on the polymer backbone are used for
exceptional ligands to stabilize AuNPs. In general, these graft copolymer ligands stabilize
AuNPs against environments that would ordinarily lead to particle aggregation. To
characterize the effect of copolymer structure on AuNP stability, we synthesized PLL-g-
PEGs with different backbone lengths, PEG grafting densities, and number of thiols per
polymer chain. AuNPs were then combined with these polymer ligands, and the
stabilities of the resulting AuNP@PLL-g-PEG particles against high temperature,
oxidants, and competing thiol ligands were characterized using dynamic light scattering
(DLS), visible absorption spectroscopy, and fluorescence spectrophotometry. Our
observations indicate that thiolated PLL-g-PEG ligands (PLL-g-[PEG:SH]) combine
thermodynamic stabilization via multiple Au-S bonds and steric stabilization by PEG
grafts, and the best graft copolymer ligands balance these two effects. This new ligand
system enables AuNPs to be used for solid phase polymerase chain reaction (SP-PCR)
that requires harsh reaction conditions, such as, elevated temperature and competing thiol
molecules. Azide functionalized PLL-g-[PEG:SH] were conjugated to oligodeoxy-
nucleotide (ODN) primers via click chemistry and bound to AuNPs to yield AuNP-
primers that successfully primed target DNA synthesis on the surface of the AuNPs
through PCR, as demonstrated by gel electrophoresis, DLS, and fluorescent analysis.
Moreover, the graft copolymer stabilized AuNPs were applied to rapid DNA diagnostics
in a single PCR tube with magnetic particles through color change without any
instrumental analysis.
In the second part, bioorthogonal, chemically cleavable -azido ether has been
studied and used to develop novel degradable materials. In order to understand the

iii
chemistry of the -azido ether, model molecules bearing the -azido ether were prepared.
Hydrolytic stability of the model molecules was investigated by measuring their
degradation rate using 1H-NMR, which leads to the relationship between the stability and
chemical structures. Additionally, the cleavage kinetics of the model molecule, which
was triggered by a couple of azide reducing reagents, was studied by 1H-NMR and UV-
Vis absorption spectroscopy. The kinetic studies enable us to develop mechanistic
investigation of the chemical cleavage as well as optimal cleavage conditions.
Furthermore, the products after the chemical cleavage of the -azido ether were
characterized using 1H-NMR. The novel -azido ether was then incorporated into
degradable polyacrylamide gel electrophoresis (PAGE), in which biological
macromolecules, including plasmid, microRNA, and proteins, were separated
electrophoretically and recovered from the gel matrix with the optimal cleavage
conditions. The kinetics of the recovery was quantitatively studied using UV-Vis
absorption spectroscopy and fluorescence spectrophotometry. Furthermore, the recovered
biological macromolecules were analyzed to investigate biocompatibility of our system.
We anticipate further expansion of the -azido ether to a broad range of biological
applications based on the fundamental studies and the representative example in PAGE.

iv
Table of Contents
List of Figures ....................................................................................................... ix
List of Tables ........................................................................................................ xx
Abbreviations ...................................................................................................... xxi
Chapter 1. Gold Nanoparticles and Polymerase Chain Reaction ..................... 1
1.1 Gold nanoparticles (AuNPs) .....................................................................................1
1.1.1 Optical properties of AuNPs ..............................................................................4
1.1.2 Surface chemistry of AuNPs ..............................................................................8
1.2 Polymerase Chain Reaction (PCR) .........................................................................11
1.1.1 Basic principles ................................................................................................11
1.1.2 Solid phase PCR (SP-PCR) ..............................................................................15
1.3 Overview .................................................................................................................19
Chapter 2. Oligothiol Graft-Copolymer Coatings Stabilize Gold
Nanoparticles Against Harsh Experimental Conditions ................................. 21
2.1 Introduction .............................................................................................................21
2.2 Experimental Methods ............................................................................................25
2.2.1 General .............................................................................................................25
2.2.2 Synthesis ...........................................................................................................26
2.2.3 Dynamic light scattering (DLS) analysis .........................................................33
2.2.4 Fluorescence experiments ................................................................................33
2.3 Results and Discussion ............................................................................................34
2.3.1 Synthesis of oligothiolated graft copolymers ...................................................35

v
2.3.2 Surface modification of AuNP with PLLn-g-[PEGx:SHy] ................................40
2.3.3 Comparative stability of AuNP@PLL-g-[PEG:SH] suspensions ....................42
2.3.4 Stability of AuNP-copolymer interactions .......................................................47
2.3.5 Stability of AuNP@PLL-g-[PEG:SH] against chemical etching .....................49
2.3.6 Steric and thermodynamic stabilization in AuNP@PLL-g-[PEG:SH] particles
....................................................................................................................................51
2.4 Summary .................................................................................................................52
Chapter 3. Oligothiol Graft Copolymer Stabilized Gold Nanoparticles as
Solid Supports in PCR ........................................................................................ 53
3.1 Introduction .............................................................................................................53
3.2 Experimental Methods ............................................................................................56
3.2.1 General .............................................................................................................56
3.2.2 Synthesis ...........................................................................................................57
3.2.3 PCR conditions .................................................................................................61
3.2.4 SP-PCR characterizations .................................................................................63
3.2.5 Colorimetric detection of AuNP SP-PCR ........................................................65
3.3 Results and Discussion ............................................................................................67
3.3.1 ODN functionalized AuNPs using oligothiol graft copolymer stabilizing
ligands ........................................................................................................................67
3.3.2 PCR inhibition experiments .............................................................................70
3.3.3 Solid phase PCR on AuNPs .............................................................................72
3.3.4 Digitalized DNA diagnostic assay through SP-PCR ........................................81
3.4 Summary .................................................................................................................87

vi
Chapter 4. Bioorthogonal, Chemically Cleavable -Azido Ether .................. 88
4.1 Degradable material and cleavable linker ...............................................................88
4.2 Cleavable linkers and its applications .....................................................................92
4.2.1 Cleavage by endogenous source .......................................................................92
4.2.2 Cleavage by exogenous source .........................................................................95
4.3 Polyacrylamide gel electrophoresis (PAGE) ...........................................................98
4.3.1 Basic principles ................................................................................................99
4.3.2 Recovery of biological molecules ..................................................................101
4.4 Overview ...............................................................................................................105
Chapter 5. Bioorthogonal, Chemically Cleavable -Azido Ether; Stability and
Cleavage Kinetics Study ................................................................................... 106
5.1 Introduction ...........................................................................................................106
5.2 Experimental Methods ..........................................................................................110
5.2.1 General ...........................................................................................................110
5.2.2 Synthesis .........................................................................................................111
5.2.3 Stability studies against hydrolytic degradation .............................................115
5.2.4 Kinetic studies of cleavage using DHLA triggers by UV-Vis spectroscopy .116
5.2.5 Kinetic studies of cleavage using TCEP triggers by 1H-NMR .......................118
5.2.6 Kinetic studies of cleavage using DHLA triggers by 1H-NMR .....................119
5.2.7 Kinetic analysis ..............................................................................................119
5.2.8 pKa values of DHLA and TCEP .....................................................................120
5.3 Results and Discussion ..........................................................................................120
5.3.1 Stability against hydrolysis .............................................................................120

vii
5.3.2 Cleavage of -azido ether using biocompatible triggers ................................124
5.3.3 Cleavage products of -azido ether using triggers .........................................139
5.4 Summary ...............................................................................................................142
Chapter 6. Degradable Polyacrylamide Gel Electrophoresis Using Cleavable
-Azido Ether for Efficient and Facile Recovery of Biological Molecules .. 144
6.1 Introduction ...........................................................................................................144
6.2 Experimental Methods ..........................................................................................148
6.2.1 General ...........................................................................................................148
6.2.2 Synthesis .........................................................................................................149
6.2.3 Polyacrylamide gel electrophoresis ................................................................152
6.2.4 Recovery of biological molecules ..................................................................154
6.2.5 Expected degradation fraction of N3EG2 .........................................................157
6.3 Results and Discussion ..........................................................................................158
6.3.1 Synthesis .........................................................................................................158
6.3.2 Degradable polyacrylamide (PAAm) gelation ...............................................159
6.3.3 Degradable native protein PAGE ...................................................................160
6.3.4 Degradable PAGE for a nucleic acid ..............................................................165
6.4 Summary ...............................................................................................................170
Chapter 7. Concluding Remarks ...................................................................... 171
Bibliography ........................................................................................................ 173
CHAPTER 1 ................................................................................................................173

viii
CHAPTER 2 ................................................................................................................180
CHAPTER 3 ................................................................................................................185
CHAPTER 4 ................................................................................................................189
CHAPTER 5 ................................................................................................................194
CHAPTER 6 ................................................................................................................199
CHAPTER 7 ................................................................................................................203
ix
List of Figures
Chapter 1
Figure 1-1. The timeline of gold: major discoveries and applications related to
AuNPs. The figure was adapted with permission from Acc. Chem. Res. 2012, 46,
650. Copyright 2012 American Chemical Society. 2
Figure 1-2. (Left) Optical properties of gold nanoparticles (AuNPs). AuNPs
interact with light strongly through absorption and scattering as a result of surface
plasmon resonance (SPR), which is the collective oscillation of the free electrons
induced by an electromagnetic field of light. The incident light induces a
polarization of the free electrons in the conduction band relative to the heavier
nuclei, which is shown in positive and negative charges due to E-field. As a result,
there is a resonance that correlates with the specific frequency of the incident light.
(Right) Photographs of AuNP solutions with respect to the size. The color of
AuNP solutions is intense even in low concentration. As the AuNP size increases,
the color changes from red to violet. The photographs reprinted with permission
from Acc. Chem. Res., 2008, 41 (12), 1721. Copyright 2008 American Chemical
Society. 7
Figure 1-3. A schematic representation of thermal cycling PCR. Target DNA is
amplified via successive thermal cycles of denaturation, annealing, and extension
steps from minute amounts of DNA template to the level at which amplified DNA
can be analyzed. 12
Figure 1-4. The two-metal ion mechanism of DNA polymerase. Divalent metal
ions like Mg2+
are bound to polymerase enzyme through typically carboxylate
residues. The 3’-OH in the primer is deprotonated by the interaction with one of
the metal ions. The deprotonated hydroxyl attacks the -phosphate of the
incorporated dNTP, which leads to covalent connection between 3’-OH of the
13

x
primer and 5’-phosphate of the complementary nucleotide.
Figure 1-5. Representative illustration of SP-PCR and DNA detection after SP-
PCR. Surface bound primers are amplified to have target dsDNA through SP-PCR.
The dsDNA is denaturated to form ssDNA in which fluorescent probes or ELISA
probes are hybridized. The presence of the target DNA is then analyzed using
fluorescence or colorimetric ELISA assay. 16
Figure 1-6. Schematic illustration of SP-PCR using oligothiol graft copolymer
stabilized AuNPs as solid supports. Primers (red) are extended to have target DNA
through SP-PCR. 19
Chapter 2
Figure 2-1. Schematic representation of the stabilization of AuNPs by
oligothiolated graft copolymers. 24
Figure 2-2. 1H NMR spectra of (A) PLL11-g-PEGx and (B) PLL34-g-PEGx in D2O. 36
Figure 2-3. (A) 1H NMR spectrum of PLL11-g-[PEG0.58:SH0.21] dissolved in D2O.
(B) Closeups of 1H NMR spectra for PLL11-g-[PEGx:SHy], illustrating integration
of PEG-CH2-CONH- (A), lysinyl -CH2NH2- (, ', and ''), and thiopropionate -
CH2CH2SH (I and II) protons. Grafting ratios x and y are calculated from these
integrals. The spectra also show a peak corresponding to a small amount of PEG-
CH2-COOH impurity (A'). 38
Figure 2-4. Intensity-averaged hydrodynamic diameter (dz) of aqueous
AuNP@PLL11-g-[PEGx:SHy] and AuNP@PEG-SH particle suspensions
containing 1 M MgCl2 solution and AuNP@citrate particle suspensions containing
2 mM MgCl2 solution, as a function of time, measured by DLS. 42

xi
Figure 2-5. Intensity-averaged hydrodynamic diameter (dz) of aqueous
AuNP@PLLn-g-[PEGx:SHy] particle suspensions containing 10 mM DTT and 10
mM PBS (pH 7), as a function of time and temperature, measured by DLS.
Suspensions were prepared at room temperature (A, C, E) or annealed at 90 °C (B,
D, F) with graft copolymers made from PLL11 (A, B), PLL34 (C, D) or PLL50 (E,
F) backbones. In each experiment, the solution temperature was increased
stepwise from 25 °C to 90 °C as shown in the legend at the top. 45
Figure 2-6. (A) Absorbance at 524 nm of aqueous AuNP@PLL11-g-[PEGx:SHy]
particle suspensions containing 10 mM DTT and 10 mM PBS (pH 7), as a function
of time and temperature. In each experiment, the solution temperature was
increased stepwise from 25 °C to 90 °C as shown in the legend at the top. (B-D)
Full absorption spectra of AuNP@PLL11-g-[PEGx:SHy] suspensions from (A). 46
Figure 2-7. Relative fluorescence intensity of AuNP@PLL11-g-[PEGx:SHy:FAM]
particle suspensions, incubated at 90 °C, as a function of time. Solutions contained
(A) no DTT, (B) 1 mM DTT, and (C) 10 mM DTT. 48
Figure 2-8. Absorbance at 520 nm of AuNP@PLL11-g-[PEGx:SHy] suspensions
exposed to 10 mM KCN, as a function of time. (A) AuNP@PLL11-g-[PEGx:SHy]
prepared at room temperature; (B) AuNP@PLL34-g-[PEGx:SHy] prepared at room
temperature; and (C) AuNP@PLL34-g-[PEGx:SHy] annealed at 90 °C. 50
Chapter 3
Figure 3-1. Synthetic scheme of -amino -azido hetero functionalized PEG. 57
Figure 3-2. Schematic representation of AuNPs coated with ODN functionalized
oligothiol graft copolymer. 69

xii
Figure 3-3. Agarose gel electrophoresis images of PCR inhibition experiments.
After PCR was performed containing different concentrations of AuNPs that were
stabilized by HS-T20, HS-PEG-T20, or PLL-g-[PEG-T20: SH], the PCR products
were analyzed aragose gel electrophoresis. Top: Visible images corresponding to
AuNP red-bands stabilized with (Left) HS-T20, (Middle) HS-PEG-T20, or (Right)
PLL-g-[PEG-T20: SH]. Bottom: Fluorescence images corresponding to ethdium
bromide staining 400bp DNA bands for AuNPs stabilized with (Left) HS-T20,
(Middle) HS-PEG-T20, or (Right) PLL-g-[PEG-T20: SH]. From left to right lanes,
the concentration of AuNPs increases (0.2, 0.4, 1, 2, and 4 nM). In no PCR lanes,
AuNPs were not performed for PCR as negative control. 71
Figure 3-4. Schematic illustration of AuNP-ssDNA characterization using
fluorophore tagged complementary ODN probes. dsDNA on the AuNP-amplicons
is denaturated by basic solution, resulting in immobilized ssDNA. FAM-ODN
probes containing complementary sequence to the immobilized ssDNA are mixed
with the AuNP-ssDNA. When the FAM-ODNs are hybridized, the fluorescence is
quenched due to FRET by AuNPs. After purification of the solution to remove
excees amount of free FAM-ODNs, the AuNPs are etched to turn on the
fluorescence that is measured by a fluorometer. 75
Figure 3-5. Schematic demonstrations of AuNPs stabilized by different types of
thiol primers; Au@HS-ODN. monothiol primer, Au@HS-T8-ODN. monothiol T8
primers, Au@HS-PEG-ODN. monothiol PEGylated primers, and Au@PLL-g-
[PEG-ODN:SH]. oligothiol graft copolymers conjugated with primers 76
Figure 3-6. (A) Agarose gel electrophoresis images of bright field (Left) and EtBr
staining (Right) of AuNP-amplicons after 30 thermal PCR cycles with 4.5 mM of
MgCl2 and 0.025 U/L of DNA polymerase. Top legends include AuNP solid
supports with different types of primers. (B) Fluorescence intensity of the
intercalated SYBR green I with the amplified dsDNA on the AuNPs and intensity-78

xiii
averaged hydrodynamic size (dz) of the AuNP-amplicons before and after SP-PCR
79varying the concentration of MaCl2 (1.5 and 4.5 mM) and DNA polymerase
(0.025 to 0.050 U/L).
Figure 3-7. (A) Agarose gel electrophoretic patterns of the AuNP-amplicons after
SP-PCR using different length of templates: 400 bp (left lane) and 100 bp (right
lane). The middle lane included Au@PLL-g-[PEG-ODN:SH] without SP-PCR for
comparison. (B) Fluorescent intensity of complementary (black solid line) and
non-complementary (red dot line) FAM-ODNs that were incubated with the
denaturated AuNP-amplicons, after AuNP etching with KCN. (C) Size change of
AuNP-amplicons depending on target DNA size and number of thermal cycles,
measured by DLS. 80
Figure 3-8. (A) Schematic diagram of colorimetric detection of SP-PCR on
AuNPs. When target DNA exists, AuNP-amplicons are tagged with biotin
thoughout SP-PCR. The biotin tagged AuNP-amplicons are then captured by
streptavidin-coated magnetic beads. When magnetic field applied, the captured
AuNPs are settled down, providing color change from red to colorless. On the
other hand, if the target sequence is absent, AuNPs do not have biotin tags,
resulting in the retention of red color. (B) Experimental results of (A). The
presence of target DNA in SP-PCR mixture induced color change from red to
colorless, which was distinguishable by eye examination. On the other hand, the
red color was retained when target DNA was not present in SP-PCR conditions.
(C) Photographs of AuNP-amplicons in capillary tubes after magnetic attraction in
(B). (Top) Light was illuminated at right angle to the tubes. (Middle) Waveguided
light illumination was used through capillary tube from top to bottom. (Bottom)
Digitalized images of waveguided light color using green optical filter. Negative
SP-PCR showed dark for 0 signal, whereas positive SP-PCR had green color for 1
signal. 85

xiv
Chapter 4
Figure 4-1. Cleavable linkers in biological applications. (Top) Linkers that can be
cleaved by endogenous sources, such as, water, enzyme and biologically abundant
chemicals. (Bottom) Linkers that can be cleaved by exogenous sources, such as,
light and biologically rare chemicals. 91
Figure 4-2. Schematic illustration of polyacrylamide (PAAm) gel electrophoresis
(PAGE). The PAAm gel is synthesized by a radical polymerization reaction of
acrylamides and crosslinkers using APS/TEMED system. The biological
molecules are loaded on the top of the gel and electrophoretically migrated by
electric potential. The biological molecules are then separated depending on
charge, size, and shape. Separated biological molecules in the gel matrix are
frequently recovered for further analysis. 100
Figure 4-3. Molecular structure of a cleavable crosslinker for a degradable
polyacrylamide gel (Right) and its degradation condition (Left). The cleavage
reaction is carried out in the red colored functional groups. 102
Chapter 5
Figure 5-1. Synthetic scheme of -azido ether 1, azido-2-methoxy-1-(2-methoxy-
ethoxy)ethane. 111
Figure 5-2. Synthetic scheme of -azido ether 2, 2-azido-2-(2-hydroxythoxy)ethyl
phthalimide. 113
Figure 5-3. Synthetic scheme of -azido ether 3, 2-(3-phthalimido(1-azidoprop-
oxy))-ethanol. 114
xv
Figure 5-4. Mechanism of -azido ether degradation via oxocarbenium
intermediate in aqueous solution. 121
Figure 5-5. Azide chemicals used to study hydrolytic stability (1-4) and reductive
cleavage of -azido ether (1) and its analogous (5 and 6). 122
Figure 5-6. Hydrolytic stability of -azido ether chemicals measured by 1H-NMR.
The degradation rate was obtained by fitting the data of ln([-azido ether]) versus
time using the first order rate equation. Chemical 1 was dissolved in several
buffered solutions (pD 3.59, 7.00 and 10.19), which showed similar behavior.
Here, pH 7.00 data was included. Chemical 2 and 3 were dissolved in 1:1 of D2O
and DMF-d7 because of solubility. 123
Figure 5-7. Reaction between DHLA and -azido ether 1 to determine order
dependences of DHLA and -azido ether on cleavage, measured by UV-Vis
spectroscopy using LA absorption peak at 334 nm. Left: Initial rate (dx/dt) of LA
formation versus different initial concentration of DHLA with excess -azido
ether 1. Right: Plot of pseudo first order rate constants versus concentration of -
azido ether 1. 126
Figure 5-8. Plot of second order rate constant (k) versus pH for the reaction
between 50 mM azido compounds (-azido ether 1, primary azido 5 and
secondary azido 6) and 10 mM DHLA in buffered aqueous solutions, measured by
UV-Vis spectroscopy. Chemical shift of methine proton of DHLA and its NMR
titration curve dependent on pD were included. 129
Figure 5-9. Kinetic profiles of DHLA and LA concentration with respect to time
for the reaction between -azido ether 1 and DHLA, measured by 1H-NMR at pH
9.67 (left) and 10.19 (right). The sum of DHLA and LA concentration remained as
constant. The plots were converted to 1/concentration and fitted using second 130

xvi
order rate equation to obtain kinetic constants (k).
Figure 5-10. Suggested mechanism for the reductive cleavage of -azido ether
using DHLA trigger. 131
Figure 5-11. Plot of second order rate constant and chemical shift versus pH or pD
for the reaction between -azido ether 1 and TCEP or DHLA. For TCEP, the rate
constant was obtained from TCEP consumption, measured by 1H-NMR. For
DHLA, the rate constant was obtained from the formation of LA, measured by
UV-Vis spectrometry. The NMR titration curve was constructed from the proton
chemical shift of methylene protons next to the P atom for TCEP and methine
proton for DHLA, measured by 1H-NMR. The arrow indicates that the trigger’s
pKa value shifts from 10 to 7.7, which also causes the rate constant curve to shift,
improving the rate constant value at neutral pH (or pD). 133
Figure 5-12. (A-E) Plot of kinetic profiles of TCEP, TCEP=O, intermediate I1
and I2 versus time for and eqimolar reaction between a-azido ether 1 and TCEP in
buffered solutions of pD (A) 6.88, (B) 8.07, (C) 9.67, (D) 10.74, and (E) 11.13,
measured by H-NMR spectroscopy. Exponential disappearance of TCEP was
observed in every pD solutions. But, the TCEP=O formation followed exponential
appearance at lower pD, and shifted then to linear dependence at higher pD with
respect to the time. (F) Second order rate constants (k2
TCEP=O M-1
s-1
) at lower pD
from exponential disappearance of TCEP=O, resulting from A-B and zero order
rate constants (k0
TCEP=O M s-1
) at higher pD from linear dependence of TCEP=O,
resulting from C-E. 135
Figure 5-13. Proposed mechanism of the major reaction pathway for the reaction
between -azido ether 1 and phosphines in aqueous solutions. 137
Figure 5-14. Proposed mechanism of minor reaction pathway for the reaction
between -azido ether 1 and phosphines in aqueous solutions. Water (top) or lone 138

xvii
pair electrons on N (bottom) might provide intermediate I2 that was eventually
converted to TCEP=O.
Figure 5-15. (A) Expected products from -azido ether 1 reductive cleavage. (B)
1H-NMR spectra of cleavage products from the reaction between -azido ether 1
and TCEP in different pD (10.19, 9.67, and 7.00) buffered NMR solutions. The
alcohol product was supported by the appearance of methoxy (i, singlet) protons at
3.38 ppm and methylene (ii, triplet) protons at 3.56 and 3.71 ppm. Hydrated
aldehyde was formed after the reaction, supported by the peaks corresponding to
triplet methine (a), doublet methlyene (b), and singlet methyl (c) at 5.16, 3.43, and
3.39 ppm, respectively, at neutral pD. The hydrated aldehyde was decomposed as
the pD of the solution increased, supported by the decrease of those peaks (a, b,
and c). 141
Chapter 6
Figure 6-1. A schematic illustration of a degradable polyacrylamide gel
electrophoresis (PAGE) using a -azido ether crosslinker (N3EG2). A
polyacrylamide gel (PAAm) was synthesized through a radical polymerization of
acrylamide monomers and N3EG2 crosslinkers using APS/TEMED initiation
system in aqueous solution. After biological molecules, such as, proteins, DNA,
and RNA, are loaded on the top of the PAAm gel, the biological molecules are
separated by gel electrophoresis. The gel containing the biological molecules is
excised and embedded molecules are recovered from the gel in mild,
biocompatible degradation conditions (TCEP solution). 147
Figure 6-2. Synthetic scheme for -azido ether crosslinker, N3EG2. 149
Figure 6-3. Initially designed synthetic scheme for a N3EG2 crosslinker through a 159

xviii
benzoate protected -azido ether.
Figure 6-4. Protein recovery after PAGE. (A) Recovery profiles of a B-PE protein
and (B) a ferritin from a degradable N3EG2 gel with a TCEP trigger solution (black
square, i), a degradable N3EG2 gel without a TCEP trigger (red circle, ii), and a
non-degradable Bis gel with a TCEP trigger (blue triangle, iii), measured by a
fluorescence spectrophotometer (ex 475 nm and em 570 nm) and a UV-Vis
spectrophotometer (absorbance at 400 nm), respectively. (C) Fluorescent images
during B-PE recovery. A pink band indicated the embedded B-PE in the gel
matrix. (D) Isolation of the recovered proteins from the degradable N3EG2 gel
matrix and small molecules like TCEP and TCEP=O using a PD-10 desalting
column. The concentration of isolated proteins, B-PE and ferritin, at each fraction
(1 mL) were measured by a fluorescence (ex 475 nm and em 570 nm) and a UV-
Vis spectrophotometer (absorbance at 400 nm), respectively. 164
Figure 6-5. (A) Gel electrophoresis (5 %T / 5 %C N3EG2 polyacrylamide gel, 1x
TBE) of a 1 kb DNA ladder and a plasmid DNA. After electrophoresis, the DNA
bands were stained with ethidium bromide solution and then scanned to provide
the image. (B) Green fluorescence images of intercalated SYBR green I into DNA
under UV light illumination with respect to the time. Green fluorescence indicated
an embedded plasmid DNA band in the gels. Recovery profiles of a plasmid DNA
out of the gels incubated at 37 oC (C) and 50
oC (C), measured by a fluorescence
intensity of the intercalated SYBR green I dye of dsDNA in the recovery solution.
Only the degradation condition (i) could liberate the plasmid DNA from the gel
matrix completely leading to the green band disappearance (B) and max
fluorescence intensity (C and D), as a result of gel solubilization, while other non-
degradable conditions (ii and iii) showed no change. 167
Figure 6-6. RNA denaturating urea gel electrophoresis. (A) Gel electrophoresis (4
%T polyacrylamide gel, 1x TBE, ~7.5 M urea) of 400nt microRNA. After
electrophoresis, the RNA bands were visualized by UV-shadowing method to 169

xix
provide the image. (top) RNA band using a conventional 5 %C Bis polyacrylamide
gel. (bottom) RNA band using a degradable 8 %C N3EG2 polyacrylamide gel. (B)
Secondary denaturating urea gel electrophoresis of ssRNA ladder, original and
isolated microRNA (400nt). After gel electrophoresis using a Bis gel, the gel was
stained with SYBR green II solution and fluorescence image was taken under UV
illumination. The isolated microRNA had the same migration as that of original
microRNA, maintaining their size after degradation. The result indicated the
degradation condition was compatible with RNA even in high temperature
resulting in no effect on the RNA band migration.

xx
List of Tables
Chapter 2
Table 2-1. Synthesis of PLL11-g-[PEGx:SHy]. 27
Table 2-2. Synthesis of PLL34-g-[PEGx:SHy], where x < 0.6. 29
Table 2-3. Synthesis of PLL34-g-[PEGx:SHy], where x > 0.6. 29
Table 2-4. Synthesis of PLL50-g-[PEGx:SHy]. 30
Table 2-5. Characteristics of PLLn-g-PEGx and PLLn-g-[PEGx:SHy] 37
Table 2-6. Characteristics of AuNP@PLLn-g-[PEGx:SHy]. 39
Chapter 3
Table 3-1. PCR primers and probes sequences. 66

xxi
Abbreviations
APS ammonium persulfate
AuNP gold nanoparticle
BAC N,N’-bisacrylylcystamine
BHT butylated hydroxytoluene
Bis N,N’-methylene bisacrylamide
B-PE B-phycoerythrin
CAPS N-cyclohexyl-3-aminopropanesulfonic acid
CNT carbon nanotube
DCM dichloromethane
DHLA dihydrolipoic acid
DIBO dibenzylcyclooctyne
DIPEA N,N-diisopropylethylamine
DLS dynamic light scattering
DMF N,N-dimethylformamide
DMSO dimethylsulfoxide
DNA deoxyribonucleic acid
dNTP deoxyribonucleotide triphosphate
dsDNA double strand DNA
DSS 4,4-dimethyl-4-silapentane-1-sulfonic acid
DTT dithiothreitol
EDC 1-ethyl-3-(3-dimethylaminopropyl)carbodiimide
EDTA ethylenediaminetetraacetic acid
ELISA enzyme-linked immunosorbent assay
EtBr ethidium bromide
FAM fluorescein
FAM-PEG-SCM fluorescein poly(ethylene glycol)-succinimidyl
carboxymethyl

xxii
FAM-PEG-SH fluorescein poly(ethylene glycol)-thiol
FRET Fluorescence resonance energy transfer
Gd-DOTA gadolinium-tetraazacyclododecanetetraacetic acid
GFP green fluorescent protein
GPC gel permeation chromatography
IEF isoelectric focusing
IgG immunoglobulin G
LA lipoic acid
LLC Lewis lung carcinoma
MEHQ methyl ether hydroquinone
MMP matrix metalloproteinase
mPEG-SCM methoxy-poly(ethylene glycol)-succinimidyl carboxymethyl
mPEG-SH methoxy-poly(ethylene glycol)-thiol
MRI magnetic resonance imaging
MsCl methanesulfonyl chloride
MWCO molecular weight cut-off
N3EG2 N-(2-(2-acrylamido-1-azidoethoxy)ethyl)acrylamide
NMR nuclear magnetic resonance
ODN oligodeoxyribonucleotides
PAAm polyacrylamide
PAGE polyacrylamide gel electrophoresis
PBS phosphate buffered saline
PCL poly-caprolactone
PCR polymerase chain reaction
PDI polydispersity index
PDP pyridyldithiopropionate
PEG poly(ethylene glycol)
PGA poly-glycolic acid
PHA polyhydroxylalkanoate

xxiii
PLA poly(lactic acid)
PLL poly(L-lysine)
PLL11-g-[PEG:PDP] poly(L-lysine)-g-[poly(ethylene glycol):(2-pyridyldithio)
propionamide]
PLL11-g-[PEG:SH:FAM] poly(L-lysine)-g-[poly(ethylene glycol):thiol:fluorescein]
PLL11-g-[PEG:SH] poly(L-lysine)-g-[poly(ethylene glycol):thiol]
PLL-g-PEG poly(L-lysine)-graft-poly(ethylene glycol)
PP polypropylene
PTFE polytetrafluoroethylene
RDS rate determining step
RNA ribonucleic acid
RP-HPLC reversed phase high-performance liquid chromatography
SDS sodium dodecyl sulfate
siRNA small interfering RNA
SNP single-nucleotide polymorphism
SPDP N-succinimidyl 3-(2-pyridyldithio)-propionate
SP-PCR solid phase polymerase chain reaction
SPR surface plasmon resonance
ssDNA single strand DNA
Taq Thermus aquaticus
TBE Tris-borate-EDTA
TCEP tris(2-carboxyethyl)phosphine
TCEP=O tris(2-carboxyethyl)phosphine oxide
TE Tris-EDTA
TEM transmission electron microscopy
TEMED tetramethylethylenediamine
TEV tobacco etch virus protease
THF tetrahydrofuran
TMS-N3 trimethyl silyl azide

xxiv
Tris tris(hydroxymethyl)aminomethane

Chapter 1. Gold nanoparticles and solid-phase PCR
1
Chapter 1. Gold Nanoparticles and
Polymerase Chain Reaction
1.1 Gold nanoparticles (AuNPs)
A nanomaterial is a material whose size is in the 1 – 100 nm range at least in one
dimension. The size of a nanomaterial falls into a range which is larger than atoms and
molecules other than polymers and smaller than bulk materials. As a consequence, the
physical behaviors of nanomaterials are unique compared to those of atomic or bulk
materials. After the conceptual beginning of nanomaterials (without using the word itself)
by Richard Feynman’s lecture in 1959 titled “There’s Plenty of Room at the Bottom”,1-2
nanomaterials have been of great interest in a wide range of research fields, including
chemistry, physics, biology, electronics, engineering, and materials, during the last three
decades. Due to the confined nanoscale size, nanomaterials show extraordinary optical,
electrical, magnetic, mechanical, and catalytic properties. For example, noble metal
nanoparticles of Au and Ag have been used as sensing probes in analytical tools and
biodiagnostics due to their incomparably intense color as well as size dependent color
change.3-4
Colloidal quantum dots consisting of semiconducting materials show excellent
photoluminescence and tunable bandgaps, depending on their size and composition, and
can be used in light-emitting devices5 and fluorescent imaging and sensing of biological
events.6 Magnetic nanoparticles made of inorganic oxides have been applied in magnetic

Chapter 1. Gold nanoparticles and solid-phase PCR
2
separation of biological molecules7 and contrast agents in magnetic resonance imaging
(MRI).8 Carbon nanotubes (CNT) have served as excellent reinforcers in composite
materials providing better mechanical properties with low mass compared to glass-
fibers.9 Furthermore, electrical conductivity of CNT promises transparent, flexible, and
conductive films in electronics.10
Nanosized structures show high catalytic activity and
selectivity depending on their size and shape in many organic reactions.11-12
Figure 1-1. The timeline of gold: major discoveries and applications related to AuNPs.
The figure was adapted with permission from Acc. Chem. Res. 2012, 46, 650. Copyright
2012 American Chemical Society.13
Among various nanomaterials, gold nanoparticles (AuNPs) are one of the most
studied nanomaterials due to their simple preparation, novel properties, and facile
functionalization. AuNPs have a long history based on these characteristics since the

Chapter 1. Gold nanoparticles and solid-phase PCR
3
ancient Roman times. AuNPs were used as color pigments in the Lycurgus cup of Roman
glass and stained-glass windows of medieval cathedrals because of their intense red
colors under transmitted light and dark green colors under reflected light.14
At one time,
gold colloidal solution was used as “the Elixir of Life” due to its blood-red color which
brought to mind life-essence materials.15
After Faraday published the first scientific
report of a AuNP red-solution in 1857,16
Turkevich17
and Frens18
developed a simple
method to prepare AuNP using sodium citrate reduction of gold ions to generate uniform
and size-controlled AuNPs, which is still one of the standard methods for AuNPs
synthesis. Antibodies-functionalized AuNPs have been applied as contrast agents in
electron microscopy to label cellular macromolecules to elucidate their in vivo
biochemical functions, which has been called immunogold labeling since 1971 by
Taylor.19
In 1983, Nuzzo et al. reported evidence of fairly strong chemical bonding
between Au and thiol (or disulfide) that contributed to facile functionalization of Au
surface using thiol molecules. Before that time, it was believed that “Gold [was]
recognized to be one of the least active metals in chemisorptions as evidenced by its
inertness toward molecular oxygen.” as Nuzzo et al. commented.20
Later, the Au-thiol
chemistry was applied to functionalize AuNPs with DNA by Mirkin21
and Alivisatos22
groups in 1996. In particular, Mirkin et al. inaugurated the use of AuNPs as optical
probes based on their extraordinary optical properties to visually detect target DNA
without any instrumental analysis other than eye examination. Since then, AuNPs have
played a significant role for instrument-free detection assays in analytical chemistry and
medical diagnostics.4 The Mirkin group has further expanded the use of AuNPs to

Chapter 1. Gold nanoparticles and solid-phase PCR
4
various applications, such as, DNA detection assays using silver enhanced AuNPs,23
AuNP arrays for electrical detection,24
and Raman-active dye labeled AuNPs for Raman
scattering,25
and basic building blocks for ordered AuNP assembly.26
AuNPs have further
been studied as essential materials in many other applications, including catalytic
systems12
and nano-medicines,27-28
resulting in AuNPs as key components in
nanomaterials.
This thesis deals with use of the unique properties that AuNPs bear, especially,
optical properties and facile Au-S surface chemistry. It is investigated to integrate the
excellent properties into a biological technology, particularly polymerase chain reaction
(PCR), as a means of instrument-free DNA detection, which reduces analysis time and
removes the additional tasks that are required in most current DNA detection methods.
However, the facile Au-S chemistry needs to be improved for this purpose because PCR
requires harsh reaction conditions like high temperatures up to 95 oC in which the Au-S
chemistry is restricted. The following sections describe a short discussion on the optical
properties and surface chemistry of AuNPs as well as polymerase chain reaction.
1.1.1 Optical properties of AuNPs
AuNPs in the size range of 1 – 100 nm have been extensively studied due largely
to their unique optical properties compared to bulk and atomic gold. When light interacts
with bulk Au, it appears yellow due to a reduction of reflectivity at the blue region of the
visible spectrum.29
AuNPs, on the other hand, have intense and distinctive colors,
covering the range from red to violet depending on their size (Figure 1-2).30-31
This array

Chapter 1. Gold nanoparticles and solid-phase PCR
5
of colors is due to a phenomenon called surface plasmon resonance (SPR), which is the
result of the collective oscillation of the free electrons being induced by an
electromagnetic field. The incident light induces a polarization of the free electrons in the
conduction band relative to the heavier nuclei. As a result, there is a resonance that
correlates with the specific frequency of the incident light. A theoretical description for
SPR of the AuNPs was reported by Mie in 1908.31-32
The theory predicts that there is a
linear relationship between ln(diameter) and ln(extinction coefficient ()). As a result, the
value of the extinction coefficient of spherical AuNPs increases from 105 to 10
10 M
-1cm
-1
with respect to their size ranging from 2 to 100 nm in diameter from both theoretical
calculation and experimental data.33-34
That means AuNPs are more useful as optical
probes for bio-applications than organic dyes because the value of AuNPs is 4 - 5
orders of magnitude larger than that of organic dye molecules, (i.e. 1.16 x 10⁵ M
-1cm
-1 at
530 nm of Rhodamine-6G). Therefore, AuNPs show promise in replacing organic optical
tags for bio-applications as well as developing color based detection of subjects even in
very low concentration.4,21
Another useful and interesting property of SPR is that the resonance and
consequently AuNP colors can be readily tuned by size, shape, and distance between the
AuNPs.21,30,35
For instance, the size of AuNPs affects the frequency of the SPR band such
that it is shifted according to the diameter of AuNPs. Both Mie theory prediction and
experimental data indicate that as the size increases from 32 to 100 nm in diameter, the
maximum extinction of SPR (max) is shifted to longer wavelengths (525 to 569 nm),33
and broadening of the SPR band occurs.31
As a result, the color of AuNP solution

Chapter 1. Gold nanoparticles and solid-phase PCR
6
changes from red to violet with the increase of the AuNP size.36
Another way of tuning
the SPR band is by changing the shape of the gold from spherical particles to nanorods.37
For gold nanorods, there are two λmax corresponding to the oscillation of the conduction
electrons along the short and long axis. Accordingly, the SPR bands are affected by the
aspect ratio: the ratio of length to width. The SPR bands also vary according to the
interparticle distance between the AuNPs. The SPR bands are red-shifted as the distance
decreases because of the interaction between particle surface plasmons. Based on this,
Alivisatos et al. developed a molecular ruler using this SPR band shift depending on the
interparticle distance to monitor the kinetics of biological events.35
In order to use the unique optical properties of the AuNPs, it is a prerequisite that
AuNPs are stable in application conditions. This can be achieved through chemical
modification of the AuNPs, which can also introduce various functionalities on the
AuNPs. Below is a short overview for why stabilization is required and how AuNPs can
be stabilized.

Chapter 1. Gold nanoparticles and solid-phase PCR
7
Figure 1-2. (Left) Optical properties of gold nanoparticles (AuNPs). AuNPs interact with
light strongly through absorption and scattering as a result of surface plasmon resonance
(SPR), which is the collective oscillation of the free electrons induced by an
electromagnetic field of light. The incident light induces a polarization of the free
electrons in the conduction band relative to the heavier nuclei, which is shown in positive
and negative charges due to E-field. As a result, there is a resonance that correlates with
the specific frequency of the incident light. (Right) Photographs of AuNP solutions with
respect to the size. The color of AuNP solutions is intense even in low concentration. As
the AuNP size increases, the color changes from red to violet. The photographs reprinted
with permission from Acc. Chem. Res., 2008, 41 (12), 1721.38
Copyright 2008 American
Chemical Society.
Chapter 1. Gold nanoparticles and solid-phase PCR
8
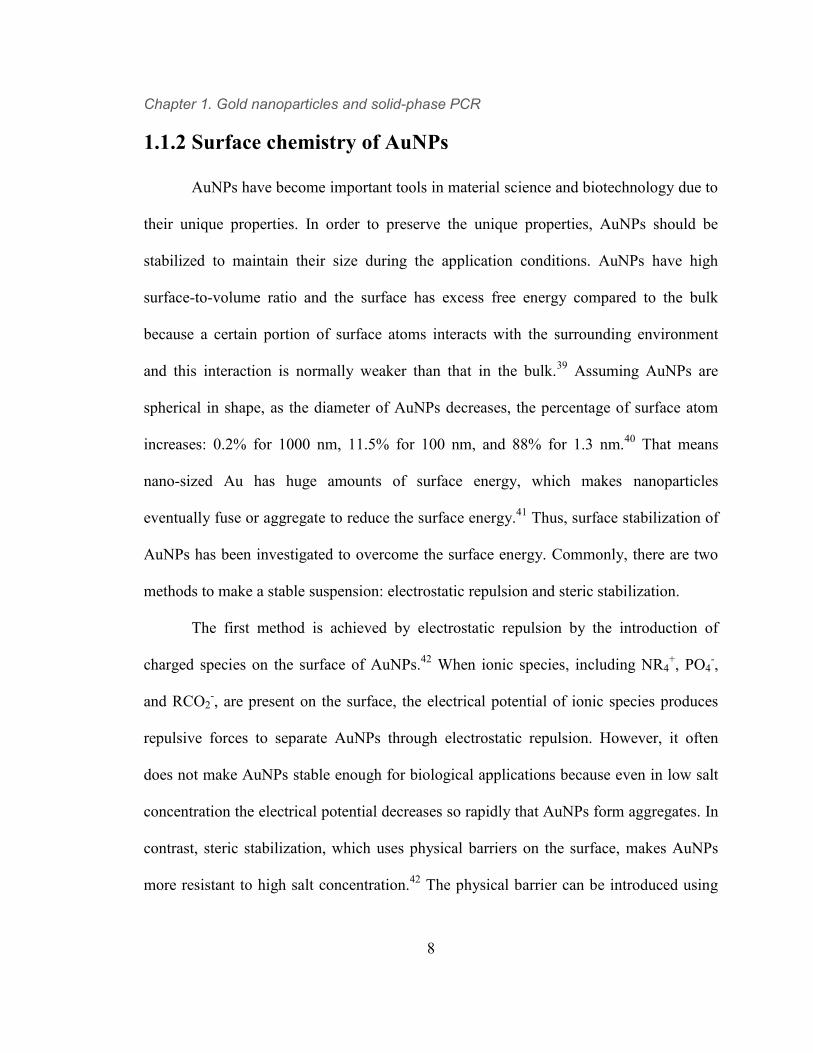
1.1.2 Surface chemistry of AuNPs
AuNPs have become important tools in material science and biotechnology due to
their unique properties. In order to preserve the unique properties, AuNPs should be
stabilized to maintain their size during the application conditions. AuNPs have high
surface-to-volume ratio and the surface has excess free energy compared to the bulk
because a certain portion of surface atoms interacts with the surrounding environment
and this interaction is normally weaker than that in the bulk.39
Assuming AuNPs are
spherical in shape, as the diameter of AuNPs decreases, the percentage of surface atom
increases: 0.2% for 1000 nm, 11.5% for 100 nm, and 88% for 1.3 nm.40
That means
nano-sized Au has huge amounts of surface energy, which makes nanoparticles
eventually fuse or aggregate to reduce the surface energy.41
Thus, surface stabilization of
AuNPs has been investigated to overcome the surface energy. Commonly, there are two
methods to make a stable suspension: electrostatic repulsion and steric stabilization.
The first method is achieved by electrostatic repulsion by the introduction of
charged species on the surface of AuNPs.42
When ionic species, including NR4+, PO4
-,
and RCO2-, are present on the surface, the electrical potential of ionic species produces
repulsive forces to separate AuNPs through electrostatic repulsion. However, it often
does not make AuNPs stable enough for biological applications because even in low salt
concentration the electrical potential decreases so rapidly that AuNPs form aggregates. In
contrast, steric stabilization, which uses physical barriers on the surface, makes AuNPs
more resistant to high salt concentration.42
The physical barrier can be introduced using

Chapter 1. Gold nanoparticles and solid-phase PCR
9
stabilizing molecules, such as, small organic molecules and polymers,43-46
including
DNA, protein, and synthetic polymers.
Electrostatic repulsion and/or steric stabilization for AuNPs have been achieved
by anchoring surface ligands.42
In order to be a good surface ligand, the surface ligand
should bind to Au strongly through the interaction between specific functional groups in
the ligands and the Au surface. Although there are many functional groups,47
such as,
phosphine, phosphine oxide, amine, and carboxylate, strong interaction between Au and
thiol has been widely used. The evidence of strong Au-S bond was first discovered by
Nuzzo et al. in 1983 through their adsorption study of disulfide molecules on Au
surface.20
Afterwards, a homolytic Au-S bond strength is ~50 kcal/mol in a vacuum
condition, which is fairly strong considering ~62 kcal/mol is a typical S-S homolytic
bond strength.40
Later, a couple of seminal papers were released consecutively in 1996, in
which the strong Au-S bond was adapted to stabilize AuNPs for colorimetric DNA
detection21
and 3D AuNP nanoassembly.22
The Au-S bond has then become the most
widely used chemistry for the anchor group of AuNP stabilizing ligands. As a result,
many thiol functionalized macromolecules have been utilized to generate stable AuNPs,
including natural macromolecules,21-22,48-49
synthetic homopolymers, in which AuNPs are
connected by either terminal50-58
or side-chain59-62
thiols, and synthetic copolymers,
including random,63-64
alternating,65
graft,66-67
and block50,68-71
copolymers.
However, the mono-thiol ligands are not always bound to the AuNPs surface
under certain conditions, such as, high temperature72-74
and in the presence of competing
thiol species75-78
or oxidants,72,79-81
in an extremely good solvent for the ligands. Based on

Chapter 1. Gold nanoparticles and solid-phase PCR
10
measured energy barrier values of thiolate desorption process from the Au surface (15-30
kcal/mol),40,82-84
thiol ligands are thermodynamically dissociated from the AuNP surface
at high temperature. For example, Herdt in the Taton group reported that mono-thiol
DNA ligands on AuNPs desorbed and degraded at high temperature. Grzybowski et al.
used the thermal desorption of mono-thiol ligands from Au surface to form fused
AuNPs.73,85
In this approach, 1,8-octanedithiols crosslinked AuNPs forming spherical
aggregates with nano-void between AuNPs, and then desorbed from the surface by
heating the solution to form nanoporous materials. It is also reported that mono-thiol
ligands are replaced with external thiol species via ligand exchange reaction. Mirkin et al.
released mono-thiol DNA ligands from the AuNP surface by addition of external thiols
like DTT through ligand exchange reaction. Moreover, Rotello et al. designed AuNP
carriers in which mono-thiol functionalized fluorophore ligands were released from the
AuNP surface via a glutathione-mediated exchange reaction, which is one of the most
abundant thiol species in cytoplasm.
Chapter 2 in this thesis shows how stable ligands for AuNP can be achieved
against the experimental harsh conditions, such as, high temperature, oxidants, and
competing thiol species.86
It is reported that as the number of thiols in a stabilizing ligand
increases, enhanced stability is obtained.87-90
For instance, Randall et al. showed that
tridentate thiol ligand stabilized AuNPs had better thermal stability as well as resistance
to ligand exchange reaction with competing thiol species, compared to monodentate and
bidentate ligands.91
Based on this idea, multi-thiolated graft copolymers have been
developed for the stable AuNPs. Graft copolymers have advantages compared with small

Chapter 1. Gold nanoparticles and solid-phase PCR
11
molecules because of their straightforward synthesis and facile control of thiol ratio in a
graft copolymer through which an optimal thiol ratio is readily investigated. The graft
copolymer stabilized AuNPs are designed as a support in a polymerase chain reaction
(PCR) that is operated in high temperature. Thus, the basic principles of PCR and
advanced PCR technique are briefly overviewed.
1.2 Polymerase Chain Reaction (PCR)
1.2.1 Basic principles
DNA is an essential biological molecule that contains the genetic information to
construct every component needed for life. Consequently, detecting specific DNA, which
means recognition of specific sequence of ATGC molecules, has impacted molecular
biology, clinical diagnostic, forensics, and so on. Traditionally, DNA detection has been
achieved through hybridization assays using detection of specifically designed probes
(i.e. radioactively or fluorescently labeled probes) or distinguishing the lengths of
hybridized dsDNA and non-hybridized ssDNA via electron microscopy.92
However,
these methods have restrictions in terms of sensitivity and reproducibility, caused by the
extremely small amounts of DNA samples. This has led to the investigation of a novel
method to amplify the amounts of DNA samples using an enzymatic reaction called
polymerase chain reaction (PCR).93-94

Chapter 1. Gold nanoparticles and solid-phase PCR
12
Figure 1-3. A schematic representation of thermal cycling PCR. Target DNA is
amplified via successive thermal cycles of denaturation, annealing, and extension steps
from minute amounts of DNA template to the level at which amplified DNA can be
analyzed.
PCR has revolutionized modern molecular biology and clinical diagnostics by
providing a practical method to amplify target DNA, theoretically, from a single copy of
DNA. In contrast to the early hybridization assays, PCR provides a rapid, sensitive, and
specific method for DNA detection. In a basic process, successive thermocycles are
performed to copy the target DNA sequence from a DNA template. Each cycle
synthesizes two copies of the target DNA from one template and the synthesized DNA
serves as a new template for the next cycle, resulting in exponential amplification of the
target DNA. PCR components consist of (1) DNA template, (2) a pair of forward and
reverse primers that is oligo-deoxyribonucleotide and designed to be hybridized with a
Chapter 1. Gold nanoparticles and solid-phase PCR
13
specific sequence of a template, (3) a polymerase enzyme, (4) deoxyribonucleotide
triphosphates (dNTP), and (5) reaction buffer. Each cycle consists of three steps: (1)
denaturation, (2) annealing, and (3) extension. In the first denaturation step, the DNA
template is unwound to generate two ssDNA templates at ~95 oC. During the annealing
step, each primer is hybridized with the ssDNA templates through the double helix
formation in the specific sequences at 40-65 oC. In the extension step, the polymerase
copies complementary sequences from the ssDNA templates, usually accomplished at 72
oC. During this step, the polymerase catalyzes the primers’ 3’-OH attack on -phosphate
of dNTP via two-metal ion mechanism, leading to 5’ to 3’ direction of DNA synthesis
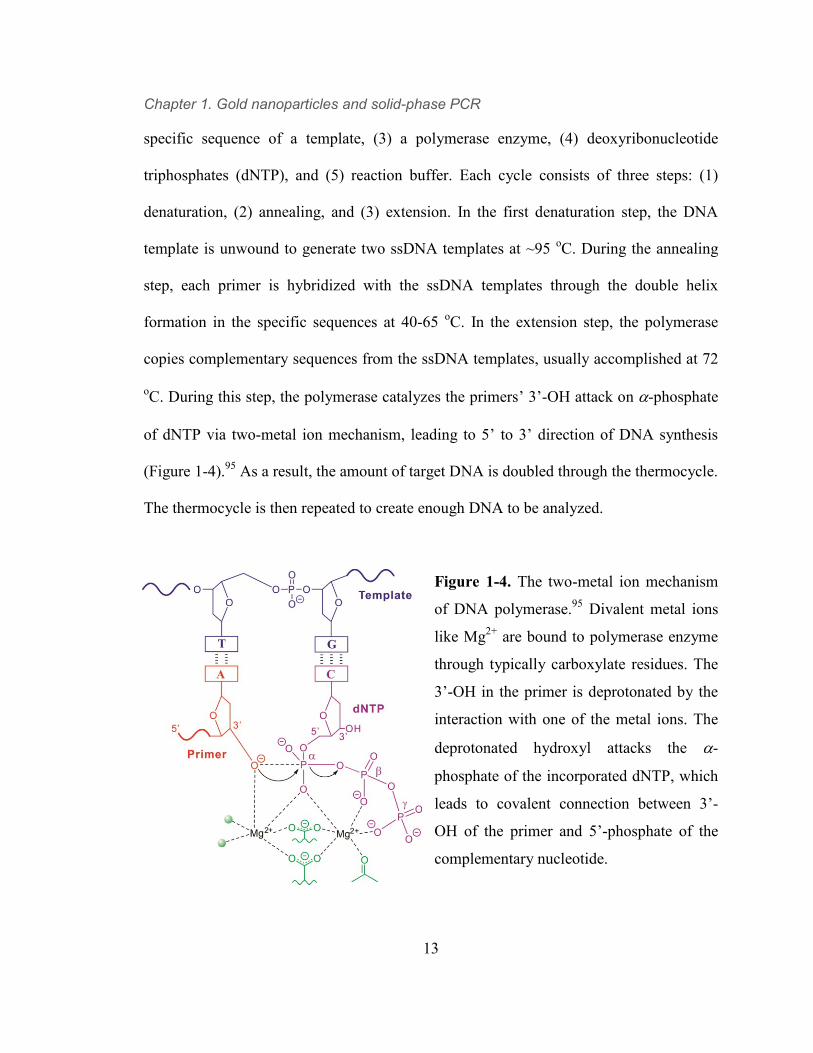
(Figure 1-4).95
As a result, the amount of target DNA is doubled through the thermocycle.
The thermocycle is then repeated to create enough DNA to be analyzed.
Figure 1-4. The two-metal ion mechanism
of DNA polymerase.95
Divalent metal ions
like Mg2+
are bound to polymerase enzyme
through typically carboxylate residues. The
3’-OH in the primer is deprotonated by the
interaction with one of the metal ions. The
deprotonated hydroxyl attacks the -
phosphate of the incorporated dNTP, which
leads to covalent connection between 3’-
OH of the primer and 5’-phosphate of the
complementary nucleotide.
Chapter 1. Gold nanoparticles and solid-phase PCR
14
Historically, the basic concept of DNA amplification was already described prior
to the development of thermocycling PCR. The Klenow fragment of E. coli DNA
polymerase I was employed to amplify DNA; however, it needs to add fresh enzyme after
each cycle because the Klenow fragment is not stable at the high temperature required for
the denaturation step.94
Moreover, the optimal temperature for the enzymatic reaction is
30 oC, which results in a broad range of DNA sizes due to non-specific interaction
between primers and a template. Later, a thermostable DNA polymerase derived from
Thermus aquaticus (Taq polymerase) was introduced into PCR protocols in the late
1980s93,96
even if Taq polymerase was previously discovered in 1976.97
Thus, it is not
necessary to add fresh enzyme after each cycle avoiding a time-consuming and tedious
task. Furthermore, the enzymatic reaction is performed at ~70 oC, which leads to
elimination of the non-specific interaction and improves sensitivity and specificity. It has
become integrated into an automated system using a machine called PCR thermocycler,
which contributed to a ubiquitous, versatile, and invaluable biological technique.
The standard methodology of PCR thermocycling was then followed by the
development of PCR techniques: adding multiple pairs of primers for simultaneous
amplification of multiple target DNA (multiplex PCR),98
modifying the concentration of
either forward or reverse primer (asymmetric PCR),99
incorporating probes in PCR
mixture which generate signal based on the amounts of amplified DNA (real-time
PCR),100
shifting to a heterogeneous reaction system called solid-phase PCR (SP-PCR),
and so on. Among them, SP-PCR will be briefly overviewed because this thesis will deal
with PCR on AuNPs.

Chapter 1. Gold nanoparticles and solid-phase PCR
15
1.2.2 Solid phase PCR (SP-PCR)
Solid phase PCR (SP-PCR) involves immobilized forward and/or reverse primers
on a solid support. The primers are extended to have target DNA sequence through PCR
cycles. The solid support includes a planar surface, such as, glass101-103
and polymer,104-
108 and a curved surface in micro/nano-particles of sepharose,
109 polyacrylamide,
110
magnetic polystyrene beads (i.e. Dynabead),111
magnetic particles,112
silica particles,113
and gold nanoparticles.74,114-115
The SP-PCR generates immobilized target DNA resulting
in facile purification and separation, simple detection protocol, further manipulation, and
promise for an automated system. As a consequence, SP-PCR has been used in many
applications, including specific DNA detection116
and SNP detection,110
solid phase DNA
colony construction followed by gene sequencing,109,117
and mRNA profiling.118
For
example, a commercially available Nucleolink coated tube, which is composed of a
thermostable polymer and can be used for EDC-amine coupling reaction for an
immobilized primer, in microwells has been used for SP-PCR, followed by DNA
detection.116
Recently developed DNA sequencing technologies, called the next
generation sequencing, have utilized SP-PCR through which DNA colonies are
constructed on microparticles109,111
or local flat surfaces103,107
and analyzed to elucidate
gene sequences.

Chapter 1. Gold nanoparticles and solid-phase PCR
16
Figure 1-5. Representative illustration of SP-PCR and DNA detection after SP-PCR.
Surface bound primers are amplified to have target dsDNA through SP-PCR. The dsDNA
is denaturated to form ssDNA in which fluorescent probes or ELISA probes are
hybridized. The presence of the target DNA is then analyzed using fluorescence or
colorimetric ELISA assay.
In spite of its potential, SP-PCR has limitations caused by its low yield and
efficiency113,119-120
and need of additional instrumentation121-122
or subsequent tasks104,116
even in target DNA detection, which is already achieved without any instrumentation
except eye examination (Figure 1-5). It has been suggested that molecular crowding on a
solid support could decrease the probability of duplication depending on the density of
the grafting chain.119
Moreover, steric hindrance between DNA polymerase and grafting

Chapter 1. Gold nanoparticles and solid-phase PCR
17
chains can lower the efficiency of SP-PCR.120
Currently developed DNA detection assay
using SP-PCR requires additional instrumentations to measure the fluorescence of
hybridized probes.122
It is possible to eliminate additional instrumentation if immobilized
target DNA is analyzed through color change using enzyme-linked immunosorbent assay
(ELISA).116
However, this method requires additional procedures for ELISA, including
denaturation of target DNA, hybridization of probes into target DNA, conjugation of
enzyme to the probes, and enzymatic reaction.
Chapter 3 of this thesis deals with a colorimetric DNA detection assay through
SP-PCR without any additional instrumentation or any secondary reactions except
magnetic attraction of positive target DNA within 5 min. It leads to facile and rapid
amplified DNA detection compared to currently developed DNA detection via SP-PCR.
To approach this goal, AuNPs are used because of their excellent optical properties
allowing eye examination even in low concentrations, such as 1 nM. However, in order to
incorporate AuNPs into SP-PCR, the thermal stability of the conjugate between the
immobilized primer and the AuNP surface should be satisfied. Otherwise, the
dissociation of primers from the solid supports may lead to low yield and non-
reproducible results.
The thermal stability of conjugation and entire entities has been issues for other
solid supports. Although thermally unstable conjugates or solid supports have been
applied to SP-PCR and showed positive results,105,112
improving the thermal stability has
been proven to increase SP-PCR yield as well as give reproducible results. Consequently,
there were attempts to improve thermal stability by modifying the chemistry. For

Chapter 1. Gold nanoparticles and solid-phase PCR
18
example, CovaLink is a chemically modified polystyrene surface for primer
immobilization in micro-tubes or wells through a carbodiimide coupling reaction between
5’-phosphorylated primers and covalently connected secondary amino groups to the
surface123
; however, its half-life is 30 m at 94 oC leading to low yield and requiring
careful handling in SP-PCR.105
Later, NucleoLink was invented to resolve the thermal
instability of CovaLink, which led to a better yield (~10 fold higher S/N ratio) and
handling, compared to CovaLink.106
The modification of the primer can improve the
thermal stability as well. The interaction of the mono-biotin/streptavidin conjugate in
biological applications has been used to connect streptavidin-coated particles and DNA.
However, Dressman et al. reported the dissociation of mono-biotin tagged primers from
the streptavidin-coated beads during thermal cycling although mono-biotin/streptavidin is
a strong conjugate at room temperature.124
The chemical modification from mono-biotin
to dual-biotin was performed to increase the thermal stability, which has been adapted in
one of the next generation sequencing technologies in the market.111,124
Au surface has usually been conjugated to DNA through Au-S chemistry.
However, it is well-known that the Au-S bond is not stable at high temperatures.72
It is
easily expected that if mono-thiol conjugated AuNPs are incorporated in PCR, thermal
instability of Au-S bond may reduce the yield and give non-reproducible results. Thus,
there are a few reports in which mono-thiolated AuNPs are used in SP-PCR for 3D nano-
architecture114
and real-time monitoring of SP-PCR using surface plasmon resonance
shift,115
whereas it is also reported that mono-thiolated AuNPs inhibit the SP-PCR

Chapter 1. Gold nanoparticles and solid-phase PCR
19
reaction.74
As a result, thermally stable conjugates are required to apply AuNPs in SP-
PCR for reproducible colorimetric DNA detection assay.
The thermally stable conjugates between AuNP and primers can be accomplished
using multi-thiolated graft copolymer as mentioned above. In chapter 3, it is described
how a graft copolymer is used to conjugate AuNP and primer, followed by its application
towards the colorimetric DNA detection through SP-PCR.
Figure 1-6. Schematic illustration of SP-PCR using oligothiol graft copolymer stabilized
AuNPs as solid supports. Primers (red) are extended to have target DNA through SP-PCR.
1.3 Overview
The next two chapters, 2 and 3, of this thesis deals with graft copolymer stabilized
AuNP and its biological application in SP-PCR (Figure 1-6).
Chapter 2 outlines the strategy of multi-thiolated graft copolymer stabilized
AuNPs and describes our fundamental study about stability of the AuNPs against
experimental harsh conditions, such as, high temperature, competing thiols, and chemical

Chapter 1. Gold nanoparticles and solid-phase PCR
20
etchants. It also explores relationship between the stability and the ratios of thiol and
hydrophilic graft chains like poly(ethylene glycol) (PEG) in a graft copolymer.
Chapter 3 investigates a practical example of the multi-thiolated graft copolymer
stabilized AuNPs as a solid support in one of the most versatile biological technologies,
PCR. It describes how primers are conjugated and extended through SP-PCR as well as
our novel strategy for rapid post-PCR colorimetric DNA detection without any
instrumentation.

Chapter 2. Oligothiolated graft copolymer stabilized AuNPs
21
Chapter 2. Oligothiol Graft-Copolymer
Coatings Stabilize Gold Nanoparticles
Against Harsh Experimental Conditions1*
2.1 Introduction
The stability of a nanoparticle suspension is often critically dependent on the
structure of ligands that are bound to the nanoparticle surface.2-3
Surface ligands stabilize
nanoparticle suspensions in a variety of ways—they block physical and chemical access
to the nanoparticle surface, compatibilize the nanoparticle with solvent, sterically and/or
electrostatically inhibit particle-particle interactions, slow the loss of surface atoms to
solution or other particles (via Ostwald ripening), and provide functional groups for
conjugating biological or other molecules to the particle without interfering with the
particle surface. Because of the many roles that surface ligands play, and the different
types of materials they are bound to, there is no single ligand structure that stabilizes all
nanoparticles in every application. However, the most successful nanoparticle ligands do
have some structural features in common. Good surface ligands typically have functional
groups that bind the nanoparticle surface strongly, self-interacting (often solvophobic)
* Reproduced with permission from Jun Sung Kang and T. Andrew Taton, Langmuir
2012, 28, 16751. Copyright 2012 American Chemical Society.1

Chapter 2. Oligothiolated graft copolymer stabilized AuNPs
22
segments that discourage ligand dissociation, and charged and/or polymer segments that
provide electrostatic and steric stabilization.
Designing surface ligands for Au nanoparticles (AuNPs) is easier than for other
nanoparticles because of the strong interaction between the Au surface and thiol
functional groups.4 As a result, many thiol-functionalized macromolecules have been
used to stabilize Au nanoparticle suspensions,5 including DNA
6-7 and RNA,
8 peptides
9
and proteins,10
oligo-saccharides,11
and synthetic homopolymers (connected to Au via
either terminal12-13
or repeat-unit14-16
thiols) and copolymers, including random,17
alternating,18
graft,19
and block20-21
copolymers. Among the polymers, poly(ethylene
glycol) (PEG) chains and segments have been used extensively in biotechnological and
biomedical applications involving AuNPs22-23
because of PEG’s biocompatibility, its
solubility in a broad range of solvent conditions, and the degree of steric stabilization it
confers to bound particles. As a result, AuNPs used in room-temperature aqueous buffers
are very commonly passivated with thiolated PEG ligands.
However, we and others have found that monothiol ligands, including
monothiolated PEGs, are not always stably bound to AuNP surfaces at high
temperatures,24-26
in the presence of competing thiols27-30
or oxidizing agents,24,31
and in
solvents where the ligand is extremely well solvated—conditions that are often
encountered in biotechnological protocols. Nuzzo et al. measured the enthalpy of
desorption of thiolates (as disulfides) from Au surfaces into the gas phase to be only
Hdes = -28 kcal/mol,32
and others have measured even smaller Hdes (or related Tdes)
values for solvophilic thiols desorbing into solution.33-34
The desorption of hydrophilic

Chapter 2. Oligothiolated graft copolymer stabilized AuNPs
23
polymer or biomolecular thiols into water or aqueous buffer from nanoparticle surfaces
have small enough Hdes values that, even though stable Au-S bonds are formed at room
temperature, the ligand-surface bonds are thermodynamically disfavored at higher
temperature. In biological or biotechnological environments, ligands are also readily
displaced from Au surfaces by competing thiols35-36
such as glutathione, mercaptoethanol
and dithiothreitol, or by oxidation,37-38
and this exchange is accelerated at high
temperatures.
One way to enhance the stability of solvophilic, thiol-functionalized ligands on
Au surfaces39
and nanoparticles40-43
has been to increase the number of thiols per ligand.
Researchers have investigated the relative stability of AuNPs passivated with ligands
bearing two to four thiols per ligand, and have found that they are generally more stable
to harsh experimental conditions than AuNPs protected with monothiol ligands.41,44
However, to our knowledge there has been no systematic demonstration of the
relationship between the stability of an AuNP in aqueous suspension against heat,
corrosion and competing ligands, and the number of thiols in a hydrophilic ligand greater
than four.

Chapter 2. Oligothiolated graft copolymer stabilized AuNPs
24
Figure 2-1. Schematic representation of the stabilization of AuNPs by oligothiolated
graft copolymers.
Herein, we describe the synthesis of different thiolated poly(L-lysine)-graft-
poly(ethylene glycol) (PLL-g-PEG) copolymers and the use of these graft copolymers to
passivate the surfaces of AuNPs (Figure 2-1). We also describe how different numbers of
thiols in a ligand affect the thermal stability of AuNPs under harsh conditions—including
high temperatures, competing thiols, and chemical etchants. Dynamic light scattering
(DLS) analysis and visible absorption spectroscopy were used to monitor the kinetic
stability of AuNP suspensions under these conditions. In addition, fluorescence
spectrophotometry was used to characterize the desorption of the different graft
copolymer ligands at the molecular level. KCN etching experiments were performed to
investigate how surface coverage by graft copolymers was related to the resistance of the
AuNP surface against chemical attack. Our results provide important guidelines for the
design of thiolated ligands for AuNPs, and especially for those used in biotechnological
applications,5 such as thermocycled PCR, that require harsh experimental conditions.

Chapter 2. Oligothiolated graft copolymer stabilized AuNPs
25
2.2 Experimental Methods
2.2.1 General
Poly(L-lysine) trifluoroacetate (PLL11, Mn 2700, PDI 1.1; PLL34, Mn 8200, PDI
1.05; PLL50, Mn 12100, PDI 1.04) was purchased from Alamanda Polymers, Inc.
(Huntsville, AL). Methoxy-poly(ethylene glycol)-succinimidyl carboxymethyl (mPEG-
SCM, MW 2000), methoxy-poly(ethylene glycol)-thiol (mPEG-SH, MW 2000), and
fluorescein poly(ethylene glycol)-succinimidyl carboxymethyl (FAM-PEG-SCM, MW
3400) were purchased from Laysan Bio, Inc. (Arab, AL). N-succinimidyl 3-(2-
pyridyldithio)-propionate (SPDP) was purchased from ProteoChem, Inc. (Denver, CO).
All other reagents were purchased from Aldrich (St. Louis, MO) unless otherwise noted.
Ultrapure water was generated from a Milli-Q water purification system (Millipore Inc.;
Billerica, MA, R > 10 MΩ·cm). PD-10 desalting columns were purchased from GE
Healthcare (Pittsburgh, PA). 1H NMR spectra were recorded on a Varian Unity (500
MHz) using solvent peaks as internal standards. Visible absorption spectra were obtained
on a Hewlett-Packard 8453 UV-Vis spectrophotometer. Gel permeation chromatography
(GPC) was conducted on an Agilent 1100 HPLC system (Santa Clara, CA) equipped with
two Waters HT4 Styragel columns (7.8 × 300 mm, 10 µm bead size, Milford, MA) in
series, and a refractive index detector (G1362A, Santa Clara, CA). GPC experiments
were performed using DMF (0.1 M LiBr) as the eluent with a flow rate of 0.4 mL/min at
50 °C. GPC data was calibrated using linear PEG standards (Agilent Tech., Santa Clara,
CA). When GPC traces showed multiple peaks, the traces were deconvoluted by

Chapter 2. Oligothiolated graft copolymer stabilized AuNPs
26
assuming multiple polymer populations, and each peak was separately analyzed by fitting
to an independent Gaussian lineshape.45
Transmission electron microscopy (TEM)
images were obtained on a JEOL 1210 electron microscope equipped with a Gatan video
camera and a Gatan Multiscan CCD camera (1024×1024 pixels). One drop of
nanoparticle solution was placed on copper grid (formvar/carbon, 300 mesh, Electron
Microscopy Science) and air-dried. All images were obtained at an operating voltage of
120 kV.
2.2.2 Synthesis
Synthesis of PLL11-g-PEGx. PLL11 (100 mg) and N,N-diisopropylethylamine
(100 µL) were dissolved in DMSO (2.3 mL) in a 4 mL polypropylene (PP) vial, and the
solution was stirred until the polymer was completely dissolved. Aliquots of this solution
were transferred into separate 4 mL PP vials. With stirring, different concentrations of
mPEG-succinimidyl carboxymethyl (mPEG-SCM, MW 2000) in DMSO (150 µL) were
then added dropwise to each aliquot (Table 2-1). After reaction overnight, each solution
was dialyzed against water using a 2000 Da molecular weight cut-off (MWCO)
membrane for 1 d, and then lyophilized to obtain product as a white powder. The
resulting polymers were characterized by 1H NMR (D2O) and GPC. Both methods
indicated that the polymer product contained a small amount (< 10 wt%) of mPEG-
COOH, presumably due to hydrolysis of mPEG-SCM, that could not be removed by
purification; this impurity was retained in subsequent experimental steps. We refer to the

Chapter 2. Oligothiolated graft copolymer stabilized AuNPs
27
product graft copolymers as PLL11-g-PEGx, where x represents the fraction of PLL
lysines converted to PEG, as measured by NMR.
Table 2-1. Synthesis of PLL11-g-[PEGx:SHy].
PLL11-g-PEGx synthesis PLL11-g-[PEGx:PDP] synthesis
xa PLL11 mPEG-SCM xb
(NMR)
PLL11-g-PEGx SPDP
L mol mg mol mg mg mol
0.1 575 9.3 20.4 10.2 0.18 8.0 8.3 26.6
0.2 460 7.4 32.6 16.3 0.22 9.3 7.3 23.4
0.3 345 5.6 36.7 18.4 0.28 10.0 5.8 18.6
0.4 276 4.4 39.1 19.6 0.32 11.5 5.6 17.9
0.5 230 3.7 40.7 20.4 0.37 13.0 4.5 14.4
0.6 230 3.7 48.9 24.5 0.45 13.6 4.4 14.2
0.8 184 3.0 52.1 26.1 0.60 16.6 2.6 8.3
aExpected fraction of PLL lysines converted to PEG.
bMeasured fraction of PLL lysines
converted to PEG of PLL11-g-PEGx by NMR.
Synthesis of PLL11-g-[PEGx:PDP]. PLL11-g-PEGx was dissolved in 1X
phosphate-buffered saline (PBS, 60 µL) in a 1.5 mL Eppendorf tube. Excess SPDP (at
least 1.5 equiv) in DMSO (70 µL) was added into the solution (Table 2-1). For the
synthesis of higher graft ratios of pyridyldithiopropionate (PDP), an additional 100 µL of
DMSO was added to dissolve the SPDP. After 10 h, the reaction mixture was dialyzed
against water using a 2000 Da MWCO membrane for 1 d and then lyophilized. This
yielded polymer products as white powders. Incorporation of PDP groups was confirmed
by 1H NMR (D2O).
Synthesis of PLL11-g-[PEGx:SHy]. PLL11-g-[PEGx:PDP] (6.0 mg) was dissolved
in 1X PBS (900 µL) in an Eppendorf tube. Then, excess dithiothreitol (DTT; 0.389 M,
100 µL 1X PBS) was added to the solution. After 2 h, the resulting polymer was isolated

Chapter 2. Oligothiolated graft copolymer stabilized AuNPs
28
from small-molecule reactants with a PD-10 size exclusion column, using water as the
eluent, according to the manufacturer’s instructions. Water was removed by
lyophilization to yield product as a white powder, which was characterized by 1H NMR
(D2O). We refer to these polymers as PLL11-g-[PEGx:SHy], where x and y represent the
fractions of PLL lysines converted to PEG and thiol groups, respectively, as measured by
NMR.
Synthesis of PLL34-g-PEGx. PLL34-g-PEGx polymers with x < 0.6 were
synthesized as described above for PLL11-g-PEGx (Table 2-2), using PLL34 as the starting
material. For polymers with x > 0.6, pre-formed PLL34-g-PEGx with x < 0.6 was used as a
starting material in place of PLL34. To the solution of PLL34-g-PEGx in DMSO (150 μL)
was added DIPEA (0.8 μL) and mPEG-SCM in DMSO (200 μL). After reaction
overnight, the solution was dialyzed against water using a 3500 Da molecular weight cut-
off (MWCO) membrane for 1 d. Finally, the dialyzed solution was lyophilized to obtain
product as a white powder. The product PLL34-g-PEGx was characterized by 1H NMR
(D2O) and GPC.
Synthesis of PLL34-g-[PEGx:SHy]. PLL34-g-[PEGx:SHy] polymers were
synthesized as described above for PLL11-g-[PEGx:SHy] (Tables 2-2 and 2-3).

Chapter 2. Oligothiolated graft copolymer stabilized AuNPs
29
Table 2-2. Synthesis of PLL34-g-[PEGx:SHy], where x < 0.6.
PLL34-g-PEGx synthesis PLL34-g-[PEGx:PDP] synthesis
xa PLL34 mPEG-SCM xb
(NMR)
PLL34-g-PEGx SPDP
L mol mg mol mg mg mol
0.4 500 3.1 82.1 41.1 0.17 14.4 16.9 54.1
0.6 400 2.4 98.6 49.3 0.25 15.0 10.4 33.3
0.8 300 1.8 98.6 49.3 0.35 12.8 5.3 17.0
aExpected fraction of PLL lysines converted to PEG.
bMeasured fraction of PLL lysines
converted to PEG of PLL34-g-PEGx by NMR.
Table 2-3. Synthesis of PLL34-g-[PEGx:SHy], where x > 0.6.
PLL34-g-PEGx synthesis PLL34-g-[PEGx:PDP] synthesis
xa
PLL34-g-PEGx
mPEG-SCM xb (NMR)
PLL34-g-PEGx SPDP
x mg mg mol mg mg mol
0.6 0.25 37.1 38.6 19.3 0.63 21.7 3.7 12
0.8 0.35 25.5 19.6 9.8 0.77 24.1 2.1 6.9
aExpected fraction of PLL lysines converted to PEG.
bMeasured fraction of PLL lysines
converted to PEG of PLL34-g-PEGx by NMR. cMeasured fraction of PLL lysines
converted to PEG of PLL34-g-[PEGx:SHy] by NMR. dMeasured fraction of PLL lysines
converted to thiol groups of PLL34-g-[PEGx:SHy] by NMR.
Synthesis of PLL50-g-[PEGx:SHy]. The graft copolymers were synthesized as
described above for PLL11-g-[PEGx:SHy], except that no attempt was made to isolate or
purify intermediate polymers PLL50-g-PEGx or PLL50-g-[PEGx:PDP] (Table 2-4). PLL50
(30 mg) and N,N-diisopropylethylamine (30 µL) were dissolved in DMSO (0.6 mL) in a
vial, and the solution was stirred until the polymer was completely dissolved. Aliquots of
this solution were transferred into separate vials. While stirring, mPEG-succinimidyl
carboxymethyl (mPEG-SCM, MW 2000) in DMSO (150 µL) was then added dropwise to
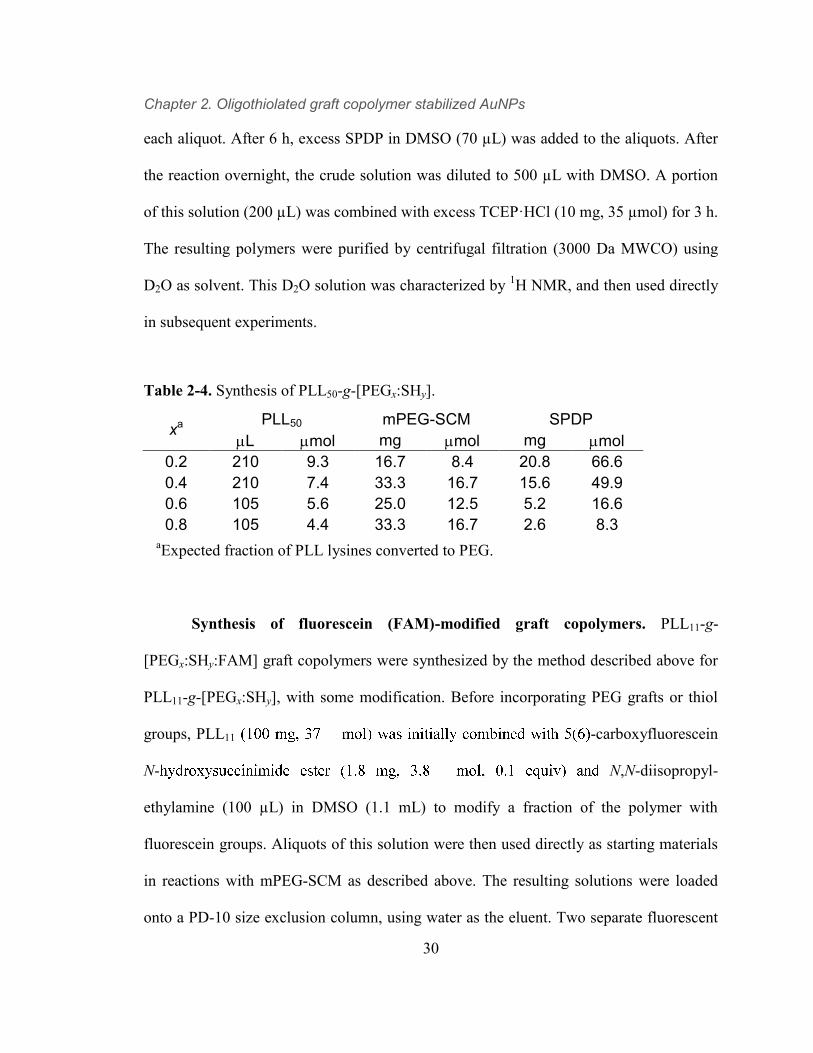
Chapter 2. Oligothiolated graft copolymer stabilized AuNPs
30
each aliquot. After 6 h, excess SPDP in DMSO (70 µL) was added to the aliquots. After
the reaction overnight, the crude solution was diluted to 500 µL with DMSO. A portion
of this solution (200 µL) was combined with excess TCEP·HCl (10 mg, 35 µmol) for 3 h.
The resulting polymers were purified by centrifugal filtration (3000 Da MWCO) using
D2O as solvent. This D2O solution was characterized by 1H NMR, and then used directly
in subsequent experiments.
Table 2-4. Synthesis of PLL50-g-[PEGx:SHy].
xa PLL50 mPEG-SCM SPDP
L mol mg mol mg mol
0.2 210 9.3 16.7 8.4 20.8 66.6
0.4 210 7.4 33.3 16.7 15.6 49.9
0.6 105 5.6 25.0 12.5 5.2 16.6
0.8 105 4.4 33.3 16.7 2.6 8.3
aExpected fraction of PLL lysines converted to PEG.
Synthesis of fluorescein (FAM)-modified graft copolymers. PLL11-g-
[PEGx:SHy:FAM] graft copolymers were synthesized by the method described above for
PLL11-g-[PEGx:SHy], with some modification. Before incorporating PEG grafts or thiol
groups, PLL11 -carboxyfluorescein
N- N,N-diisopropyl-
ethylamine (100 µL) in DMSO (1.1 mL) to modify a fraction of the polymer with
fluorescein groups. Aliquots of this solution were then used directly as starting materials
in reactions with mPEG-SCM as described above. The resulting solutions were loaded
onto a PD-10 size exclusion column, using water as the eluent. Two separate fluorescent
Chapter 2. Oligothiolated graft copolymer stabilized AuNPs
31
fractions were collected, corresponding to fluorescein-labeled PLL-g-PEG (eluting first)
and free fluorescein. The first fraction was combined with excess SPDP and reduced
using DTT as described above for PLL11-g-[PEGx:SHy] to yield samples of graft
copolymer containing a minority of fluorescein groups. Incorporation of fluorescein into
the polymer was confirmed by 1H NMR.
Synthesis of FAM-modified PEG-SH. FAM-PEG-SH was synthesized by the
reaction between cystamine and amine-reactive FAM-PEG-NHS. Cystamine
dihydrochloride (2.2 mg, 9.8 µmol) was dissolved in a mixture of 1-methyl-2-
pyrrolidinone (200 µL) and N,N-diisopropylethylamine (20 µL). FAM-PEG-SCM (100
mg, 29.4 µmol) was added, and this mixture was allowed to react overnight. The solution
was loaded onto a PD-10 size exclusion column, using water as the eluent, and the initial
colored fraction (~7 mL) was collected. This fraction was extracted with dichloromethane
(3 × 20 mL). The organic extracts were combined, dried over anhydrous sodium sulfate,
and filtered, and solvent was removed in vacuo. The remaining solids were recrystallized
from cold ethanol. The recrystallized material was redissolved in 1X PBS (1 mL), and
combined with DTT (0.1 mmol) overnight to reduce disulfide bonds. The reaction
mixture was dialyzed against water using a 1000 Da MWCO membrane for 1 d and then
lyophilized. This yielded FAM-PEG-NHS as a yellow-orange powder (11.6 mg, 17 %).
Successful incorporation of the thiol group was confirmed by 1H NMR (D2O).
Grafting ratio determination by 1H NMR. The PEG grafting ratio, x—defined
as the fraction of PLL sidechains that bear a PEG group—and the thiol grafting ratio, y—

Chapter 2. Oligothiolated graft copolymer stabilized AuNPs
32
the fraction of PLL sidechains that are thiol-modified—were calculated from peak
integrals (I) in the NMR spectrum, according to the equations below:
Preparation of citrate-capped AuNPs. AuNPs were prepared by sodium citrate
reduction of HAuCl4.46
All glassware was cleaned with aqua regia and all H2O used was
ultrapure and filtered through a 0.02-μm pore nylon membrane. A roundbottom flask was
charged with 470 mL H2O and 10 mL of 11.9 mM HAuCl4. This solution was stirred
vigorously and refluxed. After 30 min, 20 mL of 40 mM sodium citrate was quickly
added. As the solution was refluxing, the color of the solution changed from colorless to
deep red within 10 min. After refluxing for 1 h, the solution was allowed to cool, and the
AuNPs were analyzed by absorption spectroscopy, TEM and DLS; λmax = 519 nm,
d(TEM) = 17.0 ± 1.1 nm, and dz(DLS) = 20.3 ± 0.5 nm. The amount of Au used in the
synthesis and d(TEM) were used to calculate the particle concentration of AuNPs.47
Surface modification of AuNPs with PLL-g-[PEG:SH]. The solution of AuNPs
was reacted with graft copolymers to modify the surface. To 20 mL of AuNP solution (1
nM) was added excess graft copolymer (at least 1000 polymer molecules/particle) in a 20
mL vial. After vigorous mixing at room temperature, 10 mL of the solution was
transferred to a 15 mL screw-top vial, and the vial was heated to 90 °C in a sand bath.
Both the room-temperature and 90 °C solutions were incubated for three days. Solutions
were then cooled, transferred to a 15 mL centrifuge tube, and centrifuged at 8000 × g for

Chapter 2. Oligothiolated graft copolymer stabilized AuNPs
33
30 min. The supernatant was discarded to remove unreacted polymer, and the AuNP
centrifugate was re-dispersed in 15 mL H2O. Centrifugation, supernatant removal, and re-
dispersion were repeated 3 times.
2.2.3 Dynamic light scattering (DLS) analysis
The intensity (z)-averaged hydrodynamic diameter (dz) of AuNPs in solution was
measured with a Nano ZS instrument (Malvern, Worcestershire, England). All AuNP
samples were centrifuged briefly (3000 × g, 60 s) to remove dust. The concentration of
PBS (1X, 10 mM) and DTT (10 mM) were adjusted by addition of 10X PBS and 100
mM DTT solution, respectively. The diameter dz was obtained by cumulant fitting, using
an initial decay time of up to 100 µs to obtain the best fit.
2.2.4 Fluorescence experiments
For fluorescence experiments on polymers bound to AuNPs, the absorbance of the
solution was adjusted to 0.1 to minimize inner-filter effects. All samples contained 1X
PBS (pH 7.3). The temperature of each capped fluorescence cuvette was controlled in an
oil bath. Fluorescence data were collected by a Quantamaster fluorimeter (PTI, London,
Ontario; λex = 470 nm) using optical filters (FF01-492/SP-25 and BLP01-488R-25,
Semrock) to eliminate scattered light. Before and after each measurement, the cuvette
was shaken and inverted to homogenize the solution. After 6 h of measurements, AuNPs
were etched by adding 50 µL of 10 M KCN to each sample, incubating at 90 °C for 1 h,

Chapter 2. Oligothiolated graft copolymer stabilized AuNPs
34
and then at room temperature overnight, in order to release all fluorophore still bound to
the particles. The fraction of polymer dissociated from the particles over time was
calculated by dividing fluorescence intensity at 523 nm by the final fluorescence intensity
at 523 nm after KCN etching.
2.3 Results and Discussion
The primary goal of this research was to evaluate thiolated PLL-PEG graft
copolymers as stabilizing ligands for Au nanoparticles, and to determine the contributions
of different copolymer characteristics—backbone lengths, PEG grafting densities, and
number of thiol groups per polymer chain—on the effectiveness of the copolymer
ligands. Non-thiolated PLL-PEG graft copolymers have been previously shown to
passivate both monolithic48-49
and colloidal50-51
surfaces against adhesion of proteins and
cells; a goal of this work was to translate the advantages of PLL-g-PEG copolymers to
the passivation of AuNPs. Detailed experimental48
and theoretical52-53
studies on PLL-g-
PEG-coated surfaces are consistent with past work on the general biocompatibility of
PEG coatings, which resist nonspecific adsorption via steric and excluded-volume
effects.54-55
PLL-g-PEG has also been used to stabilize suspensions of inorganic
nanoparticles,56
where the same steric and entropic effects are responsible.2 In all of these
studies, PLL-g-PEG was anchored by electrostatic or covalent interactions between
lysine side-chains on the polymer and the material surface. We found that combining
citrate-capped Au nanoparticles with unmodified PLL-g-PEG yielded colloid that was

Chapter 2. Oligothiolated graft copolymer stabilized AuNPs
35
stable at room temperature, similar to previous studies performed with other PEGylated
polyamines.57
But we found that the PLL-g-PEG did not significantly improve the
nanoparticles’ stability against high temperatures or etchants, presumably because the
interaction between the polymer lysine groups and the Au surface was not strong enough
to ensure a dense layer under these conditions.
2.3.1 Synthesis of oligothiolated graft copolymers
In order to strengthen the interaction between PLL-g-PEG and Au colloid
surfaces, we incorporated thiol groups onto the PLL backbone to convert the polymer
into a multidentate ligand for Au. This was accomplished by sequential addition of NHS-
ester-terminated PEG (mPEG-SCM) and NHS-ester-containing thiol linker (SPDP) to
monodisperse PLL backbone starting materials, similar to the method reported by
Kataoka and coworkers.58
The goal of the synthesis was to convert every lysine in the
original PLL to either a PEG or thiol group, but we anticipated that some lysine groups
would remain unconverted by this approach. As a result, we expected x + y ≤ 1 for
products PLLn-g-[PEGx:SHy], accounting for incomplete conversion of lysine groups in
the PLL starting material.
Prior to introducing thiol groups, intermediate PLL-g-PEGs were characterized by
NMR and GPC to verify the grafting ratio (x) of PEG (Figure 2-2 and Table 2-5). These
intermediate copolymers were then combined with excess SPDP to exhaustively convert
remaining lysine groups to pyridyldithiopropionate (PDP) groups. Although the
incorporation of PDP groups into PLL-g-[PEGx:PDP] could be verified by NMR, it was

Chapter 2. Oligothiolated graft copolymer stabilized AuNPs
36
impossible to calculate the degree of PDP incorporation because of band broadening in
the NMR spectra. However, once the PDP groups were reduced to reveal thiols, grafting
ratios in the resulting PLLn-g-[PEGx:SHy] copolymers were characterized by integration
of the sharp peaks in their NMR spectra (Figure 2-3 and table 2-6). These results showed
that we were only able to synthesize thiolated graft copolymers for 0.25 < x < 0.65. For x
< 0.25, no polymer was isolated from the synthesis, presumably because addition of PDP
groups made the polymer too hydrophobic or subject to oxidative (disulfide)
crosslinking; and for x > 0.65, the procedure returned PLL-g-PEGx intermediates with no
thiol groups attached, possibly due to steric crowding by the attached PEGs.59
Figure 2-2.
1H NMR spectra of (A) PLL11-g-PEGx and (B) PLL34-g-PEGx in D2O.

Chapter 2. Oligothiolated graft copolymer stabilized AuNPs
37
Table 2-5. Characteristics of PLLn-g-PEGx and PLLn-g-[PEGx:SHy]
PLLn PLLn-g-PEGx PLLn-g-[PEGx:SHy]
xNMR
Mn,NMR
(g/mol)
Mn,GPC
(g/mol) PDIGPC x y
PLL11
0.18 5200 4900 1.13 0.28 0.64
0.22 6100 6100 1.28 0.27 0.61
0.28 7300 6500 1.24 0.32 0.60
0.32 8100 7200 1.22 0.37 0.51
0.37 9200 8200 1.19 0.44 0.36
0.45 11000 8600 1.21 0.50 0.29
0.60 14000 10000 1.19 0.58 0.21
PLL34
0.17 15000 20000 1.13 0.29 0.61
0.25 20000 20000 1.11 0.31 0.67
0.35 27000 21000 1.09 0.41 0.58
0.63 45000 26000 1.12 0.56 0.28
0.77 54000 28000 1.10 0.63 0.20
PLL50
0.25 0.67
a 0.33 0.57
0.52 0.32
0.63 0.19
aSynthetic PLL-g-PEG intermediates were not isolated for PLL50-based copolymers.
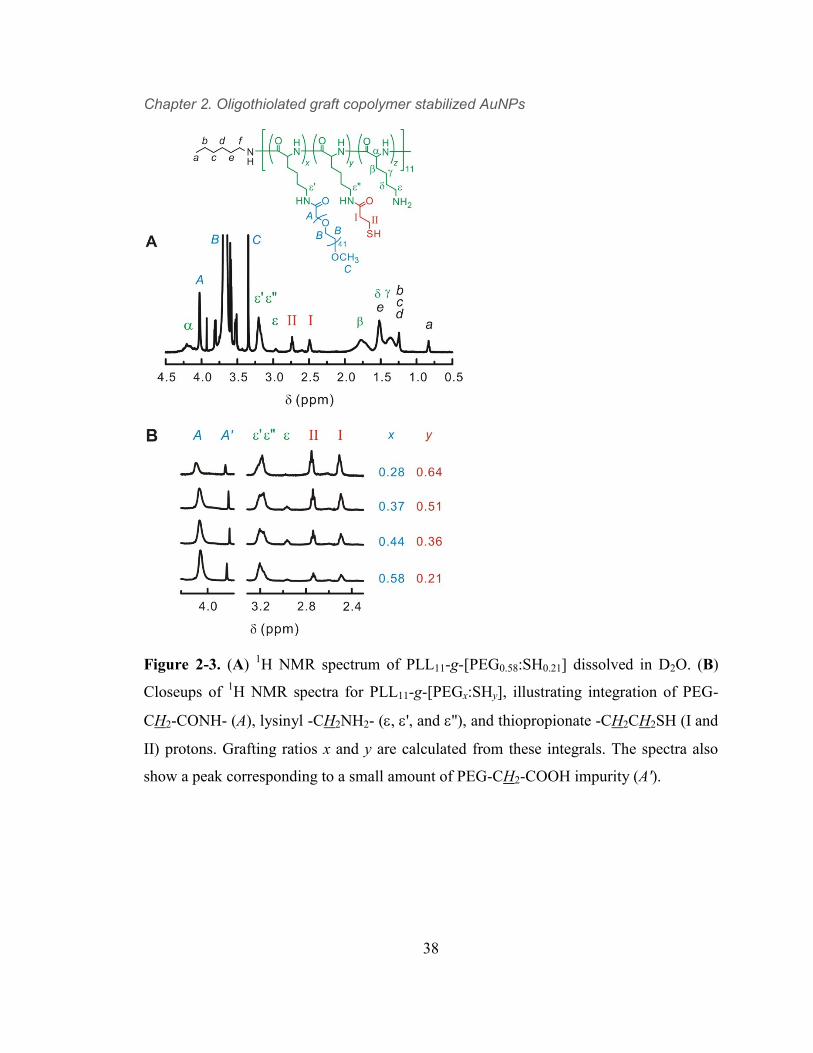
Chapter 2. Oligothiolated graft copolymer stabilized AuNPs
38
Figure 2-3. (A) 1H NMR spectrum of PLL11-g-[PEG0.58:SH0.21] dissolved in D2O. (B)
Closeups of 1H NMR spectra for PLL11-g-[PEGx:SHy], illustrating integration of PEG-
CH2-CONH- (A), lysinyl -CH2NH2- (, ', and ''), and thiopropionate -CH2CH2SH (I and
II) protons. Grafting ratios x and y are calculated from these integrals. The spectra also
show a peak corresponding to a small amount of PEG-CH2-COOH impurity (A').

Chapter 2. Oligothiolated graft copolymer stabilized AuNPs
39
Table 2-6. Characteristics of AuNP@PLLn-g-[PEGx:SHy].
prepared at RT prepared at 90 °C
PLLn x y thiols
per chain
Mn,NMR
(g/mol) dz (nm)
max
(nm) dz (nm)
max
(nm)
PLL11
0.28 0.64 7.04 7900 46.81 524 35.89 527
0.27 0.61 6.71 7700 32.96 524 33.00 526
0.32 0.60 6.60 8700 32.51 523 33.48 526
0.37 0.51 5.61 9700 34.28 524 35.19 524
0.44 0.36 3.96 11000 33.20 523 36.73 524
0.50 0.29 3.19 12000 33.10 524 36.66 524
0.58 0.21 2.31 14000 30.98 523 33.00 523
PLL34
0.29 0.61 20.77 25000 31.69 523 31.98 524
0.31 0.67 22.84 26000 31.63 522 32.71 523
0.41 0.58 19.88 33000 31.34 522 33.61 522
0.56 0.28 9.43 41000 31.29 521 33.48 522
0.63 0.20 6.96 45000 30.90 521 31.55 523
PLL50
0.25 0.67 33.50 33000 32.96 523 36.78 522
0.33 0.57 28.50 40000 32.47 522 36.53 523
0.52 0.32 16.00 57000 34.67 522 38.45 523
0.63 0.19 9.50 67000 34.26 522 36.85 522

Chapter 2. Oligothiolated graft copolymer stabilized AuNPs
40
2.3.2 Surface modification of AuNP with PLLn-g-[PEGx:SHy]
Citrate-capped Au nanoparticles were combined with PLLn-g-[PEGx:SHy]
polymers in H2O at room temperature for 3 d to yield polymer-capped AuNPs that
withstood cycles of centrifugal concentration and heating. No color change or
precipitation was observed during surface modification, indicating that the oligothiol
polymers did not aggregate the AuNPs by crosslinking. After excess copolymer was
removed by centrifugation and redispersion in aqueous solution, the polymer-stabilized
AuNPs were characterized by DLS analysis and visible absorption spectroscopy (Table
2-6). The absorption spectra of all polymer-stabilized AuNP suspensions were red-shifted
relative to that of the original, citrate-protected particles (max, AuNP-citrate = 519 nm; max
= +2-5 nm). This shift in the surface plasmon resonance absorption of the AuNPs is
consistent with a change in their surface dielectric, induced by surface
functionalization.60
DLS was used to measure the z-averaged hydrodynamic particle
diameter (dz) of the nanoparticles before and after polymer stabilization.61
In general,
polymer functionalization consistently increased dz of the AuNPs by 10-14 nm over the
diameter of the original particles. The grafted PEG chains on all of the PLL-PEG
copolymers used in this study had a starting degree of polymerization of 41, and
assuming the structural model in Figure 2-1, we estimate that these chains would extend
from the particle-bound PLL backbone into solution between 3 nm (random coil) and 14
nm (fully extended). The measured increases in dz are consistent with this model,62
though it is difficult to draw firm structural conclusions from hydrodynamic
measurements. Not all of the polymers tested were successful; one, PLL11-g-

Chapter 2. Oligothiolated graft copolymer stabilized AuNPs
41
[PEG0.28:SH0.64], generated AuNP suspensions with anomalously large dz and
polydispersity index (PDI) values. This polymer had the highest thiol functionalization
density in the PLL11 series, and the high dz value may be due to particle crosslinking by
multiple functional groups on the polymer. All of the other polymers tested generated
monodisperse particle dispersions (PDI < 0.10 for PLL11 and PLL34 graft copolymers and
0.25 for PLL50 graft copolymers). In addition, the graft copolymer stabilized AuNP
suspensions were stable in the high ionic strength solution (1 M MgCl2) over hours at
room temperature due to the presence of PEG layers, while citrate stabilized AuNP
suspension aggregated even in 2 mM MgCl2 solution (Figure 2-4).
Previous studies have shown that ligand passivation of AuNPs can sometimes be
improved by “annealing” the product particles at elevated temperatures.63-64
To test the
effect of temperature on the synthesis of PLL-PEG-protected AuNPs, we also combined
AuNPs and PLLn-g-[PEGx:SHy] copolymers at 90 °C for 3 d. After purification, the
annealed particles exhibited slightly larger dz and max values than those prepared at room
temperature, consistent with a denser degree of functionalization and a more extended
corona of graft copolymer on the particle surface. One hypothesis of this study was that
these characteristics would confer higher stability to the annealed, PLL-PEG-protected
AuNPs.

Chapter 2. Oligothiolated graft copolymer stabilized AuNPs
42
Figure 2-4. Intensity-averaged hydrodynamic diameter (dz) of aqueous AuNP@PLL11-g-
[PEGx:SHy] and AuNP@PEG-SH particle suspensions containing 1 M MgCl2 solution
and AuNP@citrate particle suspensions containing 2 mM MgCl2 solution, as a function
of time, measured by DLS.
2.3.3 Comparative stability of AuNP@PLL-g-[PEG:SH]
suspensions
A central goal of this work was to develop AuNPs that are stable to the presence
of the free thiols and dithiols used in biotechnology, like DTT, which typically displace
surface ligands from the AuNP surface and cause irreversible particle aggregation.44
To
test their stability, we gradually heated AuNP@PLL-g-[PEG:SH] suspensions in aqueous
buffer to 90 °C in the presence of 10 mM DTT, and monitored the particles by DLS and
visible absorption spectroscopy. In general, time-resolved DLS experiments (Figure 2-5)
showed that most of the particle suspensions were stable (did not experience an increase
in dz corresponding to aggregation) over hours. An increase in dz was observed for
AuNPs modified with polymers containing either low or high ratios of PEG grafts to thiol

Chapter 2. Oligothiolated graft copolymer stabilized AuNPs
43
groups, and annealed particles were more stable than those prepared at room temperature.
In addition, graft copolymers with shorter PLL backbones appeared to be marginally
better at stabilizing AuNPs than longer ones. Importantly, all of the AuNP@PLL-g-
[PEG:SH] particle suspensions were far more stable to heat and DTT than AuNPs
functionalized with monothiolated mPEG-SH molecules, which were observed to
aggregate even before the solution reached high temperature.
These DLS studies were supported by visible absorbance spectroscopy
experiments using the same solution conditions and temperature ramp to 90 °C (Figure 2-
6). Using a standard 1-cm cuvette, we observed that all of the particle suspensions
exhibited a slow decrease in optical absorbance (~30% over 90 min) as particles adhered
to the cuvette walls (and out of the optical path of the instrument); this is frequently
observed for polymer- and biomolecule-stabilized AuNPs.65
But the max of most of these
particle samples was not changed by heating in the presence of DTT. We did observe
large increases in max for AuNPs modified with PLLn-g-[PEGx:SHy] copolymers with the
lowest thiol-to-PEG ratios. These large increases in max are characteristic of aggregating
AuNPs.66
From this data, we argue that PLL-g-[PEG:SH] graft copolymers successfully
stabilize AuNP suspensions by a balance of steric stabilization by PEG chains and
thermodynamic stabilization by the oligothiol polymer ligands. In principle, polymers
with too many thiol groups might crosslink the target AuNPs, and offer insufficient steric
shielding by PEG against agglomeration; polymers with too few thiols might not bond
strongly enough to the particle surfaces, or even at all, if the thiolated PLL backbone

Chapter 2. Oligothiolated graft copolymer stabilized AuNPs
44
were occluded by too many grafted PEG chains. Our DLS and absorption spectroscopy
experiments do not provide information on the molecular details of the polymer-particle
interaction, but they are consistent with this hypothesis of a balance between steric and
thermodynamic stabilization.
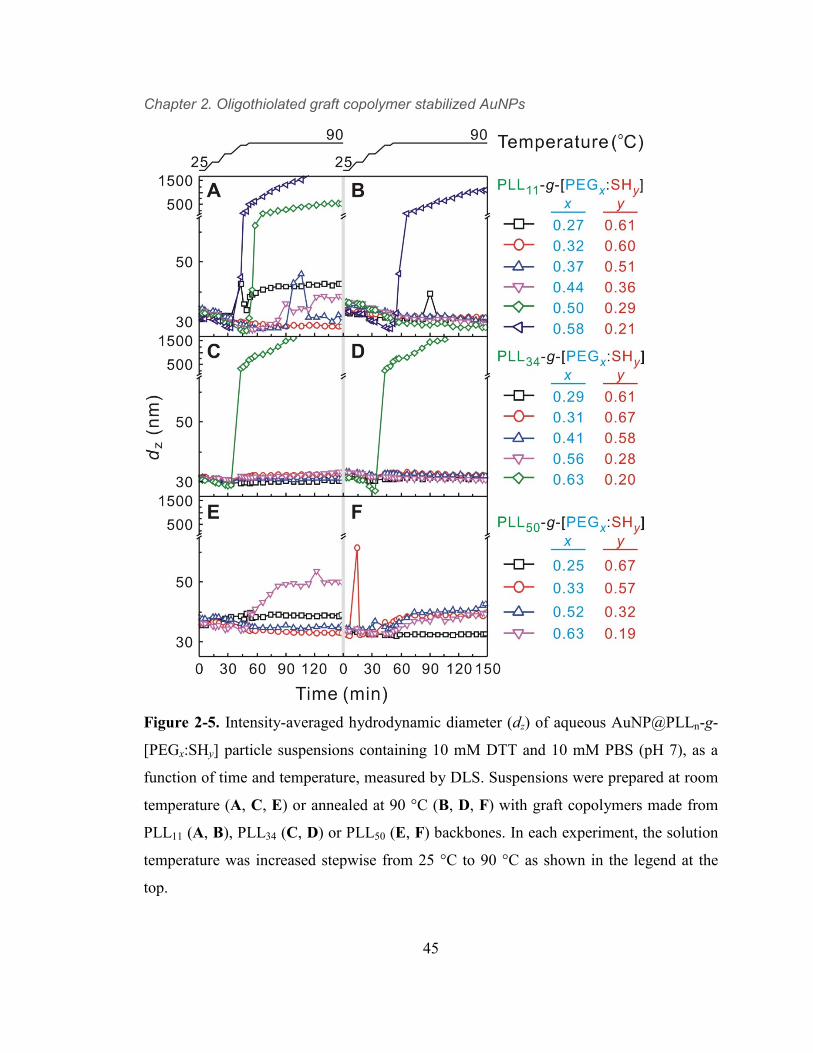
Chapter 2. Oligothiolated graft copolymer stabilized AuNPs
45
Figure 2-5. Intensity-averaged hydrodynamic diameter (dz) of aqueous AuNP@PLLn-g-
[PEGx:SHy] particle suspensions containing 10 mM DTT and 10 mM PBS (pH 7), as a
function of time and temperature, measured by DLS. Suspensions were prepared at room
temperature (A, C, E) or annealed at 90 °C (B, D, F) with graft copolymers made from
PLL11 (A, B), PLL34 (C, D) or PLL50 (E, F) backbones. In each experiment, the solution
temperature was increased stepwise from 25 °C to 90 °C as shown in the legend at the
top.

Chapter 2. Oligothiolated graft copolymer stabilized AuNPs
46
Figure 2-6. (A) Absorbance at 524 nm of aqueous AuNP@PLL11-g-[PEGx:SHy] particle
suspensions containing 10 mM DTT and 10 mM PBS (pH 7), as a function of time and
temperature. In each experiment, the solution temperature was increased stepwise from
25 °C to 90 °C as shown in the legend at the top. (B-D) Full absorption spectra of
AuNP@PLL11-g-[PEGx:SHy] suspensions from (A).

Chapter 2. Oligothiolated graft copolymer stabilized AuNPs
47
2.3.4 Stability of AuNP-copolymer interactions
In order to more specifically characterize the interaction between graft
copolymers and AuNP surfaces at the molecular level, we performed time-resolved
fluorescence experiments on the dissociation of fluorescein-labeled PLL-g-[PEG:SH]
from AuNPs. AuNPs are outstanding fluorescence quenchers,67
and so fluorescent graft
copolymer molecules bound closely to AuNP surfaces show no observable fluorescence
intensity.24
However, as the polymers desorb from the surface of the AuNPs into solution,
their fluorescence is recovered. Thus, monitoring fluorescence intensity provides a
proportional measure of the amount of polymer bound to and released from the AuNP
surface.30
In these experiments, AuNP@PLL-g-[PEG:SH] suspensions were heated to 90
°C, either in the presence or absence of DTT, and the fluorescence intensity of the
suspension was monitored over time (Figure 2-7). We also performed the same
experiments on AuNPs modified with monothiolated FAM-PEG-SH for comparison.
Then, at the end of the experiment, the total amount of fluorophore present in each
sample was determined by etching away the supporting AuNPs with KCN, and
measuring the final fluorescence. In this way, the fractional fluorescence intensities
shown in Figure 2-7 should represent the fraction of polymer dissociated from the
particle surface over time.
Even in the absence of competing DTT, a substantial fraction (30%) of bound,
monothiol FAM-PEG-SH was released from AuNPs at 90 °C within 30 min, and 100%
of the monothiol dissociated in the presence of 1 mM DTT over the same period. By
contrast, oligothiolated PLL-g-PEG graft copolymers showed dramatically less

Chapter 2. Oligothiolated graft copolymer stabilized AuNPs
48
desorption under all conditions, demonstrating stronger binding than PEG-SH. Among
the different PLL11-g-[PEGx:SHy] polymers studied, ligand desorption was inversely
related to the number of thiols per polymer. For example, only 20% of polymers with an
average of 6 thiols per PLL chain (y = 0.55) dissociated from the AuNP surface at 90 °C
over 6 h, while 60% of those with an average of 4 thiols per chain (y = 0.35) dissociated
over the same time (Figure 2-7B). Increasing the concentration of DTT led to more rapid
ligand dissociation, but even at high temperature and DTT concentrations, some
oligothiolated PLL-g-PEG remained on the AuNP surface (Figure 2-7C). These results
are consistent with a model for ligand binding in which multivalency leads to stronger
surface interactions and resistance against ligand loss.15,68
Figure 2-7. Relative fluorescence intensity of AuNP@PLL11-g-[PEGx:SHy:FAM]
particle suspensions, incubated at 90 °C, as a function of time. Solutions contained (A) no
DTT, (B) 1 mM DTT, and (C) 10 mM DTT.

Chapter 2. Oligothiolated graft copolymer stabilized AuNPs
49
2.3.5 Stability of AuNP@PLL-g-[PEG:SH] against chemical
etching
The instability of ligand-protected AuNPs can often be traced to chemical
reactions at the nanoparticle surface. As a result, AuNP suspensions can be stabilized by
restricting physical access to nanoparticle surfaces. One general way to test this access to
chemical attack is to observe cyanide-induced Au etching in water.69
Even though
cyanide is not used in typical biotechnology protocols, it is a good proxy for other small
molecules that react with Au surfaces, and cyanide etching of AuNPs can be easily
monitored by absorption spectroscopy of the disappearing Au surface plasmon band.70
We found that the rate of cyanide etching of AuNP@PLLn-g-[PEGx:SHy] particles
depended upon the relative fraction of thiol groups in the copolymer (Figure 2-8). For
example, AuNP@PLL11-g-[PEGx:SHy] particle suspensions prepared at room
temperature lost 80% of their absorbance at max within 2 h for y < 0.5, but just 20% of
their absorbance for y > 0.6 (Figure 2-8A). Particles made with longer PLL backbones
were generally less stable to etching for similar grafting ratios (Figure 2-8B). All
AuNP@PLL-g-[PEG:SH] particles were made more resistant to KCN etching by first
annealing them at 90 °C (Figure 2-8C). All of these results point to a relationship
between the density of thiol functionalization of the AuNP surface—achieved either by
controlling the number of thiols per PLL-g-[PEG:SH] chain, or by thermodynamically
annealing the modified particles—and protection against chemical attack.

Chapter 2. Oligothiolated graft copolymer stabilized AuNPs
50
Figure 2-8. Absorbance at 520 nm of AuNP@PLL11-g-[PEGx:SHy] suspensions exposed
to 10 mM KCN, as a function of time. (A) AuNP@PLL11-g-[PEGx:SHy] prepared at room
temperature; (B) AuNP@PLL34-g-[PEGx:SHy] prepared at room temperature; and (C)
AuNP@PLL34-g-[PEGx:SHy] annealed at 90 °C.

Chapter 2. Oligothiolated graft copolymer stabilized AuNPs
51
2.3.6 Steric and thermodynamic stabilization in AuNP@PLL-
g-[PEG:SH] particles
We chose thiolated PLL-g-PEG graft copolymers as stabilizers for AuNPs
because of the potential for combining steric stabilization of the colloidal suspension by
PEG chains with strong ligand attachment by multiple thiol groups. This same
combination has previously been studied for PLL-g-PEG adsorption on flat surfaces.
Textor and co-workers have analyzed the effect of grafting ratios on PLL-g-PEGx
adsorption on oxide surfaces, and found that the density of the protective PEG layer and
resistance against non-specific protein adsorption was maximized at intermediate values
of x.48,52
In these authors’ analysis, this represented a balance between affinity of lysine
amines for the oxide surface on the one hand, and steric shielding by PEG on the other.
Although stabilization of AuNP suspensions by PLL-g-[PEG:SH] copolymers is different
from passivation of flat oxide surfaces, we argue that many of the same factors that make
PLL-g-PEG copolymers effective coatings for oxides also apply to the success of the
AuNP@PLL-g-[PEG:SH] materials reported here. Researchers have also shown that, if
the ends of the grafted PEG chains in PLL-g-PEG are appropriately functionalized, it is
possible to use PLL-g-(PEG-X) coatings as scaffolds for attaching other molecules—
including proteins and peptides, affinity tags, and small organic molecules —to inorganic
surfaces.71-72
Otherwise, the unconverted lysine groups in the PLL-g-[PEG:SH] could be
used to conjugate other molecules, even if PEG chains might shield the molecules.
Although we have not demonstrated this for AuNPs in this report, one could imagine
Chapter 2. Oligothiolated graft copolymer stabilized AuNPs
52
AuNP@PLL-g-[PEG-X:SH] as a vehicle for combining the recognition properties of
biomolecules and the unique physical properties of AuNPs into an extremely stable
nanobioconjugate.
2.4 Summary
We have demonstrated that thiolated PLL-g-PEG graft copolymers are exceptional
stabilizers for AuNPs, and have explored the relationship between graft copolymer
structure and colloidal stability. In general, this study illustrates a balance between
thermodynamic and steric factors in graft copolymer stabilization of AuNPs. On the one
hand, having multivalent interactions between multiple thiol groups on the graft
copolymer and the AuNP surface helps prevent ligand dissociation under extreme
conditions, and isolates the surface from chemical attack. On the other hand, grafted PEG
chains provide steric stabilization of the colloidal suspension, and keep AuNPs from
aggregating. As a result, we predict that future optimization of PLL-g-[PEGx:SHy] ligands
for biotechnological applications will involve balancing x and y. Moreover, we anticipate
that the PLL-g-[PEG:SH]-stabilized AuNPs could be useful as nanoparticle supports in
applications such as PCR, which require harsh experimental conditions including high
salt concentrations, elevated temperature, and thiols that typically compete for surface
ligands.

Chapter 3. Oligothiol graft copolymer stabilized AuNPs for SP-PCR
53
Chapter 3. Oligothiol Graft Copolymer
Stabilized Gold Nanoparticles as Solid
Supports in PCR
3.1 Introduction
The polymerase chain reaction (PCR) is an indispensable technology in modern
molecular biology and diagnostics, and has been applied to DNA cloning, genetic
engineering, DNA sequencing, and diagnostics of infectious and genetic disease. In PCR,
a DNA polymerase enzyme extends a short, primer oligonucleotide to complement a full-
length DNA template, and amplifies the target DNA sequence exponentially via
temperature-controlled cycles from just a few copies of the template.1 The PCR
amplicons are then typically detected by additional instrumental analysis, including
fluorescence detection of fluorescent DNA intercalating dyes or fluorophore-labeled
DNA probes.2
Because PCR is instrument-intensive, it has been challenging to translate PCR to
low-cost, portable analysis of DNA sequence targets. One approach to reducing the
impact of instrumentation on PCR has been to replace fluorescence detection with visual
inspection methods. A variety of visible-contrast detection methods have been developed
for post-PCR analysis of DNA amplicons, including visualization of microbead
aggregation,3 colorimetric detection by association of conjugated polymers,
4 signal

Chapter 3. Oligothiol graft copolymer stabilized AuNPs for SP-PCR
54
amplification by polymer deposition on surfaces,5 and a variety of colorimetric and
reporter-deposition techniques based on metal nanoparticles. Gold nanoparticles
(AuNPs), in particular, are attractive as visible labels for DNA detection schemes because
of their unique physical and chemical properties. The large extinction coefficients of
AuNPs6 make it possible to visually determine concentrations of AuNP-tagged DNA
molecules in solution that are similar to those determined for fluorophore-labeled DNA
by benchtop fluorescence instruments.7 On solid substrates, AuNP-labeled DNA can be
observed directly at high surface concentrations, and autometallography at AuNP
surfaces translates low surface concentrations of AuNP-tagged DNA into clearly visible,
black spots.8 For all of these techniques, sequence-specific AuNP-DNA probes
(analogous to the fluorescent oligonucleotide probes used in fluorescence assays) are
relatively easy to construct from unmodified AuNPs and thiol-terminated
oligonucleotides.9-10
Taking advantage of these properties, researchers have developed post-PCR
colorimetric detection assays for specific DNA targets using AuNP-based sequence
probes.11-14
In most of these assays, the AuNP-DNA probes were not included in the PCR
step, and were only used after PCR amplicons were isolated from the PCR reaction.
There have been a few reports in which AuNPs modified with thiolated oligonucleotide
primers have been used in single-tube, solid-phase PCR.15-19
Other researchers,14,20
however, have reported that standard PCR reactions are poisoned by including AuNP-
DNA conjugates made from thiolated oligonucleotides. We have previously reported that
thiolated DNA does not stay bound to AuNP surfaces at the high temperatures21-23
or in

Chapter 3. Oligothiol graft copolymer stabilized AuNPs for SP-PCR
55
the presence of competing thiols24-28
that are common to PCR reactions, and this may be
one reason why PCR reactions commonly fail with AuNP-bound primers. Monothiolated
DNA is also known to degrade at high temperatures in the presence of AuNPs.23,29-30
DNA polymerases adsorb and denature on AuNP surfaces,31
and this causes PCR
enzymes to lose their activity when AuNPs are included in the PCR reaction. In principle,
these issues might be addressed by changing the chemistry that connects oligonucleotide
primers to the AuNP surface. Lee and coworkers have very recently reported that coating
AuNPs with a silica shell,32
and then connecting DNA primers to this shell, allows the
resulting ultra-stable AuNP-DNA conjugates to be used in single-tube colorimetric
analysis of PCR.14
It is not clear, however, how much of the attached or PCR-amplified
DNA survived this process, or how many bound primers participated in the PCR reaction.
We report that an alternative strategy for connecting DNA to AuNPs, using
multivalent, oligothiolated poly(L-lysine)-graft-poly(ethylene glycol) (PLL-g-PEG)
copolymers as extremely strong ligands for the AuNP surface, enables the resulting
AuNP-DNA conjugates to be used directly and stably as primers in PCR reactions. In
order to characterize the effect of AuNP surface chemistry on PCR priming, we have
systematically investigated the relationship between AuNP-DNA conjugate structure and
PCR conditions, and we have analyzed the AuNP-bound PCR products using gel
electrophoresis, dynamic light scattering, and fluorescent spectrophotometry. Finally, we
have developed a single-tube, magnetic-capture method that allows AuNP-DNA-primed
PCR reactions to be read by visual inspection within five minutes. We hope that our

Chapter 3. Oligothiol graft copolymer stabilized AuNPs for SP-PCR
56
results may be used to develop novel DNA diagnostic assays and solid-phase DNA
sequencing technologies using AuNPs as primer supports.
3.2 Experimental Methods
3.2.1 General
Poly(L-lysine) trifluoroacetate (PLL11, Mn 2700) was purchased from Alamanda
Polymers, Inc. (Huntsville, AL). Methoxy-poly(ethylene glycol)-succinimidyl
carboxymethyl (mPEG-SCM, MW 2000) was purchased from Laysan Bio, Inc. (Arab,
AL). N-succinimidyl 3-(2-pyridyldithio)-propionate (SPDP) was purchased from
ProteoChem, Inc. (Denver, CO). Triethylamine (Et3N) was distilled from calcium hydride
and methanesulfonyl chloride (MsCl) was distilled from P2O5. Oligonucleotides (ODN)
were synthesized on an Expedite Nucleic Acid Synthesizer, using reagents from Glen
Research (Sterling, VA). 5’-modified ODN with dibenzylcyclooctyne (DIBO) was
synthesized as previously described. 5’-modified ODN with thiols and fluorescein were
synthesized according to the manufacturer’s instruction (Glen Research, Sterling, VA).
PCR reactions were conducted using AmpliTaq Gold DNA Polymerase (Applied
Biosystems Inc., Grand Island, NY). Primers were designed to amplify nucleotides 7131-
7230 or 7131-7530 of the bacteriophage Lambda genome. SYBR Green I dye and
Streptavidin coated magnetic beads (Dynabeads) were purchased from Invitrogen
(Carlsbad, CA). All other reagents were purchased from Aldrich (St. Louis, MO) unless

Chapter 3. Oligothiol graft copolymer stabilized AuNPs for SP-PCR
57
otherwise noted. Ultrapure water was generated from a Milli-Q water purification system
(Millipore Inc.; Billerica, MA, R > 10 MΩ·cm). PD-10 desalting columns were
purchased from GE Healthcare (Pittsburgh, PA). 1H NMR spectra were recorded on a
Varian Unity (500 MHz) using solvent peaks as internal standards. Visible absorption
spectra were obtained on a Hewlett-Packard 8453 UV-Vis spectrophotometer. The
intensity (z)-averaged hydrodynamic diameter (dz) of AuNPs in solution was measured
with a Nano ZS instrument (Malvern, Worcestershire, England). Fluorescence data were
collected by a Quantamaster fluorimeter (PTI, London, Ontario; λex = 470 nm) using
optical filters (FF01-492/SP-25 and BLP01-488R-25, Semrock) to eliminate scattered
light.
3.2.2 Synthesis
Figure 3-1. Synthetic scheme of -amino -azido hetero functionalized PEG.
Chapter 3. Oligothiol graft copolymer stabilized AuNPs for SP-PCR
58
Diazido PEG Synthesis. Diazido PEG was prepared from PEG diol (MW 2,000)
according to a method similar to that described by Schwabacher et al.33
with the
following modification. After PEG diol (50 g, 25 mmol) was dried by addition of 25 ml
toluene and rotary evaporation, 120 ml of THF was added under N2, and MsCl (4.3 ml,
56 mmol) then was added by a syringe. As the solution was cooled in an ice bath, Et3N
(7.7 ml, 56 mmol) in 5 mL of THF was added dropwise. The ice bath was removed 1 h
later and the solution was stirred for about 4 h. To the mixture was added 150 mL H2O,
and the solution was cooled in an ice bath. Next, pH of the solution was adjusted to about
8 by the addition of NaHCO3. NaN3 (3.4 g, 52 mmol) was added to the solution while the
solution was stirred. After THF was distilled at 80°C, the mixture was refluxed for 36 h.
The aqueous layer was extracted with ether/DCM mixture (1:1) five times, and each
organic layer was washed with brine. The organic layer was dried over Na2SO2 and dried
by rotary evaporation. Residual solvent was removed by evacuation. (yield : 31.5 g,
50 %) 1H NMR (500 MHz, CDCl3, δ) 3.38 (t, CH2N3, J = 5.0 Hz), 3.47-3.78 (br s,
CH2CH2O).
α-Amino ω-azido PEG synthesis. Reduction of diazido PEG (5 g, 2.5 mmol) in
25 ml in THF/H2O (10:1) was done statistically by dropwise addition of
triphenylphosphine (656 mg, 2.5 mmol) in 5 mol of THF for 24 h under N2. THF was
distilled by rotary evaporation and 10 mL of H2O was added into the solution. The
solution was kept at 4 °C overnight. White precipitates then were filtered. To the solution
was added by one pellet of NaOH. The aqueous layer was extracted by CHCl3, and the
organic layers were combined, dried over Na2SO4, and evaporated. The product was

Chapter 3. Oligothiol graft copolymer stabilized AuNPs for SP-PCR
59
purified by silica gel chromatography (DCM:methanol:NH4OH 10:1:0.1, Rf = 0.2) to
yield 0.95 g (19 %) after the elution of unreacted diazido PEG (Rf = 0.5), and leaving
diamino PEG (Rf = ~0) in the silica gel. 1H NMR (500 MHz, CDCl3, δ) 2.86 (t, CH2NH2,
J = 5.2 Hz), 3.38 (t, CH2N3, J = 5.0 Hz), 3.51 (t, CH2CH2NH2, J = 5.2 Hz), 3.47-3.78 (br
s, CH2CH2O).
RP-HPLC analysis. RP-HPLC was used to confirm the purity of α-amino ω-
azido PEG because NMR analysis can not differentiate the desire product from the
mixture of diamino and diazido PEG, according to a method similar to that described by
Schwabacher et al. with the following modification.33
Diazido PEG (500 mg, 0.25 mmol)
was reacted with TCEP·HCl (150 mg, 0.52 mmol) in H2O as a reference of diamino PEG.
After 1 day, the pH was adjusted to about 10 by addition of 1 M NaOH. The product was
extracted with CHCl3. The organic layers were combined, dried over Na2SO4, and
evaporated. This product and the purified α-amino ω-azido PEG (20 mg) were reacted
with benzyl chloroformate (28 µl and 14 μl, respectively) in 200 μL of THF and trace
amounts of DIPEA overnight. After ninhydrin test showed negative indicating no amine
left, the mixture was dialyzed by a 1,000 MWCO membrane in 1 L of H2O (three times)
for 1 day. The product was analyzed by RP-HPLC (2:3 CH3CN:H2O with 0.05%
CF3CO2H, 3 mL/min). The mixture from purified α-amino ω-azido PEG was eluted as
one peak, while the mixture from diamino PEG showed a trace of carboxybenzylated α-
amino ω-azido PEG followed by carboxybenzylated diamino PEG.
NHS-ester-PEG-N3 synthesis. To the solution of di-(N-hydroxysuccinimidyl)-
suberate (552 mg, 1.5 mmol) in 16 ml of DMF/CHCl3 (1:15) was added α-amino ω-azido

Chapter 3. Oligothiol graft copolymer stabilized AuNPs for SP-PCR
60
PEG (300 mg, 0.15 mmol) in 5 ml of CHCl3 and 2 μl of DIPEA slowly by syringe (8
ml/h) under N2. As the addition proceeded, cloud solution became clear. After stirring
overnight, the solution was evaporated and added by small aliquot of CH2Cl2. The
product was precipitated by addition into cold ether and filtered. The product was
dissolved in CH2Cl2, filtered, and precipitated into cold ether (twice). The white product
was characterized by NMR. 1H NMR (500 MHz, CDCl3, δ), 1.36 (m, CH2CH2CH2CONH,
2H), 1.43 (m, CH2CH2CH2COO, 2H), 1.65 (m, CH2CH2CH2CONH, J = 7.5 Hz, 2H),
1.75 (m, CH2CH2CH2COO, J = 7.5 Hz, 2H), 2.18 (t, CH2CH2CH2CONH, J = 7.5 Hz, 2H),
2.60 (t, CH2CH2CH2COO, J = 7.4 Hz, 2H), 2.84 (br s, CO-CH2CH2-CO, 4H), 3.39 (t,
CH2N3, J = 5.0 Hz, 2H), 3.45 (t, CONHCH2, J = 5.2 Hz, 2H), 3.55 (t, CONHCH2CH2O, J
= 5.2 Hz, 2H), 3.47-3.84 (br s, CH2CH2O), 6.10 (br s, CONH, 1H).
PLL-g-[PEG-N3:SH] synthesis. To the solution of PLL (10 mg) in 200 μl
DMSO and 10 μl DIPEA was added 25 mg of NHS-PEG-N3 in 500 μl THF. After
shaking the solution for 2 h, the solution was added to 20 mg of SPDP and rinsed with
100 μl of 1x PBS and 100 μl of DMSO. The solution was shaken vigorously overnight.
The solution was dialyzed in 2,000 MWCO membrane tubes for 1 day in 1 L of H2O
(three times). The product was lyophilized and redissolved in 500 μl of 1x PBS. To the
solution was added 10 mg of DTT and shaken for 1 h. Then, the desired product was
collected between 2 and 3 ml from PD-10 column using H2O as an eluent. After
lyophilization, the product was characterized by NMR analysis similar to the method in
chapter 2.34
The grafting ratios of PEG and SH were 0.29 and 0.53 using CH2N3 (δ =
3.37) and CH2SH (δ = 2.75), respectively.

Chapter 3. Oligothiol graft copolymer stabilized AuNPs for SP-PCR
61
Copper free click DNA conjugation on AuNPs. AuNPs were functionalized
with oligonucleotide primers using oligothiol conjugated graft copolymers via copper
free click chemistry between 5’-dibenzocyclooctyne-modified oligonucleotides and azide
groups in the polymers.35
The solution of 5’-dibenzocyclooctyne-modified
oligonucleotides (1.1 eq.) was mixed with the solution of PLL-g-[PEG-N3:SH] for
overnight. Then, to the solution of AuNPs was added the mixture followed by stirring for
1 h. The concentration of the mixture was brought to 10 mM phosphate buffer (0.15 M
NaCl, pH 7.4). For annealed AuNPs after ~ 30 min, the solution in a glass vial was
placed in a sand bath whose temperature was adjusted to ~ 90°C. The final concentration
of NaCl and Tween20 was brought to 0.3 M and 0.01 %, respectively, 3 h later. The
solution was incubated overnight. To remove excess amounts of ligands, the solution
was cooled and centrifuged in 1.5 ml tubes. The supernatant was discarded and the pellet
was resuspended in 1.5 ml 0.01% Tween20. This was repeated three times. The solution
was kept in 4 °C refrigerator.
3.2.3 PCR conditions
PCR reactions were conducted using AmpliTaq Gold DNA Polymerase. Reagents
were combined in 1X PCR buffer to target concentrations.
For experiments to determine whether AuNPs inhibit PCR or not, PCR samples
contained 2.5 U/100 μL AmpliTaq Gold DNA polymerase, 2 μM of forward and reverse
primers, 200 μM each dNTP, 1.5 mM MgCl2, 1X PCR buffer (10 mM Tris-HCl (pH 8.3)

Chapter 3. Oligothiol graft copolymer stabilized AuNPs for SP-PCR
62
and 50 mM KCl), 0.01% Tween20, 1 ng/100 μL bacteriophage Lambda DNA, and
different concentration of AuNPs@citrate, HS-T20, HS-PEG-T20, and PLL-g-[PEG-
T20:SH] from 0 to 4 nM. The thermal cycling protocol involved initial heating at 95 °C
for 5 min; then 30 cycles of 95 °C for 15 sec, 60 °C for 30 sec, and 72 °C for 45 sec; and
finally 72 °C for 6 min.
For SP-PCR using graft copolymer stabilized AuNPs, PCR samples included
constant concentrations of 80 nM forward primer, 5 μM reverse primer, 5 pM of 400 bp
DNA template, 0.01 % Tween20, 1X PCR buffer (10 mM Tris-HCl (pH 8.3) and 50 mM
KCl), and 1 nM AuNPs. The concentration of AmpliTaq Gold DNA polymerase and
MgCl2 varied from 2.5 U/ 100 μL to 5 U/100 μL and from 1.5 mM to 4.5 mM,
respectively. The same thermal cycling protocol was used as described above except
number of thermal cycles, which varies from 30 to 50.
For colorimetric detection of SP-PCR using graft copolymer stabilized AuNPs,
PCR samples included constant concentrations of 10 nM forward primer, 30 nM reverse
primer, 1 ng/mL of Lambda DNA or 5 pM of 400 bp DNA template, 0.01 % Tween20,
1X PCR buffer (10 mM Tris-HCl (pH 8.3) and 50 mM KCl), and 1 nM AuNPs (total
volume: 50 μL). The reverse primers were 5’-biotin labeled for Dynabead conjugation,
which led to color change with magnetic attraction. Control experiments were performed
by excluding template or using 5’-OH normal reverse primers. The concentration of
AmpliTaq Gold DNA polymerase and MgCl2 were 5 U / 100 μL and 4.5 mM,
respectively. The thermal cycling protocol involved initial heating at 95 °C for 5 min;
Chapter 3. Oligothiol graft copolymer stabilized AuNPs for SP-PCR
63
then 30 cycles of 95 °C for 15 sec, 54 °C for 30 sec, and 72 °C for 75 sec; and finally 72
°C for 6 min.
3.2.4 SP-PCR characterizations
Agarose gel electrophoresis. PCR reactions were characterized by gel
electrophoresis in 1.5% (PCR inhibition experiment) or 1.0% (SP-PCR experiments)
agarose gel in 1X TBE. Wells were loaded with either 8 μL (PCR inhibition experiments)
or 16 μL (SP-PCR experiment) of each PCR reaction, and the gel was electrophoresed for
1 h at 100 V. Photographs of the gels were taken using a digital camera. The gels then
were stained with 50 g/mL ethidium bromide (EtBr) for 10 min, and washed with ddH2O
for 10 min, and imaged for EtBr fluorescence.
dsDNA characterization. dsDNA was characterized by DLS analysis and
fluorescence using SYBR Green I. To extract AuNP-PCR from PCR mixture containing
various chemicals, such as, DNA polymerase, dsDNA, primers, MgCl2, etc., the PCR
reaction mixture was diluted with 1.5 mL of 10 mM TE (10 mM Tris, 1 mM EDTA, and
0.01% Tween20, pH 7.5) and centrifuged at 7000 rpm (30 min). The supernatant was
transferred into a new tube and centrifuged at 7000 rpm (30 min). After the supernatant
was removed, all AuNP pellets were combined. This process was repeated once more
with 10 mM TE (0.01% Tween20), twice with 1X TBE (0.01% Tween20). The
concentration of AuNPs was determined by UV-Vis spectroscopy using the following
equation; lnε = k lnD + a, where k = 3.32111 and a = 10.80505.36
The purified

Chapter 3. Oligothiol graft copolymer stabilized AuNPs for SP-PCR
64
AuNPs@dsDNA was used to determine the hydrodynamic size of the AuNPs by DLS
analysis. The 0.1 nM of AuNP was incubated with 1X SYBR Green I and 10 mM KCN
at 65°C (50 min) to etch the AuNPs. The fluorescent intensity was then measured and
calibrated to standard curve to obtain the concentration of amplified dsDNA.
ssDNA characterization by DLS analysis and fluorescence using ODN-FAM.
The purified AuNP@dsDNA was incubated with 1 mL of 0.1 M NaOH (0.01%
Tween20) for 30 min. The mixture was then centrifuged at 7000 rpm (30 min). The
supernatant was transferred into a new tube and centrifuged at 7000 rpm (30 min). After
the supernatant was removed, all AuNP pellets were combined. This process was
repeated once more with 0.01% Tween20, twice with 10 mM TE (0.01% Tween20). The
concentration of AuNPs was determined by UV-Vis spectroscopy. The purified solution
of AuNPs@ssDNA was used to determine the hydrodynamic size of AuNPs by DLS
analysis. The solution of AuNP@ssDNA or AuNP@primer for control was then
incubated with 20 nM of ODN-FAM in 10 mM TE (final volume 150 μL, Absorbance of
AuNPs = 0.1 at λmax, 0.3 M NaCl, and 0.01% Tween20) overnight 50 °C using PCR
machine after 15 sec pre-heating at 95°C. The samples were then centrifuged at 10,000
rpm (20 min). The supernatant was transferred and centrifuged at 10,000 rpm (30 min).
The combined AuNPs pellets were further purified by the same procedure using 10 mM
TE (0.3 M NaCl and 0.01% Tween20) twice. The AuNPs were diluted in 10 mM TE (130
μL, 0.3 M NaCl and 0.01% Tween20). The AuNPs hybridized ODN-FAM (100 μL) were
then mixed with 100 mM KCN (10 μL), and the mixture was incubated at 65 oC for 50 m

Chapter 3. Oligothiol graft copolymer stabilized AuNPs for SP-PCR
65
to etch the AuNPs. The solutions were characterized by PTI fluorometer to measure the
fluoresecent intensity of ODN-FAM.
3.2.5 Colorimetric detection of AuNP SP-PCR
Streptavidin-coated Dynabeads solution (200 μL, 10 mg/mL) was mixed with 1
mL 10 mM TE (0.01 % Tween20). After magnetic beads were settled down using a
magnet, the supernatants were discarded. This was repeated three times more. After these
washing, the beads were mixed with 100 μL of 10 mM TE (0.01% Tween20), which
resulted in 20 mg/mL solution.
After SP-PCR using the AuNPs, the photographs of the tubes were taken using a
digital camera and UV-Vis spectra were measured. The solutions were then mixed with
15 μL of the washed Dynabeads solution and gently shaked for 5 min. Next, a magnet
was placed on the bottom of the tubes to settle down the Dynabeads. The photographs of
the tubes were taken and UV-Vis spectra were measured.
For waveguided optical analysis, 20 μL of the supertants from each tube was
transferred into a 0.8 mm diameter capillary tube. The surface of the capillary tube was
etched using commercially available glass-etching cream, which visualized the color of
the solutions (1.2 cm etched surface, 1 cm non-etched surface, and 0.5 cm etched surface
from the bottom). The tubes were placed in homemade dark room and white-light was
illuminated from the top of the tubes. Photographs were then taken from the front of the
tubes with and without a green optical filter made of green cellophane papers.

66
Table 3-1. PCR primers and probes sequences.
Forward primer 5'- GAT GAG TTC GTG TCC GTA CAA CTG G - 3'
Monothiol forward primer 5'- HS -(C6) - GAT GAG TTC GTG TCC GTA CAA CTG G - 3'
Monothiol forward primer 5'- HS -(C6) - TTT TTT TTG ATG AGT TCG TGT CCG TAC AAC TGG - 3'
DIBO tagged forward primer 5'- DIBO - GAT GAG TTC GTG TCC GTA CAA CTG G - 3'
Reverse primer (400bp) 5'- CCC GGC AGC ACA AAT GCC ACA GGT T -3'
Reverse primer (100bp) 5’- AGA CGG GCA ATC AGT TCA TCT TTC G –3’
Biotin tagged reverse primer (400bp)
5'- biotin - CCC GGC AGC ACA AAT GCC ACA GGT T -3'
Complementary FAM-ODN 5'- FAM - C CCG GCA GCA CAA ATG CCA C - 3'
Noncomplementary FAM-ODN 5'- FAM - GG TTA TCG AAA TCA GCC ACA - 3'
Ch
ap
ter 3
. Olig
oth
iol g
raft c
opo
lym
er s
tabiliz
ed A
uN
Ps fo
r SP
-PC
R

Chapter 3. Oligothiol graft copolymer stabilized AuNPs for SP-PCR
67
3.3 Results and Discussion
3.3.1 ODN functionalized AuNPs using oligothiol graft
copolymer stabilizing ligands
The main goal of this study was to explore the relationship between multivalency
of DNA surface ligands attached to AuNPs and the stability and utility of those ligands in
PCR reactions. Previous work has shown that increasing ligand valency improves the
stability of ligand-capped nanoparticles in general,37
and of AuNP-DNA conjugates in
particular.27,38
Towards this aim, researchers have synthesized di- and tri-thiol modifier
reagents for use in solid-phase oligonucleotide (ODN) synthesis, and then combined the
resulting oligothiolated ODNs with AuNPs to form stable AuNP-ODN conjugates. We
have previously attempted to use these conjugates in PCR reactions without success. In
principle, this problem might be solved by attaching ODNs to AuNP surfaces via even
more thiol groups. This hypothesis follows from our recent report that AuNPs survived
harsh experimental conditions similar to those found in PCR when they were passivated
with PLL-g-PEG graft copolymer ligands containing many thiols per polymer chain.34
To
apply these polymers to AuNP-ODN construction, we attached the copolymer ligands to
ODN molecules via a strain-promoted, copper-free “click” chemistry method we reported
recently (Figure 3-2),35
to yield oligonucleotide-copolymer conjugates. PLL-g-PEG
polymers containing both azide and thiol functional groups (PLL-g-[PEG-N3:SH]) were
prepared by sequentially combining monodisperse poly(L-lysine) trifluoroacetate (PLL11,
Mn 2700, PDI 1.1) with an azido-PEG-NHS ester (Mn 2000) and a protected thiol-NHS

Chapter 3. Oligothiol graft copolymer stabilized AuNPs for SP-PCR
68
ester (SPDP) in controlled ratios, followed by deprotection of the thiol groups. These
azide-functionalized polymers were then combined with a 5’-dibenzocyclooctyne
(DIBO)-modified ODN to yield multi-thiolated, oligonucleotide-grafted PLL. These
polymers were then incubated for 3 d with 15-nm diameter, citrate-modified AuNPs to
yield AuNP-DNA conjugates. Our previous work on graft-copolymer-modified AuNPs
showed that particle suspensions were more stable if particles were incubated with
polymer at 90 °C;34
in this work, we formed AuNP-DNA conjugates at both room
temperature and at 90 °C, in order to perform the same analysis. The hypothesis of this
study was that polymer-oligonucleotide constructs would remain more strongly attached
to AuNPs during PCR reactions than oligonucleotides bound by just one or a few thiol
groups. To help make this comparison, we also synthesized AuNPs modified with 5’-
monothiolated oligonucleotides using previously reported methods.

Chapter 3. Oligothiol graft copolymer stabilized AuNPs for SP-PCR
69
Figure 3-2. Schematic representation of AuNPs coated with ODN functionalized
oligothiol graft copolymer.

Chapter 3. Oligothiol graft copolymer stabilized AuNPs for SP-PCR
70
3.3.2 PCR inhibition experiments
One requirement of the use of AuNP-ODN conjugates in PCR reactions is that
they do not inhibit (or “poison”) the PCR reaction. Storhoff and coworkers reported that
DNA-modified AuNPs can inhibit PCR even when the bound DNA is not directly
involved in the PCR reaction.20
To test whether the AuNPs inhibited PCR through
thermal cycles, AuNPs stabilized by T20 ODNs conjugated through either widely used
mono-thiols or the graft copolymers were included in PCR. Figure 3-3 illustrated the
mono-thiolated ODN (HS-T20) stabilized AuNPs inhibited the amplification reaction
during PCR even in the low concentration of the AuNPs (0.2 nM). It showed more
migration of AuNPs bands in gel electrophoresis than PCR negative AuNPs and the
absence of target DNA bands in the ethidium bromide (EtBr) staining gel image. When
PEG layers were incorporated between thiols and ODNs, complete inhibition was
observed above 1 nM of AuNPs (Figure 3-3). When the inhibition occurred, the AuNPs
band showed more migration similar to the HS-T20 stabilized AuNPs. In contrast, multi-
thiolated graft copolymers stabilized AuNPs had no effect on the PCR results even in the
high concentration (4 nM). As a result, the positive DNA bands in EtBr staining gel
image was observed as well as no migration changes of AuNPs bands before and after
PCR (Figure 3-3). The Alivisatos group reported that further migration of DNA
functionalized AuNPs resulted from lower DNA density on AuNPs.39-40
The faster
migration from electrophoresis analysis suggested that mono-thiolated ODNs could be
degraded or desorbed from surface of AuNPs during thermal PCR cycles and
polymerases interacted with AuNP surfaces, which completely inhibited extension and

Chapter 3. Oligothiol graft copolymer stabilized AuNPs for SP-PCR
71
amplification of DNA. Although introduction of PEG layers could reduce the PCR
inhibition below 1 nM of AuNPs, which might be come from thermodynamically
unfavored desorption of PEG layer to the water at elevated temperature,41
the results
suggested that AuNPs stabilized with mono-thiolated ODN was not suitable for
colorimetric detection assays that required a certain concentration of AuNPs at which the
color of solution should be distinguished by naked eyes.
Figure 3-3. Agarose gel electrophoresis images of PCR inhibition experiments. After
PCR was performed containing different concentrations of AuNPs that were stabilized by
HS-T20, HS-PEG-T20, or PLL-g-[PEG-T20: SH], the PCR products were analyzed aragose
gel electrophoresis. Top: Visible images corresponding to AuNP red-bands stabilized
with (Left) HS-T20, (Middle) HS-PEG-T20, or (Right) PLL-g-[PEG-T20:SH]. Bottom:
Fluorescence images corresponding to ethdium bromide staining 400bp DNA bands for
AuNPs stabilized with (Left) HS-T20, (Middle) HS-PEG-T20, or (Right) PLL-g-[PEG-
T20:SH]. From left to right lanes, the concentration of AuNPs increases (0.2, 0.4, 1, 2, and
4 nM). In no PCR lanes, AuNPs were not performed for PCR as negative control.

Chapter 3. Oligothiol graft copolymer stabilized AuNPs for SP-PCR
72
3.3.3 Solid phase PCR on AuNPs
There have been a few reports of incorporation AuNPs into PCR mixture14,42-43
as
well as reports of using AuNP bound oligodeoxyribonucleotides (ODNs) as primers in
PCR, which is called solid phase PCR (SP-PCR). This strategy has been attracted
because they offer not only simple and rapid colorimetric detection without post-PCR
instrumentation, but also further subsequent applications using immobilized amplicons.
Particularly, immobilized amplicons via SP-PCR have been exploited for DNA cloning,
high-throughput DNA sequencing, and protein identification and become popular and
powerful tools for biotechnology.44-48
The SP-PCR on AuNPs have more advantages
than other solid-phases, including a microbead,44,46
a flat surface,49
and a microtiter
plate,50
due to features of AuNPs. The unique optical properties of AuNPs can be used as
optical tags for bio-physics study using interparticle distance dependent plasmonic band
shifts.51-52
In addition, nano-sized characteristics yield larger curvature on surface that
can provide more space and employ denser genes on the unit surface area than micro-size
particles or flat surfaces.53
Moreover, it may solve the limitation of SP-PCR caused by
steric masking of primers to polymerases.54-56
In addition, nano-sized materials have
more diffusive characteristic in the solution than microbead or flat surface, resulting in
more efficient amplification via enzymatic reaction.57
Nonetheless, there are few reports
in which AuNPs are used as solid-phase for PCR because of the imcompatibility of
widely used AuNP-monothiolated DNA conjugates in PCR conditions, which leads to
degradation and desorption of the DNA23,29-30
as well as the loss of DNA polymerase
activity,31
as mentioned before.

Chapter 3. Oligothiol graft copolymer stabilized AuNPs for SP-PCR
73
We believed that our graft copolymer stabilized AuNPs could overcome these
problems and be successfully used as supports for PCR. In addition, the graft copolymer
stabilized AuNPs did not affect on DNA polymerase activity from the PCR inhibition
experiments, resulting in the target DNA synthesis. Therefore, we performed SP-PCR
using the graft copolymer stabilized AuNPs on which forward primers were immobilized.
It is reported that the efficiency of SP-PCR depends on the concentration of initial DNA
template.58
As a result, SP-PCR frequently uses simultaneous amplification of the target
DNA in the liquid phase and the solid phase.46,59
The amplified target DNA in the liquid
phase increases the concentration of the DNA templates, which improves the efficiency
of SP-PCR. We also included unbound forward primers in the PCR mixture for this
strategy.
Thoughout SP-PCR, primers bound to AuNP surface are extended by DNA
polymerase to have target DNA sequences without changing AuNP properties. As a
result, AuNP amplicons should not only show intact AuNP optical properties (red color),
but also have larger hydrodynamic size than that of AuNP-primers. Gel electrophoresis
migration length was used to study the size change before and after SP-PCR.39-40
In
addition, complementary characterization of the size change was performed using DLS,
because the migration in gel electrophoresis is related to both size and charge of AuNP
amplicons. We used DLS for this characterization because DLS analysis is related to the
hydrodynamic size of suspensions, not the charge in most cases.60-61
Furthermore,
amplified double strand DNA (dsDNA) from positive SP-PCR was quantified using
fluorescent DNA intercalating dyes, which have fluorescence in the presence of
Chapter 3. Oligothiol graft copolymer stabilized AuNPs for SP-PCR
74
dsDNAs.62
To avoid false indication that would be caused by the hybridization between
the immobilized primers and the amplified single strand DNA (ssDNA) in the liquid
phase, the dsDNA bound to AuNPs was denaturated by basic solution, and the resulting
ssDNA on AuNP surfaces was analyzed. We used DLS based size change from the stiff
dsDNA to the flexible ssDNA for this purpose. Moreover, to know whether target DNA
was amplified on the AuNP surfaces, we used complementary ODN probes bearing
fluorophores and characterized the fluorescence of the hybridized complementary ODN
probes (Figure 3-4).

Chapter 3. Oligothiol graft copolymer stabilized AuNPs for SP-PCR
75
Figure 3-4. Schematic illustration of AuNP-ssDNA characterization using fluorophore
tagged complementary ODN probes. dsDNA on the AuNP-amplicons is denaturated by
basic solution, resulting in immobilized ssDNA. FAM-ODN probes containing
complementary sequence to the immobilized ssDNA are mixed with the AuNP-ssDNA.
When the FAM-ODNs are hybridized, the fluorescence is quenched due to FRET by
AuNPs. After purification of the solution to remove excees amount of free FAM-ODNs,
the AuNPs are etched to turn on the fluorescence that is measured by a fluorometer.

Chapter 3. Oligothiol graft copolymer stabilized AuNPs for SP-PCR
76
Figure 3-5. Schematic demonstrations of AuNPs stabilized by different types of thiol
primers; Au@HS-ODN. monothiol primer, Au@HS-T8-ODN. monothiol T8 primers,
Au@HS-PEG-ODN. monothiol PEGylated primers, and Au@PLL-g-[PEG-ODN:SH].
oligothiol graft copolymers conjugated with primers
We performed SP-PCR on AuNPs (1 nM) surfaces that were attached to different
types of thiol primers, including monothiol primers (Au@HS-ODN), monothiol T8
primers (Au@HS-T8-ODN) in which T8 spacers had similar molecular weight (2,400 g
mol-1
) to that of PEG layer (2,000 g mol-1
), monothiol PEGylated primers (Au@HS-
PEG-ODN) and oligothiol graft copolymers conjugated with primers (Au@PLL-g-[PEG-
ODN:SH]) (Figure 3-5). The PCR amplicons were analyzed by gel electrophoresis to
characterize the target DNA amplification in the liquid phase and the solid phase (Figure
3-6A). Electrophoretic patterns of the red AuNP bands showed all monothiol stabilized
AuNPs had more migration after SP-PCR. In addition, these AuNPs did not produce the

Chapter 3. Oligothiol graft copolymer stabilized AuNPs for SP-PCR
77
target DNA in the liquid phase from the EtBr staining image. In contrast, Au@PLL-g-
[PEG-ODN:SH] not only showed a different electrophoretic pattern after PCR, that is,
less migration AuNP bands, but also produced the target DNA in the EtBr staining image.
These results indicate that only Au@PLL-g-[PEG-ODN:SH] yielded the positive SP-
PCR in both liquid phase and solid phase because the less migration of AuNP bands is an
evidence of the denser DNA layers on the AuNPs, which is similar to the previous PCR
inhibition experiments. Compared to the previous PCR inhibition experiments, the
incorporation of PEG layer in monothiol ODNs (Au@HS-PEG-ODN) resulted in the
negative PCR result even in 1 nM of AuNPs, at which concentration partial target DNAs
were amplified in the previous PCR inhibition experiments. We believed that the primer
directed the DNA polymerase located proximal to the surface of AuNPs. As a result, the
DNA polymerase interacted with the AuNPs surface, was deactivated, and led to
complete PCR inhibition.
The AuNP-amplicons were further characterized by size change and fluorescent
DNA intercalating dyes (SYBR green I) (Figure 3-6B). Intensity-averaged hydrodynamic
diameter (dz) of AuNP-amplicons was measured using DLS after removal of excess PCR
reagents that might cause false results. The purified AuNP-amplicons showed consistent
results from DLS analysis. All monothiol stabilized AuNPs did not show any distinct size
change after SP-PCR, whereas Au@PLL-g-[PEG-ODN:SH] provided significant
increase of dz from 49 to 80~115 nm in a diameter, depending on PCR conditions
(discussed later). Similarly, the amounts of immobilized dsDNA, quantified using SYBR
green I that has green fluorescence in the presence of dsDNA after AuNPs etching,

Chapter 3. Oligothiol graft copolymer stabilized AuNPs for SP-PCR
78
significantly increased only in the case of Au@PLL-g-[PEG-ODN:SH]. These
observations suggested that monothiol ligands were not suitable under PCR conditions.
Figure 3-6. (A) Agarose gel electrophoresis images of bright field (Left) and EtBr
staining (Right) of AuNP-amplicons after 30 thermal PCR cycles with 4.5 mM of MgCl2
and 0.025 U/L of DNA polymerase. Top legends include AuNP solid supports with
different types of primers. (B) Fluorescence intensity of the intercalated SYBR green I
with the amplified dsDNA on the AuNPs and intensity-averaged hydrodynamic size (dz)
of the AuNP-amplicons before and after SP-PCR varying the concentration of MaCl2 (1.5
and 4.5 mM) and DNA polymerase (0.025 to 0.050 U/L).
PCR efficiency relies on the concentrations of MgCl2 and DNA polymerase.1,63
Thus, the concentrations of MgCl2 and DNA polymerase varied from 1.5 mM to 4.5 mM
and 0.025 U/L to 0.050 U/L, respectively, to optimize PCR conditions (Figure 3-6B).
Similar to the previous SP-PCR, all monothiol stabilized AuNPs resulted in the negative
SP-PCR due to little change of the fluorescent intensity and the size. On the other hand,

Chapter 3. Oligothiol graft copolymer stabilized AuNPs for SP-PCR
79
Au@PLL-g-[PEG-ODN:SH] yieled increasing amounts of the immobilized dsDNA as
the concentration of polymerase MgCl2 and DNA polymerase increased. For example,
the amount of the immobilized dsDNA increased by 2.3 times more when the
concentration of MgCl2 was tripled from 1.5 to 4.5 mM, based on the fluorescence
intensity of intercalated SYBR green I dyes. Doubling the concentration of DNA
polymerase (0.025 to 0.050 U/L) produced 1.5 times higher fluorescent intensity with
constant concentration of MgCl2 (4.5 mM). DLS analysis also showed consistent results;
the size of AuNP-amplicons was increased from 81 to 102 nm with three times more
concentration of MgCl2, and 102 to 115 nm with doubled amounts of DNA polymerase.
Furthermore, increasing the number of thermal cycles produced more
immobilized target dsDNA. For instance, with 4.5 mM MgCl2 and 0.050 U/L DNA
polymerase, 50 of thermal cycles produced 28.1 strands of the immobilized dsDNA per
one AuNP and larger AuNPs (dz 138 nm, Figure 3-7C), whereas 30 of thermal cycles
generated 11.5 strands and 115 nm of dz. Moreover, when the template length decreased
from 400 bp to 100 bp (30 cycles, 4.5 mM MgCl2, and 0.050 U/L DNA polymerase),
the number of the immobilized target dsDNA increased from 11.5 to 36.4 using SYBR
green I quantification method, presumably, because the smaller size of the target DNA
led to less crowding on the solid surface. By the way, the smaller size of 100 bp showed
further migration in gel electrophoresis and smaller dz (92.4 nm) by DLS (Figure 3-7A
and C).

Chapter 3. Oligothiol graft copolymer stabilized AuNPs for SP-PCR
80
Figure 3-7. (A) Agarose gel electrophoretic patterns of the AuNP-amplicons after SP-
PCR using different length of templates: 400 bp (left lane) and 100 bp (right lane). The
middle lane included Au@PLL-g-[PEG-ODN:SH] without SP-PCR for comparison. (B)
Fluorescent intensity of complementary (black solid line) and non-complementary (red
dot line) FAM-ODNs that were incubated with the denaturated AuNP-amplicons, after
AuNP etching with KCN. (C) Size change of AuNP-amplicons depending on target DNA
size and number of thermal cycles, measured by DLS.
In order to know whether these results come from the positive SP-PCR rather than
the false characterization, which might be caused by the hybridization between the
forward immobilized primers and the reverse target ssDNA, we characterized the
immobilized ssDNA after denaturation of the immobilized dsDNA. First, we used DLS to
monitor the size change, because ssDNA has a flexible conformation that leads to

Chapter 3. Oligothiol graft copolymer stabilized AuNPs for SP-PCR
81
decrease of dz, compared to a stiff dsDNA.64
The size of AuNP-amplicons decreased
from 118.9 to 80.5 nm for the 400 bp target DNA and 92.4 to 73.6 nm for the 100 bp
target DNA (Figure 3-7C). These values were still larger than that of Au@PLL-g-[PEG-
ODN:SH] (49.5 nm), suggesting primer extension on the AuNP surface rather than
hybridization between the immobilized primers and the reverse ssDNA. Furthermore, in
order to determine the presence of proper sequences, either complementary or non-
complementary fluorescein modified ODN probes (FAM-ODN) were incubated with the
immobilized ssDNA (Figure 3-4). The complementary ODN-FAM resulted in much
higher fluorescent intensity due to sequence specific hybridization, whereas the non-
complementary FAM-ODN showed negligible fluorescence, which indicated the proper
target sequence amplification through SP-PCR (Figure 3-7B).
3.3.4 Digitalized DNA diagnostic assay through SP-PCR
Next, we developed a rapid and facile DNA diagnostic assay through the color
change of AuNP-amplicons from red to colorless in a single PCR tube. First, we tried to
use hybridization between the immobilized ssDNA of AuNP-amplicons, which were
generated through the denaturation and purification steps of the immobilized dsDNA as
discussed before, and the complementary ODN tethered to magnetic nanoparticles.
However, the hybridization was slow and it required additional efforts for the
denaturation and purification steps. Instead, we designed a novel system in which faster
DNA detection could be achieved without any additional efforts other than simple mixing

Chapter 3. Oligothiol graft copolymer stabilized AuNPs for SP-PCR
82
of magnetic beads, followed by magnetic attraction (Figure 3-8A). We chosen a
conjugation reaction between streptavidin-biotin because its reaction rate is faster (kb =
106~10
7 M
-1s
-1)65
than that of DNA-DNA hybridization (kb = 104~10
5 M
-1s
-1).
66 For this
purpose, the reverse primers are tagged with biotin groups that lead to biotin tagged
AuNP-amplicons thoughout SP-PCR. After SP-PCR, the PCR mixture is mixed with
streptavidin-coated magnetic beads to capture biotin tagged AuNP-amplicons using the
magnetic beads. As a result, when a magnet is placed on the bottom of the PCR tube, the
AuNP-amplicons-magentic beads are settled down, generating disappearance of red color
in the solution. In contrast, if target DNA templates are not present in the SP-PCR
mixture, there is no extension of the bound primers as well as no biotin tagging on the
AuNPs. Thus, magnetic attraction does not induce any color change in the SP-PCR
solution.
As the proof-of-concept, we performed SP-PCR containing 1 nM of AuNP-
primers and 30 nM of biotin tagged reverse primers whose concentration was reduced
compared to the previous SP-PCR conditions because higher concentrations require more
amounts of streptavidin-coated magnetic beads. After SP-PCR with and without target
DNA, the AuNP-amplicons were mixed with the magnetic beads for five minutes in
which any purification of the AuNP-amplicons was not performed. When the target DNA
was present the color of the solution disappeared after magnetic attraction, whereas when
the target DNA was absent the color was retained as red (Figure 3-8B). These
observations indicated that the color change came from the streptavidin-biotin
conjugation as a consequence of positive SP-PCR. The magnetic beads can be included

Chapter 3. Oligothiol graft copolymer stabilized AuNPs for SP-PCR
83
before SP-PCR at the cap and stayed on the cap by the surface tension of the solution, or
can be added after PCR. If the magnetic beads were included prior to SP-PCR, capturing
biotinylated AuNP-amplicons showed less efficiency, presumably, because of the partial
denaturation of streptavidin at high temperature.67
Nonetheless, the color change was
clear enough for the colorimetric detection by eye examination.
Furthermore, when normal reverse primers (5’-OH) were replaced for biotin
tagged primers, the magnetic attraction did not induce color change, meaning that the
color change solely relies on streptavidin-biotin conjugation rather than non-specific
absorption of AuNP-amplicons to the magnetic beads. This control experiment also
confirmed that the chelation of ssDNA via magnesium ion bridges did not occur during
the conjugation. For further characterization, the supernatant was discarded and the
pellets were washed, followed by addition of denaturation basic solution. The conjugated
AuNP-amplicons with the magnetic beads were recovered due to the denaturation of
double helix, recovering red color (Figure 3-8B). It also proved that SP-PCR led to
enzymatic synthesis of the target dsDNA on AuNP surface.
Next, we enhanced the color of the solution using waveguided optical analysis.
The small volume of the solution (20 μL) was placed in capillary tubes (0.8 mm
diameter) whose glass surfaces were etched to scatter the light and visualize color of the
scattered light. When light goes through the capillary tube from top to bottom, the
increase of light path length provides more extinction of light, resulting in enhanced red
color compared to light illumination at right angle to the capillary tubes (Figure 3-8C).
Moreover, the color was readily translated into digitalized signals (0 and 1), using a green

Chapter 3. Oligothiol graft copolymer stabilized AuNPs for SP-PCR
84
optical filter that removed red color. As a result, the positive SP-PCR generated green
color for 1 signal, whereas the negative SP-PCR did not show any color for 0 signal
(Figure 3-8C). The digitalized AuNP-PCR could be extended to a massive and rapid
DNA diagnostic assay if automated systems were developed by reading 1 and 0 signals
for positive and negative of target DNA presence, respectively.

Chapter 3. Oligothiol graft copolymer stabilized AuNPs for SP-PCR
85
Figure 3-8. (A) Schematic diagram of colorimetric detection of SP-PCR on AuNPs.
When target DNA exists, AuNP-amplicons are tagged with biotin thoughout SP-PCR.
The biotin tagged AuNP-amplicons are then captured by streptavidin-coated magnetic
beads. When magnetic field applied, the captured AuNPs are settled down, providing
color change from red to colorless. On the other hand, if the target sequence is absent,
AuNPs do not have biotin tags, resulting in the retention of red color. (B) Experimental
results of (A). The presence of target DNA in SP-PCR mixture induced color change

Chapter 3. Oligothiol graft copolymer stabilized AuNPs for SP-PCR
86
from red to colorless, which was distinguishable by eye examination. On the other hand,
the red color was retained when target DNA was not present in SP-PCR conditions. (C)
Photographs of AuNP-amplicons in capillary tubes after magnetic attraction in (B). (Top)
Light was illuminated at right angle to the tubes. (Middle) Waveguided light illumination
was used through capillary tube from top to bottom. (Bottom) Digitalized images of
waveguided light color using green optical filter. Negative SP-PCR showed dark for 0
signal, whereas positive SP-PCR had green color for 1 signal.

Chapter 3. Oligothiol graft copolymer stabilized AuNPs for SP-PCR
87
3.4 Summary
We described solid phase PCR using immobilized primers on AuNPs, and
investigated primer extension and amplification using different types of ligands. The
positive SP-PCR was achieved and characterized when thermally stabilized AuNPs by
oligothiol graft copolymers. In addition, the stabilized AuNPs were used to develop a
facile and rapid DNA diagnostic assay based on color change without any additional
analysis other than eye examination. It should be noted that the virtue of this assay is that
it requires a few minutes for DNA diagnosis without any tedious or expensive
instrumental analysis and a skilled technician. Moreover, we developed a cheap process
for digitalized data extraction from the AuNP SP-PCR, which might be applied to an
automated massive DNA diagnostic platform. The stable AuNPs for PCR could be
expanded to other PCR based technologies, including DNA mapping, single-nucleotide
polymorphism analysis, and generic disease diagnostics. Furthermore, the nano-sized
AuNP amplicons could be one of the promising SP-PCR solid substrates for the next
generation DNA sequencing platforms using hybridization sequencing method. It should
be noted that AuNP amplicons may offer an alternative approach to reduce the DNA
translocation speed for currently developed nanopore based a DNA sequencing
technology.

Chapter 4. Bioorthogonal, chemically cleavable -azido ether
88
Chapter 4. Bioorthogonal, Chemically
Cleavable -Azido Ether.
4.1 Degradable material and cleavable linker
Degradable material is a material that disintegrates under certain conditions,
including environmental conditions, light illumination, and specific chemical triggers,
with a reasonable and demonstrable timescale.1 Scientific and technological demand for
degradable materials has increased to improve human life by preserving our
environment2 and health.
3-4 As a consequence, degradable materials have played an
important role as eco-friend biodegradable plastics that can minimize damage to our
environment,2 degradable biological media for analytical and fundamental studies to
understand biological functions,5-6
and biocompatible and healing materials for
biomedical applications.3,7
Degradable materials can be made from inorganic and organic
materials based on natural origin or man-made synthetic sources. There are many
degradable inorganic materials, such as, porous calcium phosphates,8 silica,
9 metal-
organic frameworks,10
and organic materials based on natural sources like gelatin.11
This
thesis mainly focuses on degradable organic materials from synthetic polymers,
especially, in biological applications.
The degradation mechanism of synthetic polymeric materials solely depends on
the chemical characteristics of the cleavable linker that makes up the material. In other

Chapter 4. Bioorthogonal, chemically cleavable -azido ether
89
words, the cleavable linker determines what conditions act as cues to disintegrate the
material.12
For example, because an ester functional group can be hydrolyzed to acid and
alcohol, degradable materials composed of esters decompose in the presence of water.7,13
Likewise, a hydrogel having a disulfide crosslinker can be dissolved by the addition of
mild reducing reagents like thiol species to break the disulfide crosslinker.14
The cues to trigger cleavage can be categorized based on where they exist; inside
an organism or outside the body; endogenous sources (water,7,13
enzyme,15
and
biologically abundant chemicals12
) and exogenous sources (light6,16
and biologically rare
chemicals12,17-21
). In addition, the interaction between a cleavable linker and its triggers
varies in terms of reaction conditions and cleavage kinetics. Both the origin of triggers
and the cleavage interactions determine applications of cleavable linkers and degradable
materials. For instance, water is the most abundant source in our bodies and ester
hydrolysis is very slow in the absence of a catalyst.13
Consequently, ester linkers have
been incorporated into biodegradable fixation devices, including resorbable pins, screws,
and plates, which need slow degradation until the defect is healed.7 Light labile linkers
have been utilized to make 3D-patterns in a hydrogel22
or manipulate physical strength of
a hydrogel6,23
because light can penetrate a transparent media to trigger the cleavage of
the linker.
Many degradable materials have been developed to degrade based on the
endogenous sources in biological applications. Although these materials have advantages
like natural degradation without injecting triggers, they often have disadvantages in terms
of degradation control after implementation, especially, in in vivo applications. On the
Chapter 4. Bioorthogonal, chemically cleavable -azido ether
90
other hand, degradable materials that degrade on exposure to exogenous sources can have
benefits in terms of degradation control after implementation by manipulating the
external triggers. Thus, it is possible to make a specific pattern by post-degradation
control using exogenous light source within demonstrable timescale.23
However,
degrading materials by exogenous chemical triggers have not been well-developed. We
believe that the materials which degrade by exogenous chemical triggers would be
suitable for various applications, such as, a degradable polymeric network for cell-culture
media and a degradable polymer for biomedical devices and drug delivery.
The rest of this thesis deals with the investigation of a linker that can be cleaved
by exogenous chemicals, a degradable polymeric material comprised of the linker, and its
application to biological technology. The chemistry of the degradable material is based
on the -azido ether functional group and its cleavage triggers, such as, phosphine and
dithiol. It will be shown how stable the cleavable linker is without the cleavage triggers
and how rapid the cleavage reaction occurs in the presence of the triggers. Next, the -
azido ether is incorporated into a crosslinked polymeric network of a polyacrylamide
hydrogel that is one of the most widely used supports in gel electrophoresis.24
The
degradation of hydrogel with the cleavage triggers will be explored to show how an
exogenous chemically cleavable linker can be associated with biological technology. This
chapter gives a brief background about cleavable linkers and their applications, followed
by polyacrylamide gel electrophoresis.

Chapter 4. Bioorthogonal, chemically cleavable -azido ether
91
Figure 4-1. Cleavable linkers in biological applications. (Top) Linkers that can be
cleaved by endogenous sources, such as, water, enzyme and biologically abundant
chemicals. (Bottom) Linkers that can be cleaved by exogenous sources, such as, light and
biologically rare chemicals.

Chapter 4. Bioorthogonal, chemically cleavable -azido ether
92
4.2 Cleavable linkers and its applications
4.2.1 Cleavage by endogenous source
Hydrolytic cleavage. One of the widely used cleavable linkers by endogenous
triggers involves a hydrolytic mechanism; water attacks the cleavable linker to break the
bond with or without a catalyst.
Ester is a representative linker that is cleaved through hydrolysis. The cleavage
reaction rate is too slow without a catalyst like a base. In in vitro applications, it has been
utilized in solid-phase biological molecule synthesis in peptides and nucleic acids.
Merrifield first chemically synthesized a peptide chain via stepwise additions of an amino
acid monomer to a chain on a crosslinked polystyrene resin and removed the synthesized
peptide from the resin using base catalyzed hydrolysis of an ester linker, which brought a
Nobel Prize award to him.25
Later, nucleic acids were chemically synthesized via a
similar concept using ester cleavage from a controlled pore glass support.26
This linker
has become a standard cleavable linker in the solid-phase synthesis until now. In in vivo
applications, the ester has played an essential role with its slow reaction rate13
in
biodegradable polymers, such as, poly(lactic acid) (PLA), poly-glycolic acid (PGA),
poly-caprolactone (PCL), polyhydroxylalkanoate (PHA), and their copolymers.2-3,7
For
example, PLA has been studied as a suitable bioadsorbable material for a fixation device
being a replacement for a metallic device because of its long retention of strength,
biocompatibility, and slow biodegradability, which promise no secondary surgery after
fixation.7

Chapter 4. Bioorthogonal, chemically cleavable -azido ether
93
In contrast to slow hydrolysis of ester in the absence of base catalyst, acid
catalyzed rapid hydrolysis has been utilized in various linkers, such as, p-alkoxybenzyl
alcohol,27
silyl ether,28
orthoester,29
acetal,30-31
ketal,32
hydrazone,33
and so on.12,34
Similar to the ester, the acid catalyzed hydrolysis was applied to solid-phase synthesis for
in vitro biological molecule synthesis through the cleavage of p-alkoxybenzyl alcohol
developed by Wang.27
On the other hand, the acid-labile linkers have been actively
studied for a pH responsive drug delivery system. Because there are pH gradients in in
vivo system (i.e. tumors: pH 5.7 to 7.8), pH sensitive biomaterials containing acidic labile
cleavable linkers have been investigated for drug delivery to tumors.31,34
For example,
Griset et al. showed that the anticancer drug, paclitaxel, was released effectively and
inhibited the growth of LLC tumors in C57B1/6 mice by acidic catalyzed cleavage of
acetal groups, which induced hydrophobic to hydrophilic transformation, swelled
crosslinked nanoparticles, and released the drugs.31
Enzymes mediated cleavage. Because enzymatic cleavage is highly selective and
efficient to a specific peptide sequence and is performed under mild conditions, enzymes
have been integrated into cleavable linkers in in vitro and in vivo applications.4,12,15,35-37
For in vitro applications, a specific peptide sequence like ENLYFQG was used as a
cleavable linker, which could be cleaved by a tobacco etch virus protease (TEV). Speers
et al. developed a probe containing the ENLYFQG sequence and cleaved the sequence by
TEV to analyze samples by mass spec and identify the sites where the probe recognized
the protein.35
For in vivo applications, enzymatic cleavable linkers were incorporated into
a degradable hydrogel in which growth factors were released by enzymatic cleavage to

Chapter 4. Bioorthogonal, chemically cleavable -azido ether
94
regenerate tissues in rats.37
Moreover, dendrimeric nanoparticles containing PLGLAG
cleavable linkers were used to image fluorescence Cy5 and Gd-DOTA MRI probes for
tumors in animals, in which matrix metalloproteinase (MMP) cleaved the sequence
during the tumor invasion and metastasis process.38
Chemically triggered cleavage. Chemicals that are biologically abundant can be
a source to trigger cleavage. One of the most studied endogenous chemical triggers is a
thiol because it is biocompatible and often associated with disease,39
which has been used
to design a targeted imaging agent40
and drug delivery system.41
Although there are a few
linkers (i.e. nitrobenzenesulfonamide42
and thiolphenylester43
) that can be broken by the
thiol trigger, a disulfide bridge has been widely explored; because it is naturally occurring
to reserve a protein structure indicating biocompatibility; its synthesis is simple; and its
cleavage is rapid in mild conditions.12,44
As a result, the disulfide has been utilized as a
linker for catch-and-release regents to analyze proteins in in vitro application.45
Moreover, small interfering RNA (siRNA) was conjugated with cholesterol via a
disulfide linker to deliver the siRNA to cells in the brain and show efficient gene
knockdown using animal subjects.46
Nonetheless, the disulfide linker is often restricted
due to its instability. Since the cleavage occurs through rapid thiol exchange reaction,44
biologically abundant thiols (i.e. cysteine amino acid) can lead to non-specific cleavage.12

Chapter 4. Bioorthogonal, chemically cleavable -azido ether
95
4.2.2 Cleavage by exogenous source
Cleavage can be triggered by exogenous sources, such as, light illumination and
chemicals. These linkers have benefits compared to the endogenous triggered linkers
because its cleavage can be controllable by changing exposure time and concentration of
triggers.
Light driven cleavage. Light driven cleavage has been extensively used in many
applications, such as, organic synthesis, photolithography, coating industry, and photo-
switching.16,47
Recently, these photolabile linkers have been incorporated into biological
applications because of their excellent temporal and spatial control. For example, Luo et
al. created biochemical channels in a photodegradable hydrogel by UV-light illumination
with spatial control to cleave the photolabile linkers and generate reactive sulphydryl
groups in which biological molecules were conjugated to the channels.22
Later, Anseth
group incorporated a nitobenzyl ether crosslinker, which was cleaved under 365 nm light,
into a hydrogel.6,23
The hydrogel was used for an in vitro cell encapsulation platform and
its properties were tuned by photo-cleavage. Vivero-Escoto et al. used photolabile groups
to change surface charges from positive to negative to induce the release of anticancer
drugs inside of human cells.48
Nonetheless, use of photo-cleavable linker is often limited
because of potential damage to biological components49
and the penetration depth of
light.50-51
We believe that these facts presumably are the reason why there are only a few
reports about the use of photolabile linkers inside a living organism: transparent zebrafish
embryos in which photolabile protecting groups were released by light illumination to
control concentration of biological components,52-53
and bioluminescence imaging in
Chapter 4. Bioorthogonal, chemically cleavable -azido ether
96
living mice through photo-cleavage by nanoparticle guided photon upconversion from
near-IR to UV to overcome the issue of penetration depth.51
Chemically triggered cleavage. There are a few linkers that can be cleaved by
exogenous chemical triggers in biological applications, including 1,2-diol and sodium
periodate (NaIO4) trigger,17
azo and sodium dithionite (Na2S2O4) trigger,18,54
and azide
and reducing reagents (phosphines or dithiols) in Staudinger ligation19
and -azido
ether.20-21,55-58
Because NaIO4 can damage biological molecules like RNA59
and Na2S2O4
is decomposed in physiological conditions,60
1,2-diol and azo linkers are not used in
living organism. On the other hand, the azide reduction can be used for in vitro and in
vivo applications because its chemical reaction is biocompatible and bioorthogonal.
The azide reduction chemistry has initiated “bioorthogonal chemistry”, which
means “a chemical reaction that neither interacts with nor interferes with a biological
system”,61-62
because azide is a non-naturally occurring functional group and the
concentration of its triggers are too low for the azide reduction.63
As a result, the azide
reduction has played an important role in in vitro and in vivo bioconjugation methods
through Staudinger ligation. Although the main purpose of Staudinger ligation is to
connect two entities through an amide bond, there is one example, to the best of my
knowledge, in which Bertozzi group expanded the Staudinger ligation to cleave a
quencher moiety and turn on fluorophore for live cell imaging.19
However, nowadays, the
Staudinger ligation has been replaced with azide-alkyne click chemistry due to its slow
reaction rate.61,64

Chapter 4. Bioorthogonal, chemically cleavable -azido ether
97
Chemical triggered cleavage of -azido ether has been utilized in DNA
sequencing technology20
and DNA detection platform,21,55-58
and played an essential role
in the next generation sequencing technology in the market.65
For example, in the DNA
sequencing technology, a fluorophore/-azido ether/DNA monomer was incorporated
into a polymerase enzymatic reaction. The fluorescence color of the hybridized DNA
monomer into DNA template was detected to determine DNA sequence. -Azido ether
was then chemically cleaved by reaction with TCEP at 60 oC to generate reactive –OH
group for the next reacton. This cycle was repeated until the DNA sequence reading was
completed.20
The same -azido ether chemistry was used for complementary DNA
detection by the Kool group.21
In this case, when a quencher bearing -azido ether and
phosphine functionalized DNA were hybridized with a template DNA, -azido ether was
located proximal to the phosphine group and cleaved to turn-on fluorescence, which
resulted in complementary DNA detection.
In contrast to the Staudinger ligation, the cleavage kinetics of the -azido ether
chemistry has not been studied yet. Although its cleavage mechanism is similar to that of
the Staudinger ligation,64
the different chemical structure of -azido ether, which bears
electronegative O adjacent to azido group, could lead to faster reaction rate. Moreover,
because its chemistry is bioorthogonal the -azido ether chemistry can hold a promise for
a novel means of degrading materials without changing biological systems and with
excellent control by addition of chemical triggers. This thesis will show the chemistry of
-azido ether and its cleavage to find out optimized cleavage conditions. Also, its
Chapter 4. Bioorthogonal, chemically cleavable -azido ether
98
integration into a degradable material will be shown using a polyacrylamide hydrogel as
the first step toward various in vitro and in vivo applications.
4.3 Polyacrylamide gel electrophoresis (PAGE)
4.3.1 Basic principles
After the discovery of electrophoresis in biological molecules by Tiselius in
1937,66
electrophoresis has played essential roles as one of the most ubiquitous, versatile,
and powerful tools in biological technology. Historically, the incorporation of starch gel
matrix into the electrophoresis initiated a gel electrophoresis by Smithies in 1955.67
In
1959, Raymond and Weintraub used a commercial gel matrix called Cyanogum 41 that
was crosslinked polyacrylamide (PAAm) gel and showed electrophoretic patterns of
serum albumin and hemoglobin.68
After this seminal report, PAAm gel has become one
of the ideal matrixes for the electrophoresis and developed many gel electrophoresis
methods, such as, DNA/RNA PAGE,69
IEF PAGE,70
SDS-PAGE,71
and 2D-PAGE.72
Polyacrylamide (PAAm) gel is synthesized by a free radical polymerization of
acrylamide monomers and crosslinker called Bis (N,N’-methylene bisacrylamide) using
APS/TEMED catalyst system in aqueous solution. PAAm gel has served an ideal matrix
in gel electrophoresis because of its inertness to biological samples and stains, stability to
pH and a wide range of ionic strengths, charge-free supports, transparency, and strength
to be thin gels.68,73-74
More importantly, PAAm is a synthetic matrix allowing

Chapter 4. Bioorthogonal, chemically cleavable -azido ether
99
reproducibility, various pore sizes by changing concentration of monomers and
crosslinker, and additional functionality by modification of crosslinkers5 or
copolymerization with chemically modified acrylamide monomers.75-76
Biological samples of interests migrate through pores in PAAm gel under applied
electric potential based on their charge, size, and shape.73-74
Varying the concentration of
monomers and crosslinkers changes the pore size that determines the degree of the
migration retardation. Velocity of the samples is then simply determined by the balance
between the electrophoretic migrating force and the retardation caused by molecular
sieving effect. As a result, biological molecules are separated based on their own
electrophoretic migration velocity. When biological molecules have the same charge-to-
mass ratio (i.e. nucleic acid, SDS-denatured proteins), the migration distance solely relies
on the size (or mass), leaving an arranged band of biological molecules with respect to
the size. On the other hand, intact proteins are often separated by electrophoretic
migration and show their own band depending on their intrinsic charge, size, and shape.
The band is then used to analyze the biological molecules5,77
; molecular weight,
composition, biological function, and so on. After gel electrophoresis is performed, the
recovery of biological molecules is frequently employed to obtain more information
about the biological system5; for example, an intact protein for functional assay,
78 an
extremely pure protein sample for protein crystallization,79
a nucleic acid-protein
complex for fundamental study of a biological assembly,80
and a pure RNA template for
protein synthesis.81
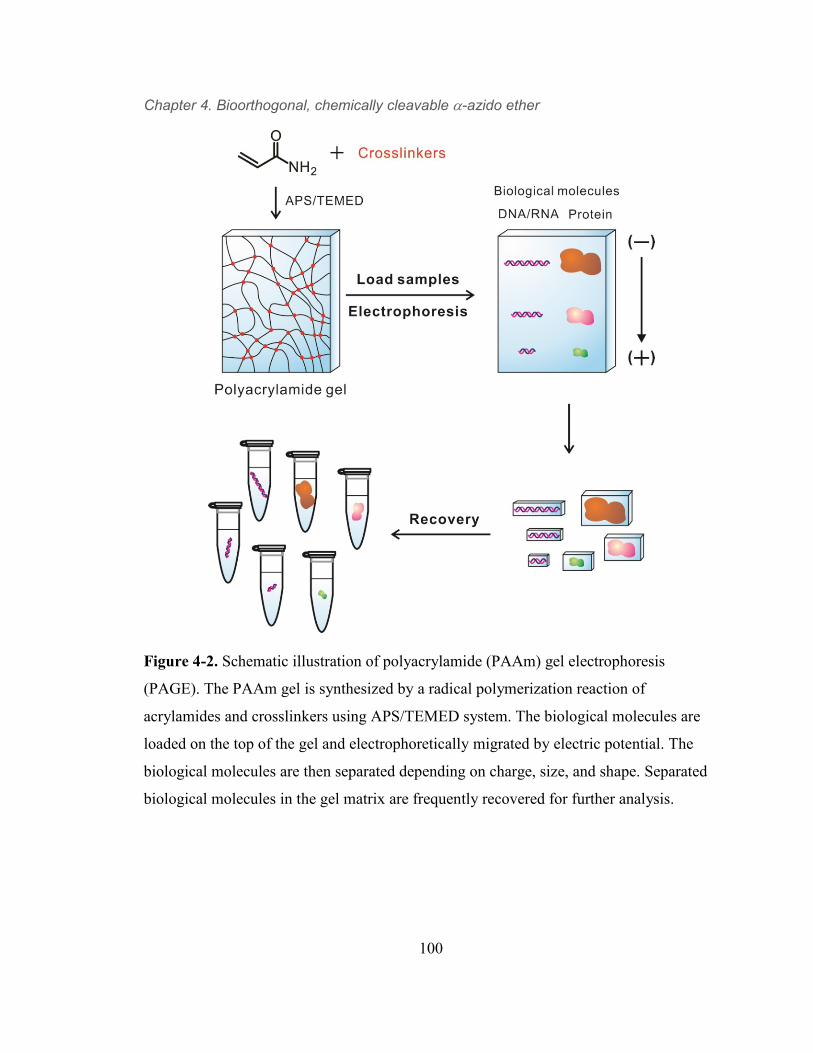
Chapter 4. Bioorthogonal, chemically cleavable -azido ether
100
Figure 4-2. Schematic illustration of polyacrylamide (PAAm) gel electrophoresis
(PAGE). The PAAm gel is synthesized by a radical polymerization reaction of
acrylamides and crosslinkers using APS/TEMED system. The biological molecules are
loaded on the top of the gel and electrophoretically migrated by electric potential. The
biological molecules are then separated depending on charge, size, and shape. Separated
biological molecules in the gel matrix are frequently recovered for further analysis.

Chapter 4. Bioorthogonal, chemically cleavable -azido ether
101
4.3.2 Recovery of biological molecules
The recovery of biological interests out of the crosslinked PAAm gel usually
includes a passive extraction and an electroelution method.5 The passive extraction is
based on simple diffusion of the interests and can be thus improved by crushing gel or
mechanical homogenization.82
The electroelution method applies electric field to elute
the interests electrophoretically using an additional device and a dialysis tubing as a
physical barrier to preserve the interests in a reservoir.83
Each method has advantages and
disadvantages. Because the passive extraction only relies on the diffusion of the gigantic
molecules through polymeric networks, yield is frequently low and it requires time-
consuming process, which often leads to loss of biological activity.74,84-85
The
electroelution may afford better yield; however, it requires a tedious routine work using
additional instrumentation.5
On the other hand, there is an alternative method in which the gel matrix is
solubilized through gel degradation, leading to free biological molecules in the solution.
The first attempt based on this idea was to cleave the amide bonds using 30% hydrogen
peroxide at 50 oC.
86 As a consequence, Young could dissolve the gel matrix and
measured methionine-35
S radioactivity of entrapped proteins. However, this method also
dissolves the biological molecules resulting in incurable damage to any kinds of proteins
as well as nucleic acids.87
Instead, chemical modification can be utilized to solubilize the gel matrix.5,88-89
Chemical modification of a crosslinker promises gel degradation by proper chemical
treatment, which makes biological molecules free in the solution. If the Bis crosslinker is

Chapter 4. Bioorthogonal, chemically cleavable -azido ether
102
replaced with a cleavable linker, the gel can be degraded and solubilized under its
degradation condition (Figure 4-3). Based on this idea, there were attempts to incorporate
a cleavable functional groups into the crosslinker, including 1,2-diol,89-93
ester,94-97
acetal,84-85
and disulfide.98-101
Figure 4-3. Molecular structure of a cleavable crosslinker for a degradable
polyacrylamide gel (Right) and its degradation condition (Left). The cleavage reaction is
carried out in the red colored functional groups.
The crosslinker functionalized 1,2-diol had been used to separate various proteins
by the degradable PAGE and recovered by oxidative cleavage of the 1,2-diol using 2%
periodic acid. However, the cleavage requires harsh conditions that are not compatible
with most biological molecules resulting in irreversible loss of bioactivity (i.e. oxidation

Chapter 4. Bioorthogonal, chemically cleavable -azido ether
103
of -hydroxy, -oxo, -amino, and thiol).102-103
Hydrolysable ester was replaced with the
Bis to separate RNA96
or proteins.94-95,97
The gel bands containing the biological
molecules were then solubilized by addition of strong basic solution like 1 M NaOH or
NH4OH. However, the degradation conditions were so harsh that only quantification of
biological molecules in the solubilized gel was achieved without preserving their
molecular structures.
Later, Hansen first introduced a disulfide crosslinker (N,N’-bisacrylylcystamine,
BAC) as a substitute for the Bis. As a result, mild conditions for the gel degradation (1-
2% -mercaptoethanol) can be used to solubilize the gel in physiological environments.
Consequently, preparative amounts of intact RNA,98
DNA fragments,99
histones,100
and
pyridine nucleotide-linked dehydrogenases101
were recovered after the gel degradation.
However, no more reports have been followed, presumably, because of a tedious,
laborious, and non-reproducible preparation.104
First, BAC is not soluble at room
temperature in concentration above 1% because of its hydrophobicity leading to
inconsistent gel concentration.104
Second, it is noted that the BAC needs careful pH
control because of its instability under alkaline conditions.105
Third, the BAC shows a
lower reactivity in radical copolymerization reaction being inhomogeneous matrix that
might cause insufficient physical and molecular sieving properties.88
Fourth, the BAC is
not applicable to urea denaturating gel, which is one of widely used supports for RNA
PAGE, because of the deleterious effect of urea.104
Next, more importantly, a disulfide
may be cleaved by radical species to provide thiyl radical (S·)106
that can react with vinyl
groups to form a non-cleavable covalent bond. As a result, Hansen reported that insoluble

Chapter 4. Bioorthogonal, chemically cleavable -azido ether
104
BAC gel was prepared due to the undesired crosslinking from reaction between S· and
acrylamide monomer.104
In order to overcome the crosslinking toward a degradable BAC
gel, it should increase temperature (40 oC) and TEMED concentration.
100,104
Recently, Kwon developed another candidate as a cleavable linker for degradable
PAGE. Acidic labile ketal is used to replace the Bis to recover mouse IgG1 protein85
and
nucleic acids84
without loss of biological activity. It seems that its preparation procedure
follows a standard procedure for the Bis gel indicating no detrimental effect on the
gelation, which is critical problem in the BAC. However, the applications are limited to
acidic stable biological molecules because gel degradation still requires acidic condition
(pH 3 - 5), implying that the recovery of biological molecules using degradation gel
technique needs improvement that can be achieved by incorporating physiological and
biocompatible cleavable linker.
In order to overcome the limitations in the current degradable PAGE system, we
incorporated -azido ether functionality into the degradable PAGE. Because it would be
expected that the gel synthesis does not require any specific handling, which is necessary
for BAC, as well as its cleavage condition can be conducted in physiological and
biocompatible conditions, biological molecules can be electrophoretically separated in
the gel matrix and recovered under gel degradation conditions without losing their
activity.

Chapter 4. Bioorthogonal, chemically cleavable -azido ether
105
4.4 Overview
The rest of this thesis describes the chemistry of -azido ether linker that could be
one of the best candidates as a bioorthogonal, chemically cleavable linker as well as its
practical example in a biological technology.
Chapter 5 explores our fundamental study of -azido ether chemistry as a
cleavable linker. It demonstrates how stable -azido ether functionalized molecules are
against hydrolytic degradation depending on the chemical structure. In addition, it
provides how fast its cleavage is completed by chemical triggers varying pH of the
aqueous solutions, which is then used to propose a cleavage mechanism.
Chapter 6 shows a proof-of-concept study in which -azido ether plays as an
essential linker to develop a degradable material. The -azido ether linker is incorporated
in a degradable hydrogel support in PAGE technology. As a result, biological molecules
are electrophoretically separated, recovered by chemical triggers, and isolated without
loss of their structure and properties.

Chapter 5. Stability and cleavage kinetics of -azido ether
106
Chapter 5. Bioorthogonal, Chemically
Cleavable -Azido Ether; Stability and
Cleavage Kinetics Study
5.1 Introduction
A cleavable linker is a covalent chemical bond through which two entities are
connected and separated under a specific condition required to trigger the cleavage of the
chemical bond.1 Cleavable linkers have become more indispensible tools in a broad range
of applications; a degradable material towards an environment friendly biodegradable
plastic2; a solubilizable polymeric network to experimentally elucidate the efficiency of
crosslinking3; solid-phase synthesis in which desired molecules are synthesized via
successive reactions and liberated from a solid support4-6
; proteomics and DNA
sequencing to identify specific biological targets incorporated with the cleavable
linkers1,7
; and a microchip in which a cleavable linker produces a specific pattern
associated with photolithography.8-9
Chemical characteristics of cleavable linkers determine their applications vice
versa. For example, hydrolytic cleavage of polyester linkers has been developed for
making biodegradable plastics that degrade in soil.10
In photolithography, a light-driven
cleavage has been developed as an acid generator for positive and negative photoresists.11

Chapter 5. Stability and cleavage kinetics of -azido ether
107
The reduction-driven cleavage of a coordination bond between Pt(IV) and ligands inside
cells has opened novel drug delivery systems, in which a cisplatin drug is released at a
specific target.12-13
Recent progress in molecular and medical biology has relied on the chemistry of
cleavable linkers. However, not all cleavable linkers have been utilized in molecular and
medical biology because a suitable cleavable linker often requires biocompatibility, high
efficiency even in a low concentration, facile purification, and a mild cleavage
condition.1 In order to perform a specific function using a cleavable linker, the linker
should be compatible with the biological system. As the abundance of biological
components is often low, the cleavage reaction should have a high yield to achieve a
proper function.14
Facile and rapid isolation of excess reagents and by-products promise
successful results from a complicated biological system. In certain cases, experimental
harsh conditions for cleavage has generated nonselective release of biological
components and damaged them, causing problems during analysis.15
The cleavage of biologically applicable linkers can be initiated by endogenous or
exogenous triggers. The ester,16
peptide,17-18
acetal,19
and disulfide linkers,20
have been
developed for in vitro and in vivo applications in which the cleavage are triggered using
endogenous sources, including water,21
enzyme,22
pH,23
and biological entities.24
For
example, in vitro applications involve cleavable linkers, such as, a safety-catch-release
linker in a solid phase synthesis4-5
and protein tagging,25
a crosslinker in a polymeric
network for 3D cell culture,26
and so on. A degradable material27-28
or targeted cleavage
system29-30
has been adopted those linkers for in vivo applications.

Chapter 5. Stability and cleavage kinetics of -azido ether
108
On the other hand, cleavable linkers whose cleavage is triggered by exogenous
source, including light31
and a chemical trigger,15,32
have also been investigated. Those
linkers have often advantages over the former linkers in terms of cleavage control. Once
the former linkers are incorporated in a cleavable system, frequently, there is little room
to control their cleavage, especially in in vivo applications. However, post-cleavage
control can be achieved using the latter linkers by controlling concentration and duration
of exogenous source. For example, a specific pattern of hydrogel was constructed by the
spatiotemporal cleavage control using exogenous light.33
Among existing linkers cleaved by the exogenous sources, chemically triggered
cleavable linkers have more advantages. Although light triggered cleavable linkers have a
benefit in terms of spatial control,34
light may damage biological components35
and its
applications are often limited due to the penetration depth of light.36
In contrast,
chemically cleavable linkers can be developed without damaging biological components
and losing cleavage control because of physical obstacles. Moreover, because the
chemically cleavable linker should be inert to biological system until triggers approach it,
its reaction can be considered as bioorthogonal chemistry, “a chemical reaction that
neither interacts with nor interferes with a biological system”, which has played an
essential role in recent chemical biology.14,37
There are only a few systems reported for the bioorthogonal, chemically cleavable
linkers; azo-linker,15,32
Staudinger ligation,38
and -azido ether.39-40
Among them, -
azido ether has gained our attention as a cleavable linker. The azo-linker can be cleaved
by a sodium dithionite; however, the chemical trigger is unstable under physiological

Chapter 5. Stability and cleavage kinetics of -azido ether
109
conditions being limited to in vitro applications so far.41
Although the Staudinger ligation
was successfully utilized to cleave a quencher to provide fluorescent signal for imaging,38
the relative slow kinetics for the Staudinger ligation restricted its expansion toward a
broad range of applications.42
In contrast, -azido ether has already been developed as an
indispensible chemistry for the next generation DNA sequencing platform in the
market,43
implying it as one of the most promising candidates.
Although the -azido ether is likely to be an ideal linker for a bioorthogonal,
chemically cleavable linker, the chemistry behind its design and function is not fully
understood. As a consequence, a certain drawback related to the aqueous stability of -
azido ether has been reported but not addressed.44
In addition, if we refer that its cleavage
affords similar mechanistic steps to those of the Staudinger ligation (azido reduction), its
reaction kinetics still needs investigation.42
As a result, herein, we have explored the
stability in aqueous solution and its cleavage kinetics with chemical triggers. The stability
was studied using model -azido ether chemicals to investigate how a chemical structure
affects on the stability. The kinetics of reductive cleavage with chemical triggers, such as,
a dithiol and a phosphine, were also studied under different experimental conditions. The
kinetics was then used to study the cleavage mechanism with which the cleavage system
could be improved to be a suitable system for a broad range of applications. Furthermore,
the products from the cleavage were examined to understand its biocompatibility through
the entire cleavage reaction.

Chapter 5. Stability and cleavage kinetics of -azido ether
110
5.2 Experimental Methods
5.2.1 General
TCEP was purchased from Thermo Fisher Scientific, Inc. (Rockford, IL) and
deuterated NMR solvents were purchased from Cambridge Isotope Laboratories, Inc.
(Andover, MA). DHLA was synthesized from -lipoic acid.45
The primary and
secondary azide analogs were synthesized using the published procedure46-47
and their
identity and purity were determined using 1H NMR. All other reagents were purchased
from Aldrich (St. Louis, MO) unless otherwise noted. Ultrapure water was generated
from a Milli-Q water purification system (Millipore Inc.; Billerica, MA, R > 10 MΩ•cm).
Visible absorption spectra were obtained on a Hewlett-Packard 8453 UV-Vis
spectrophotometer (Palo Alto, CA). 1H NMR spectra were recorded on a Varian Unity
(300 MHz or 500 MHz) using solvent peaks for general characterization. High resolution
mass spectrometry was performed using an Bruker BioTOF II instrument with PEG
(poly(ethylene glycol) as internal standard. Samples were prepared using methanol as the
carrier solvent and filtered through a PTFE (0.45 m) syringe filter before injection.
Calibration and analysis was performed using mMass open source mass spectrometry
tool.48

Chapter 5. Stability and cleavage kinetics of -azido ether
111
5.2.2 Synthesis
Figure 5-1. Synthetic scheme of -azido ether 1, azido-2-methoxy-1-(2-
methoxyethoxy)ethane.
(1,3-Dioxolan-2-yl)methyl benzoate synthesis (7). The compound was prepared
according to the method similar to that described by Parrish et al. with the following
modification.49
Benzoic acid (6 g, 49 mmol), 2-chloromethyl- 1,3-dioxolane (3 g, 24.5
mmol), and potassium carbonate (5 g, 36.75 mmol) were dissolved in 500 mL DMF and
stirred at 130 C for 120 h. The mixture was then cooled and DMF was removed through
vacuum distillation. Insoluble precipitates were dissolved in water and the aqueous layer
was extracted using ethyl acetate and washed with 5% LiCl solution. Organic layer was
dried over Na2SO4 and concentrated under reduced pressure to yield 3.6 g (70%). 1H
NMR (300 MHz, CDCl3, δ): 8.07 (m, 2H), 7.57 (m, 1H), 7.44 (m, 2H), 5.29 (t, 1H, J =
3.9 Hz), 4.38 (d, 2H, J = 4.0 Hz), 4.00 (m, 4H)
2-Azido-2-(2-hydroxyethoxy)ethyl benzoate synthesis (8). The (1,3-dioxolan-2-
yl)methyl benzoate (5 g, 24 mmol) was mixed with ZnCl2 (0.5 g, 3.4 mmol) under

Chapter 5. Stability and cleavage kinetics of -azido ether
112
nitrogen atmosphere for 15 min. Trimethyl silyl azide (TMS-N3) (4.2 g, 36 mmol) was
added to the mixture and the reaction was stirred for 24 h. Reaction mixture was
neutralized with saturated aq. NaHCO3, stirred overnight, and extracted with
dichloromethane (DCM). Organic layer was dried over Na2SO4 and concentrated under
reduced pressure to yield 5.4 g (90%) of a yellowish liquid product. 1H NMR (500 MHz,
CDCl3, δ): 8.06 (d, 2H, J = 7.8 Hz), 7.59 (m, 1H), 7.46 (m, 2H), 4.85 (dd, 1H, J = 4.88
Hz, 5.37 Hz), 4.48 (t, 2H, J = 4.9 Hz), 4.00 (m, 1H), 3.82 (m, 3H), 3.74 (m, 1H), 2.1 (br
s, 1H). 13
C NMR (125 MHz, CDCl3, δ) 166.22, 133.67, 130.01, 128.73, 89.51, 71.33,
65.04, 61.85. HRMS - ESI (m/z): [M + Na]+ calculated for C11H13N3O4, 274.0798;
observed, 274.0799.
Azido-2-methoxy-1-(2-methoxyethoxy)ethane (1). The compound was prepared
according to the method similar to that described by Johnstone et al. with the following
modification.50
Powdered potassium hydroxide (85%, 8.5 g, 0.129 mol) was dissolved in
25 mL DMSO for 10 min and 2-azido-2-(2-hydroxyethoxy)ethyl benzoate (3.2 g, 13
mmol) was added to the mixture. Immediately, iodomethane (9.1 g, 64 mmol) was added.
The mixture was stirred overnight and was dissolved in water. The aqueous layer was
extracted with DCM. The combined organic layers were washed with water and brine.
The organic layer was dried over Na2SO4 and concentrated under reduced pressure. The
product was purified by silica gel column chromatography (ethyl acetate:hexanes = 1:2)
to yield 1.59 g (70.6%) of a colorless liquid product. 1H NMR (500 MHz, CDCl3, δ): 4.62
(t, 1H, J = 1.07 Hz), 3.91 (m, 1H), 3.73 (m, 1H), 3.59 (m, 3H), 3.53 (m, 1H), 3.41 (s,
3H), 3.37 (s, 3H). 13C NMR (125 MHz, CDCl3, δ) 90.61, 73.60, 71.76, 68.77, 59.67,

Chapter 5. Stability and cleavage kinetics of -azido ether
113
59.25. HRMS - ESI (m/z): [M + Na] +
calculated for C6H13N3O3, 198.0849; observed,
198.0850.
Figure 5-2. Synthetic scheme of -azido ether 2, 2-azido-2-(2-hydroxythoxy)ethyl
phthalimide.
Phthalimido(1,3-dioxolan-2-yl)methane (9). Potassium phthalimide (50 g, 0.27
mol) was suspended in DMF (400 mL) and 2-chloromethyl-1,3-dioxolane (25 g, 0.2 mol)
was added to the mixture under constant stirring. The temperature of the mixture was
increased to 140 C and was stirred for 48 h under nitrogen atmosphere. The mixture was
then cooled to room temperature and poured on to 400 mL of cold water. The resulting
precipitate was filtered and washed with ethanol. The precipitate was purified by
recrystallization from ethanol to yield 43 g of white needle like crystals (92 %). 1H NMR
(500 MHz, CDCl3, δ) 7.82 (dd, J = 3.1, 5.4 Hz, 2H), 7.69 (dd, J = 3.1, 5.4 Hz, 2H), 5.21
(t, J = 4.8 Hz, 1H), 3.93 (m, 4H), 3.83 (d, J = 4.7 Hz, 2H). 13
C NMR (125 MHz, CDCl3,

Chapter 5. Stability and cleavage kinetics of -azido ether
114
δ) 168.11, 134.13, 132.10, 123.50, 100.76, 65.09, 40.22. HRMS - ESI (m/z): [M + Na]+
calcd for C12H11NO4, 256.0580; observed, 256.0572.
2-Azido-2-(2-hydroxythoxy)ethyl phthalimide (2). The compound was
synthesized as described above for 2-azido-2-(2-hydroxyethoxy)ethyl benzoate synthesis.
To phthalimido(1,3-dioxolan-2-yl)methane (47 g, 0.2 mol), TMS-N3 (70 g, 0.6 mol) was
added anhydrous ZnCl2 (0.04 mol, 5.5 g). The mixture was stirred overnight followed by
addition of NaHCO3 solution. After 2 h stirring, the products were extracted with DCM
and the organic layer was dried over Na2SO4 and concentrated. The product was obtained
as a white precipitate with 48 g (89%). 1H NMR (500 MHz, CDCl3, δ) 7.86 (dd, J = 3.1,
5.4 Hz, 2H), 7.74 (dd, J = 3.0, 5.5 Hz, 2H), 4.81 (t, J = 6.0 Hz, 1H), 3.93 (dd, J = 1.8, 5.4
Hz, 2H), 3.91 (m, 1H), 3.75 (m, 2H), 3.66 (m, 1H). 13
C NMR (125 MHz, CDCl3, δ)
168.13, 134.50, 131.92, 123.78, 89.06, 71.13, 61.72, 40.63. HRMS - ESI (m/z): [M +
Na]+ calculated for C12H12N4O4, 299.0751; observed, 299.0743.
Figure 5-3. Synthetic scheme of -azido ether 3, 2-(3-phthalimido(1-azidopropoxy))-
ethanol.

Chapter 5. Stability and cleavage kinetics of -azido ether
115
2-(3-Phthalimido(1-azidopropoxy))ethanol (3). The compound was synthesized
as described above for 2-azido-2-(2-hydroxyethoxy)ethyl phthalimide, where the 2-(2-
bromoethyl)1,3-dioxolane was used as the starting material. 1H NMR (500 MHz, CDCl3,
δ) 7.84 (dd, J = 3.4, 5.4 Hz, 2H), 7.72 (dd, J = 2.9, 5.4 Hz, 2H), 4.50 (dd, J = 5.4, 6.8 Hz,
1H), 3.89 (m, 2H), 3.82 (m, 1H), 3.74 (m, 2H), 3.61 (m, 1H), 2.63 (br s, 1H), 2.13 (m,
2H). 13C NMR (125 MHz, CDCl3, δ) 168.57, 134.36, 132.07, 123.57, 90.71, 71.02,
61.76, 33.97, 33.69. HRMS - ESI (m/z): [M + Na]+ calcd for C13H14N4O4, 313.0907;
observed, 313.0931.
5.2.3 Stability studies against hydrolytic degradation
For the stability studies, 50 mM of each chemicals were dissolved in D2O
(buffered pD 3.59, 7.00 and 10.19) and 1:1 of D2O:DMF-d7 for compound 1 and
compound 2 and 3, respectively. DSS (4,4-dimethyl-4-silapentane-1-sulfonic acid, 10
mM) was used as an internal reference.51
The concentration of the compounds was
monitored using 1H NMR, and the plot of ln([concentration]) versus time was fitted to
obtain the rate constant of hydrolysis. The area under the methyl proton peaks of DSS at
0 ppm was used as the reference concentration. Integration area under the peaks arising
from one of the methylene protons of 1 at 3.839 to 3.776 ppm was used for concentration
of compound 1. For compound 2, integration area under the peaks of methine proton
attached to the carbon bearing the azide, from 5.037 to 4.898 ppm, was used to calculate
the concentration. For compound 3, integration area under the peaks arising from the

Chapter 5. Stability and cleavage kinetics of -azido ether
116
methylene protons alpha position to the azide bearing carbon, from 2.206 to 2.030 ppm,
was used to calculate the concentration.
5.2.4 Kinetic studies of cleavage using DHLA triggers by UV-
Vis spectroscopy
For pH dependent experiments, phosphate (pH 6-8 and 11-13),
tris(hydroxymethyl)aminomethane (Tris pH 7-9), borate (pH 8-10), N-cyclohexyl-3-
aminopropanesulfonic acid (CAPS pH 11), carbonate (pH 9-11) and NaOH (pH 13) were
used to prepare buffered solutions. Stock solutions (200 mM) of azide compounds were
prepared by dissolving azide chemicals in water, and then the solutions were degassed by
blowing N2 gas. DHLA stock solution (40 mM) was freshly prepared by dissolving
DHLA into 40 mM of NaOH solution, and then degassed by blowing N2 gas. Kinetic
studies were initiated by addition of 500 uL azide solution into 1.5 mL mixture of 500 uL
DHLA and 1 mL buffer (200 mM) solution in a UV-Vis cuvette. Immediately, the
solutions were mixed and UV-Vis spectra were recorded at 25oC. (final concentration :
[DHLA] = 10 mM, [azide chemical] = 50 mM and [buffer components] = 100 mM)
Absorption values at 350 nm were used to calculate the concentration of lipoic acid (LA)
( = 102.65 M-1
cm-1
) using Beer’s law. Background correction, presumably, due to the
oxidation of DHLA, was done by subtracting the initial concentration of LA at 1.4 s. The
concentration versus time curves for appearance of LA were fitted to second order
integrated rate law equation having different initial concentration of reactants52
:

Chapter 5. Stability and cleavage kinetics of -azido ether
117
where a and b are initial concentrations of DHLA and azide species, respectively, and x is
concentration of LA. Linear curves were fitted to obtain slopes that were used to
calculate second order kinetic constants (k) up to ~50% conversion of DHLA.
For pseudo first order analyses, 2 mM DHLA was mixed with 10, 40, 50, 60, and
90 mM α-azido ether 1 at pH 9.90 and the rate constants were calculated under conditions
where b >> a, (b - a) = b and (b - x) = b in equation 1, resulting in the following
equation:
The rate constants were then plotted against the concentration of 1 to identify the
order of dependence on [1]. To identify the kinetic order of dependence on DHLA,
different concentrations of DHLA, from 1 mM to 5 mM, were reacted with 50 mM azide
compound 1 at pH 9.90. The initial rates were obtained from the [LA] vs time curves
(Δ[LA]/Δt) and then plotted against [DHLA]o to identify the order of dependence on
[DHLA].

Chapter 5. Stability and cleavage kinetics of -azido ether
118
5.2.5 Kinetic studies of cleavage using TCEP triggers by 1H-
NMR
Because TCEP oxide did not show distinct absorption peaks from that of TCEP,
1H-NMR was used to study kinetic of cleavage. Buffer solutions and TCEP stock
solutions were prepared in D2O and lyophilized to minimize the amounts of exchangeable
protons content and interference of data analysis from these protons. NMR samples were
prepared by mixture of 100 µL of 200 mM TCEP stock solution (with 4 equivalents of
NaOD to neutralize TCEP), 500 µL of 200 mM buffer, 100 µL of 100 mM DSS (with
one equivalent of NaOD) and 200 µL D2O in an NMR tube. For cleavage kinetic studies,
100 µL of 200 mM -azido ether compound 1 was added to the NMR tube. (Final
concentration: -azido ether compound 1 = 20 mM, TCEP = 20 mM, DSS = 10 mM, and
buffer component = 100 mM) Immediately, 1H-NMR spectra were recorded at different
time intervals. From NMR, the area under peaks arising from the methylene protons were
used to calculate the concentrations of TCEP and TCEP=O. For TCEP=O, area under the
peak from 2.19 to 2.06 ppm was used. For mechanistic analysis, NMR peaks arising from
intermediates appeared in a region overlapping the peaks from TCEP and TCEP=O. The
area of the intermediates was obtained by subtraction entire integration area from the
integration area of methylene of TCEP or TCEP=O in isolated peaks. The areas then
were used to calculate the concentrations of the intermediates. Two intermediates, I1 and
I2 were observed. For I1, area under the peaks from 2.47 to 2.32 ppm was used to
calculate the concentration. For I2, area under the peaks from 2.63 to 2.47 ppm was used.

Chapter 5. Stability and cleavage kinetics of -azido ether
119
5.2.6 Kinetic studies of cleavage using DHLA triggers by 1H-
NMR
A similar protocol of TCEP analysis was used for DHLA analysis. The only
difference being the amount of NaOD used was one equivalent instead of four. From
NMR, the area under peaks arising from methylene protons alpha to the terminal
thiol/thioether from 2.71 to 2.55 ppm and from 3.29 to 3.13 ppm were used to calculate
the concentrations of DHLA and LA respectively. For mechanistic analysis, area under
the peaks arising from the protons of methoxy group of the -azido ether from 3.44 to
3.42 ppm and from 3.37 to 3.35 ppm was used to calculate the concentrations of
intermediates.
5.2.7 Kinetic analysis
To analyze the data obtained from the kinetic studies, the plot of concentration
versus time was fitted to the following equations to obtain second order rate constants for
the consumption of reactant and formation of product:
where x and x0 are concentrations of TCEP or DHLA at time t and 0, respectively, and y
is concentration of TCEP=O or LA at time t.

Chapter 5. Stability and cleavage kinetics of -azido ether
120
5.2.8 pKa values of DHLA and TCEP
Proton NMR spectra at different pD were recorded to obtain the pKa value.
Chemical shifts of proton as a function of pD were fitted to obtain the pKa values using
nonlinear least-squares equation53
:
where δ(obs) is experimental chemical shift, δ(P) and δ(U) represent the chemical shift
corresponding to protonated and unprotonated states, respectively, and n is a Hill constant
reflecting the number of proton binding sites – it is fixed as one.
5.3 Results and Discussion
5.3.1 Stability against hydrolysis
For the practical applications of cleavable linkers, especially in biological
applications, they need to be stable in their application conditions before cleavage is
triggered. For -azido ether, Jencks et al. reported that the -azido ether degraded via
ionization to form oxocarbenium ions, followed by hydrolysis in aqueous solution
(Figure 5-4).44
Jencks et al. noted that pseudo first order rate constants ranged from 10-4
to 10-2
s-1
corresponding to less than 2 h of half life, indicating impractical use as a
cleavable linkers. However, the -azido ether has been currently involved in several
biological technologies, such as, the next generation DNA sequencing technology in the

Chapter 5. Stability and cleavage kinetics of -azido ether
121
market (Illumina Genome Analyzer)39,43
and DNA detection platform,40,54-56
requiring
longer half life. To solve this paradox, we have explored what factors make the stability
different based on chemical structure.
Figure 5-4. Mechanism of -azido ether degradation via oxocarbenium intermediate in
aqueous solution.44
The stability of -azido ether chemicals relies on the stability of oxocarbenium
ion intermediates that are governed by the nature of the substituents. For example, if the
oxocarbenium ion is destabilized by electronegative atoms like O or N at the gamma
position of the azido ether group, the formation of oxocarbenium ion would be forbidden
resulting in slower degradation of -azido ether chemicals. Such substituent effects have
also been observed for the hydrolysis of acetals that proceeds through the formation of
the same oxocarbenium intermediate.57
Based on this fact, we synthesized several model
chemicals varying atoms at the gamma position and studied their stability using 1H-NMR
(Figure 5-5 chemical 1-3). The degradation rate constants of each model chemical were
obtained from fitting the plot of ln[-azido ether] versus time (Figure 5-6). As expected,
-azido ether bearing electronegative atoms (O and N) at the gamma position showed 1.1
x 10-8
s-1
(1) and 2.8 x 10⁻⁹
s-1
(2) of first order rate constants, respectively, that had
values one or two order lower than that of -azido ether having C atom at the gamma

Chapter 5. Stability and cleavage kinetics of -azido ether
122
position, 1.0 x 10⁻⁷
s-1
(3). That means incorporating electronegative atoms instead of C at
the gamma position can significantly improve the stability from 76 d to 7.7 yr in terms of
half life.
Figure 5-5. Azide chemicals used to study hydrolytic stability (1-4) and reductive
cleavage of -azido ether (1) and its analogous (5 and 6).
In addition, the stability of oxocarbenium ion intermediate is affected by
hyperconjugation effects at the alpha position of the azido ether group. When a methyl
group was placed in the alpha position instead of a proton, the degradation rate increased
dramatically to 5.7 x 10⁻⁴
s-1
(chemical 4 in Figure 5-5) as reported by Jencks et al.44
because the oxocarbenium ion intermediate was stabilized by hyperconjugation of the
methyl group. Similar experimental results were reported from the acetal hydrolysis.57
In
the acetal hydrolysis, hyperconjugation significantly increased the hydrolysis rate of the
acetal group due to the stabilization of oxocarbenium ion intermediate.

Chapter 5. Stability and cleavage kinetics of -azido ether
123
Figure 5-6. Hydrolytic stability of -azido ether chemicals measured by 1H-NMR. The
degradation rate was obtained by fitting the data of ln([-azido ether]) versus time using
the first order rate equation. Chemical 1 was dissolved in several buffered solutions (pD
3.59, 7.00 and 10.19), which showed similar behavior. Here, pH 7.00 data was included.
Chemical 2 and 3 were dissolved in 1:1 of D2O and DMF-d7 because of solubility.
Therefore, the stability of -azido ether chemicals is able to be improved through
the modification of chemical structure by introducing electronegative atoms at the
gamma position as well as a proton at the alpha position. As a result, the degradation
without triggers can be minimized up to several years of half life, which allows the -
azido ether chemicals to be suitable for practical applications. Furthermore, any
significant difference in degradation was not observed in slightly acidic and basic
conditions through the study of pH effect on the stability of -azido ether chemicals
varying the pD of NMR solution to 3.59 and 10.19 containing -azido ether 1. It suggests

Chapter 5. Stability and cleavage kinetics of -azido ether
124
that the -azido ether could be used in any buffered solution for storage maintaining its
stability and have benefits for applications performed at various pH.
5.3.2 Cleavage of -azido ether using biocompatible triggers
To cleave the -azido ether, the azide group should be reduced to amine resulting
in rapid hydrolysis as well as cleavage. The reduction of azide has been well-established
in the field of synthetic chemistry and recently biological chemistry; for instance,
Staudinger reduction to introduce amine58-59
and Staudinger ligation to chemically link
two molecules,60-61
which has already been incorporated into in vivo bioconjugation.62-63
Particularly, Staudinger ligation has been of great interest because the reactions involving
an azide group are considered as bioorthogonal chemistry.14,37
Thus, incorporating azide
into cleavable linkers has advantages in terms of bioorthogonality, which gives rise to
controlled cleavage by external chemicals, compared to other cleavable linkers,1 such as,
hydrolytic cleavable ester, enzymatic cleavable peptide linker, and disulfide cleaved by
bio-abundant monothiols,64
which might be limited due to unwanted cleavage in
biological systems. The cleavage of -azido ether can also have an advantage in
controlled cleavage for in vivo applications, which might be difficult for photocleavable
o-nitrobenzyl ether31
because light does not penetrate tissues or skins beyond a couple of
hundred micrometers.36
Moreover, azide reduction has benefits with respect to another
bioorthogonal cleavable azo linker32
because the trigger for the -azido ether is stable
under physiological conditions. It should be noted that -azido ether can be developed as

Chapter 5. Stability and cleavage kinetics of -azido ether
125
a novel and versatile cleavable linker in various biological fields from in vitro to in vivo
applications with controllable and bioorthogonal characteristics.
Although the use of azide reduction would be superior to other cleavable linkers,
especially for in vivo applications, the reduction has not been widely used nowadays
because the slow kinetic of azide reduction has been a challenge to be solved.42
In
contrast, -azido ether has been getting attention for biological technologies as a
cleavable linker as mentioned before.39-40
However, the reduction conditions in those
biological technologies were somehow different from ordinary conditions; in the DNA
sequencing technology, the azide reduction was performed at high temperature like 60
C,
39 and in the DNA detection assays, the reduction was accelerated owing to rapid
DNA hybridization approaching -azido ether proximal to triggers.40
These facts
prompted us to study the cleavage kinetics to determine the actual rate of cleavage in
aqueous solutions. Also, we expected an improved rate compared to typical Staudinger
ligation because the electronegative O atom might affect the reduction rate.
Thus, the next step in understanding cleavage kinetics was to study the
experimental conditions required for an efficient cleavage in the presence of suitable
triggers. It is known that the azide can be reduced by biocompatible triggers including
dithiols or phosphines. For instance, dithiothreitol (dithiol) and triarylphosphines were
used previously to reduce azides in pharmaceutical compounds65-66
and reactants of
Staudinger ligation,60-61
respectively. Therefore, in our study, dihydrolipoic acid (DHLA),
which is a dithiol chemical, and TCEP, which is a phosphine chemical, were chosen as
triggers. We chose DHLA as a trigger because it is a naturally occurring antioxidant, and

Chapter 5. Stability and cleavage kinetics of -azido ether
126
is known to be biocompatible.67
TCEP was studied as well because it is water soluble and
biocompatible.68
Cleavage of -azido ether using DHLA triggers
DHLA is oxidized to form lipoic acid (LA) during the azide reduction. Because
LA is a cyclic disulfide that absorbs light at 334 nm,69
and no interference occurs in this
absorption peak from azides and cleaved products, the kinetics of the reaction between 1
and DHLA was studied by monitoring the formation of LA using UV-Vis spectroscopy.
The hydrolysis of α-amino ether after the reduction of the azide is expected to be
spontaneous. Consequently, the formation of LA could be considered as an indication for
completion of the reductive cleavage reaction.
Figure 5-7. Reaction between DHLA and -azido ether 1 to determine order
dependences of DHLA and -azido ether on cleavage, measured by UV-Vis
spectroscopy using LA absorption peak at 334 nm. Left: Initial rate (dx/dt) of LA
formation versus different initial concentration of DHLA with excess -azido ether 1.
Right: Plot of pseudo first order rate constants versus concentration of -azido ether 1.

Chapter 5. Stability and cleavage kinetics of -azido ether
127
It was reported that azide reduction using dithiols like DTT followed second order
kinetics with first order dependences on both the azides and DTT.66,70
Likewise, DHLA
can reduce azide with first order dependences on both the -azido ether and DHLA. As
the concentration of DHLA increased from 1 to 5 mM with constant 50 mM of 1, the
initial rate showed a linear relationship with respect to the concentration of DHLA
indicating a first order reaction of DHLA. Under pseudo first order reaction conditions
where 2 mM DHLA was reacted with excess concentration of 1 ranging from 10 to 90
mM, a linear curve was obtained indicating a first order reaction of -azido ether.
For the reduction reaction, we observed that the rate of reduction was changed
dependent on pH similar to previous report,71
i.e. the higher the pH, the faster the
reduction. The same pH dependence of reaction rate was also reported in several
reactions involving thiol or dithiol molecules, such as, thiol exchange reaction,72
thiol
oxidation by hydrogen peroxide,73
and DHLA and flavin reaction.74
Thus, we assumed
that active reactants using dithiols in the reduction would be deprotonated, thiolated
DHLA because the reaction required bases. Next, to study the influence of pH on the
reductive cleavage, the reaction between 1 and DHLA was performed in buffered
solutions of different pH. The concentration versus time curves for the formation of LA
were fitted to second order integrated rate equation and the values of the rate constants
(k) were calculated. The variation of the rate constant with pH was plotted as shown in
Figure 5-8. The second order kinetic constant relied on the pH of the solutions; 2~7 10-4
at lower pH like 6 or 7, abruptly increased from 0.04 M-1
s-1
at pH 9 to 0.22 M-1
s-1
at pH
10.6, leveled off up to pH 12.3, and decreased to 0.06 M-1
s-1
at pH 13.

Chapter 5. Stability and cleavage kinetics of -azido ether
128
To understand the origin of the dependence of k on pH, we have obtained the
NMR titration curve of DHLA, which has often been used to determine the pKa value of
chemicals.53
The behavior of the NMR titration curve was similar to that of the k curve
with respect to pH (or pD) below pH 13 (Figure 5-8). For example, a chemical shift of
methylene and methine protons in DHLA next to thiol group was abruptly decreased as
pD increased at around pD 9.8, which had a pKa value of DHLA from NMR titration
curves. That clearly indicated the reductive cleavage of -azido ether involved
deprotonated, thiolated DHLA, as we assumed. Although k values decrease at high pH (>
13), which is highly basic, the obtained k value under slightly basic conditions, for
instance 0.1 M-1
s-1
at pH 9.5, indicates -azido ether and DHLA can be applied to some
bio-materials. In addition, the results suggest that if dithiols would be chemically
modified to lower pKa value, the -azido ether linkers could play an essential role in
degradable bio-materials with relevant cleavage rate.
Furthermore, we compared the reduction rate of -azido ether with that of
typically used azido groups that have hydrocarbon at the alpha position to investigate the
effect of electronegative O on the rate. Model compounds 5 and 6 were synthesized and
their reduction by DHLA was studied (Figure 5-8). The reduction of all three compounds
showed similar pH dependences; the higher the k values, the higher the pH (< 13).
Primary and secondary azide analogs, 5 and 6, showed no significant difference in the
reduction rates, ranging from 3 10-4
M-1
s-1
to 0.05 M-1
s-1
. The highest observed second
order rate constants were 0.059 M–1
s–1
and 0.046 M–1
s–1
for 5 and 6, respectively, that
were about four times slower than the k value of -azido ether reduction. We believe that

Chapter 5. Stability and cleavage kinetics of -azido ether
129
the increased reactivity of -azido ethers could be a result of the presence of the
electronegative O, making azido more eletrophilic and facilitating the attack of
deprotonated DHLA on the azido groups.
Figure 5-8. Plot of second order rate constant (k) versus pH for the reaction between 50
mM azido compounds (-azido ether 1, primary azido 5 and secondary azido 6) and 10
mM DHLA in buffered aqueous solutions, measured by UV-Vis spectroscopy. Chemical
shift of methine proton of DHLA and its NMR titration curve dependent on pD were
included.
The reactions were then analyzed using 1H NMR spectroscopy to verify the
results obtained from UV-Vis experiments. Kinetic profiles were constructed from an
equimolar reaction between 1 and DHLA (Figure 5-9). The concentration of DHLA
decreased while the concentration of LA increased exponentially. The sum of both
DHLA and LA remained as constant, indicating no other intermediate of dithiol triggers
were formed during the reduction. The results were fitted using second order rate

Chapter 5. Stability and cleavage kinetics of -azido ether
130
equations to obtain rate constants (k) as 0.22 and 0.32 M–1
s–1
at pD 9.67 and 10.19,
respectively, which were consistent with the results from UV-Vis experiments.
Figure 5-9. Kinetic profiles of DHLA and LA concentration with respect to time for the
reaction between -azido ether 1 and DHLA, measured by 1H-NMR at pH 9.67 (left) and
10.19 (right). The sum of DHLA and LA concentration remained as constant. The plots
were converted to 1/concentration and fitted using second order rate equation to obtain
kinetic constants (k).
In addition to kinetic studies, mechanistic investigation was conducted for the
reaction between 1 and DHLA. Based on earlier reports70-71
on the reduction of azides by
thiols, the hypothesized mechanism for the cleavage of α-azido ethers using DHLA is
shown in Figure 5-10. After deprotonated, thiolate DHLA attacks azido, azido is reduced
by releasing nitrogen and DHLA is oxidized through the intramolecular cyclization to
form disulfide bond. The -amino ether is then hydrolyzed to cause cleavage. In the
NMR analysis, proton peaks arising from the methoxy groups of 1 and the intermediates

Chapter 5. Stability and cleavage kinetics of -azido ether
131
arising from its reaction with DHLA were used to follow the formation of intermediates.
Only one intermediate, presumably -amino ether, was observed and there were no
indications of any deviations from the suggested mechanism. Moreover, the decrease in
the reaction rates at high pH (> 13) could be explained by the suggested mechanism. The
formation of -amino ether should involve the protonation step of N that could become
difficult as the pH of the solution increases. It would lead to the observed decrease in
reaction rate at higher pH (> 13).
Figure 5-10. Suggested mechanism for the reductive cleavage of -azido ether using
DHLA trigger.
Cleavage of -azido ether using TCEP triggers
Although DHLA is effective to trigger the reductive cleavage of -azido ethers,
the cleavage might not have practical significance for most biological applications
because its rate is slow near neutral pH (kDHLA = ~7 x 10⁻⁴
M-1
s-1
), likewise, in
physiological conditions. It might be improved using chemically tailored dithiol triggers

Chapter 5. Stability and cleavage kinetics of -azido ether
132
that have a pKa value close to neutral or acidic pH.75-77
However, it requires additional
synthesis to investigate. Instead, we have tried to use commercially available reducing
reagents, which are better reducing agents for azide than DHLA. As mentioned,
phosphines can reduce azide even in neutral pH. Among phosphines, tris(2-
carboxyethyl)phosphine (TCEP) is chosen as a trigger because it has been a widely
utilized reducing reagent to cleave disulfide bonds in many biological applications as a
replacement for dithiols and is highly water soluble as well as resistant to oxidation.68,78
However, TCEP and TCEP=O, which is a product of the reduction reaction, do not have
interpretable absorption bands in the UV-Vis spectrum. As a result, the cleavage kinetics
of -azido ether reduction with TCEP has been studied using 1H NMR analysis rather
than UV-Vis spectroscopy, monitored by the consumption of TCEP and formation of
TCEP=O in buffered solutions of different pDs.
First, we fitted kinetic profiles of TCEP disappearance during an equimolar
reaction between 1 and TCEP using a second order rate equation to obtain the second
order rate constant (kTCEP). Similar to DHLA results, the rates relied on the pD; the lower
the pD, the lower the kinetic constant value (Figure 5-11). Also, its behavior resembled
the NMR titration curve, similar to DHLA results, indicating the pKa value of TCEP
affected the reductive cleavage of -azido ether. For example, the rate constant (kTCEP)
values increased from 0.04 M-1
s-1
at pD 6.5 to ~0.28 M-1
s-1
above pD 9, while the
chemical shift of the methylene proton in TCEP decreased from 2.4 ppm at pD 6.5 to
~1.7 ppm above pD 9 due to deprotonation of P at its pKa value (7.7). This fact indicated
that the initial step in the reaction mechanism would be the lone pair electrons on P attack

Chapter 5. Stability and cleavage kinetics of -azido ether
133
the azide group as well. Most importantly, when the TCEP trigger was used for the azide
reduction instead of DHLA, the rate was improved ~200 times from 4 x 10⁻⁴
M-1
s-1
to 7 x
10-2
M-1
s-1
at pH ~7 because of the trigger’s pKa shift from 10.0 to 7.7. The rate constant
was decreased at high pD (>~11), which might imply a rate determining step shift,
observed in the DHLA trigger.
Figure 5-11. Plot of second order rate constant and chemical shift versus pH or pD for
the reaction between -azido ether 1 and TCEP or DHLA. For TCEP, the rate constant
was obtained from TCEP consumption, measured by 1H-NMR. For DHLA, the rate
constant was obtained from the formation of LA, measured by UV-Vis spectrometry. The
NMR titration curve was constructed from the proton chemical shift of methylene protons
next to the P atom for TCEP and methine proton for DHLA, measured by 1H-NMR. The
arrow indicates that the trigger’s pKa value shifts from 10 to 7.7, which also causes the
rate constant curve to shift, improving the rate constant value at neutral pH (or pD).

Chapter 5. Stability and cleavage kinetics of -azido ether
134
In contrast to the second order rate of TCEP consumption, TCEP=O formation
showed different kinetic profiles as pD increased (Figure 5-12). Its behavior changed
from an exponential to a linear relationship between concentration and time, implying a
second order reaction and zero order reaction, respectively. For example, exponential
dependence was observed when pD was below 9 (Figure 5-12 A and B) while TCEP=O
formation became a linear dependence when pD was above 9 (Figure 5-12 C-E). That
meant at lower or netural pD -azido ether and TCEP reactions determined the entire
reaction of TCEP=O formation while at higher pD consecutive reactions through
intermediate I1 could occur to form TCEP=O, implying the rate determining step was
shifted. As a result, the second order rate constants (k2
TCEP=O) at lower pD showed
comparative values to kTCEP ranging from 0.15 to 0.50 M-1
s-1
as well as a similar trend to
kTCEP, increasing pD led to higher k values along with pKa. Above pD 9, zero order rate
constants (k0
TCEP=O) gradually decreased from 2.1 x 10⁻⁵
to 1.3 x 10⁻⁵
M s-1
with respect to
pD of solutions. Moreover, another parallel reaction pathway was observed even if this
pathway did not affect the TCEP=O formation significantly within the measured
timescale (1200 s). The parallel pathway went through minor intermediate I2 because
only 7 ~ 23% of I2 was produced compared to the initial TCEP concentration at ~1200 s
or at the time where major intermediate I1 reached the maximum concentration.

Chapter 5. Stability and cleavage kinetics of -azido ether
135
Figure 5-12. (A-E) Plot of kinetic profiles of TCEP, TCEP=O, intermediate I1 and I2
versus time for and eqimolar reaction between a-azido ether 1 and TCEP in buffered
solutions of pD (A) 6.88, (B) 8.07, (C) 9.67, (D) 10.74, and (E) 11.13, measured by H-
NMR spectroscopy. Exponential disappearance of TCEP was observed in every pD
solutions. But, the TCEP=O formation followed exponential appearance at lower pD, and
shifted then to linear dependence at higher pD with respect to the time. (F) Second order
rate constants (k2
TCEP=O M-1
s-1
) at lower pD from exponential disappearance of TCEP=O,
resulting from A-B and zero order rate constants (k0
TCEP=O M s-1
) at higher pD from linear
dependence of TCEP=O, resulting from C-E.

Chapter 5. Stability and cleavage kinetics of -azido ether
136
Although a zero order reaction has not been reported for TCEP=O formation in
the azide reduction by phosphines, to the best of our knowledge, we proposed a
mechanism to understand these observations as shown in Figure 5-13, based on our
results as well as previous reports79-81
on the reduction of azides by phosphines and
hydrolysis of iminophosphoranes in aqueous solutions. Because TCEP consumption
showed a second order reaction and pD dependence, deprotonated TCEP should react
with azide to form a phosphazide intermediate. After nitrogen was evolved immediately
to form iminophosphoranes (I), I was protonated to provide intermediate I1. I1 was then
transformed into I1’ by reaction with water. Next, after the equilibrium step of
protonation of I1’, TCEP=O and -amino ether were produced and -amino ether would
be cleaved via hydrolysis.
Typically, Staudinger reduction82-83
or ligation42
followed a second order reaction
because the rate determining step (RDS) was phosphines’ attack on azides. In -azido
ether reduction, at low pH (or pD, < 9) it would follow the same RDS, providing
exponential dependence of TCEP=O formation. However, at high pH (or pD, > 9) the
zero order rate of TCEP=O formation indicated that RDS should occur after the reaction
between -azido ether and TCEP.84
In addition, the zero order behavior was observed
above a certain pD, suggesting RDS had to involve protons. Based on these facts,
although the provenance of the intermediate was uncertain, we proposed that RDS might
be the protonation step of intermediate I1’ at higher pD. Because the concentration of
protons was maintained by the buffered solutions and the concentration of protons was

Chapter 5. Stability and cleavage kinetics of -azido ether
137
much less than that of I1’ above the certain pD, the rate of TCEP=O formation solely
relied on the concentration of protons. It provided zero order to both -azido ether and
TCEP as well as decreasing the rate constant with increasing pD. Our results also
suggested that the presence of free protons was essential to provide TCEP=O formation
and cleavage of -azido ether.
Figure 5-13. Proposed mechanism of the major reaction pathway for the reaction
between -azido ether 1 and phosphines in aqueous solutions.
In addition, a parallel reaction pathway through intermediate I2 was observed
irrespective of the pDs of the reaction even if it was minor (7 – 23 %). The concentration

Chapter 5. Stability and cleavage kinetics of -azido ether
138
of I2 increased without any relationship with I1, supported by the fact that concentration
of I2 leveled off while I1 was converted to TCEP=O when almost all of TCEP was
consumed in pD 10.74 at ~1000 s (Figure 5-12D). In addition, I2 eventually was
converted to TCEP=O after 1 d in NMR. The minor pathway did not exist in the
reduction of secondary azido chemical 6, implying electronegative O could play an
important role for the minor pathway. Based on these observations, although the identity
of intermediate I2 needs more investigation, we proposed the minor pathway involved the
cleavage of C-O bond before TCEP=O formation as shown in Figure 5-14.
Figure 5-14. Proposed mechanism of minor reaction pathway for the reaction between -
azido ether 1 and phosphines in aqueous solutions. Water (top) or lone pair electrons on
N (bottom) might provide intermediate I2 that was eventually converted to TCEP=O.

Chapter 5. Stability and cleavage kinetics of -azido ether
139
5.3.3 Cleavage products of -azido ether using triggers
The reductive kinetics of -azido ether has showed that it can be applied to
degradable biomaterials with relevant cleavage time scales when appropriate triggers
were used depending on the reaction conditions. Along with kinetics, it is also important
to study the products of the reductive cleavage because they would determine the
biocompatibility of the system. Although reactants are known as biocompatible, the
products of -azido ether have not been investigated but just been hypothesized as
alcohols and aldehydes until now.39-40
Here, we studied the products comparing H-NMR
of -azido ether 1 reduced by TCEP and its model compound.
The azide of 1 is reduced to an amine, followed by alcohol release and imine
formation that was hydrolyzed to aldehyde (Figure 5-15A). As a result, in the NMR
spectrum of cleavage products 2-methoxy ethanol was observed with two sets of triplet
peaks of methylenes (ii) at 3.56 and 3.71 ppm and a singlet methoxy peak (i) at 3.38 ppm
(Figure 5-15B). However, another expected product, aldehyde, was not observed. Instead,
2-methoxyethane-1,1-diol, hydrated form of aldehyde, was observed at neutral pD. The
hydrated form of aldehyde is also found in other aldehyde molecules, such as,
glutaldehyde85-86
and aliphatic aldehyde.87
The hydrated form was verified by comparing
the NMR obtained after the reductive cleavage of 1 to that of the model compounds, 2-
methoxyethane-1,1-diol, which was generated in the NMR solution after deprotection of
commercially available 1,1,2-trimethoxy ethane under acidic condition (Figure 5-15B). In
the NMR spectrum, there were peaks corresponding to triplet methine (a), doublet

Chapter 5. Stability and cleavage kinetics of -azido ether
140
methlyene (b), and singlet methyl (c) at 5.16, 3.43, and 3.39 ppm, respectively. The
adehyde was decomposed into unknown chemicals as pD increased above 9 due to the
observations of the disappearance of the triplet methine peak (a), which needs further
investigation for identification.
Based on the reports using -azido ether cleavable linkers in biological
technologies,39-40
the cleavage products could be biocompatible. Although aldehyde
functional groups can interact with amines to form imines, the imines are generally
hydrolyzed in aqueous solution to form carbonyl groups, especially, in aliphatic
aldehyde.37,88
In addition, aldehydes have been believed to be bioorthogonal functional
groups.37
Consequently, aldehydes were used for selective bioconjugation linkers through
oximes or hydrazones without significantly changing the functions of biological
molecules, suggesting aldehyde is one of the biocompatible functional groups. These
facts may imply biocompatibility of cleavage products from -azido ether reduction.

Chapter 5. Stability and cleavage kinetics of -azido ether
141
Figure 5-15. (A) Expected products from -azido ether 1 reductive cleavage. (B) 1H-
NMR spectra of cleavage products from the reaction between -azido ether 1 and TCEP
in different pD (10.19, 9.67, and 7.00) buffered NMR solutions. The alcohol product was
supported by the appearance of methoxy (i, singlet) protons at 3.38 ppm and methylene
(ii, triplet) protons at 3.56 and 3.71 ppm. Hydrated aldehyde was formed after the
reaction, supported by the peaks corresponding to triplet methine (a), doublet methlyene
(b), and singlet methyl (c) at 5.16, 3.43, and 3.39 ppm, respectively, at neutral pD. The
hydrated aldehyde was decomposed as the pD of the solution increased, supported by the
decrease of those peaks (a, b, and c).

Chapter 5. Stability and cleavage kinetics of -azido ether
142
5.4 Summary
We have studied the characteristics of a novel cleavable -azido ether linker and
its reductive cleavage in aqueous solutions using UV-Vis and NMR spectroscopy. The
hydrolytic stability of the -azido ether functionalized molecules can be improved up to
several years of half life by introduction of electronegative atoms (O or N) at the gamma
position and a proton at the alpha position. Nucleophilic attack of deprotonated dithiol or
phosphine triggers can initiate the cleavage of -azido ether, resulting from pH
dependence reaction rate. Although the results of the cleavage rate at neutral pH, which is
the most important value for biological applications, were not maximum values when
DHLA and TCEP were used as triggers, it could be improved by manipulating the pKa
value of triggers through chemical modifications75-77
up to ~0.2 M–1
s–1
. That means a
pseudo first order half life of -azido ether would reach to ~ 1 h when 1 mM trigger is
used, suggesting -azido ether can be developed as cleavable linkers for many in vitro
and in vivo biological applications. For example, cleavable linkers can be incorporated
into a degradable hydrogel matrix for in vitro applications, including cell cuture and gel
electrophoresis. Such linkers are also developed in in vivo degradable materials, such as,
drug delivery systems, tissue regeneration scaffolds, degradable sutures, and degradable
bioadhesives. In these applications, it would be anticipated to obtain a unique external
control over the cleavage and stability due to bioorthogonal properties of -azido ether
and its triggers. This is unique compared to currently available systems because -azido

Chapter 5. Stability and cleavage kinetics of -azido ether
143
ethers would be devoid of interference from environmental sources as they do not react
with endogenous reducing agents.

Chapter 6. Degradable PAGE using -azido ether
144
Chapter 6. Degradable Polyacrylamide Gel
Electrophoresis Using Cleavable -Azido
Ether for Efficient and Facile Recovery of
Biological Molecules
6.1 Introduction
A crosslinked polymeric network is a structure in which polymers are connected
through covalent or physical crosslinking. The polymeric network has been remarkably
used in various applications, such as, stimuli-responsive particles or gels,1 novel hybrid
materials,2-3
and protective outer layers.4-6
The development of the polymeric networks in
aqueous media has brought crosslinked hydrophilic polymeric networks called hydrogels,
which contain substantial amounts of water in its network.7 Many natural
8 and synthetic
9-
10 polymers can be used to construct networks and their properties, such as, mechanical
strength, viscoelasticity, and pore size, can be manipulated,11-14
because of which they
have become exceptional tools in numerous biological applications; a scaffold to mimic
artificial extra-cellular matrix for 3D cell culture and tissue engineering,15
a cargo to
deliver toxic drugs or genes into a cell without side-effects,16
and an inert matrix for the
separation of biological molecules to analyze biological components and functions.17
The
hydrogel has historically been a part of a well-developed and ubiquitous biological

Chapter 6. Degradable PAGE using -azido ether
145
technique, called gel electrophoresis.18
The hydrogel serves as an inert matrix for the
electrophoretic separation of biological molecules depending on their migration length.
Based on this technique numerous biological mysteries have been deciphered19-20
; for
example, protein molecular weight, subunit composition, protein-protein interaction and
amino acid sequence in conjunction with mass spectrometry have been conducted; size of
a nucleic acid and its fragments, its sequence information, and nucleic acid-protein
interaction have also been analyzed.
The gel matrix for the electrophoresis can be synthesized using physical or
chemical crosslinking in an agarose21
or a polyacrylamide (PAAm)22
gel, respectively. In
common, the agarose gel has a larger pore size being suitable for larger biological
molecules like DNA, while the PAAm gel has been used for mainly proteins due to its
smaller pore size. However, nucleic acids are often analyzed using PAAm gels when high
resolving power is required, leading to extremely pure molecules.23
In gel
electrophoresis, gigantic biological molecules are separated by charge, size, and shape.24
The separated biological molecules are then frequently recovered for in-depth analysis,20
such as, activity study,25
a protein crystallization,26
biological assembly study,27
and a
template for a biological reaction.28
Current methods for the recovery, including passive extraction and electroelution,
often have limitations due to low yield and more effort using additional
instrumentation.20,29-31
Therefore, it is necessary to develop a better solution. There is a
chemical solution to improve the recovery without any instrumentation. Chemical
modification of a crosslinker promises gel degradation by chemical treatment, which

Chapter 6. Degradable PAGE using -azido ether
146
makes biological molecules free in the solution, leading to a more efficient and facile
recovery.29-30
Based on this idea, there were attempts to incorporate cleavable functional
groups into the crosslinker, including 1,2-diol,32-33
ester,34-37
acetal,29-30
and disulfide.38-41
However, almost all cases require harsh cleavage conditions (i.e. 2% periodic acid, 1M
NaOH, or pH < 5 acidic solution) that lead to irreversible damage to biological
molecules. Although disulfide may be suitable as the cleavable linker because of mild
cleavage condition (2% -mercaptoethanol), the gelation requires careful temperature
control to prevent C-S link formation due to a thiyl radical (RS·) in the radical
polymerization of PAAm.39
We have developed an -azido ether cleavable linker that is a bioorthogonal,
chemically cleavable in mild cleavage conditions as well as having relevant cleavage
timescale as described in the previous chapter. As a result, we replaced the Bis with a
crosslinker containing -azido ether (N3EG2), synthesized a degradable PAAm gel for
gel electrophoresis, and recovered biological molecules by gel degradation after
polyacrylamide gel electrophoresis (PAGE) as shown in Figure 6-1. Because our -azido
ether can be cleaved using mild and biocompatible conditions, we believe that the
degradable PAGE using the -azido ether functionality could improve upon the existing
methods. Here, we showed a proof-of-concept for the recovery of biological molecules
using the degradable PAGE synthesized from acrylamide and -azido ether crosslinker.
The recovery profiles of model biological macromolecules (proteins and DNA) from the
PAAm gel matrix were obtained by measuring fluorescence or absorption to investigate
how fast biological molecules were recovered. Furthermore, microRNA model molecules

Chapter 6. Degradable PAGE using -azido ether
147
were recovered and isolated through the degradable PAGE, and electrophoresed again to
verify the success of the degradable PAGE.
Figure 6-1. A schematic illustration of a degradable polyacrylamide gel electrophoresis
(PAGE) using a -azido ether crosslinker (N3EG2). A polyacrylamide gel (PAAm) was
synthesized through a radical polymerization of acrylamide monomers and N3EG2
crosslinkers using APS/TEMED initiation system in aqueous solution. After biological
molecules, such as, proteins, DNA, and RNA, are loaded on the top of the PAAm gel, the
biological molecules are separated by gel electrophoresis. The gel containing the
biological molecules is excised and embedded molecules are recovered from the gel in
mild, biocompatible degradation conditions (TCEP solution).

Chapter 6. Degradable PAGE using -azido ether
148
6.2 Experimental Methods
6.2.1 General
TCEP was purchased from Thermo Fisher Scientific, Inc. (Rockford, IL) and
deuterated NMR solvents were purchased from Cambridge Isotope Laboratories, Inc.
(Andover, MA). DNA and RNA ladder were purchased from New England BioLabs, Inc.
(Ipswich, MA). SYBR Green I and II dyes were purchased from Invitrogen (Carlsbad,
CA). B-phycoerythrin fluorescent protein (B-PE, 240 kDa, ex 490-560 nm, em 575 nm)
was purchased from Enzo Life Sciences (Farmingdale, NY). All other reagents were
purchased from Aldrich (St. Louis, MO) unless otherwise noted. Tetramethylethylene-
diamine (TEMED) was purified using distillation after refluxing in the presence of
sodium for 2 h. Ammonium persulfate (APS) was recrystallized from water/EtOH
mixture (30 g in 50/60 mL) by chilling the solution in a salt/ice bath. A GFP encoded
plasmid was grown with shaking overnight at 37 oC
42 and the plasmid was purified using
a QIAprep spin miniprep kit according to the manufacturer’s manual (Qiagen,
Germantown, MD). MicroRNA (400 nt) was synthesized according to the procedure
similar to that described by Seelig.28
Acryamide solution (40 %) and ethidium bromide
solution were purchased from Bio-rad (Hercules, CA). SequaGel Sequencing system kit
for 7.5 M urea denaturated PAGE was purchased from National Diagnostics
(Mississauga, ON). Ultrapure water was generated from a Milli-Q water purification
system (Millipore Inc.; Billerica, MA, R > 10 MΩ•cm). UV-Visible absorption spectra
were obtained on a Hewlett-Packard 8453 UV-Vis spectrophotometer (Palo Alto, CA) or

Chapter 6. Degradable PAGE using -azido ether
149
a Nanodrop 2000C (Thermo Scientific, Wilmington, DE). PD-10 desalting columns were
purchased from GE Healthcare (Pittsburgh, PA). 1H NMR spectra were recorded on a
Varian Unity (500 MHz) using a solvent peak as an internal standard.
6.2.2 Synthesis
Figure 6-2. Synthetic scheme for -azido ether crosslinker, N3EG2.
N-(2-(2-Phthalimido(1-azidoethoxy))ethyl)phthalimide (3). Phthalimido(1,3-
dioxolan-2-yl)methane (1, 44 g, 0.16 mol) was dissolved in dichloromethane (500 mL)
and placed under nitrogen flow for 15 min on an ice bath. Pyridine (20 mL, 0.25 mol) and
methanesulfonyl chloride (20 mL, 0.25 mol) were added slowly under constant stirring.

Chapter 6. Degradable PAGE using -azido ether
150
After stirring for 15 min, a nitrogen balloon was affixed and the mixture was allowed to
warm room temperature, and stirring was maintained overnight. After this period, water
(500 mL) was added to the reaction mixture and stirred for 2 h to remove any unreacted
pyridine. The aqueous layer was removed and the organic layer was washed thrice with
saturated aqueous sodium bicarbonate solution (500 mL) and once with brine (500 mL).
The organic layer was dried with sodium sulfate and concentrated under reduced pressure
to produce yellow oil in quantitative yield. The yellow oil (2, 55 g, 0.16 mol) was
dissolved in dimethylformamide (500 mL). Potassium phthalimide was added, and the
mixture was heated to 75 oC and stirred overnight under nitrogen atmosphere. The
reaction mixture was cooled to room temperature and poured on to cold water resulting in
a white precipitate. The precipitate was filtered and washed with ethanol. The product
was purified by recrystallization from DMF/water solvent mixture to result in white
granular crystals (51 g, 78 % yield). 1H NMR (500 MHz, CDCl3, δ) 7.78 (m, 4H, Ar-H),
7.70 (m, 4H, Ar-H), 4.81 (t, 1H, J = 6.2 Hz, CHN3), 4.07 (m, 1H, OCH2), 3.94 (m, 1H,
OCH2), 3.83-3.92 (m, 4H, OCH2 and NCH2)
2-(2-Aminoethoxy)-2-azidoethanamine (4). N-(2-(2-Phthalimido(1-azido-
ethoxy))ethyl)phthalimide (3, 25 g, 62 mmol) was suspended in 0.3 M methanolic
hydrazine (150 mL) and refluxed for 2 h. Aqueous hydrochloric acid (5 %, 100 mL) was
then added to the solution resulting in the formation of a white precipitate. This
suspension was then refluxed for 12 h. Insoluble components were filtered off after
acidifying the mixture and the aqueous solution was washed twice with DCM (50 mL).
Solid KOH was added to the aqueous solution to make the solution basic (pH > 10). The

Chapter 6. Degradable PAGE using -azido ether
151
basic solution was then extracted with DCM. The organic layers were combined, dried
using sodium sulfate and concentrated under vacuum to produce a yellow oil (5.5 g, 61
%). 1H NMR (500 MHz, CDCl3, δ) 4.43 (t, J = 5.3 Hz, 1H, CHN3), 3.86 (m, 1H, OCH2),
3.59 (m, 1H, OCH2), 2.94 (m, 4H, NCH2), 1.37 (s, 4H, NH2).
N-(2-(2-acrylamido-1-azidoethoxy)ethyl)acrylamide – N3EG2. The crosslinker
(N3EG2) was prepared according to the method similar to that described by Delgado et al.
with the following modification.43
2-(2-Aminoethoxy)-2-azidoethanamine (4, 2.23 g,
15.4 mmol) in 60 mL acetonitrile was slowly added dropwise to a solution of acryloyl
chloride (1.4 mL, 17.2 mmol) in 90 mL acetonitrile in an ice bath under nitrogen,
resulting in the formation of yellow precipitates. The reaction mixture was warmed to
room temperature and stirred overnight. The precipitates were filtered and washed with
warm acetonitrile. The filtrates were stabilized by addition of 0.1 mL MEHQ (methyl
ether hydroquinone, 10 mg / 1 mL methanol). The solution was concentrated to a few mL
and remaining salts were removed by short (~2 cm) silica gel filtration using ethyl acetate
washing. The solution was concentrated and the product was purified by silica gel
column chromatography using ethyl acetate as eluents (Rf = 0.43, 634.5 mg, 29 %). The
product N3EG2 was dissolved in degassed water with trace amounts of MEHQ and stored
at -20 oC.
1H NMR (500 MHz, CDCl3, δ) 6.33 (m, 2H, CH2=CH), 6.17 (m, 2H,
CH2=CH), 6.13-6.05 (br, 2H, CONH), 5.70 (m, 2H, CH2=CH), 4.64 (t, J = 5.3 Hz, 1H,
CHN3), 3.93 (m, 1H, OCH2), 3.71 (m, 3H, OCH2CH2), 3.49 (m, 2H, NCH2).

Chapter 6. Degradable PAGE using -azido ether
152
6.2.3 Polyacrylamide gel electrophoresis
Degradable polyacrylamide gel using the N3EG2 was prepared according to the general
protocols for conventionally available non-degradable polyacrylamide gel using the Bis
crosslinker The degree of monomers and crosslinkers was regulated by parameters; the
percentage of total monomers including crosslinkers (%T) and the crosslinker percentage
(%C) according to the equations,
The gelation was initiated by a radical polymerization from TEMED (0.1 %) and APS (1
%) system and continued for about 1 - 2 h. Before samples were loaded, pre-
electrophoresis was conducted for 15 – 30 min.
Native protein PAGE. Conventionally developed polyacrylamide gels (37.5:1
gel) were used for native protein PAGE. For comparison to the conventional gel, the mol
ratio of a N3EG2 crosslinker was adjusted to that of the conventional gel. Gels were
prepared from 10/4.3 (%T/%C) of total monomers and N3EG2 crosslinkers for the
degradable PAGE and 10/2.6 (%T/%C) of total monomers and Bis crosslinkers for a
control experiment in Tris·Cl buffers (pH 8.8 for a separating gel and pH 6.8 for a
stacking gel). Gel electrophoresis was performed under the Tris-glycine (25 mM Tris and
192 mM glycine, pH 8.3) native running buffer. Samples were prepared by diluting B-PE
and ferritin in 1x Tris/glycerol loading buffer (62.5 mM Tris and 10 % glycerol, pH 6.8).
After the pre-electrophoresis at 120 V, samples were added to wells (30 L of 0.8 mg/mL

Chapter 6. Degradable PAGE using -azido ether
153
B-PE or 2 mg/mL ferritin). The electrophoresis was then performed for 2 h at 120 V.
Because the proteins had pink (B-PE) and brown (ferritin) colors, without a staining step
the migrated protein bands were carefully excised using a razor. The proteins in the
excised bands were used for the recovery study.
Native DNA PAGE. The native DNA PAGE was performed using a similar
method as described above for the native protein PAGE with modifications. Gels were
prepared from 5/5 (%T/%C) of total monomers and N3EG2 crosslinkers for the
degradable PAGE and 5/3.6 (%T/%C) of total monomers and Bis crosslinkers for the
control experiment in 1x TBE buffers (Tris-borate-EDTA pH 8.0, 89 mM Tris, 89 mM
borate, and 2 mM EDTA). Gel electrophoresis was performed under 1x TBE buffer.
Samples were prepared by diluting 1kb DNA ladder and GFP plasmid in 1x DNA loading
buffer (5 % glycerol). After the pre-electrophoresis at 100 V, samples were added to
wells (6 L of 417 g/mL 1kb DNA ladder or 15 L of 37.5 g/mL GFP plasmid). The
electrophoresis was then performed for 1 h 40 m at 100 V. Next, the gels were stained
using ethidium bromide solution (0.5 g/mL) or 1x SYBR green I solution. The ethidium
bromide stained gel were imaged using a Bio-Rad Molecular Imager FX. The migrated
green fluorescent DNA bands from SYBR green I staining were carefully excised using a
razor under UV light illumination, which were used for the recovery study.
Denaturating urea RNA PAGE. The denaturating urea PAGE was performed
for RNA sample using a similar method as described above for the native DNA PAGE
with modifications. Conventional gels were prepared from 4/5 (%T/%C) of total
monomers and Bis crosslinker using denaturating 7.5 M urea SequaGel kits in 1x TBE

Chapter 6. Degradable PAGE using -azido ether
154
buffers. Degradable urea gels were prepared from 4/8 (%T/%C) of total monomers and
N3EG2 crosslinker using denaturating 7.4 M urea gel in 1x TBE buffers. Gel
electrophoresis was performed under 1x TBE buffer. RNA sample was prepared by
diluting microRNA in 1x loading buffer (1.2 g/L, 3 % ficoll). After the pre-
electrophoresis at 20 W for 30 m, 4 or 12 L of microRNA samples were added to wells.
The electrophoresis was then performed for 1 h at 150 V. Next, the microRNA bands
were visualized by UV-shadowing method44
and carefully excised using a razor under
UV light illumination on a silica plate. The excised gels were stored at -70 oC.
6.2.4 Recovery of biological molecules
The biological molecules were recovered from the N3EG2 gels into the solution by
degradation through reductive cleavage of N3EG2 crosslinker. The degradation of N3EG2
gels was performed using TCEP/TE solution (condition i). The recovery profiles of
biological molecules were measured by fluorescence (B-PE and DNA) or UV-Vis
(ferritin) spectrophotometry. For controls, recovery profiles of degradable N3EG2 and
non-degradable Bis gels were obtained using TE solution (condition ii) and TCEP/TE
solution (condition iii), respectively.
Proteins recovery. The excised N3EG2 band of the B-PE protein were placed in a
capped fluorescence cuvette and 3 mL of 10 mM TCEP/TE for the degradation sample (i)
or 10 mM TE for the control sample (ii) were then added to the cuvette (pH 8.0). In
addition, the Bis band of the B-PE protein was mixed with 10 mM TCEP/TE for control

Chapter 6. Degradable PAGE using -azido ether
155
sample (iii). The samples were then incubated at room temperature. Fluorescence data of
solutions, where the gels were settled down on the bottom of the cuvette, were collected
by a Quantamaster fluorimeter (PTI, London, Ontario; λex = 475 nm) using an excitation
optical filter (FF01-492/SP-25, Semrock) to eliminate scattered light. Along with
fluorescence data collection, fluorescence images of the gels in a 24-well plate were
taken using a digital camera with bench-top UV-lamp illumination. After overnight
incubation, the degradable gel (i) was not solubilized, leaving swelled gel without B-PE
pink color in the gel. The B-PE protein was then isolated physically from the gel matrix
and further purified by a PD-10 desalting column, in which each fraction (1 mL) was
measured by a fluorimeter.
Ferritin samples were prepared the methods similar to that described in B-PE
protein samples. Instead of fluorescence collection, UV-Vis absorption data of solutions,
where gels were settled down on the bottom of the cuvette, were collected by HP 8453
UV-Vis spectrophotometer. After 24 h incubation, the brown band was disappeared. The
ferritin protein was then isolated physically from the gel matrix and further purified by a
PD-10 desalting column, in which each fraction was measured by UV-Vis
spectrophotometer.
DNA recovery. The GFP plasmid band was handled similar to the method
described in B-PE protein sample handling with modification. The solution contained 1x
SYBR green I dye to quantify the DNA using fluorescence intensity of intercalated
SYBR green I45
. The temperatures of the cuvette were controlled in a water bath at 37 oC
and ~50 oC. Fluorescence data of solutions, where gels were settled down on the bottom

Chapter 6. Degradable PAGE using -azido ether
156
of the cuvette, were collected by the PTI fluorimeter (λex = 470 nm) using optical filters
(FF01-492/SP-25 and BLP01-488R-25, Semrock) to eliminate scattered light. At each
time of fluorescence measurement, the green fluorescence from DNA was imaged by a
digital camera with bench-top UV-lamp.
MicroRNA recovery. MicroRNA was recovered by degradation of N3EG2 gel
using TCEP solution and then isolated from the solution using TRI reagent extraction,
followed by Qiagen RNeasy MinElute Cleanup Kit or LiCl precipitation46
. For the
extraction method, a gel was placed in a 1.5 mL tube, crushed using a plastic pipette tip,
and then added 400 L of 10 mM TCEP/TE buffer (pH 7.0). The tube was incubated at
80 oC for ~ 1 h with occasionally vortex. After completely degradation of the N3EG2 gels,
700 L of TRI reagent and 140 L of chloroform were added. After vortex, the tube was
centrifuged and the top layer was transferred into a new tube. The solution was mixed
with 400 L of ethanol and purified using Qiagen RNeasy MinElute Cleanup Kit
according to the manufacturer’s manual without addition of RLT buffer. The isolated
microRNA was quantified by Nanodrop 2000C (Thermo Scientific, Wilmington, DE).
For the LiCl precipitation, five N3EG2 gels were placed in a 1.5 mL tube, crushed
using a plastic pipette tip, and then added 500 L of 20 mM TCEP/TE buffer (pH 7.0).
The tube was incubated at 80 oC for ~ 1 h with occasionally vortex. After completely
degradation of the N3EG2 gels, 500 L of 8 M LiCl was added and the solution was then
incubated at -20 oC for 45 m. Next, the solution was centrifuged at 4
oC for 15 m and
supernatant was discarded carefully. MicroRNA was then washed with 400 L of 70 %
EtOH using centrifugation and supernatant removal. After a white pellet of microRNA

Chapter 6. Degradable PAGE using -azido ether
157
was dried for 5 m, the microRNA was dissolved in 20 L H2O. The isolated microRNA
was quantified by Nanodrop 2000C (Thermo Scientific, Wilmington, DE). The isolated
microRNA was further analyzed using conventional Bis PAGE with a RNA ladder. After
the electrophoretic separation, microRNA was stained using 1x SYBR green II dye and
imaged by C-80 Epi-illumination UV Darkroom (UVP, LLC, Upland, CA).47
6.2.5 Expected degradation fraction of N3EG2
The degradation fraction of N3EG2 can be theoretically calculated using a mixed
second order rate equation developed by Micheau et al..48
When the concentration of
reactants (A and B) is different and a second order rate constant (k) is known, the fraction
of B, which is lower amounts in reactants, can follow the equation;
In our experiment, TCEP concentration corresponds to A0 due to excess amount used.
The concentration of N3EG2 can be estimated from a gel size and a volume of TCEP
solution. The gel size was assumed as 1 x 1 x 0.1 cm, resulting in 0.1 mL of volume.

Chapter 6. Degradable PAGE using -azido ether
158
6.3 Results and Discussion
6.3.1 Synthesis
Acrylamide groups were simply introduced into a crosslinker by reacting between
acryloyl chlorides and an amine functionalized -azido ether. The amine functionalized
-azido ether was initially synthesized through a benzoate protected -azido ether
followed by basic deprotection and Gabriel synthesis using a mesylate as an alternative to
a halide49
(Figure 6-3). However, the chemicals involved in this reaction scheme were a
liquid being difficult for purification via recrystallization. Moreover, ring formation
occurred during the deprotection of benzoate group lowering yield and purity. In contrast,
when a phthalimide protected amine was used instead of a benzoate protected alcohol,
developed by Ramasubramanian in Taton group, solid compounds were formed resulting
in better yield and facile purification method via recrystallization. In the step of the
N3EG2 crosslinker synthesis (acrylamide formation), a diamine -azido ether was used as
base, similar to procedure reported previously,43
rather than use of additional bases like a
triethylamine.50
When the triethylamine was included in the reaction, there were always
more unknown byproducts produced, leading to difficult purification and lower yield,
compared to the developed procedure. The N3EG2 crosslinker was stabilized with BHT or
MEHQ radical inhibitor to prevent from air polymerization during storage.

Chapter 6. Degradable PAGE using -azido ether
159
Figure 6-3. Initially designed synthetic scheme for a N3EG2 crosslinker through a
benzoate protected -azido ether.
6.3.2 Degradable polyacrylamide (PAAm) gelation
From the literature, it was reported that an azido group could react with an olefin
to form a cycloaddition product.51-52
As a consequence, there were a few reports in which
an azide in a controlled radical polymerization reacted with an electron poor olefin, such
as, an acrylate or an acrylamide monomer to produce cycloaddition products.53-55
However, this cycloaddition reaction became negligible when the reaction was performed
below 50 oC.
53,56 The well-controlled polymerization was obtained at 30
oC or room
temperature using azide functionalized methacrylate53,56
or N-isopropylacrylamide57
monomers without any side reaction. In addition, an acrylamide monomer showed a
lower reactivity for the cycloaddition than an acrylate monomer due to more electron

Chapter 6. Degradable PAGE using -azido ether
160
deficient double bond characteristics of the acrylate monomer, indicating that a
successful radical polymerization could be achieved using the acrylamide monomers.55
Moreover, Young in the Taton group has synthesized a degradable hydrogel using -
azido ether functionalized macromers and showed its degradation by chemical triggers.58
Therefore, the degradable PAAm gel was prepared by a radical polymerization of
acrylamide monomers and the N3EG2 crosslinker using a catalyst-redox system of
peroxide-amine (APS-TEMED) in aqueous solution, which is one of the widely used
systems in PAGE.24
Tertiary amines like TEMED were frequently used in the radical
polymerization to accelerate a free radical formation from peroxides even in room
temperature.59-60
Although it seemed that the efficiency of N3EG2 crosslinker in the
radical polymerization was little bit lower than that of Bis because the duration of gel
casting needed more time than conventional Bis, a transparent N3EG2 functionalized
PAAm gel was obtained after 1 h or more gelation, having similar appearance to that of
the conventional PAAm gel. For the comparison to the conventional Bis gel, the molar
ratio of a monomer to a crosslinker (N3EG2 or Bis) was adjusted. It should be noted that
the gel can be casted without any detrimental effect, which was reported in the gel casted
from a disulfide crosslinker due to the formation of RS· radical.39
6.3.3 Degradable native protein PAGE
The degradable native PAGE for protein recovery was performed to investigate
how efficient and fast gigantic proteins were recovered from the gel into solution. The gel
Chapter 6. Degradable PAGE using -azido ether
161
concentration was adjusted to that of conventionally developed materials, 2.6 %C of Bis
crosslinker (16.9 mM). For the comparison of recovered proteins out of the degradable
gel, the same molarity of N3EG2 crosslinker was used to cast the degradable gel, leading
to 4.3 %C of N3EG2. B-phycoerythrin fluorescent protein (240 kDa, pI ~4.2–4.4)61-62
and
ferritin (440 kDa, pI ~4.5)63-64
were chosen as model proteins because they are
commercially developed as biomarkers in a native protein ladder, more importantly, and
have a color band giving facile visualization and tracking. During the native protein
PAGE, B-PE bands were moved further than ferritin, mainly due to larger size of ferritin.
After the electrophoretic separation, each protein was recovered out of the gel matrix by
reductive cleavage of -azido ether using 10 mM TCEP solution and the amounts of
recovered protein were monitored.
The recovery profile of B-PE from the degradable N3EG2 gel with TCEP (i) was
measured using fluorescence intensity in the solution. For control samples, the
degradable N3EG2 gel and the conventional, non-degradable Bis gel were prepared and
incubated in non-degradable (without TCEP, ii) and degradable (with TCEP, iii) solution,
respectively. The B-PE was recovered from the gel gradually in all conditions, i - iii. But,
the recovery of B-PE was faster in the degradable N3EG2 gel with the TCEP trigger (i),
compared to control samples (ii and iii) as shown in Figure 6-4A. For example, the
recovery amounts of B-PE using condition i was 1.5 and 1.7 times higher than that of
condition ii and iii, respectively. The recovery profile of B-PE in the condition i was
almost leveled off at 5 h and reached to maximum at 8 h, suggesting quantitative
recovery of B-PE.

Chapter 6. Degradable PAGE using -azido ether
162
Consistent results were obtained from fluorescence images although these did not
give quantitative results (Figure 6-4C). As incubation time increased, the fluorescence
intensity became fainted and disappeared at 8 h in the degradable N3EG2 gel with the
TCEP trigger (i), similar to the results from the recovery profile. For the N3EG2 gel
without the TCEP (ii), although the fluorescence intensity became weaker with increasing
incubation time, the fluorescence intensity was always relatively stronger than that of
condition i as well as the fluorescence band was observed even at 17 h. On the other
hand, the fluorescence intensity of iii was always the most intense over the entire
experimental timescale.
We believed that the cleavage of N3EG2 led to degradation of the gel, leading to
larger pores in the matrix through which more proteins diffused out. It caused the most
increase fluorescence of the recovery profile (Figure 6-4A) and the most fainted pink
band in the gel (Figure 6-4C) in the condition i. The result from the condition ii showed
faster recovery compared to iii, presumably, due to longer and hydrophilic N3EG2 that
absorbed more water. It caused the extended matrix to have larger pore sizes than that of
the Bis gel. The observations indicated that when the degradable gel in the presence of
the trigger (i) was used, faster and quantitative recovery of protein could be obtained,
although the gel was not solublized within the experimental timescale.
In fact, non-solubilization resulted in efficient and facile isolation of B-PE from
the gel matrix physically. Furthermore, small molecules like TCEP=O (oxidized TCEP
by-products) were excluded using a desalting column in 1 - 3 mL elution volume (Figure
6-4D). It should be noted that the results might show that the degradable condition (i)

Chapter 6. Degradable PAGE using -azido ether
163
would be biocompatible because the fluorescence of B-PE did not change during the
entire experiments.
Next, ferritin, which is a bigger protein, was used for recovery because it was
expected to have slower diffusion and lower recovery yield. Similar to the results of B-
PE, the recovery rate of ferritin in condition i was 1.7 and 3.0 times faster than that of the
condition ii and iii, respectively (Figure 6-4B). After 24 h incubation, ferritin was still
embedded in the gel in both of ii and iii while all ferritin was recovered in condition i
because no more color band was left in the gel. Ferritin was further isolated from the gel
matrix and small molecules using a desalting column with quantitative recovery yield
(Figure 6-4D). The results show that if the N3EG2 gel and degradation condition (i) are
applied in PAGE any gigantic proteins can be electrophoretically separated, recovered,
and purified with improved yield that could not be obtained using the conventional
PAGE.
It is possible to expect theoretical fraction of -azido ether remaining in the gel
with respect to time under the degradation condition using a mixed second order rate
equation. Because a general excised gel size was 0.1 x 1 x 1 cm and 2 mL of 10 mM
TCEP solution was added, the concentration of N3EG2 became 8 M. The second order
rate constant was obtained from the previous chapter as ~0.2 M-1
s-1
at pH 8 in TCEP
case. From the calculation, 31 % and 3.4 % of N3EG2 were left in the gel at 10 and 30 m,
respectively. That might promise solubilization of the N3EG2 gel within 1 h under
experimental conditions. However, the N3EG2 gel was not solubilized within the
experimental condition (~24 h). It suggests that because the expected calculation was

Chapter 6. Degradable PAGE using -azido ether
164
based on the homogeneous reaction between -azido ether molecule and TCEP in
aqueous solution, its exertion to heterogeneous system was not applicable. In order to be
more accurate expectation, heterogeneous reaction conditions need to be considered.
Figure 6-4. Protein recovery after PAGE. (A) Recovery profiles of a B-PE protein and
(B) a ferritin from a degradable N3EG2 gel with a TCEP trigger solution (black square, i),
a degradable N3EG2 gel without a TCEP trigger (red circle, ii), and a non-degradable Bis
gel with a TCEP trigger (blue triangle, iii), measured by a fluorescence
spectrophotometer (ex 475 nm and em 570 nm) and a UV-Vis spectrophotometer
(absorbance at 400 nm), respectively. (C) Fluorescent images during B-PE recovery. A
pink band indicated the embedded B-PE in the gel matrix. (D) Isolation of the recovered
proteins from the degradable N3EG2 gel matrix and small molecules like TCEP and
TCEP=O using a PD-10 desalting column. The concentration of isolated proteins, B-PE
and ferritin, at each fraction (1 mL) were measured by a fluorescence (ex 475 nm and
em 570 nm) and a UV-Vis spectrophotometer (absorbance at 400 nm), respectively.

Chapter 6. Degradable PAGE using -azido ether
165
6.3.4 Degradable PAGE for a nucleic acid
Next, a nucleic acid was separated and recovered from the degradable N3EG2 gel.
Although a nucleic acid is commonly separated by the electrophoresis of an agarose gel
that has larger pore size than a PAAm gel, a PAAm gel is often utilized to obtain an
extremely pure nucleic acid using its better resolution and more sensitive detection
methods23,30
. In addition, using a larger biological molecule than a protein allows us to
study the efficiency of the biocompatible, degradable N3EG2 gel for the recovery. As a
result, nucleic acids, such as, a plasmid (4343 bp, 2638 kDa) and microRNA (400 nt, 128
kDa), were electrophoretically separated and recovered.
Because the plasmid had a larger size than the previous proteins, it was required
that the gel concentration decreased to 5 %T. After the plasmid and DNA ladder were
loaded into either of 5 %C (N3EG2) or 3.6 %C (Bis) gel, the DNA was separated
electrophoretically. When the DNA bands were visualized using ethdium bromide
fluorescence, separated DNA bands were observed for both N3EG2 and Bis gels
according to a basepair (or size) in Figure 6-5A because DNA separation in the gel
electrophoresis relied on the basepair (or size). In addition, another gel was prepared and
stained with SYBR green I dye that has green fluorescence by intercalating into double
strand DNA45
. The green fluorescence band of plasmid was then cut and the plasmid
DNA embedded in the gel matrix was recovered using the same method as above in the
protein recovery except incubation temperature. Because DNA is relatively stable at a
higher temperature, the gels were incubated at 37 and 50 oC to investigate temperature

Chapter 6. Degradable PAGE using -azido ether
166
effect on the recovery rate. The recovery rate was then measured by monitoring green
fluorescence intensity with respect to the time.
From the recovery profiles (Figure 6-5C and D), it was observed that no plasmid
DNA was liberated from the gel matrix under the non-degradable conditions, ii
(degradable N3EG2 gel without TCEP trigger) and iii (non-degradable Bis gel with TCEP
trigger) at both 37 and 55 oC. However, when the degradation of N3EG2 gel was triggered
using TCEP at 37 oC, recovery of the plasmid DNA began at 3 h, followed by abrupt
increase after 4 h, and completed at 6 h in which the gel was solubilized and quantitative
recovery was obtained. The recovery rate was improved at elevated temperature 50 oC,
based on the fact that recovery completion and gel solubilization were achieved at ~2.5 h.
The results were also verified by fluorescence images of the embedded plasmid DNA
(Figure 6-5B). In the images, the recovery of the plasmid DNA led to the disappearance
of the green fluorescence band at 6.5 h at 37 oC in the degradation condition i only while
the green fluorescence band was persisted in other non-degradation conditions (ii and iii).
The results suggested that the recovery of large biological molecules like the plasmid
DNA was completely restricted using the conventional Bis gel. But, when the degradable
N3EG2 gel was replaced for the Bis gel any size of gigantic biological molecules could be
recovered from the gel matrix using TCEP trigger. Moreover, the recovery time could be
significantly reduced by increasing the temperature.

Chapter 6. Degradable PAGE using -azido ether
167
Figure 6-5. (A) Gel electrophoresis (5 %T / 5 %C N3EG2 polyacrylamide gel, 1x TBE)
of a 1 kb DNA ladder and a plasmid DNA. After electrophoresis, the DNA bands were
stained with ethidium bromide solution and then scanned to provide the image. (B) Green
fluorescence images of intercalated SYBR green I into DNA under UV light illumination
with respect to the time. Green fluorescence indicated an embedded plasmid DNA band
in the gels. Recovery profiles of a plasmid DNA out of the gels incubated at 37 oC (C)
and 50 oC (C), measured by a fluorescence intensity of the intercalated SYBR green I dye
of dsDNA in the recovery solution. Only the degradation condition (i) could liberate the
plasmid DNA from the gel matrix completely leading to the green band disappearance
(B) and max fluorescence intensity (C and D), as a result of gel solubilization, while
other non-degradable conditions (ii and iii) showed no change.

Chapter 6. Degradable PAGE using -azido ether
168
Micro RNA (microRNA) was also recovered using a similar method. Because
RNA is single strand which might cause secondary structures leading to false
separation65
, denaturating gel electrophoresis was performed using concentrated urea
(~7.5 M). In addition, pre-electrophoresis was conducted to warm electrophoresis system
to aid denaturation of RNA. After microRNA (400 nt) was electrophoretically separated,
the microRNA band was simply excised using UV-shadowing method44
(Figure 6-6A),
followed by gel degradation using TCEP in pH 7.0 buffer to prevent hydrolysis of RNA.
In order to reduce the recovery time, the gel was crushed and temperature was elevated to
80 oC which is frequently conducted in crush-and-soak method for recovery of small
RNA46
. As a result, the gel was solubilized within ~1 h that was faster than what was
observed previously when the recovery was performed at 50 oC. Next, the microRNA
was isolated from the solubilized gel and other small components using either of TRI
reagent extraction (guanidine thiocyanate/phenol/ chloroform), followed by a Qiagen
purification kit or LiCl precipitation method, which is frequently used in microRNA
purification46
, to afford 21-47 % yield.
The isolated microRNA was further analyzed by a secondary PAGE to verify
compatibility of degradation condition to microRNA. After the secondary gel
electrophoresis, the same migration bands of microRNA before and after gel degradation
were obtained as shown in Figure 6-6B. It indicated that the microRNA was inert under
the degradation condition (10 mM TCEP, pH 7.0, 80 oC) being no structural change and
hydrolysis even if the RNA is chemically unstable relative to DNA.

Chapter 6. Degradable PAGE using -azido ether
169
Figure 6-6. RNA denaturating urea gel electrophoresis. (A) Gel electrophoresis (4 %T
polyacrylamide gel, 1x TBE, ~7.5 M urea) of 400nt microRNA. After electrophoresis,
the RNA bands were visualized by UV-shadowing method to provide the image. (top)
RNA band using a conventional 5 %C Bis polyacrylamide gel. (bottom) RNA band using
a degradable 8 %C N3EG2 polyacrylamide gel. (B) Secondary denaturating urea gel
electrophoresis of ssRNA ladder, original and isolated microRNA (400nt). After gel
electrophoresis using a Bis gel, the gel was stained with SYBR green II solution and
fluorescence image was taken under UV illumination. The isolated microRNA had the
same migration as that of original microRNA, maintaining their size after degradation.
The result indicated the degradation condition was compatible with RNA even in high
temperature resulting in no effect on the RNA band migration.

Chapter 6. Degradable PAGE using -azido ether
170
6.4 Summary
We have demonstrated that the degradable PAGE using a bioorthogonal,
chemically cleavable -azido ether crosslinker (N3EG2) replaced for a Bis crosslinker is a
chemical alternative to current methods for recovery of biological molecules, such as,
protein, DNA, and RNA. Under the mild and biocompatible degradation conditions using
TCEP trigger, the N3EG2 was cleaved making bigger pore size or solubilizing the entire
gel matrix. As a result, the biological macromolecules were recovered rapidly and
efficiently through simple diffusion compared to conventional methods. The degradation
can be manipulated by elevating temperature to reduce degradation time. Although more
optimization would be performed to improve the system, we anticipate that the
degradable PAGE could be a versatile and universal tool for an efficient and facile
recovery of biological molecules. In addition, the result has verified the proof-of-concept
of incorporation of the bioorthogonal, chemically cleavable -azido ether into a
degradable hydrogel. As a result, we believe that the -azido ether can be expanded to
novel degradable biomaterials for in vivo applications, such as, drug delivery, bio-
adhesive, and tissue regeneration scaffolds.

Chapter 7. Concluding remarks
171
Chapter 7. Concluding Remarks
This thesis describes our efforts to develop novel nano/bio-materials and their
biological applications. It demonstrates how chemistry can improve properties of
nano/bio-materials that have been incorporated into biological technologies. As a result,
the improved properties give benefits to the biological technologies. We anticipate that
the developed chemistry in this thesis would provide tools for technological advance in
biological applications.
Particularly, oligothiol stabilized AuNPs were prepared using the advantages of
graft copolymer with thermally and chemically resistant AuNPs. The graft copolymer
stabilized AuNPs were then integrated into a biological technology, SP-PCR, for rapid
colorimetric post-PCR analysis to improve the current analytical method by excluding
instrumental needs and removing subsequent analysis for target DNA detection.
Although this thesis deals with only colorimetric target DNA detection, the graft
copolymer stabilized AuNPs with SP-PCR would be further expanded into advanced
PCR technologies; SNP detection using a sequence-specific restriction enzyme1;
multiplex SP-PCR using AuNP-primer libraries composed of various sizes and shapes2
that lead to simultaneous, automated target DNA detection through various methods3; and
mobilized gene colonies that can be sequenced by a hybridization sequencing method or
a currently being developed nanopore method.4
The bioorthgonal, chemically cleavable -azido ether has also been studied as a
essential part of degradable materials. The fundamental studies of the -azido ether were

Chapter 7. Concluding remarks
172
performed to elucidate its stability and cleavage kinetics, which gave the ways to improve
its performance in degradable materials. A representative example of chemically
degradable materials was also demonstrated by incorporating the -azido ether into a
polyacrylamide gel, which is an essential matrix in a biological technology, PAGE.
Although the degradable gel showed the efficient and facile recovery of biological
molecules through the chemical cleavage of the -azido ether, it would become improved
by further investigations: a simple preparation that can be achieved using a radical
reaction of azide with benzyl ether,5 development of triggers bearing low pKa,
6-7 and
catalytic cleavage of azide through visible-light-induced azide reduction.8 Afterwards, the
-azido ether would hold a promise for novel cleavable linkers in degradable materials
by chemical and/or light triggered degradation. Furthermore, it would be possible to use
the -azido ether as dual-functional groups in which ligation and cleavage reactions
occur through Staudinger ligation and azide reduction, respectively.9-10
In conclusion, we anticipate that these efforts on surface functionalization of
AuNPs with graft copolymers bearing oligothiols and the novel -azido ether
functionality with controllable chemical cleavage open a broad range of biological
applications. As a consequence, we hope that these approaches would play an important
role in advanced biomaterials as well as biotechnologies.
173
Bibliography
CHAPTER 1
(1) Drexler, E. "There's Plenty of Room at the Bottom" (Richard Feynman, Pasadena, 29
December 1959) 2009. http://metamodern.com/2009/12/29/theres-plenty-of-room-at-the-
bottom%E2%80%9D-feynman-1959/.
(2) Feynman, R. P. There's Plenty of Room at the Bottom.
http://media.wiley.com/product_data/excerpt/53/07803108/0780310853.pdf.
(3) Giljohann, D. A.; Mirkin, C. A., Nature 2009, 462, 461-464.
(4) Rosi, N. L.; Mirkin, C. A., Chemical Reviews 2005, 105, 1547-1562.
(5) Shirasaki, Y.; Supran, G. J.; Bawendi, M. G.; Bulovic, V., Nature Photonics 2013, 7,
13-23.
(6) Medintz, I. L.; Uyeda, H. T.; Goldman, E. R.; Mattoussi, H., Nature Materials 2005,
4, 435-446.
(7) Pankhurst, Q. A.; Connolly, J.; Jones, S. K.; Dobson, J., Journal of Physics D:
Applied Physics 2003, 36, R167.
(8) Yoo, D.; Lee, J.-H.; Shin, T.-H.; Cheon, J., Accounts of Chemical Research 2011, 44,
863-874.
(9) Ajayan, P. M.; Tour, J. M., Nature 2007, 447, 1066-1068.
(10) Hu, L.; Hecht, D. S.; Grüner, G., Chemical Reviews 2010, 110, 5790-5844.
(11) Bell, A. T., Science 2003, 299, 1688-1691.
(12) Mahmoud, M. A.; Narayanan, R.; El-Sayed, M. A., Accounts of Chemical Research
2013.
(13) Alkilany, A. M.; Lohse, S. E.; Murphy, C. J., Accounts of Chemical Research 2012,
46, 650-661.
(14) Rotello, V., Nanoparticles Buliding Blocks for Nanotechnology. Kluwer
Academic/Plenum Publishers: New York, 2004.
(15) Higby, G. J., Gold Bulletin 1982, 15, 130-140.

174
(16) Faraday, M., Philosophical Transactions of the Royal Society of London 1857, 147,
145-181.
(17) Turkevich, J.; Stevenson, P. C.; Hillier, J., Discussions of the Faraday Society 1951,
11, 55-75.
(18) Frens, G., Nature Physical Science 1973, 241, 20-22.
(19) Hayat, M. A., Colloidal Gold: Principles, Methods, and Applications. Academic
Press, Inc.: San Diego, 1989; Vol. 1.
(20) Nuzzo, R. G.; Allara, D. L., Journal of the American Chemical Society 1983, 105,
4481-4483.
(21) Mirkin, C. A.; Letsinger, R. L.; Mucic, R. C.; Storhoff, J. J., Nature 1996, 382, 607-
609.
(22) Alivisatos, A. P.; Johnsson, K. P.; Peng, X.; Wilson, T. E.; Loweth, C. J.; Bruchez,
M. P.; Schultz, P. G., Nature 1996, 382, 609-611.
(23) Taton, T. A.; Mirkin, C. A.; Letsinger, R. L., Science 2000, 289, 1757-1760.
(24) Nam, J.-M.; Park, S.-J.; Mirkin, C. A., Journal of the American Chemical Society
2002, 124, 3820-3821.
(25) Cao, Y. W. C.; Jin, R. C.; Mirkin, C. A., Science 2002, 297, 1536-1540.
(26) Park, S. Y.; Lytton-Jean, A. K. R.; Lee, B.; Weigand, S.; Schatz, G. C.; Mirkin, C.
A., Nature 2008, 451, 553-556.
(27) Jain, S.; Hirst, D. G.; O'Sullivan, J. M., British Journal of Radiology 2012, 85, 101-
113.
(28) Weintraub, K., Nature 2013, 495, S14-S16.
(29) Cretu, C.; Lingen, E., Gold Bulletin 1999, 32, 115-126.
(30) Jain, P. K.; Lee, K. S.; El-Sayed, I. H.; El-Sayed, M. A., The Journal of Physical
Chemistry B 2006, 110, 7238-7248.
(31) Yguerabide, J.; Yguerabide, E. E., Analytical Biochemistry 1998, 262, 137-156.
(32) Mie, G., Annalen der Physik 1908, 330, 377-445.
(33) Haiss, W.; Thanh, N. T. K.; Aveyard, J.; Fernig, D. G., Analytical Chemistry 2007,
79, 4215-4221.

175
(34) Liu, X.; Atwater, M.; Wang, J.; Huo, Q., Colloids and Surfaces B: Biointerfaces
2007, 58, 3-7.
(35) Sonnichsen, C.; Reinhard, B. M.; Liphardt, J.; Alivisatos, A. P., Nature
Biotechnology 2005, 23, 741-745.
(36) Yguerabide, J.; Yguerabide, E. E., Analytical Biochemistry 1998, 262, 157-176.
(37) Jain, P. K.; Huang, X.; El-Sayed, I. H.; El-Sayed, M. A., Accounts of Chemical
Research 2008, 41, 1578-1586.
(38) Murphy, C. J.; Gole, A. M.; Stone, J. W.; Sisco, P. N.; Alkilany, A. M.; Goldsmith,
E. C.; Baxter, S. C., Accounts of Chemical Research 2008, 41, 1721-1730.
(39) Hunter, R. J., Foundations of colloid science. 2nd ed.; Oxford University Press:
2001.
(40) Love, J. C.; Estroff, L. A.; Kriebel, J. K.; Nuzzo, R. G.; Whitesides, G. M.,
Chemical Reviews 2005, 105, 1103-1170.
(41) Hiemenz, P. C.; Rajagopalan, R., Principles of Colloid and Surface Chemistry. 3rd
ed.; CRC Press: 1997.
(42) Sperling, R. A.; Parak, W. J., Philosophical Transactions of the Royal Society A:
Mathematical, Physical and Engineering Sciences 2010, 368, 1333-1383.
(43) Ghosh, S. K.; Pal, T., Chemical Reviews 2007, 107, 4797-4862.
(44) Katz, E.; Willner, I., Angewandte Chemie, International Edition 2004, 43, 6042-
6108.
(45) Shan, J.; Tenhu, H., Chemical Communications 2007, 4580-4598.
(46) Kang, Y.; Taton, T. A., Angewandte Chemie International Edition 2005, 44, 409-
412.
(47) Daniel, M.-C.; Astruc, D., Chemical Reviews 2003, 104, 293-346.
(48) Tkachenko, A. G.; Xie, H.; Coleman, D.; Glomm, W.; Ryan, J.; Anderson, M. F.;
Franzen, S.; Feldheim, D. L., Journal of the American Chemical Society 2003, 125, 4700-
4701.
(49) Chah, S.; Hammond, M. R.; Zare, R. N., Chemistry & Biology 2005, 12, 323-328.
(50) Lowe, A. B.; Sumerlin, B. S.; Donovan, M. S.; McCormick, C. L., Journal of the
American Chemical Society 2002, 124, 11562-11563.

176
(51) Wuelfing, W. P.; Gross, S. M.; Miles, D. T.; Murray, R. W., Journal of the
American Chemical Society 1998, 120, 12696-12697.
(52) Corbierre, M. K.; Cameron, N. S.; Sutton, M.; Mochrie, S. G. J.; Lurio, L. B.;
Rühm, A.; Lennox, R. B., Journal of the American Chemical Society 2001, 123, 10411-
10412.
(53) Zhu, M.-Q.; Wang, L.-Q.; Exarhos, G. J.; Li, A. D. Q., Journal of the American
Chemical Society 2004, 126, 2656-2657.
(54) Wang, B.; Li, B.; Zhao, B.; Li, C. Y., Journal of the American Chemical Society
2008, 130, 11594-11595.
(55) Shan, J.; Nuopponen, M.; Jiang, H.; Kauppinen, E.; Tenhu, H., Macromolecules
2003, 36, 4526-4533.
(56) Gentilini, C.; Evangelista, F.; Rudolf, P.; Franchi, P.; Lucarini, M.; Pasquato, L.,
Journal of the American Chemical Society 2008, 130, 15678-15682.
(57) Nishi, H.; Kobatake, S., Macromolecules 2008, 41, 3995-4002.
(58) Hilf, S.; Kilbinger, A. F. M., Macromolecules 2009, 42, 4127-4133.
(59) Kruger, C.; Agarwal, S.; Greiner, A., Journal of the American Chemical Society
2008, 130, 2710-2711.
(60) Wilson, R.; Chen, Y.; Aveyard, J., Chemical Communications 2004, 1156-1157.
(61) Jana, N. R.; Erathodiyil, N.; Jiang, J.; Ying, J. Y., Langmuir 2010, 26, 6503-6507.
(62) Huang, H.-M.; Chang, C.-Y.; Liu, I.-C.; Tsai, H.-C.; Lai, M.-K.; Tsiang, R. C.-C.,
Journal of Polymer Science, Part A: Polymer Chemistry 2005, 43, 4710-4720.
(63) Mangeney, C., et al., Journal of the American Chemical Society 2002, 124, 5811-
5821.
(64) Teranishi, T.; Kiyokawa, I.; Miyake, M., Advanced Materials 1998, 10, 596-599.
(65) Wu, S.-H.; Huang, H.-M.; Chen, K.-C.; Hu, C.-W.; Hsu, C.-C.; Tsiang, R. C.-C.,
Advanced Functional Materials 2006, 16, 1959-1966.
(66) Han, D.-H.; Pan, C.-Y., Journal of Polymer Science Part A: Polymer Chemistry
2008, 46, 341-352.
(67) Wen, Y.; Jiang, X.; Yin, G.; Yin, J., Chemical Communications 2009, 6595-6597.
177
(68) Abraham, S.; Kim, I.; Batt, Carl A., Angewandte Chemie International Edition
2007, 46, 5720-5723.
(69) Luo, S.; Xu, J.; Zhang, Y.; Liu, S.; Wu, C., Journal of Physical Chemistry B 2005,
109, 22159-22166.
(70) Costanzo, P. J.; Demaree, J. D.; Beyer, F. L., Langmuir 2006, 22, 10251-10257.
(71) Javakhishvili, I.; Hvilsted, S., Biomacromolecules 2008, 10, 74-81.
(72) Herdt, A. R.; Drawz, S. M.; Kang, Y.; Taton, T. A., Colloids and Surfaces B:
Biointerfaces 2006, 51, 130-139.
(73) Klajn, R.; Gray, T. P.; Wesson, P. J.; Myers, B. D.; Dravid, V. P.; Smoukov, S. K.;
Grzybowski, B. A., Advanced Functional Materials 2008, 18, 2763-2769.
(74) Wong, J. K. F.; Yip, S. P.; Lee, T. M. H., Small 2012, 8, 214-219.
(75) Hostetler, M. J.; Templeton, A. C.; Murray, R. W., Langmuir 1999, 15, 3782-3789.
(76) Guo, R.; Song, Y.; Wang, G.; Murray, R. W., Journal of the American Chemical
Society 2005, 127, 2752-2757.
(77) Kassam, A.; Bremner, G.; Clark, B.; Ulibarri, G.; Lennox, R. B., Journal of the
American Chemical Society 2006, 128, 3476-3477.
(78) Hong, R.; Han, G.; Fernández, J. M.; Kim, B.-J.; Forbes, N. S.; Rotello, V. M.,
Journal of the American Chemical Society 2006, 128, 1078-1079.
(79) Schoenfisch, M. H.; Pemberton, J. E., Journal of the American Chemical Society
1998, 120, 4502-4513.
(80) Song, Y.; Huang, T.; Murray, R. W., Journal of the American Chemical Society
2003, 125, 11694-11701.
(81) Coutts, M. J.; Cortie, M. B.; Ford, M. J.; McDonagh, A. M., Journal of Physical
Chemistry C 2009, 113, 1325-1328.
(82) Nuzzo, R. G.; Zegarski, B. R.; Dubois, L. H., Journal of the American Chemical
Society 1987, 109, 733-740.
(83) Schlenoff, J. B.; Li, M.; Ly, H., Journal of the American Chemical Society 1995,
117, 12528-12536.
(84) Schessler, H. M.; Karpovich, D. S.; Blanchard, G. J., Journal of the American
Chemical Society 1996, 118, 9645-9651.

178
(85) Olson, M. A.; Coskun, A.; Klajn, R.; Fang, L.; Dey, S. K.; Browne, K. P.;
Grzybowski, B. A.; Stoddart, J. F., Nano Letters 2009, 9, 3185-3190.
(86) Kang, J. S.; Taton, T. A., Langmuir 2012, 28, 16751-16760.
(87) Wojczykowski, K.; Mei; Jutzi, P.; Ennen, I.; Hutten, A.; Fricke, M.; Volkmer, D.,
Chemical Communications 2006, 3693-3695.
(88) Li, Z.; Jin, R.; Mirkin, C. A.; Letsinger, R. L., Nucleic Acids Research 2002, 30,
1558-1562.
(89) Zhang, S.; Leem, G.; Srisombat, L.; Lee, T. R., Journal of the American Chemical
Society 2008, 130, 113-120.
(90) Perumal, S.; Hofmann, A.; Scholz, N.; R hl, E.; Graf, C., Langmuir 2011, 27, 4456-
4464.
(91) Srisombat, L.; Zhang, S.; Lee, T. R., Langmuir 2010, 26, 41-46.
(92) van Pelt-Verkuil, E.; van Belkum, A.; Hays, J. P., Principles and technical aspects
of PCR amplification. Springer: 2008.
(93) Saiki, R.; Gelfand, D.; Stoffel, S.; Scharf, S.; Higuchi, R.; Horn, G.; Mullis, K.;
Erlich, H., Science 1988, 239, 487-491.
(94) Saiki, R. K.; Scharf, S.; Faloona, F.; Mullis, K. B.; Horn, G. T.; Erlich, H. A.;
Arnheim, N., Science 1985, 230, 1350-1354.
(95) Steitz, T. A., Journal of Biological Chemistry 1999, 274, 17395-17398.
(96) Wong, C.; Dowling, C. E.; Saiki, R. K.; Higuchi, R. G.; Erlich, H. A.; Kazazian, H.
H., Nature 1987, 330, 384-386.
(97) Chien, A.; Edgar, D. B.; Trela, J. M., Journal of Bacteriology 1976, 127, 1550-
1557.
(98) Chamberlain, J. S.; Gibbs, R. A.; Rainer, J. E.; Nguyen, P. N.; Thomas, C., Nucleic
Acids Research 1988, 16, 11141-11156.
(99) Sanchez, J. A.; Pierce, K. E.; Rice, J. E.; Wangh, L. J., Proceedings of the National
Academy of Sciences of the United States of America 2004, 101, 1933-1938.
(100) Heid, C. A.; Stevens, J.; Livak, K. J.; Williams, P. M., Genome Research 1996, 6,
986-994.

179
(101) Yang, M.; Kong, R. Y. C.; Kazmi, N.; Leung, A. K. C., Chemistry Letters 1998,
27, 257-258.
(102) Adessi, C.; Matton, G.; Ayala, G.; Turcatti, G.; Mermod, J.-J.; Mayer, P.;
Kawashima, E., Nucleic Acids Research 2000, 28, e87.
(103) Fedurco, M.; Romieu, A.; Williams, S.; Lawrence, I.; Turcatti, G., Nucleic Acids
Research 2006, 34, e22.
(104) Kohsaka, H.; Carson, D. A., Journal of Clinical Laboratory Analysis 1994, 8, 452-
455.
(105) Rasmussen, S. R.; Rasmussen, H. B.; Larsen, M. R.; Hoff-Jørgensen, R.; Cano, R.
J., Clinical Chemistry 1994, 40, 200-5.
(106) Oroskar, A. A.; Rasmussen, S. E.; Rasmussen, H. N.; Rasmussen, S. R.; Sullivan,
B. M.; Johansson, A., Clinical Chemistry 1996, 42, 1547-55.
(107) Bentley, D. R., et al., Nature 2008, 456, 53-59.
(108) Hoffmann, J.; Hin, S.; Stetten, F. v.; Zengerle, R.; Roth, G., RSC Advances 2012.
(109) Margulies, M., et al., Nature 2005, 437, 376-380.
(110) Shapero, M. H.; Leuther, K. K.; Nguyen, A.; Scott, M.; Jones, K. W., Genome
Research 2001, 11, 1926-1934.
(111) Diehl, F.; Li, M.; He, Y.; Kinzler, K. W.; Vogelstein, B.; Dressman, D., Nature
Methods 2006, 3, 551-559.
(112) Liu, H.; Li, S.; Wang, Z.; Ji, M.; Nie, L.; He, N., Journal of Biotechnology 2007,
131, 217-222.
(113) Palanisamy, R.; Connolly, A. R.; Trau, M., Bioconjugate Chemistry 2010, 21, 690-
695.
(114) Chen, W.; Bian, A.; Agarwal, A.; Liu, L.; Shen, H.; Wang, L.; Xu, C.; Kotov, N.
A., Nano Letters 2009, 9, 2153-2159.
(115) Pollet, J.; Janssen, K. P. F.; Knez, K.; Lammertyn, J., Small 2011, 7, 1003-1006.
(116) Wilson, T.; Carson, J.; Bowman, J., Journal of Microbiological Methods 2002, 51,
163-170.
(117) Shendure, J., et al., Science 2005, 309, 1728-1732.

180
(118) Kim, J. B.; Porreca, G. J.; Song, L.; Greenway, S. C.; Gorham, J. M.; Church, G.
M.; Seidman, C. E.; Seidman, J. G., Science 2007, 316, 1481-1484.
(119) Mercier, J.-F.; Slater, G. W., Biophysical Journal 2005, 89, 32-42.
(120) Carmon, A.; Vision, T. J.; Mitchell, S. E.; Thannhauser, T. W.; Müller, U.;
Kresovich, S., BioTechniques 2002, 32, 410-420.
(121) Tiemann-Boege, I.; Curtis, C.; Shinde, D. N.; Goodman, D. B.; Tavar , S.;
Arnheim, N., Analytical Chemistry 2009, 81, 5770-5776.
(122) Hoffmann, J.; Trotter, M.; Stetten, F. v.; Zengerle, R.; Roth, G., Lab on a Chip
2012, 12, 3049-3054.
(123) Rasmussen, S. E., Annales de Biologie Clinique 1990, 48, 647-650.
(124) Dressman, D.; Yan, H.; Traverso, G.; Kinzler, K. W.; Vogelstein, B., Proceedings
of the National Academy of Sciences 2003, 100, 8817-8822.
CHAPTER 2
(1) Kang, J. S.; Taton, T. A., Langmuir 2012, 28, 16751-16760.
(2) Sperling, R. A.; Parak, W. J., Philosophical Transactions of the Royal Society A:
Mathematical, Physical and Engineering Sciences 2010, 368, 1333-1383.
(3) Baraton, M.-I., Synthesis, Functionalization and Surface Treatment of Nanoparticles.
American Scientific Publishers: Stevenson Ranch, California, 2003.
(4) Love, J. C.; Estroff, L. A.; Kriebel, J. K.; Nuzzo, R. G.; Whitesides, G. M., Chemical
Reviews (Washington, DC, United States) 2005, 105, 1103-1170.
(5) Katz, E.; Willner, I., Angewandte Chemie, International Edition 2004, 43, 6042-
6108.
(6) Alivisatos, A. P.; Johnsson, K. P.; Peng, X.; Wilson, T. E.; Loweth, C. J.; Bruchez,
M. P.; Schultz, P. G., Nature 1996, 382, 609-611.
(7) Mirkin, C. A.; Letsinger, R. L.; Mucic, R. C.; Storhoff, J. J., Nature 1996, 382, 607-
609.
(8) Giljohann, D. A.; Seferos, D. S.; Prigodich, A. E.; Patel, P. C.; Mirkin, C. A., Journal
of the American Chemical Society 2009, 131, 2072-2073.

181
(9) Tkachenko, A. G.; Xie, H.; Coleman, D.; Glomm, W.; Ryan, J.; Anderson, M. F.;
Franzen, S.; Feldheim, D. L., Journal of the American Chemical Society 2003, 125, 4700-
4701.
(10) Aubin-Tam, M.-E.; Hamad-Schifferli, K., Langmuir 2005, 21, 12080-12084.
(11) de la Fuente, J. M.; Barrientos, A. G.; Rojas, T. C.; Rojo, J.; Cañada, J.; Fernández,
A.; Penadés, S., Angewandte Chemie, International Edition 2001, 40, 2257-2261.
(12) Wuelfing, W. P.; Gross, S. M.; Miles, D. T.; Murray, R. W., Journal of the
American Chemical Society 1998, 120, 12696-12697.
(13) Corbierre, M. K.; Cameron, N. S.; Sutton, M.; Mochrie, S. G. J.; Lurio, L. B.;
Rühm, A.; Lennox, R. B., Journal of the American Chemical Society 2001, 123, 10411-
10412.
(14) Wilson, R.; Chen, Y.; Aveyard, J., Chemical Communications 2004, 1156-1157.
(15) Jana, N. R.; Erathodiyil, N.; Jiang, J.; Ying, J. Y., Langmuir 2010, 26, 6503-6507.
(16) Huang, H.-M.; Chang, C.-Y.; Liu, I.-C.; Tsai, H.-C.; Lai, M.-K.; Tsiang, R. C.-C.,
Journal of Polymer Science, Part A: Polymer Chemistry 2005, 43, 4710-4720.
(17) Teranishi, T.; Kiyokawa, I.; Miyake, M., Advanced Materials 1998, 10, 596-599.
(18) Wu, S.-H.; Huang, H.-M.; Chen, K.-C.; Hu, C.-W.; Hsu, C.-C.; Tsiang, R. C.-C.,
Advanced Functional Materials 2006, 16, 1959-1966.
(19) Han, D.-H.; Pan, C.-Y., Journal of Polymer Science Part A: Polymer Chemistry
2008, 46, 341-352.
(20) Abraham, S.; Kim, I.; Batt, Carl A., Angewandte Chemie International Edition
2007, 46, 5720-5723.
(21) Luo, S.; Xu, J.; Zhang, Y.; Liu, S.; Wu, C., Journal of Physical Chemistry B 2005,
109, 22159-22166.
(22) Zalipsky, S., Bioconjugate Chemistry 1995, 6, 150-165.
(23) Otsuka, H.; Nagasaki, Y.; Kataoka, K., Advanced Drug Delivery Reviews 2003, 55,
403-419.
(24) Herdt, A. R.; Drawz, S. M.; Kang, Y.; Taton, T. A., Colloids and Surfaces B:
Biointerfaces 2006, 51, 130-139.

182
(25) Klajn, R.; Bishop, K. J. M.; Fialkowski, M.; Paszewski, M.; Campbell, C. J.; Gray,
T. P.; Grzybowski, B. A., Science 2007, 316, 261-264.
(26) Bhatt, N.; Huang, P.-J. J.; Dave, N.; Liu, J., Langmuir 2011, 27, 6132-6137.
(27) Kassam, A.; Bremner, G.; Clark, B.; Ulibarri, G.; Lennox, R. B., Journal of the
American Chemical Society 2006, 128, 3476-3477.
(28) Hong, R.; Han, G.; Fernández, J. M.; Kim, B.-J.; Forbes, N. S.; Rotello, V. M.,
Journal of the American Chemical Society 2006, 128, 1078-1079.
(29) Song, Y.; Murray, R. W., Journal of the American Chemical Society 2002, 124,
7096-7102.
(30) Chompoosor, A.; Han, G.; Rotello, V. M., Bioconjugate Chemistry 2008, 19, 1342-
1345.
(31) Song, Y.; Huang, T.; Murray, R. W., Journal of the American Chemical Society
2003, 125, 11694-11701.
(32) Nuzzo, R. G.; Zegarski, B. R.; Dubois, L. H., Journal of the American Chemical
Society 1987, 109, 733-740.
(33) Schessler, H. M.; Karpovich, D. S.; Blanchard, G. J., Journal of the American
Chemical Society 1996, 118, 9645-9651.
(34) Bain, C. D.; Troughton, E. B.; Tao, Y. T.; Evall, J.; Whitesides, G. M.; Nuzzo, R.
G., Journal of the American Chemical Society 1989, 111, 321-335.
(35) Guo, R.; Song, Y.; Wang, G.; Murray, R. W., Journal of the American Chemical
Society 2005, 127, 2752-2757.
(36) Ingram, R. S.; Hostetler, M. J.; Murray, R. W., Journal of the American Chemical
Society 1997, 119, 9175-9178.
(37) Flynn, N. T.; Tran, T. N. T.; Cima, M. J.; Langer, R., Langmuir 2003, 19, 10909-
10915.
(38) Schoenfisch, M. H.; Pemberton, J. E., Journal of the American Chemical Society
1998, 120, 4502-4513.
(39) Shon, Y.-S.; Lee, T. R., Journal of Physical Chemistry B 2000, 104, 8192-8200.
(40) Zhang, S.; Leem, G.; Srisombat, L.; Lee, T. R., Journal of the American Chemical
Society 2008, 130, 113-120.

183
(41) Srisombat, L.; Zhang, S.; Lee, T. R., Langmuir 2010, 26, 41-46.
(42) Wojczykowski, K.; Mei; Jutzi, P.; Ennen, I.; Hutten, A.; Fricke, M.; Volkmer, D.,
Chemical Communications 2006, 3693-3695.
(43) Perumal, S.; Hofmann, A.; Scholz, N.; R hl, E.; Graf, C., Langmuir 2011, 27, 4456-
4464.
(44) Li, Z.; Jin, R.; Mirkin, C. A.; Letsinger, R. L., Nucleic Acids Research 2002, 30,
1558-1562.
(45) Inglis, A. J.; Sinnwell, S.; Davis, T. P.; Barner-Kowollik, C.; Stenzel, M. H.,
Macromolecules 2008, 41, 4120-4126.
(46) Frens, G., Nature Physical Science 1973, 241, 20-22.
(47) Liu, X.; Atwater, M.; Wang, J.; Huo, Q., Colloids and Surfaces B: Biointerfaces
2007, 58, 3-7.
(48) Pasche, S.; De Paul, S. M.; Vörös, J.; Spencer, N. D.; Textor, M., Langmuir 2003,
19, 9216-9225.
(49) Lee, S.; Spencer, N. D., Langmuir 2008, 24, 9479-9488.
(50) Park, J. W.; Mok, H.; Park, T. G., Journal of Controlled Release 2010, 142, 238-
244.
(51) Wattendorf, U.; Koch, M. C.; Walter, E.; Voros, J.; Textor, M.; Merkle, H. P.,
Biointerphases 2006, 1, 123-133.
(52) Feuz, L.; Leermakers, F. A. M.; Textor, M.; Borisov, O., Langmuir 2008, 24, 7232-
7244.
(53) Gon, S.; Santore, M. M., Langmuir 2011, 27, 1487-1493.
(54) Jeon, S. I.; Lee, J. H.; Andrade, J. D.; De Gennes, P. G., Journal of Colloid and
Interface Science 1991, 142, 149-158.
(55) Szleifer, I., Biophysical Journal 1997, 72, 595-612.
(56) Mok, H.; Park, J. W.; Park, T. G., Bioconjugate Chemistry 2008, 19, 797-801.
(57) Miyamoto, D.; Oishi, M.; Kojima, K.; Yoshimoto, K.; Nagasaki, Y., Langmuir
2008, 24, 5010-5017.
(58) Miyata, K.; Kakizawa, Y.; Nishiyama, N.; Harada, A.; Yamasaki, Y.; Koyama, H.;
Kataoka, K., Journal of the American Chemical Society 2004, 126, 2355-2361.

184
(59) Maurizi, L.; Bisht, H.; Bouyer, F.; Millot, N., Langmuir 2009, 25, 8857-8859.
(60) Kelly, K. L.; Coronado, E.; Zhao, L. L.; Schatz, G. C., Journal of Physical
Chemistry B 2002, 107, 668-677.
(61) Liu, Y.; Shipton, M. K.; Ryan, J.; Kaufman, E. D.; Franzen, S.; Feldheim, D. L.,
Analytical Chemistry 2007, 79, 2221-2229.
(62) Takae, S.; Akiyama, Y.; Otsuka, H.; Nakamura, T.; Nagasaki, Y.; Kataoka, K.,
Biomacromolecules 2005, 6, 818-824.
(63) Xia, X.; Yang, M.; Wang, Y.; Zheng, Y.; Li, Q.; Chen, J.; Xia, Y., ACS Nano 2011,
6, 512-522.
(64) Hurst, S. J.; Lytton-Jean, A. K. R.; Mirkin, C. A., Analytical Chemistry 2006, 78,
8313-8318.
(65) Zareie, H. M.; Boyer, C.; Bulmus, V.; Nateghi, E.; Davis, T. P., ACS Nano 2008, 2,
757-765.
(66) Ghosh, S. K.; Pal, T., Chemical Reviews (Washington, DC, United States) 2007,
107, 4797-4862.
(67) Dulkeith, E., et al., Physical Review Letters 2002, 89, 203002.
(68) Stewart, M. H.; Susumu, K.; Mei, B. C.; Medintz, I. L.; Delehanty, J. B.; Blanco-
Canosa, J. B.; Dawson, P. E.; Mattoussi, H., Journal of the American Chemical Society
2010, 132, 9804-9813.
(69) Hou, W.; Dasog, M.; Scott, R. W. J., Langmuir 2009, 25, 12954-12961.
(70) Agasti, S. S.; You, C.-C.; Arumugam, P.; Rotello, V. M., Journal of Materials
Chemistry 2008, 18, 70-73.
(71) VandeVondele, S.; Vörös, J.; Hubbell, J. A., Biotechnology and Bioengineering
2003, 82, 784-790.
(72) Zhen, G.; Falconnet, D.; Kuennemann, E.; Vörös, J.; Spencer, N. D.; Textor, M.;
Zürcher, S., Advanced Functional Materials 2006, 16, 243-251.

185
CHAPTER 3
(1) Saiki, R.; Gelfand, D.; Stoffel, S.; Scharf, S.; Higuchi, R.; Horn, G.; Mullis, K.;
Erlich, H., Science 1988, 239, 487-491.
(2) Heid, C. A.; Stevens, J.; Livak, K. J.; Williams, P. M., Genome Research 1996, 6,
986-994.
(3) Leslie, D. C., et al., Journal of the American Chemical Society 2012, 134, 5689-5696.
(4) Ho, H.-A.; Boissinot, M.; Bergeron, M. G.; Corbeil, G.; Doré, K.; Boudreau, D.;
Leclerc, M., Angewandte Chemie International Edition 2002, 41, 1548-1551.
(5) Lou, X.; Lewis, M. S.; Gorman, C. B.; He, L., Analytical Chemistry 2005, 77, 4698-
4705.
(6) Kelly, K. L.; Coronado, E.; Zhao, L. L.; Schatz, G. C., Journal of Physical Chemistry
B 2002, 107, 668-677.
(7) Elghanian, R.; Storhoff, J. J.; Mucic, R. C.; Letsinger, R. L.; Mirkin, C. A., Science
1997, 277, 1078-1081.
(8) Taton, T. A.; Mirkin, C. A.; Letsinger, R. L., Science 2000, 289, 1757-1760.
(9) Alivisatos, A. P.; Johnsson, K. P.; Peng, X.; Wilson, T. E.; Loweth, C. J.; Bruchez,
M. P.; Schultz, P. G., Nature 1996, 382, 609-611.
(10) Mirkin, C. A.; Letsinger, R. L.; Mucic, R. C.; Storhoff, J. J., Nature 1996, 382, 607-
609.
(11) Li; Rothberg, L. J., Journal of the American Chemical Society 2004, 126, 10958-
10961.
(12) Jung, Y. L.; Jung, C.; Parab, H.; Cho, D.-Y.; Park, H. G., Chembiochem 2011, 12,
1387-1390.
(13) Deng, H., et al., Analytical Chemistry 2012, 84, 1253-1258.
(14) Wong, J. K. F.; Yip, S. P.; Lee, T. M. H., Small 2012, 8, 214-219.
(15) Zhao, Y.; Xu, L.; Kuang, H.; Wang, L.; Xu, C., Journal of Materials Chemistry
2012, 22, 5574-5580.
(16) Kuang, H.; Zhao, S.; Chen, W.; Ma, W.; Yong, Q.; Xu, L.; Wang, L.; Xu, C.,
Biosensors and Bioelectronics 2011, 26, 2495-2499.
(17) Cai, M.; Li, F.; Zhang, Y.; Wang, Q., Nano Research 2010, 3, 557-563.
186
(18) Chen, W.; Bian, A.; Agarwal, A.; Liu, L.; Shen, H.; Wang, L.; Xu, C.; Kotov, N. A.,
Nano Letters 2009, 9, 2153-2159.
(19) Shen, H. B.; Hu, M.; Wang, Y. B.; Zhou, H. Q., Biophysical Chemistry 2005, 115,
63-66.
(20) Storhoff, J. J.; Fritz, B. M.; Herrmann, M. Real-Time Monitoring of PCR
Amplification Using Nanoparticle Probes. WO/2003/048769, 2003.
(21) Klajn, R.; Gray, T. P.; Wesson, P. J.; Myers, B. D.; Dravid, V. P.; Smoukov, S. K.;
Grzybowski, B. A., Advanced Functional Materials 2008, 18, 2763-2769.
(22) Klajn, R.; Bishop, K. J. M.; Fialkowski, M.; Paszewski, M.; Campbell, C. J.; Gray,
T. P.; Grzybowski, B. A., Science 2007, 316, 261-264.
(23) Herdt, A. R.; Drawz, S. M.; Kang, Y.; Taton, T. A., Colloids and Surfaces B:
Biointerfaces 2006, 51, 130-139.
(24) Guo, R.; Song, Y.; Wang, G.; Murray, R. W., Journal of the American Chemical
Society 2005, 127, 2752-2757.
(25) Song, Y.; Murray, R. W., Journal of the American Chemical Society 2002, 124,
7096-7102.
(26) Hill, H. D.; Mirkin, C. A., Nature Protocols 2006, 1, 324-336.
(27) Li, Z.; Jin, R.; Mirkin, C. A.; Letsinger, R. L., Nucleic Acids Research 2002, 30,
1558-1562.
(28) Hong, R.; Han, G.; Fernández, J. M.; Kim, B.-J.; Forbes, N. S.; Rotello, V. M.,
Journal of the American Chemical Society 2006, 128, 1078-1079.
(29) Bhatt, N.; Huang, P.-J. J.; Dave, N.; Liu, J., Langmuir 2011, 27, 6132-6137.
(30) Mittal, S.; Bushman, F.; Orgel, L. E., Journal of Chemical Technology &
Biotechnology 2003, 78, 471-473.
(31) Wan, W.; Yeow, J. T. W., Nanotechnology 2009, 20, 325702.
(32) Wong, J. F.; Yip, S.; Lee, T. H., Nano Research 2012, 5, 585-594.
(33) Schwabacher, A. W.; Lane, J. W.; Schiesher, M. W.; Leigh, K. M.; Johnson, C. W.,
The Journal of Organic Chemistry 1998, 63, 1727-1729.
(34) Kang, J. S.; Taton, T. A., Langmuir 2012, 28, 16751-16760.

187
(35) Marks, I. S.; Kang, J. S.; Jones, B. T.; Landmark, K. J.; Cleland, A. J.; Taton, T. A.,
Bioconjugate Chemistry 2011, 22, 1259-1263.
(36) Liu, X.; Atwater, M.; Wang, J.; Huo, Q., Colloids and Surfaces B: Biointerfaces
2007, 58, 3-7.
(37) Zhang, S.; Leem, G.; Srisombat, L.; Lee, T. R., Journal of the American Chemical
Society 2008, 130, 113-120.
(38) Dougan, J. A.; Karlsson, C.; Smith, W. E.; Graham, D., Nucleic Acids Research
2007, 35, 3668-3675.
(39) Parak, W. J.; Pellegrino, T.; Micheel, C. M.; Gerion, D.; Williams, S. C.; Alivisatos,
A. P., Nano Letters 2002, 3, 33-36.
(40) Zanchet, D.; Micheel, C. M.; Parak, W. J.; Gerion, D.; Alivisatos, A. P., Nano
Letters 2000, 1, 32-35.
(41) Özdemir, C.; Güner, A., Journal of Applied Polymer Science 2006, 101, 203-216.
(42) Li, H.; Huang, J.; Lv, J.; An, H.; Zhang, X.; Zhang, Z.; Fan, C.; Hu, J., Angewandte
Chemie International Edition 2005, 44, 5100-5103.
(43) Chen, P., et al., Nature Nanotechnology 2011, 6, 639-644.
(44) Margulies, M., et al., Nature 2005, 437, 376-380.
(45) Shendure, J., et al., Science 2005, 309, 1728-1732.
(46) Diehl, F.; Li, M.; He, Y.; Kinzler, K. W.; Vogelstein, B.; Dressman, D., Nature
Methods 2006, 3, 551-559.
(47) Kojima, T.; Takei, Y.; Ohtsuka, M.; Kawarasaki, Y.; Yamane, T.; Nakano, H.,
Nucleic Acids Research 2005, 33, e150.
(48) Shendure, J.; Ji, H., Nature Biotechnology 2008, 26, 1135-1145.
(49) Fedurco, M.; Romieu, A.; Williams, S.; Lawrence, I.; Turcatti, G., Nucleic Acids
Research 2006, 34, e22.
(50) Sjöroos, M.; Ilonen, J.; Lövgren, T., Clinical Chemistry 2001, 47, 498-504.
(51) Reinhard, B. M.; Sheikholeslami, S.; Mastroianni, A.; Alivisatos, A. P.; Liphardt, J.,
Proceedings of the National Academy of Sciences 2007, 104, 2667-2672.
(52) Liu, G. L., et al., Nature Nanotechnology 2006, 1, 47-52.

188
(53) Hill, H. D.; Millstone, J. E.; Banholzer, M. J.; Mirkin, C. A., ACS Nano 2009, 3,
418-424.
(54) Tiemann-Boege, I.; Curtis, C.; Shinde, D. N.; Goodman, D. B.; Tavar , S.;
Arnheim, N., Analytical Chemistry 2009, 81, 5770-5776.
(55) Palanisamy, R.; Connolly, A. R.; Trau, M., Bioconjugate Chemistry 2010, 21, 690-
695.
(56) Nicewarner Peña, S. R.; Raina, S.; Goodrich, G. P.; Fedoroff, N. V.; Keating, C. D.,
Journal of the American Chemical Society 2002, 124, 7314-7323.
(57) Gijs, M. A. M.; Lacharme, F. d. r.; Lehmann, U., Chemical Reviews 2009, 110,
1518-1563.
(58) Adessi, C.; Matton, G.; Ayala, G.; Turcatti, G.; Mermod, J.-J.; Mayer, P.;
Kawashima, E., Nucleic Acids Research 2000, 28, e87.
(59) Huber, M.; Losert, D.; Hiller, R.; Harwanegg, C.; Mueller, M. W.; Schmidt, W. M.,
Analytical Biochemistry 2001, 299, 24-30.
(60) Dai, Q.; Liu, X.; Coutts, J.; Austin, L.; Huo, Q., Journal of the American Chemical
Society 2008, 130, 8138-8139.
(61) Falabella, J. B.; Cho, T. J.; Ripple, D. C.; Hackley, V. A.; Tarlov, M. J., Langmuir
2010, 26, 12740-12747.
(62) Zipper, H.; Brunner, H.; Bernhagen, J.; Vitzthum, F., Nucleic Acids Research 2004,
32, e103.
(63) Kramer, M. F.; Coen, D. M., Enzymatic Amplification of DNA by PCR: Standard
Procedures and Optimization. In Current Protocols in Toxicology, John Wiley & Sons,
Inc.: 2001.
(64) Chi, C.; Vargas-Lara, F.; Tkachenko, A. V.; Starr, F. W.; Gang, O., ACS Nano
2012, 6, 6793-6802.
(65) Srisa-Art, M.; Dyson, E. C.; deMello, A. J.; Edel, J. B., Analytical Chemistry 2008,
80, 7063-7067.
(66) Henry, M. R.; Wilkins Stevens, P.; Sun, J.; Kelso, D. M., Analytical Biochemistry
1999, 276, 204-214.

189
(67) Fan, Z. H.; Mangru, S.; Granzow, R.; Heaney, P.; Ho, W.; Dong, Q.; Kumar, R.,
Analytical Chemistry 1999, 71, 4851-4859.
CHAPTER 4
(1) Barenberg, S. A.; Brash, J. L.; Narayan, R.; Redpath, A. E., Degradable materials :
perspectives, issues and opportunities : the first international scientific consensus
workshop proceedings. CRC Press: 1990.
(2) Gross, R. A.; Kalra, B., Science 2002, 297, 803-807.
(3) Seliktar, D., Science 2012, 336, 1124-1128.
(4) D. Nicodemus, G.; J. Bryant, S., Tissue Engineering: Part B 2008, 14, 149-165.
(5) Seelert, H.; Krause, F., Electophoresis 2008, 29, 2617-2636.
(6) Kloxin, A. M.; Kasko, A. M.; Salinas, C. N.; Anseth, K. S., Science 2009, 324, 59-
63.
(7) Lasprilla, A. J. R.; Martinez, G. A. R.; Lunelli, B. H.; Jardini, A. L.; Filho, R. M.,
Biotechnology Advances 2012, 30, 321-328.
(8) LeGeros, R. Z., Clinical Materials 1993, 14, 65-88.
(9) Ehrlich, H.; Demadis, K. D.; Pokrovsky, O. S.; Koutsoukos, P. G., Chemical Reviews
2010, 110, 4656-4689.
(10) Horcajada, P.; Gref, R.; Baati, T.; Allan, P. K.; Maurin, G.; Couvreur, P.; Férey, G.;
Morris, R. E.; Serre, C., Chemical Reviews 2011, 112, 1232-1268.
(11) Van Vlierberghe, S.; Dubruel, P.; Schacht, E., Biomacromolecules 2011, 12, 1387-
1408.
(12) Leriche, G.; Chisholm, L.; Wagner, A., Bioorganic & Medicinal Chemistry 2012,
20, 571-582.
(13) van Nostrum, C. F.; Veldhuis, T. F. J.; Bos, G. W.; Hennink, W. E., Polymer 2004,
45, 6779-6787.
(14) Hisano, N.; Morikawa, N.; Iwata, H.; Ikada, Y., Journal of Biomedical Materials
Research 1998, 40, 115-123.
(15) Hu, J.; Zhang, G.; Liu, S., Chemical Society Reviews 2012, 41, 5933-5949.

190
(16) Zhao, H.; Sterner, E. S.; Coughlin, E. B.; Theato, P., Macromolecules 2012, 45,
1723-1736.
(17) Smith, R. J.; Capaldi, R. A.; Muchmore, D.; Dahlquist, F., Biochemistry 1978, 17,
3719-3723.
(18) Verhelst, S. H. L.; Fonović, M.; Bogyo, M., Angewandte Chemie International
Edition 2007, 46, 1284-1286.
(19) Hangauer, M. J.; Bertozzi, C. R., Angewandte Chemie 2008, 120, 2428-2431.
(20) Guo, J., et al., Proceedings of the National Academy of Sciences 2008, 105, 9145-
9150.
(21) Franzini, R. M.; Kool, E. T., Journal of the American Chemical Society 2009, 131,
16021-16023.
(22) Luo, Y.; hoichet, M. S., Nature Materials 2004, 3, 1476-1122.
(23) Kloxin, A. M.; Tibbitt, M. W.; Anseth, K. S., Nature Protocols 2010, 5, 1867-87.
(24) Vesterberg, O., Electophoresis 1993, 14, 1243-1249.
(25) Merrifield, R. B., Journal of the American Chemical Society 1963, 85, 2149-2154.
(26) Matteucci, M. D.; Caruthers, M. H., Journal of the American Chemical Society
1981, 103, 3185-3191.
(27) Wang, S.-S., Journal of the American Chemical Society 1973, 95, 1328-1333.
(28) Parrott, M. C.; Luft, J. C.; Byrne, J. D.; Fain, J. H.; Napier, M. E.; DeSimone, J.,
Journal of the American Chemical Society 2010, 132, 17928-17932.
(29) Bruyère, H.; Westwell, A. D.; Jones, A. T., Bioorganic & Medicinal Chemistry
Letters 2010, 20, 2200-2203.
(30) Cui, L.; Cohen, J. L.; Chu, C. K.; Wich, P. R.; Kierstead, P. H.; Fréchet, J. M. J.,
Journal of the American Chemical Society 2012, 134, 15840-15848.
(31) Griset, A. P.; Walpole, J.; Liu, R.; Gaffey, A.; Colson, Y. L.; Grinstaff, M. W.,
Journal of the American Chemical Society 2009, 131, 2469-2471.
(32) Murthy, N.; Xu, M.; Schuck, S.; Kunisawa, J.; Shastri, N.; Fréchet, J. M. J.,
Proceedings of the National Academy of Sciences 2003, 100, 4995-5000.
(33) Aryal, S.; Hu, C.-M. J.; Zhang, L., ACS Nano 2009, 4, 251-258.

191
(34) Gao, W.; Chan, J. M.; Farokhzad, O. C., Molecular Pharmaceutics 2010, 7, 1913-
1920.
(35) Speers, A. E.; Cravatt, B. F., Journal of the American Chemical Society 2005, 127,
10018-10019.
(36) Dieterich, D. C.; Link, A. J.; Graumann, J.; Tirrell, D. A.; Schuman, E. M.,
Proceedings of the National Academy of Sciences of the United States of America 2006,
103, 9482-9487.
(37) Phelps, E. A.; Landázuri, N.; Thulé, P. M.; Taylor, W. R.; García, A. J.,
Proceedings of the National Academy of Sciences 2010, 107, 3323-3328.
(38) Olson, E. S.; Jiang, T.; Aguilera, T. A.; Nguyen, Q. T.; Ellies, L. G.; Scadeng, M.;
Tsien, R. Y., Proceedings of the National Academy of Sciences of the United States of
America 2010, 107, 4311-4316.
(39) Pullela, P. K.; Chiku, T.; Carvan, M. J.; Sem, D. S., Analytical Biochemistry 2006,
352, 265-273.
(40) Gao, W.; Langer, R.; Farokhzad, O. C., Angewandte Chemie-International Edition
2010, 49, 6567-6571.
(41) Zhang, W.; Song, J.; Mu, L.; Zhang, B.; Liu, L.; Xing, Y.; Wang, K.; Li, Z.; Wang,
R., Bioorganic & Medicinal Chemistry Letters 2011, 21, 1452-1455.
(42) Yokoshima, S.; Abe, Y.; Watanabe, N.; Kita, Y.; Kan, T.; Iwatsubo, T.; Tomita, T.;
Fukuyama, T., Bioorganic & Medicinal Chemistry Letters 2009, 19, 6869-6871.
(43) Long, L.; Lin, W.; Chen, B.; Gao, W.; Yuan, L., Chemical Communications 2011,
47, 893-895.
(44) Whitesides, G. M.; Lilburn, J. E.; Szajewski, R. P., The Journal of Organic
Chemistry 1977, 42, 332-338.
(45) Gartner, C. A.; Elias, J. E.; Bakalarski, C. E.; Gygi, S. P., Journal of Proteome
Research 2007, 6, 1482-1491.
(46) Chen, Q., et al., Journal of Controlled Release 2010, 144, 227-232.
(47) Lee, H.-M.; Larson, D. R.; Lawrence, D. S., ACS Chemical Biology 2009, 4, 409-
427.

192
(48) Vivero-Escoto, J. L.; Slowing, I. I.; Wu, C.-W.; Lin, V. S. Y., Journal of the
American Chemical Society 2009, 131, 3462-+.
(49) Fedorovich, N. E.; Oudshoorn, M. H.; van Geemen, D.; Hennink, W. E.; Alblas, J.;
Dhert, W. J. A., Biomaterials 2009, 30, 344-353.
(50) Meinhardt, M.; Krebs, R.; Anders, A.; Heinrich, U.; Tronnier, H., Journal of
Biomedical Optics 2008, 13, 044030-044030.
(51) Yang, Y., et al., Angewandte Chemie International Edition 2012, 51, 3125-3129.
(52) Sinha, D. K., et al., Chembiochem 2010, 11, 653-663.
(53) Neveu, P.; Aujard, I.; Benbrahim, C.; Le Saux, T.; Allemand, J.-F.; Vriz, S.;
Bensimon, D.; Jullien, L., Angewandte Chemie International Edition 2008, 47, 3744-
3746.
(54) Leriche, G.; Budin, G.; Brino, L.; Wagner, A., European Journal of Organic
Chemistry 2010, 4360-4364.
(55) Li, H.; Franzini, R. M.; Bruner, C.; Kool, E. T., Chembiochem 2010, 11, 2132-2137.
(56) Franzini, R. M.; Kool, E. T., Chemistry – A European Journal 2011, 17, 2168-2175.
(57) Franzini, R. M.; Kool, E. T., Bioconjugate Chemistry 2011, 22, 1869-1877.
(58) Harcourt, E. M.; Kool, E. T., Nucleic Acids Research 2012, 40, e65.
(59) Proudnikov, D.; Mirzabekov, A., Nucleic Acids Research 1996, 24, 4535-4542.
(60) Cera, C.; Egbertson, M.; Teng, S. P.; Crothers, D. M.; Danishefsky, S. J.,
Biochemistry 1989, 28, 5665-5669.
(61) Sletten, E. M.; Bertozzi, C. R., Accounts of Chemical Research 2011, 44, 666-676.
(62) Sletten, E. M.; Bertozzi, C. R., Angewandte Chemie International Edition 2009, 48,
6974-6998.
(63) Saxon, E.; Bertozzi, C. R., Science 2000, 287, 2007-2010.
(64) Lin, F. L.; Hoyt, H. M.; van Halbeek, H.; Bergman, R. G.; Bertozzi, C. R., Journal
of the American Chemical Society 2005, 127, 2686-2695.
(65) Bentley, D. R., et al., Nature 2008, 456, 53-59.
(66) Tiselius, A., Transactions of the Faraday Society 1937, 33, 524-531.
(67) Smithies, O., Biochemical Journal 1955, 61, 629-641.
(68) Raymond, S.; Weintraub, L., Science 1959, 130, 711.
193
(69) Stellwagen, N. C., Electophoresis 2009, 30, S188-S195.
(70) Gianazza, E.; Righetti, P. G., Electophoresis 2009, 30, S112-S121.
(71) Rabilloud, T., Journal of Proteomics 2010, 73, 1562-1572.
(72) Klose, J., Electophoresis 2009, 30, S142-S149.
(73) Allen, R. C.; Budowle, B., Gel electrophoresis of proteins and nucleic acids. Walter
de Gruyter: New York, 1994.
(74) Hawcroft, D. M., Electrophoresis. Oxford University Press: 1997.
(75) Heegaard, N. H. H., Electophoresis 2009, 30, S229-S239.
(76) Kinoshita, E.; Kinoshita-Kikuta, E.; Matsubara, M.; Aoki, Y.; Ohie, S.; Mouri, Y.;
Koike, T., Electophoresis 2009, 30, 550-559.
(77) Alberts, B.; Johnson, A.; Lewis, J.; Raff, M.; Roberts, K.; Walter, P., Molecular
Biology of the Cell. 5th ed.; Garland Science: 2007.
(78) Krause, F., Electrophoresis 2006, 27, 2759-2781.
(79) Poetsch, A.; Neff, D.; Seelert, H.; Schägger, H.; Dencher, N. A., Biochimica et
Biophysica Acta (BBA) - Biomembranes 2000, 1466, 339-349.
(80) Coppola, J. A.; Luse, D. S., Journal of Molecular Biology 1984, 178, 415-437.
(81) Seelig, B., Nature Protocols 2011, 6, 540-552.
(82) Scheer, J. M.; Ryan, C. A., Analytical Biochemistry 2001, 298, 130-132.
(83) Antal, J.; Banyasz, B.; Buzas, Z., Electrophoresis 2007, 28, 508-511.
(84) Kim, Y. K.; Kwon, Y. J., Electophoresis 2010, 31, 1656-1661.
(85) Kim, Y. K.; Kwon, Y. J., Proteomics 2009, 9, 3765-3771.
(86) Young, R. W.; Fulhorst, H. W., Analytical Biochemistry 1965, 11, 389-391.
(87) Armitage, B., Chemical Reviews 1998, 98, 1171-1200.
(88) Gelfi, C.; Righetti, P. G., Electophoresis 1981, 2, 213-219.
(89) Righetti, P. G.; Brost, B. C. W.; Snyder, R. S., Journal of Biochemical and
Biophysical Methods 1981, 4, 347-363.
(90) Anker, H. S., FEBS Letters 1970, 7, 293.
(91) Tas, J.; de Vries, A. C. J.; Berndsen, R., Analytical Biochemistry 1979, 100, 264-
270.
(92) Hahn, E. C.; Hahn, P. S., Journal of Virological Methods 1987, 15, 41-52.

194
(93) Baumann, G.; Chrambach, A., Analytical Biochemistry 1976, 70, 32-38.
(94) Cain, D. F.; Pitney, R. E., Analytical Biochemistry 1968, 22, 11-20.
(95) Choules, G. L.; Zimm, B. H., Analytical Biochemistry 1965, 13, 336-344.
(96) Peacock, A. C.; Dingman, C. W., Biochemistry 1967, 6, 1818-1827.
(97) Alpers, D. H.; Glickman, R., Analytical Biochemistry 1970, 35, 314-320.
(98) Hansen, J. N., Analytical Biochemistry 1976, 76, 37-44.
(99) Hansen, J. N., Analytical Biochemistry 1981, 116, 146-151.
(100) Faulkner, R. D.; Carraway, R.; Bhatnagar, Y. M., Biochimica et Biophysica Acta
(BBA) - Protein Structure and Molecular Enzymology 1982, 708, 245-252.
(101) Seymour, J. L.; Lazarus, R. A., Analytical Biochemistry 1989, 178, 243-247.
(102) Späth, P. J.; Koblet, H., Analytical Biochemistry 1979, 93, 275-285.
(103) Maros, L.; Molnar-Perl, I.; Kover, L., Journal of the Chemical Society, Perkin
Transactions 2 1976, 0, 1337-1342.
(104) Hansen, J. N.; Pheiffer, B. H.; Boehnert, J. A., Analytical Biochemistry 1980, 105,
192-201.
(105) Galvani, M.; Hamdan, M.; Righetti, P. G., Electophoresis 2000, 21, 3684-3692.
(106) Haenen, G. R. M. M.; Bast, A., Biochemical Pharmacology 1991, 42, 2244-2246.
CHAPTER 5
(1) Leriche, G.; Chisholm, L.; Wagner, A., Bioorganic & Medicinal Chemistry 2012, 20,
571-582.
(2) Chen, G.-Q.; Patel, M. K., Chemical Reviews 2011, 112, 2082-2099.
(3) Zhou, H.; Woo, J.; Cok, A. M.; Wang, M.; Olsen, B. D.; Johnson, J. A., Proceedings
of the National Academy of Sciences 2012.
(4) Merrifield, R. B., Journal of the American Chemical Society 1963, 85, 2149-2154.
(5) Wang, S.-S., Journal of the American Chemical Society 1973, 95, 1328-1333.
(6) Scott, P. J. H., Linker strategies in solid-phase organic synthesis. 1st ed.; John Wiley
& Sons Ltd: 2009.
(7) Guo, J.; Yu, L.; Turro, N. J.; Ju, J., Accounts of Chemical Research 2010, 43, 551-
563.

195
(8) Sassolas, A.; Leca-Bouvier, B. D.; Blum, L. J., Chemical Reviews 2007, 108, 109-
139.
(9) Montague, M. F.; Hawker, C. J., Chemistry of Materials 2007, 19, 526-534.
(10) Gross, R. A.; Kalra, B., Science 2002, 297, 803-807.
(11) MacDonald, S. A.; Willson, C. G.; Frechet, J. M. J., Accounts of Chemical Research
1994, 27, 151-158.
(12) Dhar, S.; Kolishetti, N.; Lippard, S. J.; Farokhzad, O. C., Proceedings of the
National Academy of Sciences 2011, 108, 1850-1855.
(13) Dhar, S.; Liu, Z.; Thomale, J. r.; Dai, H.; Lippard, S. J., Journal of the American
Chemical Society 2008, 130, 11467-11476.
(14) Sletten, E. M.; Bertozzi, C. R., Accounts of Chemical Research 2011, 44, 666-676.
(15) Verhelst, S. H. L.; Fonović, M.; Bogyo, M., Angewandte Chemie International
Edition 2007, 46, 1284-1286.
(16) Lasprilla, A. J. R.; Martinez, G. A. R.; Lunelli, B. H.; Jardini, A. L.; Filho, R. M.,
Biotechnology Advances 2012, 30, 321-328.
(17) Bremer, C.; Tung, C. H.; Weissleder, R., Nature Medicine 2001, 7, 743-748.
(18) Cravatt, B. F.; Wright, A. T.; Kozarich, J. W., Activity-based protein profiling:
From enzyme chemistry. Annual Review of Biochemistry, 2008; Vol. 77, pp 383-414.
(19) Cui, L.; Cohen, J. L.; Chu, C. K.; Wich, P. R.; Kierstead, P. H.; Fréchet, J. M. J.,
Journal of the American Chemical Society 2012, 134, 15840-15848.
(20) Traut, R. R.; Bollen, A.; Sun, T.-T.; Hershey, J. W. B.; Sundberg, J.; Pierce, L. R.,
Biochemistry 1973, 12, 3266-3273.
(21) van Nostrum, C. F.; Veldhuis, T. F. J.; Bos, G. W.; Hennink, W. E., Polymer 2004,
45, 6779-6787.
(22) Hu, J.; Zhang, G.; Liu, S., Chemical Society Reviews 2012, 41, 5933-5949.
(23) Murthy, N.; Xu, M.; Schuck, S.; Kunisawa, J.; Shastri, N.; Fréchet, J. M. J.,
Proceedings of the National Academy of Sciences 2003, 100, 4995-5000.
(24) Pullela, P. K.; Chiku, T.; Carvan, M. J.; Sem, D. S., Analytical Biochemistry 2006,
352, 265-273.

196
(25) Gartner, C. A.; Elias, J. E.; Bakalarski, C. E.; Gygi, S. P., Journal of Proteome
Research 2007, 6, 1482-1491.
(26) D. Nicodemus, G.; J. Bryant, S., Tissue Engineering: Part B 2008, 14, 149-165.
(27) Patterson, J.; Siew, R.; Herring, S. W.; Lin, A. S. P.; Guldberg, R.; Stayton, P. S.,
Biomaterials 2010, 31, 6772-6781.
(28) Phelps, E. A.; Landázuri, N.; Thulé, P. M.; Taylor, W. R.; García, A. J.,
Proceedings of the National Academy of Sciences 2010, 107, 3323-3328.
(29) Griset, A. P.; Walpole, J.; Liu, R.; Gaffey, A.; Colson, Y. L.; Grinstaff, M. W.,
Journal of the American Chemical Society 2009, 131, 2469-2471.
(30) Nguyen, Q. T.; Olson, E. S.; Aguilera, T. A.; Jiang, T.; Scadeng, M.; Ellies, L. G.;
Tsien, R. Y., Proceedings of the National Academy of Sciences of the United States of
America 2010, 107, 4317-4322.
(31) Kloxin, A. M.; Kasko, A. M.; Salinas, C. N.; Anseth, K. S., Science 2009, 324, 59-
63.
(32) Leriche, G.; Budin, G.; Brino, L.; Wagner, A., European Journal of Organic
Chemistry 2010, 4360-4364.
(33) Luo, Y.; hoichet, M. S., Nature Materials 2004, 3, 1476-1122.
(34) Kloxin, A. M.; Tibbitt, M. W.; Anseth, K. S., Nature Protocols 2010, 5, 1867-87.
(35) Fedorovich, N. E.; Oudshoorn, M. H.; van Geemen, D.; Hennink, W. E.; Alblas, J.;
Dhert, W. J. A., Biomaterials 2009, 30, 344-353.
(36) Meinhardt, M.; Krebs, R.; Anders, A.; Heinrich, U.; Tronnier, H., Journal of
Biomedical Optics 2008, 13, 044030-044030.
(37) Sletten, E. M.; Bertozzi, C. R., Angewandte Chemie International Edition 2009, 48,
6974-6998.
(38) Hangauer, M. J.; Bertozzi, C. R., Angewandte Chemie 2008, 120, 2428-2431.
(39) Guo, J., et al., Proceedings of the National Academy of Sciences 2008, 105, 9145-
9150.
(40) Franzini, R. M.; Kool, E. T., Journal of the American Chemical Society 2009, 131,
16021-16023.

197
(41) Cera, C.; Egbertson, M.; Teng, S. P.; Crothers, D. M.; Danishefsky, S. J.,
Biochemistry 1989, 28, 5665-5669.
(42) Lin, F. L.; Hoyt, H. M.; van Halbeek, H.; Bergman, R. G.; Bertozzi, C. R., Journal
of the American Chemical Society 2005, 127, 2686-2695.
(43) Bentley, D. R., et al., Nature 2008, 456, 53-59.
(44) Amyes, T. L.; Jencks, W. P., Journal of the American Chemical Society 1989, 111,
7888-7900.
(45) Gunsalus, I. C.; Barton, L. S.; Gruber, W., Journal of the American Chemical
Society 1956, 78, 1763-1766.
(46) Daun, J.; Fields, S.; Kobayashi, S. US patent application US20040186127 A1 2004
(47) P tzsch, R.; Fleischmann, S.; Tock, C.; Komber, H.; Voit, B. I., Macromolecules
2011, 44, 3260-3269.
(48) Strohalm, M.; avan, D.; Nov k, P.; Voln , M.; Havl ek, V. r., Analytical
Chemistry 2010, 82, 4648-4651.
(49) Parrish, J. P.; Dueno, E. E.; Kim, S. I.; Jung, K. W., Synthetic Communications
2000, 30, 2687-2700.
(50) Johnstone, R. A. W.; Rose, M. E., Tetrahedron 1979, 35, 2169-2173.
(51) Nowick, J. S.; Brower, J. O., Journal of the American Chemical Society 2003, 125,
876-877.
(52) Upadhyay, S. K., Chemical Kinetics and Reaction Dynamics. Springer: 2006.
(53) Moody, E. M.; Brown, T. S.; Bevilacqua, P. C., Journal of the American Chemical
Society 2004, 126, 10200-10201.
(54) Li, H.; Franzini, R. M.; Bruner, C.; Kool, E. T., Chembiochem 2010, 11, 2132-2137.
(55) Franzini, R. M.; Kool, E. T., Chemistry – A European Journal 2011, 17, 2168-2175.
(56) Franzini, R. M.; Kool, E. T., Bioconjugate Chemistry 2011, 22, 1869-1877.
(57) Kreevoy, M. M.; Taft, R. W., Journal of the American Chemical Society 1955, 77,
5590-5595.
(58) Staudinger, H.; Meyer, J., Helvetica Chimica Acta 1919, 2, 635-646.
(59) Scriven, E. F. V.; Turnbull, K., Chemical Reviews 1988, 88, 297-368.
(60) Saxon, E.; Bertozzi, C. R., Science 2000, 287, 2007-2010.

198
(61) van Berkel, S. S.; van Eldijk, M. B.; van Hest, J. C. M., Angewandte Chemie
International Edition 2011, 50, 8806-8827.
(62) Prescher, J. A.; Dube, D. H.; Bertozzi, C. R., Nature 2004, 430, 873-877.
(63) Saxon, E.; Luchansky, S. J.; Hang, H. C.; Yu, C.; Lee, S. C.; Bertozzi, C. R.,
Journal of the American Chemical Society 2002, 124, 14893-14902.
(64) Whitesides, G. M.; Lilburn, J. E.; Szajewski, R. P., The Journal of Organic
Chemistry 1977, 42, 332-338.
(65) Baker, N. D.; Griffin, R. J.; Irwin, W. J.; Slack, J. A., International Journal of
Pharmaceutics 1989, 52, 231-238.
(66) Handlon, A.; Oppenheimer, N., Pharmaceutical Research 1988, 5, 297-299.
(67) Shay, K. P.; Moreau, R. F.; Smith, E. J.; Smith, A. R.; Hagen, T. M., Biochimica et
Biophysica Acta (BBA) - General Subjects 2009, 1790, 1149-1160.
(68) Han, J. C.; Han, G. Y., Analytical Biochemistry 1994, 220, 5-10.
(69) Matsugo, S.; Han, D.; Tritschler, H. J.; Packer, L., Biochemistry & Molecular
Biology International 1996, 38, 51-59.
(70) Naik, A.; Irwin, W. J.; Griffin, R. J., International Journal of Pharmaceutics 1993,
89, 51-63.
(71) Cartwright, I. L.; Hutchinson, D. W.; Armstrong, V. W., Nucleic Acids Research
1976, 3, 2331-2339.
(72) Shaked, Z. e.; Szajewski, R. P.; Whitesides, G. M., Biochemistry 1980, 19, 4156-
4166.
(73) Luo, D.; Smith, S. W.; Anderson, B. D., Journal of Pharmaceutical Sciences 2005,
94, 304-316.
(74) Gascoigne, I. M.; Radda, G. K., Biochimica et Biophysica Acta 1967, 131, 498-507. (75) Lamoureux, G. V.; Whitesides, G. M., The Journal of Organic Chemistry 1993, 58,
633-641.
(76) Singh, R.; Whitesides, G. M., The Journal of Organic Chemistry 1991, 56, 2332-
2337.
(77) Lukesh, J. C.; Palte, M. J.; Raines, R. T., Journal of the American Chemical Society
2012, 134, 4057-4059.

199
(78) Getz, E. B.; Xiao, M.; Chakrabarty, T.; Cooke, R.; Selvin, P. R., Analytical
Biochemistry 1999, 273, 73-80.
(79) Tam, A.; Soellner, M. B.; Raines, R. T., Journal of the American Chemical Society
2007, 129, 11421-11430.
(80) Pyun, S. Y.; Lee, Y. H.; Kim, T. R., Kinetics and Catalysis 2005, 46, 21-28.
(81) Shalev, D. E.; Chiacchiera, S. M.; Radkowsky, A. E.; Kosower, E. M., The Journal
of Organic Chemistry 1996, 61, 1689-1701.
(82) Leffler, J. E.; Tsuno, Y., The Journal of Organic Chemistry 1963, 28, 902-906.
(83) Leffler, J. E.; Temple, R. D., Journal of the American Chemical Society 1967, 89,
5235-5246.
(84) Mathew, J. S.; Klussmann, M.; Iwamura, H.; Valera, F.; Futran, A.; Emanuelsson,
E. A. C.; Blackmond, D. G., The Journal of Organic Chemistry 2006, 71, 4711-4722.
(85) Whipple, E. B.; Ruta, M., The Journal of Organic Chemistry 1974, 39, 1666-1668.
(86) Migneault, I.; Dartiguenave, C.; Bertrand, M. J.; Waldron, K. C., BioTechniques
2004, 37, 790-802.
(87) Gruen, L. C.; McTigue, P. T., Journal of the Chemical Society 1963, 5217-5223.
(88) Jencks, W. P., Journal of the American Chemical Society 1959, 81, 475-481.
CHAPTER 6
(1) Stuart, M. A. C., et al., Nature Materials 2010, 9, 101-113.
(2) Ugelstad, J.; Soderberg, L.; Berge, A.; Bergstrom, J., Nature 1983, 303, 95-96.
(3) Zhang, J.; Xu, S.; Kumacheva, E., Journal of the American Chemical Society 2004,
126, 7908-7914.
(4) Kang, Y.; Taton, T. A., Angewandte Chemie International Edition 2005, 44, 409-
412.
(5) Gan, D.; Mueller, A.; Wooley, K. L., Journal of Polymer Science Part A: Polymer
Chemistry 2003, 41, 3531-3540.
(6) Dong, B.; Manolache, S.; Somers, E. B.; Lee Wong, A. C.; Denes, F. S., Journal of
Applied Polymer Science 2005, 97, 485-497.

200
(7) Kopecek, J., Journal of Polymer Science Part A: Polymer Chemistry 2009, 47, 5929-
5946.
(8) Van Vlierberghe, S.; Dubruel, P.; Schacht, E., Biomacromolecules 2011, 12, 1387-
1408.
(9) Wichterle, O.; Lim, D., Nature 1960, 185, 117-118.
(10) Lee, K. Y.; Mooney, D. J., Chemical Reviews 2001, 101, 1869-1880.
(11) Hoffman, A. S., Advanced Drug Delivery Reviews 2002, 54, 3-12.
(12) Li, P., et al., Nature Materials 2011, 10, 149-156.
(13) Gilbert, P. M., et al., Science 2010, 329, 1078-1081.
(14) Rabilloud, T., Journal of Proteomics 2010, 73, 1562-1572.
(15) D. Nicodemus, G.; J. Bryant, S., Tissue Engineering: Part B 2008, 14, 149-165.
(16) Lin, C.-C.; Metters, A. T., Advanced Drug Delivery Reviews 2006, 58, 1379-1408.
(17) Raymond, S.; Weintraub, L., Science 1959, 130, 711.
(18) Vesterberg, O., Electophoresis 1993, 14, 1243-1249.
(19) Alberts, B.; Johnson, A.; Lewis, J.; Raff, M.; Roberts, K.; Walter, P., Molecular
Biology of the Cell. 5th ed.; Garland Science: 2007.
(20) Seelert, H.; Krause, F., Electophoresis 2008, 29, 2617-2636.
(21) Aaij, C.; Borst, P., Biochimica et Biophysica Acta (BBA) - Nucleic Acids and
Protein Synthesis 1972, 269, 192-200.
(22) Raymond, S.; Nakamichi, M., Analytical Biochemistry 1962, 3, 23-30.
(23) Stellwagen, N. C., Electophoresis 2009, 30, S188-S195.
(24) Hawcroft, D. M., Electrophoresis. Oxford University Press: 1997.
(25) Krause, F., Electrophoresis 2006, 27, 2759-2781.
(26) Poetsch, A.; Neff, D.; Seelert, H.; Schägger, H.; Dencher, N. A., Biochimica et
Biophysica Acta (BBA) - Biomembranes 2000, 1466, 339-349.
(27) Coppola, J. A.; Luse, D. S., Journal of Molecular Biology 1984, 178, 415-437.
(28) Seelig, B., Nature Protocols 2011, 6, 540-552.
(29) Kim, Y. K.; Kwon, Y. J., Proteomics 2009, 9, 3765-3771.
(30) Kim, Y. K.; Kwon, Y. J., Electophoresis 2010, 31, 1656-1661.
(31) Antal, J.; Banyasz, B.; Buzas, Z., Electrophoresis 2007, 28, 508-511.

201
(32) Anker, H. S., FEBS Letters 1970, 7, 293.
(33) Tas, J.; de Vries, A. C. J.; Berndsen, R., Analytical Biochemistry 1979, 100, 264-
270.
(34) Cain, D. F.; Pitney, R. E., Analytical Biochemistry 1968, 22, 11-20.
(35) Choules, G. L.; Zimm, B. H., Analytical Biochemistry 1965, 13, 336-344.
(36) Peacock, A. C.; Dingman, C. W., Biochemistry 1967, 6, 1818-1827.
(37) Alpers, D. H.; Glickman, R., Analytical Biochemistry 1970, 35, 314-320.
(38) Hansen, J. N., Analytical Biochemistry 1976, 76, 37-44.
(39) Hansen, J. N., Analytical Biochemistry 1981, 116, 146-151.
(40) Faulkner, R. D.; Carraway, R.; Bhatnagar, Y. M., Biochimica et Biophysica Acta
(BBA) - Protein Structure and Molecular Enzymology 1982, 708, 245-252.
(41) Seymour, J. L.; Lazarus, R. A., Analytical Biochemistry 1989, 178, 243-247.
(42) Duckworth, B. P.; Xu, J.; Taton, T. A.; Guo, A.; Distefano, M. D., Bioconjugate
Chemistry 2006, 17, 967-974.
(43) Delgado, M.; Spanka, C.; Kerwin, L. D.; Wentworth, P.; Janda, K. D.,
Biomacromolecules 2001, 3, 262-271.
(44) Hassur, S. M.; Whitlock Jr, H. W., Analytical Biochemistry 1974, 59, 162-164.
(45) Zipper, H.; Brunner, H.; Bernhagen, J.; Vitzthum, F., Nucleic Acids Research 2004,
32, e103.
(46) Sambrook, J.; Russell, D. W., Molecular Cloning: a Laboratory Manual. 3rd ed.;
Cold Spring Harb. Lab. Press: 2001; Vol. 3.
(47) Ortí, G.; Pearse, D. E.; Avise, J. C., Proceedings of the National Academy of
Sciences 1997, 94, 10745-10749.
(48) Lavabre, D.; Pimienta, V.; Levy, G.; Micheau, J. C., The Journal of Physical
Chemistry 1993, 97, 5321-5326.
(49) Gibson, M. S.; Bradshaw, R. W., Angewandte Chemie International Edition in
English 1968, 7, 919-930.
(50) Kwon, Y. J.; Standley, S. M.; Goodwin, A. P.; Gillies, E. R.; Fréchet, J. M. J.,
Molecular Pharmaceutics 2005, 2, 83-91.

202
(51) Broeckx, W.; Overbergh, N.; Samyn, C.; Smets, G.; L'Abbé, G., Tetrahedron 1971,
27, 3527-3534.
(52) Anderson, G. T.; Henry, J. R.; Weinreb, S. M., The Journal of Organic Chemistry
1991, 56, 6946-6948.
(53) Li, Y.; Yang, J.; Benicewicz, B. C., Journal of Polymer Science Part A: Polymer
Chemistry 2007, 45, 4300-4308.
(54) Sumerlin, B. S.; Tsarevsky, N. V.; Louche, G.; Lee, R. Y.; Matyjaszewski, K.,
Macromolecules 2005, 38, 7540-7545.
(55) Ladmiral, V.; Legge, T. M.; Zhao, Y.; Perrier, S. b., Macromolecules 2008, 41,
6728-6732.
(56) Li, G.; Zheng, H.; Bai, R., Macromolecular Rapid Communications 2009, 30, 442-
447.
(57) Li, C.; Hu, J.; Yin, J.; Liu, S., Macromolecules 2009, 42, 5007-5016.
(58) Young, A. J. Tailored Biomaterials for T Cell-Directed Applications. University of
Minnesota, 2011.
(59) Brauer G, M.; Argentar, H., Initiator-Accelerator Systems for Dental Resins. In
Initiation of Polymerization, American Chemical Society: 1983; Vol. 212, pp 359-371.
(60) Oldfield, F. F.; Yasuda, H. K., Journal of Biomedical Materials Research 1999, 44,
436-445.
(61) Fisher, R. G.; Woods, N. E.; Fuchs, H. E.; Sweet, R. M., Journal of Biological
Chemistry 1980, 255, 5082-5089.
(62) Fu, J.; Schoch, R. B.; Stevens, A. L.; Tannenbaum, S. R.; Han, J., Nature
Nanotechnology 2007, 2, 121-128.
(63) Clegg, G. A.; Fitton, J. E.; Harrison, P. M.; Treffry, A., Progress in Biophysics and
Molecular Biology 1981, 36, 53-86.
(64) Yang, V. C.; Langer, R., Analytical Biochemistry 1985, 147, 148-155.
(65) Summer, H.; Dröge, P.; Grämer, R., Journal of Visualized Experiments 2009,
e1485.

203
CHAPTER 7
(1) Hughes, S.; Moody, A., PCR (Methods Express). 1st ed.; Scion Publishing Ltd.:
2006.
(2) Alkilany, A. M.; Lohse, S. E.; Murphy, C. J., Accounts of Chemical Research 2012,
46, 650-661.
(3) Fritzsche, W.; Taton, T. A., Nanotechnology 2003, 14, R63.
(4) Shendure, J.; Ji, H., Nature Biotechnology 2008, 26, 1135-1145.
(5) Viuf, C.; Bols, M., Angewandte Chemie International Edition 2001, 40, 623-625.
(6) Lamoureux, G. V.; Whitesides, G. M., The Journal of Organic Chemistry 1993, 58,
633-641.
(7) Lukesh, J. C.; Palte, M. J.; Raines, R. T., Journal of the American Chemical Society
2012, 134, 4057-4059.
(8) Chen, Y.; Kamlet, A. S.; Steinman, J. B.; Liu, D. R., Nature Chemistry 2011, 3, 146-
153.
(9) Sletten, E. M.; Bertozzi, C. R., Accounts of Chemical Research 2011, 44, 666-676.
(10) Sletten, E. M.; Bertozzi, C. R., Angewandte Chemie International Edition 2009, 48,
6974-6998.