grain & oilseed production peace...
TRANSCRIPT
BC Agriculture Climate Change Adaptation Risk + Opportunity Assessment Series
Grain & Oilseed Production
Peace Region snapshot report

published March 2012 by the British Columbia Agriculture & Food Climate Action Initiative www.BCAgClimateAction.ca
project funding provided by Agriculture and Agri-food Canada BC Ministry of Agriculture BC Ministry of Environment Pacific Institute for Climate Solutions
other project partners BCAC/ARDCorp BC Ministry of Agriculture Investment Agriculture Foundation
authors Erica Crawford & Emily MacNair
contributing authors Rachelle Beveridge & Dr. David Connell
graphic design Rocketday
photographs from Flickr and Picture BC, under Creative Commons licenses: cover by Peace Photographics; page 3 by Andrew Tulosky; page 5 by Shannon; page 10 by Scott Lough; page 15 by Ricardo Alberto Lieva; page 17 by Carla Trask
British Columbia Agriculture & Food Climate Action Initiative acknowledges the financial assistance of Agriculture and Agri-Food Canada, the BC Ministry of Agriculture, and the Investment Agriculture Foundation of BC for making this project possible.
Agriculture and Agri-Food Canada, the BC Ministry of Agriculture and the Investment Agriculture Foundation of BC, are pleased to participate in the creation of this publication. We are committed to working with our industry partners to address issues of importance to the agriculture and agri-food industry in British Columbia. Opinions expressed in this publication are those of the BC Agriculture and Food Climate Action Initiative and not necessarily those of the Investment Agriculture Foundation, the BC Ministry of Agriculture or Agriculture and Agri-Food Canada.

Acknowledgements
This project has been initiated by the BC Agriculture Council’s Climate Action Initiative (CAI) to address the priorities identified in
the BC Agriculture Climate Change Action Plan. The Action Plan is intended to guide the agriculture sector in adapting to a changing climate and mitigating greenhouse gas emissions.
The Action Plan is available at: www.BCAgClimateAction.ca
This project involved contributions from many people in different capacities from its early stages through to its completion. The project management team assisted in developing, guiding and executing the project: Dr. David Connell (University of Northern BC), Jennifer Pouliotte (BC Ministry of Environment) and Allen James (BC Agriculture Council). In addition, Dr. Connell played a key role in developing the focus group design and providing background research. Rachelle Beveridge assisted with background research, focus groups, analysis of the interviews and development of Chapter 4 of the Provincial Report. Lauren Klose helped with background research and materials for the focus groups.
An Advisory Committee guided the project from conceptual stages through research design and production of the final reports: Allen James, BC Agriculture Council; Ted Van der Gulik, Sean Darling, Ian McLachlan, Orlando Schmidt, Jennifer Curtis and Linda Wilson, BC Ministry of Agriculture; Thomas White, Jennifer Pouliotte and Celine Davis, BC Ministry of Environment; Denise Neilsen, Scott Smith and Doug Edwards, Agriculture and Agri-Food
Canada; Stewart Cohen, Environment Canada; and Tom Pedersen, Pacific Institute for Climate Solutions.
Trevor Murdock and the Pacific Climate Impacts Consortium provided their assistance, support and technical advice. Input was provided by Markus Schnorbus (PCIC), Ellen Pond (UBC-CALP), Livia Bizikova (IISD), Dave Trotter (BC Ministry of Agriculture) and Ngaio Hotte (SFU-ACT). Christopher Kay (BC Ministry of Agriculture) provided copy-editing.
Many agricultural organizations around the province (and their hard-working staff) assisted in communicating with their members about the project. A number of individual producers and Ministry of Agriculture staff assisted by providing feedback on the provincial draft and the snapshot report drafts.
Thank you as well to the many agricultural producers and Ministry of Agriculture specialists who participated in the interviews and focus groups. Without the producers, who volunteered and took time away from their operations to participate, this study would not have been possible.
The results of this project will be applied to two new Climate Action Initiative projects in 2012–2013. The On-Farm Adaptation Practices project will explore appropriate farm level adaptation practices for BC agriculture. The Regional Agricultural Adaptation Strategies project will pilot a collaborative adaptation planning process involving local and regional government and the agriculture industry organizations as partners.

Contents
2 Project Rationale & Methodology
3 Agricultural ProfileHistorical role of agriculture in the Peace Region
Agricultural land base, soils & climate
Characteristics of Peace Region agriculture
5 Current Resilience & Adaptive CapacityFinancial resources
Human & social resources
Knowledge resources: Information, extension & research
Physical resources
Policy & regulatory resources
10 The Climate ScienceWeather, variability & climate change
BC climate change projections
Peace Region climate change projections
15 Impacts, Risks & Opportunities
17 Key ActionsPeace Region / grain producer focus group
19 Endnotes

BC Agriculture Climate Change Adaptation Risk + Opportunity Assessment Series — Peace Region March 2012 2
Project Rationale & Methodology
The BC Agriculture Climate Change Adaptation Risk + Opportunity Assessment is intended to improve collective
knowledge of how changes to the climate may impact agricultural commodities in key regions of BC, and the risks and opportunities associated with these impacts. The most important element of this assessment has been gathering perspectives from agricultural producers about their ability to adapt to current and projected challenges and opportunities, as well as identification of approaches, tools and resources required to better support adaptation.
To address the project’s goals, a review of existing research in the areas of climate science and climate change and agriculture was conducted. Data regarding the current state of the BC sector was also reviewed. Original data was collected through thirty-seven interviews and twelve focus groups with producers and specialists across the province. Interviews were focused on assessing how well individual producers felt they could adapt to a range of current challenges and opportunities. The focus groups brought together small groups of producers and other specialists to discuss the projected changes in climate, and the associated risks and opportunities for their operations, regions and commodities.
This project is an initial step in building knowledge and understanding of the implications of climate change for BC agriculture. The incredible diversity of the BC agriculture sector cannot be captured in a single study. Due to the limited breadth and scope of this study, a select number of commodities and regions were included. However, this study does offer
a foundation or baseline; a starting point for further dialogue as well as guidance for development of approaches and resources to enhance BC’s agriculture sector in a changing climate.
The overall findings of this project are available through a provincial report. In addition, a series of region/commodity “Snapshot” reports have been developed. This “Snapshot” report is intended to communicate the findings and key action items associated with grain production in the Peace Region of British Columbia. The study’s overall recommendations (that apply across the province) are available through an Executive Summary document.
Report structure
■ Agricultural Profile provides a high level description of the sector, its major characteristics and context.
■ Adaptive Capacity highlights challenges, strengths and variations in the Peace Region grain and oilseed sector’s capacity to adapt to challenging conditions.
■ Climate Science provides an introduction to the climate science, including a review of provincial and regional level climate trends and projections.
■ Impacts, Risks & Opportunities outlines the major climate change impacts, risks and opportunities for grain and oilseed production.
■ Key Actions highlights the priority actions identified through the focus groups.

BC Agriculture Climate Change Adaptation Risk + Opportunity Assessment Series — Peace Region March 2012 3
Agricultural Profile
Historical role of agriculture in the Peace Region1
A gricultural production has been an economic mainstay of the Peace Region since European settlement in the early 1900s.
Wheat was the most common crop, along with oats for livestock feed. Agricultural producers in the Peace Region suffered from the economic hardship of the Great Depression, but the area did not experience the droughts that so severely impacted the southern Prairies. During this period, the production of wheat and oats increased and surpluses where shipped out of the Peace Region.
In the 1930s and 1940s the production of flax, legumes and grass crops for seed increased. By the 1950s, barley surpassed wheat as the primary crop. Oats and canola are also historically important crops in the region. Honey production was well established in the area early on. The livestock industry took longer to develop its firm foothold in the Region, but is now substantial.2
Expansion of land-based linkages, including the construction of the Alaska Highway, improved transportation networks and increased the economic opportunities in the Peace Region. By the mid-1960s, the coal, oil and gas and hydro-electric industries provided substantial economic benefits, along with
the expansion of the forestry industry. However, agriculture has remained a steady and stable economic base for the Peace Region for 100 years and today it is estimated that about 9% of the population is involved in food production.3
Agricultural land base, soils & climate
The Peace River Regional District is the largest in British Columbia. The area’s population (approximately 58,000 people) is concentrated in the area of the Peace River and its tributaries.4 The region’s topography varies from relatively flat in the north east, to mountainous in the south and west.
The varied topography gives rise to a range of vegetation and soil types. Winter conditions in the Peace Region have restricted soil forming processes and winter frosts penetrate deeply into many soils.5 The dominant soils in the region are Grey Luvisols, developed under forest vegetation on loamy to clay glacial till.6 Most of the area’s soils are prone to water erosion and some are acidic (low pH).7
The climate in the Peace Region is typically defined as “continental,” with long cold winters and short warm summers. The average annual precipitation in the Peace Region is moderate, estimated to vary between 350 and 500mm. High rates of evapo-transpiration often create water deficits and dry soils in late

BC Agriculture Climate Change Adaptation Risk + Opportunity Assessment Series — Peace Region March 2012 4
summer, particularly in lowland areas.8 It is moisture availability that is defined as the primary limiting factor for much of the agricultural land in the Peace River Valley.
Within the broader Peace Region, just under half of the Agricultural Land Reserve land (about 490,000 hectares) is defined as class 3 or better.9 As one of Canada’s northernmost farming areas, the Peace Region benefits from long daylight hours during the summer which allow for the production of crops requiring a high number of growing degree days. The Peace Region growing conditions tend to support early maturing or short season crops that can perform well at lower temperatures and take advantage of the long daylight hours.
Characteristics of Peace Region agriculture
With approximately 890,000 hectares in farmland, the Peace Region is the largest agricultural area in the province. In 2006, about 31% of the farmland in BC was located in the Peace Region and about 9% of the total number of farms in the province.10 The average farm size in the Peace Region is 521 hectares (compared with an average 143 hectares within the province as a whole).11
At the time of the last census there were about 1,700 farms in the area (about 2,500 farmers) with an average age of 52.12 The Peace Region’s farms annually produce almost $140 million in products. In comparison with BC’s other agricultural areas, land prices and the cost of production in the Peace Region have remained relatively low.
The region’s major crops include: wheat, oats, barley, canola, field peas, fescue and alfalfa. Up to 90% of British Columbia’s grain and 95% of its canola are produced in the Peace Region.13 The region is also a prime area for producing exceptional quality grass seeds.
In 2006, almost 23% of the province’s beef cattle were located in the Peace River Regional District; this is more than any other region of the province.14 In addition to a significant cow/calf industry (almost 146,000 cattle/calves reported in the 2006 Census) the northern portion of the region produces almost three quarters of BC’s bison. The only federally inspected slaughter facility in the region is located in Dawson Creek and most calves leave the region to be finished in Alberta.15
A growing number of farms in the Peace Region are now producing certified organic beef, bison, poultry, hogs, eggs, wheat, barley, hay, oil seeds and potatoes. Short season crops are also viable in proximity to the Peace River and its tributaries (low elevation areas). Viable crops include: potatoes, rutabagas, carrots, beets, cabbage, lettuce, peas, tomatoes and sweet corn.16 Despite this potential for versatility, production for nearby markets in commodities such as dairy, vegetables and eggs, remains limited.
The price of grain is influenced by a range of global variables including the weather conditions and quantity and quality of production in jurisdictions outside of BC.

BC Agriculture Climate Change Adaptation Risk + Opportunity Assessment Series — Peace Region March 2012 5
Current Resilience & Adaptive Capacity
A dapting to changing and challenging conditions of all kinds is a constant element of agricultural practice, and producers have long
been in the business of maximizing their resources to adjust to variability. This variability can occur in a range of areas including weather, markets, input prices and regulations. To effectively manage their operations farmers have to continually learn, change and adjust their approaches, as well as collaborate with a broad range of partners.
Adaptive capacity describes the presence of necessary resources and the ability to mobilize those resources to effectively respond to various challenging conditions in both the immediate and long-term. Resources may be at the farm or sector level, or a result of the broader social, biophysical, economic, or institutional context. In addition, knowledge resources, the ability to re-organize and the capacity for ongoing learning are critical to mobilizing effective responses to climate change.17 In part because future climate conditions may be unexpected or unprecedented, managing the effects of climate change requires, above all, flexibility to address a range of potential impacts and to change course as required.
Figure 1 outlines many elements that factor into the agriculture sector’s ability to adapt. These elements
are expressed as five interrelated types of resources: financial, physical, human & social, knowledge and policy & regulatory.18
Evaluating the approaches, resources and tools currently utilized by producers to manage through challenging or changing conditions, is a first step in exploring the resilience of the industry.19 For this reason, the interviews conducted with producers and other specialists focused on existing resources and tools employed to manage through variability or difficult conditions, as well as current barriers or challenges to adapting and overall resilience.
If you have money to spend you will adapt but if you get hit with low prices and you have poor
crops to boot, not a lot of farmers will be able to weather that… Right now we say in the Peace
country in the grain farming industry, we have shrunk [ourselves] to survival of the fittest
already because of all the different challenges we’ve had over the last 20 years. So the people who are staying in farming, we’re going to get
better at it and are going to do well at it.
— grain producer, Taylor

BC Agriculture Climate Change Adaptation Risk + Opportunity Assessment Series — Peace Region March 2012 6
Some studies evaluate adaptive capacity through quantitative data. Various indicators can be used to measure the industry’s capacity in certain areas.20 This study does not employ a quantitative approach, in part because the BC sector’s diversity does not lend itself well to this type of analysis. In addition, many elements of adaptive capacity cannot be meaningfully expressed in quantitative terms.
For this reason, the majority of the data that informs the analysis below was drawn from interviews with producers and other sector specialists; additional data was collected throughout the focus group sessions. The analysis is divided into the five categories of adaptive capacity identified in the Figure 1, but with a focus on the specific issues and themes that emerged through the research.
Financial resources
The ability of the industry to cope with challenging and changing conditions is strongly influenced by the
availability of sufficient and stable financial resources. The economic circumstances across the sector, and from one operation to another, vary considerably. Therefore, the financial resources available to support adaptation are similarly variable.
Farm businesses struggling with marginal economic circumstances are not likely to prioritize investing in new approaches or technologies. Periodic economic setbacks, such as extreme weather, can also add up to make upgrading, innovating and reinvesting difficult. The BC grain and oilseed industry, particularly in recent years, has experienced fluctuations in farm revenues. The fluctuations are attributable to both volatile market prices and seasonal conditions.
The price of grain is influenced by a range of global variables including the weather conditions and quantity and quality of production in jurisdictions outside of BC. In recent years there has been an upward trend in input costs, which impacts the bottom line for grain and oilseed producers in
Governmentprograms& services
Regulatorycontext, bylaws
governancestructures
Networksassociations & resource
sharing
Farmoperators& labour
Community& interface
Knowledge,experience,education
& skills
Access to information& extension
Research,development& technology
Land, water& ecology
Off-farm& regional
infrastructure
On-farminfrastructure
Insurance& risk
management
Farmincome
Markets,processing,economiccontext
AdaptiveCapacity
in Agriculture
FinancialResources
PhysicalResources
KnowledgeResources
Human & Social
Resources
Policy &RegulatoryResources
Figure 1. Adaptive capacity in BC agriculture

BC Agriculture Climate Change Adaptation Risk + Opportunity Assessment Series — Peace Region March 2012 7
the Peace Region. This is in part due to the rapid expansion of the lucrative oil and gas industry in the region, which has driven up costs, such as labour, for other businesses.
According to census numbers, between 1991 and 2006, the number of grain and oilseed operations (including wheat) in BC dropped from 452 operations down to 250.21 These numbers represent both trends toward consolidation and diversification.* During this period of time, the hectares of production of various grain and oilseed crops have also dropped.** A recent series of drought years (2006, 2008 and 2010) have resulted in substantial financial losses for the industry.*** The provincial government waived farm income and production requirements for the 2011 property assessment roll to ensure that grain farms affected by prolonged drought did not lose their farm status.22
Those who have remained in grain production have demonstrated their capacity to adapt to challenging conditions. However, this difficult period has also revealed the vulnerability of the province’s grain production. The experiences of grain producers during the recent drought periods amply demonstrate the extent of risk involved in grain production.
Diversification is an important element of adaptive capacity because it creates a buffer against potential losses. In order to manage through difficult years, some grain producers have opted to diversify which strengthens their capacity to “ride it out” through bad years. Most operations produce more than one type of grain and/or oilseed crop and some have beef cattle.
Off farm income is also a substantial contributor to overall average income for grain farms.23 Off farm income is viewed as particularly important for smaller operations. The presence of the oil and gas industry provides alternate revenue sources for producers,
* These numbers anecdotally reflect the drop in the number of operations (as consolidation has occurred). However, there are more operations producing grain and oilseed than these numbers indicate. It may that the Census category for “grains and oilseeds” does not capture many of the mixed operations.
** In 1991, wheat production in BC was about 44,000 hectares and reduced steadily to 23,076 hectares reported in 2006. Production of barley, rye and flaxseed also dropped during this period.
*** 2010 crop insurance claims for the grain sector were approximately $11.4 million. The BC Grain Producers Association has estimated net losses for producers were an additional $19 million.
including rent, employment and the loaning out of farm equipment.24
To manage through uncertain, changing or difficult conditions, some grain producers choose to participate in government Business Risk Management programs. The extent to which producers are able to participate in the programs varies and, ultimately, direct income stabilization programs do not replace self-sufficiency and stable profit margins. However, at present they are a substantial component of managing variability.
While many producers view the production insurance and additional emergency compensation as providing important protection from losses, there is concern that the formulaic approaches used at present do not take into account the types losses being experienced. When significant losses occur, the responsiveness and timing of compensation programs is critical. In addition, programs may not have mechanisms in place to support a range of scenarios, such as incremental losses or losses in consecutive years.
Human & social resources
The primary asset for enhancing the resilience of agriculture is farmers themselves. However, across the province the current human and social resources of the sector are being stretched and this is impacting the ability to manage through difficult and changing conditions.
Farm operators
As noted in the agricultural profile, the demographics indicate that many Peace Region producers are
Also facing our industry is the age of our people…They’re an aging population [and]
they’re almost to retirement…they’re not really willing to change their methodologies so I
think…if they’re economically viable operations there will be young people moving in to take
over, but it has to make sense. And the younger [producers], I think they’re more willing to adapt to the changes or to try new things…
— grain producer, Clayhurst

BC Agriculture Climate Change Adaptation Risk + Opportunity Assessment Series — Peace Region March 2012 8
nearing retirement. When difficult conditions arise that require new approaches and investments, producers contemplating retirement are more likely to retain the status quo or to consider exiting the industry, which may also be the more cost-effective option. Producers with a longer planning horizon (new entrants or those with clear succession plans) are more likely to adapt to change or adopt new technologies and practices.
Networks & organizations
Producers use informal networks and word of mouth to share information about daily issues, challenges and new approaches. These informal networks are particularly important for producers with smaller scale and more remote operations, who may not participate in associations.
The BC Grain Producers Association provides a hub for education, research and connection between producers across the region. The Association also enables grain producers to draw on information from other areas by maintaining an active network with Prairie associations. The Peace Region has unique growing conditions and the grain trials conducted by the Grain Producers Association are viewed as critical for appropriate selection for local (and changing) conditions. The Association also provides other services to producers, for example, it purchased equipment for working on ditching and drainage that can be loaned out to individual producers for use.
While the Grain Producers Association plays a pivotal role, as government has stepped away from providing certain supports to producers, the pressure on industry organizations to fill these gaps is growing. Consequently, the staff and funding resources of these organizations are being stretched.
Knowledge resources: Information, extension & research
The Peace Region has many producers with decades of experience in agriculture. At the same time, when producers encounter new or challenging circum-stances, or wish to bolster their decision-making, they seek out information through a range of sources.
Web-based resources are increasingly drawn upon by producers for all types of information. Recently developed tools like the irrigation calculator25, can be easily accessed on-line. Producers can also draw on web resources from comparable jurisdictions. However, for geographic- or commodity-specific information, most producers continue to utilize more traditional options including educational workshops, field days, conferences or direct consultation with experts. Producers also share information with each other or seek it out through suppliers (of equipment, inputs, etc).
There has been a reduction in informational and extension resources that governments provide for BC agriculture and this is particularly acute in more remote regions. Most grain producers currently rely on their Association or paid extension services, but these sources are unable to address all of the informational and research needs of producers and the industry as a whole.
A range of informational gaps currently exist. One example is the limited weather data collection and availability to enable localized monitoring of patterns, trends and changes. Although some weather data is collected in the area by actors such as BC Hydro and oil and gas companies, it is currently unavailable to producers in a form that is straightforward for agricultural application.
Physical resources
The nature and condition of on-farm and surrounding physical resources plays an important role in the ability of producers to adapt to difficult conditions. This is particularly true with respect to variability and extremes in weather, which can challenge the existing infrastructure and available physical resources.
On-farm infrastructure: Equipment, technology & farm practices
The condition and efficacy of on-farm physical resources is important for farm resilience and producers continually improve and adjust their equipment, technology and practices.

BC Agriculture Climate Change Adaptation Risk + Opportunity Assessment Series — Peace Region March 2012 9
While the grain industry has been through difficult times in recent years, many producers have demonstrated an ability to adapt by employing different practices and approaches. For example, adopting conservation tillage and utilizing varieties that are better suited to their specific growing conditions. A number of additional examples are provided in the box below.
Current management practices/approaches
→ Conservation tillage
→ Crop residues management
→ Seed treatment
→ Variety testing & trials
→ Variety or crop changes
→ Crop rotation
→ Ditching & drainage improvements
→ Grassed waterways
→ Pest management practices
→ Wildlife management practices
→ Equipment changes
→ Crop insurance / wildlife damage payments
→ Business risk management
The extent to which producers are flexible with regards to investing in new technologies and practices is defined largely by other factors including: knowledge and information, financial resources and willingness to alter current approaches. The previously noted financial and informational constraints are limiting factors for adopting more costly on-farm infrastructure.
Local & regional infrastructure
Much of the physical infrastructure that farm businesses depend on is located beyond the boundaries of the farm. Regional and local
infrastructure plays a central role in the ability of producers to manage through challenging and variable conditions.
The overall agricultural potential of the Peace Region is a tremendous asset with respect to adaptation to climate change. While the quality of land and soils varies, the potential and scale of the agricultural land base enables greater flexibility than in most other areas of the province where the viable agricultural land base is considerably more limited.
Patterns of land use and management have a significant bearing on agriculture’s adaptive capacity. Changes that are made to the land base have both immediate and long-term impacts on agricultural production. For some producers, oil and gas activities on, or in close proximity to, agricultural lands raises concerns about the compatibility of the land uses, particularly with respect to the introduction of weeds and diseases onto farms, and drainage issues.
In the Peace region, the areas that are likely to require collective approaches for effective adaptation include: land use planning (particularly for impacts of competing land uses), water supply and irrigation, drainage management and transportation corridors.
Policy & regulatory resources
The policy and regulatory framework shapes the interface between government and the agriculture sector. Agriculture is embedded in a complex regulatory context with numerous government agencies. This can create a challenging and fragmented environment for producers managing through difficult or variable conditions. Producers also raised concerns regarding policy and regulatory approaches that constrain management options, or influence the surrounding context, in ways which, in turn, reduce the ability of producers to respond to changing or difficult conditions. Areas of particular concern were land management, drainage, ditching and erosion and wildlife management. Producers noted that these were areas where cross-agency and cross-jurisdictional cooperation is required, and where more flexible approaches that acknowledge management complexity would facilitate more resilient agricultural systems.
BC Agriculture Climate Change Adaptation Risk + Opportunity Assessment Series — Peace Region March 2012 10
The Climate ScienceWeather, variability & climate change
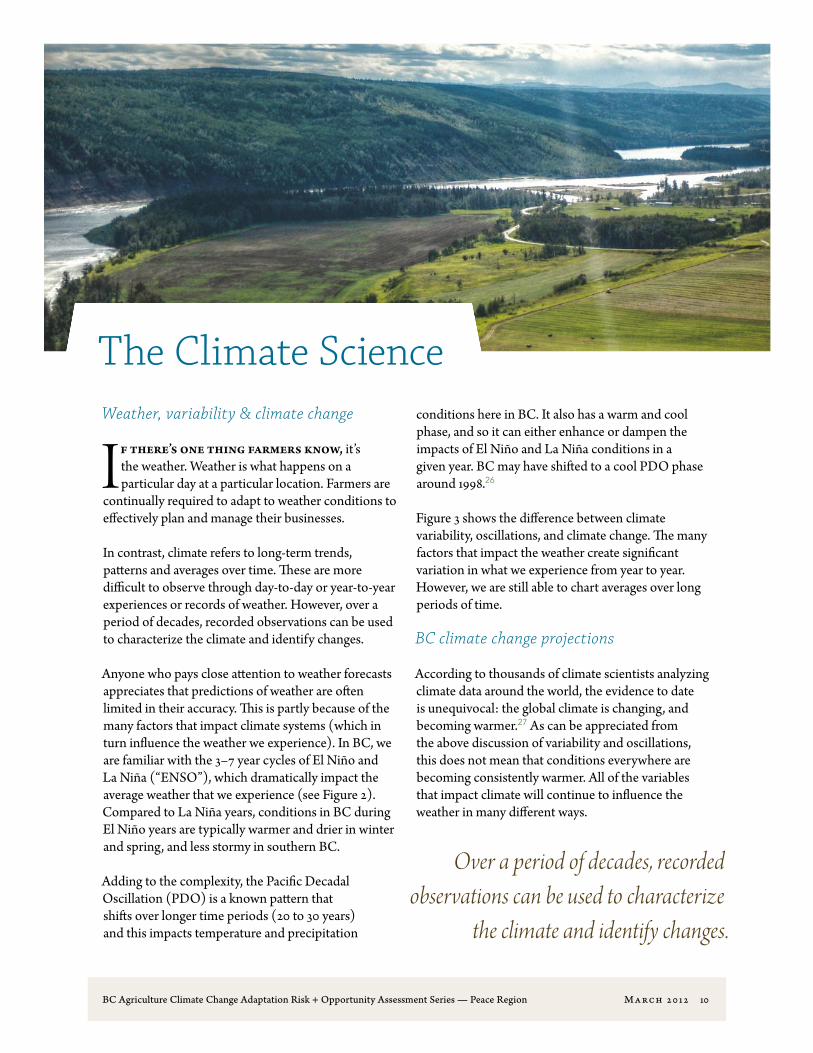
If there’s one thing farmers know, it’s the weather. Weather is what happens on a particular day at a particular location. Farmers are
continually required to adapt to weather conditions to effectively plan and manage their businesses.
In contrast, climate refers to long-term trends, patterns and averages over time. These are more difficult to observe through day-to-day or year-to-year experiences or records of weather. However, over a period of decades, recorded observations can be used to characterize the climate and identify changes.
Anyone who pays close attention to weather forecasts appreciates that predictions of weather are often limited in their accuracy. This is partly because of the many factors that impact climate systems (which in turn influence the weather we experience). In BC, we are familiar with the 3–7 year cycles of El Niño and La Niña (“ENSO”), which dramatically impact the average weather that we experience (see Figure 2). Compared to La Niña years, conditions in BC during El Niño years are typically warmer and drier in winter and spring, and less stormy in southern BC.
Adding to the complexity, the Pacific Decadal Oscillation (PDO) is a known pattern that shifts over longer time periods (20 to 30 years) and this impacts temperature and precipitation
conditions here in BC. It also has a warm and cool phase, and so it can either enhance or dampen the impacts of El Niño and La Niña conditions in a given year. BC may have shifted to a cool PDO phase around 1998.26
Figure 3 shows the difference between climate variability, oscillations, and climate change. The many factors that impact the weather create significant variation in what we experience from year to year. However, we are still able to chart averages over long periods of time.
BC climate change projections
According to thousands of climate scientists analyzing climate data around the world, the evidence to date is unequivocal: the global climate is changing, and becoming warmer.27 As can be appreciated from the above discussion of variability and oscillations, this does not mean that conditions everywhere are becoming consistently warmer. All of the variables that impact climate will continue to influence the weather in many different ways.
Over a period of decades, recorded observations can be used to characterize
the climate and identify changes.

BC Agriculture Climate Change Adaptation Risk + Opportunity Assessment Series — Peace Region March 2012 11
CLIMATE VARIABILITYShort term (years to decadal)
rises and falls about the trend line (ENSO)
CLIMATE OSCILLATIONSMulti-decadal oscillations
in regional climate (e.g. PDO, NAO)
CLIMATE CHANGELong Term Trends or
major shifts in climate (centuries)
Figure 2. ENSO patterns in BCThe top two maps depict temperature differences (1900–2004) from the average during El Niño years (left) and La Niña years (right).
The two bottom maps depict precipitation variations from average (again with El Niño at left, La Niña at right). Source: Pacific Climate Impacts Consortium, www.pacificclimate.org | Data source: Environment Canada CANGRID dataset
Figure 3. Climate variability, oscillations & changeDiagram showing difference between climate variability, oscillations, and climate change.
Adapted from original, courtesy of Pacific Climate Impacts Consortium, www.pacificclimate.org
(
(
(
(
(
(
((
(
(
(
(
(
(
(
(
(
(
(
(
(
(
(
(
(
(
(
(
(
( (
(
((
(
(
(
(
(
(
((
(
(
(
(
(
(
(
(
(
(
(
(
(
(
(
((
(
(
(
(
(
(
(
((
(
(
(
(
(
(
(
(
(
(
(
(
(
(
(
(
(
(
!
!
!
!
!
!
!
!
!
!
!
!
!
!
!
!
!
!
!
!
!
!
!
!
!
!
!
!
!
!
!
!
!
!
!
!
!
!
!
!
!
!
!
!
!
!
!
!
!
!
!
!
!
!
!
!
!
!
!
!
!
!
!
!
!
!
!
!
!
!
!!
!
!
!
!
!
!
!
!
!
!
!
!
!
!
!
!
!
!
!
!
!
!
!
!
!
!
!
!
!
!
!
!
!
!
!
!
!
!
!
!
!
!
!!
!
!
!
!
!
!
!
!
!
!
!
!
!
!
!
!
!
!
!
!
!!
!
!
!
!
!
!
!
!
!
!
!
!
!
!
!
!
!
!
!
!
!
!
!
!
!
!
!
!
!
!
!
!
!
!
!
!
!
!
!
!
!!
!
!
!
!
!
!
!
!
!
!
!
!
!
!
!
!
!
!
!
!
!
!
!
!
!
!
!
!
!
!
!
!
!
!
!!
!
!
!
!
!
!
!
!
!
!
!
!
!
!
!
!
!
!
!
!
!
!
!
!
!
!
!
!
!
!
!
!
!
!
!
!
!
!
!
!
!
!
!
!
!
!
!
!
!
!
!
!
!
!
!!
!
!
!
!
!
!
!
!
!
!
!
!
!
!
!
!
!
!
!
!
!
!
!
!
!
!
!
!
!
!
!
!
!
!
!
!
!
!
!
!
!
!
!
!
!
!
!
!
!
!
!
!
!
!
!
!
!
!
!
!
!
!
!
!
!
!
!
!
!
!
!
!
!
!
!
!
!
!
!
!
!
!
!
!
!
!
!
!
!
!
!
!
!
!
!
!
!
!
!
!
!
!
!
!
!
!
!
!
!
!
!
!
!
!
!
!
!
!
!
!
!
!
!
!
!
!
!
!
!
!
!
!!
!
!
!
!
!
!
!
!
!
!
!
!
!
!
!
!
!
!
!
!
!
!
!
!
!
!
!
!
!
!
!
!
!
!
!
!
!
!
!
!
!
!
!
!
!
!
!
!
!
!
!
!
!
!
!
!
!
!
!
!!
!
!
!
!
!
!
!
!
!
!
!
!
!
!
!
!
!
!
!
!
!
!
!
!
!
!
!
!
!
!
!
!
!
!!
!
!
!
!
!
!
!
!
!
!
!
!
!
! !
!
!
!
!
!
!
!
!
!
!
!
!
!
!
!
!
!
!
!
!
!
!
!
!
!
!
!
!
!
!
!
!
!
!
!
!
!
!
!
!
!
!
!
!
!
!
!
!
!
!
!
!
!
!
!
!
!
!
!
!
!
!
!
!
!
!
!
!
!!
!
!
!
!
!
!
!
!
!
!
!
!
!
!
!
! !
!
!
!
!
!
!
!
!
!
!
!
!
!!
!
!
!
!
!
!
!
!
!
!
!
!
!
!
!
!
!
!
!
!
!
!
!
!
! !
!
!
!
!
!
!
!
!
!
!
!
!
!
!
!
!
!
!
!
!
!
!
!
!
!!
!
!
!
!
!
!
!
!
!
!
!!
!
!
!
!
!
!
!
!
!
!
!
!
!
!
!
!
!
!
!
!
!
!
!
!
!
!
!
!
!
!
!
!
!
!
!
!
!
!
!
!
!
!
!
!
!
!
!
!
!
!
!
!
!
!
!
!
!
! !
!
!
!
!
!
!
!
!
!
!
!
!
!
!
!
!
!
!
!
!
!
!
!
!
!
!
!
!
!
!
!
!
!
!
!
!
!
!
!
!
!
!
!
!
!
!
!
!
!
!
!
!
!
!
!
!
!
!
!
!
!
!
!
!
!
!
!
!!
!
!
!
!
!
!
!
!
!
!
!
!
!
!
!
!
!
!
!
!
!
!
!
!
!
!
!
!
!
!
!
!
!
!
!
!
!
!
!
!
!
!
!
!
!
!
!
!
!
!
!
!
!
!
!
!
!
!!
!
!
!
!
!
!
!
!
!
!
!
!
!
!
!
!
!
!
!
!
!
!
!
!!
!
!
!
!
!
!
!
!
!
!
!
!
!
!
!
!
!
!
!
!
!
!
!
!
!
!
!
!
!
!
!
!
!
!
!
!
!
!
!
!
!
!
!
!
!
!
!
!
!
!
!
!
!
!
!
!
!
!
!
!
!
!
!
!
!
!
!
!
!
!
!
!
!
!
!
!
!
!
!
!
!
!
!
!
!
!
!
!
!
!
!!
!
!
!
!
!
!
!
!
!
!
!
!
!
!
!
!
!
!
!!
!
!
!
!
!
!
!
!
!
!
!
!
!
!
!
!
!
!
!
!
!
!
!
!
!
!
!
!
!
!
!
!
!
!
!
!
!
!
!
!
!
!
!
!
!
!
!
!
!
!
!
!
!
!!
!
!
!
!
!
!
!
!
!
!
!
!
!
!
!
!
!
!
!
!
!
!
!
!
!
!
!
!
!
!
!
!
!
!
!
!
!
!
!
!
!
!
!
!
!
!
!
!
!
!
!
!
!
!
!
!
!
!
!
!!
!
!
!
!
!!
!
!
!
!
!
!
!
!
!
!
!
!
!
!
!
!
!
!
! !
!
!
!
!
!
!
!
!
!
!
!
!
!
!
!
!
!
!
!
!
!
!
!
!
!
!
!
!
!
!
!
!
!
!
!
!
!
!
!
!
!
!
!
!!
!
!
!
!
!
!
!
!
!
!
!
!
!
!
!
!
!
!
!
!
!
!!
!
!
!
!
!
!
!
!
!
!
!
!
!!
!
!
!
!
!
!
!
!
!
!
!
! !
!
!
!
!
!
!
!
!
!
!
!
!
!
!
!
!
!
!
!
!
!
!
!
!
!
!
Winter mean temperature - El Niño (1900-2004)
¹
0 200 400
Kilometers
°C difference-2.8 to -2.4-2.4 to -2-2 to -1.6-1.6 to -1.2-1.2 to -0.8-0.8 to -0.4-0.4 to 0.40.4 to 0.80.8 to 1.21.2 to 1.61.6 to 22 to 2.4
( Climate Stations! Significant
(
(
(
(
(
(
(
(
(
(
(
(
(
(
(
(
(
(
(
(
(
(
(
(
(
(
(
(
(
(
(
(
(
(
(
(
(
(
(
(
(
(
(
(
(
(
((
(
(
(
(
(
(
(
(
(
(
(
(
(
(
(
(
( (
(
(
(
(
(
(
(
(
(
((
(
(
(
(
( (
(
(
(
(
(
(
((
(
(
(
(
(
(
(
(
(
(
(
(
(
(
(
((
((
(
(
(
(
(
(
(
(
(
(
(
(
(
(
(
(
(
(
(
(
(
(
(
(
(
(
((
(
(
(
(
(
(
(
(
(
(
((
(
(
(
(
(
(
(
(
(
(
(
(
(
(
(
(
(
(
(
(
(
(
(
(
((
(
(
((
(
(
(
(
(
(
(
(
(
(
(
(
(
(
(
(
(
(
(
(!
!
!
!
!!
!
!
!
!
!
!
!
!
!
!
!
!
!
!
!
!
!
!
!
!
!
!
!
!
!
!
!
!
!
!
!
!
!
!
!
!
!
!
!
!
!
!
!
!
!
!
!
!
!
!
!
!
!
!
!
!
!
!
!
!
!
!
!
!
!
!
!
!
!
!
!
!
!
!
!
!
!
!
!
!
!
!
!
!
!
!
!
!
!
!
!!
!
!!
!
!
!
!
!
!
!
!
!
!
!
!
!
!
!
!
!
!
!
!!
!
!
!
!
!
!
!!
!
!
!
!
!
!!
!
!
!
!
!
!
!
!
!
!
!
!
!
!
!
!
!
!
!
!!
!
Winter precipitation - El Niño (1900-2004)
¹
0 200 400
Kilometers
% change< -20-20 to -15-15 to -10-10 to -5-5 to -2.5-2.5 to 2.52.5 to 55 to 1010 to 1515 to 20> 20
! Significant( Climate Stations
(
(
(
(
(
(
((
(
(
(
(
(
(
(
(
(
(
(
(
(
(
(
(
(
(
(
(
(
( (
(
((
(
(
(
(
(
(
((
(
(
(
(
(
(
(
(
(
(
(
(
(
(
(
((
(
(
(
(
(
(
(
((
(
(
(
(
(
(
(
(
(
(
(
(
(
(
(
(
(
(
!
!
!
!
!
!
!
!
!
!
!
!
!
!
!
!
!
!
!
!
!
!
!
!
!
!
!
!
!
!
!
!
!
!
!
!
!
!
!
!
!
!
!
!
!
!
!
!
!
!
!
!
!
!
!
!
!
!
!
!
!
!
!
!
!
!
!
!
!
!
!
!
!
!
!
!
!
!
!
!
!
!
!
!
!
!
!!
!
!
!
!
!
!
!
!
!
!
!
!
!
!
!
!
!
!
!
!
!
!
!
!
!
!
!
!
!
!
!
!
!
!
!
!
!
!
!
!
!
!
!
!
!
!
!!
!
!
!
!
!
!
!
!
!
!
!
!
!
!
!
!
!
!
!
!
!
!
!
!
!
!
!
!!
!
!
!
!
!
!
!
!
!
!
!
!
!
!
!
!
!
!
!
!
!
!
!
!
!
!
!
!
!
!
!
!
!
!
!
!
!
!
!
!
!!
!
!
!
!
!
!
!
!
!
!!
!
!
!
!
!
!
!
!
!
!
!
!
!
!
!
!
!
!
!
!
!
!
!
!
!
!
!
!
!!
!
!
!
!
!
!
!
!
!
!
!
!
!
!
!
!
!
!
!
!
!
!
!
!
!
!
!
!
!
!
!
!
!
!
!
!
!
!
!
!
!
!
!
!
!
!
!
!
!
!
!
!
!
!
!
!!
!
!
!
!
!
!
!
!
!
!
!
!
!
!
!
!
!
!
!
!
!
!
!
!
!
!
!
!
!
!
!
!
!
!
!
!
!
!
!
!
!
!
!
! !
!
!
!
!
!
!
!
!
!
!
!
!
!
!
!
!
!
!
!
!
!
!
!
!
!
!
!
!
!
!
!! !
!
!
!
!
!
!
!
!
!
!
!
!
!
!
!
!
!
!
!
!
!
!
!
!
!
!
!
!
!
!
!
!
!
!
!
!
!
!
!
!
!
!
!
!
!
!
!
!
!
!
!
!
!
!
!
!
!!
!
!
!
!
!
!
!
!
!
!
! !
!
!
!
!
!
!
!
!
!
!!
!
!
!
!
!
!
!
!
!
!
!
!
!
!
! !
!
!
!
!
!
!
!
!
!
!
!
!
!
!
!
!
!
!
!
!
!!
!
!
!
!
!
!
!
!
!
!!
!
!
!
!
!
!
!
!
!
!
!
!
!
!
!
!
!
!
!
!
!
!
!
!
!
!
!
!
!
!
!
!
!
!
!
!
!
!
!
!
!
!
!
!
!
!
! !
!
!
!
!
!
!
!
!
!
!
!
!
!
!
!
!
!
!
!
!
!
!
!
!
!
!
!
!
!
!
!
!
!
!
!
!
!
!
!
!
!
!
!
!
!
!
!
!
!
!
!
!
!
!
!
!
!
!!
!
!
!
!
!
!
!
!
!
!
!
!
!
!
!
!
!
!
!
!
!
!
!
!
!
!
!
!
!
!
!
!
!
!
!
!
!
!
!!
!
!
!
!
!
!
!!
!
!
!
!
!
!
!
!
!
!
!
!
!
!
!
!
!
!
!
!
!
!
!
!
!
!
!
!
!
!
!
!
!
!
!
!
!
!
!
!
!
!
!
!
!
!
!
!
!
!
!
!
!
!
!
!
!
!
!
!
!
!
!
!
!
!
!
!
!
!
!
!
!
!
!
!
!
!
!
!
!
!!
!
!
!
!
!
!
!
!!
!
!
!
!
!
!!
!
!
!
!
!
!
!
!
!
!
!
!
!
!
!
!
!
!
!
!
!
!
!
!
!
!
!
!
!
!
!
!
!
!
!
!
!
!
!
!
!
!
!
!
!
!!
!
!
!
!
!
! !
!
!
!
!
!
!
!
!
!
!
!
!
!!
!
!
!
!
!
!
!
!
!
!
!
!
!
!
!
!
!
!
!
!
!
!
!
!
!
!
!
!
!
!
!
!
!
!
!
!
!
!
!
!
!
!
!
!
!
!
! !
!
!
!
!
!
!
!
!
!
!
!
!
!
!
!
!
!
!
!
!
!
!
!
!
!
!
!
!
!
!
!
!
!!
!
!
!
!
!
!
!
!
!
!
!!
!
!
!
!
!
!
!
!
!
!
!!
!
!
!
!
!
!
!
!
!
!
!
!
!
!
!
!
!
!
!
!
!
!
!
!
!
!
!
!!
Winter mean temperature - La Niña (1900-2004)
¹
0 200 400
Kilometers
°C difference-2.8 to -2.4-2.4 to -2-2 to -1.6-1.6 to -1.2-1.2 to -0.8-0.8 to -0.4-0.4 to 0.40.4 to 0.80.8 to 1.21.2 to 1.61.6 to 22 to 2.4
( Climate Stations! Significant
(
(
(
(
(
(
(
(
(
(
(
(
(
(
(
(
(
(
(
(
(
(
(
(
(
(
(
(
(
(
(
(
(
(
(
(
(
(
(
(
(
(
(
(
(
(
((
(
(
(
(
(
(
(
(
(
(
(
(
(
(
(
(
( (
(
(
(
(
(
(
(
(
(
((
(
(
(
(
( (
(
(
(
(
(
(
((
(
(
(
(
(
(
(
(
(
(
(
(
(
(
(
((
((
(
(
(
(
(
(
(
(
(
(
(
(
(
(
(
(
(
(
(
(
(
(
(
(
(
(
((
(
(
(
(
(
(
(
(
(
(
((
(
(
(
(
(
(
(
(
(
(
(
(
(
(
(
(
(
(
(
(
(
(
(
(
((
(
(
((
(
(
(
(
(
(
(
(
(
(
(
(
(
(
(
(
(
(
(
(
!
!
!
!
!
!
!
!!
!
!
!
!
!
!
!!
!
!
!
!
!
!
!
!
!
!
!
!
!
!
!
!
!
!
!
!
!
!
!
!
!
!
!
!
!
!
!
!
!
!
!
!
!
!
!
!
!
!
!
!
!
!
!
!
!
!
!
!
!
!!
!
!
!
!
!
!
!
!
! !
!
!!
!!
!
!
!
!
!
!
!
!
!
!!
!
!!
!
!
!
!
!
!
!
!
!
!
!
!
!
!
!
!
!
!
!
!
!
!
!!
!
!
!
!
!
!
!
!
!
!
!
!
!
!
!
!
!!
!
!
!
!
!
!
!
!
!
!
!
!
!
!
!
!
!
!
!
!
!
!
!
!
!
!
!
!
!
!
!
!
!
!
!
!
!
!
!
!
!
!
!
!
!
!
!
Winter precipitation - La Niña (1900-2004)
¹
0 200 400
Kilometers
% change< -20-20 to -15-15 to -10-10 to -5-5 to -2.5-2.5 to 2.52.5 to 55 to 1010 to 1515 to 20> 20
! Significant( Climate Stations

BC Agriculture Climate Change Adaptation Risk + Opportunity Assessment Series — Peace Region March 2012 12
In BC for example, warming has primarily been felt in an upward shift in BC’s coldest winter temperatures. Winter average temperatures have been increasing more than summer average temperatures. In other words, BC has been getting less cold more rapidly than it has been getting more hot.28 And changes will still impact each region of the province differently. So while the term “global warming” makes sense if you talk about the overall trend, at a regional level,
“climate change” is a more appropriate way to describe what is occurring.
While rising sea levels do not directly impact all regions, this could potentially reduce the overall agricultural land base of the province. Global sea level has risen more than 20 cm since 1899,29 but this
varies considerably by location due to land movement (rising or falling) and climate and weather variability. Future projections show that sea level rise will continue. Estimates for the BC coast over the next century suggest a possible sea level rise of at least 80 to 120 cm at the Fraser River Delta, and 50 to 80 cm at Nanaimo.30
The tables below summarize potential changes in climate variables that will affect agricultural production in the province. They provide overall changes on average for the whole province. There are significant variations in trends and projections for different regions of BC, and the next section addresses these differences for the Peace Region specifically.
Climate Projections for British Columbia in the 2020sSource: Pacific Climate Impacts Consortium, www.Plan2Adapt.ca
Time of Year Projected Change from 1961–1990 Baseline
Range (BC) Average (BC)
Average Temperature Annual +0.5 °C to +1.5 °C +1.0 °C
Precipitation Annual +0% to +7% +4%
Summer −4% to +5% +0%
Winter +1% to +8% +4%
Snowfall Winter −11% to +2% −2%
Spring −55% to −7% −30%
Growing Degree Days Annual +76 to +234 degree days +163 degree days
Frost-free days Annual +6 to +16 days +10 days
Climate Projections for British Columbia in the 2050sSource: Pacific Climate Impacts Consortium, www.Plan2Adapt.ca
Time of Year Projected Change from 1961–1990 Baseline
Range (BC) Average (BC)
Average Temperature Annual +1.3°C to +2.7 °C +1.8 °C
Precipitation Annual +2% to +11% +6%
Summer −8% to +6% −1%
Winter −2% to +16% +8%
Snowfall Winter −16% to +2% −10%
Spring −70% to −20% −58%
Growing Degree Days Annual +191 to +459 degree days +305 degree days
Frost-free days Annual +12 to +28 days +20 days

BC Agriculture Climate Change Adaptation Risk + Opportunity Assessment Series — Peace Region March 2012 13
Peace Region climate change projections
While regional climate data is improving rapidly in BC, at a local level there remain great differences in data availability and a limited set of climate modeling studies to draw from. As a result, this summary util-izes regional modeling where possible, and supple-ments this with broader scale studies as necessary.
In addition to overall temperature increases, average winter low temperatures have increased more significantly in the Peace (by 5.3°C in Fort St John between 1951 and 2006)31 than for the province as a whole, and this increase is projected to continue in the future.32 The annual number of frost-free days and the length of the overall frost-free period are projected
to increase. Annual growing degree days are also projected to increase.33
To illustrate the magnitude of projected changes, the average annual temperature in BC by the 2080s is pro-jected to increase by 2.8°C. This means that an average year in the 2080s will be as warm as the warmest years we have experienced in the past century.34 While 2080 might seem like a long way off, this change will occur in stages over the intervening period.
Precipitation is projected to increase in the Peace overall, and in all seasons except the summer. Most areas of the Peace can expect a slight increase in snowfall, a continuation of the observed trend for northern BC since the mid-20th century.35 An
Climate Projections for the Peace Region in the 2020sSource: Pacific Climate Impacts Consortium, www.Plan2Adapt.ca
Time of Year Projected Change from 1961–1990 Baseline
Range (Peace Region) Average (Peace Region) Average (BC)
Average Temperature Annual +0.5 °C to +1.5 °C +1.0 °C +1.0 °C
Precipitation Annual −2% to +9% +5% +4%
Summer −4% to +9% +2% +0%
Winter −1% to +12% +7% +4%
Snowfall Winter −1% to +10% +5% −2%
Spring −48% to −5% −30% −30%
Growing Degree Days Annual +66 to +186 degree days +134 degree days +163 degree days
Frost-free days Annual +5 to +14 days +9 days +10 days
Climate Projections for the Peace Region in the 2050sSource: Pacific Climate Impacts Consortium, www.Plan2Adapt.ca
Time of Year Projected Change from 1961–1990 Baseline
Range (Peace Region) Average (Peace Region) Average (BC)
Average Temperature Annual +1.4 °C to +2.8 °C +1.8 °C +1.8 °C
Precipitation Annual +1% to +15% +8% +6%
Summer −7% to +12% +3% −1%
Winter −5% to +22% +10% +8%
Snowfall Winter −7% to +16% +7% −10%
Spring −69% to −17% −56% −58%
Growing Degree Days Annual +142 to +397 degree days +241 degree days +305 degree days
Frost-free days Annual +10 to +25 days +16 days +20 days

BC Agriculture Climate Change Adaptation Risk + Opportunity Assessment Series — Peace Region March 2012 14
increasing portion of this will melt earlier on rather than being stored as snow.
The Peace Region is generally in transition to more of a combined rain-and-snow-dominated hydrological system, whereas most of the area’s runoff has been snow-dominated in the past. Some areas, such as the Alberta plateau east of the Rockies, will have rain-dominated runoff in the future, while higher elevation areas in the northwest of the Peace will remain snow-dominated.36 These types of regimes typically experience more unpredictable peak flows than in snow-dominated systems, and an increased risk of flash flooding in the winter.
Trends to date indicate that peak streamflow has been occurring earlier in May and June, and this shift is projected to continue in the future. That contributes to lower flows in August and September in some watercourses. Streamflow during the rest of the year is expected to increase.37 Dry conditions and droughts are expected to occur more frequently during the summer and early fall.
Extreme weather events are projected to occur more often in BC in the future, and studies have shown some specific trends already.38 These include an increase in heavy rainfall events in the spring, and an increase in extreme wet and extreme dry conditions in summer.
Forest fires have become more frequent and severe in western North America, and this trend is projected to continue.39

BC Agriculture Climate Change Adaptation Risk + Opportunity Assessment Series — Peace Region March 2012 15
Impacts, Risks & Opportunities
To develop a practical understanding of what these projected changes mean for the future of grain and oilseed production in the
Peace Region, a small group of producers from the area were engaged in a workshop focusing on the climate change scenario for the 2020s, just described. This section presents the results of this exploration of potential impacts, risks and opportunities for Peace region agriculture. Findings in this section also incorporate information gathered through interviews and broader background research regarding climate change impacts.
Extreme precipitation events pose a significant challenge for grain production. Some of the factors that influence the degree of associated risk include the severity and timing of the event. Extreme precipitation events are difficult to manage and it is hard for producers to justify investment in measures to mitigate events that are random and infrequent.
Likewise, increasing spring soil moisture could pose risks, although when accompanied by warmer temperatures this could provide benefits. The degree to which this is a risk or benefit relates to having
Potential agricultural impacts of significance for Grain & Oilseed production in the Peace Region in the 2020s
Changing Conditions Potential Agricultural Impacts
Extreme precipitation events Flash flooding, crop damage, input losses, impeded pollination, delayed planting, impeded combining
Increasing spring soil moisture Improved germination and emergence, water logged soils, delayed planting schedule and increased costs
Dry conditions or drought in summer and fall Decreased drying costs, decreased yields, improved grain quality, increased plant stress, slower weed growth, crop loss, increased feasibility of irrigation infrastructure
Changes in pests and diseases Increased winter survival rates, increased number of cycles in a year, introduction of new pests and diseases, increased management costs, complexity, uncertainty
Longer growing season, more heat units Different crops and variety suitability (higher value, longer maturing, fall-seeded), increased yields and quality, increased uncertainty
Increase wildlife and bird activity, success rates, population sizes
Increased crop damage and losses, increased (associated) conflicts with other stakeholders

BC Agriculture Climate Change Adaptation Risk + Opportunity Assessment Series — Peace Region March 2012 16
enough, but not too much, moisture at the right times. Spring moisture combined with warming could enable earlier germination and emergence (and improve growing conditions). Spring rains (too much, too early) could also impact the very small window available for planting, which would have serious consequences for production. More spring moisture could require changes to soil management, drainage infrastructure and erosion control, and different equipment is required to manage wet fields.
Similarly, dry conditions later in the season (summer and autumn) could be positive for grain production as a slight decrease in productivity is offset by slower weed growth, reduced costs of harvesting (both for equipment wear and tear, and grain conditioning) and improved quality. Drought, on the other hand, is unmanageable by definition. While producers employ a range of management practices to maintain viability through drought, consecutive years of low soil moisture or drought was identified as a serious risk for grain production.
The influence of climate change on growing season length and available heat units is seen as a moderate opportunity for the grain industry. An increase in growing degree days and fewer frost free days could enable higher yields and new varieties. A very small change could enable new varieties in the region. However, it is precisely when the frosts happen that is the limiting factor (it only takes one random frost to cause damage). The projected increase in variability of precipitation and extreme events limited how optimistic participants were about potential benefits associated with future conditions.
In addition, along with any opportunities due to an extended growing season and heat units, come the risks and costs associated with trying something new (switching crops, varieties, etc). So while there may be more opportunities in the future, there is also more risk associated with testing the parameters of what is possible and implementing alternatives. Therefore, the added benefit of extended season or heat units was perceived to be marginal.
An increase in pests and diseases may be manageable in some cases, but not in others. An increase in frequency and prevalence of pest or disease outbreaks is seen as relatively manageable up to a cost threshold (and beyond this point, management costs outweigh benefits of control measures). However, the introduction of new pests or diseases is a categorically new level of risk due to uncertainty and the lack of proven control measures. Where there is no practice or chemical control available to manage a pest or disease, it is considered unmanageable.
An increase in wildlife activity gives rise to impacts that are location specific — some farms currently experience more of a problem with wildlife damage to crops than others. Projected conditions could increase wildlife populations and alter their migration and hibernation patterns, leading to an increase in damage to crops. Managing this challenge requires cooperation across a range of stakeholders.
The projected increase in variability of precipitation and extreme events limited how
optimistic participants were about potential benefits associated with future conditions.

BC Agriculture Climate Change Adaptation Risk + Opportunity Assessment Series — Peace Region March 2012 17
Key Actions
The purpose of the BC Agriculture Adapta-tion Assessment is to develop a baseline assess-ment of potential risks and opportunities due
to climate change for the BC agriculture sector as a whole. The dialogue that has occurred at the regional and commodity levels (through interviews, focus groups and informal discussion) has contributed critical information for the analysis and key actions in the provincial report, and provided a first look at the important issues regionally. A provincial report Execu-tive Summary document has been developed, which outlines key actions that apply across the province.
Key action items identified through the focus group session are noted below. The specific issues raised by grain producers in the Peace Region are an important first step toward a regional approach to agricultural adaptation.
Peace Region / grain producer focus group
Food security & agriculture
Prioritization of agricultural production and food security in British Columbia at the policy level was identified as an important first step in supporting the sector to manage the challenges associated with climate change.
Variety trials & alternate potential crops
Conducting variety trials for unpredictable future conditions presents challenges. However, this is considered to be a critical tool for improving options available to deal with changing conditions. More active investigation of crop suitability (and alternative crops) for future conditions was also raised as an area for further research.
Water management & irrigation
At present, irrigation is not considered a practical or cost-effective option in the Peace region, but irrigation infrastructure may become viable in the future (which could improve crop yields, water access issues and season length). An irrigation feasibility study would be a valuable first step forward. With future production potential in mind, current
If drought continues, I’m not sure what grain farmers can do to actually keep alive or keep
af loat until the good times return. If something doesn’t change, I’m just going to sell the place. If it ’s not a viable operation, production insurance
will cover it off for a few years. But if you’re not moving ahead or not able to cover your
costs, why not pull the cord on the life support?
— grain producer, Clayhurst

BC Agriculture Climate Change Adaptation Risk + Opportunity Assessment Series — Peace Region March 2012 18
approaches to water management in the region are relevant; in particular the extent of water use (and associated impacts) of the oil and gas industries and plans for the Site C dam project.
Management practices & approaches
A range of management practices and approaches that help with adapting to variability, extremes and changing conditions, were identified throughout the focus group session. In many cases, producers are either utilizing these practices, or would have an interest in doing so in the future. A partnership-based approach to identifying, demonstrating, testing and/or incenting practices that would strengthen adaptive management was suggested.40
Collective approaches for infrastructure & land use management
As is the case across the province, many of the key adaptation issues in the Peace Region relate to off-farm infrastructure and collective management
decisions. Developing cooperative and key agency approaches was a priority. Some of the key areas identified were: drainage planning, irrigation opportunities, managing impacts of other land uses and wildlife management.
Risk management & compensation programs
While a range of adaptation options were discussed throughout the focus group, the effectiveness of current compensation programs was of concern in circumstances where losses occur. In particular, streamlining the compensation process and improving the accessibility of compensation when damages cannot be mitigated was deemed to be a high priority.

Endnotes1 Clare, Gerry. “A Very Brief History of
the Peace River Area.” http://www.calverley.ca/BRIEFHISTORY.html
2 Guitard, A.A. 1965. “Agriculture in the Peace – Past, Present, and Future.” Research station, Beaverlodge, Alberta. http://www.calverley.ca/Part08-Agriculture/8-03.html
3 BC Ministry of Agriculture and Lands. July 2008. Peace River Regional District Agricultural Overview. P. 3.
4 Peace River Regional District: http://prrd.bc.ca/about/index.php
5 Valentine, K.W.G., Sprout, P.N., Baker, T.E., Lawkulich, L.M. (Eds.) 1978. The Soil Landscapes of British Columbia. BC Ministry of Environment. Green, A.J. and T.M. Lord. Part 3:“The Great Plains.” http://www.env.gov.bc.ca/soils/landscape/3.7plains.html
6 http://www4.agr.gc.ca/AAFC-AAC/display-afficher.do?id=1198002277259&lang=eng and http://www.env.gov.bc.ca/soils/landscape/figures/fig321.html
7 British Columbia Agriculture in the Classroom Foundation. 2008. “Grow BC: A Guide to BC’s Agriculture Resources” p. 9. http://www.aitc.ca/bc/uploads/growbc/1_intro.pdf
8 Valentine, K.W.G., Sprout, P.N., Baker, T.E., Lawkulich, L.M. (Eds.) 1978. The Soil Landscapes of British Columbia. BC Ministry of Environment. Green, A.J. and T.M. Lord. Part 3:“The Great Plains.” http://www.env.gov.bc.ca/soils/landscape/3.7plains.html
9 British Columbia Agriculture in the Classroom Foundation. 2008. “Grow BC: A Guide to BC’s Agriculture Resources” p. 8. http://www.aitc.ca/bc/uploads/growbc/1_intro.pdf
10 BC Ministry of Agriculture and Lands. July 2008. Peace River Regional District Agricultural Overview. P. 5.
11 Statistics Canada: 2006 Census of Agriculture: Quick Agricultural Profile for Dawson Creek http://www26.statcan.ca:8080/AgrProfiles/cp06/Table1.action?prov=00&search=search&placename=dawson+creek&placestart=0&geog_id=590855021&geog_id_amal=590855021&loccode=34907&tab_id=1
12 Statistics Canada: 2006 Census of Agriculture: Average age of farm operators: http://www.statcan.gc.ca/pub/95-629-x/8/4124836-eng.htm#59; 2006 Census of Agriculture: Total number of farms and total number of farm operators: http://www.statcan.gc.ca/pub/95-629-x/8/4182944-eng.htm#59
13 http://www.npedc.ca/key-sectors/agriculture
14 BC Ministry of Agriculture and Lands. July 2008. Peace River Regional District Agricultural Overview. p.11.
15 British Columbia Agriculture in the Classroom Foundation. 2008. “Grow BC: A Guide to BC’s Agriculture Resources.” p. 9. http://www.aitc.ca/bc/uploads/growbc/1_intro.pdf
16 City of Dawson Creek: Community Profile, Agriculture: http://www.dawsoncreek.ca/economy/industries/agriculture/
17 2009–2010 Peace River Regional District Rural Official Community Plan: Oil & Gas, http://www.ruralocp.ca/issues/oil_and_gas.php
18 This framework for adaptive capacity was developed based on our interviews with producers in BC, together with approaches presented in Belliveau et al 2006; Moser et al 2008; Smit & Wandel 2006; Reid et al 2007; Yohe & Tol 2002; Smit & Pilifosova 2003; Stokes and Howden 2010.
19 BC Ministry of Agriculture. June 1, 2011. Fast Stats 2010: Agriculture, Aquaculture & Food. p.4. http://www.agf.gov.bc.ca/publicat/stats/FastStats2010_R2.pdf
20 A strong example of this type of analysis may be found in: The Prairie Climate Resilience Project: Indicators of Adaptive Capacity to Climate Change for Agriculture in the Prairie Region of Canada. http://www.iisd.org/pdf/2007/climate_adaptive_cap.pdf
21 BC Ministry of Agriculture. Fast Stats 2010: Agriculture, Aquaculture & Food. June 1, 2011, p.4. http://www.agf.gov.bc.ca/publicat/stats/FastStats2010_R2.pdf
22 News release, Ministry of Community, Sport and Cultural Development
“Province Helps Peace Region Farms Retain Status,” January 4, 2011.
23 http://www.agf.gov.bc.ca/stats/faststats/FastStats2010_R2.pdf
24 Stokes, C. and M. Howden, eds. (2010) Adapting Agriculture to Climate Change. CSIRO Publishing: Melbourne. Stokes and Howden 2010.
25 http://www.irrigationbc.com
26 Jakob, M., McKendry, I., and Lee, R. 2003. Long-term changes in rainfall intensity in Vancouver, British Columbia. Canadian Water Resources Journal. 28(4): 587–604.
27 IPCC, 2007: Climate Change 2007: Synthesis Report. Contribution of Working Groups I, II and III to the Fourth Assessment Report of the Intergovernmental Panel on Climate Change [Core Writing Team, Pachauri, R.K and Reisinger, A. (eds.)]. IPCC, Geneva, Switzerland, 104 pp.
28 Rodenhuis, D.R., Bennett, K.E., Werner, A.T., Murdock, T.Q., Bronaugh, D. 2009. Hydro-climatology and future climate impacts in British Columbia. Pacific Climate Impacts Consortium, University of Victoria, Victoria BC.
29 Mazzotti S., C. Jones, and R.E. Thomson, 2008. Relative and absolute sea level rise in western Canada and northwestern United States from a combined tide gauge-GPS analysis . Journal of Geophysical Research — Oceans. 113 (C11).
30 Bornhold, B., 2008. Projected sea level changes for British Columbia in the 21st century. BC Climate Change Branch and the Government of Canada. 9 pp.
31 BC Ministry of Environment, 2007. Environmental Trends in British Columbia: 2007.
32 Rodenhuis et al. 2009
33 http://www.plan2adapt.ca
34 Rodenhuis et al. 2009
35 Ibid.
36 Schnorbus, M.A., K.E. Bennett, A.T. Werner and A.J. Berland, 2011: Hydrologic Impacts of Climate Change in the Peace, Campbell and Columbia Watersheds, British Columbia, Canada. Pacific Climate Impacts Consortium, University of Victoria, Victoria, BC, 157 pp.
37 Ibid.
38 Stone, D. A., A. J. Weaver, and F. W. Zwiers, 2000. Trends in Canadian precipitation intensity. Atmos.– Ocean, 38: 321–347 Zhang, X., Vincent, L.A., Hogg, W.D. and Niitsoo, A., 2000. Temperature and precipitation trends in Canada during the 20th century. Atmosphere-Ocean, 38(3): 395–429.
39 Walker, I.J. and Sydneysmith, R. (2008): British Columbia. In, From Impacts to Adaptation: Canada in a Changing Climate. D.S. Lemmen, F.J. Warren, J. Lacroix and E. Bush (eds); Gov. Canada, Ottawa,p. 329–386.
40 A BC Agriculture & Food Climate Action Initiative led project to identify adaptive management practices, and seek partnerships for pilot and demonstration, is underway in 2012.