granulated blast furnace slag in structural lightweight panel for...
TRANSCRIPT

GRANULATED BLAST FURNACE SLAG IN STRUCTURAL LIGHTWEIGHT PANEL FOR
HOUSING
ZAID SHAKER MAHMOOD
UNIVERSITI SAINS MALAYSIA
2016

GRANULATED BLAST FURNACE SLAG IN STRUCTURAL LIGHTWEIGHT PANEL FOR
HOUSING
by
ZAID SHAKER MAHMOOD
Thesis submitted in fulfillment of the requirements for the degree of
Doctor of Philosophy
August 2016

ii
ACKNOWLEDGEMENT
I offer my greatest gratitude to my supervisor Dr. Norizal Noordin for his
guidance, time and patience through each step of the way. He has supported me
throughout my thesis with his knowledge whilst allowing me the room to work in my
own way. I attribute this work to his encouragement, effort and without him this
thesis would not have been completed or written. I would also like to thank and show
my deepest appreciation to my Co-supervisor Assoc. Prof. Dr. Hanizam Awang for
the effort and time that she has give in this research.
I would also like to show my greatest gratitude to Universiti Sains Malaysia
for giving me the opportunity of obtaining my Ph.D. degree. Thus, giving me the
chance of having better opportunities in life. I want to thank my dearest friends for
their help, encouragement and feedback and they are Muhammed Zuhear Al-mulali,
Muhammed Abu AlMa’ali, Raith Zeher and Ng Phei Li. Without you all this work
would not have happened. I want to show my deepest appreciation to my family
members who stood by me during the best and worst times throughout my studying
period.
Last but not least, to my mother and father, in-laws, my wife Hala, my
daughters Jude and Zuha. Each one of you has sacrificed the most for me to achieve
what I have achieved. I am deeply indebted to you and I hope that this humble work
would repay a tiny portion of what you have done for me. Thank you is something
small compared to what you have sacrificed. You have always been that light at the
end of the tunnel given me hope and inspiration to be a better, more loving person. If
it was not for your unconditional love, sacrifice and continuous prays this humble
work would not have seen the light. Therefore I thank you from the bottom of my
heart.

iii
TABLE OF CONTENTS
ACKNOWLEDGEMENTS ii
TABLE OF CONTENTS iii
LIST OF TABLES ix
LIST OF FIGURES xiv
LIST OF EQUATIONS xx
LIST OF ABBREVIATIONS xxi
ABSTRAK xxii
ABSTRACT xxiv
CHAPTER 1: INTRODUCTION
1.1 Introduction 1
1.2 Problem statement 3
1.3 Objectives of the study 6
1.4 Significant of the study 7
1.5 Scope of the study 8
1.6 Thesis layout 8
CHAPTER 2: LITERATURE REVIEW
2.1 Introduction 11
2.2 Foam concrete 11
2.3 Materials utilised in foam concrete 13
2.4 Properties of foam concrete 17
2.4.1 Consistency and stability of foam concrete 17

iv
2.4.2 Density 20
2.4.3 Compressive strength 22
2.4.4 Flexural and splitting tensile strength 29
2.4.5 Ultrasonic pulse velocity 31
2.4.6 Drying shrinkage 32
2.4.7 Intrinsic permeability 36
2.4.8 Water absorption 38
2.4.9 Carbonation depth 40
2.4.10 Porosity 41
2.5 Granulated blast furnace slag (GBS) 44
2.6 Ground granulated blast furnace slag (GGBS) 49
2.7 Properties of GGBS 51
2.7.1 Chemical composition of blast furnace slag 51
2.7.2 Physical characteristics of blast furnace slag 53
2.8 Hydraulic activity of GGBS 55
2.9 GGBS indexing 57
2.10 Properties of concreting materials containing GGBS 57
2.10.1 Workability 58
2.10.2 Water absorption 59
2.10.3 Microstructure and porosity 61
2.10.4 Compressive strength 64
2.10.5 Flexural and splitting tensile strength 70
2.10.6 Ultrasonic pulse velocity (UPV) 75
2.10.7 Unit weight 78
2.10.8 Shrinkage behaviour 79

v
2.10.9 Carbonation depth 83
2.10.10 Intrinsic permeability 85
2.11 Pre-cast concrete wall panel 87
2.12 Classes of wall panels 87
2.12.1 Non- load bearing wall panels (cladding) 87
2.12.2 Load bearing wall panels 88
2.13 Types of wall panels 88
2.14 Lightweight foam concrete wall panels 88
2.15 Conclusion 95
CHAPTER 3: METHODOLOGY
3.1 Introduction 97
3.2 Preliminary study 97
3.2.1 Phase one 99
3.2.2 Phase two 100
3.3 Materials 102
3.3.1 Physical properties of binding material 102
3.3.2 Chemical characteristics of binding material 106
3.3.3 Fine aggregate 108
3.3.4 Water 109
3.3.5 Water reduction agent (PS-1) 110
3.3.6 Foaming agent 111
3.4 Mix constituents 111
3.5 Mixing procedure and curing method 114
3.6 Testing programme 115

vi
3.6.1 Mechanical properties 115
3.6.2 Physical properties 116
3.6.3 Durability 116
3.7 Testing programme for wall panels 118
3.8 Computer analysis using STAAD Pro 119
3.8.1 Modeling mode 119
3.8.2 Analysis and design 119
3.8.3 Post processing mode 120
CHAPTER 4: RESULTS AND DISCUSSIONS
4.1 Introduction 121
4.2 Fresh properties 121
4.3 Hardened properties 129
4.3.1 Compressive strength 129
4.3.2 Flexural strength 136
4.3.3 Splitting tensile strength 144
4.3.4 Oven dry density 151
4.3.5 Ultrasonic pulse velocity (UPV) 159
4.3.6 Drying shrinkage 167
4.3.7 Porosity 172
4.3.8 Water absorption 182
4.3.9 Intrinsic permeability 189
4.3.10 Carbonation depth 195
4.4 Optimum GBS mix 199
4.5 Conclusion 201

vii
CHAPTER 5: DEVELOPMENT OF LIGHTWEIGHT PRECAST LOAD
BEARING WALL
5.1 Introduction 203
5.2 Design concept 203
5.3 Load determination and wall structural design 206
5.4 Mould fabrication 210
5.5 Steel fabrication 212
5.6 Mixing procedure and curing 213
5.7 Preparation and testing procedure 215
5.8 Experimental results 218
5.9 The correlation between walls with 1.8 and 2.8 meter heights 224
5.10 Conclusion 229
CHAPTER 6: CONCLUSION AND FUTURE WORK
6.1 Introduction 231
6.2 Effect of GBS inclusion on fresh properties of foam concrete 231
6.3 Effect of GBS inclusion on the mechanical properties of foam
concrete
232
6.4 Effect of GBS inclusion on the physical properties of foam
concrete
233
6.5 Effect of GBS inclusion on the durability of foam concrete 234
6.6 Optimum GBS foam concrete mix 234
6.7 Precast lightweight load bearing wall 235
6.8 Future work 237

viii
REFERENCES 238
LIST OF PUBLICATIONS 256
APPENDICES

ix
LIST OF TABLES Page
Table 2.1 Utilization of foam concrete in various applications. 13
Table 2.2 Utilization of various materials as additives and admixtures in
constituents of foam concrete.
16
Table 2.3 Compressive strength of foam concrete determined by other
studies
28
Table 2.4 Splitting tensile strength determined in previous studies 30
Table 2.5 Flexural strength determined in previous studies 31
Table 2.6 Drying shrinkage of foam concrete determined in previous
studies
36
Table 2.7 Cooling methods of blast furnace slag 47
Table 2.8 Examples of GBS utilization in the construction industry 49
Table 2.9 Recent projects utilised GGBS as cement replacement in
Malaysia.
50
Table 2.10 Range of chemical constituents of GGBS based on BS 6699 and
BS EN 15167-1.
51
Table 2.11 The range of oxide in GGBS based on ACI report. 52
Table 2.12 Chemical composition of GGBS mentioned in previous
researches
52
Table 2.13 Physical properties of GGBS that mentioned in previous
researches
53
Table 2.14 Water Absorption (as weight %) with deferent curing and age at
various GGBS replacement levels.
60

x
Table 2.15 Water absorption (as weight%) at various GGBS replacement
level and ages (with and without SiO2).
61
Table 3.1 GBS indexing. 100
Table 3.2 Trial mixes with the results for the compressive strength at 7 and
28 days.
101
Table 3.3 Physical properties of the binding materials. 103
Table 3.4 Particle size distribution of the binding materials. 104
Table 3.5 Chemical composition of binding materials (wt. %). 107
Table 3.6 Typical properties of super plasticiser (PS-1). 110
Table 3.7 General properties of the foaming agent and aqueous foam. 111
Table 3.8 Mix constituents of foam concrete for three series. 113
Table 4.1 The actual water demand, mortar density, foam required and
actual foam quantity for all mixes in three series
122
Table 4.2 Fresh density, hardened density, consistency and stability of
foam concrete
128
Table 4.3 Compressive strength of the three series through the age 130
Table 4.4 Strength development of foam concrete mixes with GBS and
GGBS as 7 days the benchmark
135
Table 4.5 The ratio of strength at the age of 28 and 180 days for mixes
containing GBS and their correspondent GGBS mixes
136
Table 4.6 Flexural strength of foam concrete for three series with the ages
(MPa)
137
Table 4.7 The ratio of flexural to compressive strength at the age of 28 and
90 days for the three series
142

xi
Table 4.8 Relation between flexural and compressive strength at 28 days
for mixes with GBS and GGBS presented as R2 and equations
144
Table 4.9 Splitting tensile strength of foam concrete for different cement to
sand ratio through the ages
145
Table 4.10 The ratio of tensile to compressive strength at the age of 28 and
90 days for all mixes
150
Table 4.11 Relation between tensile splitting strength and compressive
strength at 28 days for mixes with GBS and GGBS presented as
R2 and equations
151
Table 4.12 Oven dry density of the three series with age (kg/m3) 152
Table 4.13 The ratio of demoulding to oven dry density for the three series
at all ages
155
Table 4.14 The correlation between compressive strength and oven dry
density at 28 days for mixes with GBS and GGBS presented as
R2 and equations
157
Table 4.15 The ratio of compressive strength to oven dry density at 28, 90
and 180 days for three series (× 10-3)
158
Table 4.16 Ultrasonic pulse velocity of three series (m/s) through the age 159
Table 4.17 The correlation between compressive strength and ultrasonic
pulse velocity at 28 days for mixes with GBS and GGBS
presented as R2 and equations
165
Table 4.18 The correlation between UPV and oven dry density at 28 days
for mixes with GBS and GGBS presented as R2 and equations
167
Table 4.19 Drying shrinkage readings for all mixes with age (10-4) strain 168
Table 4.20 The porosity of the three series as a function of age 173

xii
Table 4.21 The correlation between Porosity and compressive strength at 28
days for mixes with GBS and GGBS presented as R2 and
equations
180
Table 4.22 The correlation between Porosity and oven dry density at 28
days for mixes with GBS and GGBS presented as R2 and
equations
181
Table 4.23 Water absorption (weight %) of the three series as a function
with age
183
Table 4.24 The correlation between water absorption and Porosity and at 90
days for mixes with GBS and GGBS presented as R2 and
equations
189
Table 4.25 Intrinsic Permeability for three series through the age ×10-11 (m2) 190
Table 4.26 The correlation between intrinsic permeability and Porosity and
at 90 days for mixes with GBS and GGBS presented as R2 and
equations
193
Table 4.27 Carbonation depth as a function of age for three series 194
Table 4.28 The correlation between carbonation depth and intrinsic
permeability at 90 days for mixes with GBS presented as R2 and
equations
199
Table 4.29 The comparison between control mixes and 30% GBS foam
concrete in series I and II
201
Table 5.1 The total load applied on ground floor wall panel 207
Table 5.2 The value of the variables that are used in equation 5.1 and
results with 0.9 m width for walls with different heights.
208
Table 5.3 Design and ultimate shear capacity for bolt 210

xiii
Table 5.4 The compressive strength and density for the mix used in casting
the ribbed panels at 7 and 28 days of age
214
Table 5.5 The Coordinates of the strain gauges and LVDT (mm) 217
Table 5.6 Results comparison between the present study and previous foam
concrete wall panels
219
Table 5.7 Stresses obtained from finite element method using STAAD Pro
for two different heights
226
Table 5.8 The ratio of the load obtained from theory and the actual test or
approximated load (STAAD pro) for each wall height
228
Table 5.9 The load ratio between two different wall heights (Theoretically
and actual or approximated load)
229
xiv
LIST OF FIGURES Page
Figure 2.1 General process of blast furnace slag 48
Figure 2.2 The SEM image for grinding process by A- ball mill, B- Vibro
mill and C- airflow
54
Figure 2.3 Foam concrete wall prototype before and after testing 89
Figure 2.4 A cross sectional area of Lightweight ferrocement sandwich
panel
91
Figure 2.5 The lightweight foam concrete panel with permanent steel
sheet
92
Figure 2.6 The lightweight sandwich panel designed and tested 93
Figure 3.1 Flowchart describing the methodology taken by the study. 98
Figure 3.2 Particle Size Distributions of binding materials 103
Figure 3.3 Scanning Electron Microscopy of (A) OPC at 5000x, (B)
GGBS at 5000x, (C) GBS at 5000x and (D) GBS at 20000x
105
Figure 3.4 Granulated blast furnace slag (GBS) 106
Figure 3.5 Energy Dispersive X-Ray Analyser (EDX) of (A) Mapped sum
spectrum for GGBS, (B) Mapped sum spectrum for GBS, (C)
Mapping elements layout for GGBS, (D) Mapping elements
layout for GBS
108
Figure 3.6 Sand sieving analysis based on BS 882-92 109
Figure 4.1 Correlation between the actual water demand and GBS and
GGBS replacement levels for (A) series I, (B) series II and (c)
series III
124

xv
Figure 4.2 Correlation between mortar density and GBS and GGBS
replacement levels for (A) series I, (B) series II and (C) series
III
125
Figure 4.3 The foam quantity as a function of GBS and GGBS
replacement levels.
127
Figure 4.4 Compressive strength as a function of age for GBS mixes in
(A) series I, (B) sereis II and (C) sereis III
131
Figure 4.5 Compressive strength as a function of age for GGBS mixes in
(A) series I, (B) sereis II and (C) sereis III (B) GGBS mixes
132
Figure 4.6 The compressive strength at 28 day as a function of
replacement level for different filler to binder ratio for (A)
GBS mixes and (B) GGBS mixes
134
Figure 4.7 Flexural strength at 28 days of age as a function of
replacement level for different filler to binder ratio in (A) GBS
mixes and (B) GGBS mixes
138
Figure 4.8 Flexural strength as function of age for GBS mixes in
comparison with control mixes in (A) series I, (B) series II and
(C) series III
139
Figure 4.9 Flexural strength as function of age for GGBS mixes in
comparison with control mixes in (A) series I, (B) series II and
(C) series III
141
Figure 4.10 Flexural strength at 28 days as a function of its corresponding
compressive strength for (A) GBS mixes and (B) GGBS mixes
143
Figure 4.11 Tensile splitting strength at 28 days as function of replacement
level for (A) GBS mixes and (B) GGBS mixes
146

xvi
Figure 4.12 Tensile splitting strength as a function with age for GBS mixes
in (A) series I, (B) series II and (C) series III
147
Figure 4.13 Splitting tensile strength as a function of age for the mixes
with GGBS replacement levels in (A) series I, (B) series II and
(C) series III
148
Figure 4.14 Splitting tensile strength at 28 days as a function of
corresponding compressive strength for (A) GBS mixes and
(B) GGBS mixes
150
Figure 4.15 The oven dry density as function of replacement level at 28
days of age for (A) GBS mixes and (B) GGBS mixes
153
Figure 4.16 Compressive strength as function of oven dry density at 28
days of age for (A) GBS mixes and (B) GGBS mixes
156
Figure 4.17 Ultrasonic pulse velocity at 28 days of age as a function
deferent replacement level for (A) GBS mixes and (B) GGBS
mixes
160
Figure 4.18 UPV as function of age for GBS mixes in (A) series I, (B)
series II and (C) series III
161
Figure 4.19 UPV as function of age for GGBS mixes in (A) series I, (B)
series II and (C) series III
162
Figure 4.20 Compressive strength as function of ultrasonic pulse velocity
at 28 days of age for (A) GBS mixes and (B) GGBS mixes
164
Figure 4.21 Ultrasonic pulse velocity as function of oven dry density at 28
days of age for (A) GBS mixes and (B) GGBS mixes
166
Figure 4.22 Drying shrinkage as a function of replacements level at 28
days of age for (A) GBS mixes and (B) GGBS mixes
169

xvii
Figure 4.23 Drying shrinkage as a function of age for mixes with GBS in
(A) series I, (B) series II and (C) series III
170
Figure 4.24 Drying shrinkage as a function of age for mixes with GGBS in
(A) series I, (B) series II and (C) series III
171
Figure 4.25 Porosity at 28 days of age as function of replacements level for
three series in (A) GBS mixes and (B) GGBS mixes
174
Figure 4.26 The porosity as a function of age for GBS mixes in (A) series
I, (B) series II and (C) series III
175
Figure 4.27 The porosity as a function of age for GGBS mixes in (A) series
I, (B) series II and (C) series III
176
Figure 4.28 Ultrasonic pulse velocity as function of porosity at 28 days of
age for three series in (A) GBS mixes and (B) GGBS mixes
178
Figure 4.29 The compressive strength as a function of porosity at 28 days
of age in three series for (A) GBS mixes and (B) GGBS mixes
179
Figure 4.30 The oven dry density as function of porosity at 28 days of age
for three series in (A) GBS mixes and (B) GGBS mixes
182
Figure 4.31 Water absorption as a function of replacements level at 28
days of age for (A) GBS mixes and (B) GGBS mixes
184
Figure 4.32 Water absorption as a function of ages for the mixes with GBS
in (A) series I, (B) series II and (C) series III
185
Figure 4.33 Water absorption as a function of ages for the mixes with
GGBS in (A) series I, (B) series II and (C) series III
187
Figure 4.34 The water absorption as a function of porosity at 90 days of
age for (A) GBS mixes and (B) GGBS mixes
188

xviii
Figure 4.35 Intrinsic permeability as a function of replacements level at 56
days of age for (A) GBS mixes and (B) GGBS mixes
191
Figure 4.36 The intrinsic permeability as a function of porosity at 90 days
of age for (A) GBS mixes and (B) GGBS mixes
192
Figure 4.37 Carbonation depth as function of replacements level at 90 days
of age for (A) GBS mixes and (B) GGBS mixes
195
Figure 4.38 The carbonation depth as function of age for GBS mixes in (A)
series I, (B) series II and (C) series III.
196
Figure 4.39 The carbonation depth as function of age for mixes with
GGBS in (A) series I, (B) series II and (C) series III
198
Figure 4.40 The carbonation depth as a function of intrinsic permeability at
90 days of age for GBS mixes
199
Figure 5.1 Cross section of the wall consist of two single (ribbed) panels
(mm)
204
Figure 5.2 Design concept for (A) single ribbed panel and (B) individual
wall consist of two single panel (mm)
205
Figure 5.3 Single panel mould shows the sides middle rib groove 211
Figure 5.4 The dimension and the steps of fabrication of mould of single
panel (mm)
212
Figure 5.5 The steel fabrication in (A) and the jointing method in (B) 213
Figure 5.6 The sequence of casting the panels in (A) prepare the moulds
for casting the optimum mix, (B) casting the outer shell and
ribs, (C) remove the inner polystyrene and (D) casting of inner
panel with insulation density
215
xix
Figure 5.7 A) Nominal restrain end simulation and (B) the position of
LVDT for the wall panel
216
Figure 5.8 Strain gauges position and LVDT in each face of wall A 217
Figure 5.9 Strain gauges position and LVDT in each face of wall B 218
Figure 5.10 Load to horizontal displacement for wall A and B 219
Figure 5.11 Load to vertical displacement for wall A and B 220
Figure 5.12 The cracking pattern in wall A that observed during the test 220
Figure 5.13 Stress-strain curves for wall A at (A) A-1 panel and (B) A-2
panel
221
Figure 5.14 The cracking pattern in wall B that observed during the test 222
Figure 5.15 Stress-strain curves for wall B at (A) B-1 panel and (B) B-2
panel
223
Figure 5.16 The unlevelled load distributor during the testing of wall B 224
Figure 5.17 Maximum stress due to 391KN applied load for wall with
1.8m height
227
Figure 5.18 Maximum stress due to 391KN applied load for wall with
2.8m height
227

xx
LIST OF EQUATIONS Page
Equation 2.1 Kearsly’s target density equation 20
Equation 2.2 Determined target density for foam concrete contained fly
ash as cement of sand replacement
20
Equation 2.3 Oven dry density 21
Equation 2.4 The relation between compressive strength of the foam
concrete and the air content
26
Equation 2.5 Portland cement hydration 56
Equation 2.6 Pozzolanic reaction 56
Equation 2.7 Slag activity index 57
Equation 3.1 Activity index 99
Equation 3.2 Water absorption (weight%) 117
Equation 3.3 Porosity 117
Equation 3.4 Intrinsic air permeability (K) 118
Equation 5.1 Design ultimate axial load for slender braced solid wall 208
Equation 5.2 Design shear stress of the bolt 209
xxi
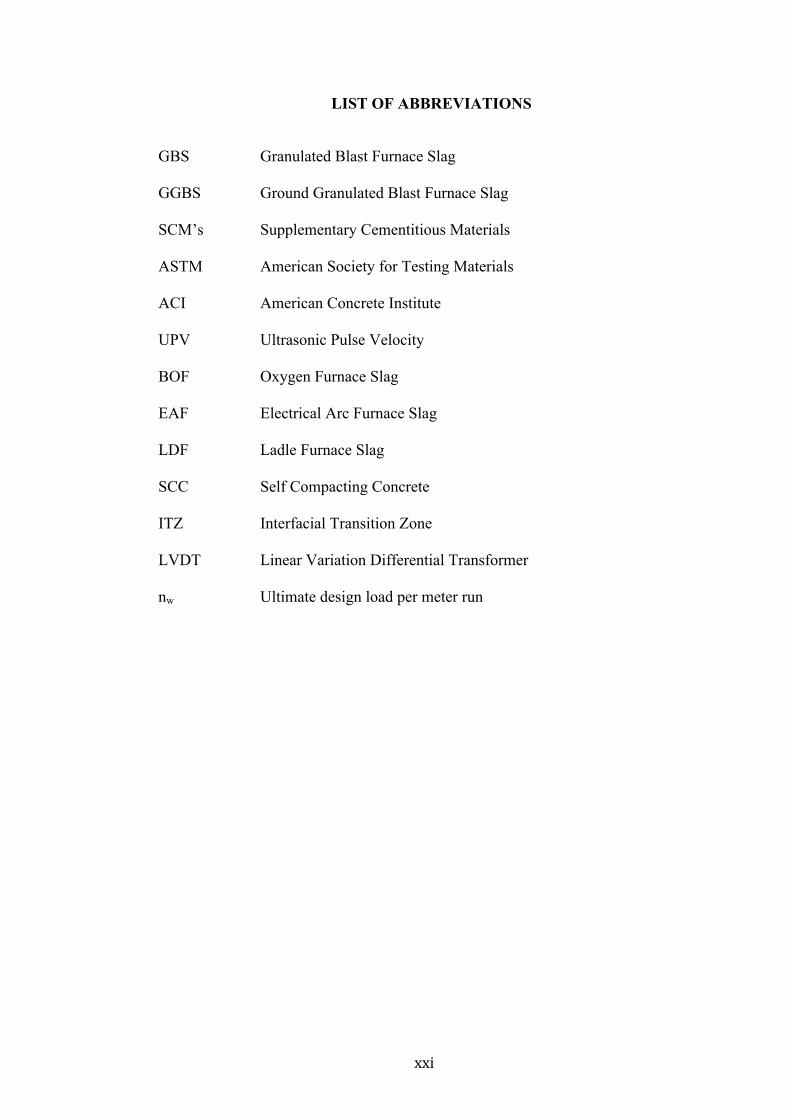
LIST OF ABBREVIATIONS
GBS Granulated Blast Furnace Slag
GGBS Ground Granulated Blast Furnace Slag
SCM’s Supplementary Cementitious Materials
ASTM American Society for Testing Materials
ACI American Concrete Institute
UPV Ultrasonic Pulse Velocity
BOF Oxygen Furnace Slag
EAF Electrical Arc Furnace Slag
LDF Ladle Furnace Slag
SCC Self Compacting Concrete
ITZ Interfacial Transition Zone
LVDT Linear Variation Differential Transformer
nw Ultimate design load per meter run

xxii
SANGGA RELAU BAGAS BERBUTIR DALAM PANEL STRUKTUR
RINGAN UNTUK PERUMAHAN
ABSTRAK
Sangga relau bagas berbutir (GBS) adalah bahan buangan utama yang
dihasilkan oleh industri besi. Dalam usaha untuk menjadikan sebagai bahan
pozzolanik yang berkesan, GBS perlu dikisar. Dengan proses tersebut, ianya
mengakibatkan penambahan kos dan meletakkan tenaga pengeluaran yang lebih,
dan hasilnya, pelepasan gas yang tinggi kepada alam sekitar. Kajian ini bertujuan
untuk menggunakan GBS sebagai pengganti simen separa untuk pengeluaran konkrit
busa. GBS digunakan sebahagiannya bagi menggantikan simen pada tahap
penggantian 30-70% mengikut berat simen pada ketumpatan 1300 kg /m3 campuran
konkrit berbusa menggunakan tiga nisbah pengisi kepada pengikat yang berbeza
(1.0, 1.5 dan 2.0). Dalam usaha untuk mempunyai pemahaman yang lebih baik
tentang perbezaan prestasi antara GBS dan sangga relau bagas hancur (GGBS) yang
digunakan secara meluas, GGBS telah digunakan dalam menghasilkan konkrit
berbusa menggunakan ketumpatan, tahap penggantian dan nisbah pengisi untuk
pengikat yang sama. Sebanyak 36 campuran disediakan dan telah diuji untuk sifat
fizikal, mekanik dan ketahanan pada tempoh masa yang berbeza. Hasil kajian
menunjukkan campuran optima konkrit berbusa GBS adalah campuran yang
mengandungi 30% daripada GBS dan nisbah pengisi untuk pengikat 1.5. Campuran
ini dipilih untuk fabrikasi kelompang luar untuk panel dinding pratuang. Panel
dinding direka sebagai dinding tanggung beban yang dibuat daripada dua bahagian
lapisan disambungkan bersama-sama menggunakan bolt keluli. Kedua-dua
kelompang luar direka sebagai panel berusuk dan teras dalaman yang terdiri daripada
campuran 500 kg/m3 konkrit berbusa. Melalui ujian eksperimen, panel dinding

xxiii
mencapai purata beban pemecah sebanyak 391kN, iaitu 51.6% lebih tinggi
berbanding dengan beban teori yang diperolehi menggunakan beban rekabentuk
muktamad.
xxiv
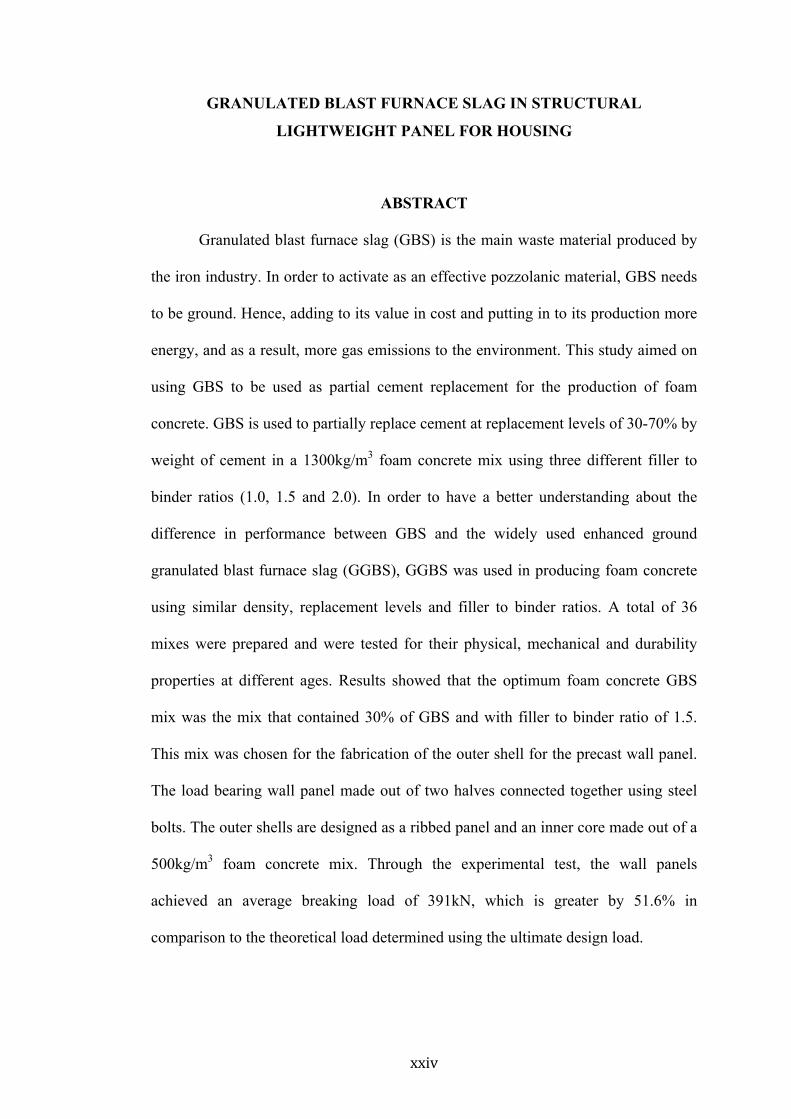
GRANULATED BLAST FURNACE SLAG IN STRUCTURAL
LIGHTWEIGHT PANEL FOR HOUSING
ABSTRACT
Granulated blast furnace slag (GBS) is the main waste material produced by
the iron industry. In order to activate as an effective pozzolanic material, GBS needs
to be ground. Hence, adding to its value in cost and putting in to its production more
energy, and as a result, more gas emissions to the environment. This study aimed on
using GBS to be used as partial cement replacement for the production of foam
concrete. GBS is used to partially replace cement at replacement levels of 30-70% by
weight of cement in a 1300kg/m3 foam concrete mix using three different filler to
binder ratios (1.0, 1.5 and 2.0). In order to have a better understanding about the
difference in performance between GBS and the widely used enhanced ground
granulated blast furnace slag (GGBS), GGBS was used in producing foam concrete
using similar density, replacement levels and filler to binder ratios. A total of 36
mixes were prepared and were tested for their physical, mechanical and durability
properties at different ages. Results showed that the optimum foam concrete GBS
mix was the mix that contained 30% of GBS and with filler to binder ratio of 1.5.
This mix was chosen for the fabrication of the outer shell for the precast wall panel.
The load bearing wall panel made out of two halves connected together using steel
bolts. The outer shells are designed as a ribbed panel and an inner core made out of a
500kg/m3 foam concrete mix. Through the experimental test, the wall panels
achieved an average breaking load of 391kN, which is greater by 51.6% in
comparison to the theoretical load determined using the ultimate design load.

1
CHAPTER 1
1.1 INTRODUCTION
Due to its versatility, economy, raw materials availability, durability and
strength; concrete is the most widely used material on the planet after water. It can be
designed to endure the harshest of environmental circumstances and can be
fabricated to take any shape and form (Ozlutas et al., 2012). Although concrete is
used extensively, it is a huge contributor to global warming. In the construction
industry, and especially in the production of concrete, the amount of crushed rocks
and gravel needed annually is estimated to be up to 11 billion tons (Mehta, 2001).
Furthermore, to produce a ton of cement, the needed energy consumption and the
emitted emissions of carbon dioxide (CO2) into the atmosphere are estimated to be
approximately 150 kWT and 0.81 tons, respectively (Chandra, 1996; Huntzinger and
Eatmon, 2009).
It is a well-known fact that technology is becoming increasingly prominent in
the construction industry. This prominence is the result of the construction
industries’ need to produce innovative building materials. Hence, nowadays,
concrete contents are not limited to cement, aggregate, and water, but it also has
minerals and admixtures that can enhance the quality of the concrete and reduce its
negative impact on the environment (Aı̈tcin, 2000). In addition, new types of
concrete have been developed to ensure the creation of more environmentally
friendly concretes. This is done by reducing the concrete’s exploitation of natural
resources and reducing the concrete’s energy consumption by making them lighter
(Ul Haq and Liew, 2007).

2
Scientists and engineers are continuously striving towards the creation of
innovative chemical admixtures and supplementary cementing materials (SCMs).
The use of such materials conserves energy and has environmental benefits because
of reducing the amount of manufactured cement, and as a result, reducing the amount
of green house emissions to the atmosphere. Strict regulations and air pollution
controls caused the production of numerous industrial by-products that can be used
as SCMs. Such examples are fly ash, ground granulated blast furnace slag (GGBS),
metakaoline and rice husk ash. These materials have been typically used in concrete
manufacturing for the sake of cement content reduction, workability and strength
improvement, and durability enhancement (Chandra, 1996; Siddique, 2007; Siddique
and Khan, 2011).
New types of concrete have been developed to counter the effects of global
warming. Concrete types that are lightweight or use lightweight materials are an
attempt to re-establish concrete as an environmental friendly material (Noordin and
Awang, 2005). Lightweight concretes when used in construction reduce the cost and
sizes of the super and substructures in the building. Lightweight building
components also reduce the energy consumption used in their transportation and
placement. In addition, using lightweight concrete in the construction of buildings
will reduce the building’s energy consumption used for cooling and heating (Fouad,
2006).
Foam concrete, as a type of lightweight concrete, has been proven to be more
environmentally friendly as it uses fewer natural resources than conventional
concrete. Additionally, it is superior to conventional concrete in terms of fire
resistance as well as thermal and sound insulation. Foam concrete can offer moderate
mechanical properties, reduce the weight of superstructures or substructures,
3
minimise the overall cost of construction, and it can be handled and constructed
relatively faster and easier (Kearsley, 1999; Mahmood, 2010; Noordin and Awang,
2005).
Aiming on making foam concrete more environmentally friendly and more
cost effective (Huntzinger and Eatmon, 2009), extensive research has been done in
using SCMs in its fabrication. SCMs such as fly ash, GGBS and rice husk ash has
been used as partial or complete replacements for the binding and/or filler materials
(Neville, 1996).
GGBS is a by-product of the iron industry. In a 1500C blast furnace, iron
ore, limestone and coke are heated up and melted. As a result of the melting process,
two products emerge and they are molten iron and molten slag. Due to its lightness,
the molten slag floats on the molten iron. The molten slag comprises of silicates and
alumina from the original iron ore with a combination of some oxides that originate
from the limestone. As mentioned before, GGBS has been used extensively in
concrete as a partial cement replacement at different levels by weight of cement.
GGBS is known to have a positive impact on the strength and durability of concrete
(Siddique, 2007).
1.2 PROBLEM STATEMENT
According to a report published by the World Steel Association in 2013,
Malaysia was placed among the top 25 countries that produce an average 5.9 million
tons of steel annually (World Steel Association, 2010). The processing of each ton of
steel produces around 300 kilograms of by-product materials (Neville, 1996).
Specifically, the steel slag waste in Malaysia is around 1.77 million tons per year.
65% of slag waste is used as GGBS and the remainder, which is around 620,000
tons, is disposed in the environment (Motz and Geiseler, 2001). The storage of slag

4
not only occupies large amounts of land resources but also has a negative impact on
the environment by polluting the soil, underground water and the atmosphere (Li et
al., 2015).
GGBS has been exploited extensively in the production of concrete.
However, after several attempts done by (Bijen, 1996; Chen, 2007; Chi et al., 2012;
Memon et al., 2007; N. Arreshvhina et al., 2006; Parniani et al., 2011; Wang et al.,
2005; Yüksel et al., 2007; Yüksel et al., 2008), the integration of GGBS was mostly
limited to conventional concrete while only a few researchers investigated the
possibility of integrating GGBS in foam concrete. In addition, the replacement level
of the binder was also limited (Pan et al., 2007; Sanjaya et al., 2007; Wee et al.,
2006; Wee et al., 2011).
Granulated blast furnace slag (GBS) is yet to be investigated as a partial
cement replacement. The utilisation of GBS in concrete production will cause a
reduction in both cost and energy consumption. It is a known fact, that slag particles
require longer time to be ground than that of cement clinker; hence, require more
energy (Zandi and Vefa Akpinar, 2012). Conventional methods of construction are
divided into two major components. The first component is the structural system,
which comprises of beams, columns and slab frames that are cast in-situ. The
construction of these frames goes through four operations.
These operations are erecting the timber formwork and scaffolding, erecting
the steel bars for reinforcement, fresh concrete pouring into the form and finally, the
dismantling of formwork and scaffolding. These conventional methods are labor
intensive, tiresome and require a lot of onsite coordination. The second component
consists of erecting the partitions, which consist of brick work and plastering (Abdul
Kadir et al., 2006).
5
As a response to the problems associated with conventional construction
methods, the technology of industrialised construction is becoming a preferable
option, especially in making lightweight prefabricated structures, which perform
better than conventional concrete due to their lesser weight, thermal insulation
properties, and good strength to weight ratio (Sumadi and Memon, 2008). Along
with the benefits of utilising the IBS application that was mentioned by in previous
studies (Onyeizu et al., 2011; Taherkhani et al., 2012), IBS technology saves
approximately 20% of the wastages from the overall construction cost, such wastages
typically occur when using conventional construction methods (Lim, 2006).
The pre-fabrication and pre-casting of structural wall panels have many
advantages than the other systems. A precast structural wall has the capacity to
eliminate the structural frame system (columns and beams), sustain the lateral and
gravity loads, reduce the exterior and interior frame (if they are present in
construction), and increase the span of the slab. Furthermore, it is able to increase the
thermal insulation and become part of the precast wall (Ragan, 2011). Moreover, if
the Malaysian construction industry adopts the IBS construction system, a total
reduction of 4.72 million tons of CO2 emissions can be achieved.
In addition, when selecting a precast wall panel system in a given structure, a
total reduction in emissions of 26.27% is achievable (Omar et al., 2014). However,
wall panels constructed using conventional concrete are heavy and require special
attention when transported and erected into their position. Therefore, lighter weight
wall panels are a good solution in reducing both the cost and energy consumption of
such construction method.
Motivated by the problems mentioned previously in this section, this study
incorporated GBS as a partial cement replacement into producing foam concrete. In

6
addition, a GBS foamed concrete mix is used to fabricate a lightweight wall panel,
which will be designed and used in the construction of a low medium cost house.
1.3 OBJECTIVES OF THE STUDY
The aim of this study is to investigate the possibility of using GBS in the
production of foam concrete. The GBS is used to partially replace cement at different
replacement levels. The assessment of such incorporation is made through the
determination of the physical, mechanical and durability properties of the GBS foam
concrete. For the sake of comparison, foam concrete containing similar cement
replacement levels of GGBS has been prepared and its physical, mechanical and
durability properties were determined. Finally, the foam concrete mix containing
GBS that offers a balance between maximum GBS content and properties is used to
fabricate the lightweight wall panel. Therefore, the following objectives are set to be
achieved by this study:
1- To investigate the physical, mechanical and durability properties of foam
concrete using GBS as cement replacement at different levels and
binder/filler ratio.
2- To compare the properties of GBS and GGBS foam concrete using similar
replacement levels and binder/filler ratio.
3- To establish the optimum replacement level and mix ratio of GBS in foam
concrete based on adequate mechanical, physical and durability properties.
4- To construct a functional precast load-bearing wall for low-rise residential
buildings using the optimum GBS foam concrete mix.

7
1.4 SIGINIFCANCE OF THE STUDY
From an environmental perspective, utilising GBS as partial cement
replacement in foam concrete will reduce the dependency on cement and as a result
decrease the carbon footprint of foam concrete. In addition, GBS utilisation will
reduce the negative impact of leftover slag on the environment. As a result increasing
the possibility of using such a slag in the production of other types of concrete.
Moreover, using GBS instead of GGBS will eliminate the energy consumed for the
production of GGBS. Furthermore, GBS is more cost effective than its ground
counter part, hence, manufacturing a cheaper type of foam concrete.
Since GBS is a new material that its incorporation as a partial cement
replacement is yet to be investigated, the effect of GBS as a partial cement
replacement was compared to the well-known and the extensively researched GGBS.
The uniqueness of such an endeavour was to increase the knowledge about the
difference in performance of these two materials. These two materials (GBS and
GGBS) were used to partially replace up to 70% of the cement in foam concrete
mixes that have a semi-structural density of 1300kg/m3.
The foam concrete mix that incorporates a maximum amount of GBS without
affecting the properties negatively was used to fabricate the precast wall panel. The
panel has unique features in itself. The optimum GBS foam concrete mix will be
used to fabricate the outer shell in which it is using a semi-structural density and not
a structural density. In addition, the wall panel will be made out purely from foam
concrete, hence, creating a lightweight wall panel used for structural applications. In
addition, the uniqueness of this wall panel also arises from its thinner outer shell
(thickness = 30mm), which is designed as a ribbed panel.

8
1.5 SCOPE OF THE STUDY
In this study, GBS will be used as a partial cement replacement in foam
concrete having a semi structural density of 1300kg/m3. GBS will replace the cement
using a replacement level of 30-70% by weight of cement at 10% increments. Also
three different filler to binder ratios will be utilised namely 1.0, 1.5, and 2.0. Each
GBS foam concrete mix is tested for its mechanical (compressive strength, flexural
strength, and splitting tensile stress), physical (density, drying shrinkage, ultrasonic
pules velocity, and porosity) and durability properties (intrinsic permeability, water
absorption, and carbonation) at various ages.
At the same time and for the sake of comparison, foam concrete mixes
containing GGBS with similar replacement levels, density and filler to binder ratio
are prepared and tested for similar properties at the same age. The lightweight load-
bearing wall will be casted using the optimum GBS foam concrete mix. The wall
panel design is based on a two story low medium cost house, which its details are
listed in chapter five. For the sake of easiness of handling and transportation, the
lightweight wall is made out of two halves. Each half panel is designed to have an
outer shell and core. The outer shell is designed as a ribbed panel and is fabricated
from the optimum GBS foam concrete mix. While, the core is made out of lower
foam concrete density (100% cement). The two halves are joined using steel bolts to
form the lightweight load-bearing wall.
1.6 THESIS LAYOUT
This thesis comprises of six chapters. Chapter One already discussed the
motive of this thesis and its aims, significances and scope. Chapter Two will review
the literature related to this study. This chapter contains mainly three parts, the first
part discusses the applications of foam concrete, foam concrete properties for fresh

9
and hardening density, foam concrete constituents, and the effect of the type of by-
product material or pozzolanic material used as a filler or binder on the properties of
the mix. The second part of this chapter will briefly discuss the by-product material
and, especially, steel slag and it’s processing. It also discusses the effects of GGBS
as a by-product material on properties of concreting material (normal, mortar, and
lightweight concrete) in the fresh and plastic phases. The third will review types of
concrete wall panels; the standards used to design these wall panels and studied foam
concrete wall panels.
Chapter Three explains in detail the experimental sequence and the methods
that will achieve the objectives of this study. This chapter consists of two parts; the
first part describes the preliminary study examining GBS as a supplementary
cementitious material. Furthermore, it examined the use of GBS as a foam concrete
constituent. The second part is the main study, which describes the foam concrete’s
constituents, properties, material testing, and mixing procedure. The properties of
fresh and hardened foam concrete have been tested according to the standards.
Moreover, the machinery and testing procedure for the wall was also included as part
of this chapter.
Chapter Four reviews the results of the created foam concrete’s mechanical,
physical, and durability properties. The results are illustrated in graphs and tables,
which discuss the effects of GBS and GGBS on fresh and hardened properties of the
foam concrete. Meanwhile, Chapter Five will discuss the design concept of the wall
panel. This chapter will explain the wall’s design concept and its mathematical
calculations. The testing procedures and the results obtained from the actual
laboratory test and the engineering software (STAAD Pro) will be discussed.

10
Chapter Six will list the conclusions drawn from this research and laid down
a number of future works based on the current study.

11
CHAPTER 2
LITERATURE REVIEW AND RELATED WORK
2.1 INTRODUCTION
This chapter describes various topics that are related to the objectives of this
research project. It initially describes foam concrete discretion, application,
constituents, and its fresh and hardened characteristics. Also, various cementaious
materials that have been used as binder or filler as well as their effect on the
properties of foam concrete will be illustrated in this chapter. Furthermore, this
chapter will review the types of produced by-products as well as their properties and
utilisation into the construction industry. Moreover, this chapter will review and
discuss the precast wall panels using lightweight concrete as well as their advantages
and disadvantages in comparison to other systems.
2.2 FOAM CONCRETE
Hoff (1972) defined foam concrete as a type of lightweight concrete with a
homogenous cell or void structure attained by the inclusion of a foaming agent or by
the generation of gas within a fresh cementation mixture. It has been calculated that,
possibly, between 30-80% of the total volume of foam concrete is made up of air
bubbles or foam. In addition, Tam et al. (1987) described it as slurry or mortar with
air bubbles, ranging in size from 0.1 mm to 1 mm, that have been introduced
chemically or mechanically into the wet mixture. Fouad (2006) described foam
concrete as a low-density material with structural cells or homogeneous voids
generated by the introduction of preformed foam or gas into the mortar matrix. The
common casting densities range from 320 to 1920 kg/m3.

12
Therefore, based on the definitions above, foam concrete can be defined as a
lightweight concrete that has different densities ranging from 320 to1920 kg/m3. The
constituents of foam concrete can be any mortar mixture with or without an infill
material. Any type of binder, like normal concrete, can be used, and instead of coarse
aggregate, air bubbles with diameters ranging from 0.1 to 1 mm can be introduced
into the matrix mechanically or chemically by introducing gas in the wet mixture.
This foam does not perform any chemical action until the cement sets and holds the
desired shape. The amount of air or foam that is added to the mortar slurry has been
calculated to range from 30% to 80% of the total volume (ASTM, 2004c; Barnes,
2008; Fouad, 2006; Hoff, 1972; Liew, 2005; Tam et al., 1987).
There are two types of foam concrete based on the curing conditions, namely,
autoclaved and moist foam concrete. In the first type, the foam concrete is cured
under high-pressure steam at temperatures ranging from 180 to 210 oC, while in the
second type; the foam concrete is cured under atmospheric pressure and steam. The
first method of curing is generally used for making precast structural cellular
elements. Precast moist-cured products are used as secondary structural elements
because of their good thermal and sound insulation properties (Al-Noury et al., 1990;
Tam et al., 1987).
Liew (2005) classified foam concrete based on the densities utilised in
construction, while Fouad (2006) listed the constituents of the foam concrete based
on density. Table 2.1 illustrates Liew’s classification. It is worth mentioning that the
production of aerated concrete was commercialised in Sweden in 1929 and was
rapidly distributed to other parts of the world at the end of the Second World War.
From that time, various methods have been devised and different types of foam
concrete have been produced and used in construction applications in many countries

13
(Abdullah et al., 2006; Brady et al., 2001).
Table 2.1: Utilization of foam concrete in various application (Liew, 2005)
Based on density Author Density range (kg/m3) Application
Liew (2005)
300-600
Thermal insulation for flat roofing with required grading. Floor sub-surfaces. Block infills for sub-floor slabs. Cavity walls filling. General thermal and acoustic insulation. Heat insulation slabs.
600-800
Internal partition wall blocks and panels. Roofing slabs. Floors. Sub-surface for stables, pig sties and poultry farms. Walls, floor sub-surfaces of large cool rooms. Façade panels. Trench reinstatements.
600-800
Internal partition wall blocks and panels. Roofing slabs. Floors. Sub-surfaces for stables, pig sties and poultry farms. Walls, floor sub-surfaces of large cool rooms. Façade panels. Trench reinstatements.
900-1200
External wall blocks and panels, both structural and non-structural. General sound-proofing in industrial areas.
1200 -1800
Medium weight blocks and slabs. Large reinforcement slabs and panels. Walls, either precast or poured in situ. Garden ornaments
2.3 MATERIALS UTILISED IN FOAM CONCRETE
As mentioned before, foam concrete can be based on slurry or mortar mixture
that consists of Portland cement and water or Portland cement, fine aggregate (sand),
and water. The binder can be Portland cement or blended cement, consisting of
Portland cement slag, Pozzolans, lime with siliceous material, fly ash, metakaolin, or
any other hydraulic material (ACI, 1996; Brady et al., 2001). Pozzolanic materials
are utilised with varying percentages to replace cement or sand in the foam concrete
mixture. These materials are cost efficient and environmentally friendly, as well as
14
they can enhance the properties of the foam concrete in its fresh and plastic phases
(ACI, 2006). It is possible to use admixtures (chemical additives) in foam concrete as
a percentage of the total weight of the binder.
The tests listed in ASTM C796 (2004d) and the 1996 and 2006 ACI reports
are recommended for the trial mixes before the admixtures and supplementary
materials are utilised in the production of foam concrete in order to determine their
compatibility with the foam concrete. The typical foaming agents are protein
hydrozylates or synthetic surfactants with a density varying between 32 to 64 kg/m3,
as recommended by ASTM (ASTM, 2004c). However, ACI (2006) and Fouad
(2006), proposed a density of 40 to 65 kg/m3 and 32 to 56 kg/m3, respectively.
Kearsley (2006) determined the compatibility of the foaming agent by mixing
samples containing only cement, water, and foam. The water required was obtained
from various foam percentages and was based on visual observations. Essentially,
there are two methods for the use of preformed foam in the production of foam
concrete, namely the wet and dry method. The first method, which is suitable for the
production of foam concrete with a density of up to 1000 kg/m3, involves spraying a
solution of the foaming agent with water through a fine mesh to generate bubbles
with a diameter of 2 to 5 mm.
The second method is the dry preform method, which involves using the
power of an air compressor to force the foaming agent and water into a mixing
chamber, thus resulting in the generation of stable air bubbles having a diameter of
less than 1 mm (Barnes, 2008; Brady et al., 2001; Ramamurthy et al., 2009). The
preformed foam technique is the more economical method of producing foam
concrete as it uses less foaming agent and the mix can be controlled and possibly
adjusted if there is a human error (Ramamurthy et al., 2009; Wee et al., 2006).

15
Due to the small size of bubbles, the near bubble skeleton, and the stability of
the protein foaming agent reflect the bond strength of the final foam concrete product
(Mcgovern, 2000; Nambiar and Ramamurthy, 2007a; Othuman Mydin, 2010).
Dransfield (2000) stated that although a synthetic foaming agent can be easily
formulated and it is more stable, its high expansion can open cells and create large
bubble sizes which can reduce the strength of the foam concrete. Therefore, a protein
foaming agent is preferable to a synthetic one. A filler or fine aggregate, with a
maximum particle size of not more than 5 mm, can be used.
Furthermore, a high strength foam concrete can be obtained by mixing 60 to
95% sand passing through a 600-micron sieve (ACI, 1996; ACI, 2006; ASTM,
2004a; ASTM, 2004c; Barnes, 2008; Brady et al., 2001; Fouad, 2006; Ramamurthy
et al., 2009). Table 2.2 reviews several researches that had been carried out utilising
different materials and admixtures in powder or liquid form in foam concrete.
(Fouad, 2006; Hoff, 1972; Liew, 2005; Tam et al., 1987) (ACI, 2006; ASTM, 2004c), (ACI, 1996) (Dransfield, 2000; Kearsley, 2006) (BSI, 1985b) (BSI, 1992b),

16
Table 2.2: Utilization of various materials as additives and admixtures in constituents of foam concrete
Author Density Kg/m3
Mix ratio
Replacements (%)
Additives (%) W/b Foam
type Foam
density (Ranjani and Ramamurthy, 2012)
1000-1500 1:1 FAa (10-30)
(OPC - - Synthetic 25-38
(Jitchaiyaphum et al., 2011) 800 - FAa (10-30)
(OPC) - 0.5 Protein 45
(Wee et al., 2006) 600-1900 - GGBS (50)
(OPC) - 0.3 Protein -
(Kearsley and Wainwright, 2001b)
1000-1500 -
FA & PFb (50-67.7-75)
(OPC) - 0.3 Protein 70
(Tam et al., 1987)
1300-1600
1:1.58-1:1.75 - - 0.6-
0.8 Protein 59
(Jones et al., 2003) 1000 1:1.83
FA (30) (OPC),
FA coarse (30) (sand)
- 0.5-1.11
- 50
(Jones and McCarthy, 2005b)
1400-1800
1:1.5-1:2.3
FA (30-50) (OPC), FA coarse (50-100)
Spd 0.26-0.5
Synthetic 50
(Jones and McCarthy, 2005b)
1000-1400 1:1.83
FA coarse (66-70) (sand)
- 0.5 Synthetic 50
(Nambiar and Ramamurthy, 2006)
1000-1500 1:1 FA (50-100)
(sand) - - Protein 50
(Pan et al., 2007) 620-1600 1:2.3 - - 0.7 Protein -
(Nambiar and Ramamurthy, 2007b)
840-1753
1:2
FA (0-100) (sand)
-
0.94-1.65
Protein
40
(Wee et al., 2011) 693-1635 1:0 GGBS (50)
(OPC) Sp (8ml/kg) 0.22-0.6 Protein -
(Zulkarnain and Ramli, 2011) 1150 1:1.5 SFc (10-15)
(OPC) Sp 0.45 Protein 80
(Chindaprasirt and Rattanasak, 2011)
1600 1:2.5 FA (15-30) (OPC)
Propylene glycol (1)
Triethylene glycol (1)
Dipropylene glycol(1)
0.5 - 50
(Shi et al., 2012) 500-1000 1:0,
1:0.6
FA (20-40-60)
(OPC) Sp (0.1) 0.3 Protein 55
(Mydin, 2011) 1000 1:0.5 - 0.5 0.5 Protein 80
(Panesar, 2013) 500-900 - - - 0.29 Protein &
two Synthetic
65 45-65, 50-60
(Lim et al., 2013)
1300
-
OPA (10-20) (sand)
-
0.52-0.6
Synthetic
45
(Awang et al., 2014) 1300 1:2 OPA (25-65)
(OPC) Sp (1) 0.45 Protein 65
(Rahyan et al., 2008)
1000-1500 1:1.5 - Sp (1.25) 0.45 Protein 80
aFA: Fly ash, bPF: Pozz-Fill, SFc: Silica fume, Spd: Super-plasticiser
17
2.4 PROPERTIES OF FOAM CONCRETE
This section will explain various properties of foam concrete in fresh and hardened
stages.
2.4.1 CONSISTENCY AND STABILITY OF FOAM CONCRETE
The workability of foam concrete, whether it is mortar-based (cement, sand
and water) or neat cement, is described by the ACI (2005b) as the characteristic of a
normal fresh mortar mix that is homogeneous and permits easy mixing, placing,
compacting, and finishing. A common workability test for a basic foam concrete
mixture is the Brewer test or any other test in ASTM C230 (ASTM, 2004b). In a
study conducted by Li (2013), the workability of the mortar was determined based on
the modified cylinder plate method in accordance with ASTM C230 (ASTM,
2004b), which was adopted from the company that supplied the foaming agent and
foam generator.
Valore (1954) noticed that at lower foam concrete densities, the water to
cement ratio increased with the increase of sand level in the mix. Moreover, he stated
that the amount of water required in the mix was determined by the consistency
rather than by a predetermined water/cement ratio. Based on the actual flow table
test, Kearsley and Mostert (2005) were able to determine the workability of a base
mixture of foam concrete according to ASTM C230 (ASTM, 2004b). The water
required for the cement used in their study made up 35% of the total weight of the
cement, which meant that the minimum water to cement ratio needed to avoid the
cement pulling the water from the foam is 0.35. When fly ash was included in the
matrix, the water demand was 0.25 litres for each kg of fly ash. This phenomenon
occurred due to the spherical shape of the particles. This is also reported in a study
carried out by Pretorius (2006). An additional reason for this phenomenon is that fly
18
ash (pozzolanic material) is not engaged in the hydration process during the early
stages (early hours) because it only participates in the processes after the formation
of calcium hydroxide. (Pretorius, 2006)
Fly ash, which contains up to 10% unburnt carbon, has a large particle size
(more than 45 micron) and is reported to increase the water required to achieve a
specific workability (Kearsley, 1999). However, when fly ash is excluded, Kersealy
(2006) indicated that the optimum w/c ratio is in the range of 0.38 based on the foam
content. However, this ratio increased with increment of the ash ratio. Furthermore,
water demand tends to increase with the increasing percentage of foam. The
inclusion of GGBS in the foam concrete base mixture at an equal percentage of the
binder can increase workability. However, increasing the level of GGBS content in
the mixture in addition to the low w/c ratio can cause the foam to separate from the
paste (Brady et al., 2001).
Lim et al. (2013) defined the consistency of foam concrete as the freshly
obtained density over the designed density. On the other hand, Ramamurthy et al.
(2009) described it as the ratio of water to solid that can attain the design density. If
the base mixture of the foam concrete has a low consistency, it will cause the bubbles
to brake due to the stiffness of the mixture, and if it is too watery, it will lead to an
increase in density due to segregation. Furthermore, the consistency of the foam
concrete tends to decline with the addition of foam into the base matrix. In other
words, the consistency of the foam concrete depends on the volume of water added
for the desired density, the type of filler, and the water to solid ratio (Brady et al.,
2001; Ramamurthy et al., 2009). Nevertheless, Jones and McCarthy (2005c)
concluded based on their experiment that replacing the unprocessed fly ash with sand
enhances the consistency of the matrix compared to using sand as the filler because
19
of the finer state and shape of the fly ash particles. Meanwhile, Lim et al. (2013)
concluded that the incorporation of oil palm ash as a filler replacement decreases the
flow-ability of the fresh mix.
The stability of foam concrete is related to the consistency of the base mix
and can be represented by the ratio of water to solid, which differs according to the
filler type. Lim et al. (2013), Valore (1954), and Nambair and Ramamurthy (2007b)
described the stability of foam concrete as the ratio of the demoulded (hardened)
density over the obtained density (fresh). In general, the consistency and stability of
the foam concrete are affected by the amount of foam, the w/s ratio, and the other
solid materials that are introduced into the mixture (Brady et al., 2001; Ramamurthy
et al., 2009). Jones and McCarthy (2005c) and in other paper that published by the
main authors above at (2006) suggested that the stability of foam concrete can be
indicated by comparing the theoretical and actual amount of foam that is added to
achieve the desired plastic density which is within the range of ±50 kg/m3 of the
design value or 3% of the fresh (wet) density.
Also, it was indicated that in terms of the stability of foam concrete with
unprocessed fly ash as a replacement for the sand, the amount of foam required is
more than three times that of normal filler. This is due to the high consistency of the
base mixture as well as the high content of carbon in the ash. Panesar (2013)
mentioned in his study that the inclusion of fine aggregate in the base mixture of the
foam concrete increases the stability of the foam concrete compared to a slurry (neat
cement) mixture, which, although it has more consistency, it is unable to hold the air
bubbles due to segregation.

20
2.4.2 DENSITY
In order to determine the oven dry density, the ASTM C513 (2004e) and BS
EN 12390 part seven at (2009a) recommended that a temperature of 110 oC ± 5 oC
should be applied to the specimen for 24 hours, and the dimensions of the sample
and its weight per cubic meter or cubic foot should be determined. Both dry and
fresh densities of foam concrete are important to determine the requirements of the
mix design, to ensure quality control, and because most of the characteristics of foam
concrete are explained with regard to oven dry density (Fouad, 2006; Jones and
McCarthy, 2006; Ramamurthy et al., 2009).
Basically, preformed foamed concrete with a cement to sand based mixture
has a higher density and requires more cement (Ramamurthy et al., 2009) than fly
ash, which has a relatively lower density and requires less foam, as the filler
replacement. Furthermore, A1-Noury et al. (1990) mentioned that the loss in dry
density of foam concrete increases with the increasing water to cement ratio. Due to
the loss of water in the plastic density of foam concrete, Kearsley and Mostert (2005)
determined that the difference added to the dry density (oven-dried) of the foam
concrete should range from 600 to 1200 kg/m3 in order to obtain the target density,
as calculated from the liner equation below:
Target density = 1.034 Pdry+ 101.96 ….2.1
On the other hand, Jones and McCarthy (2005b) used the equations below to
determine the plastic density of foam concrete incorporated with fly ash as a binder
and filler substitute,
D = ! + ! + !, where ! = !" + !"finer, f= FAcoarse+ sand……..… 2.2
Where D is the target plastic density, C is the cement content, f is the content of fine
aggregate, and W is the free water content, which determined as:

21
W= (w/c) × (PC+ !"finer+ FAcoarse)
Nevertheless, Fouad (2006) and Neville (1996), in their calculation of the
amount of solid material based on the oven dry density and with a water content of
20% of the total binder cement weight, made the following assumption:
D = 1.2C × A (C and A in kg/m3)……………..… 2.3
Where D is the dry density, C is the weight of the cement, and A is the weight of the
aggregate.
McCormick (1967) determined the wet density with a difference of 5% from
the design density by using the solid volume calculation method. In his study, he also
examined the effect of the fineness of the sand, the type of foam agent, and the sand-
cement ratio on the wet density of foam concrete. Jones and McCarthy (2005b)
mentioned that the proportion of the foam concrete mix can be designed according to
the plastic density. Nonetheless, it is difficult to do this with the dry density as the
density of the foam concrete usually drops by about 50 to 200 kg/m3, according to
the total water content in the mixture. Thus, the design of foam concrete mix depends
on the foam concrete plastic density and the curing regime.
In a research by Noordin and Awang (2005), it was noted that there was a
reduction of 60-120 kg/m3 in the dry density (oven-dried) compared to the target
density. Thus, indicating that the designed density tends to be higher than the dry
density. The difference in the dry density and the targeted design density is mostly
due to the water-cement ratio and the casting density.
Jeong and Kim (2011) mentioned in his study that the variation between the
wet density and the oven-dry density depends on the amount of cement paste in the
matrix. The difference, however, increases with an increase in the amount of cement
paste. Also, they discovered in their study that the type of the synthetic foaming

22
agent also influences the gap between the wet and the oven-dry density. The air-dry
density or air curing method for foam concrete is the most convenient industrial
method. The air-dry density technique relies on many factors, such as weather
conditions (temperature and humidity), duration of exposure to the weather, the
density obtained, and the water to binder ratio. Based on the variables and the casting
conditions, air-dry densities are probably lower by about 80 kg/m3 than the cast
density (Fouad, 2006; Neville, 1996).
2.4.3 COMPRESSIVE STRENGTH
Many factors influence the compressive strength of foam concrete, including
density, quantity of cement in the matrix, w/c ratio, mix proportions, type of binder
and filler, admixture, period and type of curing regime, specimen shape and size, and
pore formation method (Fouad, 2006; Narayanan and Ramamurthy, 2000b). In
addition, the size, spacing, and regularity of the air voids as well as the void to paste
ratio might also affect the mechanical properties of the foam concrete (Wee et al.,
2006).
The curing regime is one of the most important factors influencing the
mechanical properties of foam concrete. The conventional water curing practice
promises a higher strength. It has been proven that relative humidity influences the
compressive strength of the foam concrete when it is exposed to the environment and
its strength could be reduced by about 35% within a humidity range of 30 to 80%
(Lee et al., 2011).
Based on laboratory experiments, Kearsley (2006) concluded that the best
curing for foam concrete is moist curing, also known as curing under plastic cover.
In addition, this method of curing can reduce the cost of foam concrete production. It
has been reported that moist-cured foam concrete is affordable and can be used for

23
many applications (Tam et al., 1987). Moreover, it has been proven that a good
curing regime can generate high compressive strength in the long run regardless of
whether a high level classified or non-classified fly ash is replaced by cement in the
foam concrete (Kearsley and Wainwright, 2001b). On the other hand, the
experimental study conducted by Alwi et al. (2010) indicated that curing in salt-
water results in a higher compressive strength than curing in fresh water and in air
due to the development of a strong matrix bond in the foam concrete samples.
A comparison that was made based on the ash/cement ratio for the mix with
and without foam indicated that increasing the ratio decreased the strength of the mix
without foam, while the mix with the foam acted oppositely or maintained its
strength as the control mix. The optimum replacement level of the ash by cement is
50% for a mix content that has 30 or 40% foam (air voids) (Kearsley, 2006). Better
mechanical properties can lead to optimal strength-to-weight ratio, and this is
achieved by having a dense microstructure with relatively small air voids and large
spacing factor (Wee et al., 2006). (Alwi et al., 2010)
Increasing the w/c ratio in foam concrete positively influences the mechanical
properties as long as there is no reduction in the a/c ratio. The compressive strength
of foam concrete depends on both the water to cement and the air to cement ratios,
unlike mortar, which undergoes a reduction in compressive strength with the increase
in the w/c ratio (Fouad, 2006; Tam et al., 1987; Wimpenny, 2006). Moreover, the
presence of 5% to 2% voids in normal concrete dramatically reduces the strength by
30% to 10%, respectively (Al-Noury et al., 1990). The study by Wimpenny (2006)
indicated a dramatic change in compressive strength for foam concrete that has a
density of 1350 kg/m3. However, he found that the strength remained statically the
same when the w/c ratio was above 0.9 and below 0.75.

24
It was reported that small changes in the w/c ratio due to the amount of water
content in the sand, which varied between 6%-14%, did not have an effect on the
strength of the foam concrete (Tam et al., 1987). The sand to cement ratio affects the
strength and the linear trend reduction when there is an increase in the amount of
sand. Furthermore, it is worth mentioning that the reduction in compressive strength
is not affected by further increases in the sand content. The optimum sand/cement
ratios vary between 0.5-1 for foam concrete containing 20% to 60% foam (Kearsley,
2006). The fineness of the sand has been reported to increase the compressive
strength of the foam concrete (Wimpenny, 2006). This phenomenon is attributed to
the uniform coating on each bubble that prevents overlapping and merging, unlike
coarse sand which forms large and irregular pores and also leads to the clustering of
the bubbles (Jitchaiyaphum et al., 2011; Jones and Giannakou, 2004; Nambiar and
Ramamurthy, 2006).
Wimpenny (2006) utilised an equal amount of w/c and a/c to examine the
effect of integrating GGBS in foam concrete. The researcher found that when cement
is replaced by an equal amount of GGBS, the strength of the foam concrete at 7 days
is reported to be much lower than the mix that has no GGBS. However, the scenario
changes at 28 days as the mix with GGBS develops strength that is higher than the
control mix. It has also been reported that the use of coarse fly ash as a filler in the
base mix of foam concrete enhances the compressive strength of the foam concrete.
This phenomenon can be explained as being part of a pozzolanic reaction, where fly
ash, having a lower specific density than fine aggregate, results in reducing the
amount of foam required (Nambiar and Ramamurthy, 2006; Valore Jr, 1954).
Kearsley and Wainwright (2001a) demonstrated that no harmful or major
effects on the compressive strength of high-density foam concrete for long term