graph comprehension model talk, birkbeck and toulouse le mirail, february 2012
TRANSCRIPT
A computational model of graphcomprehension
David Peebles
February 15, 2012
Outline of the talk
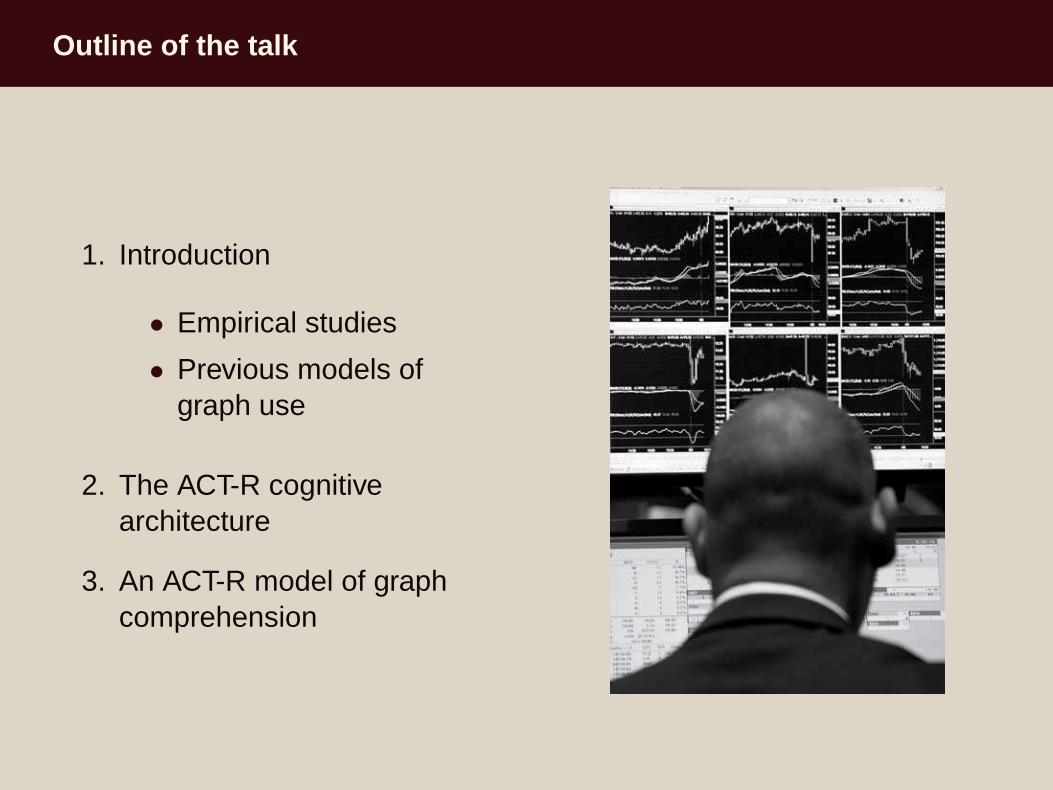
1. Introduction
• Empirical studies
• Previous models ofgraph use
2. The ACT-R cognitivearchitecture
3. An ACT-R model of graphcomprehension
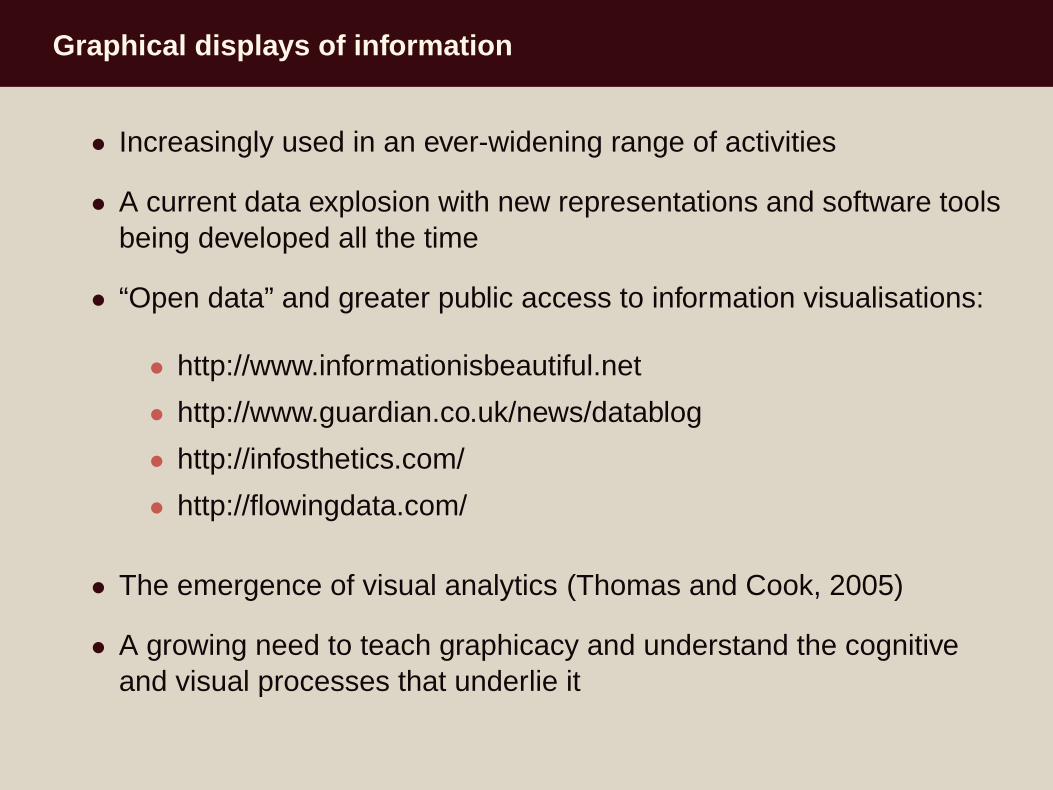
Graphical displays of information
• Increasingly used in an ever-widening range of activities
• A current data explosion with new representations and software toolsbeing developed all the time
• “Open data” and greater public access to information visualisations:
• http://www.informationisbeautiful.net
• http://www.guardian.co.uk/news/datablog
• http://infosthetics.com/
• http://flowingdata.com/
• The emergence of visual analytics (Thomas and Cook, 2005)
• A growing need to teach graphicacy and understand the cognitiveand visual processes that underlie it

Costs and benefits of using graphical representations
Benefits
• Information can be groupedby location, reducing search
• Allows perceptual reasoningand rapid identification ofsalient aspects of data(Larkin and Simon, 1987)
Costs
• People interpret graphicalelements differently(Zacks and Tversky, 1999)
• Interpretation can bedistorted by visual features(Peebles, 2008)
Bar and line graphs
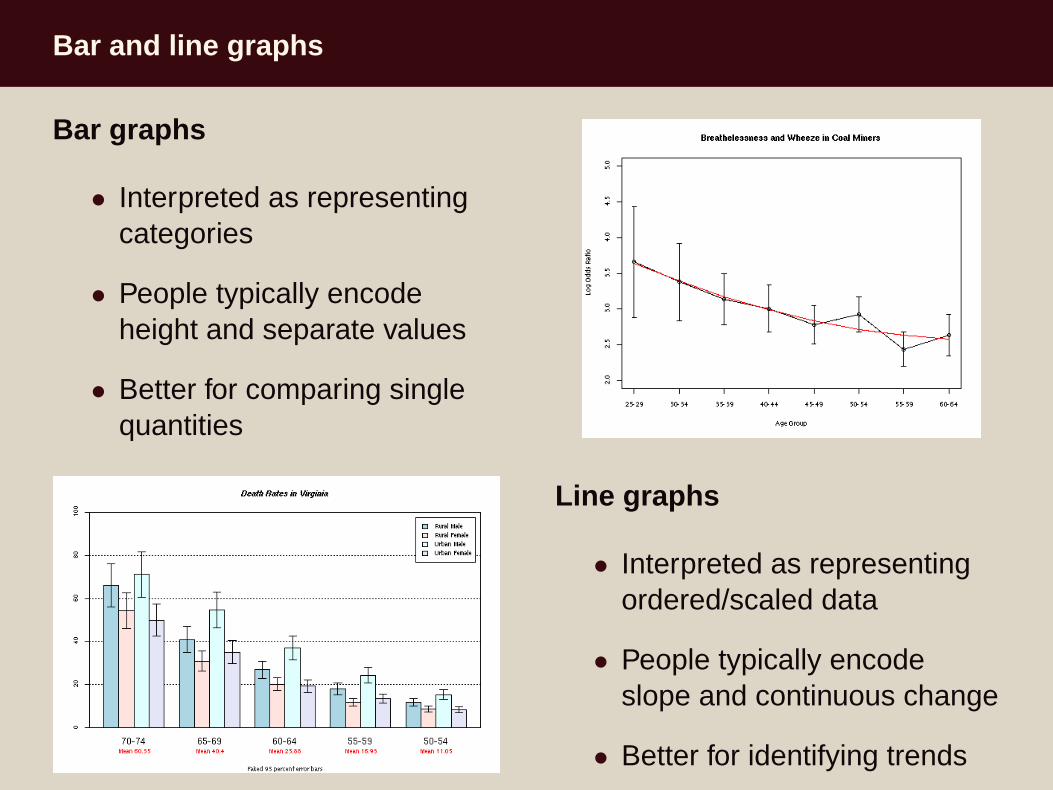
Bar graphs
• Interpreted as representingcategories
• People typically encodeheight and separate values
• Better for comparing singlequantities
Line graphs
• Interpreted as representingordered/scaled data
• People typically encodeslope and continuous change
• Better for identifying trends
Line graphs
0
1
2
3
4
5
6
7
8
9
10
Jan FebMar AprMayJun Jul AugSep Oct NovDec
Am
ount
Pro
duce
d
Month
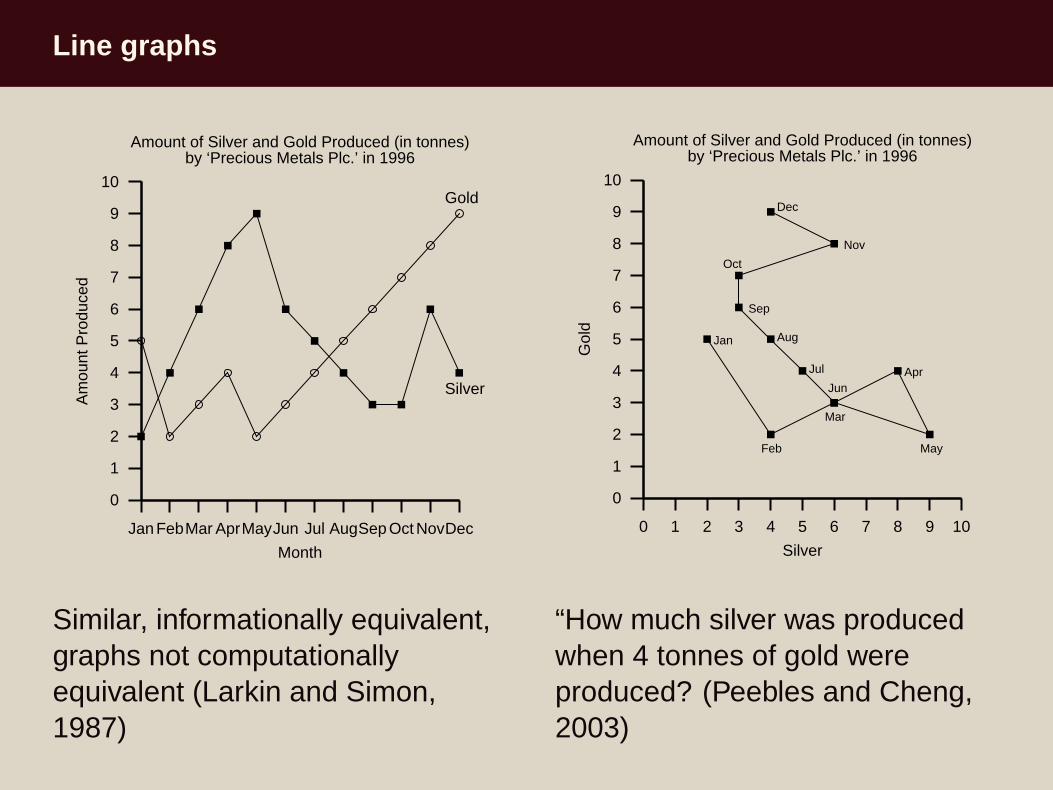
Amount of Silver and Gold Produced (in tonnes)by ‘Precious Metals Plc.’ in 1996
Silver
Gold
Similar, informationally equivalent,graphs not computationallyequivalent (Larkin and Simon,1987)
0
1
2
3
4
5
6
7
8
9
10
0 1 2 3 4 5 6 7 8 9 10
Gol
d
Silver
Amount of Silver and Gold Produced (in tonnes)by ‘Precious Metals Plc.’ in 1996
Jan
Feb
Mar
Apr
May
Jun
Jul
Aug
Sep
Oct
Nov
Dec
“How much silver was producedwhen 4 tonnes of gold wereproduced? (Peebles and Cheng,2003)
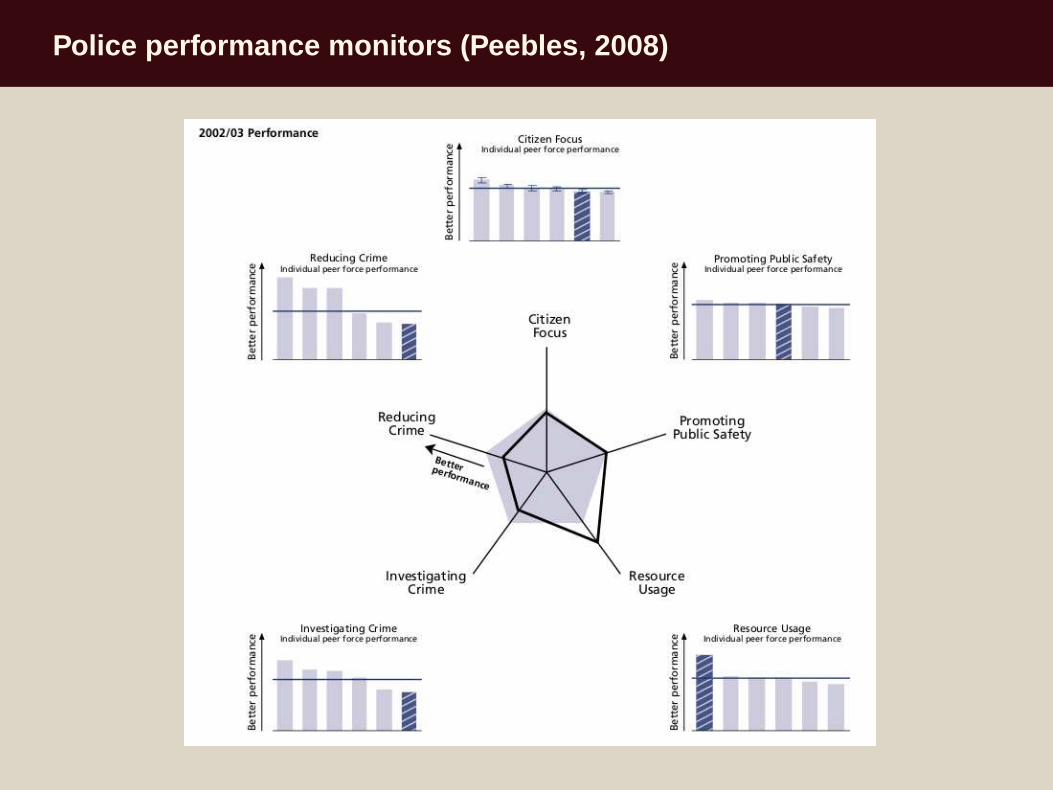
Police performance monitors (Peebles, 2008)
(Peebles and Cheng, 2003)
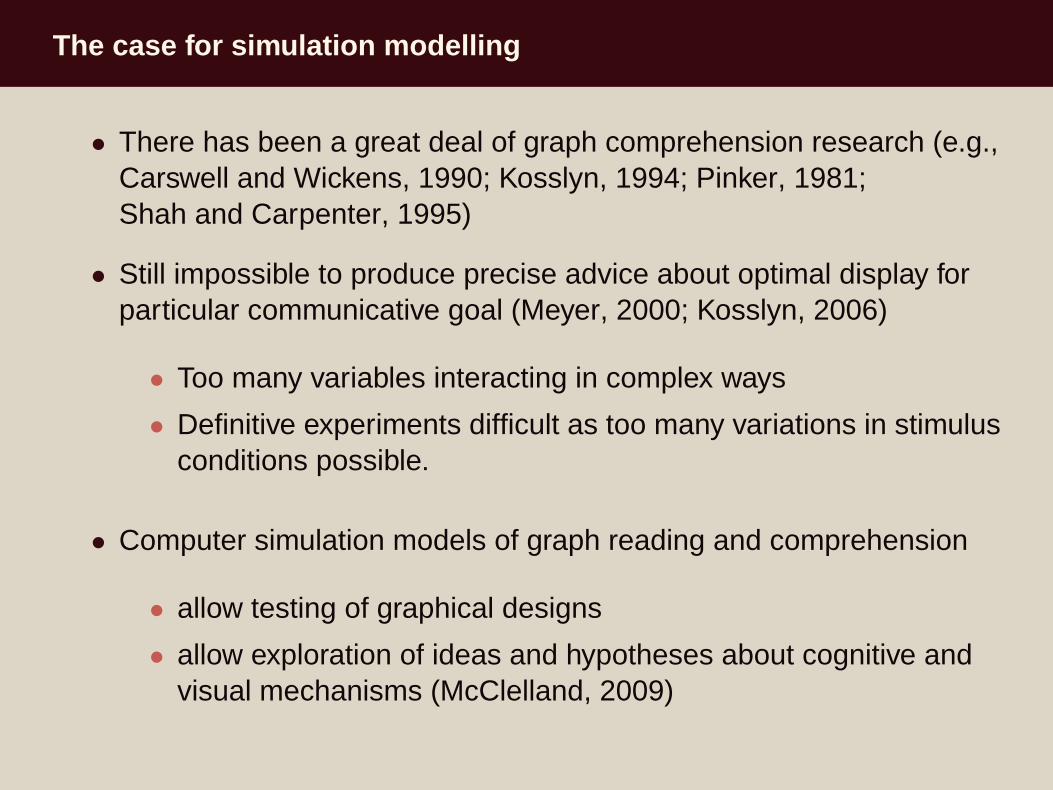
The case for simulation modelling
• There has been a great deal of graph comprehension research (e.g.,Carswell and Wickens, 1990; Kosslyn, 1994; Pinker, 1981;Shah and Carpenter, 1995)
• Still impossible to produce precise advice about optimal display forparticular communicative goal (Meyer, 2000; Kosslyn, 2006)
• Too many variables interacting in complex ways
• Definitive experiments difficult as too many variations in stimulusconditions possible.
• Computer simulation models of graph reading and comprehension
• allow testing of graphical designs
• allow exploration of ideas and hypotheses about cognitive andvisual mechanisms (McClelland, 2009)
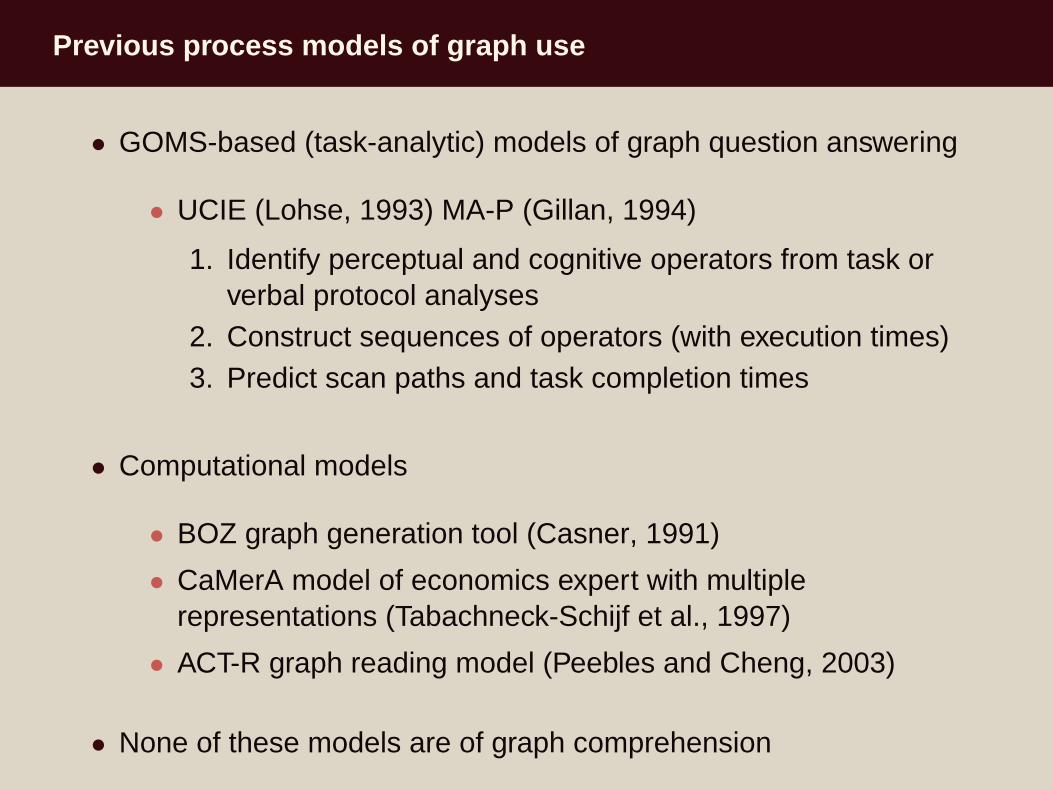
Previous process models of graph use
• GOMS-based (task-analytic) models of graph question answering
• UCIE (Lohse, 1993) MA-P (Gillan, 1994)
1. Identify perceptual and cognitive operators from task orverbal protocol analyses
2. Construct sequences of operators (with execution times)3. Predict scan paths and task completion times
• Computational models
• BOZ graph generation tool (Casner, 1991)
• CaMerA model of economics expert with multiplerepresentations (Tabachneck-Schijf et al., 1997)
• ACT-R graph reading model (Peebles and Cheng, 2003)
• None of these models are of graph comprehension

Cognitive architectures
• “Unified theories of cognition” (Newell, 1990)
• Theories of core cognitive components, representational formats,and processes (e.g., memory, cognitive control)
• Main examples of symbolic cognitive architectures:
• Soar (Newell, 1990; Laird, 2012)
• Epic (Kieras and Meyer, 1997)
• ACT-R (Anderson, 2007)
• All three based on production system architecture
• All can interact with simulated task environments
• This allows models of interaction with external representations to bedeveloped
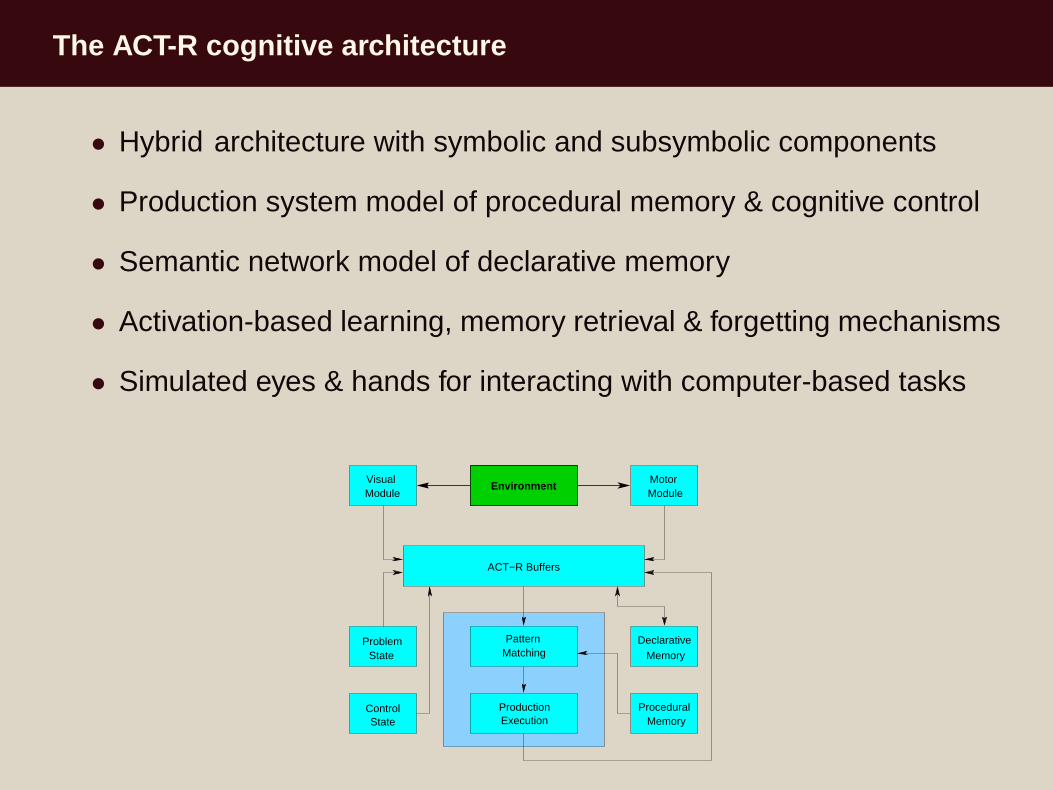
The ACT-R cognitive architecture
• Hybrid architecture with symbolic and subsymbolic components
• Production system model of procedural memory & cognitive control
• Semantic network model of declarative memory
• Activation-based learning, memory retrieval & forgetting mechanisms
• Simulated eyes & hands for interacting with computer-based tasks
VisualModule
ACT−R Buffers
Environment
PatternMatching
ExecutionProduction
ModuleMotor
ControlState
ProblemState
MemoryProcedural
MemoryDeclarative
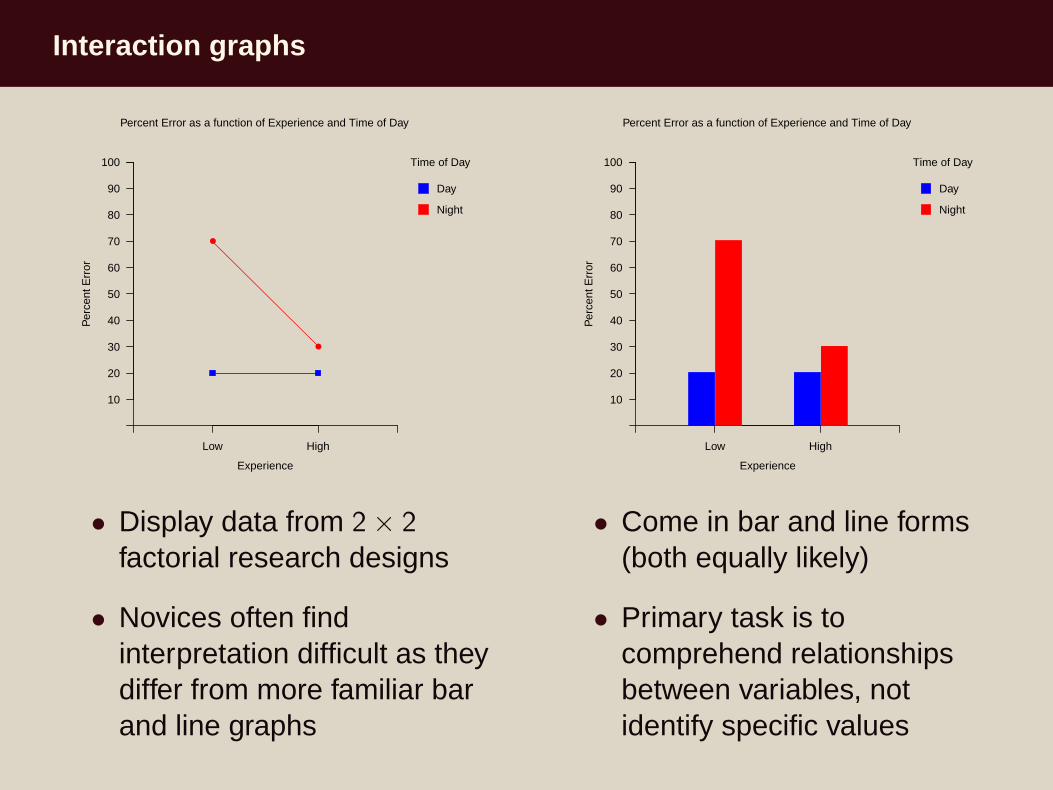
Interaction graphs
Low High
10
20
30
40
50
60
70
80
90
100
●
●
Percent Error as a function of Experience and Time of Day
Per
cent
Err
or
Experience
Time of Day
Day
Night
• Display data from 2× 2
factorial research designs
• Novices often findinterpretation difficult as theydiffer from more familiar barand line graphs
Low High
10
20
30
40
50
60
70
80
90
100
Percent Error as a function of Experience and Time of Day
Per
cent
Err
or
Experience
Time of Day
Day
Night
• Come in bar and line forms(both equally likely)
• Primary task is tocomprehend relationshipsbetween variables, notidentify specific values

How people use interaction graphs
Low High
10
20
30
40
50
60
70
80
90
100
●
●
Percent Error as a function of Experience and Time of Day
Per
cent
Err
or
Experience
Time of Day
Day
Night
• Novices’ interpretations ofline graphs significantlyworse than bar graphs(Peebles and Ali, 2009)
• Drawn by salience of lines toidentify legend variable &ignore x axis variable
Low High
10
20
30
40
50
60
70
80
90
100
Percent Error as a function of Experience and Time of Day
Per
cent
Err
or
Experience
Time of Day
Day
Night
• Expert users’ interpretationsalso affected by graph type
• New line graph designimproved novice performanceto bar graph level (Ali andPeebles, submitted)
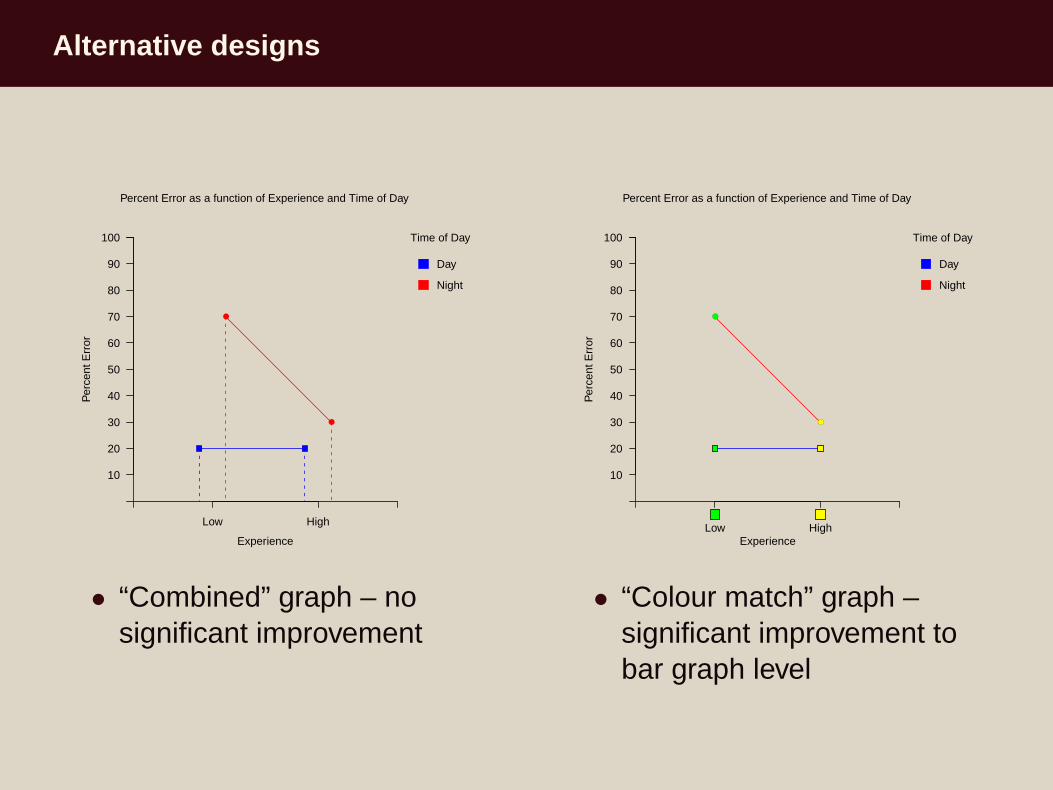
Alternative designs
Low High
10
20
30
40
50
60
70
80
90
100
●
●
Percent Error as a function of Experience and Time of Day
Per
cent
Err
or
Experience
Time of Day
Day
Night
• “Combined” graph – nosignificant improvement
10
20
30
40
50
60
70
80
90
100
●
●
Percent Error as a function of Experience and Time of Day
Per
cent
Err
or
ExperienceLow High
Time of Day
Day
Night
• “Colour match” graph –significant improvement tobar graph level
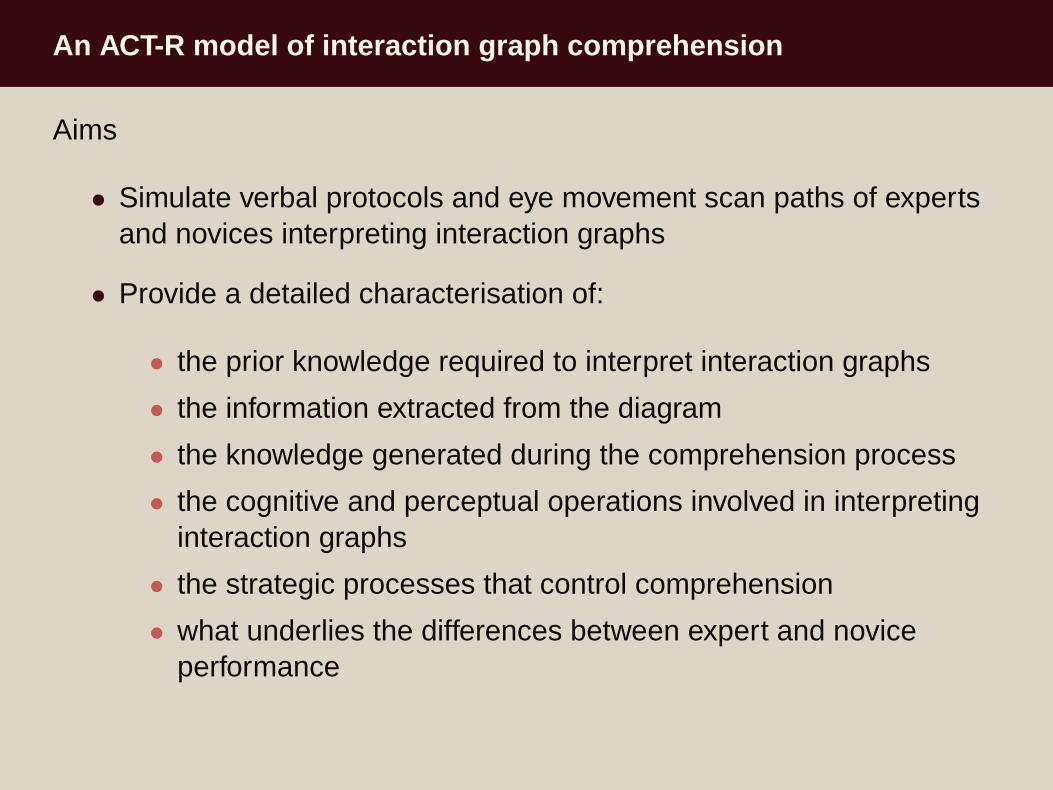
An ACT-R model of interaction graph comprehension
Aims
• Simulate verbal protocols and eye movement scan paths of expertsand novices interpreting interaction graphs
• Provide a detailed characterisation of:
• the prior knowledge required to interpret interaction graphs
• the information extracted from the diagram
• the knowledge generated during the comprehension process
• the cognitive and perceptual operations involved in interpretinginteraction graphs
• the strategic processes that control comprehension
• what underlies the differences between expert and noviceperformance
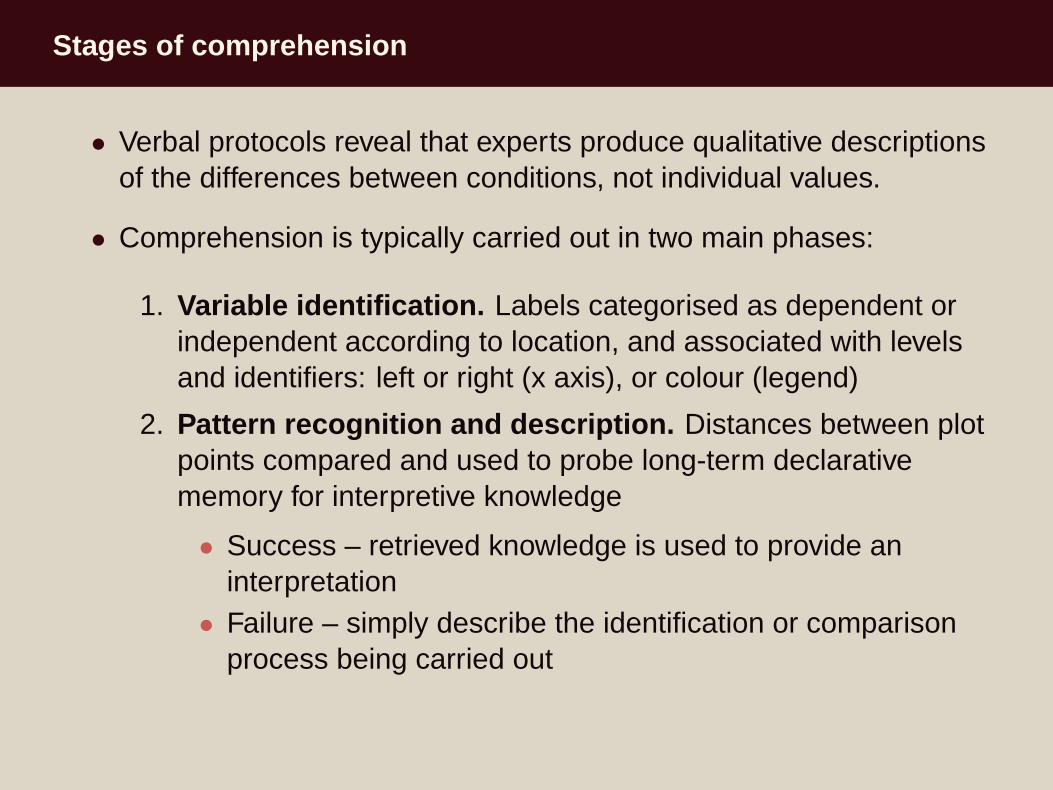
Stages of comprehension
• Verbal protocols reveal that experts produce qualitative descriptionsof the differences between conditions, not individual values.
• Comprehension is typically carried out in two main phases:
1. Variable identification. Labels categorised as dependent orindependent according to location, and associated with levelsand identifiers: left or right (x axis), or colour (legend)
2. Pattern recognition and description. Distances between plotpoints compared and used to probe long-term declarativememory for interpretive knowledge
• Success – retrieved knowledge is used to provide aninterpretation
• Failure – simply describe the identification or comparisonprocess being carried out
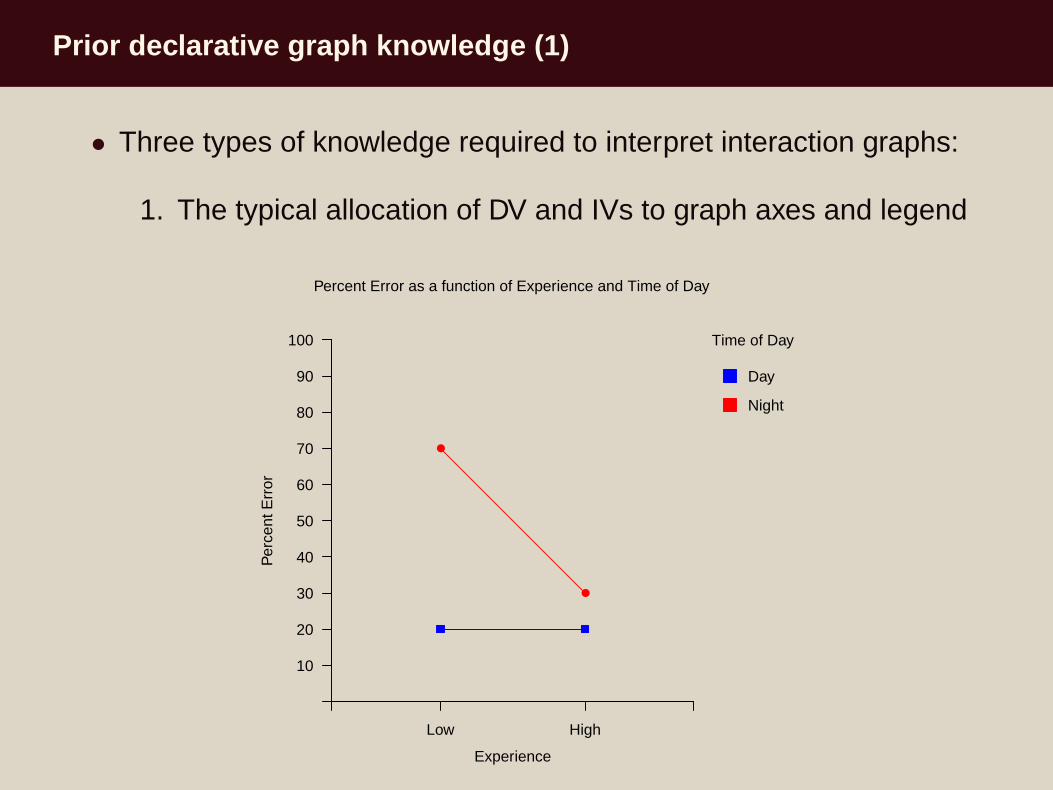
Prior declarative graph knowledge (1)
• Three types of knowledge required to interpret interaction graphs:
1. The typical allocation of DV and IVs to graph axes and legend
Low High
10
20
30
40
50
60
70
80
90
100
●
●
Percent Error as a function of Experience and Time of DayP
erce
nt E
rror
Experience
Time of Day
Day
Night
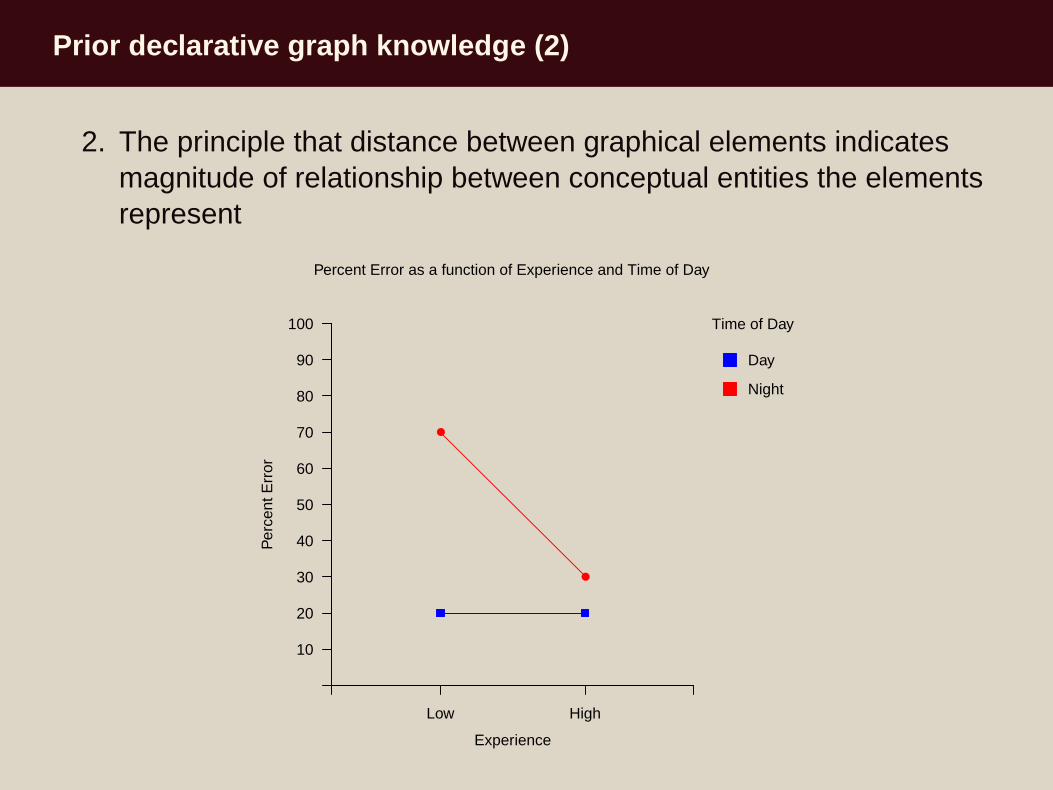
Prior declarative graph knowledge (2)
2. The principle that distance between graphical elements indicatesmagnitude of relationship between conceptual entities the elementsrepresent
Low High
10
20
30
40
50
60
70
80
90
100
●
●
Percent Error as a function of Experience and Time of DayP
erce
nt E
rror
Experience
Time of Day
Day
Night
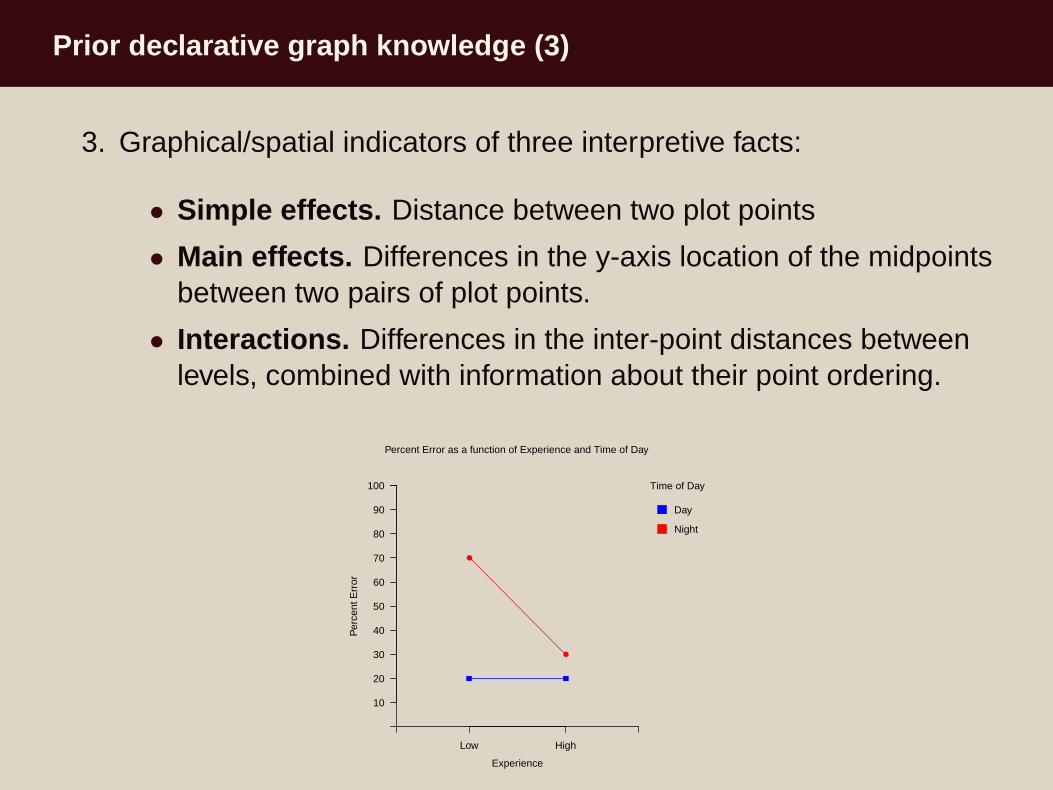
Prior declarative graph knowledge (3)
3. Graphical/spatial indicators of three interpretive facts:
• Simple effects. Distance between two plot points
• Main effects. Differences in the y-axis location of the midpointsbetween two pairs of plot points.
• Interactions. Differences in the inter-point distances betweenlevels, combined with information about their point ordering.
Low High
10
20
30
40
50
60
70
80
90
100
●
●
Percent Error as a function of Experience and Time of Day
Per
cent
Err
or
Experience
Time of Day
Day
Night
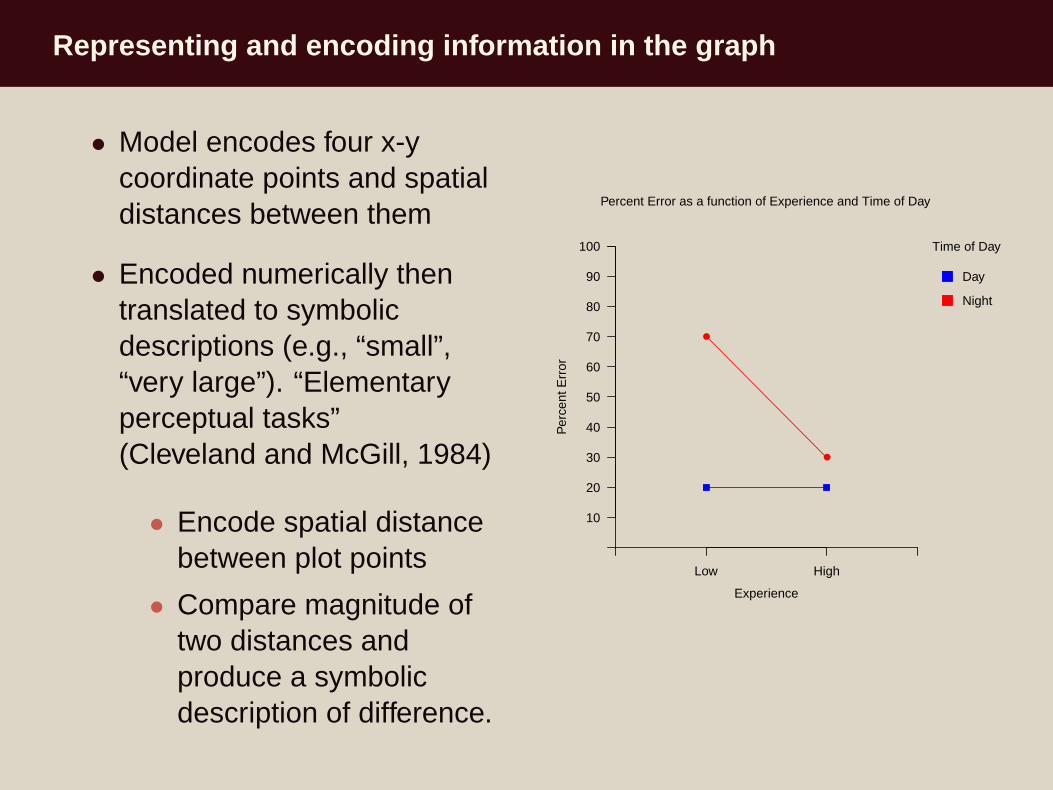
Representing and encoding information in the graph
• Model encodes four x-ycoordinate points and spatialdistances between them
• Encoded numerically thentranslated to symbolicdescriptions (e.g., “small”,“very large”). “Elementaryperceptual tasks”(Cleveland and McGill, 1984)
• Encode spatial distancebetween plot points
• Compare magnitude oftwo distances andproduce a symbolicdescription of difference.
Low High
10
20
30
40
50
60
70
80
90
100
●
●
Percent Error as a function of Experience and Time of Day
Per
cent
Err
or
Experience
Time of Day
Day
Night
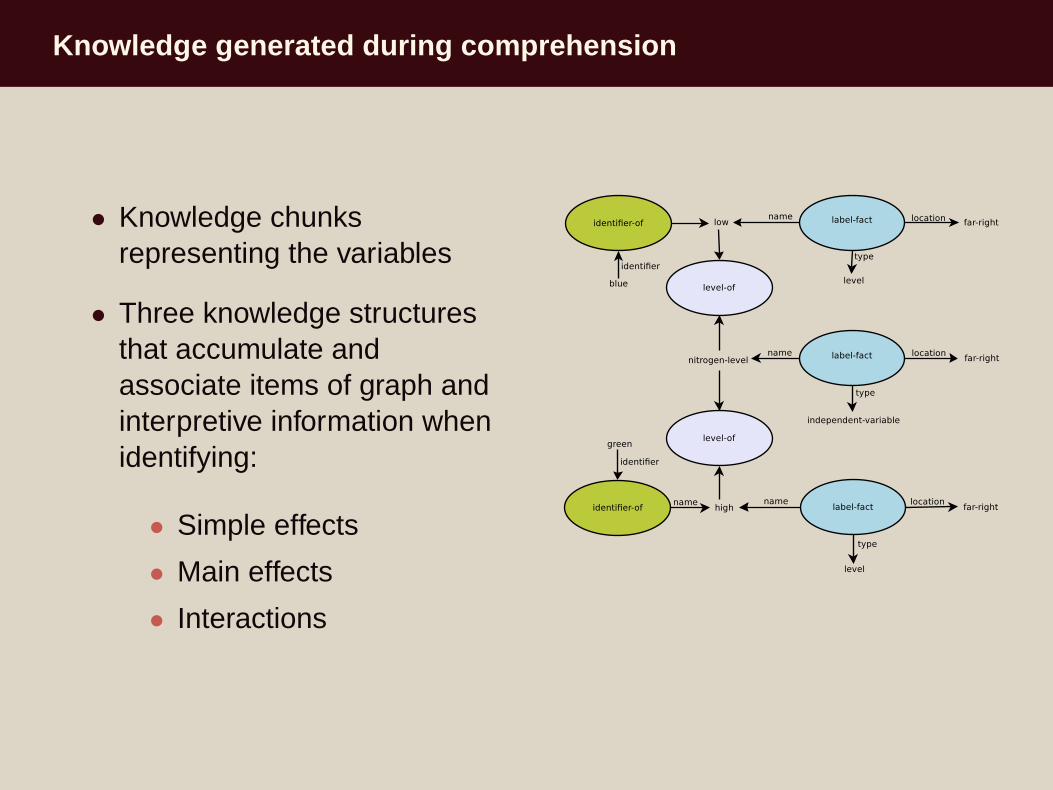
Knowledge generated during comprehension
• Knowledge chunksrepresenting the variables
• Three knowledge structuresthat accumulate andassociate items of graph andinterpretive information whenidentifying:
• Simple effects
• Main effects
• Interactions
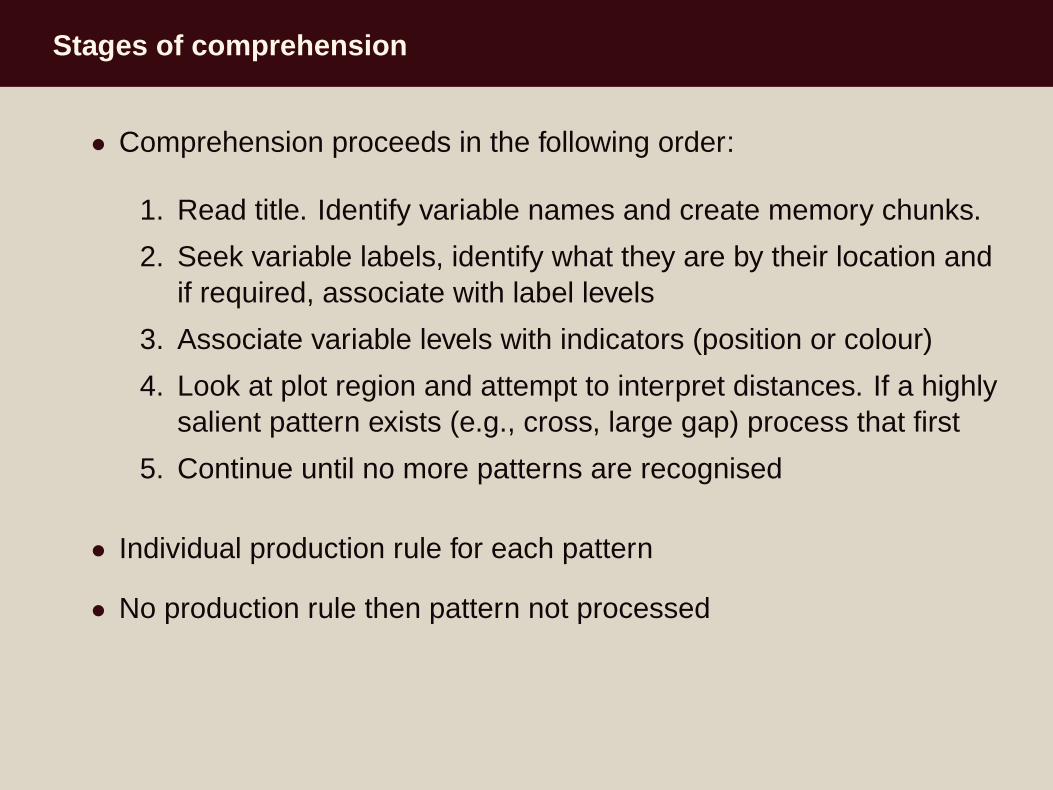
Stages of comprehension
• Comprehension proceeds in the following order:
1. Read title. Identify variable names and create memory chunks.
2. Seek variable labels, identify what they are by their location andif required, associate with label levels
3. Associate variable levels with indicators (position or colour)
4. Look at plot region and attempt to interpret distances. If a highlysalient pattern exists (e.g., cross, large gap) process that first
5. Continue until no more patterns are recognised
• Individual production rule for each pattern
• No production rule then pattern not processed
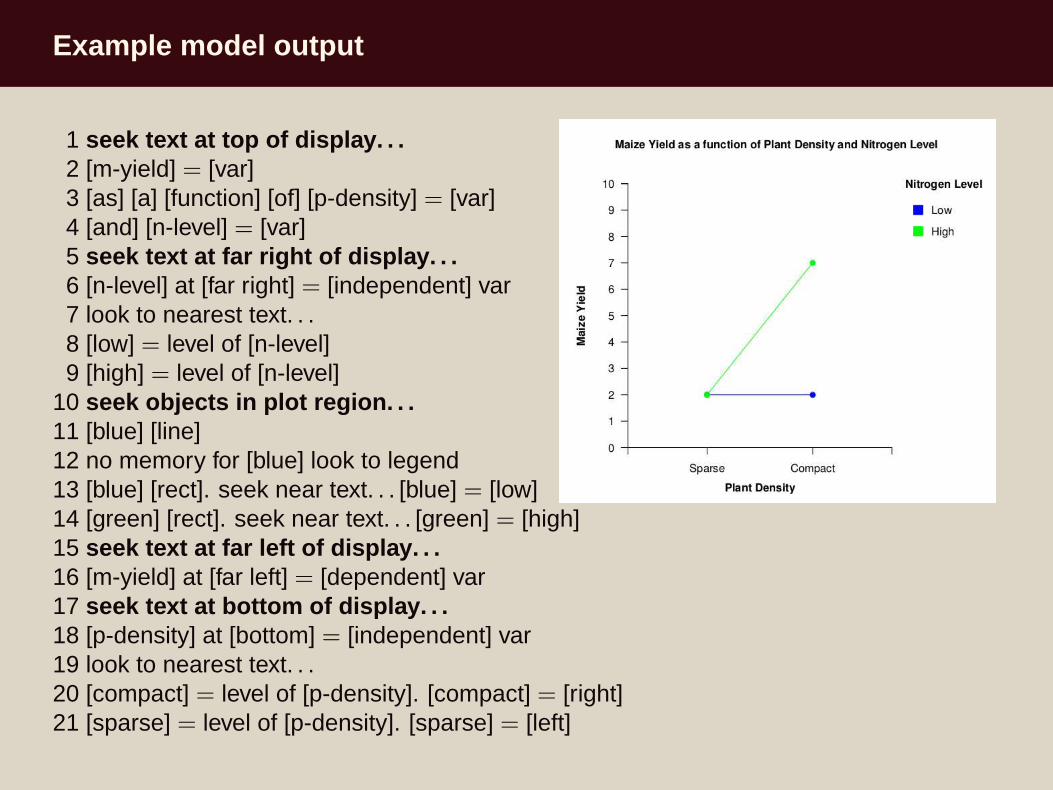
Example model output
1 seek text at top of display. . .2 [m-yield] = [var]3 [as] [a] [function] [of] [p-density] = [var]4 [and] [n-level] = [var]5 seek text at far right of display. . .6 [n-level] at [far right] = [independent] var7 look to nearest text. . .8 [low] = level of [n-level]9 [high] = level of [n-level]
10 seek objects in plot region. . .11 [blue] [line]12 no memory for [blue] look to legend13 [blue] [rect]. seek near text. . . [blue] = [low]14 [green] [rect]. seek near text. . . [green] = [high]15 seek text at far left of display. . .16 [m-yield] at [far left] = [dependent] var17 seek text at bottom of display. . .18 [p-density] at [bottom] = [independent] var19 look to nearest text. . .20 [compact] = level of [p-density]. [compact] = [right]21 [sparse] = level of [p-density]. [sparse] = [left]
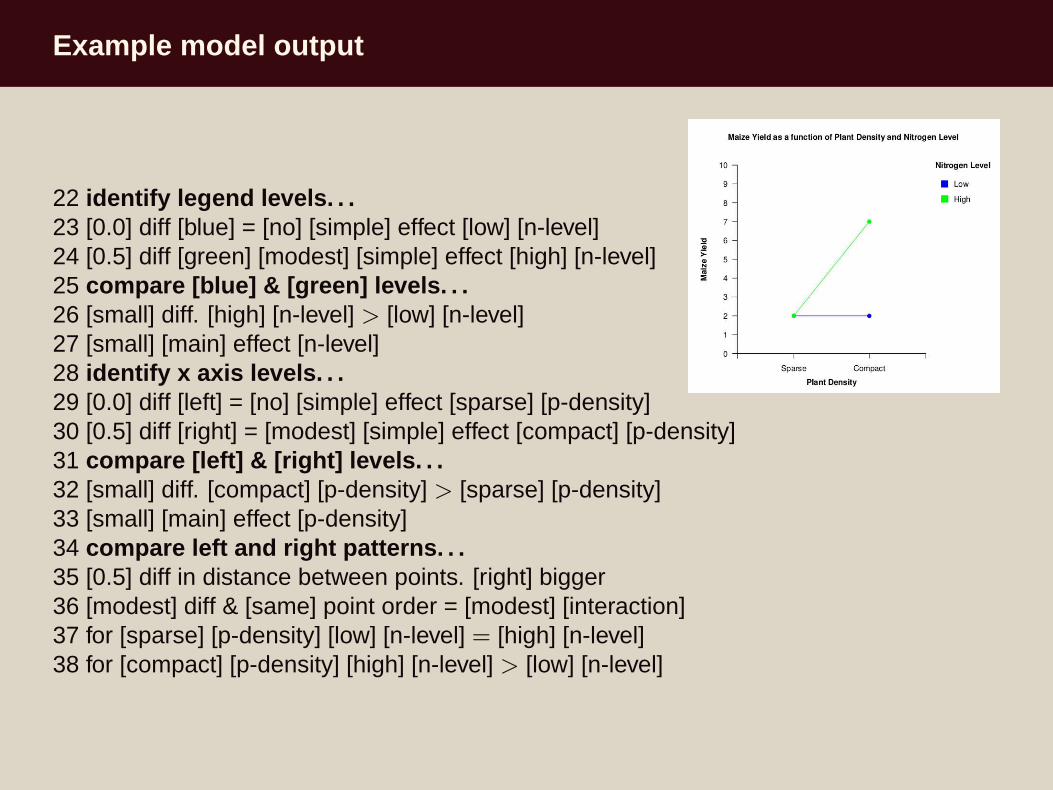
Example model output
22 identify legend levels. . .23 [0.0] diff [blue] = [no] [simple] effect [low] [n-level]24 [0.5] diff [green] [modest] [simple] effect [high] [n-level]25 compare [blue] & [green] levels. . .26 [small] diff. [high] [n-level] > [low] [n-level]27 [small] [main] effect [n-level]28 identify x axis levels. . .29 [0.0] diff [left] = [no] [simple] effect [sparse] [p-density]30 [0.5] diff [right] = [modest] [simple] effect [compact] [p-density]31 compare [left] & [right] levels. . .32 [small] diff. [compact] [p-density] > [sparse] [p-density]33 [small] [main] effect [p-density]34 compare left and right patterns. . .35 [0.5] diff in distance between points. [right] bigger36 [modest] diff & [same] point order = [modest] [interaction]37 for [sparse] [p-density] [low] [n-level] = [high] [n-level]38 for [compact] [p-density] [high] [n-level] > [low] [n-level]

Limitations of the model
• Model currently focuses on graph knowledge and not the effects ofdomain knowledge. Experts do display such domain-general graphknowledge.
• Early visual processes are not specified. ACT-R models of visual andspatial processing are being developed.
• Although based on human data, the model has not been rigorouslycompared to eye movement and verbal protocol data yet.
• Model of novice users has not been developed yet
• Selectively remove production rules and interpretive declarativeknowledge.
Conclusions
• Currently the only computational model of graph comprehension
• Given a data set from a 2× 2 factorial research design it will producean expert level description of the effects
• The model also describes the patterns used to produce theinterpretation
• The model associates variables and their levels, and levels with theircolour identifiers using mechanisms that are functionally equivalentto the Gestalt laws of proximity and similarity respectively.
• The current model can be considered a first approximation to a moredetailed model that incorporates additional factors to broaden thescope of behaviour accounted for.
• The model will form the basis of a more general graphcomprehension model that can interpret bar interaction graphs andmore general bar and line graphs.
References (1)
• Ali, N. and Peebles, D. (submitted). The effect of gestalt laws of perceptualorganisation on the comprehension of three-variable bar and line graphs
• Anderson, J. R. (2007). How can the human mind occur in the physicaluniverse? Oxford University Press, New York, NY
• Carswell, C. M. and Wickens, C. D. (1990). The perceptual interaction ofgraphical attributes: Configurality, stimulus homogeneity, and objectinteraction. Perception & Psychophysics, 47:157–168
• Casner, S. M. (1991). A task-analytic approach to the automated design ofgraphic presentations. ACM Transactions on Graphics, 10:111–151
• Gillan, D. J. (1994). A componential model of human interaction withgraphs: 1. linear regression modelling. Human Factors, 36(3):419–440
References (2)
• Kieras, D. E. and Meyer, D. E. (1997). An overview of the EPIC architecturefor cognition and performance with application to human-computerinteraction. Human-Computer Interaction, 12:391–438
• Kosslyn, S. M. (1994). Elements of graph design. W. H. Freeman & Co.,New York
• Kosslyn, S. M. (2006). Graph design for the eye and mind. OxfordUniversity Press, New York
• Laird, J. E. (2012). The Soar cognitive architecture. MIT Press, Cambridge,Mass
• Lohse, G. L. (1993). A cognitive model for understanding graphicalperception. Human-Computer Interaction, 8:353–388
• Meyer, J. (2000). Performance with tables and graphs: effects of trainingand a visual search model. Ergonomics, 43(11):1840–1865
References (3)
• McClelland, J. L. (2009). The place of modeling in cognitive science.Topics in Cognitive Science, 1:11–38
• Newell, A. (1990). Unified theories of cognition. The William Jameslectures. Harvard University Press
• Peebles, D. (2008). The effect of emergent features on judgments ofquantity in configural and seperable displays. Journal of ExperimentalPsychology: Applied, 14(2):85–100
• Peebles, D. and Ali, N. (2009). Differences in comprehensibility betweenthree-variable bar and line graphs. In Proceedings of the Thirty-first AnnualConference of the Cognitive Science Society, pages 2938–2943, Mahwah,NJ. Lawrence Erlbaum Associates
• Peebles, D. and Cheng, P. C.-H. (2003). Modeling the effect of task andgraphical representation on response latency in a graph reading task.Human Factors, 45:28–45
References (4)
• Pinker, S. (1981). A theory of graph comprehension. Occasional Paper 10,Center for Cognitive Science, Massachusetts Institute of Technology
• Shah, P. and Carpenter, P. A. (1995). Conceptual limitations incomprehending line graphs. Journal of Experimental Psychology: General,124:43–62
• Tabachneck-Schijf, H. J. M., Leonardo, A. M., and Simon, H. A. (1997).CaMeRa: A computational model of multiple representations. CognitiveScience, 21:305–350
• Thomas, J. J. and Cook, K. A. (2005). Illuminating the path: The researchand development agenda for visual analytics. IEEE Press
• Zacks, J. and Tversky, B. (1999). Bars and lines: A study of graphiccommunication. Memory and Cognition, 27(6):1073–1079