graph - sharif
TRANSCRIPT


High dim. data
Locality sensitive hashing
Clustering
Dimensionality
reduction
Graph data
PageRank, SimRank
Community Detection
Spam Detection
Infinite data
Filtering data
streams
Web advertising
Queries on streams
Machine learning
SVM
Decision Trees
Perceptron, kNN
Apps
Recommender systems
Association Rules
Duplicate document detection
4/9/2020 2

Customer X
Buys Metallica CD
Buys Megadeth CD
Customer Y Does search on Metallica
Recommender system suggests Megadeth from data collected about customer X
4/9/2020 3
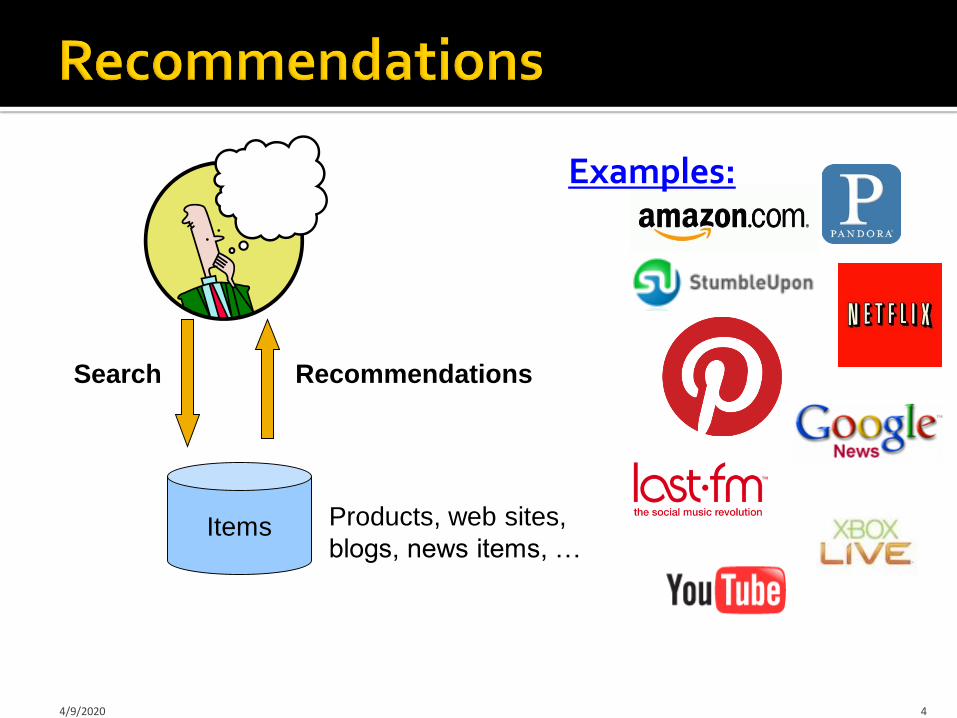
Items
Search Recommendations
Products, web sites,
blogs, news items, …
4/9/2020 4
Examples:

Shelf space is a scarce commodity for traditional retailers Also: TV networks, movie theaters,…
Web enables near-zero-cost dissemination of information about products From scarcity to abundance
More choice necessitates better filters: Recommendation engines
Association rules: How Into Thin Air made Touching the Void a bestseller: http://www.wired.com/wired/archive/12.10/tail.html
4/9/2020 5
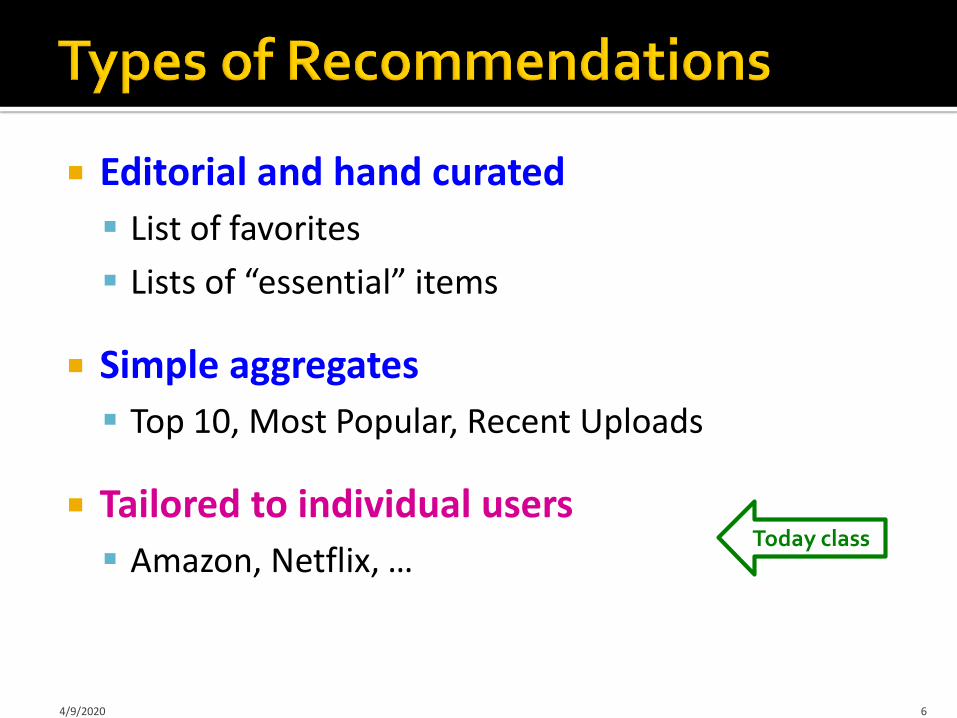
Editorial and hand curated
List of favorites
Lists of “essential” items
Simple aggregates
Top 10, Most Popular, Recent Uploads
Tailored to individual users
Amazon, Netflix, …
4/9/2020 6
Today class

X = set of Customers S = set of Items
Utility function u: X × S R
R = set of ratings
R is a totally ordered set
e.g., 0-5 stars, real number in [0,1]
4/9/2020 7
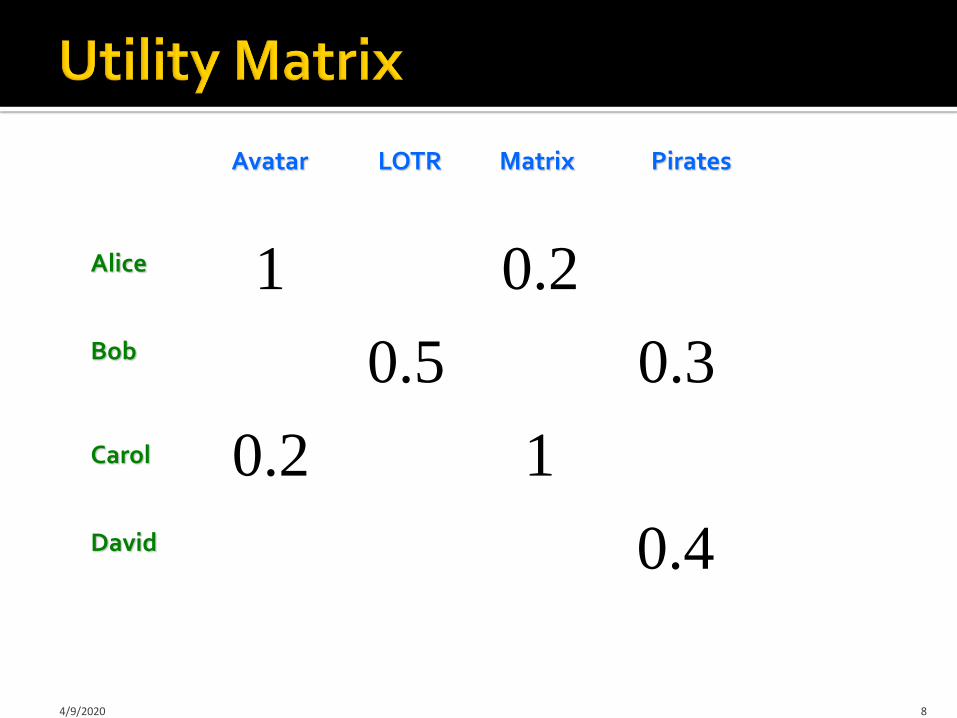
0.4
10.2
0.30.5
0.21
Avatar LOTR Matrix Pirates
Alice
Bob
Carol
David
4/9/2020 8
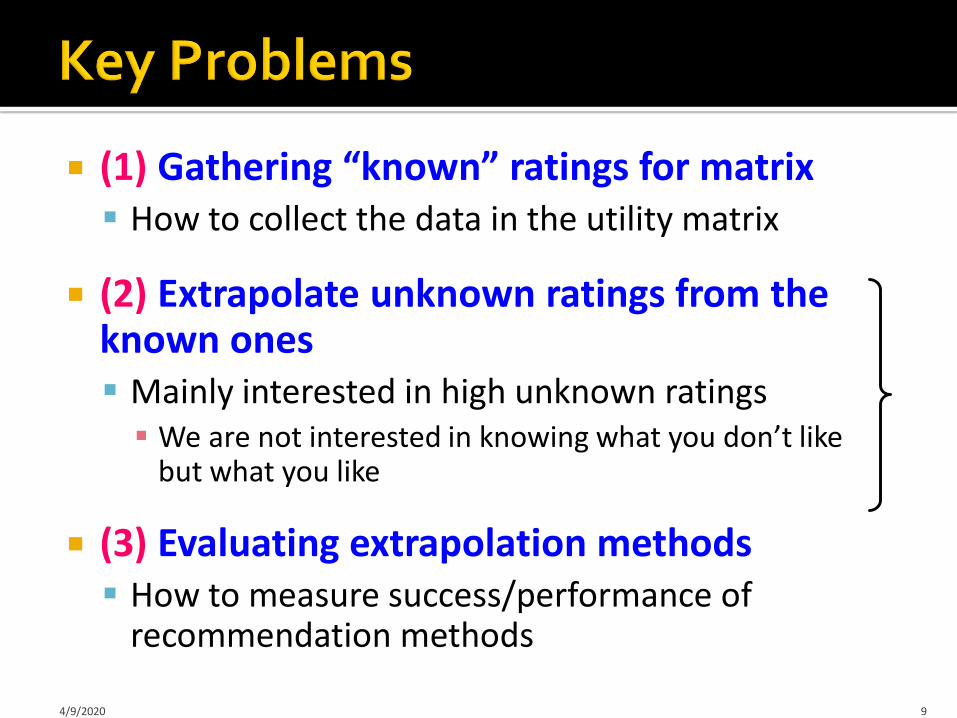
(1) Gathering “known” ratings for matrix How to collect the data in the utility matrix
(2) Extrapolate unknown ratings from the known ones Mainly interested in high unknown ratings We are not interested in knowing what you don’t like
but what you like
(3) Evaluating extrapolation methods How to measure success/performance of
recommendation methods
4/9/2020 9

Explicit
Ask people to rate items
Doesn’t work well in practice – people can’t be bothered
Crowdsourcing: Pay people to label items
Implicit
Learn ratings from user actions
E.g., purchase implies high rating
What about low ratings?
4/9/2020 10
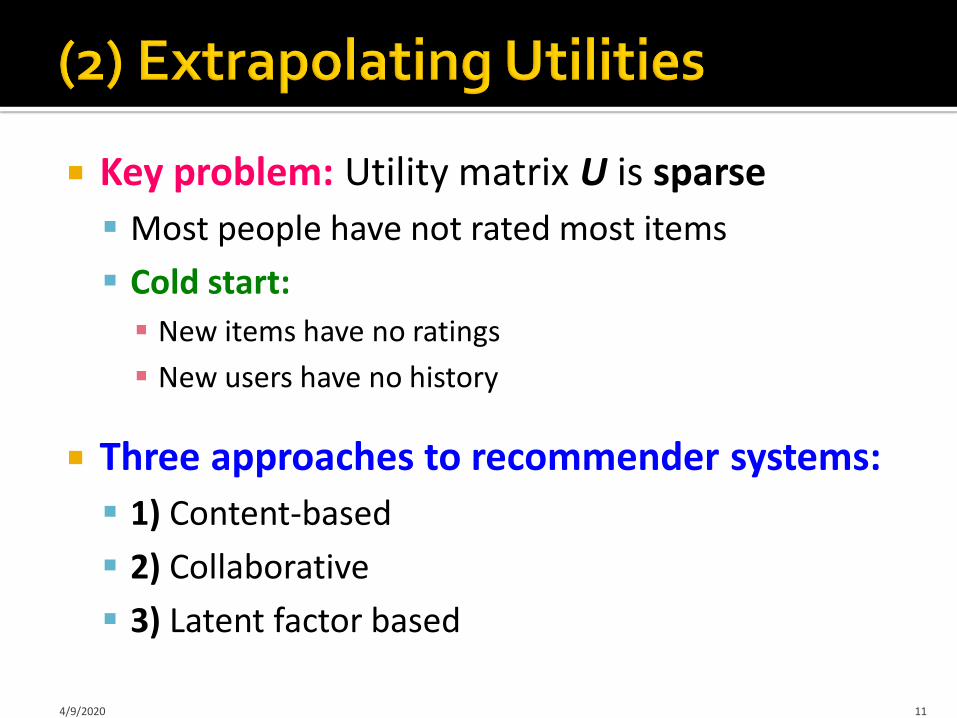
Key problem: Utility matrix U is sparse
Most people have not rated most items
Cold start:
New items have no ratings
New users have no history
Three approaches to recommender systems:
1) Content-based
2) Collaborative
3) Latent factor based
4/9/2020 11

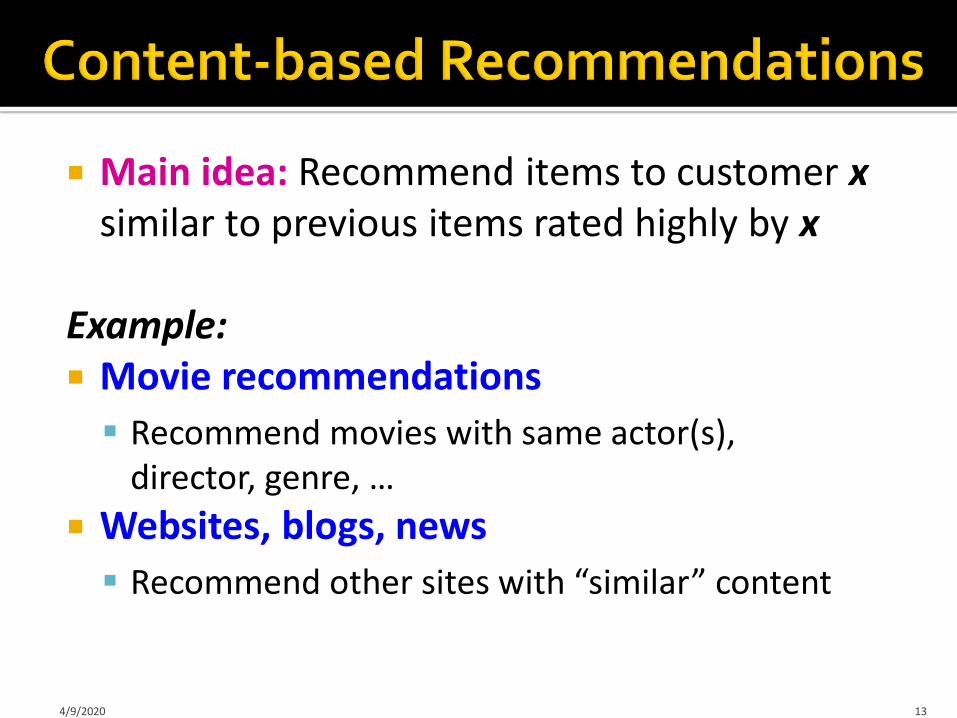
Main idea: Recommend items to customer xsimilar to previous items rated highly by x
Example: Movie recommendations
Recommend movies with same actor(s), director, genre, …
Websites, blogs, news
Recommend other sites with “similar” content
4/9/2020 13

likes
Item profiles
Red
Circles
Triangles
User profile
match
recommendbuild
4/9/2020 14

For each item, create an item profile
Profile is a set (vector) of features
Movies: author, title, actor, director,…
Text: Set of “important” words in document
How to pick important features?
Usual heuristic from text mining is TF-IDF(Term frequency * Inverse Doc Frequency)
Term … Feature
Document … Item
4/9/2020 15

fij = frequency of term (feature) i in doc (item) j
ni = number of docs that mention term iN = total number of docs
TF-IDF score: wij = TFij × IDFi
Doc profile = set of words with highest TF-IDF scores, together with their scores
4/9/2020 16
Note: we normalize TF
to discount for “longer”
documents

User profile possibilities: Weighted average of rated item profiles
Variation: weight by difference from average rating for item
Prediction heuristic: Cosine similarity of user and item profiles) Given user profile x and item profile i, estimate
𝑢 𝒙, 𝒊 = cos 𝒙, 𝒊 =𝒙·𝒊
𝒙 ⋅ 𝒊
How do you quickly find items closest to 𝒙? Job for LSH!
4/9/2020 17

+: No need for data on other users
No cold-start or sparsity problems
+: Able to recommend to users with unique tastes
+: Able to recommend new & unpopular items
No first-rater problem
+: Able to provide explanations
Can provide explanations of recommended items by listing content-features that caused an item to be recommended
4/9/2020 18

–: Finding the appropriate features is hard
E.g., images, movies, music
–: Recommendations for new users
How to build a user profile?
–: Overspecialization
Never recommends items outside user’s content profile
People might have multiple interests
Unable to exploit quality judgments of other users
4/9/2020 19

Harnessing quality judgments of other users

Consider user x
Find set N of other users whose ratings are “similar” to x’s ratings
Estimate x’s ratings based on ratings of users in N
4/9/2020 21
x
N
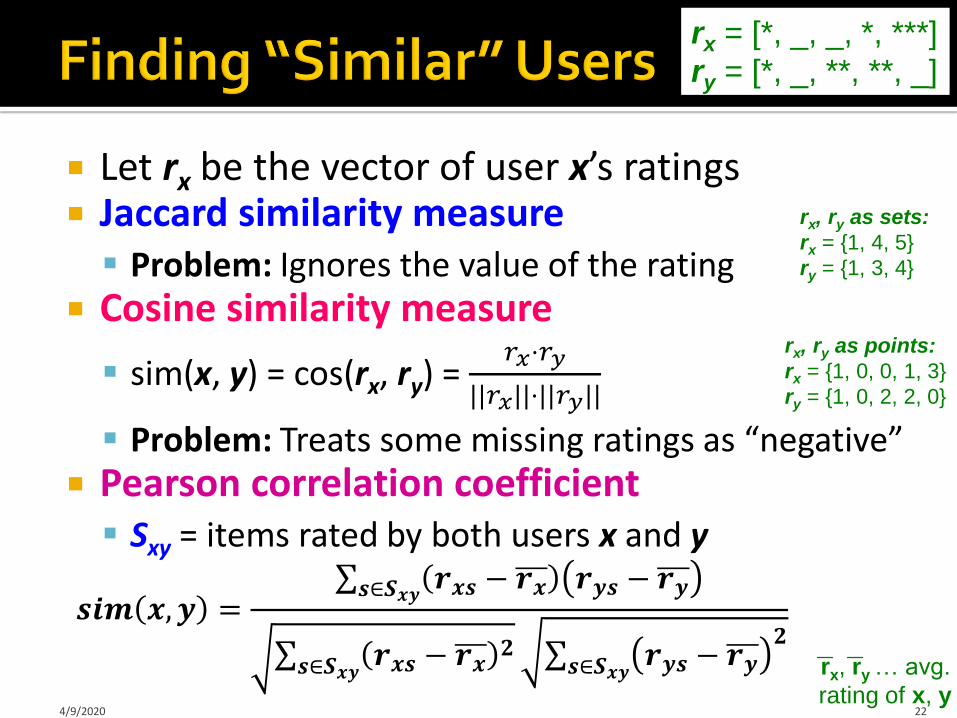
Let rx be the vector of user x’s ratings Jaccard similarity measure Problem: Ignores the value of the rating
Cosine similarity measure
sim(x, y) = cos(rx, ry) = 𝑟𝑥⋅𝑟𝑦
||𝑟𝑥||⋅||𝑟𝑦||
Problem: Treats some missing ratings as “negative” Pearson correlation coefficient Sxy = items rated by both users x and y
4/9/2020 22
rx = [*, _, _, *, ***]
ry = [*, _, **, **, _]
rx, ry as sets:
rx = {1, 4, 5}
ry = {1, 3, 4}
rx, ry as points:
rx = {1, 0, 0, 1, 3}
ry = {1, 0, 2, 2, 0}
rx, ry … avg.
rating of x, y
𝒔𝒊𝒎 𝒙, 𝒚 = 𝒔∈𝑺𝒙𝒚 𝒓𝒙𝒔 − 𝒓𝒙 𝒓𝒚𝒔 − 𝒓𝒚
𝒔∈𝑺𝒙𝒚 𝒓𝒙𝒔 − 𝒓𝒙𝟐 𝒔∈𝑺𝒙𝒚 𝒓𝒚𝒔 − 𝒓𝒚
𝟐
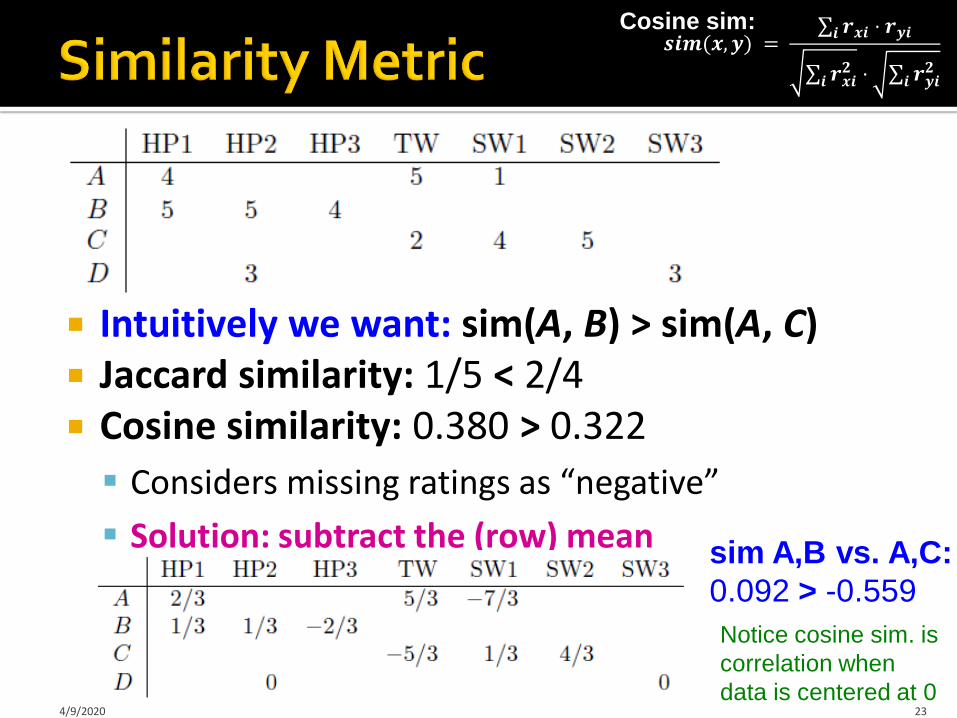
Intuitively we want: sim(A, B) > sim(A, C) Jaccard similarity: 1/5 < 2/4 Cosine similarity: 0.380 > 0.322
Considers missing ratings as “negative”
Solution: subtract the (row) mean
4/9/2020 23
sim A,B vs. A,C:
0.092 > -0.559
Notice cosine sim. is
correlation when
data is centered at 0
𝒔𝒊𝒎(𝒙, 𝒚) = 𝒊 𝒓𝒙𝒊 ⋅ 𝒓𝒚𝒊
𝒊 𝒓𝒙𝒊𝟐 ⋅ 𝒊 𝒓𝒚𝒊
𝟐
Cosine sim:
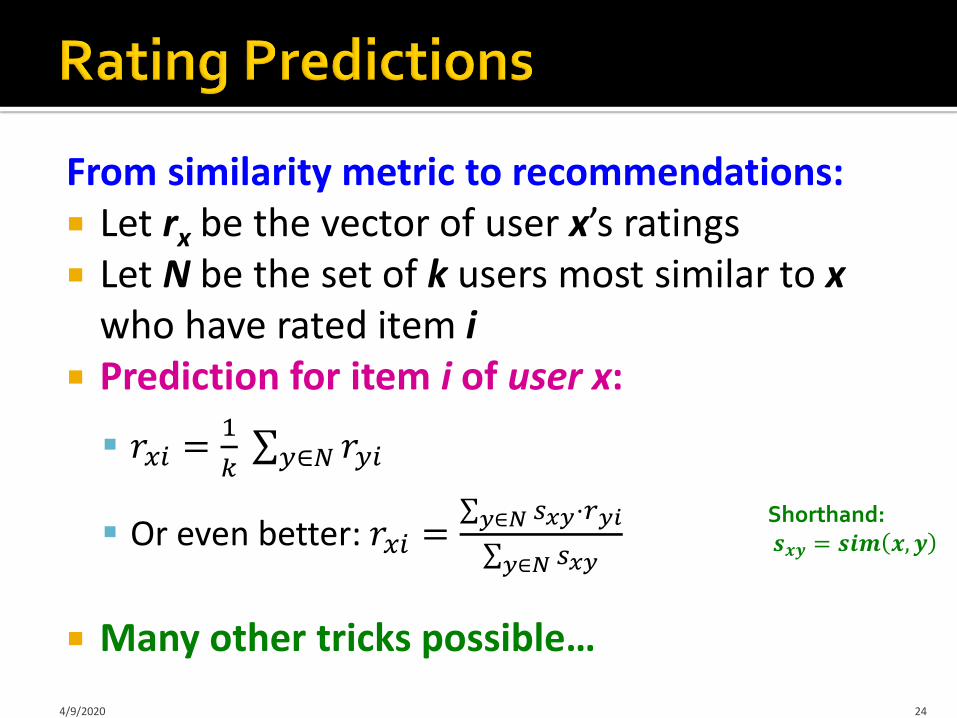
From similarity metric to recommendations: Let rx be the vector of user x’s ratings Let N be the set of k users most similar to x
who have rated item i Prediction for item i of user x:
𝑟𝑥𝑖 =1
𝑘 𝑦∈𝑁 𝑟𝑦𝑖
Or even better: 𝑟𝑥𝑖 = 𝑦∈𝑁 𝑠𝑥𝑦⋅𝑟𝑦𝑖
𝑦∈𝑁 𝑠𝑥𝑦
Many other tricks possible…
4/9/2020 24
Shorthand:𝒔𝒙𝒚 = 𝒔𝒊𝒎 𝒙, 𝒚
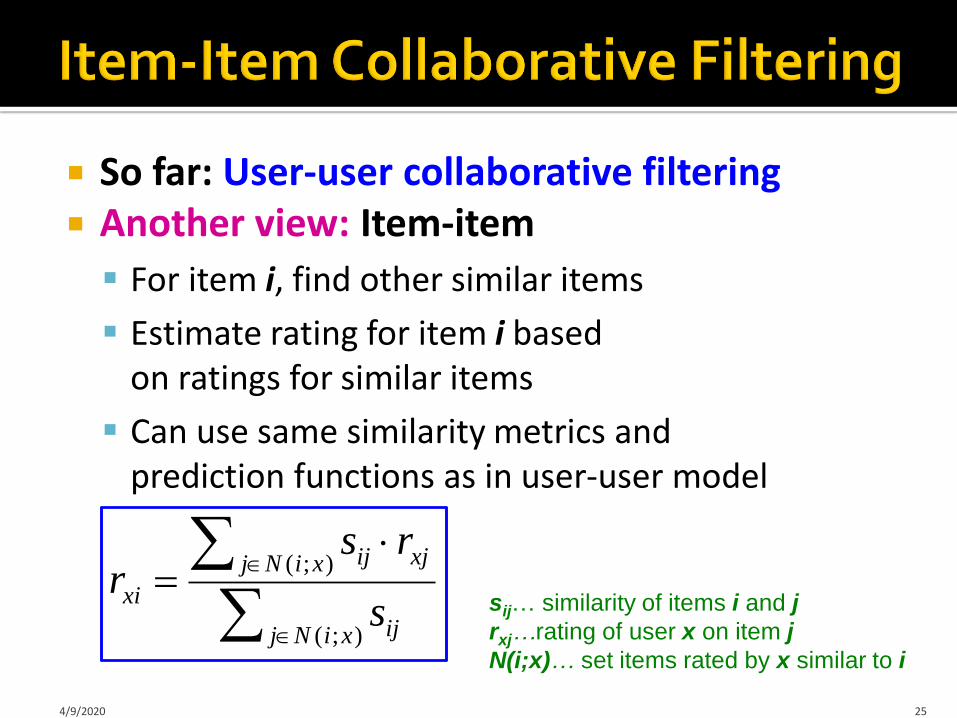
So far: User-user collaborative filtering Another view: Item-item
For item i, find other similar items
Estimate rating for item i based on ratings for similar items
Can use same similarity metrics and prediction functions as in user-user model
4/9/2020 25
);(
);(
xiNj ij
xiNj xjij
xis
rsr
sij… similarity of items i and j
rxj…rating of user x on item j
N(i;x)… set items rated by x similar to i
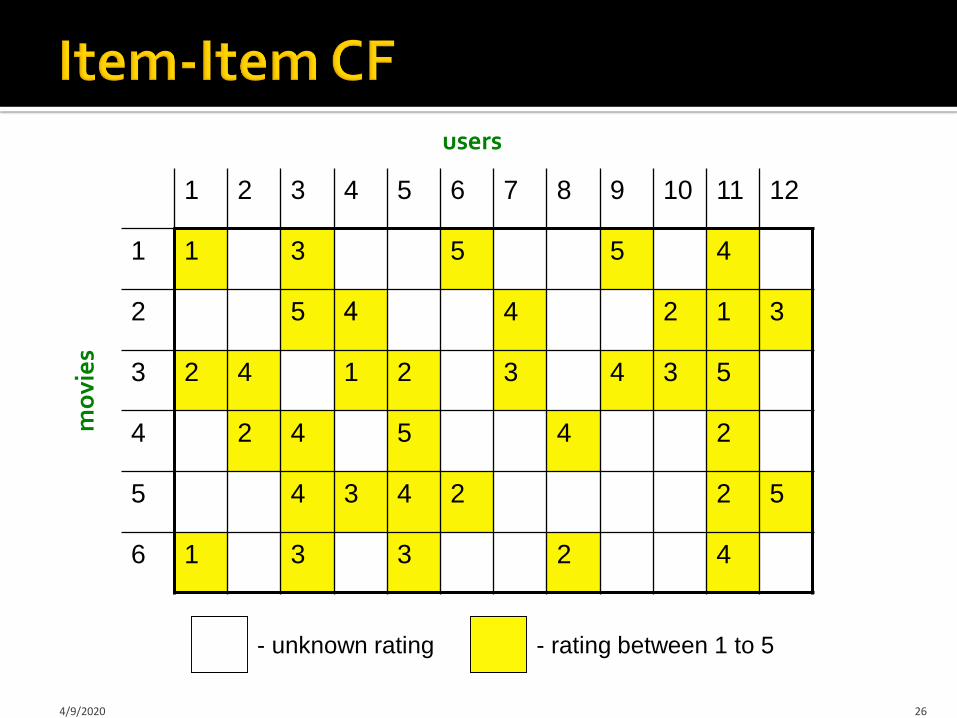
121110987654321
455311
3124452
534321423
245424
5224345
423316
users
mo
vie
s
- unknown rating - rating between 1 to 5
4/9/2020 26
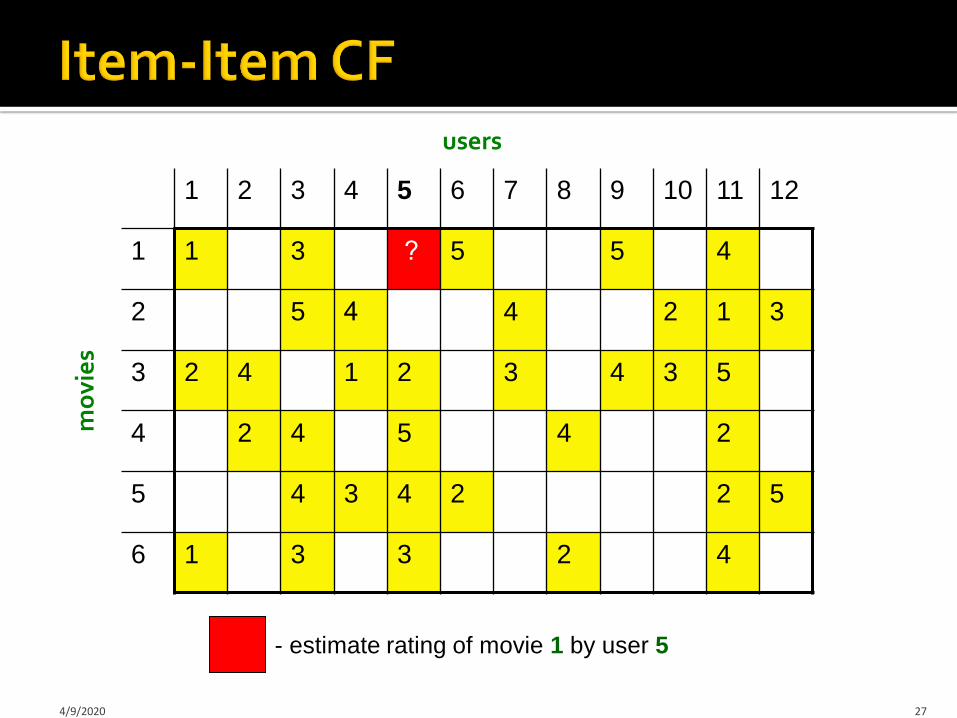
121110987654321
455 ?311
3124452
534321423
245424
5224345
423316
users
- estimate rating of movie 1 by user 5
4/9/2020 27
mo
vie
s

121110987654321
455 ?311
3124452
534321423
245424
5224345
423316
users
Neighbor selection:
Identify movies similar to
movie 1, rated by user 54/9/2020 28
mo
vie
s
1.00
-0.18
0.41
-0.10
-0.31
0.59
sim(1,m)
Here we use Pearson correlation as similarity:
1) Subtract mean rating mi from each movie i
m1 = (1+3+5+5+4)/5 = 3.6
row 1: [-2.6, 0, -0.6, 0, 0, 1.4, 0, 0, 1.4, 0, 0.4, 0]
2) Compute cosine similarities between rows

121110987654321
455 ?311
3124452
534321423
245424
5224345
423316
users
Compute similarity weights:
s1,3=0.41, s1,6=0.59
4/9/2020 29
mo
vie
s
1.00
-0.18
0.41
-0.10
-0.31
0.59
sim(1,m)

121110987654321
4552.6311
3124452
534321423
245424
5224345
423316
users
Predict by taking weighted average:
r1.5 = (0.41*2 + 0.59*3) / (0.41+0.59) = 2.6
4/9/2020 30
mo
vie
s
𝒓𝒊𝒙 = 𝒋∈𝑵(𝒊;𝒙) 𝒔𝒊𝒋 ⋅ 𝒓𝒋𝒙
𝒔𝒊𝒋
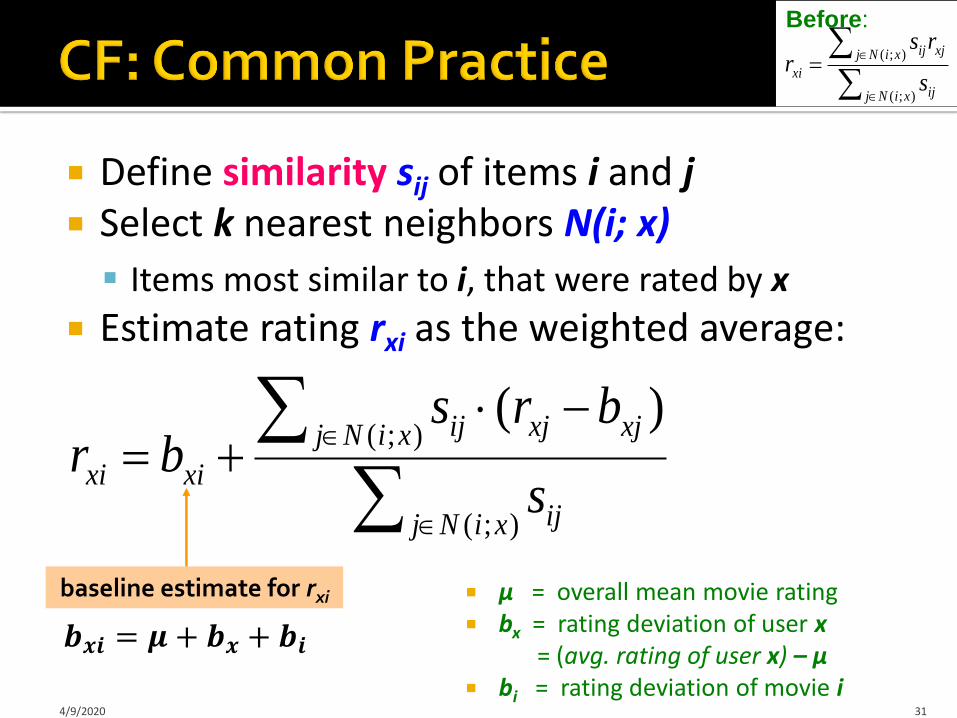
Define similarity sij of items i and j Select k nearest neighbors N(i; x)
Items most similar to i, that were rated by x
Estimate rating rxi as the weighted average:
4/9/2020 31
baseline estimate for rxi μ = overall mean movie rating bx = rating deviation of user x
= (avg. rating of user x) – μ bi = rating deviation of movie i
);(
);(
xiNj ij
xiNj xjij
xis
rsr
Before:
);(
);()(
xiNj ij
xiNj xjxjij
xixis
brsbr
𝒃𝒙𝒊 = 𝝁 + 𝒃𝒙 + 𝒃𝒊

0.41
8.010.9
0.30.5
0.81
Avatar LOTR Matrix Pirates
Alice
Bob
Carol
David
4/9/2020 32
In practice, it has been observed that item-itemoften works better than user-user
Why? Items are simpler, users have multiple tastes

+ Works for any kind of item No feature selection needed
- Cold Start: Need enough users in the system to find a match
- Sparsity: The user/ratings matrix is sparse Hard to find users that have rated the same items
- First rater: Cannot recommend an item that has not been
previously rated New items, Esoteric items
- Popularity bias: Cannot recommend items to someone with
unique taste Tends to recommend popular items
4/9/2020 33

Implement two or more different recommenders and combine predictions
Perhaps using a linear model
Add content-based methods to collaborative filtering
Item profiles for new item problem
Demographics to deal with new user problem
4/9/2020 34

- Evaluation- Error metrics- Complexity / Speed
4/9/2020 35

1 3 4
3 5 5
4 5 5
3
3
2 2 2
5
2 1 1
3 3
1
movies
users
4/9/2020 36

1 3 4
3 5 5
4 5 5
3
3
2 ? ?
?
2 1 ?
3 ?
1
Test Data Set
users
movies
4/9/2020 37
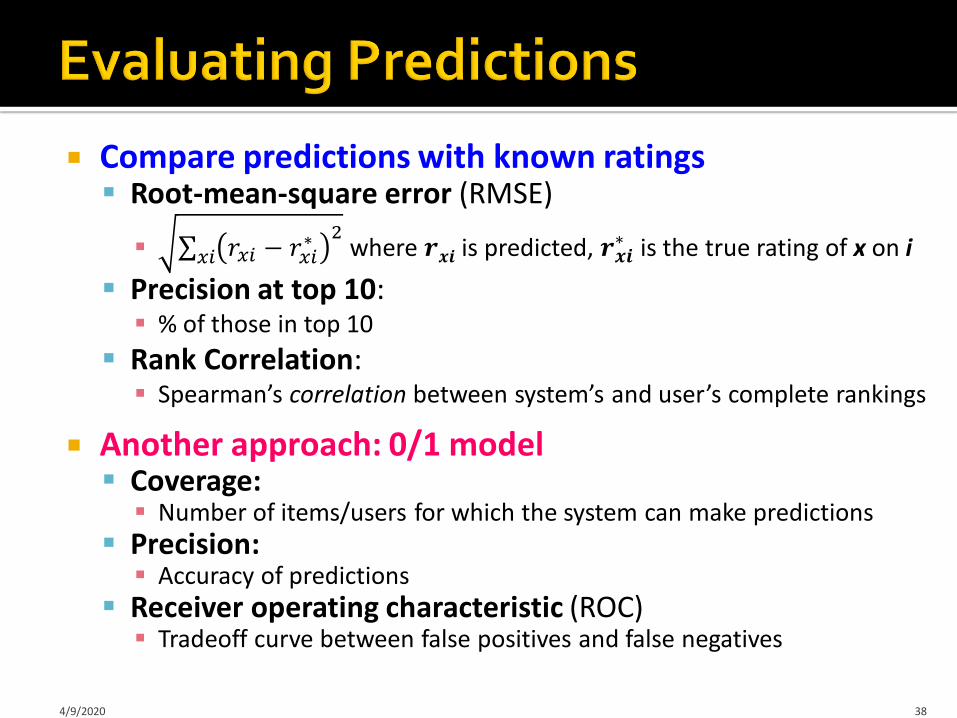
Compare predictions with known ratings Root-mean-square error (RMSE)
𝑥𝑖 𝑟𝑥𝑖 − 𝑟𝑥𝑖∗ 2
where 𝒓𝒙𝒊 is predicted, 𝒓𝒙𝒊∗ is the true rating of x on i
Precision at top 10: % of those in top 10
Rank Correlation: Spearman’s correlation between system’s and user’s complete rankings
Another approach: 0/1 model Coverage: Number of items/users for which the system can make predictions
Precision: Accuracy of predictions
Receiver operating characteristic (ROC) Tradeoff curve between false positives and false negatives
4/9/2020 38
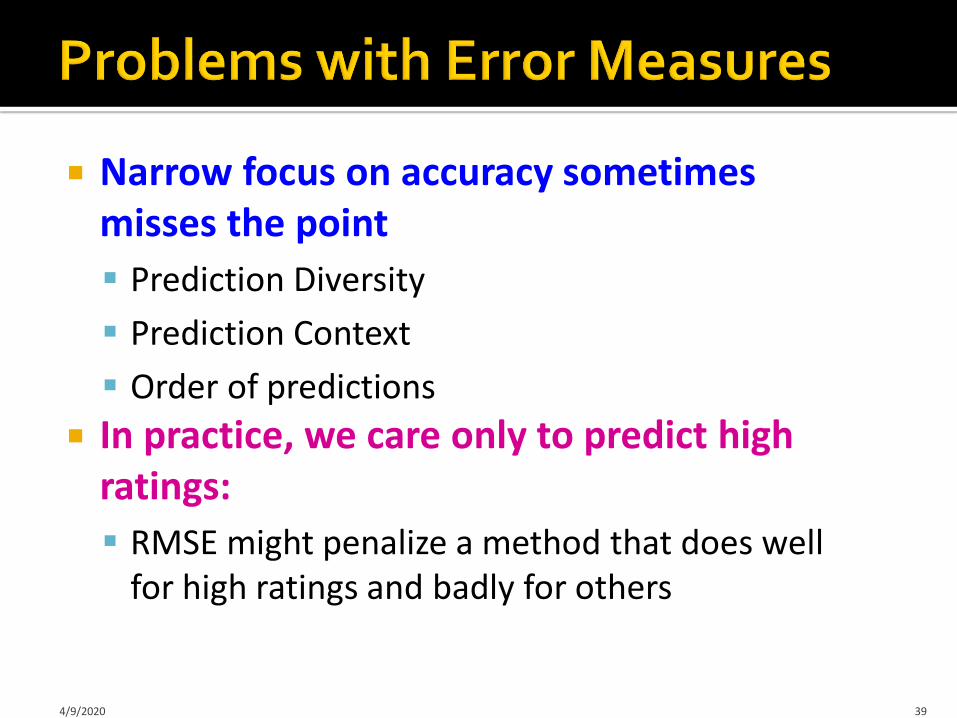
Narrow focus on accuracy sometimes misses the point
Prediction Diversity
Prediction Context
Order of predictions
In practice, we care only to predict high ratings:
RMSE might penalize a method that does well for high ratings and badly for others
4/9/2020 39

Expensive step is finding k most similar customers: O(|X|)
Too expensive to do at runtime
Could pre-compute
Naïve pre-computation takes time O(k ·|X|) X … set of customers
We already know how to do this!
Near-neighbor search in high dimensions (LSH)
Clustering
Dimensionality reduction
4/9/2020 40

Leverage all the data
Don’t try to reduce data size in an effort to make fancy algorithms work
Simple methods on large data do best
Add more data
e.g., add IMDB data on genres
More data beats better algorithmshttp://anand.typepad.com/datawocky/2008/03/more-data-usual.html
4/9/2020 41

Global:
Mean movie rating: 3.7 stars
The Sixth Sense is 0.5 stars above avg.
Joe rates 0.2 stars below avg. Baseline estimation: Joe will rate The Sixth Sense 4 stars
Local neighborhood (CF/NN):
Joe didn’t like related movie Signs
Final estimate:Joe will rate The Sixth Sense 3.8 stars
4/9/2020 42

Earliest and most popular collaborative filtering method
Derive unknown ratings from those of “similar” movies (item-item variant)
Define similarity measure sij of items i and j Select k-nearest neighbors, compute the rating
N(i; x): items most similar to i that were rated by x
4/9/2020 43
);(
);(ˆ
xiNj ij
xiNj xjij
xis
rsr sij… similarity of items i and j
rxj…rating of user x on item j
N(i;x)… set of items similar to
item i that were rated by x

In practice we get better estimates if we model deviations:
4/9/2020 44
μ = overall mean rating
bx = rating deviation of user x
= (avg. rating of user x) – μ
bi = (avg. rating of movie i) – μ
Problems/Issues:1) Similarity measures are “arbitrary”2) Pairwise similarities neglect interdependencies among users 3) Taking a weighted average can be restrictingSolution: Instead of sij use wij that we estimate directly from data
^
);(
);()(
xiNj ij
xiNj xjxjij
xixis
brsbr
baseline estimate for rxi
𝒃𝒙𝒊 = 𝝁 + 𝒃𝒙 + 𝒃𝒊

Use a weighted sum rather than weighted avg.:
𝑟𝑥𝑖 = 𝑏𝑥𝑖 +
𝑗∈𝑁(𝑖;𝑥)
𝑤𝑖𝑗 𝑟𝑥𝑗 − 𝑏𝑥𝑗
A few notes:
𝑵(𝒊; 𝒙) … set of movies rated by user x that aresimilar to movie i
𝒘𝒊𝒋 is the interpolation weight (some real number)
Note, we allow: 𝒋∈𝑵(𝒊;𝒙)𝒘𝒊𝒋 ≠ 𝟏
𝒘𝒊𝒋 models interaction between pairs of movies
(it does not depend on user x)4/9/2020 45
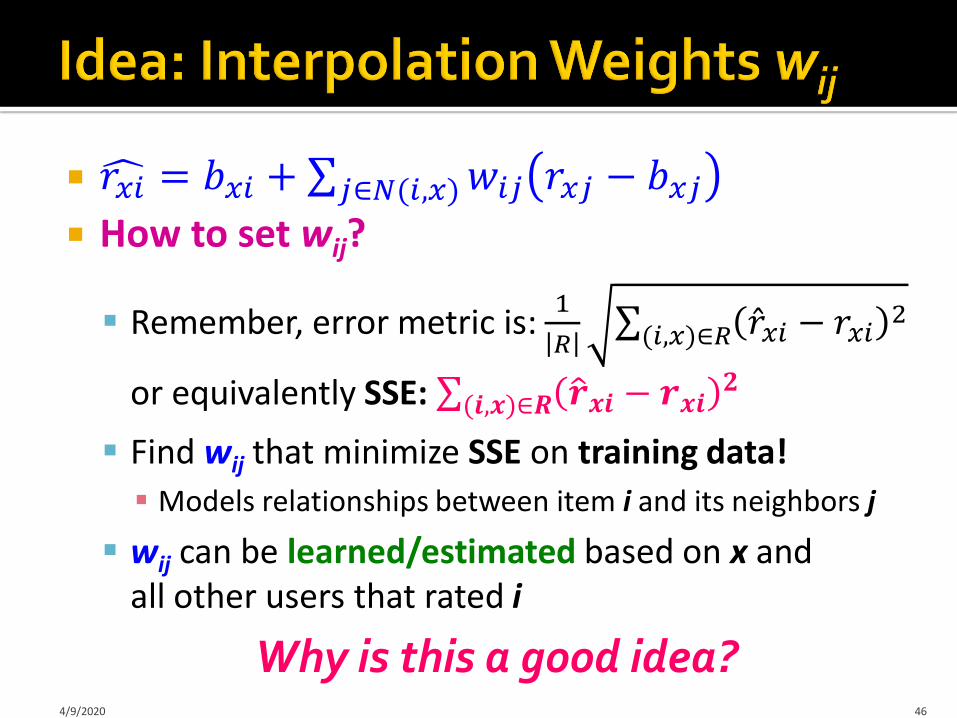
𝑟𝑥𝑖 = 𝑏𝑥𝑖 + 𝑗∈𝑁(𝑖,𝑥)𝑤𝑖𝑗 𝑟𝑥𝑗 − 𝑏𝑥𝑗 How to set wij?
Remember, error metric is:1
𝑅 (𝑖,𝑥)∈𝑅 𝑟𝑥𝑖 − 𝑟𝑥𝑖
2
or equivalently SSE: (𝒊,𝒙)∈𝑹 𝒓𝒙𝒊 − 𝒓𝒙𝒊𝟐
Find wij that minimize SSE on training data!
Models relationships between item i and its neighbors j
wij can be learned/estimated based on x and all other users that rated i
4/9/2020 46
Why is this a good idea?

Goal: Make good recommendations
Quantify goodness using RMSE:Lower RMSE better recommendations
Want to make good recommendations on items that user has not yet seen. Can’t really do this!
Let’s set build a system such that it works well on known (user, item) ratingsAnd hope the system will also predict well the unknown ratings
474/9/2020
1 3 43 5 54 5 533
2 2 25
2 1 1
3 31

Idea: Let’s set values w such that they work well on known (user, item) ratings
How to find such values w? Idea: Define an objective function
and solve the optimization problem
Find wij that minimize SSE on training data!
𝐽 𝑤 =
𝑥,𝑖∈𝑅
𝑏𝑥𝑖 +
𝑗∈𝑁 𝑖;𝑥
𝑤𝑖𝑗 𝑟𝑥𝑗 − 𝑏𝑥𝑗 − 𝑟𝑥𝑖
2
Think of w as a vector of numbers4/9/2020 48
Predicted ratingTrue
rating
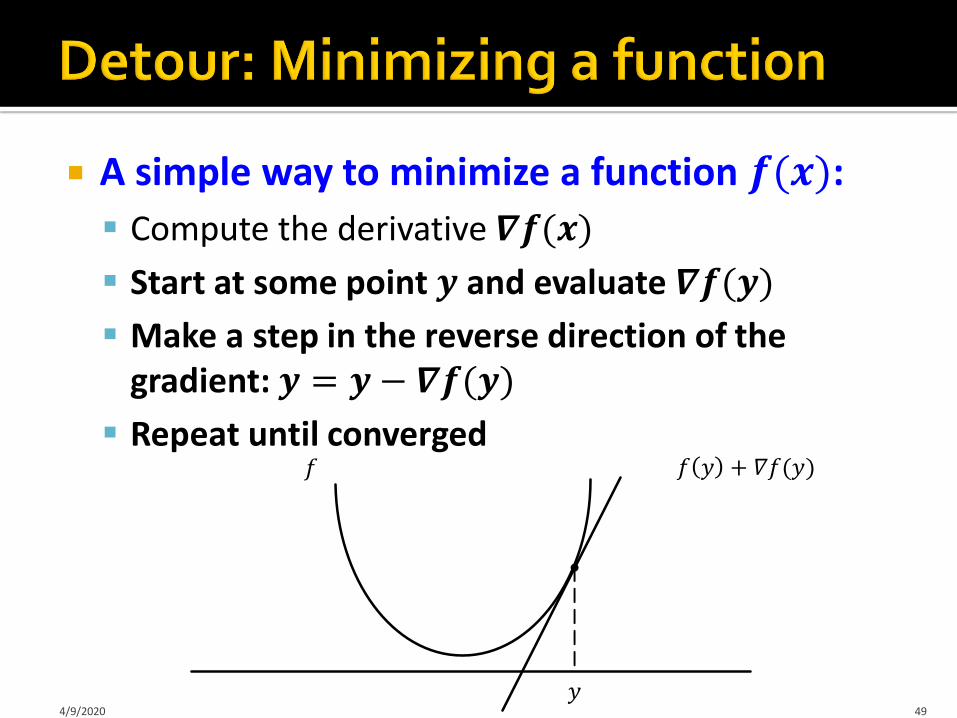
A simple way to minimize a function 𝒇(𝒙):
Compute the derivative 𝜵𝒇(𝒙)
Start at some point 𝒚 and evaluate 𝜵𝒇(𝒚)
Make a step in the reverse direction of the gradient: 𝒚 = 𝒚 − 𝜵𝒇(𝒚)
Repeat until converged
49
𝑓
𝑦
𝑓 𝑦 + 𝛻𝑓(𝑦)
4/9/2020
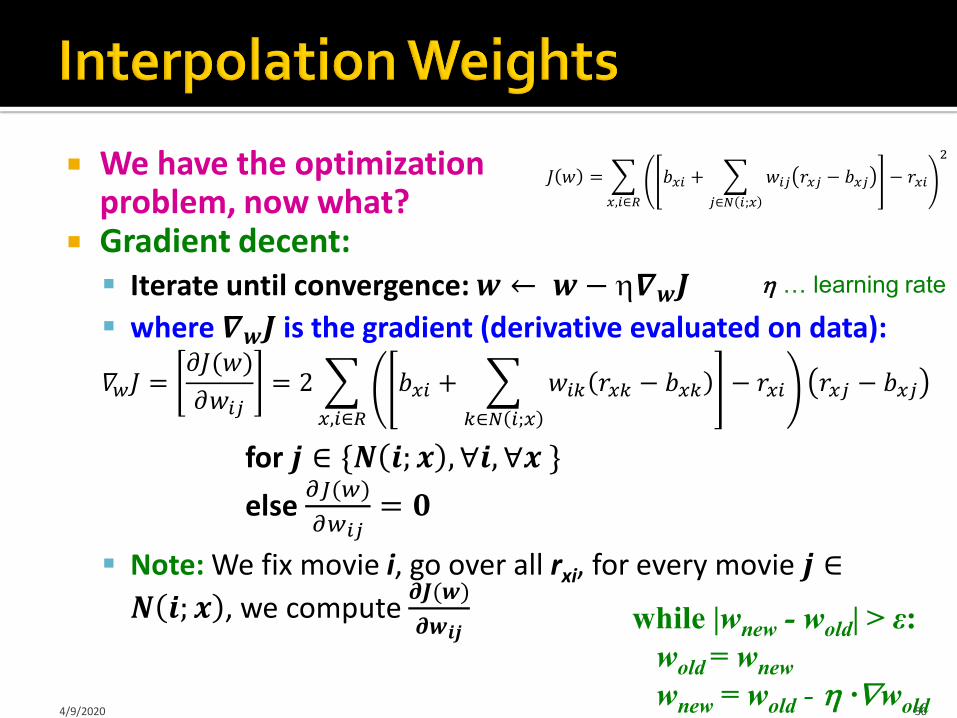
We have the optimization problem, now what?
Gradient decent: Iterate until convergence: 𝒘 ← 𝒘− 𝜵𝒘𝑱
where 𝜵𝒘𝑱 is the gradient (derivative evaluated on data):
𝛻𝑤𝐽 =𝜕𝐽(𝑤)
𝜕𝑤𝑖𝑗= 2
𝑥,𝑖∈𝑅
𝑏𝑥𝑖 +
𝑘∈𝑁 𝑖;𝑥
𝑤𝑖𝑘 𝑟𝑥𝑘 − 𝑏𝑥𝑘 − 𝑟𝑥𝑖 𝑟𝑥𝑗 − 𝑏𝑥𝑗
for 𝒋 ∈ {𝑵 𝒊; 𝒙 , ∀𝒊, ∀𝒙 }
else 𝜕𝐽(𝑤)
𝜕𝑤𝑖𝑗= 𝟎
Note: We fix movie i, go over all rxi, for every movie 𝒋 ∈
𝑵 𝒊; 𝒙 , we compute 𝝏𝑱(𝒘)
𝝏𝒘𝒊𝒋
4/9/2020 50
… learning rate
while |wnew - wold| > ε:
wold= wnewwnew = wold - ·wold
𝐽 𝑤 =
𝑥,𝑖∈𝑅
𝑏𝑥𝑖 +
𝑗∈𝑁 𝑖;𝑥
𝑤𝑖𝑗 𝑟𝑥𝑗 − 𝑏𝑥𝑗 − 𝑟𝑥𝑖
2
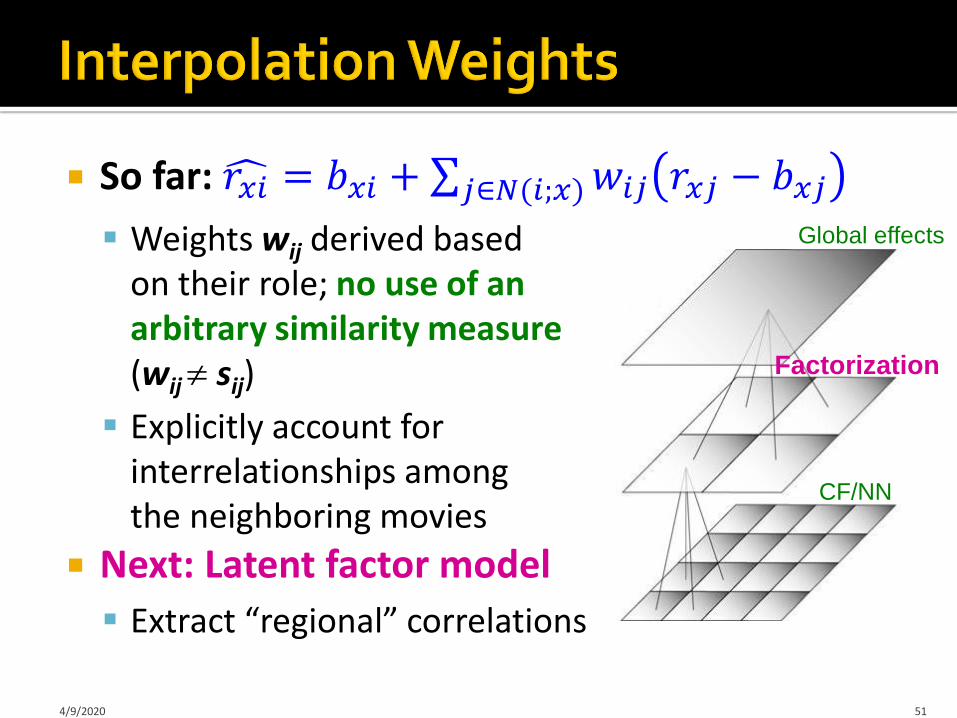
So far: 𝑟𝑥𝑖 = 𝑏𝑥𝑖 + 𝑗∈𝑁(𝑖;𝑥)𝑤𝑖𝑗 𝑟𝑥𝑗 − 𝑏𝑥𝑗 Weights wij derived based
on their role; no use of an arbitrary similarity measure (wij sij)
Explicitly account for interrelationships among the neighboring movies
Next: Latent factor model
Extract “regional” correlations
4/9/2020 51
Global effects
Factorization
CF/NN

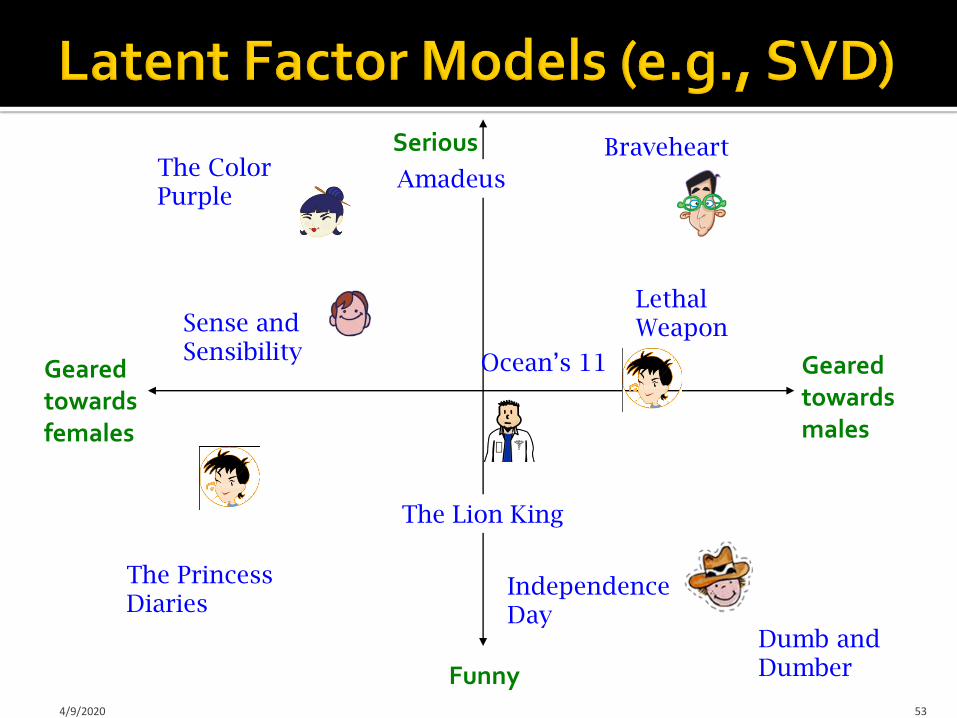
Geared towards females
Geared towards males
Serious
Funny4/9/2020 53
The PrincessDiaries
The Lion King
Braveheart
Lethal Weapon
Independence Day
AmadeusThe Color Purple
Dumb and Dumber
Ocean’s 11
Sense and Sensibility

“SVD” on Netflix data: R ≈ Q · PT
For now let’s assume we can approximate the rating matrix R as a product of “thin” Q · PT
R has missing entries but let’s ignore that for now! Basically, we will want the reconstruction error to be small on known
ratings and we don’t care about the values on the missing ones
4/9/2020 54
45531
312445
53432142
24542
522434
42331
.2-.4.1
.5.6-.5
.5.3-.2
.32.11.1
-22.1-.7
.3.7-1
-.92.41.4.3-.4.8-.5-2.5.3-.21.1
1.3-.11.2-.72.91.4-1.31.4.5.7-.8
.1-.6.7.8.4-.3.92.41.7.6-.42.1
≈
users
item
s
PT
Q
ite
ms
users
R
SVD: A = U VT
factors
facto
rs

How to estimate the missing rating of user x for item i?
4/9/2020 55
45531
312445
53432142
24542
522434
42331
item
s
.2-.4.1
.5.6-.5
.5.3-.2
.32.11.1
-22.1-.7
.3.7-1
-.92.41.4.3-.4.8-.5-2.5.3-.21.1
1.3-.11.2-.72.91.4-1.31.4.5.7-.8
.1-.6.7.8.4-.3.92.41.7.6-.42.1
≈
item
s
users
users
?
PT
𝒓𝒙𝒊 = 𝒒𝒊 ⋅ 𝒑𝒙
=
𝒇
𝒒𝒊𝒇 ⋅ 𝒑𝒙𝒇
qi = row i of Q
px = column x of PT
facto
rs
Qfactors

How to estimate the missing rating of user x for item i?
4/9/2020 56
45531
312445
53432142
24542
522434
42331
item
s
.2-.4.1
.5.6-.5
.5.3-.2
.32.11.1
-22.1-.7
.3.7-1
-.92.41.4.3-.4.8-.5-2.5.3-.21.1
1.3-.11.2-.72.91.4-1.31.4.5.7-.8
.1-.6.7.8.4-.3.92.41.7.6-.42.1
≈
item
s
users
users
?
PT
facto
rs
Qfactors
𝒓𝒙𝒊 = 𝒒𝒊 ⋅ 𝒑𝒙
=
𝒇
𝒒𝒊𝒇 ⋅ 𝒑𝒙𝒇
qi = row i of Q
px = column x of PT

How to estimate the missing rating of user x for item i?
4/9/2020 57
45531
312445
53432142
24542
522434
42331
item
s
.2-.4.1
.5.6-.5
.5.3-.2
.32.11.1
-22.1-.7
.3.7-1
-.92.41.4.3-.4.8-.5-2.5.3-.21.1
1.3-.11.2-.72.91.4-1.31.4.5.7-.8
.1-.6.7.8.4-.3.92.41.7.6-.42.1
≈
item
s
users
users
?
Q
PT
2.4
ffa
cto
rs
f factors
𝒓𝒙𝒊 = 𝒒𝒊 ⋅ 𝒑𝒙
=
𝒇
𝒒𝒊𝒇 ⋅ 𝒑𝒙𝒇
qi = row i of Q
px = column x of PT

Geared towards females
Geared towards males
Serious
Funny4/9/2020 58
The PrincessDiaries
The Lion King
Braveheart
Lethal Weapon
Independence Day
AmadeusThe Color Purple
Dumb and Dumber
Ocean’s 11
Sense and Sensibility
Factor 1
Facto
r 2

Geared towards females
Geared towards males
Serious
Funny4/9/2020 59
The PrincessDiaries
The Lion King
Braveheart
Lethal Weapon
Independence Day
AmadeusThe Color Purple
Dumb and Dumber
Ocean’s 11
Sense and Sensibility
Factor 1
Facto
r 2

Remember SVD:
A: Input data matrix
U: Left singular vecs
V: Right singular vecs
: Singular values
So in our case: “SVD” on Netflix data: R ≈ Q · PT
A = R, Q = U, PT = VT
Am
n
m
n
VT
60
U
𝒓𝒙𝒊 = 𝒒𝒊 ⋅ 𝒑𝒙
4/9/2020
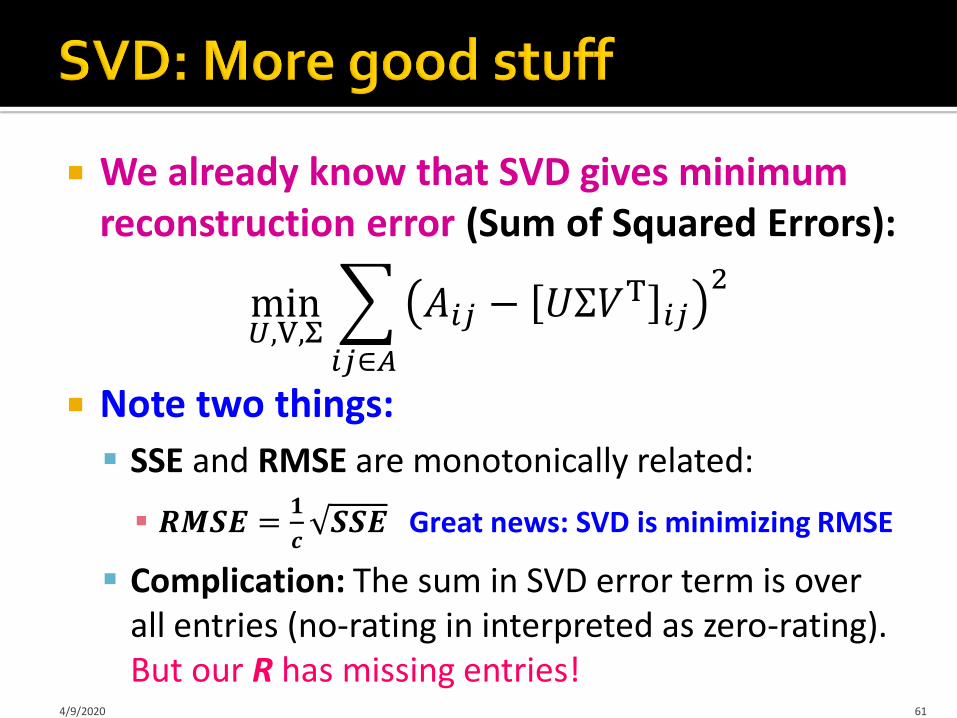
We already know that SVD gives minimum reconstruction error (Sum of Squared Errors):
min𝑈,V,Σ
𝑖𝑗∈𝐴
𝐴𝑖𝑗 − 𝑈Σ𝑉T𝑖𝑗2
Note two things:
SSE and RMSE are monotonically related:
𝑹𝑴𝑺𝑬 =𝟏
𝒄𝑺𝑺𝑬 Great news: SVD is minimizing RMSE
Complication: The sum in SVD error term is over all entries (no-rating in interpreted as zero-rating). But our R has missing entries!
614/9/2020

SVD isn’t defined when entries are missing! Use specialized methods to find P, Q
min𝑃,𝑄 𝑖,𝑥 ∈R 𝑟𝑥𝑖 − 𝑞𝑖 ⋅ 𝑝𝑥
2
Note: We don’t require cols of P, Q to be orthogonal/unit length
P, Q map users/movies to a latent space
This was the most popular model among Netflix contestants4/9/2020 62
45531
312445
53432142
24542
522434
42331
.2-.4.1
.5.6-.5
.5.3-.2
.32.11.1
-22.1-.7
.3.7-1
-.92.41.4.3-.4.8-.5-2.5.3-.21.1
1.3-.11.2-.72.91.4-1.31.4.5.7-.8
.1-.6.7.8.4-.3.92.41.7.6-.42.1
PT
Q
users
item
s
𝑟𝑥𝑖 = 𝑞𝑖 ⋅ 𝑝𝑥
factors
facto
rsitem
s
users

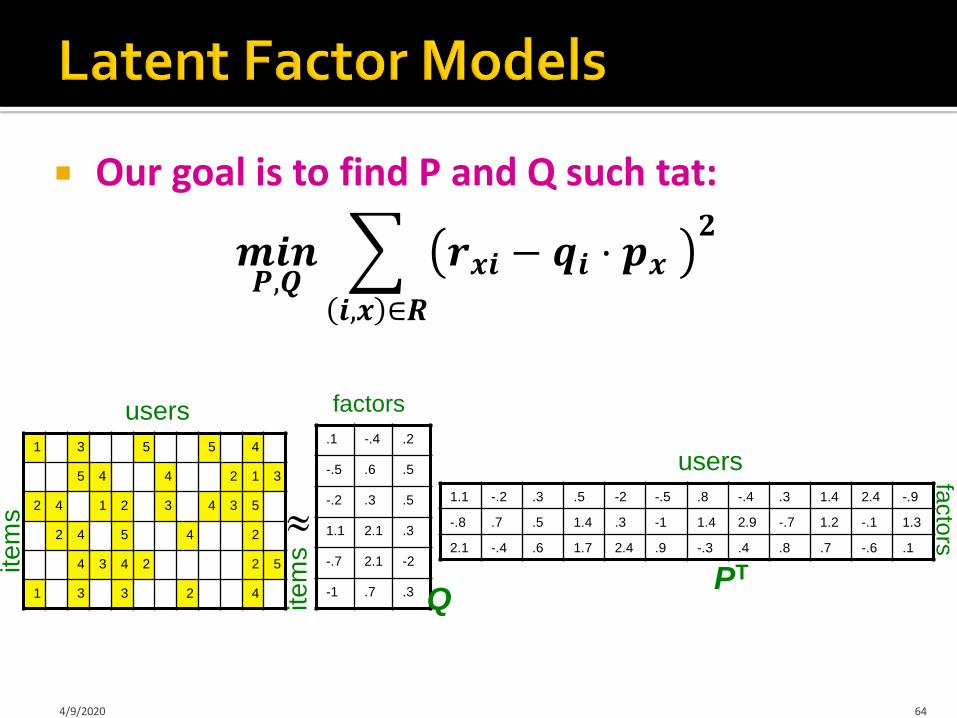
Our goal is to find P and Q such tat:
𝒎𝒊𝒏𝑷,𝑸
𝒊,𝒙 ∈𝑹
𝒓𝒙𝒊 − 𝒒𝒊 ⋅ 𝒑𝒙𝟐
64
45531
312445
53432142
24542
522434
42331
.2-.4.1
.5.6-.5
.5.3-.2
.32.11.1
-22.1-.7
.3.7-1
-.92.41.4.3-.4.8-.5-2.5.3-.21.1
1.3-.11.2-.72.91.4-1.31.4.5.7-.8
.1-.6.7.8.4-.3.92.41.7.6-.42.1
PT
Q
users
item
s
factors
facto
rsitem
s
users
4/9/2020
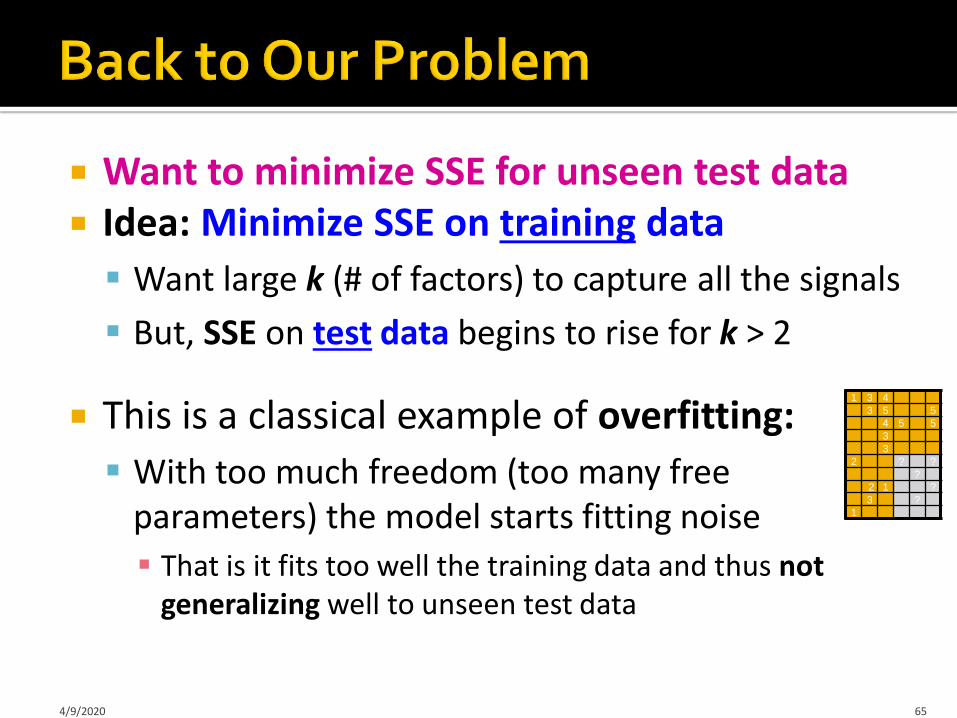
Want to minimize SSE for unseen test data Idea: Minimize SSE on training data
Want large k (# of factors) to capture all the signals
But, SSE on test data begins to rise for k > 2
This is a classical example of overfitting:
With too much freedom (too many free parameters) the model starts fitting noise
That is it fits too well the training data and thus notgeneralizing well to unseen test data
65
1 3 4
3 5 5
4 5 5
3
3
2 ? ?
?
2 1 ?
3 ?
1
4/9/2020

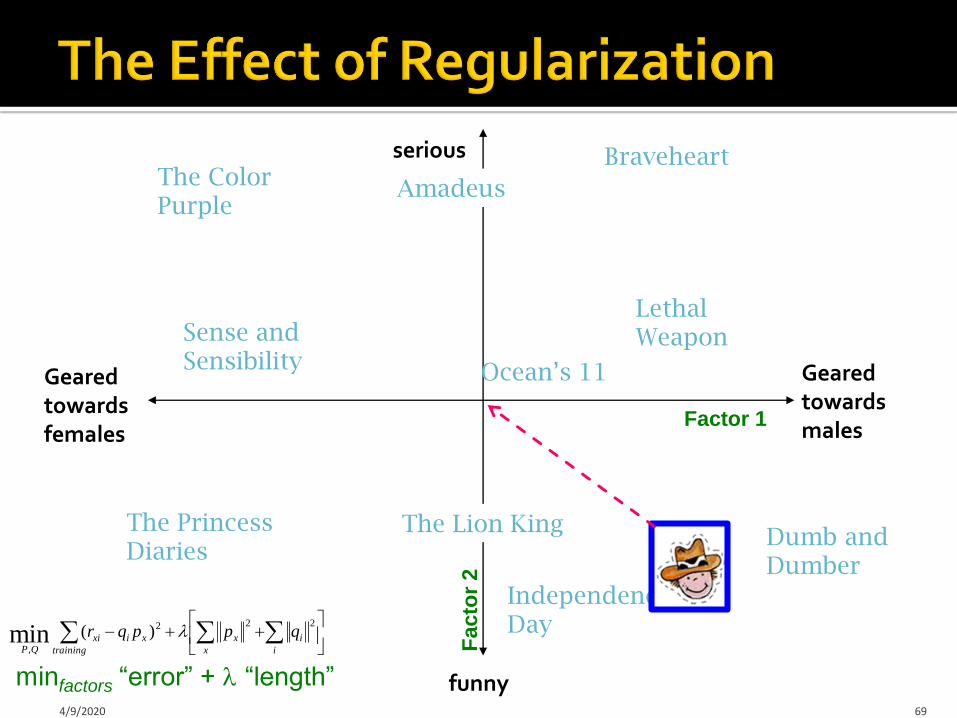
To solve overfitting we introduce regularization:
Allow rich model where there is sufficient data
Shrink aggressively where data is scarce
66
i
i
x
x
training
xixiQP
qppqr2
2
2
1
2
,
)(min
1 3 4
3 5 5
4 5 5
3
3
2 ? ?
?
2 1 ?
3 ?
1
1, 2 … user set regularization parameters
“error” “length”
Note: We do not care about the “raw” value of the objective function,
but we care about P,Q that achieve the minimum of the objective4/9/2020
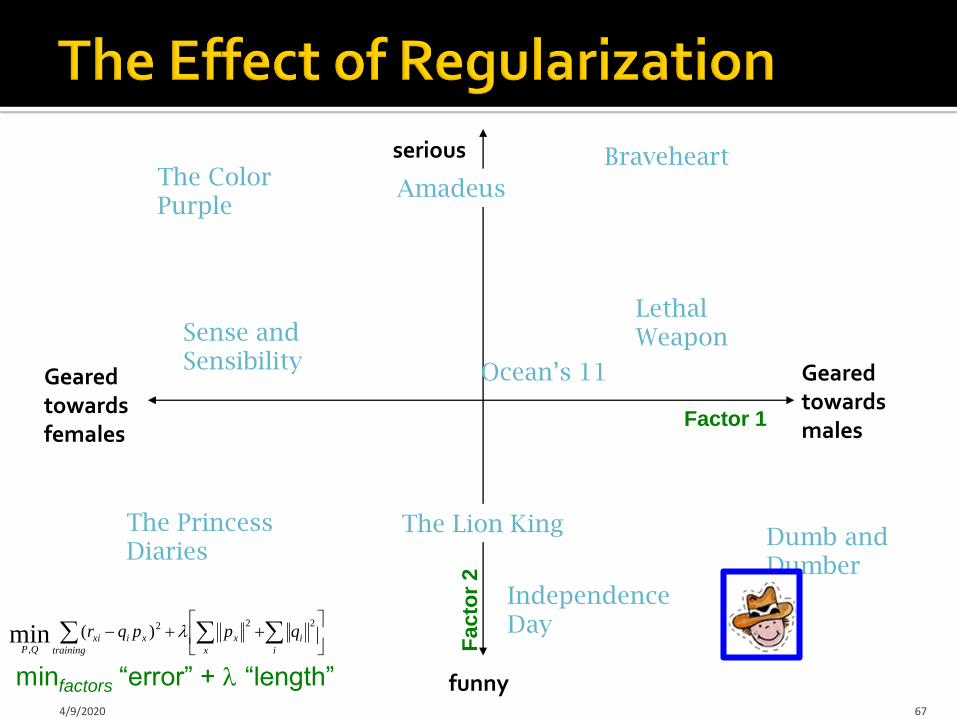
Geared towards females
Geared towards males
serious
funny4/9/2020 67
The PrincessDiaries
The Lion King
Braveheart
Lethal Weapon
Independence Day
AmadeusThe Color Purple
Dumb and Dumber
Ocean’s 11
Sense and Sensibility
Factor 1
Facto
r 2
minfactors “error” + “length”
i
i
x
x
training
xixiQP
qppqr222
,
)(min

Geared towards females
Geared towards males
serious
funny4/9/2020 68
The Lion King
Braveheart
Lethal Weapon
Independence Day
AmadeusThe Color Purple
Dumb and Dumber
Ocean’s 11
Sense and Sensibility
Factor 1
Facto
r 2
The PrincessDiaries
minfactors “error” + “length”
i
i
x
x
training
xixiQP
qppqr222
,
)(min
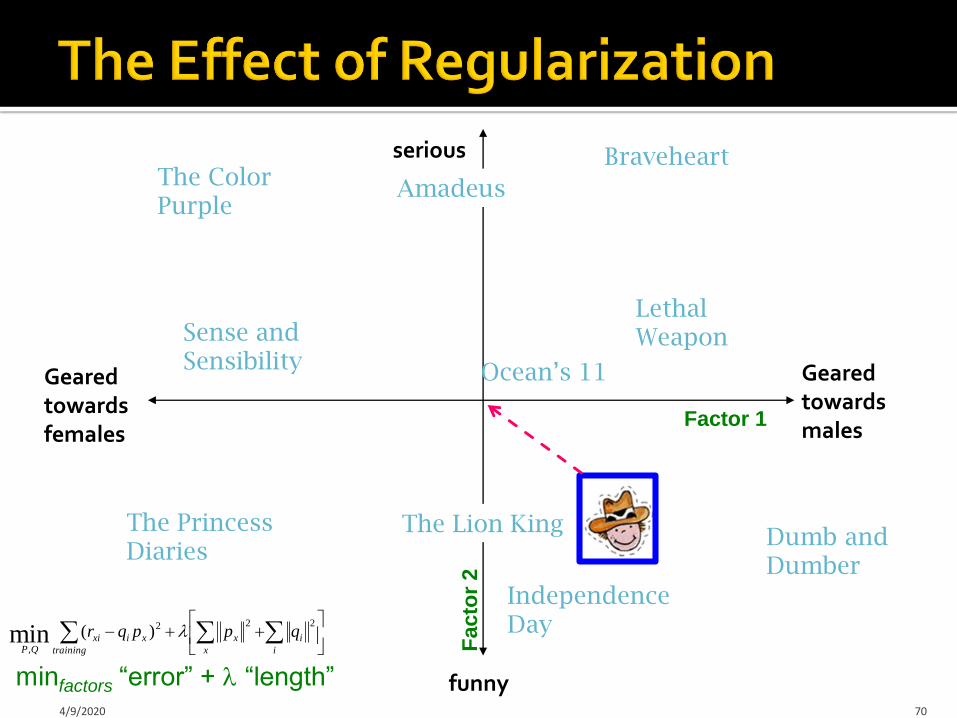
Geared towards females
Geared towards males
serious
funny4/9/2020 69
The Lion King
Braveheart
Lethal Weapon
Independence Day
AmadeusThe Color Purple
Dumb and Dumber
Ocean’s 11
Sense and Sensibility
Factor 1
Facto
r 2
minfactors “error” + “length”
The PrincessDiaries
i
i
x
x
training
xixiQP
qppqr222
,
)(min
Geared towards females
Geared towards males
serious
funny4/9/2020 70
The Lion King
Braveheart
Lethal Weapon
Independence Day
AmadeusThe Color Purple
Dumb and Dumber
Ocean’s 11
Sense and Sensibility
Factor 1
Facto
r 2
The PrincessDiaries
minfactors “error” + “length”
i
i
x
x
training
xixiQP
qppqr222
,
)(min

Want to find matrices P and Q:
Gradient descent: Initialize P and Q (using SVD, pretend missing ratings are 0)
Do gradient descent: P P - ·P
Q Q - ·Q
where Q is gradient/derivative of matrix Q:𝛻𝑄 = [𝛻𝑞𝑖𝑓] and 𝛻𝑞𝑖𝑓 = 𝑥,𝑖−2 𝑟𝑥𝑖 − 𝑞𝑖𝑝𝑥 𝑝𝑥𝑓 + 2𝜆2𝑞𝑖𝑓 Here 𝒒𝒊𝒇 is entry f of row qi of matrix Q
Observation: Computing gradients is slow!4/9/2020 71
How to compute gradient
of a matrix?
Compute gradient of every
element independently!
i
i
x
x
training
xixiQP
qppqr2
2
2
1
2
,
)(min

Gradient Descent (GD) vs. Stochastic GD Observation: 𝛻𝑄 = [𝛻𝑞𝑖𝑓] where
𝛻𝑞𝑖𝑓 =
𝑥,𝑖
−2 𝑟𝑥𝑖 − 𝑞𝑖𝑓𝑝𝑥𝑓 𝑝𝑥𝑓 + 2𝜆𝑞𝑖𝑓 =
𝒙,𝒊
𝑸 𝒓𝒙𝒊
Here 𝒒𝒊𝒇 is entry f of row qi of matrix Q
𝑸 = 𝑸 − 𝑸 = 𝑸 − 𝒙,𝒊𝑸(𝒓𝒙𝒊)
Idea: Instead of evaluating gradient over all ratings evaluate it for each individual rating and make a step
GD: 𝑸𝑸− 𝒓𝒙𝒊𝑸(𝒓𝒙𝒊) SGD: 𝑸𝑸− 𝜇𝑸(𝒓𝒙𝒊) Faster convergence! Need more steps but each step is computed much faster
4/9/2020 72

Convergence of GD vs. SGD
4/9/2020 73
Iteration/step
Va
lue
of
the
ob
jec
tive
fu
nc
tio
n
GD improves the value
of the objective function
at every step.
SGD improves the value
but in a “noisy” way.
GD takes fewer steps to
converge but each step
takes much longer to
compute.
In practice, SGD is
much faster!

Stochastic gradient descent:
Initialize P and Q (using SVD, pretend missing ratings are 0)
Then iterate over the ratings (multiple times if necessary) and update factors:
For each rxi:
𝜀𝑥𝑖 = 2(𝑟𝑥𝑖 − 𝑞𝑖 ⋅ 𝑝𝑥 ) (derivative of the “error”)
𝑞𝑖 ← 𝑞𝑖 + 𝜇1 𝜀𝑥𝑖 𝑝𝑥 − 2𝜆2 𝑞𝑖 (update equation)
𝑝𝑥 ← 𝑝𝑥 + 𝜇2 𝜀𝑥𝑖 𝑞𝑖 − 2𝜆1 𝑝𝑥 (update equation)
2 for loops: For until convergence:
For each rxi
Compute gradient, do a “step” a above4/9/2020 74
𝜇 … learning rate
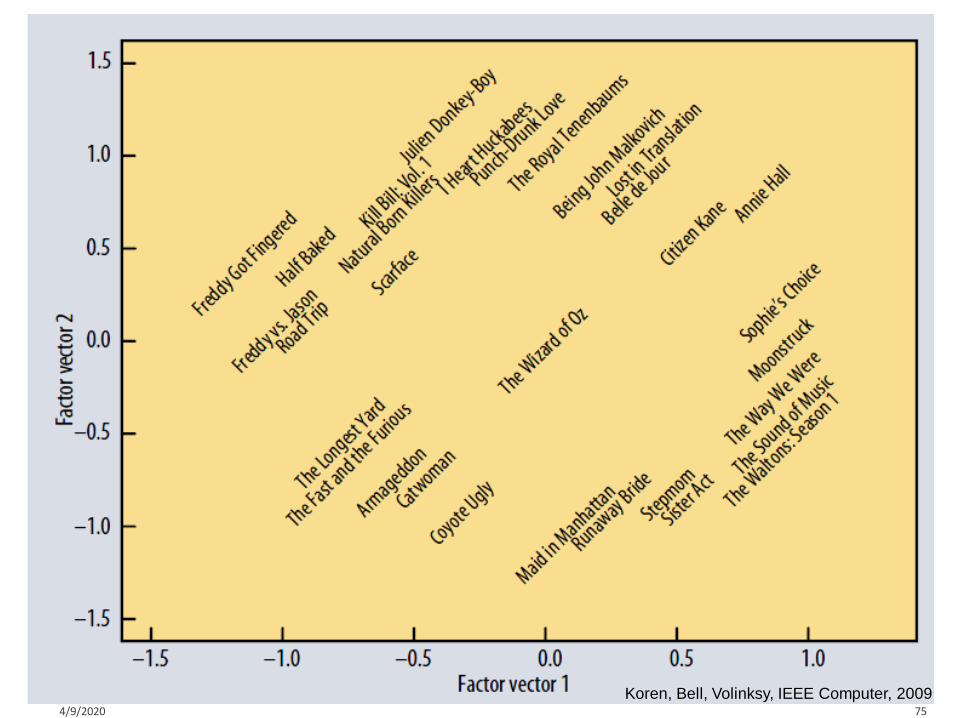
Koren, Bell, Volinksy, IEEE Computer, 20094/9/2020 75

4/9/2020 77
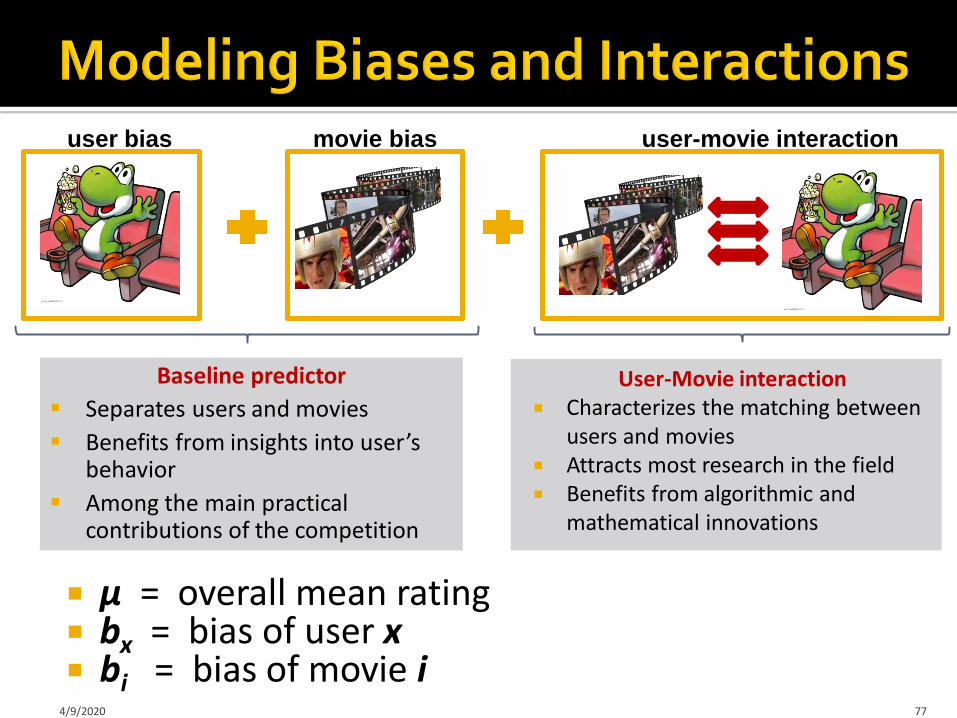
μ = overall mean rating bx = bias of user x bi = bias of movie i
user-movie interactionmovie biasuser bias
User-Movie interaction Characterizes the matching between
users and movies Attracts most research in the field Benefits from algorithmic and
mathematical innovations
Baseline predictor
Separates users and movies
Benefits from insights into user’s behavior
Among the main practical contributions of the competition
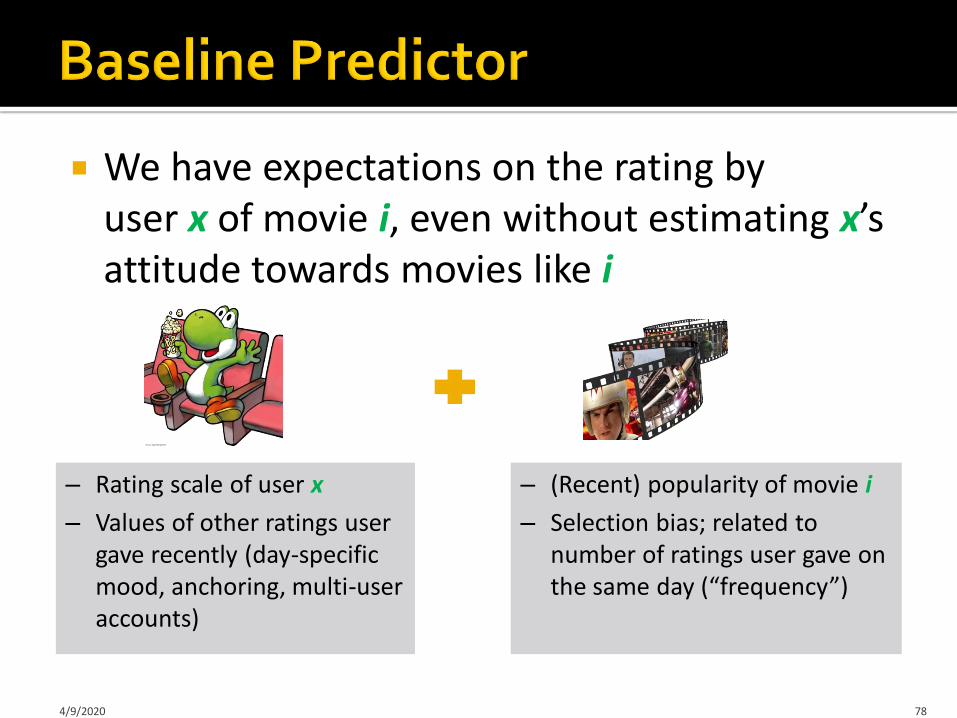
We have expectations on the rating by user x of movie i, even without estimating x’s attitude towards movies like i
– Rating scale of user x
– Values of other ratings user gave recently (day-specific mood, anchoring, multi-user accounts)
– (Recent) popularity of movie i
– Selection bias; related to number of ratings user gave on the same day (“frequency”)
4/9/2020 78
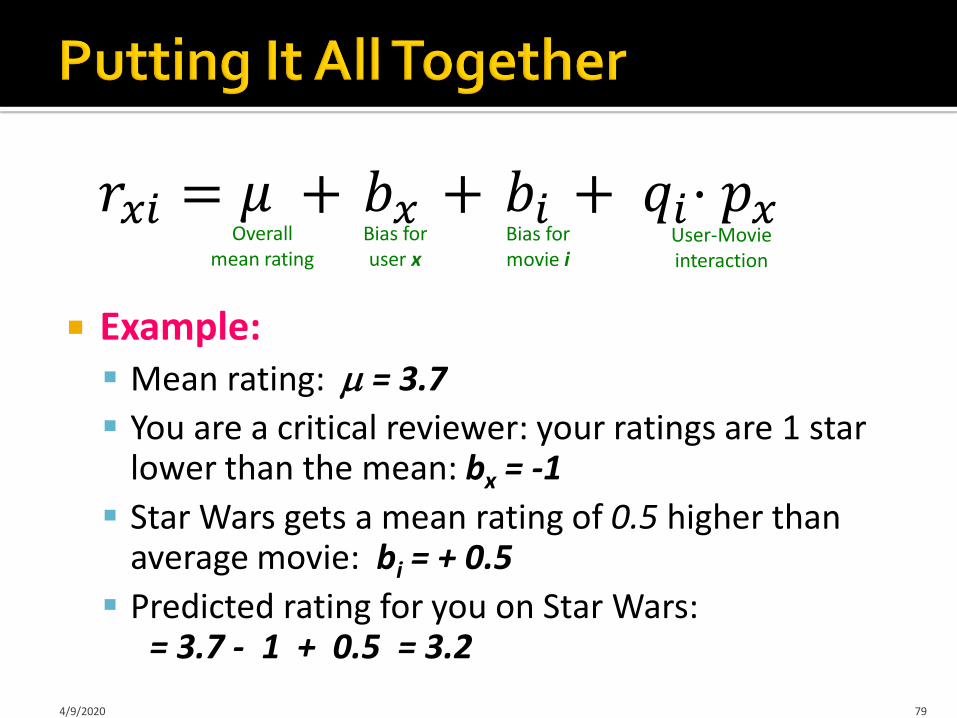
Example: Mean rating: = 3.7
You are a critical reviewer: your ratings are 1 star lower than the mean: bx = -1
Star Wars gets a mean rating of 0.5 higher than average movie: bi = + 0.5
Predicted rating for you on Star Wars: = 3.7 - 1 + 0.5 = 3.2
4/9/2020 79
Overall mean rating
Bias for user x
Bias formovie i
𝑟𝑥𝑖 = 𝜇 + 𝑏𝑥 + 𝑏𝑖 + 𝑞𝑖⋅ 𝑝𝑥User-Movieinteraction
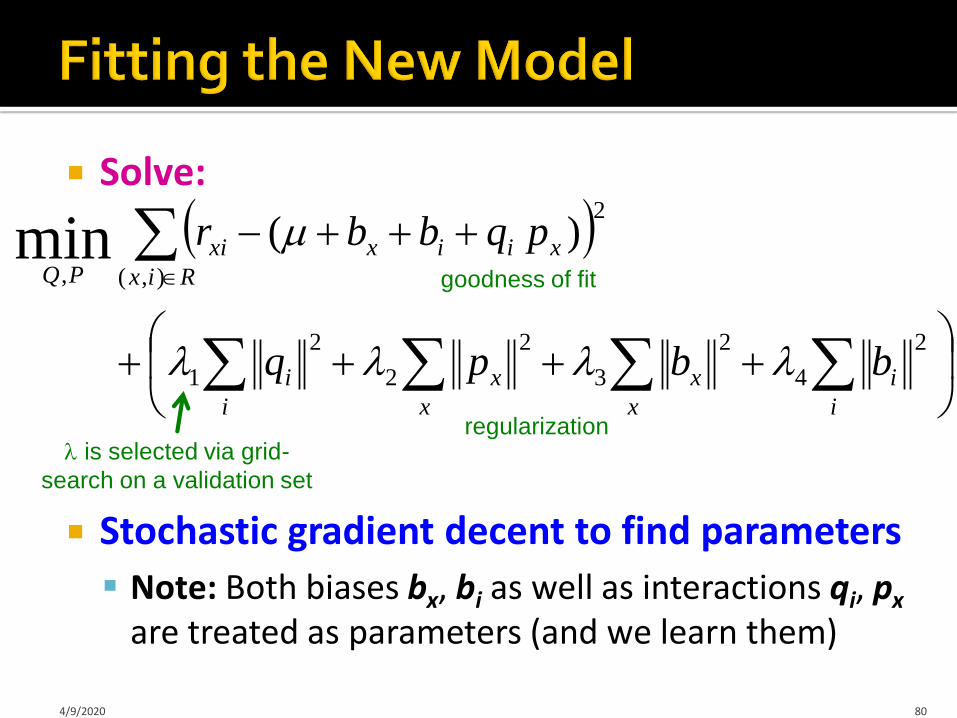
Solve:
Stochastic gradient decent to find parameters
Note: Both biases bx, bi as well as interactions qi, px
are treated as parameters (and we learn them)
4/9/2020 80
regularization
goodness of fit
is selected via grid-
search on a validation set
i
i
x
x
x
x
i
i
Rix
xiixxiPQ
bbpq
pqbbr
2
4
2
3
2
2
2
1
2
),(,
)(min