graphic packaging holding co - s1.q4cdn.com annual... · accelerated filer, accelerated filer and...
TRANSCRIPT

GRAPHIC PACKAGING HOLDING CO
FORM 10-K(Annual Report)
Filed 02/06/14 for the Period Ending 12/31/13
Address 814 LIVINGSTON COURT
MARIETTA, GA 30067Telephone 7706443000
CIK 0001408075Symbol GPK
SIC Code 2650 - Paperboard Containers And BoxesIndustry Paper & Paper Products
Sector Basic MaterialsFiscal Year 12/31
http://www.edgar-online.com© Copyright 2014, EDGAR Online, Inc. All Rights Reserved.
Distribution and use of this document restricted under EDGAR Online, Inc. Terms of Use.
Table of Contents
UNITED STATES SECURITIES AND EXCHANGE COMMISSION Washington, D.C. 20549
Form 10-K
COMMISSION FILE NUMBER: 001-33988
Graphic Packaging Holding Company (Exact name of registrant as specified in its charter)
(770) 240-7200
Registrant’s telephone number, including area code: Securities registered pursuant to Section 12(b) of the Act:
Securities registered pursuant to Section 12(g) of the Act: None
Indicate by check mark if the registrant is a well-known seasoned issuer, as defined in Rule 405 of the Securities Act. Yes � No �
Indicate by check mark if the registrant is not required to file reports pursuant to Section 13 or Section 15(d) of the Act. Yes � No �
Indicate by check mark whether the registrant (1) has filed all reports required to be filed by Section 13 or 15(d) of the Securities Exchange Act of 1934 during the preceding
12 months (or for such shorter period that the registrant was required to file such reports), and (2) has been subject to such filing requirements for the past 90 days. Yes � No �
Indicate by check mark whether the registrant has submitted electronically and posted on its corporate Web site, if any, every Interactive Data File required to be submitted and posted pursuant to Rule 405 of Regulation S-T during the preceding 12 months (or for such shorter period that the registrant was required to submit and post such files). Yes � No �
Indicate by check mark if disclosure of delinquent filers pursuant to Item 405 of Regulation S-K is not contained herein, and will not be contained, to the best of the registrant’s knowledge, in definitive proxy or information statements incorporated by reference in Part III of this Form 10-K or any amendment to this Form 10-K. �
Indicate by check mark whether the registrant is a large accelerated filer, an accelerated filer, a non-accelerated filer, or a smaller reporting company. See the definitions of “large accelerated filer,” “accelerated filer” and “smaller reporting company” in Rule 12b-2 of the Exchange Act. (Check one):
Indicate by check mark whether the registrant is a shell company (as defined in Rule 12b-2 of the Act). Yes � No �
The aggregate market value of voting and non-voting common equity held by non-affiliates at June 30, 2013 was approximately $1.6 billion .
As of January 31, 2014 there were approximately 324,746,642 shares of the registrant’s Common Stock, $0.01 par value per share outstanding.
1
� ANNUAL REPORT PURSUANT TO SECTION 13 OR 15(d) OF THE SECURITIES EXCHANGE ACT OF 1934 For the fiscal year ended December 31, 2013
or
� TRANSITION REPORT PURSUANT TO SECTION 13 OR 15(d) OF THE SECURITIES EXCHANGE ACT OF 1934
For the transition period from to
Delaware 26-0405422
(State of incorporation) (I.R.S. employer identification no.)
1500 Riveredge Parkway, Suite 100, Atlanta, Georgia 30328
(Address of principal executive offices) (Zip Code)
Title of Each Class Name of Each Exchange on Which Registered
Common Stock, $0.01 par value per share New York Stock Exchange
Series A Junior Participating Preferred Stock New York Stock Exchange
Purchase Rights Associated with the Common Stock
Large accelerated filer � Accelerated filer � Non-accelerated filer � Smaller reporting company �
(Do not check if a smaller reporting company)

Table of Contents
DOCUMENTS INCORPORATED BY REFERENCE:
Portions of the registrant’s definitive Proxy Statement for the 2014 Annual Meeting of Stockholders are incorporated by reference into Part III of this Annual Report on Form
10-K.
2

Table of Contents
TABLE OF CONTENTS OF FORM 10-K
3
INFORMATION CONCERNING FORWARD-LOOKING STATEMENTS 4
PART I
ITEM 1. BUSINESS 5
ITEM 1A. RISK FACTORS 11
ITEM 1B. UNRESOLVED STAFF COMMENTS 13
ITEM 2. PROPERTIES 13
ITEM 3 . LEGAL PROCEEDINGS 15
ITEM 4. MINE SAFETY DISCLOSURES 15
EXECUTIVE OFFICERS OF THE REGISTRANT 15
PART II
ITEM 5. MARKET FOR REGISTRANT’S COMMON EQUITY, RELATED STOCKHOLDER MATTERS AND ISSUER PURCHASES OF EQUITY SECURITIES 17
ITEM 6. SELECTED FINANCIAL DATA 19
ITEM 7. MANAGEMENT’S DISCUSSION AND ANALYSIS OF FINANCIAL CONDITION AND RESULTS OF OPERATIONS 20
ITEM 7A. QUANTITATIVE AND QUALITATIVE DISCLOSURE ABOUT MARKET RISK 38
ITEM 8. FINANCIAL STATEMENTS AND SUPPLEMENTARY DATA 40
ITEM 9. CHANGES IN AND DISAGREEMENTS WITH ACCOUNTANTS ON ACCOUNTING AND FINANCIAL DISCLOSURE 98
ITEM 9A . CONTROLS AND PROCEDURES 98
ITEM 9B. OTHER INFORMATION 99
PART III
ITEM 10 . DIRECTORS, EXECUTIVE OFFICERS AND CORPORATE GOVERNANCE 100
ITEM 11. EXECUTIVE COMPENSATION 100
ITEM 12. SECURITY OWNERSHIP OF CERTAIN BENEFICIAL OWNERS AND MANAGEMENT AND RELATED STOCKHOLDER MATTERS 100
ITEM 13. CERTAIN RELATIONSHIPS AND RELATED TRANSACTIONS, AND DIRECTOR INDEPENDENCE 100
ITEM 14. PRINCIPAL ACCOUNTANT FEES AND SERVICES 100
PART IV
ITEM 15. EXHIBITS AND FINANCIAL STATEMENT SCHEDULES 101
SIGNATURES 106

Table of Contents
INFORMATION CONCERNING FORWARD-LOOKING STATEMENTS
Certain statements regarding the expectations of Graphic Packaging Holding Company (“GPHC” and, together with its subsidiaries, the “Company”), including, but not limited to, statements regarding cost savings from its continuous improvement programs, capital investment, depreciation and amortization, interest expense, debt reduction, synergies from acquisitions, pension plan contributions and postretirement health care benefit payments, in this report constitute “forward-looking statements” as defined in the Private Securities Litigation Reform Act of 1995. Such statements are based on currently available operating, financial and competitive information and are subject to various risks and uncertainties that could cause actual results to differ materially from the Company’s historical experience and its present expectations. These risks and uncertainties include, but are not limited to, inflation of and volatility in raw material and energy costs, continuing pressure for lower cost products, the Company’s ability to implement its business strategies, including productivity initiatives and cost reduction plans, the Company’s debt level, currency movements and other risks of conducting business internationally, and the impact of regulatory and litigation matters, including those that could impact the Company’s ability to utilize its net operating losses to offset taxable income and those that impact the Company's ability to protect and use its intellectual property. Undue reliance should not be placed on such forward-looking statements, as such statements speak only as of the date on which they are made and the Company undertakes no obligation to update such statements. Additional information regarding these and other risks is contained in Part I, Item 1A., Risk Factors.
4

Table of Contents
PART I
Overview
Graphic Packaging Holding Company (“GPHC” and, together with its subsidiaries, the “Company”) is committed to providing consumer packaging that makes a world of difference. The Company is a leading provider of packaging solutions to food, beverage and other consumer products companies. The Company is the largest U.S. producer of folding cartons and holds leading market positions in coated unbleached kraft paperboard, coated-recycled paperboard and multi-wall bags.
The Company’s customers include many of the world’s most widely recognized companies and brands with prominent market positions in the beverage, food and other consumer products industries. The Company strives to provide its customers with packaging solutions designed to deliver marketing and performance benefits at a competitive cost by capitalizing on its low-cost paperboard mills and converting plants, proprietary carton and packaging designs, and its commitment to quality and service.
During November of 2013, certain shareholders of the Company sold approximately 47.9 million shares of common stock in a secondary
public offering at $8.38 per share. The shares were sold by certain affiliates of TPG Capital, L.P. (the “TPG Entities”), certain Coors family trusts and the Adolph Coors Foundation (the “Coors Family Stockholders”), Clayton, Dubilier & Rice Fund V Limited Partnership (the “CD&R Fund”) and Old Town, S.A. (“Old Town”), (“Old Town”, and together with the TPG Entities, the Coors Family Stockholders, the Adolph Coors Foundation, and the CD&R Fund, the "Selling Stockholders"). In connection with the offering, the Company repurchased approximately 23.9 million shares at $8.38 per share resulting in aggregate purchase price of $200 million (the "Share Repurchase"). The Share Repurchase was funded with a combination of cash on hand and borrowings under the Company’s revolving credit facility. After these transactions the shares outstanding held by the Selling Stockholders decreased from approximately 35% to approximately 23%.
During 2013, prior to the November secondary, the Selling Stockholders sold 15 million, 15 million and 28 million shares of common stock in separate secondary public offerings at prices of $7.00, $7.73 and $8.45 per share, respectively. The shares outstanding held by the Selling Stockholders in these offerings decreased from approximately 53% at December 31, 2012 to approximately 35%.
On September 30, 2013, the Company completed the sale of certain assets related to the flexible plastics business and the sale of its uncoated-
recycled board (“URB”) mill. The flexible plastics business was part of the Flexible Packaging segment and the URB mill was part of the Paperboard Packaging segment, and in aggregate, accounted for approximately 2% of net consolidated sales.
On December 31, 2012, the Company acquired Contego Packaging Holdings, Ltd. ("Contego"), a leading food and consumer product
packaging company based in the United Kingdom. Under the terms of the transaction, the Company paid approximately $93 million and assumed debt of approximately $35 million in an all cash transaction. Contego operates four folding carton facilities that convert approximately 150,000 tons of paperboard annually. The acquisition is included in the paperboard packaging segment. This transaction is herein referred to as the "Contego Transaction".
On December 31, 2012, the Company acquired A&R Carton Holding BV’s Beer and Beverage packaging business in Europe ("A&R"). Under
the terms of the transaction, the Company paid approximately $25 million and assumed approximately $2 million in debt in an all cash transaction. A&R includes two manufacturing facilities that convert approximately 30,000 tons of paperboard annually. The acquisition is included in the paperboard packaging segment. This transaction is herein referred to as the "A&R Transaction". The A&R Transaction and the Contego Transaction are collectively referred to as the "European Acquisitions".
During December of 2012, the Selling Stockholders sold 18.5 million shares of common stock in a secondary public offering at $6.10 per share, as well as an additional 2.8 million shares pursuant to the underwriters' overallotment option. In connection with the offering, the Company also repurchased approximately 49.2 million shares of its common stock from the Selling Stockholders at $6.10 per share. The Company funded the share repurchase with an incremental term loan borrowing. The shares outstanding held by the Selling Stockholders decreased from approximately 65% to approximately 53%.
5
ITEM 1. BUSINESS

Table of Contents During December 2011, the Company combined its multi-wall bag and specialty plastics packaging businesses with the kraft paper and multi-wall bag businesses of Delta Natural Kraft, LLC and Mid-America Packaging, LLC (collectively "DNK"), both wholly-owned subsidiaries of Capital Five Investments, LLC ("CVI"). Under the terms of the transaction, the Company formed a new limited liability company, Graphic Flexible Packaging, LLC ("GFP"), and contributed the net assets of its multi-wall bag and specialty plastics packaging businesses to it. CVI concurrently contributed its ownership interests in DNK to GFP. Neither party received cash consideration as part of the transaction. After the combination, the Company owns approximately 87% of GFP and consolidates its results of operations. The remaining 13% of GFP is owned by CVI. GFP is included in the flexible packaging segment. This transaction is herein referred to as the "DNK Transaction". Products
The Company reports its results in two business segments: paperboard packaging and flexible packaging. The Company operates in four geographic areas: the United States (“U.S.”)/Canada, Central/South America, Europe and Asia Pacific. For business segment and geographic area information for each of the last three fiscal years, see Note 16 in the Notes to Consolidated Financial Statements included herein under “Item 8., Financial Statements and Supplementary Data.” Paperboard Packaging
The Company’s paperboard packaging products deliver brand, marketing and performance benefits at a competitive cost. The Company supplies paperboard cartons and carriers designed to protect and contain products while providing:
The Company provides a wide range of paperboard packaging solutions for the following end-use markets:
The Company’s packaging applications meet the needs of its customers for:
Strength Packaging. The Company's products provide sturdiness to meet a variety of packaging needs, including tear and wet strength,
puncture resistance, durability and compression strength (providing stacking strength to meet store display packaging requirements).
Promotional Packaging. The Company offers a broad range of promotional packaging options that help differentiate its customers’ products in the marketplace. These promotional enhancements improve brand awareness and visibility on store shelves.
Convenience Packaging. These packaging solutions improve package usage and food preparation:
Barrier Packaging. The Company provides packages that protect against moisture, grease, oil, oxygen, sunlight, insects and other potential
product-damaging factors.
6
• convenience through ease of carrying, storage, delivery, dispensing of product and food preparation for consumers;
• a smooth surface printed with high-resolution, multi-color graphic images that help improve brand awareness and visibility of products on store shelves; and
• durability, stiffness and wet and dry tear strength; leak, abrasion and heat resistance; barrier protection from moisture, oxygen, oils and greases, as well as enhanced microwave heating performance.
• beverage, including beer, soft drinks, energy drinks, water and juices;
• food, including cereal, desserts, frozen, refrigerated and microwavable foods and pet foods;
• prepared foods, including snacks, quick-serve foods for restaurants and food service products; and
• household products, including dishwasher and laundry detergent, health care and beauty aids, and tissues and papers.
• beverage multiple-packaging — Multi-packs for beer, soft drinks, energy drinks, water and juices;
• active microwave technologies — Substrates that improve the preparation of foods in the microwave; and
• easy opening and closing features — Pour spouts and sealable liners.

Table of Contents
The Company produces paperboard at its mills; prints, cuts and glues (“converts”) the paperboard into folding cartons at its converting plants; and designs and manufactures specialized, proprietary packaging machines that package bottles and cans and, to a lesser extent, non-beverage consumer products. The Company also installs its packaging machines at customer plants and provides support, service and advanced performance monitoring of the machines.
The Company offers a variety of laminated, coated and printed packaging structures that are produced from its coated unbleached kraft (“CUK”), coated-recycled board (“CRB”), kraft paper containerboard and URB, as well as other grades of paperboard that are purchased from third-party suppliers.
Below is the production at each of the Company’s mills in the paperboard packaging segment during 2013:
Note:
The Company consumes most of its coated board output in its carton converting operations, which is an integral part of the customer value
proposition. In 2013, approximately 82% of mill production of CUK and CRB was consumed internally.
CUK Production. The Company is the largest of three worldwide producers of CUK. CUK is a specialized high-quality grade of coated paperboard with excellent wet and dry tear strength characteristics and printability for high resolution graphics that make it particularly well-suited for a variety of packaging applications.
CRB Production. The Company is the largest domestic producer of CRB. CRB is manufactured entirely from recycled fibers, primarily old corrugated containers (“OCC”), doubled-lined kraft cuttings from corrugated box plants (“DLK”), old newspapers (“ONP”), and box cuttings. The recycled fibers are re-pulped, formed on paper machines, and clay-coated to provide an excellent printing surface for superior quality graphics and appearance characteristics.
Containerboard/Kraft Paper. The Company manufactures corrugated medium and kraft paper for sale in the open market and internal use. Corrugated medium is combined with linerboard to make corrugated containers. Kraft paper is used primarily to make grocery bags and sacks.
The Company converts CUK and CRB, as well as other grades of paperboard, into cartons at converting plants the Company operates in various locations globally, including a converting plant associated with its joint venture in Japan, contract converters and at licensees outside the U.S. The converting plants print, cut and glue paperboard into cartons designed to meet customer specifications.
The Company’s labels business focuses on heat transfer labels and lithographic labels and provides customers with high-quality labels
utilizing multiple technology applications. The Company operates dedicated label plants which produce labels for food, beverage, pharmaceutical, automotive, household and industrial products, detergents, and the health and beauty markets.
7
Location Product # of Machines 2013 Net Tons Produced
West Monroe, LA CUK 2 777,000 Macon, GA CUK 2 604,000 Kalamazoo, MI CRB 2 459,000 Battle Creek, MI CRB 2 173,000 Middletown, OH CRB 1 163,000 Santa Clara, CA CRB 1 141,000 Pekin, IL (a) URB 1 34,000 West Monroe, LA Containerboard 1 128,000 West Monroe, LA Kraft Paper 1 48,000
(a) Mill was sold on September 30, 2013.

Table of Contents Flexible Packaging
The Company’s flexible packaging segment includes multi-wall bag facilities and the Pine Bluff, AR mill, which produced approximately 140,000 tons of kraft paper in 2013. In 2013, approximately 58% of the Company's mill production of kraft paper was consumed internally.
The Company is a leading supplier of flexible packaging in North America. Products include multi-wall bags, such as pasted value, pinched bottom, sewn open mouth and woven polypropylene, and coated paper. Coated paper products include institutional french fry packaging, barrier pouch rollstock and freezer paper. Key end-markets include food and agriculture, building and industrial materials, chemicals, minerals, and pet foods. Prior to the sale, approximately 27% of the plastics produced were consumed internally. The Company’s facilities are strategically located, allowing it to provide a high level of service to customers, minimize freight and logistics costs, improve order turnaround times and improve supply chain reliability. Joint Ventures
The Company is a party to a joint venture with Rengo Riverwood Packaging, Ltd. (in Japan) in which it holds a 50% ownership interest. The
joint venture agreement covers CUK supply, use of proprietary carton designs and marketing and distribution of packaging systems.
Marketing and Distribution
The Company markets its products principally to multinational beverage, food, and other well-recognized consumer product companies. The beverage companies include Anheuser-Busch, Inc., MillerCoors LLC, PepsiCo, Inc. and The Coca-Cola Company. Consumer product customers include Mondelez International Inc., Kraft Foods, Inc., General Mills, Inc., Nestlé USA, Inc., Kellogg Company, HAVI Global Solutions, LLC and Kimberly-Clark Corporation, among others. The Company also sells paperboard in the open market to independent and integrated paperboard converters.
Distribution of the Company’s principal products is primarily accomplished through sales offices in the U.S., Australia, Brazil, China, Germany, Italy, Japan, Mexico, Spain, the Netherlands and the United Kingdom, and, to a lesser degree, through broker arrangements with third parties.
During 2013 , the Company did not have any one customer that represented 10% or more of its net sales. Competition
Although a relatively small number of large competitors hold a significant portion of the paperboard packaging market, the Company’s business is subject to strong competition. There are two major CUK producers in the U.S. - MeadWestvaco Corporation and the Company. Internationally, The Klabin Company in Brazil produces similar grades of paperboard.
In beverage packaging, cartons made from CUK compete with substitutes such as plastics and corrugated packaging for packaging glass or plastic bottles, cans and other primary containers. Although plastics and corrugated packaging are typically priced lower than CUK, the Company believes that cartons made from CUK offer advantages over these materials in areas such as distribution, brand awareness, carton designs, package performance, package line speed, environmental friendliness and design flexibility.
In non-beverage consumer packaging, the Company’s paperboard competes with MeadWestvaco’s CUK, as well as CRB and solid bleached sulfate (“SBS”) from numerous competitors, and internationally, folding boxboard and white-lined chip. There are a large number of producers in the paperboard markets. Suppliers of paperboard compete primarily on the basis of price, strength and printability of their paperboard, quality and service.
The Company’s multi-wall bag business competes with a small number of large competitors. Additionally, the Company faces increasing competition from imported products, primarily from Asia. Raw Materials
Paperboard Packaging
The paperboard packaging produced by the Company comes from pine trees and recycled fibers. Pine pulpwood, paper and recycled fibers (including DLK and OCC) and energy used in the manufacture of paperboard, as well as poly sheeting, plastic
8

Table of Contents resins and various chemicals used in the coating of paperboard, represent the largest components of the Company’s variable costs of paperboard production.
For the West Monroe, LA and Macon, GA mills, the Company relies on private landowners and the open market for all of its pine pulpwood and recycled fiber requirements, supplemented by CUK clippings that are obtained from its converting operations. The Company believes that adequate supplies from both private landowners and open market fiber sellers currently are available in close proximity to meet its fiber needs at these mills.
The paperboard grades produced at the Kalamazoo, MI, Battle Creek, MI, Middletown, OH, and Santa Clara, CA, mills are made from 100% recycled fiber. The Company procures its recycled fiber from external suppliers and internal converting operations. The market price of each of the various recycled fiber grades fluctuates with supply and demand. The Company’s internal recycled fiber procurement function enables the Company to attain the lowest market price for its recycled fiber given the Company’s highly fragmented supplier base. The Company believes there are adequate supplies of recycled fiber to serve its mills.
In addition to paperboard that is supplied to its converting operations from its own mills, the Company converts a variety of other paperboard grades such as SBS. The Company purchases such paperboard requirements, including additional CRB from outside vendors. The majority of external paperboard purchases are acquired through long-term arrangements with other major industry suppliers.
The labels business purchases its primary raw materials, which include heat transfer papers and coated one-side and two-side papers, from a
limited number of suppliers. In addition, the group purchases wet strength and metalized paper for specific, niche label applications and shrink sleeve film substrates through a variety of agreements, generally with terms of one to six years.
Flexible Packaging
For its Pine Bluff, AR mill, the Company relies on private landowners and the open market for all of its pine pulpwood and recycled fiber requirements. The multi-wall bag business uses a combination of natural kraft, high performance, bleached, metallic and clay-coated papers in its converting operations. The paper is supplied either internally or directly through other North American paper mills, under supply agreements that are typically renewed annually. Energy
Energy, including natural gas, fuel oil and electricity, represents a significant portion of the Company’s manufacturing costs. The Company has entered into contracts designed to manage risks associated with future variability in cash flows and price risk related to future energy cost increases for a portion of its natural gas requirements, primarily at its U.S. mills. The Company’s hedging program for natural gas is discussed in Note 9 in the Notes to Consolidated Financial Statements included herein under “Item 8., Financial Statements and Supplementary Data.” Backlog
Orders from the Company’s principal customers are manufactured and shipped with minimal lead time. The Company did not have a material amount relating to backlog orders at December 31, 2013 or 2012 . Seasonality
The Company’s net sales, income from operations and cash flows from operations are subject to moderate seasonality, with demand usually increasing in the late spring through early fall due to the beverage, folding carton, housing and construction markets. Research and Development
The Company’s research and development team works directly with its sales, marketing and consumer insight personnel to understand long-term consumer and retailer trends and create relevant new packaging. These innovative solutions provide customers with differentiated packaging to meet customer needs. The Company’s development efforts include, but are not limited to, extending the shelf life of customers’products; reducing production and waste costs; enhancing the heat-managing characteristics of food packaging; and refining packaging appearance through new printing techniques and materials.
Sustainability represents one of the strongest trends in the packaging industry. The Company’s strategy is to combine sustainability with innovation to create new packaging solutions for its customers.
9

Table of Contents
For more information on research and development expenses see Note 1 in the Notes to Consolidated Financial Statements included herein under “Item 8., Financial Statements and Supplementary Data.” Patents and Trademarks
As of December 31, 2013 , the Company had a large patent portfolio, presently owning, controlling or holding rights to more than 1,800 U.S. and foreign patents, with more than 700 U.S. and foreign patent applications currently pending. The Company’s patent portfolio consists primarily of patents relating to packaging machinery, manufacturing methods, structural carton designs, active microwave packaging technology, barrier protection packaging, multi-wall packaging and manufacturing methods. These patents and processes are significant to the Company’s operations and are supported by trademarks such as Cap-Sac ® , DI-NA-CAL ® , Fridge Vendor ® , IntegraPak TM , Kitchen Master ® , MicroFlex-Q ® , MicroRite ® , Quilt Wave ® , Qwik Crisp ® , Soni-Lok ® , Soni-Seal ® , Tite-Pak ® , The Yard Master ® , and Z-Flute ® . The Company takes significant steps to protect its intellectual property and proprietary rights. Culture and Employees
The Company’s corporate vision — consumer packaging that makes a world of difference — and values of respect, integrity, relationships, teamwork and accountability guide employee behavior, expectations and relations. The Company’s ongoing efforts to build a high-performance culture and improve the manner in which work is done across the Company includes a significant focus on continuous improvement utilizing processes like Lean Sigma and Six Sigma. In 2013, employees across the globe participated in lean and six sigma events.
As of December 31, 2013 , the Company had approximately 12,900 employees worldwide , of which approximately 54 % were represented by labor unions and covered by collective bargaining agreements or covered by work councils in Europe. As of December 31, 2013 , approximately 500 of the Company’s employees were working under an expired contract, which is currently being negotiated, and approximately 1,700 were covered under collective bargaining agreements that expire within one year. The Company considers its employee relations to be satisfactory. Environmental Matters
The Company is subject to federal, state and local environmental regulations and employs a team of professionals in order to maintain compliance at each of its facilities. For additional information on such regulation and compliance, see “Environmental Matters” in “Item 7., Management’s Discussion and Analysis of Financial Condition and Results of Operations” and Note 13 in the Notes to Consolidated Financial Statements included herein under “Item 8., Financial Statements and Supplementary Data.” Available Information
The Company’s website is located at http://www.graphicpkg.com . The Company makes available, free of charge through its website, its Annual Report on Form 10-K, Quarterly Reports on Form 10-Q, Current Reports on Form 8-K, and amendments to those reports filed or furnished pursuant to Section 13(a) or 15(d) of the Securities Exchange Act of 1934, as soon as reasonably practicable after such materials are electronically filed or furnished to the Securities and Exchange Commission (the “SEC”). The Company also makes certain investor presentations and access to analyst conference calls available through its website. The information contained or incorporated into the Company’s website is not a part of this Annual Report on Form 10-K.
10

Table of Contents
The following risks could affect (and in some cases have affected) the Company's actual results and could cause such results to differ
materially from estimates or expectations reflected in certain forward-looking statements: The Company's financial results could be adversely impacted if there are significant increases in prices for raw materials, energy, transportation and other necessary supplies, and the Company is unable to raise prices, or improve productivity and reduce costs.
Limitations in the availability of, and increases in, the costs of raw materials, including petroleum-based materials, energy, wood,
transportation and other necessary goods and services, could have an adverse effect on the Company's financial results. Because negotiated sales contracts and the market largely determine the pricing for its products, the Company is at times limited in its ability to raise prices and pass through to its customers any inflationary or other cost increases that the Company may incur.
The Company uses productivity improvements to reduce costs and offset inflation. These include global continuous improvement initiatives
that use statistical process control to help design and manage many types of activities, including production and maintenance. The Company's ability to realize anticipated savings from these improvements is subject to significant operational, economic and competitive uncertainties and contingencies, many of which are beyond the Company's control. If the Company cannot pass through price increases or successfully implement cost savings plans, it may not be able to continue to compete successfully against other manufacturers. In addition, any failure to generate the anticipated efficiencies and savings could adversely affect the Company's financial results. The Company's ability to use its net operating losses to offset its future taxable income may be limited under Section 382 of the Internal Revenue Code.
As of December 31, 2013, the Company had approximately $892.3 million of net operating losses (“NOLs”) available to offset future taxable income for U.S. federal income tax purposes. The Company's ability to use such NOLs to offset taxable income can be limited, however, if the Company undergoes an “ownership change” within the meaning of Section 382 of the Internal Revenue Code (“Section 382”). In general, an ownership change occurs whenever the aggregate percentage of the Company's common stock owned directly or indirectly by its stockholders who own five percent or more of the Company's common stock (“Significant Stockholders”) increases by more than 50 percentage points over the lowest aggregate percentage of the Company's common stock owned directly or indirectly by such Significant Stockholders at any time during the preceding three years. In addition, under certain circumstances, issuances, sales or other dispositions or acquisitions of the ownership interests in the Company's Significant Stockholders can be deemed an ownership change for the Company.
If an ownership change occurs, Section 382 establishes an annual limitation on the amount of NOL that may be used to offset federal taxable
income in future years. As a result, the Company's cash tax liability for such years could increase significantly. The magnitude of the annual limitation on the use of deferred tax assets and the effect of such limitation on the Company is difficult to assess and depends in part on the market value of the Company at the time of the ownership change and prevailing interest rates. The Company's indebtedness may adversely affect its financial condition and its ability to react to changes in its business.
As of December 31, 2013, the Company had an aggregate principal amount of $ 2,253.6 million of outstanding debt. Because of the Company's debt level, a portion of its cash flows from operations will be dedicated to payments on indebtedness and the Company's ability to obtain additional financing for working capital, capital expenditures, acquisitions or general corporate purposes may be restricted in the future.
Additionally, the Company’s Credit Agreement dated March 16, 2012, as amended (the “Credit Agreement”) and the indenture governing its
7.875% Senior Notes due 2018 and the 4.75% Senior Notes due 2021 (the “Indenture”) prohibit or restrict, among other things, the disposal of assets, the incurrence of additional indebtedness (including guarantees), payment of dividends, loans or advances and certain other types of transactions. These restrictions could limit the Company's flexibility to respond to changing market conditions and competitive pressures. The debt obligations and restrictions may also leave the Company more vulnerable
11
Item 1A. RISK FACTORS

Table of Contents to a downturn in general economic conditions or its business, or unable to carry out capital expenditures that are necessary or important to its growth strategy and productivity improvement programs. The Company's future growth and financial results could be adversely impacted, if the Company is unable to identify and finance strategic acquisitions and to successfully integrate the acquired businesses.
The Company has made several acquisitions in recent years. The Company's ability to continue to make strategic acquisitions and to integrate the acquired businesses successfully, including obtaining anticipated cost savings or synergies and expected operating results within a reasonable period of time, is an important factor in the Company's future growth. If the Company is unable to realize the expected revenue and cash flow growth and other benefits, the Company may be required to spend additional time or money on integration efforts that would otherwise have been spent on the development and expansion of its business. In addition, the Company's ability to finance acquisitions may be adversely impacted by the Company's financial position and access to credit markets. The Company is subject to environmental, health and safety laws and regulations, and costs to comply with such laws and regulations, or any liability or obligation imposed under new laws or regulations, could negatively impact its financial condition and results of operations.
The Company is subject to a broad range of foreign, federal, state and local environmental, health and safety laws and regulations, including those governing discharges to air, soil and water, the management, treatment and disposal of hazardous substances, the investigation and remediation of contamination resulting from releases of hazardous substances, and the health and safety of employees. The Company cannot currently assess the impact that future emission standards, climate control initiatives and enforcement practices will have on the Company's operations and capital expenditure requirements. Environmental liabilities and obligations may result in significant costs, which could negatively impact the Company's financial position, results of operations or cash flows. See Note 13 in the Notes to Consolidated Financial Statements included herein under “Item 8., Financial Statements and Supplementary Data.” The Company may not be able to develop and introduce new products and adequately protect its intellectual property and proprietary rights, which could harm its future success and competitive position.
The Company works to increase market share and profitability through product innovation and the introduction of new products. The inability to develop new or better products in a timely manner may impact the Company's competitive position.
The Company's future success and competitive position also depends, in part, upon its ability to obtain and maintain protection for certain proprietary carton and packaging machine technologies used in its value-added products, particularly those incorporating the Cap-Sac, DI-NA-CAL, Fridge Vendor, IntegraPak, Kitchen Master, MicroFlex-Q, MicroRite, Quilt Wave, Qwik Crisp, Soni-Lok, Soni-Seal, Tite-Pak, The Yard Master and Z-Flute technologies. Failure to protect the Company's existing intellectual property rights may result in the loss of valuable technologies or may require it to license other companies' intellectual property rights. It is possible that any of the patents owned by the Company may be invalidated, rendered unenforceable, circumvented, challenged or licensed to others or any of its pending or future patent applications may not be issued within the scope of the claims sought by the Company, if at all. Further, others may develop technologies that are similar or superior to the Company's technologies, duplicate its technologies or design around its patents, and steps taken by the Company to protect its technologies may not prevent misappropriation of such technologies.
Competition could have an adverse effect on the Company's financial results.
The Company competes with other paperboard manufacturers and carton converters, both domestically and internationally. The Company's
products compete with those made from other manufacturers' CUK board and other substrates, as well as SBS and recycled clay-coated news (“CCN”). Substitute products include plastic, shrink film and corrugated containers. In addition, while the Company has long-term relationships with many of its customers, the underlying contracts may be re-bid or renegotiated from time to time, and the Company may not be successful in renewing on favorable terms or at all. The Company works to maintain market share through efficiency, product innovations and strategic sourcing to its customers; however, pricing and other competitive pressures may occasionally result in the loss of a customer relationship.
12

Table of Contents
The Company's pension plans are currently underfunded, and the Company may be required to make cash payments to the plans, reducing the cash available for its business. The Company's cash flows may be adversely impacted by the Company's pension funding obligations. The Company's pension funding obligations are dependent upon multiple factors resulting from actual plan experience and assumptions of future experience. The Company has unfunded obligations of $153.2 million under its domestic and foreign defined benefit pension plans. The funded status of these plans is dependent upon various factors, including returns on invested assets, the level of certain market interest rates and the discount rate used to determine the pension obligations. Unfavorable returns on the plan assets or unfavorable changes in applicable laws or regulations could materially change the timing and amount of required plan funding, which would reduce the cash available to the Company for other purposes.
None.
Headquarters
The Company leases its principal executive offices in Atlanta, GA and maintains country headquarters in Australia, China, Germany, Italy, and Japan. Operating Facilities
A listing of the principal properties owned or leased and operated by the Company is set forth below. The Company’s buildings are adequate and suitable for the business of the Company. The Company also leases certain smaller facilities, warehouses and office space throughout the U.S. and in foreign countries from time to time. The operating locations include 7 mills, 38 paperboard converting plants, and 11 flexible packaging plants.
13
ITEM 1B. UNRESOLVED STAFF COMMENTS
ITEM 2. PROPERTIES
Segment and Location Related Products or Use of Facility
Paperboard Packaging:
Battle Creek, MI CRB
Kalamazoo, MI CRB
Macon, GA CUK
Middletown, OH CRB
Santa Clara, CA CRB
West Monroe, LA CUK; Containerboard; Research and Development
Atlanta, GA Folding Cartons
Bremen, Germany Folding Cartons
Bristol, Avon, United Kingdom Folding Cartons
Carol Stream, IL Folding Cartons; Design Center
Centralia, IL Folding Cartons
Charlotte, NC Folding Cartons
Elk Grove, IL (a) Folding Cartons
Fort Smith, AR (a) Folding Cartons
Gordonsville, TN Folding Cartons
Greensboro, NC Labels
Hoogerheide, Netherlands Folding Cartons
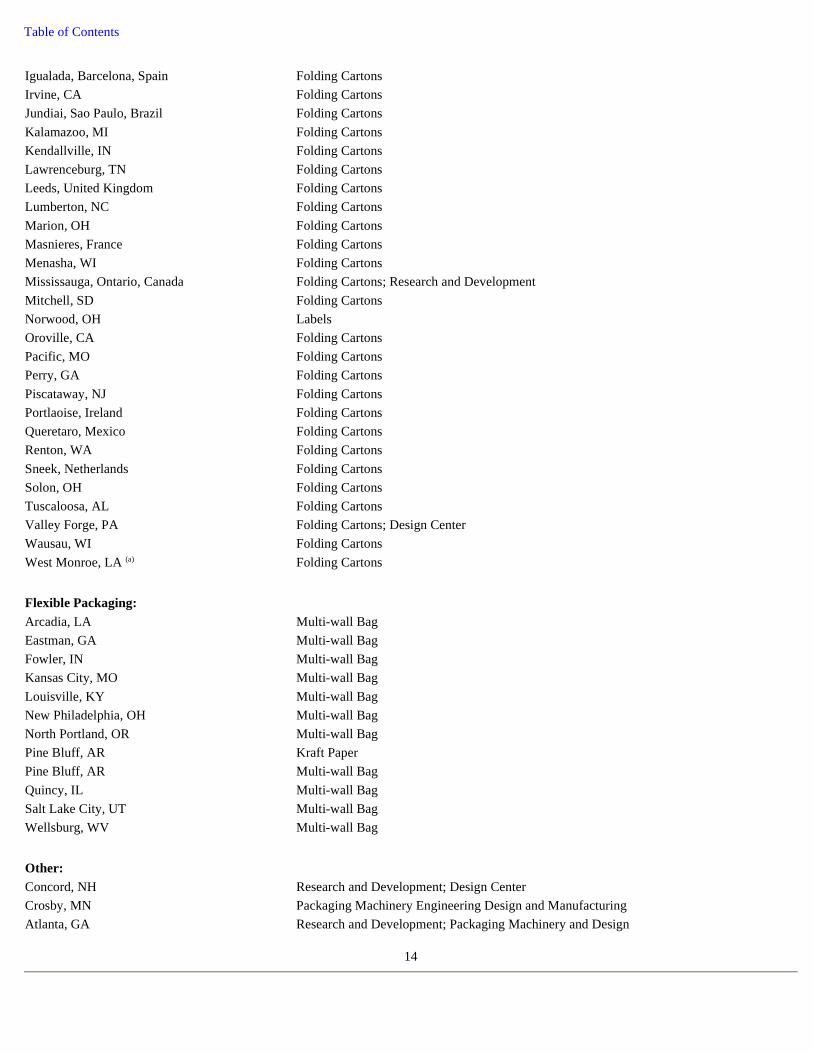
Table of Contents
14
Igualada, Barcelona, Spain Folding Cartons
Irvine, CA Folding Cartons
Jundiai, Sao Paulo, Brazil Folding Cartons
Kalamazoo, MI Folding Cartons
Kendallville, IN Folding Cartons
Lawrenceburg, TN Folding Cartons
Leeds, United Kingdom Folding Cartons
Lumberton, NC Folding Cartons
Marion, OH Folding Cartons
Masnieres, France Folding Cartons
Menasha, WI Folding Cartons
Mississauga, Ontario, Canada Folding Cartons; Research and Development
Mitchell, SD Folding Cartons
Norwood, OH Labels
Oroville, CA Folding Cartons
Pacific, MO Folding Cartons
Perry, GA Folding Cartons
Piscataway, NJ Folding Cartons
Portlaoise, Ireland Folding Cartons
Queretaro, Mexico Folding Cartons
Renton, WA Folding Cartons
Sneek, Netherlands Folding Cartons
Solon, OH Folding Cartons
Tuscaloosa, AL Folding Cartons
Valley Forge, PA Folding Cartons; Design Center
Wausau, WI Folding Cartons
West Monroe, LA (a) Folding Cartons
Flexible Packaging:
Arcadia, LA Multi-wall Bag
Eastman, GA Multi-wall Bag
Fowler, IN Multi-wall Bag
Kansas City, MO Multi-wall Bag
Louisville, KY Multi-wall Bag
New Philadelphia, OH Multi-wall Bag
North Portland, OR Multi-wall Bag
Pine Bluff, AR Kraft Paper
Pine Bluff, AR Multi-wall Bag
Quincy, IL Multi-wall Bag
Salt Lake City, UT Multi-wall Bag
Wellsburg, WV Multi-wall Bag
Other:
Concord, NH Research and Development; Design Center
Crosby, MN Packaging Machinery Engineering Design and Manufacturing
Atlanta, GA Research and Development; Packaging Machinery and Design

Table of Contents Note:
The Company is a party to a number of lawsuits arising in the ordinary conduct of its business. Although the timing and outcome of these
lawsuits cannot be predicted with certainty, the Company does not believe that disposition of these lawsuits will have a material adverse effect on the Company’s consolidated financial position, results of operations or cash flows. See Note 13 in the Notes to Consolidated Financial Statements included herein under “Item 8., Financial Statements and Supplementary Data.”
None.
EXECUTIVE OFFICERS OF THE REGISTRANT
Pursuant to General Instruction G.(3) of Form 10-K, the following list is included as an unnumbered item in Part I of this Report in lieu of
being included in the definitive proxy statement that will be filed within 120 days after December 31, 2013 .
David W. Scheible, 57 , was appointed Chairman of the Board of GPHC on May 22, 2013. He was appointed to the Board of Directors of GPHC upon its formation (under the name New Giant Corporation) in June 2007. Prior to the combination of the businesses of Graphic Packaging Corporation ("GPC") and Altivity Packaging LLC, on March 10, 2008 (the " Altivity Transaction"), he had served as a director, President and Chief Executive Officer of GPC since January 1, 2007. Prior to that time, Mr. Scheible had served as Chief Operating Officer of GPC since October 2004. Mr. Scheible served as Executive Vice President of Commercial Operations from August 2003 until October 2004. Mr. Scheible served as Graphic Packaging International Corporation’s Chief Operating Officer from 1999 until August 2003. He also served as President of Graphic Packaging International Corporation’s Flexible Division from January to June 1999. Previously, Mr. Scheible was affiliated with the Avery Dennison Corporation, working most recently as its Vice President and General Manager of the Specialty Tape Division from 1995 through 1999 and Vice President and General Manager of the Automotive Division from 1993 to 1995. Mr. Scheible serves on the Board of Directors of Benchmark Electronics, Inc., a provider of integrated electronics manufacturing, design and engineering services.
Daniel J. Blount, 58, is the Senior Vice President and Chief Financial Officer of GPHC. Prior to the Altivity Transaction, he had served as
Senior Vice President and Chief Financial Officer of GPC since September 2005. From October 2003 until September 2005, he was the Senior Vice President, Integration of GPC. From August 2003 until October 2003, he was the Senior Vice President, Integration, Chief Financial Officer and Treasurer. From June 2003 until August 2003, he was Senior Vice President, Chief Financial Officer and Treasurer of Riverwood Holding, Inc. From September 1999 until June 2003, Mr. Blount was Senior Vice President and Chief Financial Officer of Riverwood Holding, Inc. Mr. Blount was named Vice President and Chief Financial Officer of Riverwood Holding, Inc. in September 1998. Prior to joining Riverwood Holding, Inc., Mr. Blount spent 13 years at Montgomery Kone, Inc., an elevator, escalator and moving ramp product manufacturer, installer and service provider, most recently serving as Senior Vice President, Finance.
Carla J. Chaney, 43 , is the Senior Vice President, Human Resources of GPHC, a position she has held since July 15, 2013. Mrs. Chaney
joined GPHC from Exide Technologies, a leading global supplier of stored electrical energy. Mrs. Chaney was with Exide Technologies from
February 2012 to July 2013 and served most recently as Executive Vice President, Human Resources and Communications. Prior to Exide
Technologies, Mrs. Chaney held a variety of leadership roles with Newell Rubbermaid, Inc. from 2004 to 2011, including Group Vice President,
Human Resources for the Home & Family business segment, Regional Vice President, Human Resources, EMEA; Corporate Vice President,
Global Organization and People Development; and Vice President, Human Resources, Culinary Lifestyles Business. Mrs. Chaney also worked
for Georgia-Pacific from 1992 to 2004.
Michael P. Doss, 47, is the Chief Operating Officer of GPHC. Mr. Doss previously held the position of Executive Vice President, Commercial Operations of GPHC. Prior to this Mr. Doss held the position of Senior Vice President, Consumer Packaging Division. Prior to the Altivity Transaction, he had served as Senior Vice President, Consumer Products Packaging of GPC since September
15
(a) Multiple facilities in this location.
ITEM 3. LEGAL PROCEEDINGS
ITEM 4. MINE SAFETY DISCLOSURES

Table of Contents 2006. From July 2000 until September 2006, he was the Vice President of Operations, Universal Packaging Division. Since joining Graphic Packaging International Corporation in 1990, Mr. Doss has held positions of increasing management responsibility, including Plant Manager at the Gordonsville, TN and Wausau, WI plants. Mr. Doss was Director of Web Systems for the Universal Packaging Division prior to his promotion to Vice President of Operations.
R. Allen Ennis, 45 , is the Senior Vice President, Flexible Division, of GPHC. Mr. Ennis joined GPII in 2011 from Sierra Pacific Packaging, a state-of-the-art food and beverage folding carton manufacturing company. He served as Chief Executive Officer of Sierra Pacific Packaging since founding the company in 1994 until the acquisition by GPII in 2011.
Stephen A. Hellrung, 66, is the Senior Vice President, General Counsel and Secretary of GPHC. Prior to the Altivity Transaction, he had
served as Senior Vice President, General Counsel and Secretary of GPC since October 2003. He was Senior Vice President, General Counsel and Secretary of Lowe's Companies, Inc., a home improvement specialty retailer, from April 1999 until June 2003. Prior to joining Lowe's Companies, Mr. Hellrung held similar positions with The Pillsbury Company and Bausch & Lomb, Incorporated.
Alan R. Nichols, 51 , is the Senior Vice President, Mills Division of GPHC. He served as Vice President, Mills from August 2008 until March 2009. From March 2008 until August 2008, Mr. Nichols was Vice President, CRB Mills. Prior to the Altivity Transaction, Mr. Nichols served as Vice President, CRB Mills for Altivity Packaging, LLC from February 2007 until March 2008 and was the Division Manufacturing Manager, Mills for Altivity Packaging and the Consumer Products Division of Smurfit-Stone Container Corporation from August 2005 to February 2007. From February 2001 until August 2005, Mr. Nichols was the General Manager of the Wabash Mill for Smurfit-Stone.
Michael R. Schmal, 60 , is the Senior Vice President, Beverage Packaging Division of GPHC. Prior to the Altivity Transaction, he had served as Senior Vice President, Beverage of GPC since August 2003. From October 1996 until August 2003, Mr. Schmal was the Vice President and General Manager, Brewery Group of Riverwood Holding, Inc. Prior to that time, Mr. Schmal held various positions with Riverwood Holding, Inc. since 1981.
Stephen R. Scherger, 49 , is the Senior Vice President, Consumer Packaging of GPHC. Mr. Scherger joined GPHC in April of 2012 from
MeadWestvaco Corporation, where he served as President, Beverage and Consumer Electronics. Mr. Scherger was with MeadWestvaco
Corporation from 1986 to 2012 and held positions including Vice President, Corporate Strategy; Vice President and General Manager,
Packaging Systems; Vice President and CFO, Papers Group and other executive-level positions.
16

Table of Contents
PART II
GPHC’s common stock (together with the associated stock purchase rights) is traded on the New York Stock Exchange under the symbol “GPK.” The historical range of the high and low sales price per share for each quarter of 2013 and 2012 are as follows:
No cash dividends have been paid during the last three years to the Company’s common stockholders. The Company’s intent is not to pay
dividends at this time. Additionally, the Company’s credit facilities and the indenture governing its debt securities place limitations on the Company’s ability to pay cash dividends on its common stock (see “Covenant Restrictions” in “Item 7., Management’s Discussion and Analysis of Financial Condition and Results of Operations” and Note 5 in the Notes to Consolidated Financial Statements included herein under “Item 8., Financial Statements and Supplementary Data”).
On January 31, 2014, there were approximately 1,800 stockholders of record and approximately 13,600 beneficial holders of GPHC’s common stock.
During the fourth quarter of 2013 the Company purchased shares of common stock as follows:
1 Shares were purchased from the underwriters in conjunction with a secondary offering.
Total Return to Stockholders
The following graph compares the total returns (assuming reinvestment of dividends) of the common stock of the Company, the Standard & Poor’s (“S&P”) 500 Stock Index and the Dow Jones (“DJ”) U.S. Container & Packaging Index. The graph assumes $100 invested on December 31, 2008 in GPHC’s common stock and each of the indices. The stock price performance on the following graph is not necessarily indicative of future stock price performance.
17
ITEM 5. MARKET FOR REGISTRANT’S COMMON EQUITY, RELATED STOCKHOLDER MATTERS AND ISSUER PURCHASES OF EQUITY SECURITIES
2013 2012
High Low High Low
First Quarter $ 7.60 $ 6.55 $ 5.76 $ 4.38 Second Quarter 8.06 7.26 5.67 4.51 Third Quarter 8.89 7.91 5.90 5.18 Fourth Quarter 9.60 8.06 6.69 5.51
Period
Total Number of Shares
Purchased 1
Average Price Paid Per Share
Total Number of Shares Purchased as Part of Publicly Announced Plans or Programs 1
Maximum Number of Shares That May Yet Be Purchased
Under the Publicly Announced Plans or Programs
November 1, 2013 through November 30, 2013 23,866,348 $ 8.38 23,866,348 —

Table of Contents
18
12/31/2008 12/31/2009 12/31/2010 12/31/2011 12/31/2012 12/31/2013
Graphic Packaging Holding Company $ 100.00 $ 304.39 $ 341.23 $ 373.68 $ 566.67 $ 842.11 S&P 500 Stock Index 100.00 126.46 145.51 148.59 172.37 228.19 Dow Jones U.S. Container & Packaging Index 100.00 140.45 164.74 164.97 188.24 264.88
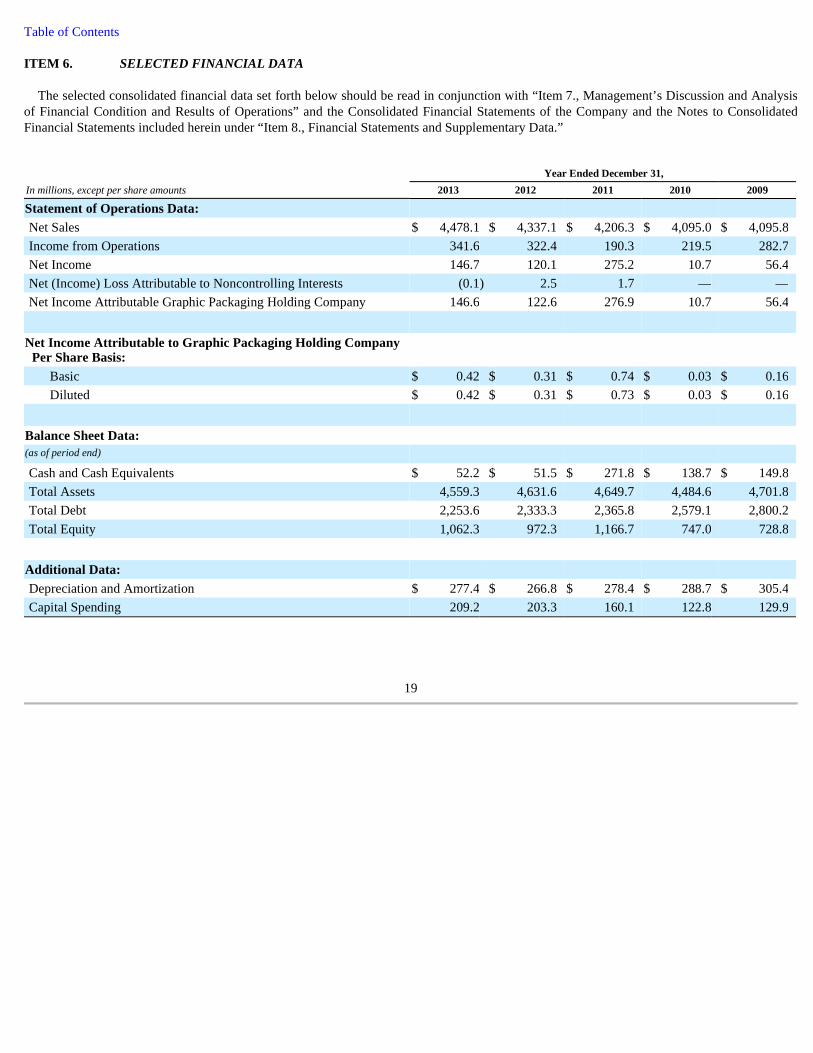
Table of Contents
The selected consolidated financial data set forth below should be read in conjunction with “Item 7., Management’s Discussion and Analysis
of Financial Condition and Results of Operations” and the Consolidated Financial Statements of the Company and the Notes to Consolidated Financial Statements included herein under “Item 8., Financial Statements and Supplementary Data.”
19
ITEM 6. SELECTED FINANCIAL DATA
Year Ended December 31,
In millions, except per share amounts 2013 2012 2011 2010 2009
Statement of Operations Data:
Net Sales $ 4,478.1 $ 4,337.1 $ 4,206.3 $ 4,095.0 $ 4,095.8 Income from Operations 341.6 322.4 190.3 219.5 282.7 Net Income 146.7 120.1 275.2 10.7 56.4 Net (Income) Loss Attributable to Noncontrolling Interests (0.1 ) 2.5 1.7 — — Net Income Attributable Graphic Packaging Holding Company 146.6 122.6 276.9 10.7 56.4
Net Income Attributable to Graphic Packaging Holding Company Per Share Basis:
Basic $ 0.42 $ 0.31 $ 0.74 $ 0.03 $ 0.16 Diluted $ 0.42 $ 0.31 $ 0.73 $ 0.03 $ 0.16
Balance Sheet Data: (as of period end)
Cash and Cash Equivalents $ 52.2 $ 51.5 $ 271.8 $ 138.7 $ 149.8 Total Assets 4,559.3 4,631.6 4,649.7 4,484.6 4,701.8 Total Debt 2,253.6 2,333.3 2,365.8 2,579.1 2,800.2 Total Equity 1,062.3 972.3 1,166.7 747.0 728.8
Additional Data:
Depreciation and Amortization $ 277.4 $ 266.8 $ 278.4 $ 288.7 $ 305.4 Capital Spending 209.2 203.3 160.1 122.8 129.9

Table of Contents
INTRODUCTION
This management’s discussion and analysis of financial condition and results of operations is intended to provide investors with an understanding of the Company’s past performance, its financial condition and its prospects. The following will be discussed and analyzed:
Overview of Business
Overview of 2013 Results
Results of Operations
Financial Condition, Liquidity and Capital Resources
Critical Accounting Policies
New Accounting Standards
Business Outlook
OVERVIEW OF BUSINESS
The Company’s objective is to strengthen its position as a leading provider of packaging solutions. To achieve this objective, the Company offers customers its paperboard, cartons and packaging machines, either as an integrated solution or separately. Cartons and carriers are designed to protect and contain products. Product offerings include a variety of laminated, coated and printed packaging structures that are produced from the Company’s CUK and CRB, as well as other grades of paperboard that are purchased from third party suppliers. Innovative designs and combinations of paperboard, films, foils, metallization, holographics and embossing are customized to the individual needs of the customers. The Company’s labels business focuses on two product lines: heat transfer labels and lithographic labels.
The Company is a leading supplier of flexible packaging in North America. Products include multi-wall bags, such as pasted value, pinched bottom, sewn open mouth and woven polypropylene, and coated paper. Coated paper products include institutional french fry packaging, barrier pouch rollstock and freezer paper. Key end-markets include food and agriculture, building and industrial materials, chemicals, minerals and pet foods.
The Company is implementing strategies (i) to expand market share in its current markets and to identify and penetrate new markets; (ii) to capitalize on the Company’s customer relationships, business competencies, and mills and converting assets; (iii) to develop and market innovative, sustainable products and applications; and (iv) to continue to reduce costs by focusing on operational improvements. The Company’s ability to fully implement its strategies and achieve its objective may be influenced by a variety of factors, many of which are beyond its control, such as inflation of raw material and other costs, which the Company cannot always pass through to its customers, and the effect of overcapacity in the worldwide paperboard packaging industry.
Significant Factors That Impact The Company’s Business
Impact of Inflation. The Company’s cost of sales consists primarily of energy (including natural gas, fuel oil and electricity), pine pulpwood, chemicals, secondary fibers, purchased paperboard, paper, aluminum foil, ink, plastic films and resin, depreciation expense and labor. Inflation increased year over year costs by $51.9 million in 2013 and by $43.1 million in 2012. The higher costs in 2013 are primarily related to energy costs ($24.0 million), wood ($11.6 million), labor and related benefits ($7.6 million), freight ($4.3 million), corrugated cases ($3.9 million), other chemical-based inputs ($2.3 million), external board ($1.5 million), and other costs ($11.6 million). These higher costs were partially offset by lower secondary fiber ($14.9 million).
As the price of natural gas has experienced significant volatility, the Company has entered into contracts designed to manage risks associated with future variability in cash flows caused by changes in the price of natural gas. The Company has entered into
20
ITEM 7. MANAGEMENT’S DISCUSSION AND ANALYSIS OF FINANCIAL CONDITION AND RESULTS OF OPERATIONS
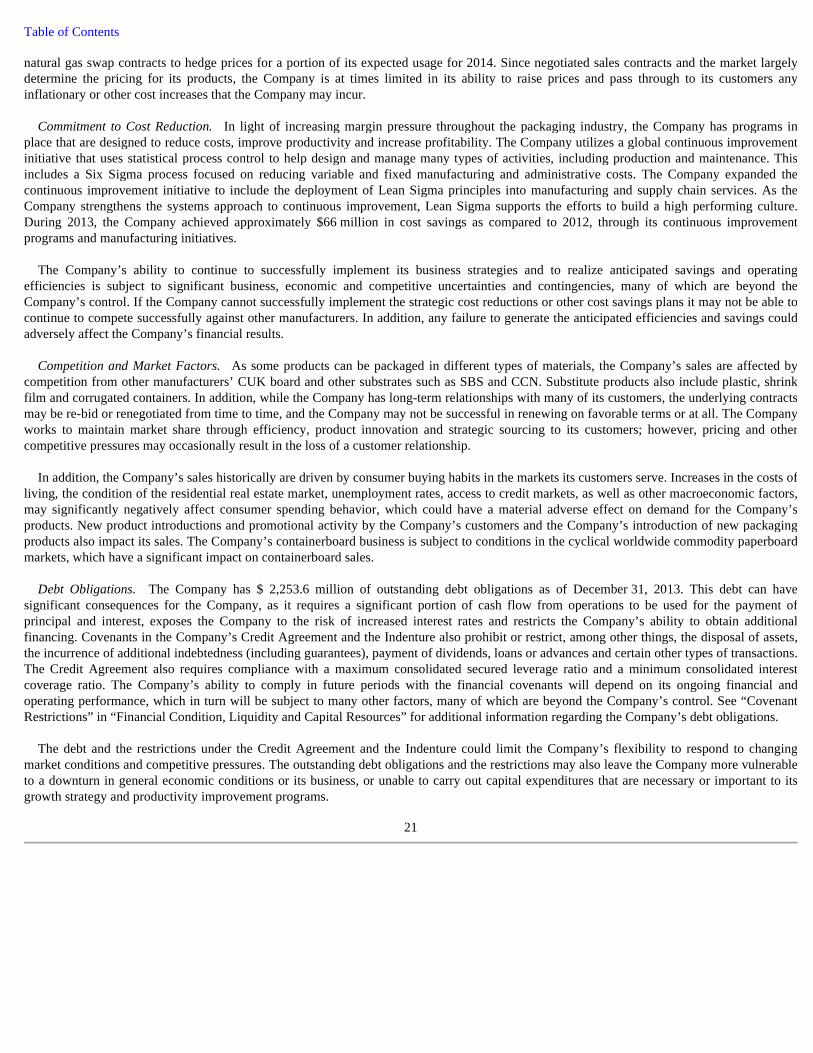
Table of Contents natural gas swap contracts to hedge prices for a portion of its expected usage for 2014. Since negotiated sales contracts and the market largely determine the pricing for its products, the Company is at times limited in its ability to raise prices and pass through to its customers any inflationary or other cost increases that the Company may incur.
Commitment to Cost Reduction. In light of increasing margin pressure throughout the packaging industry, the Company has programs in place that are designed to reduce costs, improve productivity and increase profitability. The Company utilizes a global continuous improvement initiative that uses statistical process control to help design and manage many types of activities, including production and maintenance. This includes a Six Sigma process focused on reducing variable and fixed manufacturing and administrative costs. The Company expanded the continuous improvement initiative to include the deployment of Lean Sigma principles into manufacturing and supply chain services. As the Company strengthens the systems approach to continuous improvement, Lean Sigma supports the efforts to build a high performing culture. During 2013, the Company achieved approximately $66 million in cost savings as compared to 2012, through its continuous improvement programs and manufacturing initiatives.
The Company’s ability to continue to successfully implement its business strategies and to realize anticipated savings and operating efficiencies is subject to significant business, economic and competitive uncertainties and contingencies, many of which are beyond the Company’s control. If the Company cannot successfully implement the strategic cost reductions or other cost savings plans it may not be able to continue to compete successfully against other manufacturers. In addition, any failure to generate the anticipated efficiencies and savings could adversely affect the Company’s financial results.
Competition and Market Factors. As some products can be packaged in different types of materials, the Company’s sales are affected by competition from other manufacturers’ CUK board and other substrates such as SBS and CCN. Substitute products also include plastic, shrink film and corrugated containers. In addition, while the Company has long-term relationships with many of its customers, the underlying contracts may be re-bid or renegotiated from time to time, and the Company may not be successful in renewing on favorable terms or at all. The Company works to maintain market share through efficiency, product innovation and strategic sourcing to its customers; however, pricing and other competitive pressures may occasionally result in the loss of a customer relationship.
In addition, the Company’s sales historically are driven by consumer buying habits in the markets its customers serve. Increases in the costs of living, the condition of the residential real estate market, unemployment rates, access to credit markets, as well as other macroeconomic factors, may significantly negatively affect consumer spending behavior, which could have a material adverse effect on demand for the Company’s products. New product introductions and promotional activity by the Company’s customers and the Company’s introduction of new packaging products also impact its sales. The Company’s containerboard business is subject to conditions in the cyclical worldwide commodity paperboard markets, which have a significant impact on containerboard sales.
Debt Obligations. The Company has $ 2,253.6 million of outstanding debt obligations as of December 31, 2013. This debt can have
significant consequences for the Company, as it requires a significant portion of cash flow from operations to be used for the payment of principal and interest, exposes the Company to the risk of increased interest rates and restricts the Company’s ability to obtain additional financing. Covenants in the Company’s Credit Agreement and the Indenture also prohibit or restrict, among other things, the disposal of assets, the incurrence of additional indebtedness (including guarantees), payment of dividends, loans or advances and certain other types of transactions. The Credit Agreement also requires compliance with a maximum consolidated secured leverage ratio and a minimum consolidated interest coverage ratio. The Company’s ability to comply in future periods with the financial covenants will depend on its ongoing financial and operating performance, which in turn will be subject to many other factors, many of which are beyond the Company’s control. See “Covenant Restrictions” in “Financial Condition, Liquidity and Capital Resources” for additional information regarding the Company’s debt obligations.
The debt and the restrictions under the Credit Agreement and the Indenture could limit the Company’s flexibility to respond to changing market conditions and competitive pressures. The outstanding debt obligations and the restrictions may also leave the Company more vulnerable to a downturn in general economic conditions or its business, or unable to carry out capital expenditures that are necessary or important to its growth strategy and productivity improvement programs.
21

Table of Contents
OVERVIEW OF 2013 RESULTS
This management’s discussion and analysis contains an analysis of Net Sales, Income from Operations and other information relevant to an understanding of results of operations. To enhance the understanding of continuing operations, this discussion and analysis excludes discontinued operations for all periods presented.
22
• Net Sales in 2013 increased by $141.0 million or 3.3% to $4,478.1 million from $4,337.1 million in 2012 primarily due to higher volume in paperboard packaging. The higher volume was due to the European acquisitions, new consumer product business and open market sales. This increase was partially offset by lower volume in flexible packaging due to continued general market softness, the internalization of paper and to a lesser extent the sale of the flexible plastics business. Net sales also decreased due to lower pricing and unfavorable exchange rates, primarily in Japan.
• Income from Operations in 2013 increased by $19.2 million , or 6.0% , to $341.6 million from $322.4 million in 2012. The increase was driven primarily by the gain on the sale of the flexible plastics business and improved performance due to cost savings through continuous improvement programs and other strategic initiatives. These increases were partially offset by higher inflation primarily related to energy, the lower pricing, integration costs and unfavorable exchange rates.
• On September 30, 2013, the Company completed the sale of certain assets related to the flexible plastics business and the sale of its URB mill. The Company had previously announced the closure of its Brampton, Ontario facility which was also part of the flexible plastics business.
• During November of 2013, certain shareholders of the Company sold approximately 47.9 million shares of common stock in a secondary public offering at $8.38 per share. The shares were sold by certain affiliates of TPG Capital, L.P. (the “TPG Entities”), certain Coors family trusts and the Adolph Coors Foundation (the “Coors Family Stockholders”), Clayton, Dubilier & Rice Fund V Limited Partnership (the “CD&R Fund”) and Old Town, S.A. (“Old Town”), (“Old Town” and together with the TPG Entities, the Coors Family Stockholders, the Adolph Coors Foundation, and the CD&R Fund, the named therein the "Selling Stockholders"). In connection with the offering, the Company repurchased approximately 23.9 million shares at $8.38 per share resulting in aggregate purchase price of $200 million (the "Share Repurchase"). The Share Repurchase was funded with a combination of cash on hand and borrowings under the Company’s revolving credit facility. After these transactions the shares outstanding held by the Selling Stockholders decreased from approximately 35% to approximately 23%.
• During 2013, prior to the November secondary, the Selling Stockholders sold 15 million, 15 million and 28 million shares of common stock in separate secondary public offerings at prices of $7.00, $7.73 and $8.45 per share, respectively. The shares outstanding held by the Selling Stockholders in these offerings decreased from approximately 53% at December 31, 2012 to approximately 35%.

Table of Contents RESULTS OF OPERATIONS
Segment Information
The Company reports its results in two business segments: paperboard packaging and flexible packaging.
2013 COMPARED WITH 2012
Net Sales
The components of the change in Net Sales by segment are as follows:
Paperboard Packaging
The Company’s Net Sales from paperboard packaging in 2013 increased by $227.3 million , or 6.3% , to $3,844.3 million from $3,617.0
million in 2012 as a result of the European acquisitions, new consumer product business and open market sales. This increase was partially offset by lower organic volume due to the continuing impact of general market conditions in which volume was down in dry foods, cereal and global beverage. Unfavorable pricing due to deflationary cost pass-throughs and unfavorable currency exchange rate changes, primarily in Japan, also negatively impacted Net Sales.
23
Year Ended December 31,
In millions 2013 2012 2011
NET SALES:
Paperboard Packaging $ 3,844.3 $ 3,617.0 $ 3,580.3 Flexible Packaging 633.8 720.1 626.0 Total $ 4,478.1 $ 4,337.1 $ 4,206.3
INCOME (LOSS) FROM OPERATIONS:
Paperboard Packaging $ 402.2 $ 417.3 $ 361.3 Flexible Packaging (1.3 ) (24.3 ) (98.8 )
Corporate (59.3 ) (70.6 ) (72.2 )
Total $ 341.6 $ 322.4 $ 190.3
In millions
Year Ended December 31,
2013 2012 Increase Percent Change
Paperboard Packaging $ 3,844.3 $ 3,617.0 $ 227.3 6.3 %
Flexible Packaging 633.8 720.1 (86.3 ) (12.0 )%
Total $ 4,478.1 $ 4,337.1 $ 141.0 3.3 %
Year Ended December 31,
Variances In millions 2012 Price Volume/Mix Exchange Total 2013
Paperboard Packaging $ 3,617.0 $ (21.9 ) $ 270.4 $ (21.2 ) $ 227.3 $ 3,844.3 Flexible Packaging 720.1 0.4 (85.9 ) (0.8 ) (86.3 ) 633.8 Total $ 4,337.1 $ (21.5 ) $ 184.5 $ (22.0 ) $ 141.0 $ 4,478.1

Table of Contents
Flexible Packaging
The Company’s Net Sales from flexible packaging in 2013 decreased by $ (86.3) million , or (12.0)% , to $ 633.8 million from $ 720.1 million in 2012. The decrease is due to internalization as more paper was consumed internally, lower organic volume/mix due to market softness in certain agriculture sectors, construction and other industrial sectors and the sale of the flexible plastics business.
Income (Loss) from Operations
(a) Percentage calculation not meaningful.
The components of the change in Income (Loss) from Operations by segment are as follows:
Paperboard Packaging
The Company’s Income from Operations from paperboard packaging in 2013 decreased by $(15.1) million , or (3.6)% , to $402.2 million
from $417.3 million in 2012. This resulted from higher costs due to inflation, the lower pricing, the lower volume in global beverage markets, higher integration costs, and unfavorable currency exchange rates, primarily in Japan. These decreases were partially offset by cost savings through continuous improvement programs and manufacturing initiatives and the volume from the European Acqusitions. The inflation was primarily related to higher energy costs ($23.7 million), wood ($11.6 million), corrugated cases ($3.9 million), freight ($3.6 million) labor and benefits ($3.4 million), chemical based inputs ($2.3 million) and other costs ($5.1 million). These higher costs were partially offset by lower secondary fiber ($15.9 million) and inks and coatings ($3.0 million).
Flexible Packaging
The Company’s Loss from Operations from flexible packaging in 2013 was $1.3 million compared to Loss from Operations of $24.3 million in 2012 primarily as a result of the gain on the sale of the flexible plastics business and improved performance due to synergies and cost savings through continuous improvement programs. These increases were offset by inflation, shutdown costs in Brampton, and higher production costs at New Philadelphia, OH. The inflation was related to externally purchased paper ($7.9 million), labor and benefits ($5.5 million), secondary fiber ($1.1 million), chemical-based inputs, primarily resin ($1.0 million), freight ($0.7 million) and other inflation ($2.3 million).
24
Year Ended December 31,
In millions 2013 2012 Increase (Decrease) Percent Change
Paperboard Packaging $ 402.2 $ 417.3 $ (15.1 ) (3.6 )%
Flexible Packaging (1.3 ) (24.3 ) 23.0 (a) Corporate (59.3 ) (70.6 ) 11.3 (a) Total $ 341.6 $ 322.4 $ 19.2 6.0 %
Year Ended December 31,
Variances In millions 2012 Price Volume/Mix Inflation Exchange Other (a) Total 2013
Paperboard Packaging $ 417.3 $ (21.9 ) $ (12.6 ) $ (34.7 ) $ (10.7 ) $ 64.8 $ (15.1 ) $ 402.2 Flexible Packaging (24.3 ) 0.4 (0.6 ) (18.5 ) (1.3 ) 43.0 23.0 (1.3 )
Corporate (70.6 ) — — 1.3 (0.4 ) 10.4 11.3 (59.3 )
Total $ 322.4 $ (21.5 ) $ (13.2 ) $ (51.9 ) $ (12.4 ) $ 118.2 $ 19.2 $ 341.6 (a) Includes the Company’s cost reduction initiatives, combination-related expenses and sale of businesses.

Table of Contents
Corporate
The Company’s Loss from Operations from corporate was $59.3 million in 2013 compared to $70.6 million in 2012. The decrease was due to lower compensation costs and lower acquisition/integration costs recorded in corporate during 2013.
INTEREST EXPENSE, NET, INCOME TAX EXPENSE, AND EQUI TY INCOME OF UNCONSOLIDATED ENTITIES
Interest Expense, Net
Interest Expense, Net decreased by $9.2 million to $101.9 million in 2013 from $111.1 million in 2012. Interest Expense, Net decreased due to lower total debt, and lower rates on the Company’s debt. As of December 31, 2013, approximately 44% of the Company’s total debt was subject to floating interest rates.
Income Tax Expense
During 2013, the Company recognized Income Tax Expense of $67.4 million on Income before Income Taxes and Equity Income of Unconsolidated Entities of $212.6 million . During 2012, the Company recognized Income Expense of $82.5 million on Income before Income Taxes and Equity Income of Unconsolidated Entities of $200.3 million . The effective tax rate for 2013 was different than the statutory rate primarily as a result of the Company's determination, based on additional guidance published by the Internal Revenue Service, that it is more likely than not that certain excise tax credit refunds received in 2009 are excludable from taxable income. As a result, the Company will amend its 2009 federal and state income tax returns which will result in an increase in our overall net operating loss carryforward. Other differences in the effective tax rate and the statutory tax rate include the mix and levels between foreign and domestic earnings including losses in jurisdictions with full valuation allowances, as well as the effects of certain discrete tax items. The Company has NOLs of approximately $892.3 million for U.S. federal income tax purposes, which may be used to offset future taxable income.
Equity Income of Unconsolidated Entities
Equity Income of Unconsolidated Entities was $1.5 million in 2013 and $2.3 million in 2012 and is related to the Company’s equity investment in the joint venture, Rengo Riverwood Packaging, Ltd.
25

Table of Contents
2012 COMPARED WITH 2011
Net Sales
The components of the change in Net Sales by segment are as follows:
Paperboard Packaging
The Company’s Net Sales from paperboard packaging in 2012 increased by $36.7 million , or 1.0% , to $3,617.0 million from $3,580.3
million in 2011 as a result of the higher consumer products volume and higher pricing for consumer and beverage products. The higher consumer products volume was due to the impact of new product sales and the Sierra Pacific Packaging ("Sierra") acquisition in 2011, partially offset by lower organic volume due to the continuing impact of general market conditions in which volume was down primarily in soap and cleaners, cereal and frozen pizza. The higher pricing for both consumer products and beer was due to inflationary cost pass throughs. These increases were partially offset by lower organic volume for beverage, containerboard and open market board sales of CRB and CUK. Unfavorable currency exchange rate changes, primarily in Europe, also negatively impacted Net Sales.
Flexible Packaging
The Company’s Net Sales from flexible packaging in 2012 increased by $94.1 million , or 15.0% , to $720.1 million from $626.0 million in 2011. The increase was as a result of the impact of the DNK combination and the higher pricing, partially offset by the lower organic volume/mix due to market softness in certain agriculture sectors, construction and other industrial sectors.
26
In millions
Year Ended December 31,
2012 2011 Increase Percent Change
Paperboard Packaging $ 3,617.0 $ 3,580.3 $ 36.7 1.0 %
Flexible Packaging 720.1 626.0 94.1 15.0 %
Total $ 4,337.1 $ 4,206.3 $ 130.8 3.1 %
Year Ended December 31,
Variances In millions 2011 Price Volume/Mix Exchange Total 2012
Paperboard Packaging $ 3,580.3 $ 12.9 $ 38.5 $ (14.7 ) $ 36.7 $ 3,617.0 Flexible Packaging 626.0 4.3 89.8 — 94.1 720.1 Total $ 4,206.3 $ 17.2 $ 128.3 $ (14.7 ) $ 130.8 $ 4,337.1

Table of Contents
Income (Loss) from Operations
The components of the change in Income (Loss) from Operations by segment are as follows:
Note:
Paperboard Packaging
The Company’s Income from Operations from paperboard packaging in 2012 increased by $56.0 million , or 15.5% , to $417.3 million from
$361.3 million in 2011. This was primarily a result of cost savings through continuous improvement programs and manufacturing initiatives primarily focused on maximizing productivity and minimizing waste in the production cycle, the higher pricing, and the higher volume primarily due to new business. These increases were partially offset by higher costs due to inflation, the lower organic volume in beverage products, start-up costs related to new and relocated business, and unfavorable currency exchange rates, primarily in Europe. The inflation was primarily related to higher labor and benefits ($21.1 million), and freight ($17.7 million), chemical-based input ($16.9 million), wood ($15.1 million), and other costs ($3.5 million). These higher costs were partially offset by lower secondary fiber ($32.5 million), energy costs ($20.0 million) mainly due to the price of natural gas, and externally purchased paperboard ($2.1 million). The Company also incurred higher incentive compensation expense compared to the prior year. During the third quarter 2011, the Company took down time in its converting facilities to manage inventory due to market softness, resulting in approximately $5 million of higher costs due to lower absorption. Additionally in 2011, the Company recorded $8.5 million for severance expense and accelerated depreciation for assets that will be removed from service before the end of their lives due to the closure of the Cincinnati, OH facility and the planned closure of the LaPorte, IN facilities.
Flexible Packaging
The Company’s Loss from Operations from flexible packaging in 2012 was $24.3 million compared to Loss from Operations of $98.8 million in 2011 primarily as a result of the non-cash goodwill impairment charge of $96.3 million recorded in 2011, as well as the higher inflation, and the lower organic volume. The inflation was related to externally purchased paper ($8.7 million), labor and benefits ($5.9 million), chemical-based inputs, primarily resin ($4.1 million), other inflation ($2.0 million) and freight ($1.7 million). Additionally, the Company recorded approximately $16 million for integration activities and for severance expense due to the closure of the Twinsburg, OH bag facility. The higher costs were partially offset by the higher pricing and cost savings through continuous improvement, and the impact of the business combination.
Corporate
27
Year Ended December 31,
In millions 2012 2011 Increase Percent Change
Paperboard Packaging $ 417.3 $ 361.3 $ 56.0 15.5 %
Flexible Packaging (24.3 ) (98.8 ) 74.5 (a) Corporate (70.6 ) (72.2 ) 1.6 (a) Total $ 322.4 $ 190.3 $ 132.1 69.4 %
(a) Percentage calculation not meaningful.
Year Ended December 31,
Variances In millions 2011 Price Volume/Mix Inflation Exchange Other(a) Total 2012
Paperboard Packaging $ 361.3 $ 12.9 $ 11.1 $ (19.7 ) $ (7.1 ) $ 58.8 $ 56.0 $ 417.3 Flexible Packaging (98.8 ) 4.3 5.6 (22.4 ) 0.3 86.7 74.5 (24.3 )
Corporate (72.2 ) — — (1.0 ) 5.3 (2.7 ) 1.6 (70.6 )
Total $ 190.3 $ 17.2 $ 16.7 $ (43.1 ) $ (1.5 ) $ 142.8 $ 132.1 $ 322.4
(a) Includes the Company’s cost reduction initiatives, the goodwill impairment charge, and merger-related expenses.

Table of Contents
The Company’s Loss from Operations from corporate was $70.6 million in 2012 compared to $72.2 million in 2011. The change was primarily due to the favorable impact of the foreign exchange rates from the Company's derivative instruments, which was partially offset by fees related to the acquisitions and the secondary offering, higher general corporate costs and higher inflation for labor and benefits. Additionally, in the fourth quarter 2011, the Company recorded non-cash asset impairment charges of $4.8 million related to assets held for sale and severance expense of $4.3 million related to a workforce reduction announced in October 2011.
INTEREST EXPENSE, NET, INCOME TAX EXPENSE, AND EQUI TY INCOME OF UNCONSOLIDATED ENTITIES
Interest Expense, Net
Interest Expense, Net decreased by $33.8 million to $111.1 million in 2012 from $144.9 million in 2011. Interest Expense, Net decreased due to lower total debt, and lower rates on the Company’s debt. As of December 31, 2012, approximately 50% of the Company’s total debt was subject to floating interest rates.
Income Tax Expense
During 2012, the Company recognized Income Tax Expense of $82.5 million on Income before Income Taxes and Equity Income of Unconsolidated Entities of $200.3 million. During 2011, the Company recognized Income Tax Benefit of $229.8 million on Income before Income Taxes and Equity Income of Unconsolidated Entities of $43.3 million. The effective tax rate for 2012 was different than the statutory rate primarily due to the mix and levels between foreign and domestic earnings including losses in jurisdictions with full valuation allowances, as well as the effects of certain discrete tax items. Income Tax Benefit for 2011 primarily relates to the non-cash benefit of $265.2 million associated with the release of the Company's U.S. federal and a substantial portion of its state deferred tax asset valuation allowance. The valuation allowance release was based on the Company's assessment that it is more likely than not that the Company's U.S. federal and a substantial portion of its state deferred tax assets will be realized.
Equity Income of Unconsolidated Entities
Equity Income of Unconsolidated Entities was $2.3 million in 2012 and $2.1 million in 2011 and is related to the Company’s equity investment in the joint venture, Rengo Riverwood Packaging, Ltd.
FINANCIAL CONDITION, LIQUIDITY AND CAPITAL RESOURCE S
The Company broadly defines liquidity as its ability to generate sufficient funds from both internal and external sources to meet its obligations and commitments. In addition, liquidity includes the ability to obtain appropriate debt and equity financing and to convert into cash those assets that are no longer required to meet existing strategic and financial objectives. Therefore, liquidity cannot be considered separately from capital resources that consist of current or potentially available funds for use in achieving long-range business objectives and meeting debt service commitments.
Cash Flows
Net cash provided by operating activities in 2013 totaled $458.0 million , compared to $468.6 million in 2012. The decrease was due
primarily to lower than expected operating results, including higher inventory as a result of lower than expected sales, higher payments for income taxes, and incentive compensation; partially offset by lower interest payments due to the lower average interest rates on the Company's debt. Pension contributions in 2013 and 2012 were $ 51.5 million and $ 55.1 million , respectively.
28
Years Ended December 31,
In millions 2013 2012
Net Cash Provided by Operating Activities $ 458.0 $ 468.6 Net Cash Used in Investing Activities $ (144.4 ) $ (294.0 )
Net Cash Used in Financing Activities $ (311.1 ) $ (396.1 )

Table of Contents
Net cash used in investing activities in 2013 totaled $144.4 million , compared to $294.0 million in 2012. The change was primarily due to the 2012 European Acquisitions of $118.1 million and current year proceeds from the sale of assets of $73.5 million; partially offset by an increase in current year capital spending, primarily for improving process capabilities.
Net cash used in financing activities in 2013 totaled $311.1 million , compared to $396.1 million used in financing activities in 2012. Current
year activities include net payments under revolving credit facilities of $8.8 million and payments on debt of $71.3 million . The Company entered into Amendment No. 2 to the existing Credit Agreement to extend the maturity dates of its existing revolving credit and term loan facilities, to add revolving credit facilities under which borrowings will be made in Euros, Pound Sterling, and the Yen, and to amend certain other terms of the the agreement. In addition, the Company completed its debt offering of $425 million aggregated principal amount of 4.75% senior notes due 2021 in a registered public offering and used the net proceeds, together with cash on hand, to refinance, through a redemption, all $425 million of the 9.5% senior notes due 2017. The Company incurred approximately $30 million in fees and expenses related to the senior notes refinancing and amendment activities. During the fourth quarter of 2013, using cash on hand and borrowings under the Company's revolving credit facility, the Company repurchased and retired approximately $200 million or 23.9 million shares of its common stock at $8.38 per share. In the prior year, the Company entered into an amended and restated Credit Agreement, and approximately $1.53 billion was drawn at closing which, when combined with cash on hand, was used to repay the outstanding term loans due in May 2014 which totaled $1.68 billion. The Company incurred approximately $22 million in fees and expenses related to the refinancing activities. Additionally, during the fourth quarter of 2012, the Company entered into an amendment to the Credit Agreement to provide for an incremental term loan of $300 million which was used to repurchase and retire approximately 49.2 million shares of its common stock at $6.10 per share.
Liquidity and Capital Resources
The Company's liquidity needs arise primarily from debt service on its indebtedness and from the funding of its capital expenditures, ongoing operating costs and working capital. Principal and interest payments under the term loan facilities and the revolving credit facility, together with principal and interest payments on the Company's 7.875% Senior Notes due 2018 and the 4.75% Senior Notes due 2021 (the “Notes”), represent significant liquidity requirements for the Company. Based upon current levels of operations, anticipated cost savings and expectations as to future growth, the Company believes that cash generated from operations, together with amounts available under its revolving credit facility and other available financing sources, will be adequate to permit the Company to meet its debt service obligations, necessary capital expenditure program requirements and ongoing operating costs and working capital needs, although no assurance can be given in this regard. The Company's future financial and operating performance, ability to service or refinance its debt and ability to comply with the covenants and restrictions contained in its debt agreements (see “Covenant Restrictions”) will be subject to future economic conditions, including conditions in the credit markets, and to financial, business and other factors, many of which are beyond the Company's control, and will be substantially dependent on the selling prices and demand for the Company's products, raw material and energy costs, and the Company's ability to successfully implement its overall business and profitability strategies.
As of December 31, 2013, the Company had approximately $892.3 million of NOLs for U.S. federal income tax purposes. These NOLs generally may be used by the Company to offset taxable income earned in subsequent taxable years. However, the Company’s ability to use these NOLs to offset its future taxable income may be subject to significant limitations as a result of certain shifts in ownership due to direct or indirect transfers of the Company’s common stock by one or more five percent stockholders, or issuance or redemption of the Company’s common stock, which, when taken together with previous changes in ownership of the Company’s common stock, constitute an ownership change under Section 382 of the Internal Revenue Code. Imposition of any such limitation of the use of NOLs could have an adverse effect on the Company’s future after tax free cash flow.
As of December 31, 2013, the Company had $44.2 million of cash in foreign jurisdictions for which deferred taxes in the U.S. have not been
provided as earnings have been deemed indefinitely reinvested outside the U.S.
The Company has entered into various factoring arrangements, principally at the request of customers through supply chain financing programs, which qualify for sale accounting in accordance with the Transfers and Servicing topic of the Financial Accounting Standards Board ("FASB") Accounting Standards Codification ("the FASB Codification"). As of December 31, 2013 and 2012, the Company had received incremental proceeds of approximately $41 million and $11 million, respectively, from the
29

Table of Contents factoring arrangements. Amounts transferred subject to continuing involvement at December 31, 2013 and 2012 were approximately $20 million and $0 million, respectively.
Covenant Restrictions
The Credit Agreement and the Indenture limit the Company's ability to incur additional indebtedness. Additional covenants contained in the Credit Agreement and the Indenture, among other things, restrict the ability of the Company to dispose of assets, incur guarantee obligations, prepay other indebtedness, make dividends and other restricted payments, create liens, make equity or debt investments, make acquisitions, modify terms of the indenture under which the Notes are issued, engage in mergers or consolidations, change the business conducted by the Company and its subsidiaries, and engage in certain transactions with affiliates. Such restrictions, together with the disruptions in the credit markets, could limit the Company's ability to respond to changing market conditions, fund its capital spending program, provide for unexpected capital investments or take advantage of business opportunities.
Under the terms of the Credit Agreement, the Company must comply with a maximum Consolidated Total Leverage Ratio covenant and a minimum Consolidated Interest Expense Ratio covenant. The Credit Agreement, which contains the definitions of these covenants, was filed as an exhibit to the Company's Form 8-K filed on March 22, 2012. The Company must maintain a maximum Consolidated Total Leverage Ratio of less than the following:
The Company must also comply with a minimum consolidated interest expense ratio of the following:
Minimum Consolidated Interest Expense Ratio: 3.00 to 1.00
The Company's management believes that presentation of the Consolidated Total Leverage Ratio, Consolidated Interest Expense Ratio and
Credit Agreement EBITDA herein provides useful information to investors because borrowings under the Credit Agreement are a key source of the Company's liquidity, and the Company's ability to borrow under the Credit Agreement is dependent on, among other things, its compliance with the financial ratio covenants. Any failure by the Company to comply with these financial covenants could result in an event of default, absent a waiver or amendment from the lenders under such agreement, in which case the lenders may be entitled to declare all amounts owed to be due and payable immediately.
Credit Agreement EBITDA is a financial measure not calculated in accordance with U.S. GAAP, and is not a measure of net income, operating income, operating performance or liquidity presented in accordance with U.S. GAAP. Credit Agreement EBITDA should be considered in addition to results prepared in accordance with U.S. GAAP, but should not be considered a substitute for, or superior to, U.S. GAAP results. In addition, Credit Agreement EBITDA may not be comparable to EBITDA or similarly titled measures utilized by other companies because other companies may not calculate Credit Agreement EBITDA in the same manner as the Company does.
The calculations of the components of the Consolidated Total Leverage Ratio and Consolidated Interest Expense Ratio for and as of the period
ended December 31, 2013 are listed below:
30
Fiscal Quarter Consolidated Total Leverage Ratio
March 31, 2012 - December 31, 2012 4.75 to 1.00
March 31, 2013 - December 31, 2013 4.50 to 1.00
March 31, 2014 and thereafter 4.25 to 1.00

Table of Contents
At December 31, 2013, the Company was in compliance with the Consolidated Total Leverage Ratio covenant in the Credit Agreement and the ratio was as follows:
Consolidated Total Leverage Ratio: 3.19 to 1.00 At December 31, 2013, the Company was in compliance with the minimum Consolidated Interest Expense Ratio covenant in the Credit
Agreement and the ratio was as follows:
Consolidated Interest Expense Ratio: 7.21 to 1.00
As of December 31, 2013, the Company's credit rating remained BB+ by Standard & Poor's and improved to Ba2 by Moody's Investor
Services. Both Standard & Poor's and Moody's Investor Services' ratings on the Company included a stable outlook. If inflationary pressures on key inputs continue, or depressed selling prices, lower sales volumes, increased operating costs or other factors
have a negative impact on the Company's ability to increase its profitability, the Company may not be able to maintain its compliance with the financial covenants in its Credit Agreement. The Company's ability to comply in future periods with the financial covenants in the Credit Agreement will depend on its ongoing financial and operating performance, which in turn will be subject to economic conditions and to financial, business and other factors, many of which are beyond the Company's control, and will be substantially dependent on the selling prices for the Company's products, raw material and energy costs, and the Company's ability to successfully implement its overall business strategies, and meet its profitability objective. If a violation of the financial covenants or any of the other covenants occurred, the Company would attempt to obtain a waiver or an amendment from its lenders, although no assurance can be given that the Company would be successful in this regard. The Credit Agreement
31
Twelve Months Ended
In millions December 31, 2013
Net Income $ 146.7 Income Tax Expense 67.4 Interest Expense, Net 95.6 Depreciation and Amortization including Debt Issuance Costs 283.7 Equity Income of Unconsolidated Entities, Net of Dividends 0.1 Other Non-Cash Charges 57.4 Other Non-Recurring/Extraordinary/Unusual Items 38.4 Credit Agreement EBITDA $ 689.3
In millions As of December 31, 2013
Short-Term Debt $ 77.4 Long-Term Debt 2,176.2 Total Debt $ 2,253.6 Less: Cash and Cash Equivalents 52.2
Consolidated Indebtedness $ 2,201.4
In millions Twelve Months Ended
December 31, 2013
Interest Expense, Net $ 101.9 Less: Amortization of Financing Costs 6.3
Consolidated Interest Expense, Net $ 95.6

Table of Contents and the Indenture governing the Notes have certain cross-default or cross-acceleration provisions; failure to comply with these covenants in any agreement could result in a violation of such agreement which could, in turn, lead to violations of other agreements pursuant to such cross-default or cross-acceleration provisions. If an event of default occurs, the lenders are entitled to declare all amounts owed to be due and payable immediately. The Credit Agreement is collateralized by substantially all of the Company's domestic assets.
Capital Investment
The Company’s capital investment in 2013 was $209.2 million compared to $203.3 million in 2012. During 2013, the Company had capital spending of $176.0 million for improving process capabilities, $21.4 million for capital spares and $11.8 million for manufacturing packaging machinery.
32

Table of Contents
Environmental Matters
Some of the Company’s current and former facilities are the subject of environmental investigations and remediations resulting from historical operations and the release of hazardous substances or other constituents. Some current and former facilities have a history of industrial usage for which investigation and remediation obligations may be imposed in the future or for which indemnification claims may be asserted against the Company. Also, potential future closures or sales of facilities may necessitate further investigation and may result in future remediation at those facilities. The Company has established reserves for those facilities or issues where liability is probable and the costs are reasonably estimable.
For further discussion of the Company’s environmental matters, see Note 13 in the Notes to Consolidated Financial Statements included herein under “Item 8., Financial Statements and Supplementary Data.”
Contractual Obligations and Commitments
A summary of our contractual obligations and commitments as of December 31, 2013 is as follows:
Notes: (a) Purchase obligations primarily consist of commitments related to pine pulpwood, wood chips, and wood processing and
handling.
International Operations
For 2013, before intercompany eliminations, net sales from operations outside of the U.S. represented approximately 15% of the Company’s
net sales. The Company’s revenues from export sales fluctuate with changes in foreign currency exchange rates. At December 31, 2013, approximately 15% of the Company’s total assets were denominated in currencies other than the U.S. dollar. The Company has significant operations in countries that use the British pound sterling, the Australian dollar, the Japanese yen or the euro as their functional currencies. The effect of changes in the U.S. dollar exchange rate against these currencies produced a net currency translation adjustment loss of $13.6 million, which was recorded as an adjustment to Shareholders’ Equity for the year ended December 31, 2013. The magnitude and direction of this adjustment in the future depends on the relationship of the U.S. dollar to other currencies. The Company pursues a currency hedging program in order to limit the impact of foreign currency exchange fluctuations on financial results. See “Financial Instruments” below.
The functional currency of the Company’s international subsidiaries is the local currency for the country in which the subsidiaries own their primary assets. The translation of the applicable currencies into U.S. dollars is performed for balance sheet accounts using current exchange rates in effect at the balance sheet date and for revenue and expense accounts using a weighted average
33
Payments Due by Period
In millions Total Less than
1 Year 1-3 Years 3-5 Years More than
5 Years
Long-Term Debt $ 2,248.0 $ 75.0 $ 169.1 $ 1,575.8 $ 428.1 Operating Leases 134.1 37.1 50.7 27.4 18.9 Capital Leases 5.6 2.3 2.5 0.8 — Interest Payable 521.4 78.0 183.7 164.2 95.5 Purchase Obligations (a) 697.6 127.2 170.2 127.0 273.2 Pension Funding 50.0 50.0 — — — Total Contractual Obligations (b) $ 3,656.7 $ 369.6 $ 576.2 $ 1,895.2 $ 815.7
(b) Certain amounts included in this table are based on management’s estimates and assumptions about these obligations. Because these estimates and assumptions are necessarily subjective, the obligations the Company will actually pay in the future periods may vary from those reflected in the table.

Table of Contents exchange rate during the period. Any related translation adjustments are recorded directly to Shareholders’ Equity. Gains and losses on foreign currency transactions are included in Other Income, Net for the period in which the exchange rate changes.
Financial Instruments
The Company pursues a currency hedging program which utilizes derivatives to limit the impact of foreign currency exchange fluctuations on its consolidated financial results. Under this program, the Company has entered into forward exchange contracts in the normal course of business to hedge certain foreign currency denominated transactions. Realized and unrealized gains and losses on these forward contracts are included in the measurement of the basis of the related foreign currency transaction when recorded. The Company also pursues a hedging program that utilizes derivatives designed to manage risks associated with future variability in cash flows and price risk related to future energy cost increases. Under this program, the Company has entered into natural gas swap contracts to hedge a portion of its natural gas usage for 2014. Realized gains and losses on these contracts are included in the financial results concurrently with the recognition of the commodity consumed. The Company uses interest rate swaps to manage interest rate risks on future interest payments caused by interest rate changes on its variable rate term loan facility. The Company does not hold or issue financial instruments for trading purposes. See “Item 7A., Quantitative and Qualitative Disclosure About Market Risk.” CRITICAL ACCOUNTING POLICIES
The preparation of financial statements in conformity with U.S. GAAP requires management to make estimates and assumptions that affect the reported amounts of assets and liabilities at the date of the financial statements and the reported amounts of net sales and expenses during the reporting period. Actual results could differ from these estimates, and changes in these estimates are recorded when known. The critical accounting policies used by management in the preparation of the Company’s consolidated financial statements are those that are important both to the presentation of the Company’s financial condition and results of operations and require significant judgments by management with regard to estimates used. The critical judgments by management relate to pension benefits, retained insurable risks, future cash flows associated with impairment testing for goodwill and long-lived assets, and deferred income taxes.
• Pension Benefits
The Company sponsors defined benefit pension plans (the “Plans”) for eligible employees in North America and certain international locations. The funding policy for the qualified defined benefit plans is to, at a minimum, contribute assets as required by the Internal Revenue Code Section 412. Nonqualified U.S. plans providing benefits in excess of limitations imposed by the U.S. income tax code are not funded.
The Company’s pension expense for defined benefit pension plans was $39.2 million in 2013 compared with $42.5 million in 2012. Pension expense is calculated based upon a number of actuarial assumptions applied to each of the defined benefit plans. The weighted average expected long-term rate of return on pension fund assets used to calculate pension expense was 7.60% and 7.90% in 2013 and 2012, respectively. The expected long-term rate of return on pension assets was determined based on several factors, including historical rates of return, input from our pension investment consultants and projected long-term returns of broad equity and bond indices. The Company evaluates its long-term rate of return assumptions annually and adjusts them as necessary.
The Company determined pension expense using both the fair value of assets and a calculated value that averages gains and losses over a period of years. Investment gains or losses represent the difference between the expected and actual return on assets. As of December 31, 2013, the net actuarial loss was $154.8 million. These net losses may increase future pension expense if not offset by (i) actual investment returns that exceed the assumed investment returns, or (ii) other factors, including reduced pension liabilities arising from higher discount rates used to calculate pension obligations, or (iii) other actuarial gains, including whether such accumulated actuarial losses at each measurement date exceed the “corridor” determined under the Compensation — Retirement Benefits topic of the FASB Codification.
The discount rate used to determine the present value of future pension obligations at December 31, 2013 was based on a yield curve constructed from a portfolio of high-quality corporate debt securities with maturities ranging from 1 year to 30 years. Each year’s expected future benefit payments were discounted to their present value at the appropriate yield curve rate thereby generating
34

Table of Contents the overall discount rate for the Company’s pension obligations. The weighted average discount rate used to determine the pension obligations was 4.86% and 4.20% in 2013 and 2012, respectively.
The Company’s pension expense is estimated to be approximately $6 million in 2014. The estimate is based on a weighted average expected long-term rate of return of 7.76%, a weighted average discount rate of 4.86% and other assumptions. Pension expense beyond 2014 will depend on future investment performance, the Company’s contribution to the plans, changes in discount rates and other factors related to covered employees in the plans.
If the discount rate assumptions for the Company’s U.S. plans were reduced by 0.25%, pension expense would increase by approximately $4 million and the December 31, 2013 projected benefit obligation would increase by about $30 million.
The fair value of assets in the Company’s plans was $1,065.7 million at December 31, 2013 and $921.3 million at December 31, 2012. The projected benefit obligations exceed the fair value of plan assets by $153.2 million and $367.6 million as of December 31, 2013 and 2012, respectively. The accumulated benefit obligation (“ABO”) exceeded plan assets by $141.7 million at the end of 2013. At the end of 2012, the ABO exceeded the fair value of plan assets by $351.1 million.
• Retained Insurable Risks
The Company is self-insured for certain losses relating to workers’ compensation claims and employee medical and dental benefits. Provisions for expected losses are recorded based on the Company’s estimates, on an undiscounted basis, of the aggregate liabilities for known claims and estimated claims incurred but not reported. The Company has purchased stop-loss coverage or insurance with deductibles in order to limit its exposure to significant claims. The Company also has an extensive safety program in place to minimize its exposure to workers’compensation claims. Self-insured losses are accrued based upon estimates of the aggregate uninsured claims incurred using certain actuarial assumptions, loss development factors followed in the insurance industry and historical experience.
• Goodwill The Company evaluates goodwill for potential impairment annually as of October 1, as well as whenever events or changes in circumstances
suggest that the fair value of a reporting unit may no longer exceed its carrying amount. Potential impairment of goodwill is measured at the reporting unit level by comparing the reporting unit’ s carrying amount, including goodwill, to the estimated fair value of the reporting unit. As of October 1, 2013, the Company had seven reporting units, of which six of the units had goodwill.
The calculated fair value of each reporting unit is determined by utilizing a discounted cash flow analysis based on the Company’s forecasts discounted using a weighted average cost of capital and market indicators of terminal year cash flows based upon a multiple of EBITDA.
In determining fair value, management relies on and considers a number of factors, including but not limited to, operating results, business plans, economic projections, forecasts including anticipated future cash flows, and market data and analysis, including market capitalization. Fair value determinations are sensitive to changes in the factors described above. There are inherent uncertainties related to these factors and judgments in applying them to the analysis of potential goodwill impairment.
The Company performed its annual goodwill impairment test as of October 1, 2013 and concluded that the fair value of its reporting units
exceeded their carrying values including goodwill and, therefore, that goodwill was not impaired. The variability of the assumptions that management uses to perform the goodwill impairment test depends on a number of conditions,
including uncertainty about future events and cash flows. Accordingly, the Company’s accounting estimates may materially change from period to period due to changing market factors. If the Company had used other assumptions and estimates or if different conditions occur in future periods, future operating results could be materially impacted.
The assumptions used in the goodwill impairment testing process could be adversely impacted by certain of the risks discussed in “Item 1A.,
Risk Factors” and thus could result in future goodwill impairment charges.
35

Table of Contents
• Recovery of Long-Lived Assets
The Company reviews long-lived assets (including property, plant and equipment and intangible assets) for impairment whenever events or changes in circumstances indicate that the carrying amount of such long-lived assets may not be fully recoverable by undiscounted cash flows. Measurement of the impairment loss, if any, is based on the fair value of the asset, which is determined by an income, cost or market approach. The Company evaluates the recovery of its long-lived assets by analyzing operating results and considering significant events or changes in the business environment that may have triggered impairment.
• Deferred Income Taxes and Potential Assessments
According to the Income Taxes topic of the FASB Codification, a valuation allowance is required to be established or maintained when, based on currently available information and other factors, it is more likely than not that all or a portion of a deferred tax asset will not be realized. The FASB Codification provides important factors in determining whether a deferred tax asset will be realized, including whether there has been sufficient taxable income in recent years and whether sufficient income can reasonably be expected in future years in order to utilize the deferred tax asset. The Company has evaluated the need to maintain a valuation allowance for deferred tax assets based on its assessment of whether it is more likely than not that deferred tax benefits would be realized through the generation of future taxable income. Appropriate consideration was given to all available evidence, both positive and negative, in assessing the need for a valuation allowance. In determining whether a valuation allowance is required, many factors are considered, including the specific taxing jurisdiction, the carryforward period, reversals of existing taxable temporary differences, cumulative pretax book earnings, income tax strategies and forecasted earnings for the entities in each jurisidiction.
As of December 31, 2013, the Company has recorded a valuation allowance of $50.1 million against its net deferred tax assets in certain
foreign jurisdictions and against domestic deferred tax assets related to certain state net operating loss carryforwards and federal capital loss carryforwards. As of December 31, 2012, a total valuation allowance of $37.3 million was recorded. As of December 31, 2011, the Company recognized $265.2 million of Income Tax Benefit associated with the release of its U.S. federal deferred tax valuation allowance and a substantial portion of its state deferred tax valuation allowance resulting in a total valuation allowance recorded of $37.0 million.
As of December 31, 2013, the Company has only provided for deferred U.S. income taxes on $ 4.6 million of undistributed earnings related to the Company's equity investment in the joint venture, Rengo Riverwood Packaging, Ltd. The Company has not provided for deferred U.S. income taxes on approximately $ 8.1 million of undistributed earnings of international subsidiaries because of its intention to indefinitely reinvest these earnings outside the U.S. The determination of the amount of the unrecognized deferred U.S. income tax liability on these unremitted earnings is not practicable because of the complexities associated with the hypothetical calculation.
The Company records current liabilities for potential assessments. The accruals relate to uncertain tax positions in a variety of taxing jurisdictions and are based on what management believes will be the most likely outcome of these positions. These liabilities may be affected by changing interpretations of laws, rulings by tax authorities, or the expiration of the statute of limitations. NEW ACCOUNTING STANDARDS
For a discussion of recent accounting pronouncements impacting the Company, see Note 1 in the Notes to Consolidated Financial Statements included herein under “Item 8., Financial Statements and Supplementary Data.”
36

Table of Contents
BUSINESS OUTLOOK
Total capital investment for 2014 is expected to be between $185 million and $205 million and is expected to relate principally to the Company’s process capability improvements (approximately $165 million), acquiring capital spares (approximately $20 million), and producing packaging machinery (approximately $10 million).
The Company also expects the following in 2014:
37
• Depreciation and amortization between $275 million and $285 million.
• Interest expense of $90 million to $100 million, including approximately $5 million to $10 million of non-cash interest expense associated with amortization of debt issuance costs.
• Net debt reduction of approximately $350 million.
• Pension plan contributions of $40 million to $60 million.

Table of Contents
The Company does not trade or use derivative instruments with the objective of earning financial gains on interest or currency rates, nor does
it use leveraged instruments or instruments where there are no underlying exposures identified.
Interest Rates
The Company is exposed to changes in interest rates, primarily as a result of its short-term and long-term debt, which include both fixed and floating rate debt. The Company uses interest rate swap agreements effectively to fix the LIBOR rate on certain variable rate borrowings. At December 31, 2013, the Company had interest rate swap agreements with a notional amount of $560 million.
The table below sets forth interest rate sensitivity information related to the Company’s debt.
Long-Term Debt Principal Amount by Maturity-Average Interest Rate
(a) Includes Senior Notes with a face amount of $250.0 million.
Total Interest Rate Swaps-Notional Amount by Expiration-Average Swap Rate
38
ITEM 7A. QUANTITATIVE AND QUALITATIVE DISCLOSURE ABOUT MARKET RISK
Expected Maturity Date
In millions 2014 2015 2016 2017 2018 Thereafter Total
Fair Value
Total Debt Fixed Rate $ 13.1 $ — $ — $ 0.2 247.3 (a) $ 428.1 $ 688.7 $ 708.3 Average Interest Rate 10.15 % —% —% 1.55 % 7.88 % 4.73 % Variable Rate $ 61.9 $ 69.2 $ 99.9 $ 123.0 $ 1,205.3 $ — $ 1,559.3 $ 1,559.3
Average Interest Rate, spread range is .45% — .82% LIBOR +
Spread LIBOR +
Spread LIBOR +
Spread LIBOR +
Spread LIBOR +
Spread —
Expected Maturity Date
In millions 2014 2015 2016 2017 2018 Thereafter Total Fair Value
Interest Rate Swaps (Pay Fixed/Receive Variable)
Notional $ — $ — $ 560.0 $ — $ — $ — $ 560.0 $ (3.6 )
Average Pay Rate — — 0.75 —% — —
Average Receive Rate — — 1-Month LIBOR — — —

Table of Contents
Foreign Exchange Rates
The Company enters into forward exchange contracts to effectively hedge substantially all accounts receivable resulting from transactions denominated in foreign currencies. The purpose of these forward exchange contracts is to protect the Company from the risk that the eventual functional currency cash flows resulting from the collection of these accounts receivable will be adversely affected by changes in exchange rates. At December 31, 2013, multiple foreign currency forward exchange contracts existed, with maturities ranging up to three months. Those forward currency exchange contracts outstanding at December 31, 2013, when aggregated and measured in U.S. dollars at December 31, 2013 exchange rates, had net notional amounts totaling $32.5 million. The Company continuously monitors these forward exchange contracts and adjusts accordingly to minimize the exposure.
The Company also enters into forward exchange contracts to hedge certain other anticipated foreign currency transactions. The purpose of these contracts is to protect the Company from the risk that the eventual functional currency cash flows resulting from anticipated foreign currency transactions will be adversely affected by changes in exchange rates.
During the years ended December 31, 2013 and 2012, there were minimal amounts reclassified to earnings in connection with forecasted transactions that were no longer considered probable of occurring and there was no amount of ineffectiveness related to changes in the fair value of foreign currency forward contracts. Additionally, there were no amounts excluded from the measure of effectiveness during the years ended December 31, 2013 and 2012.
Foreign Exchange Rates Contractual Amount by Expected Maturity-Average Contractual Exchange Rate
Natural Gas Contracts
The Company has hedged a portion of its expected natural gas usage for 2014. The carrying amount and fair value of the natural gas swap
contracts is a net asset of $0.8 million as of December 31, 2013. Such contracts are designated as cash flow hedges and are accounted for by deferring the quarterly change in fair value of the outstanding contracts in Shareholders’ Equity. The resulting gain or loss is reclassified into Cost of Sales concurrently with the recognition of the commodity consumed. The ineffective portion of the swap contracts change in fair value, if any, would be recognized immediately in earnings.
39
December 31, 2013
In millions
Contract Amount Fair Value
FORWARD EXCHANGE AGREEMENTS:
Receive $US/Pay Yen $ 24.4 $ 1.5 Weighted average contractual exchange rate 98.70
Receive $US/Pay Euro $ 28.4 $ (0.3 )
Weighted average contractual exchange rate 1.37
Receive $US/Pay GBP $ 12.5 $ (0.3 )
Weighted average contractual exchange rate 1.61

Table of Contents
INDEX TO FINANCIAL STATEMENTS
40
ITEM 8. FINANCIAL STATEMENTS AND SUPPLEMENTARY DATA
Page
GRAPHIC PACKAGING HOLDING COMPANY
Consolidated Statements of Operations for each of the three years in the period ended December 31, 201 3 41
Consolidated Statements of Comprehensive Income for each of the three years in the period ended December 31, 2013 42
Consolidated Balance Sheets as of December 31, 2013 and 201 2 43
Consolidated Statements of Shareholders’ Equity for each of the three years in the period ended December 31, 201 3 44
Consolidated Statements of Cash Flows for each of the three years in the period ended December 31, 201 3 45
Notes to Consolidated Financial Statements 47
Reports of Independent Registered Public Accounting Firm 96

Table of Contents
GRAPHIC PACKAGING HOLDING COMPANY CONSOLIDATED STATEMENTS OF OPERATIONS
The accompanying notes are an integral part of the consolidated financial statements.
41
Year Ended December 31,
In millions, except per share amounts 2013 2012 2011
Net Sales $ 4,478.1 $ 4,337.1 $ 4,206.3 Cost of Sales 3,752.5 3,617.5 3,568.8 Selling, General and Administrative 384.3 378.1 342.4 Other Income, Net (13.4 ) (7.3 ) (2.7 )
Restructuring, Goodwill Impairment, and Other Special Charges, Net 13.1 26.4 107.5 Income from Operations 341.6 322.4 190.3 Interest Expense, Net (101.9 ) (111.1 ) (144.9 )
Loss on Modification or Extinguishment of Debt (27.1 ) (11.0 ) (2.1 )
Income before Income Taxes and Equity Income of Unconsolidated Entities 212.6 200.3 43.3 Income Tax (Expense) Benefit (67.4 ) (82.5 ) 229.8 Income before Equity Income of Unconsolidated Entities 145.2 117.8 273.1 Equity Income of Unconsolidated Entities 1.5 2.3 2.1 Net Income $ 146.7 $ 120.1 $ 275.2 Net (Income) Loss Attributable to Noncontrolling Interests (0.1 ) 2.5 1.7 Net Income Attributable to Graphic Packaging Holding Company $ 146.6 $ 122.6 $ 276.9
Net Income Per Share Attributable to Graphic Packaging Holding Company — Basic $ 0.42 $ 0.31 $ 0.74 Net Income Per Share Attributable to Graphic Packaging Holding Company — Diluted $ 0.42 $ 0.31 $ 0.73

Table of Contents
GRAPHIC PACKAGING HOLDING COMPANY CONSOLIDATED STATEMENTS OF COMPREHENSIVE INCOME
The accompanying notes are an integral part of the consolidated financial statements.
42
Year Ended December 31,
In millions 2013 2012 2011
Net Income $ 146.7 $ 120.1 $ 275.2 Other Comprehensive Income (Loss), Net of Tax:
Derivative Instruments 3.2 (0.6 ) 14.0 Currency Translation Adjustment (13.7 ) 0.6 (3.7 )
Pension Benefit Plans 127.6 (26.4 ) (80.4 )
Postretirement Benefit Plans 6.4 (2.7 ) 1.2 Total Other Comprehensive Income (Loss), Net of Tax 123.5 (29.1 ) (68.9 )
Total Comprehensive Income 270.2 91.0 206.3 Comprehensive (Income) Loss Attributable to Noncontrolling Interests (0.5 ) 2.4 1.8
Comprehensive Income Attributable to Graphic Packaging Holding Company $ 269.7 $ 93.4 $ 208.1

Table of Contents
GRAPHIC PACKAGING HOLDING COMPANY CONSOLIDATED BALANCE SHEETS
The accompanying notes are an integral part of the consolidated financial statements.
43
December 31,
In millions, except share amounts 2013 2012
ASSETS
Current Assets:
Cash and Cash Equivalents $ 52.2 $ 51.5 Receivables, Net 412.8 461.3 Inventories, Net 557.1 532.5 Deferred Income Tax Assets 171.3 139.3 Other Current Assets 38.8 18.4
Total Current Assets 1,232.2 1,203.0 Property, Plant and Equipment, Net 1,678.9 1,732.2 Goodwill 1,125.4 1,139.0 Intangible Assets, Net 467.0 506.4 Other Assets 55.8 51.0 Total Assets $ 4,559.3 $ 4,631.6
LIABILITIES
Current Liabilities:
Short-Term Debt and Current Portion of Long-Term Debt $ 77.4 $ 79.8 Accounts Payable 428.3 453.7 Compensation and Employee Benefits 112.9 133.9 Interest Payable 15.2 10.1 Other Accrued Liabilities 77.4 75.4
Total Current Liabilities 711.2 752.9 Long-Term Debt 2,176.2 2,253.5 Deferred Income Tax Liabilities 329.9 147.8 Accrued Pension and Postretirement Benefits 198.2 420.7 Other Noncurrent Liabilities 70.2 73.6
Commitments and Contingencies (Note 12) Redeemable Noncontrolling Interests (Note 14) 11.3 10.8
SHAREHOLDERS' EQUITY
Preferred Stock, par value $.01 per share; 100,000,000 shares authorized at December 31, 2013 and December 31, 2012; no shares issued or outstanding — —
Common Stock, par value $.01 per share; 1,000,000,000 shares authorized at December 31, 2013 and 2012, 324,746,642 and 344,534,039 shares issued and outstanding at December 31, 2013 and 2012, respectively 3.2 3.4
Capital in Excess of Par Value 1,789.9 1,915.1 Accumulated Deficit (542.6 ) (633.2 )
Accumulated Other Comprehensive Loss (188.2 ) (311.3 )
Total Graphic Packaging Holding Company Shareholders’ Equity 1,062.3 974.0 Noncontrolling Interests — (1.7 )
Total Equity 1,062.3 972.3 Total Liabilities and Equity $ 4,559.3 $ 4,631.6

Table of Contents
GRAPHIC PACKAGING HOLDING COMPANY CONSOLIDATED STATEMENTS OF SHAREHOLDERS’ EQUITY
The accompanying notes are an integral part of the consolidated financial statements.
44
Accumulated
Other
Common Stock Capital in Excess of Par
Value
In millions, except share amounts Shares Amount Accumulated
Deficit Comprehensive Income (Loss)
Noncontrolling Interests Total Equity
Balances at December 31, 2010 343,698,778 $ 3.4 $ 1,965.2 $ (1,008.3 ) $ (213.3 ) $ — $ 747.0 Net Income (Loss) — — — 276.9 — (1.6 ) 275.3 Other Comprehensive Income (Loss), Net
of Tax: Derivative Instruments — — — — 14.0 — 14.0 Pension and Postretirement Benefit Plans — — — — (79.1 ) — (79.1 )
Currency Translation Adjustment — — — — (3.7 ) — (3.7 )
Issuance of Common Stock, Net 52,530,975 0.5 237.0 — — — 237.5 Repurchase of Common Stock (7,264,922 ) — (32.9 ) — — — (32.9 )
Investment in Subsidiaries — — (3.1 ) — — 0.4 (2.7 )
Recognition of Stock-Based Compensation — — 11.3 — — — 11.3 Issuance of Shares for Stock-Based Awards 509,955 — — — — — —
Balances at December 31, 2011 389,474,786 $ 3.9 $ 2,177.5 $ (731.4 ) $ (282.1 ) $ (1.2 ) $ 1,166.7 Net Income (Loss) — — — 122.6 — (0.5 ) 122.1 Other Comprehensive Income (Loss), Net
of Tax: Derivative Instruments — — — — (0.6 ) — (0.6 )
Pension and Postretirement Benefit Plans — — — — (29.2 ) — (29.2 )
Currency Translation Adjustment — — — — 0.6 — 0.6 Repurchase of Common Stock (49,180,327 ) (0.5 ) (275.1 ) (24.4 ) — — (300.0 )
Investment in Subsidiaries — — 3.1 — — 3.1 Recognition of Stock-Based Compensation — — 9.6 — — — 9.6 Issuance of Shares for Stock-Based Awards 4,239,580 — — — — — —
Balances at December 31, 2012 344,534,039 $ 3.4 $ 1,915.1 $ (633.2 ) $ (311.3 ) $ (1.7 ) $ 972.3 Net Income — — — 146.6 — — 146.6 Other Comprehensive Income (Loss), Net
of Tax: Derivative Instruments — — — — 3.2 — 3.2 Pension and Postretirement Benefit Plans — — — — 133.5 — 133.5 Currency Translation Adjustment — — — — (13.6 ) — (13.6 )
Repurchase of Common Stock (23,866,348 ) (0.2 ) (143.8 ) (56.0 ) — — (200.0 )
Investment in Subsidiaries — — (1.7 ) — — 1.7 — Recognition of Stock-Based Compensation — — 20.3 — — — 20.3 Issuance of Shares for Stock-Based Awards 4,078,951 — — — — — —
Balances at December 31, 2013 324,746,642 $ 3.2 $ 1,789.9 $ (542.6 ) $ (188.2 ) $ — $ 1,062.3

Table of Contents
GRAPHIC PACKAGING HOLDING COMPANY CONSOLIDATED STATEMENTS OF CASH FLOWS
45
Year Ended December 31,
In millions 2013 2012 2011
CASH FLOWS FROM OPERATING ACTIVITIES: Net Income $ 146.7 $ 120.1 $ 275.2
Non-cash Items Included in Net Income: Depreciation and Amortization 277.4 266.8 278.4 Goodwill Impairment Charge — — 96.3 Write-off of Deferred Debt Issuance Costs on Early Extinguishment of Debt 4.5 7.5 2.1 Amortization of Deferred Debt Issuance Costs 7.0 6.2 7.0 Deferred Income Taxes 62.7 76.0 (238.4 )
Amount of Postretirement Expense Less Than Funding (12.4 ) (14.0 ) (38.8 )
Gain on the Sale of Assets (26.6 ) — — Asset Write-offs 1.5 5.6 7.0 Other, Net 19.5 17.5 19.8 Changes in Operating Assets and Liabilities, Net of Acquisitions (See Note 3) (22.3 ) (17.1 ) (20.8 )
Net Cash Provided by Operating Activities 458.0 468.6 387.8
CASH FLOWS FROM INVESTING ACTIVITIES: Capital Spending (209.2 ) (203.3 ) (160.1 )
Acquisition of Businesses — (118.1 ) (51.9 )
Cash Acquired Related to Business Acquisitions — 13.1 — Proceeds Received from the Sale of Assets, Net of Selling Costs 73.5 18.8 2.3 Other, Net (8.7 ) (4.5 ) (2.1 )
Net Cash Used in Investing Activities (144.4 ) (294.0 ) (211.8 )
CASH FLOWS FROM FINANCING ACTIVITIES: Net Proceeds from Issuance of Common Stock — — 237.7 Repurchase of Common Stock (200.0 ) (300.0 ) (32.9 )
Proceeds from Issuance or Modification of Debt 425.0 1,300.0 — Retirement of Long-Term Debt (425.0 ) — — Payments on Debt (71.3 ) (1,703.4 ) (249.2 )
Borrowings under Revolving Credit Facilities 1,729.2 1,367.2 92.1 Payments on Revolving Credit Facilities (1,738.0 ) (1,034.7 ) (89.6 )
Redemption and Early Tender Premiums and Debt Issuance Costs (29.9 ) (27.7 ) — Repurchase of Common Stock related to Share-Based Payments (11.2 ) (10.7 ) — Other, Net 10.1 13.2 (0.3 )
Net Cash Used in Financing Activities (311.1 ) (396.1 ) (42.2 )
EFFECT OF EXCHANGE RATE CHANGES ON CASH (1.8 ) 1.2 (0.7 )
Net Increase (Decrease) in Cash and Cash Equivalents 0.7 (220.3 ) 133.1 Cash and Cash Equivalents at Beginning of Period 51.5 271.8 138.7 CASH AND CASH EQUIVALENTS AT END OF PERIOD $ 52.2 $ 51.5 $ 271.8

Table of Contents
Non-cash investing activities:
The accompanying notes are an integral part of the consolidated financial statements.
46
Total Consideration Received from the Sale of Assets $ 83.2 $ — $ — Cash Proceeds Received from the Sale of Assets 73.5 — — Non-cash Consideration Received from the Sale of Assets $ 9.7 $ — $ —

Table of Contents
GRAPHIC PACKAGING HOLDING COMPANY NOTES TO CONSOLIDATED FINANCIAL STATEMENTS
Nature of Business
Graphic Packaging Holding Company (“GPHC” and, together with its subsidiaries, the “Company”) is a leading provider of packaging
solutions for a wide variety of products to food, beverage and other consumer products companies. The Company is the largest U.S. producer of folding cartons and holds a leading market position in coated unbleached kraft paperboard, coated-recycled boxboard and flexible packaging. The Company’s customers include some of the most widely recognized companies in the world. The Company strives to provide its customers with packaging solutions designed to deliver marketing and performance benefits at a competitive cost by capitalizing on its low-cost paperboard mills and converting plants, its proprietary carton and packaging designs, and its commitment to customer service.
GPHC became a new publicly-traded parent company when, on March 10, 2008 , the businesses of Graphic Packaging Corporation (“GPC”) and Altivity Packaging, LLC (“Altivity”) were combined through a series of transactions.
GPHC and GPC conduct no significant business and have no independent assets or operations other than GPHC’s ownership of all of GPC’s outstanding common stock, and GPC’s ownership of all of Graphic Packaging International, Inc’s (GPII) outstanding common stock.
Basis of Presentation and Principles of Consolidation
The Company’s Consolidated Financial Statements include all subsidiaries in which the Company has the ability to exercise direct or indirect control over operating and financial policies. The accompanying Consolidated Financial Statements include the worldwide operations of the paperboard packaging segment, which includes the paperboard packaging, packaging machinery, labels, and containerboard businesses, and the flexible packaging segment, which produces kraft paper and converts kraft, specialty paper and plastics into multi-wall, consumer and specialty retail bags and produces flexible packaging, and laminations. Intercompany transactions and balances are eliminated in consolidation. As a result of purchase accounting, certain adjustments have been made to the December 31, 2012 balance sheet in order to conform to the required presentation (see Note 4 — Acquisitions). Certain other reclassifications have been made to prior year amounts to conform to current year presentation.
The Company holds a 50% ownership interest in a joint venture with Rengo Riverwood Packaging, Ltd. (in Japan) which is accounted for using the equity method.
The Company holds an 87% ownership interest in Graphic Flexible Packaging, LLC, which is consolidated in the Company's financial
statements. The noncontrolling interest in this joint venture is shown in the Company's financial statements.
Use of Estimates
The preparation of financial statements in conformity with accounting principles generally accepted in the United States (“U.S. GAAP”) requires management to make estimates and assumptions that affect the reported amounts of assets and liabilities at the date of the financial statements and the reported amounts of net sales and expenses during the reporting periods. Actual results could differ from these estimates, and changes in these estimates are recorded when known. Estimates are used in accounting for, among other things, pension benefits, retained insurable risks, slow-moving and obsolete inventory, allowance for doubtful accounts, useful lives for depreciation and amortization, future cash flows, discount rates and earnings before interest, taxes, depreciation and amortization (“EBITDA”) multiples associated with impairment testing of goodwill and long-term assets, fair values related to the allocation of purchase price to property, plant and equipment and intangible assets in connection with business combinations, fair value of derivative financial instruments, deferred income tax assets and potential income tax assessments, and loss contingencies.
47
NOTE 1. NATURE OF BUSINESS AND SUMMARY OF SIGNIFICANT ACCOU NTING POLICIES

GRAPHIC PACKAGING HOLDING COMPANY NOTES TO CONSOLIDATED FINANCIAL STATEMENTS - (Conti nued)
Cash and Cash Equivalents
Cash and cash equivalents include time deposits, certificates of deposit and other marketable securities with original maturities of three months or less.
Accounts Receivable and Allowances
Accounts receivable are stated at the amount owed by the customer, net of an allowance for estimated uncollectible accounts, returns and allowances, and cash discounts. The allowance for doubtful accounts is estimated based on historical experience, current economic conditions and the credit worthiness of customers. Receivables are charged to the allowance when determined to be no longer collectible.
The Company has entered into various factoring arrangements, principally at the request of customers through supply chain financing programs, which qualify for sale accounting in accordance with the Transfers and Servicing topic of the Financial Accounting Standards Board ("FASB") Accounting Standards Codification ("the FASB Codification"). As of December 31, 2013 and 2012, the Company had received incremental proceeds of approximately $ 41 million and $ 11 million , respectively, from the factoring arrangements. Amounts transferred subject to continuing involvement at December 31, 2013 and 2012 were approximately $ 20 million and $ 0 million , respectively.
Concentration of Credit Risk
The Company’s cash, cash equivalents, and accounts receivable are potentially subject to concentration of credit risk. Cash and cash equivalents are placed with financial institutions that management believes are of high credit quality. Accounts receivable are derived from revenue earned from customers located in the U.S. and internationally and generally do not require collateral. As of and for the years ended December 31, 2013 and 2012 , no customer accounted for more than 10% of net sales or net accounts receivable.
Inventories
Inventories are stated at the lower of cost or market with cost determined principally by the first-in, first-out (“FIFO”) basis. Average cost basis is used to determine the cost of supplies inventories. Raw materials and consumables used in the production process such as wood chips and chemicals are valued at purchase cost on a FIFO basis upon receipt. Work in progress and finished goods inventories are valued at the cost of raw material consumed plus direct manufacturing costs (such as labor, utilities and supplies) as incurred and an applicable portion of manufacturing overhead. Inventories are stated net of an allowance for slow-moving and obsolete inventory.
Property, Plant and Equipment
Property, plant and equipment are recorded at cost. Betterments, renewals and extraordinary repairs that extend the life of the asset are
capitalized; other repairs and maintenance charges are expensed as incurred. The Company’s cost and related accumulated depreciation applicable to assets retired or sold are removed from the accounts and the gain or loss on disposition is included in income from operations.
Interest is capitalized on assets under construction for one year or longer with an estimated spending of $1.0 million or more. The capitalized interest is recorded as part of the asset to which it relates and is amortized over the asset’s estimated useful life. Capitalized interest was $ 3.5 million , $ 2.2 million and $ 1.5 million in the years ended December 31, 2013 , 2012 and 2011 , respectively.
The Company assesses its long-lived assets, including certain identifiable intangibles, for impairment whenever events or circumstances indicate that the carrying value of an asset may not be recoverable. To analyze recoverability, the Company projects future cash flows, undiscounted and before interest, over the remaining life of such assets. If these projected cash flows are less than the carrying amount, an impairment would be recognized, resulting in a write-down of assets with a corresponding charge to earnings. The impairment loss is measured based upon the difference between the carrying amount and the fair value of the assets. The Company assesses the appropriateness of the useful life of its long-lived assets periodically.
48

GRAPHIC PACKAGING HOLDING COMPANY NOTES TO CONSOLIDATED FINANCIAL STATEMENTS - (Conti nued)
Depreciation and Amortization
Depreciation is computed using the straight-line method based on the following estimated useful lives of the related assets:
Depreciation expense, including the depreciation expense of assets under capital leases, for 2013 , 2012 and 2011 was $ 232.5 million , $
222.7 million and $ 231.4 million , respectively. Intangible assets with a determinable life are amortized on a straight-line basis over that period. The amortization expense for each intangible
asset is recorded in the Consolidated Statements of Operations according to the nature of that asset . Goodwill is the Company’s only intangible asset not subject to amortization at December 31, 2013 and 2012 . The following table displays the
intangible assets that continue to be subject to amortization and aggregate amortization expense as of December 31, 2013 and 2012 :
The Company recorded amortization expense for the years ended December 31, 2013 , 2012 and 2011 of $ 44.9 million ,
$ 44.1 million and $ 47.0 million , respectively, relating to intangible assets subject to amortization. The Company expects amortization expense to be approximately $ 44 million for 2014 through 2016 and approximately $ 41 million for 2017 and 2018 .
Goodwill
The Company tests goodwill for impairment annually as of October 1, as well as whenever events or changes in circumstances suggest that the estimated fair value of a reporting unit may no longer exceed its carrying amount.
The Company tests goodwill for impairment at the reporting unit level, which is an operating segment or level below an operating segment, which is referred to as a component. A component of an operating segment is a reporting unit if the component constitutes a business for which discrete financial information is available and management regularly reviews the operating results of that component. However, two or more components of an operating segment are aggregated and deemed a single reporting unit if the components have similar economic characteristics.
Potential goodwill impairment is measured at the reporting unit level by comparing the reporting unit’s carrying amount including goodwill,
to the fair value of the reporting unit. The estimated fair value of each reporting unit is determined by utilizing a discounted cash flow analysis based on the Company’s forecasts discounted using a weighted average cost of capital and market indicators of terminal year cash flows based upon a multiple of EBITDA. If the carrying amount of a reporting unit exceeds its estimated fair value, goodwill is considered potentially impaired. In determining fair value, management relies on and considers a number of factors, including but not limited to, operating results, business plans, economic projections, forecasts including future cash flows, and market data and analysis, including market capitalization. The assumptions we use are based on what we believe a hypothetical market participant would use in estimating fair value. Fair value determinations are sensitive to changes in the
49
Buildings 40 years
Land improvements 15 years
Machinery and equipment 3 to 40 years
Furniture and fixtures 10 years
Automobiles, trucks and tractors 3 to 5 years
December 31, 2013 December 31, 2012
In millions
Gross Carrying Amount
Accumulated Amortization
Net Carrying Amount
Gross Carrying Amount
Accumulated Amortization
Net Carrying Amount
Amortizable Intangible Assets:
Customer Relationships $ 670.6 $ (242.7 ) $ 427.9 $ 669.7 $ (204.3 ) $ 465.4 Patents, Trademarks and Licenses 118.7 (79.6 ) 39.1 113.8 (72.8 ) 41.0 Total $ 789.3 $ (322.3 ) $ 467.0 $ 783.5 $ (277.1 ) $ 506.4
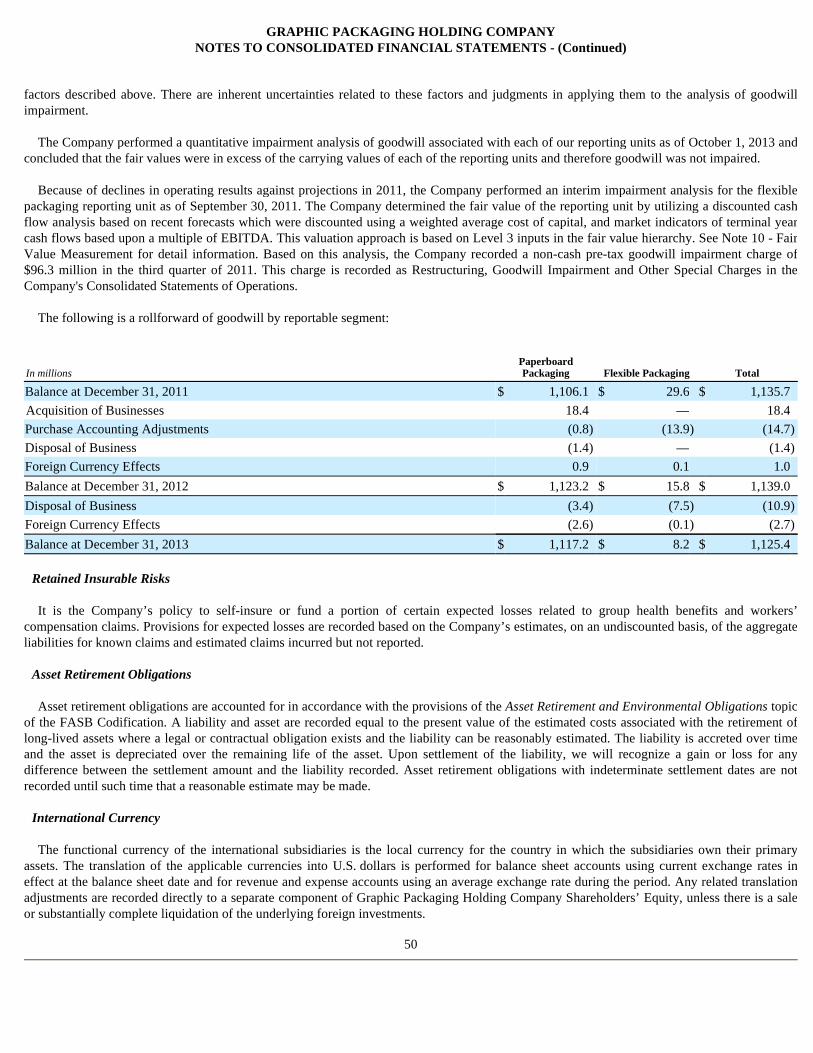
GRAPHIC PACKAGING HOLDING COMPANY NOTES TO CONSOLIDATED FINANCIAL STATEMENTS - (Conti nued)
factors described above. There are inherent uncertainties related to these factors and judgments in applying them to the analysis of goodwill impairment.
The Company performed a quantitative impairment analysis of goodwill associated with each of our reporting units as of October 1, 2013 and
concluded that the fair values were in excess of the carrying values of each of the reporting units and therefore goodwill was not impaired. Because of declines in operating results against projections in 2011, the Company performed an interim impairment analysis for the flexible
packaging reporting unit as of September 30, 2011. The Company determined the fair value of the reporting unit by utilizing a discounted cash flow analysis based on recent forecasts which were discounted using a weighted average cost of capital, and market indicators of terminal year cash flows based upon a multiple of EBITDA. This valuation approach is based on Level 3 inputs in the fair value hierarchy. See Note 10 - Fair Value Measurement for detail information. Based on this analysis, the Company recorded a non-cash pre-tax goodwill impairment charge of $96.3 million in the third quarter of 2011. This charge is recorded as Restructuring, Goodwill Impairment and Other Special Charges in the Company's Consolidated Statements of Operations.
The following is a rollforward of goodwill by reportable segment:
Retained Insurable Risks
It is the Company’s policy to self-insure or fund a portion of certain expected losses related to group health benefits and workers’
compensation claims. Provisions for expected losses are recorded based on the Company’s estimates, on an undiscounted basis, of the aggregate liabilities for known claims and estimated claims incurred but not reported.
Asset Retirement Obligations
Asset retirement obligations are accounted for in accordance with the provisions of the Asset Retirement and Environmental Obligations topic of the FASB Codification. A liability and asset are recorded equal to the present value of the estimated costs associated with the retirement of long-lived assets where a legal or contractual obligation exists and the liability can be reasonably estimated. The liability is accreted over time and the asset is depreciated over the remaining life of the asset. Upon settlement of the liability, we will recognize a gain or loss for any difference between the settlement amount and the liability recorded. Asset retirement obligations with indeterminate settlement dates are not recorded until such time that a reasonable estimate may be made.
International Currency
The functional currency of the international subsidiaries is the local currency for the country in which the subsidiaries own their primary
assets. The translation of the applicable currencies into U.S. dollars is performed for balance sheet accounts using current exchange rates in effect at the balance sheet date and for revenue and expense accounts using an average exchange rate during the period. Any related translation adjustments are recorded directly to a separate component of Graphic Packaging Holding Company Shareholders’ Equity, unless there is a sale or substantially complete liquidation of the underlying foreign investments.
50
In millions Paperboard Packaging Flexible Packaging Total
Balance at December 31, 2011 $ 1,106.1 $ 29.6 $ 1,135.7 Acquisition of Businesses 18.4 — 18.4 Purchase Accounting Adjustments (0.8 ) (13.9 ) (14.7 )
Disposal of Business (1.4 ) — (1.4 )
Foreign Currency Effects 0.9 0.1 1.0 Balance at December 31, 2012 $ 1,123.2 $ 15.8 $ 1,139.0 Disposal of Business (3.4 ) (7.5 ) (10.9 )
Foreign Currency Effects (2.6 ) (0.1 ) (2.7 )
Balance at December 31, 2013 $ 1,117.2 $ 8.2 $ 1,125.4

GRAPHIC PACKAGING HOLDING COMPANY NOTES TO CONSOLIDATED FINANCIAL STATEMENTS - (Conti nued)
The Company pursues a currency hedging program which utilizes derivatives to limit the impact of foreign currency exchange fluctuations on its consolidated financial results. Under this program, the Company has entered into forward exchange contracts in the normal course of business to hedge certain foreign currency denominated transactions. Realized and unrealized gains and losses on these forward contracts are included in the measurement of the basis of the related foreign currency transaction when recorded.
Revenue Recognition
The Company recognizes revenue when all of the following criteria are met: persuasive evidence of an agreement exists, delivery has occurred or services have been rendered, the Company’s price to the buyer is fixed or determinable and collectability is reasonably assured. Delivery is not considered to have occurred until the customer takes title and assumes the risks and rewards of ownership.
The timing of revenue recognition is largely dependent on the location of title transfer which is normally either at our plant (shipping point) or
upon arrival at our customer’s plant (destination). The Company recognizes revenues on its annual and multi-year carton supply contracts as the shipment occurs in accordance with the title transfer discussed above.
Discounts and allowances are comprised of trade allowances and rebates, cash discounts and sales returns. Cash discounts and sales returns
are estimated using historical experience. Trade allowances are based on the estimated obligations and historical experience. Customer rebates are determined based on contract terms and are recorded at the time of sale.
Shipping and Handling
The Company includes shipping and handling costs in Cost of Sales. Research and Development
Research and development costs, which relate primarily to the development and design of new packaging machines and products and are
recorded as a component of Selling, General and Administrative expenses, are expensed as incurred. Expenses for the years ended December 31, 2013 , 2012 and 2011 were $ 16.8 million , $ 16.1 million and $ 16.0 million , respectively.
Restructuring, Goodwill Impairment and Other Special Charges The following table summarizes the transactions recorded in Restructuring, Goodwill Impairment and Other Special Charges in the
Consolidated Statements of Operations as of December 31:
The Company has undertaken restructuring activities associated with the integration of the business combinations that occurred within the
Paperboard Packaging and in the Flexible Packaging segments in 2012 and 2011, respectively. These charges primarily relate to one-time termination benefits and other closure costs associated with the rationalization of the business. These activities were near completion and substantially all amounts have been paid out as of December 31, 2013.
On September 30, 2013, the Company completed the sale of certain assets related to the flexible plastics business and the sale of its uncoated-
recycled board ("URB") mill. The Company had previously announced the closure of its Brampton, Ontario facility which was also part of the flexible plastics business. This facility was sold in December 2013. Approximately $11 million of goodwill was written off relating to the sales. The financial impacts of these transactions are reflected as (Gain) Loss
51
In millions 2013 2012 2011
(Gain) Loss on Sale or Closure of Certain Assets $ (17.9 ) $ 3.0 $ 5.3 Net Charges Associated with Business Combinations 29.2 21.7 1.2 Other Special Charges 1.8 1.7 4.7 Goodwill Impairment — — 96.3 Total $ 13.1 $ 26.4 $ 107.5

GRAPHIC PACKAGING HOLDING COMPANY NOTES TO CONSOLIDATED FINANCIAL STATEMENTS - (Conti nued)
on Sale or Closure of Certain Assets in Restructuring, Goodwill Impairment and Other Special Charges, Net in the Consolidated Statement of Operations. The flexible plastics business was part of the Flexible Packaging segment and the URB mill was part of the Paperboard Packaging segment, and in aggregate, accounted for approximately 2% of Consolidated Net Sales.
Equity Offerings and Repurchases During November of 2013, certain shareholders of the Company sold approximately 47.9 million shares of common stock in a secondary
public offering at $8.38 per share. The shares were sold by certain affiliates of TPG Capital, L.P. (the “TPG Entities”), certain Coors family trusts and the Adolph Coors Foundation (the “Coors Family Stockholders”), Clayton, Dubilier & Rice Fund V Limited Partnership (the “CD&R Fund”) and Old Town, S.A. (“Old Town”), (“Old Town” and together with the TPG Entities, the Coors Family Stockholders, the Adolph Coors Foundation, and the CD&R Fund, the "Selling Stockholders"). In connection with the offering, the Company repurchased approximately 23.9 million shares at $8.38 per share resulting in aggregate purchase price of $200 million (the "Share Repurchase"). The Share Repurchase was funded with a combination of cash on hand and borrowings under the Company’s revolving credit facility. After these transactions, the shares outstanding held by the Selling Stockholders decreased from approximately 35% to approximately 23% .
During 2013, prior to the November secondary offering, the Selling Stockholders sold 15 million , 15 million and 28 million shares of common stock in separate secondary public offerings at prices of $7.00 , $7.73 and $8.45 per share, respectively. The shares outstanding held by the Selling Stockholders in these offerings decreased from approximately 53% at December 31, 2012 to approximately 35% .
During December of 2012, the Selling Stockholders sold 18.5 million shares of common stock in a secondary public offering at $6.10 per share, as well as an additional 2.8 million shares pursuant to the underwriters' overallotment option. In connection with the offering, the Company also repurchased approximately 49.2 million shares of its common stock from the Selling Stockholders at $6.10 per share. The Company funded the share repurchase with an incremental term loan borrowing. The shares outstanding held by the Selling Stockholders decreased from approximately 65% to approximately 53% .
During the second quarter of 2011 , the Company completed a public offering of 52.5 million shares of its common stock, priced at $4.75 per share. The offering resulted in net proceeds of $237.7 million , after deducting offering expenses. The Company used $32.9 million of the net proceeds from the offering to repurchase and subsequently retire 7.3 million shares of common stock held by the Grover C. Coors Trust (“Coors Trust”). The Company used the remaining net proceeds from its stock offerings to reduce its indebtedness and for general corporate purposes.
Adoption of New Accounting Standards
Effective January 1, 2013, the Company adopted revised guidance on the Comprehensive Income topic of the FASB Codification which requires an entity to present either parenthetically on the face of the financial statements or in the notes, significant amounts reclassified from each component of accumulated other comprehensive income and the income statement line items affected by the reclassification. The adoption did not have any impact on the Company’s financial position, results of operations or cash flows.
Effective January 1, 2013, the Company adopted revised guidance on Balance Sheet topic of the FASB Codification, which clarifies the scope
of disclosures about offsetting assets and liabilities. The clarification applies only to derivatives, repurchase agreements and reverse purchase agreements, and to certain securities borrowing and securities lending transactions, and not to ordinary trade receivables and payables. The adoption did not have any impact on the Company’s financial position, results of operations or cash flows.
Effective July 17, 2013, the Company adopted revised guidance on Derivatives and Hedging topic of the FASB Codification, which permits entities to prospectively apply the Fed Funds Effective Swap Rate as a U.S. benchmark interest rate for hedge accounting purposes, in addition to the previously allowed United States Treasury and LIBOR (London Interbank Offered Rate) rates for qualifying new or redesignated hedging relationships. The adoption did not have any impact on the Company’s financial position, results of operations or cash flows.
52

GRAPHIC PACKAGING HOLDING COMPANY NOTES TO CONSOLIDATED FINANCIAL STATEMENTS - (Conti nued)
Effective October 1, 2013, the Company adopted revised guidance on Foreign Currency Matters topic of the FASB Codification, which requires a parent entity that ceases to have a controlling financial interest in a subsidiary or group of assets that represents a business, within a foreign entity, to release any related cumulative translation adjustment into net income. The adoption did not have any impact on the Company’s financial position, results of operations or cash flows.
Accounting Standards Not Yet Adopted In July 2013, the FASB issued guidance amending the Income Taxes topic of the FASB Codification. The amendment requires that an
unrecognized tax benefit, or a portion of an unrecognized tax benefit, should be presented in the financial statements as a reduction to the deferred tax asset for a net operating loss carryforward, or similar tax loss, or a tax credit carryforward. This guidance will be effective for the Company in the first quarter of 2014, to be applied prospectively, and is not expected to have a material impact on the Company's financial position, results of operations or cash flows.
53

GRAPHIC PACKAGING HOLDING COMPANY NOTES TO CONSOLIDATED FINANCIAL STATEMENTS - (Conti nued)
The following tables provide disclosure related to the components of certain line items included in our consolidated balance sheets. Receivables, Net:
Inventories, Net by major class:
Other Current Assets:
Property, Plant and Equipment, Net:
(1) Includes gross assets under capital lease of $ 11.7 million and related accumulated depreciation of $ 2.3 million as of December 31, 2013
and gross assets under capital lease of $ 10.2 million and related accumulated depreciation of $ 1.5 million as of December 31, 2012 .
54
NOTE 2. SUPPLEMENTAL BALANCE SHEET DATA
In millions 2013 2012
Trade $ 396.7 $ 445.8 Less: Allowance (5.3 ) (6.4 )
391.4 439.4 Other 21.4 21.9 Total $ 412.8 $ 461.3
In millions 2013 2012
Finished Goods $ 288.3 $ 270.5 Work in Progress 49.2 50.6 Raw Materials 149.7 152.1 Supplies 69.9 59.3 Total $ 557.1 $ 532.5
In millions 2013 2012
Prepaid Assets $ 29.9 $ 18.3 Assets Held for Sale 6.6 — Fair Value of Derivatives, current portion 2.3 0.1 Total $ 38.8 $ 18.4
In millions 2013 2012
Property, Plant and Equipment, at Cost:
Land and Improvements $ 114.0 $ 123.0 Buildings 405.8 414.7 Machinery and Equipment (1) 3,570.7 3,489.6 Construction-in-Progress 130.2 169.5 4,220.7 4,196.8 Less: Accumulated Depreciation (1) (2,541.8 ) (2,464.6 )
Total $ 1,678.9 $ 1,732.2

GRAPHIC PACKAGING HOLDING COMPANY NOTES TO CONSOLIDATED FINANCIAL STATEMENTS - (Conti nued)
Other Assets:
Other Accrued Liabilities:
Other Noncurrent Liabilities:
55
In millions 2013 2012
Deferred Debt Issuance Costs, Net of Amortization of $9.5 million and $9.1 million for 2013 and 2012, respectively $ 24.3 $ 25.7
Deferred Income Tax Assets 8.9 10.1 Pension Assets 0.7 — Note Receivable 9.1 — Other 12.8 15.2 Total $ 55.8 $ 51.0
In millions 2013 2012
Fair Value of Derivatives, current portion $ 3.3 $ 3.0 Deferred Revenue 10.7 13.1 Accrued Customer Rebates 14.1 16.6 Other 49.3 42.7 Total $ 77.4 $ 75.4
In millions 2013 2012
Deferred Revenue $ 5.1 $ 6.5 Multi-employer Plans 25.4 24.2 Workers Compensation Reserve 12.7 14.1 Other 27.0 28.8 Total $ 70.2 $ 73.6

GRAPHIC PACKAGING HOLDING COMPANY NOTES TO CONSOLIDATED FINANCIAL STATEMENTS - (Conti nued)
Cash Flow Provided by (Used in) Operations Due to Changes in Operating Assets and Liabilities:
Cash paid for interest and cash paid, net of refunds, for income taxes was as follows:
On December 31, 2012, the Company acquired Contego Cartons ("Contego"), a leading food and consumer product packaging company based
in the United Kingdom. Under the terms of the transaction, the Company paid approximately $93 million and assumed debt of approximately $35 million in an all cash transaction funded with existing cash and debt under the Company's revolving line of credit. Contego operates four folding carton facilities that convert approximately 150,000 tons of paperboard annually into folding cartons for the food and consumer product industries. The acquisition and associated goodwill are included in the paperboard packaging segment. This transaction is herein referred to as the "Contego Transaction".
On December 31, 2012, the Company acquired A&R Carton’s Beer and Beverage packaging business in Europe ("A&R"). Under the terms of
the transaction, the Company paid approximately $25 million in cash and assumed approximately $2 million in debt. The transaction was funded with existing cash and borrowings from the Company’s revolving line of credit. A&R includes two manufacturing facilities that convert approximately 30,000 tons of paperboard annually. The acquisition and associated goodwill are included in the paperboard packaging segment. This transaction is herein referred to as the "A&R Transaction". The A&R Transaction and the Contego Transaction are collectively referred to as the "European Acquisitions".
The purchase price of the European Acquisitions has been allocated to the assets acquired and liabilities assumed based on the estimated fair
values as of the purchase date. The European Acquisitions were made to grow the European food and beverage business and optimize the Company's supply chain footprint around customer needs. The excess of the purchase price over the aggregate fair value of net assets acquired was allocated to goodwill. Management believes that the portion of the purchase price attributable to goodwill represents benefits expected as a result of the acquisition, including 1) cost-reduction opportunities and synergies by combining sales and support functions and eliminating duplicate corporate functions, 2) providing new opportunities for top-line growth, which will allow the Company to compete effectively in the global packaging market, and 3) expansion of the Company’s manufacturing system. The Company does not expect goodwill to be deductible for tax purposes. The purchase price allocation is as follows:
56
NOTE 3. SUPPLEMENTAL CASH FLOW INFORMATION
In millions 2013 2012 2011
Receivables, Net $ 49.3 $ 7.3 $ 0.7 Inventories, Net (39.5 ) (23.9 ) (43.0 )
Prepaid Expenses (11.4 ) (0.2 ) 3.4 Other Assets (3.8 ) 4.0 (5.8 )
Accounts Payable (13.9 ) 6.8 27.5 Compensation and Employee Benefits (20.8 ) 16.9 (3.3 )
Income Taxes 1.1 (4.5 ) 0.8 Interest Payable 21.9 (14.9 ) (6.9 )
Other Accrued Liabilities (1.1 ) (8.7 ) (6.5 )
Other Noncurrent Liabilities (4.1 ) 0.1 12.3 Total $ (22.3 ) $ (17.1 ) $ (20.8 )
In millions 2013 2012 2011
Interest $ 89.6 $ 117.5 $ 143.7 Income Taxes $ 12.1 $ 8.9 $ 8.2
NOTE 4. ACQUISITIONS

GRAPHIC PACKAGING HOLDING COMPANY NOTES TO CONSOLIDATED FINANCIAL STATEMENTS - (Conti nued)
On December 8, 2011, the Company combined its multi-wall bag and specialty plastics packaging businesses with the kraft paper and multi-wall bag businesses of Delta Natural Kraft, LLC and Mid-America Packaging, LLC (collectively "DNK"), both wholly owned subsidiaries of Capital Five Investments, LLC ("CVI"). Under the terms of the transaction, the Company formed a new limited liability company, Graphic Flexible Packaging, LLC ("GFP") and contributed its ownership interests in multi-wall bag and specialty plastics packaging subsidiaries to it. CVI concurrently contributed its ownership interests in DNK to GFP. Neither party received cash consideration as part of the transaction. After the combination, the Company owns approximately 87% of GFP and consolidates its results of operations. The remaining 13% of GFP is owned by CVI. CVI's noncontrolling interest in GFP is recorded as Redeemable Noncontrolling Interests in the Company's financial statements. GFP is included in the flexible segment. The purchase consideration was allocated to the assets and liabilities based on estimated fair values as of the purchase date. Based on the independent third party valuation, there were no amounts allocated to goodwill. This transaction is herein referred to as the "DNK Transaction".
On April 29, 2011 , the Company paid $51.9 million to acquire substantially all of the assets of Sierra Pacific Packaging, Inc. (“Sierra”), a producer of folding cartons, beverage carriers and corrugated boxes for the consumer packaged goods industry. The purchase price was allocated to the assets acquired and liabilities assumed based on estimated fair values as of the purchase date. The excess of the total purchase consideration over the aggregate fair value of identifiable net assets of $14.2 million was allocated to goodwill and the Company expects to deduct approximately $24 million of goodwill for tax purposes. The acquisition is included in the paperboard packaging segment.
57
In millions
Amounts Recognized as of Acquisition Date
Measurement Period
Adjustments
Amounts Recognized as of Acquisition Date
(as adjusted)
Purchase Price $ 118.4 $ (0.3 ) $ 118.1 Assumed Debt 36.9 — 36.9 Total Purchase Consideration $ 155.3 $ (0.3 ) $ 155.0
In millions
Cash and Cash Equivalents $ 13.1 $ — $ 13.1 Receivables, Net 65.7 — 65.7 Inventories 35.8 1.3 37.1 Other Current Assets 0.9 (0.2 ) 0.7 Property, Plant and Equipment, Net 70.1 25.6 95.7 Intangible Assets, Net — 7.3 7.3 Total Assets Acquired 185.6 34.0 219.6 Current Liabilities, Excluding Current Portion of Long-Term Debt 49.0 — 49.0 Pension and Postretirement Benefits 24.7 — 24.7 Deferred Tax (Assets) Liabilities (0.6 ) 8.3 7.7 Other Noncurrent Liabilities 1.6 — 1.6 Total Liabilities Assumed 74.7 8.3 83.0 Net Assets Acquired 110.9 25.7 136.6 Goodwill 44.4 (26.0 ) 18.4 Total Estimated Fair Value of Net Assets Acquired $ 155.3 $ (0.3 ) $ 155.0

GRAPHIC PACKAGING HOLDING COMPANY NOTES TO CONSOLIDATED FINANCIAL STATEMENTS - (Conti nued)
Short-Term Debt is comprised of the following:
Short-term borrowings are principally at the Company’s international subsidiaries. The weighted average interest rate on short-term
borrowings as of December 31, 2013 and 2012 was 10.1% and 8.9% , respectively. Long-Term Debt is comprised of the following:
Long-Term Debt maturities (excluding capital leases) are as follows:
58
NOTE 5. DEBT
In millions 2013 2012
Short-Term Borrowings $ 12.4 $ 12.9 Current Portion of Capital Lease Obligations 2.4 2.2 Current Portion of Long-Term Debt 62.6 64.7 Total $ 77.4 $ 79.8
In millions 2013 2012
Senior Notes with interest payable semi-annually at 7.875%, payable in 2018 ($250.0 million face amount) $ 247.3 $ 246.8
Senior Notes with interest payable semi-annually at 9.5%, payable in 2017 ($425.0 million face amount) — 423.2 Senior Notes with interest payable semi-annually at 4.75%, payable in 2021 425.0 — Senior Secured Term Loan Facilities with interest payable at various dates at floating rates (2.0% at December 31, 2013) payable through 2018 1,214.6 1,275.0
Senior Secured Revolving Facility with interest payable at floating rates (2.1% at December 31, 2013) payable in 2018 344.3 325.8
Capital Lease Obligations 5.6 7.8 Other 16.8 54.7 2,253.6 2,333.3 Less: Current Portion 77.4 79.8
Total $ 2,176.2 $ 2,253.5
In millions
2014 $ 75.0 2015 69.2 2016 99.9 2017 123.2 2018 1,452.6 After 2018 428.1 Total $ 2,248.0

GRAPHIC PACKAGING HOLDING COMPANY NOTES TO CONSOLIDATED FINANCIAL STATEMENTS - (Conti nued)
On March 16, 2012, the Company entered into a $2.0 billion amended and restated credit agreement with a syndicate of lenders consisting primarily of commercial banks (the “Credit Agreement”). The Credit Agreement provides for a $1.0 billion revolving credit facility and a $1.0 billion amortizing term loan facility, both due on March 16, 2017. The revolving credit facility and the term loan facility bear interest at an initial rate equal to the London Interbank Offered Rate (LIBOR) plus 225 basis points. The interest rate margin over LIBOR will vary between 175 basis points and 275 basis points depending upon the Company's current consolidated total leverage ratio. This transaction was treated primarily as an extinguishment of debt, and a charge of $8.9 million was recorded as Loss on Modification or Extinguishment of Debt in the Company's Consolidated Statements of Operations. The Company's obligations under the Credit Agreement are collateralized by substantially all of the Company's domestic assets.
On December 18, 2012, the Company entered into Amendment No. 1 to the existing Credit Agreement to amend certain restrictions in the
Credit Agreement to provide an incremental term loan facility (the "Incremental Term Loan") in the amount of $300.0 million to fund the concurrent share repurchase. The Incremental Term Loan was treated primarily as a modification of debt. As a result, $2.1 million in third party fees were expensed as part of the loss on modification of debt, and the remaining fees paid to creditors of $3.1 million were deferred and will be amortized using the effective interest method over the term of the debt.
On April 2, 2013, the Company completed the issuance and sale of $425 million aggregated principal amount of its 4.75% Senior Notes due
2021. In connection with the new notes, the Company recorded deferred financing cost of approximately $7.2 million . During June of 2013, the Company redeemed 100% of the $425 million aggregated principal of its 9.5% Senior Notes due in 2017. The bonds
were redeemed at a price of 104.75% . The early redemption premium, unamortized issue premium and discount, and unamortized deferred financing costs of $25.9 million are reflected as Loss on Modification or Extinguishment of Debt in the Company's Consolidated Statement of Operations.
On September 13, 2013, the Company entered into Amendment No. 2 to the Credit Agreement to extend the maturity date of its existing
revolving credit and term loan facilities from March 16, 2017 to September 13, 2018 and to amend certain other terms of the the agreement. Under the amendment, the Company added a €75.0 million (approximately $100 million ) revolving credit facility, under which borrowings will be made in Euros and Pound Sterling, and a ¥2.5 billion (approximately $25 million ) revolving credit facility, under which borrowings will be made in Yen. Both revolving credit facilities will have the same maturity and interest rate pricing as the Company's current $1.0 billion revolving credit facility. In addition, Amendment No. 2 reduces the applicable margins for the existing facilities, which will be based on LIBOR and will vary between 150 basis points and 250 basis points depending upon the Company's current consolidated total leverage ratio. The Company's current rate is LIBOR plus 175 basis points. The extension of the term loans and revolving credit facility were treated primarily as a modification of debt. As a result, $1.2 million of fees were expensed as part of the loss on modification or extinguishment of debt, and the remaining fees of $2.2 million were deferred and will be amortized over the term of the debt.
At December 31, 2013 , the Company and its U.S. and international subsidiaries had the following commitments, amounts outstanding and amounts available under revolving credit facilities:
Note:
The Credit Agreement and the indenture governing the 7.875% Senior Notes due 2018 and the 4.75% Senior Notes due 2021 (the
“Indenture”) limit the Company’s ability to incur additional indebtedness. Additional covenants contained in the Credit
59
In millions Total Commitments Total Outstanding Total Available
Domestic Revolving Credit Facility (a) $ 1,000.0 $ 296.0 $ 676.8 International Facilities 159.3 65.0 94.3 Total $ 1,159.3 $ 361.0 $ 771.1
(a) In accordance with its debt agreements, the Company's availability under its Revolving Credit Facility has been reduced by the amount of standby letters of credit issued of $ 27.2 million as of December 31, 2013 . These letters of credit are primarily used as security against its self-insurance obligations and workers' compensation obligations. These letters of credit expire through January 1, 2015 unless extended.

GRAPHIC PACKAGING HOLDING COMPANY NOTES TO CONSOLIDATED FINANCIAL STATEMENTS - (Conti nued)
Agreement and the Indenture, among other things, restrict the ability of the Company to dispose of assets, incur guarantee obligations, prepay other indebtedness, make dividend and other restricted payments, create liens, make equity or debt investments, make acquisitions, modify terms of the Indenture, engage in mergers or consolidations, change the business conducted by the Company and its subsidiaries, and engage in certain transactions with affiliates. Such restrictions could limit the Company’s ability to respond to changing market conditions, fund its capital spending program, provide for unexpected capital investments or take advantage of business opportunities.
As of December 31, 2013 , the Company was in compliance with the covenants in the Credit Agreement and the Indenture.
The Company has one active equity compensation plan under which new grants are made, the Graphic Packaging Holding Company
Amended and Restated 2004 Stock and Incentive Compensation Plan (the “2004 Plan”). Under the 2004 Plan, the Company may grant stock options, stock appreciation rights, restricted stock, restricted stock units (“RSUs”) and other types of stock-based and cash awards to employees and directors of the Company. Stock options and other awards granted under the Company’s 2004 plan generally vest and expire in accordance with terms established at the time of grant. Shares issued pursuant to awards under the 2004 plan are from the Company’s authorized but unissued shares. Compensation costs are recognized on a straight-line basis over the requisite service period of the award.
60
NOTE 6. STOCK INCENTIVE PLANS

GRAPHIC PACKAGING HOLDING COMPANY NOTES TO CONSOLIDATED FINANCIAL STATEMENTS - (Conti nued)
Stock Options
GPC and the Company have not granted any stock options since 2004 . As of December 31, 2013 , there are no options outstanding and all stock options outstanding as of December 31, 2012 have been exercised or have expired and been cancelled.
A summary of option activity during the three years ended December 31, 2013 is as follows:
During 2013, 2012 and 2011 the intrinsic value of options exercised was $ 2.1 million , $ 1.1 million and $ 0.2 million , respectively.
Stock Awards, Restricted Stock and Restricted Stock Units
The Company’s 2004 Plan permits the grant of stock awards, restricted stock and RSUs. Generally, all RSUs vest and become payable in three years from date of grant. RSUs granted to employees generally contain performance conditions based on various financial targets and service requirements that must be met for the shares to vest. Upon vesting, RSUs granted in 2011, 2012 and 2013 are payable solely in shares of common stock. RSUs granted in 2010 were payable in cash and shares of common stock based on the proportion set forth in the grant agreement. Stock awards granted to non-employee directors as part of their compensation for service on the Board are unrestricted on the grant date.
61
Options
Weighted Average Exercise Price
Outstanding — December 31, 2010 5,280,267 $ 7.50 Exercised (71,350 ) 2.12 Canceled (27,000 ) 5.69
Outstanding — December 31, 2011 5,181,917 $ 7.58 Exercised (300,000 ) 1.56 Canceled (2,130,754 ) 7.88
Outstanding — December 31, 2012 2,751,163 $ 8.01 Exercised (1,756,629 ) 6.66 Canceled (994,534 ) 10.40
Outstanding — December 31, 2013 — $ —

GRAPHIC PACKAGING HOLDING COMPANY NOTES TO CONSOLIDATED FINANCIAL STATEMENTS - (Conti nued)
Data concerning RSUs and stock awards granted in the years ended December 31:
A summary of the changes in the number of unvested RSUs from December 31, 2010 to December 31, 2013 is presented below:
The initial value of the RSUs is based on the market value of the Company’s common stock on the date of grant. RSUs payable in cash are
subject to variable accounting and marked to market accordingly. RSUs payable in cash are recorded as liabilities, whereas the RSUs payable in shares are recorded in Shareholders’ Equity. The unrecognized expense at December 31, 2013 is approximately $ 25 million and is expected to be recognized over a weighted average period of 2 years.
The value of stock awards granted to the Company's directors are based on the market value of the Company’s common stock on the date of grant. These awards are unrestricted on the date of grant.
During 2013 , 2012 and 2011 , $ 19.0 million , $ 27.8 million and $ 17.6 million , respectively, were charged to compensation expense for stock incentive plans. During 2013, 2012 and 2011, cash payments for share-based liabilities were $13.3 million, $21.3 million and $12.0 million, respectively.
During 2013, 2012, and 2011, RSUs with an aggregate fair value of $ 27.3 million , $ 20.7 million and $ 0.7 million , respectively, vested and
were paid out. Approximately two-thirds of each of these amounts were payable in shares of common stock and one-third was payable in cash. The RSUs vested in 2013 were granted primarily during 2010.
62
2013 2012 2011
RSUs — Employees 3,335,039 3,793,045 3,979,591 Weighted-average grant date fair value $ 7.34 $ 5.44 $ 5.16 Stock Awards — Board of Directors 103,842 207,288 198,888 Weighted-average grant date fair value $ 7.80 $ 5.21 $ 5.43
Shares
Weighted Average Grant Date Fair
Value
Outstanding — December 31, 2010 13,843,484 $ 2.05 Granted 3,979,591 5.16 Released (276,700 ) 1.75 Forfeited (787,524 ) 2.94
Outstanding — December 31, 2011 16,758,851 $ 2.75 Granted 3,793,045 5.44 Released (8,024,847 ) 1.09 Forfeited (216,762 ) 4.53
Outstanding — December 31, 2012 12,310,287 $ 4.63 Granted 3,335,039 7.34 Released (5,299,116 ) 3.94 Forfeited (510,077 ) 5.94
Outstanding — December 31, 2013 9,836,133 $ 5.86

GRAPHIC PACKAGING HOLDING COMPANY NOTES TO CONSOLIDATED FINANCIAL STATEMENTS - (Conti nued)
DEFINED BENEFIT PLANS
The Company maintains both defined benefit pension plans and postretirement health care plans that provide medical and life insurance
coverage to eligible salaried and hourly retired employees in North America and their dependents. The Company maintains international defined benefit pension plans which are both noncontributory and contributory and are funded in accordance with applicable local laws. Pension or termination benefits are based primarily on years of service and the employees’ compensation.
Currently, the North American plans are closed to newly-hired salaried and non-union hourly employees. Effective July 1, 2011 , the North American plans were frozen for most salaried and non-union hourly employees and replaced with a defined contribution plan.
The U.K. and Canada defined benefit plans were frozen effective March 31, 2001 and December 21, 2009 respectively, and replaced with a
defined contribution plan. The Company assumed additional defined benefit plans due to the European Acquisitions and DNK Transaction.
Pension and Postretirement Expense
The pension and postretirement expenses related to the Company’s plans consisted of the following:
63
NOTE 7. PENSIONS AND OTHER POSTRETIREMENT BENEFITS
Pension Benefits Postretirement Benefits
Year Ended December 31,
In millions 2013 2012 2011 2013 2012 2011
Components of Net Periodic Cost:
Service Cost $ 16.3 $ 18.3 $ 19.3 $ 1.2 $ 1.2 $ 1.1 Interest Cost 52.2 51.1 52.2 2.0 2.3 2.5 Expected Return on Plan Assets (68.0 ) (58.1 ) (58.3 ) — — — Amortization:
Prior Service Cost (Credit) 0.7 0.7 0.5 (0.4 ) (0.2 ) (0.2 )
Actuarial Loss (Gain) 36.1 30.1 13.4 (1.1 ) (1.4 ) (1.7 )
Special Termination Benefit 1.2 — — — — — Other 0.7 0.4 (0.5 ) — (0.1 ) —
Net Periodic Cost $ 39.2 $ 42.5 $ 26.6 $ 1.7 $ 1.8 $ 1.7

GRAPHIC PACKAGING HOLDING COMPANY NOTES TO CONSOLIDATED FINANCIAL STATEMENTS - (Conti nued)
Certain assumptions used in determining the pension and postretirement expenses were as follows:
64
Pension Benefits Postretirement Benefits
Year Ended December 31,
2013 2012 2011 2013 2012 2011
Weighted Average Assumptions:
Discount Rate 4.20 % 4.85 % 5.74 % 3.97 % 4.74 % 5.48 %
Rate of Increase in Future Compensation Levels 2.03 % 2.16 % 2.16 % — — — Expected Long-Term Rate of Return on Plan Assets 7.60 % 7.90 % 7.96 % — — — Initial Health Care Cost Trend Rate — — — 9.00 % 8.00 % 8.50 %
Ultimate Health Care Cost Trend Rate — — — 4.50 % 5.00 % 5.00 %
Ultimate Year — — — 2023 2018 2018

GRAPHIC PACKAGING HOLDING COMPANY NOTES TO CONSOLIDATED FINANCIAL STATEMENTS - (Conti nued)
Funded Status
The following table sets forth the funded status of the Company’s pension and postretirement plans as of December 31:
65
Pension Benefits Postretirement Benefits
In millions 2013 2012 2013 2012
Change in Benefit Obligation:
Benefit Obligation at Beginning of Year $ 1,288.9 $ 1,069.8 $ 56.4 $ 53.0 Service Cost 16.3 18.3 1.2 1.2 Interest Cost 52.2 51.1 2.0 2.3 Actuarial (Gain) Loss (91.4 ) 101.8 (8.3 ) 3.0 Foreign Currency Exchange 3.4 6.7 — — Curtailment Gain (0.3 ) (0.2 ) — — Acquisitions — 82.0 — — Benefits Paid (51.8 ) (45.0 ) (1.8 ) (3.2 )
Amendments — 4.5 (1.8 ) — Other 1.6 (0.1 ) 0.2 0.1 Benefit Obligation at End of Year $ 1,218.9 $ 1,288.9 $ 47.9 $ 56.4
Change in Plan Assets:
Fair Value of Plan Assets at Beginning of Year $ 921.3 $ 754.5 $ — $ — Actual Return on Plan Assets 142.1 93.9 — — Employer Contributions 51.5 55.1 1.8 3.2 Foreign Currency Exchange 2.8 6.2 — — Benefits Paid (51.8 ) (45.0 ) (1.8 ) (3.2 )
Acquisitions — 57.4 — — Other (0.2 ) (0.8 ) — — Fair Value of Plan Assets at End of Year $ 1,065.7 $ 921.3 $ — $ — Plan Assets Less than Projected Benefit Obligation $ (153.2 ) $ (367.6 ) $ (47.9 ) $ (56.4 )
Amounts Recognized in the Consolidated Balance Sheets Consist of:
Pension Assets $ 0.7 $ — $ — $ — Accrued Pension and Postretirement Benefits Liability — Current $ (1.1 ) $ (0.8 ) $ (2.5 ) $ (2.5 )
Accrued Pension and Postretirement Benefits Liability — Noncurrent $ (152.8 ) $ (366.8 ) $ (45.4 ) $ (53.9 )
Accumulated Other Comprehensive Income:
Net Actuarial Loss (Gain) $ 154.8 $ 356.7 $ (11.9 ) $ (4.7 )
Prior Service Cost (Credit) $ 3.6 $ 4.3 $ (2.2 ) $ (0.8 )
Weighted Average Calculations:
Discount Rate 4.86 % 4.20 % 4.74 % 3.97 %
Rates of Increase in Future Compensation Levels 1.88 % 2.03 % — — Initial Health Care Cost Trend Rate — — 7.50 % 9.00 %
Ultimate Health Care Cost Trend Rate — — 4.77 % 4.50 %
Ultimate Year — — 2027 2023

GRAPHIC PACKAGING HOLDING COMPANY NOTES TO CONSOLIDATED FINANCIAL STATEMENTS - (Conti nued)
66
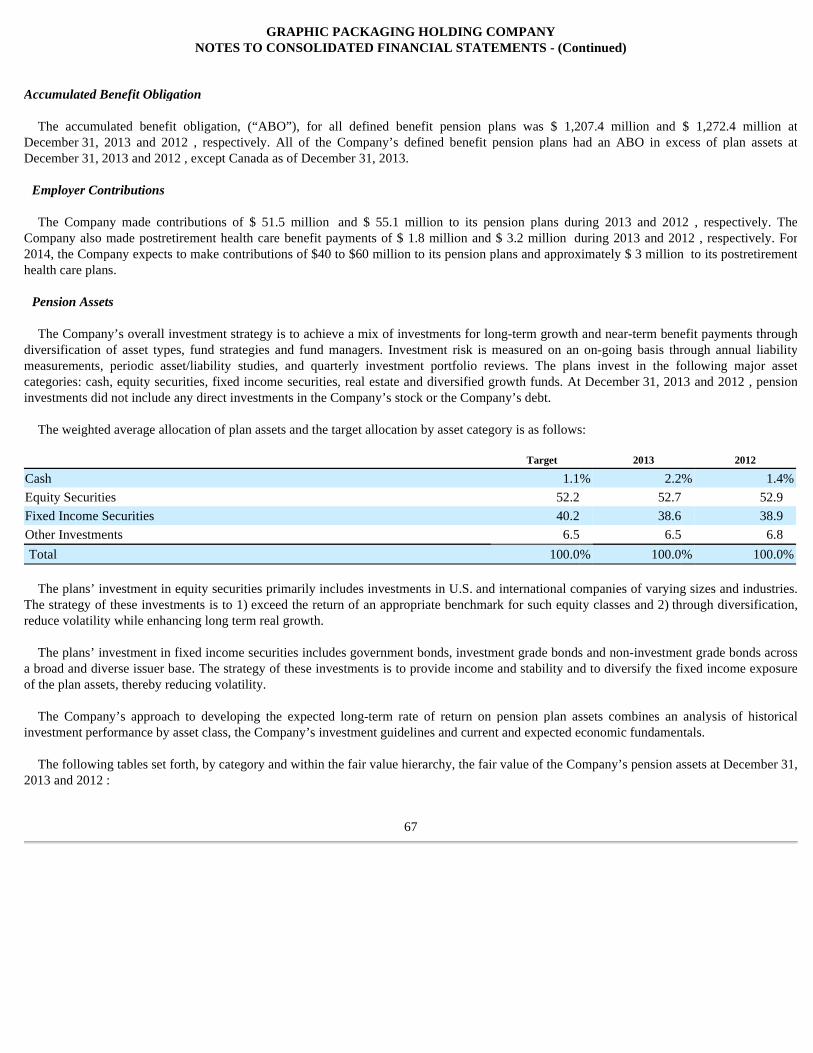
GRAPHIC PACKAGING HOLDING COMPANY NOTES TO CONSOLIDATED FINANCIAL STATEMENTS - (Conti nued)
Accumulated Benefit Obligation
The accumulated benefit obligation, (“ABO”), for all defined benefit pension plans was $ 1,207.4 million and $ 1,272.4 million at December 31, 2013 and 2012 , respectively. All of the Company’s defined benefit pension plans had an ABO in excess of plan assets at December 31, 2013 and 2012 , except Canada as of December 31, 2013.
Employer Contributions
The Company made contributions of $ 51.5 million and $ 55.1 million to its pension plans during 2013 and 2012 , respectively. The Company also made postretirement health care benefit payments of $ 1.8 million and $ 3.2 million during 2013 and 2012 , respectively. For 2014, the Company expects to make contributions of $40 to $60 million to its pension plans and approximately $ 3 million to its postretirement health care plans.
Pension Assets
The Company’s overall investment strategy is to achieve a mix of investments for long-term growth and near-term benefit payments through
diversification of asset types, fund strategies and fund managers. Investment risk is measured on an on-going basis through annual liability measurements, periodic asset/liability studies, and quarterly investment portfolio reviews. The plans invest in the following major asset categories: cash, equity securities, fixed income securities, real estate and diversified growth funds. At December 31, 2013 and 2012 , pension investments did not include any direct investments in the Company’s stock or the Company’s debt.
The weighted average allocation of plan assets and the target allocation by asset category is as follows:
The plans’ investment in equity securities primarily includes investments in U.S. and international companies of varying sizes and industries.
The strategy of these investments is to 1) exceed the return of an appropriate benchmark for such equity classes and 2) through diversification, reduce volatility while enhancing long term real growth.
The plans’ investment in fixed income securities includes government bonds, investment grade bonds and non-investment grade bonds across a broad and diverse issuer base. The strategy of these investments is to provide income and stability and to diversify the fixed income exposure of the plan assets, thereby reducing volatility.
The Company’s approach to developing the expected long-term rate of return on pension plan assets combines an analysis of historical investment performance by asset class, the Company’s investment guidelines and current and expected economic fundamentals.
The following tables set forth, by category and within the fair value hierarchy, the fair value of the Company’s pension assets at December 31, 2013 and 2012 :
67
Target 2013 2012
Cash 1.1 % 2.2 % 1.4 %
Equity Securities 52.2 52.7 52.9 Fixed Income Securities 40.2 38.6 38.9 Other Investments 6.5 6.5 6.8 Total 100.0 % 100.0 % 100.0 %

GRAPHIC PACKAGING HOLDING COMPANY NOTES TO CONSOLIDATED FINANCIAL STATEMENTS - (Conti nued)
(a) The Level 2 investments are held in pooled funds and fair value is determined by net asset value, based on the underlying investments, as reported on the valuation date. (b) The fund invests in a combination of traditional investments (equities, bonds, and foreign exchange), seeking to achieve returns through active asset allocation over a three to five year horizon.
Postretirement Health Care Trend Rate Sensitivity
Assumed health care cost trend rates affect the amounts reported for postretirement health care benefit plans. A one-percentage-point change in assumed health care cost trend rates would have the following effects on 2013 data:
68
Fair Value Measurements at December 31, 2013
In millions
Total
Quoted Prices in Active Markets for
Identical Assets (Level 1)
Significant Observable Inputs
(Level 2)
Significant Unobservable Inputs
(Level 3)
Asset Category:
Cash (a) $ 23.8 $ 4.5 $ 19.3 $ — Equity Securities:
Domestic (a) 378.0 75.8 302.2 — Foreign (a) 183.1 64.7 118.4 —
Fixed Income Securities (a) 411.3 261.8 149.5 — Other Investments:
Real estate (a) 20.9 — 20.9 — Diversified growth fund (b) 48.6 — 48.6 — Total $ 1,065.7 $ 406.8 $ 658.9 $ —
Fair Value Measurements at December 31, 2012
In millions Total
Quoted Prices in Active Markets for
Identical Assets (Level 1)
Significant Observable Inputs
(Level 2)
Significant Unobservable Inputs
(Level 3)
Asset Category:
Cash (a) $ 13.2 $ 3.0 $ 10.2 $ — Equity Securities:
Domestic (a) 319.1 63.6 255.5 — Foreign (a) 168.6 76.6 92.0 —
Fixed Income Securities (a) 357.7 217.3 140.4 — Other Investments:
Real estate (a) 18.7 — 18.7 — Diversified growth fund (b) 44.0 — 44.0 — Total $ 921.3 $ 360.5 $ 560.8 $ —
One Percentage Point
In millions Increase Decrease
Health Care Cost Trend Rate Sensitivity:
Effect on Total Interest and Service Cost Components $ 0.3 $ (0.3 )
Effect on Year-End Postretirement Benefit Obligation $ 3.2 $ (2.7 )

GRAPHIC PACKAGING HOLDING COMPANY NOTES TO CONSOLIDATED FINANCIAL STATEMENTS - (Conti nued)
Estimated Future Benefit Payments
The following represents the Company’s estimated future pension and postretirement health care benefit payments through the year 2023:
Amounts in Accumulated Other Comprehensive Loss Expected to Be Recognized in Net Periodic Benefit Costs in 2014
During 2014 , amounts recorded in Accumulated Other Comprehensive Loss expected to be recognized in Net Periodic Benefit Costs are as
follows:
Multi -Employer Plans
Certain of the Company’s employees participate in multi-employer plans that provide both pension and other postretirement health care benefits to employees under union-employer organization agreements. Expense related to ongoing participation in these plans for the years ended December 31, 2013 and 2012 was $ 5.7 million and $ 8.1 million , respectively.
Estimated liabilities have been established related to the partial or complete withdrawal from certain multi-employment benefit plans for
facilities which have been closed. At December 31, 2013, and December 31, 2012, the Company has $ 25.4 million and $ 24.2 million , respectively, recorded in Other Noncurrent Liabilities for these withdrawal liabilities which represents the Company's best estimate of the expected withdrawal liability.
69
In millions Pension Plans Postretirement
Health Care Benefits
2014 $ 79.5 $ 2.8 2015 56.9 3.1 2016 60.2 3.5 2017 63.6 3.7 2018 67.0 3.9 2019— 2023 378.4 21.1
In millions Pension Benefits
Postretirement Health Care Benefits
Recognition of Prior Service Cost $ 0.7 $ 0.3 Recognition of Actuarial Loss (Gain) 12.1 (1.1 )

GRAPHIC PACKAGING HOLDING COMPANY NOTES TO CONSOLIDATED FINANCIAL STATEMENTS - (Conti nued)
The Company's remaining participation in multi-employer pension plans consists of contributions to three plans under the terms contained in collective bargaining agreements. The risks of participating in these multi-employer plans are different from single-employer plans in the following ways:
The Company recorded charges of $ 1.5 million during 2013 related to the complete withdrawal from the United Food and Commercial
Workers International Union - Industry Pension Fund and $ 1.0 million during 2011 related to the partial withdrawal from the Paper Industry Union - Pension Fund ("PIUMP"). There were no similar charges recorded for the year ended December 31, 2012. While it is not possible to quantify the potential impact of future actions, further reductions in participation or withdrawal from these multi-employer pension plans could have a material impact on the Company's results of operations, financial position, or cash flows.
The Company's participation in these plans for the year ended December 31, 2013, 2012 and 2011 is shown in the table below:
The EIN Number column provides the Employer Identification Number (EIN). Unless otherwise noted, the most recent Pension Protection
Act (PPA) zone status available in 2013 and 2012 is for the plan's year-end at December 31, 2012 and December 31, 2011, respectively. The zone status is based on information that the Company receives from the plan and is certified by the plan's actuary. Among other factors, plans in the red zone are generally less than 65 percent funded, plans in the yellow zone are less than 80 percent funded, and plans in the green zone are at least 80 percent funded. The "FIP/RP Status Implemented" column indicates plans for which a Financial Improvement Plan (FIP) or Rehabilitation Plan (RP) has been implemented. The Company's share of the contributions to these plans did not exceed 5% of total plan contributions for the most recent plan year. DEFINED CONTRIBUTION PLANS
The Company provides defined contribution plans for eligible U.S. employees. The Company’s contributions to the plans are based upon employee contributions, a percentage of eligible compensation, and the Company’s annual operating results. Contributions to these plans for the years ended December 31, 2013 , 2012 and 2011 were $ 27.9 million , $ 23.7 million and $ 22.9 million , respectively.
70
a. Assets contributed to the multi-employers plan by one employer may be used to provide benefits to employees of other participating employers.
b. If a participating employer stops contributing to the plan, the unfunded obligation of the plan may be borne by the remaining participating employers.
c. If a company chooses to stop participating in a multi-employer plan, a company may be required to pay that plan an amount based on the underfunded status of the plan, referred to as the withdrawal liability.
Pension Protection
Act Zone Status
Company Contributions (in
millions)
Multi-employer Pension Fund EIN/Pension Plan
Number 2013 2012 FIP/RP Status Implemented 2013 2012 2011
Surcharged Imposed
Expiration Date of Bargaining Agreement
Central States Southeast and Southwest Areas Pension Fund
36-6044243/001 Red Red Yes $ 0.1
$ 0.1
$ 0.1
Yes 7/31/2014
PIUMP 11-6166763/001 Red Red Yes 0.4
0.5
0.5
Yes 9/30/2014
Western Conference of Teamsters Pension Trust - Northwest Area
91-6145047/001 Green Green No 0.1
0.1
0.1
No 4/30/2014
Total $ 0.6 $ 0.7 $ 0.7

GRAPHIC PACKAGING HOLDING COMPANY NOTES TO CONSOLIDATED FINANCIAL STATEMENTS - (Conti nued)
The U.S. and international components of Income before Income Taxes and Equity Income of Unconsolidated Entities consisted of the
following:
The provisions for Income Tax (Expense) Benefit on Income before Income Taxes and Equity Income of Unconsolidated Entities consisted of
the following:
A reconciliation of Income Tax (Expense) Benefit on Income before Income Taxes and Equity Income of Unconsolidated Entities at the federal statutory rate of 35% compared with the Company’s actual Income Tax (Expense) Benefit is as follows:
71
NOTE 8. INCOME TAXES
Year Ended December 31,
In millions 2013 2012 2011
U.S. $ 252.0 $ 200.4 $ 53.8 International (39.4 ) (0.1 ) (10.5 )
Income before Income Taxes and Equity Income of Unconsolidated Entities $ 212.6 $ 200.3 $ 43.3
Year Ended December 31,
In millions 2013 2012 2011
Current (Expense) Benefit:
U.S. $ (1.4 ) $ (3.4 ) $ (3.4 )
International (3.3 ) (3.1 ) (5.2 )
Total Current $ (4.7 ) $ (6.5 ) $ (8.6 )
Deferred (Expense) Benefit:
U.S. (65.3 ) (76.0 ) 238.9 International 2.6 — (0.5 )
Total Deferred $ (62.7 ) $ (76.0 ) $ 238.4 Income Tax (Expense) Benefit $ (67.4 ) $ (82.5 ) $ 229.8

GRAPHIC PACKAGING HOLDING COMPANY NOTES TO CONSOLIDATED FINANCIAL STATEMENTS - (Conti nued)
During 2013, the Company determined, based on additional guidance published by the Internal Revenue Service, that it is more likely than not that certain excise tax credit refunds received in 2009 are excludable from taxable income. As a result, the Company will amend its 2009 federal and state income tax returns which will result in an increase in the overall net operating loss carryforward.
The tax effects of differences that give rise to significant portions of the deferred income tax assets and deferred income tax liabilities as of December 31 were as follows:
72
Year Ended December 31,
In millions 2013 Percent 2012 Percent 2011 Percent
Income Tax Expense at U.S. Statutory Rate $ (74.4 ) 35.0 % $ (70.1 ) 35.0 % $ (15.2 ) 35.0 %
U.S. State and Local Tax (Expense) Benefit (7.7 ) 3.6 (6.3 ) 3.1 (4.2 ) 9.8 Goodwill Impairment — — — — (18.5 ) 42.7 Capital Loss on Subsidiary Stock 5.4 (2.6 ) — — — — Permanent Items (3.5 ) 1.7 (3.4 ) 1.6 (2.4 ) 5.6 Change in Valuation Allowance (15.2 ) 7.2 (1.8 ) 0.9 262.8 (606.8 )
International Tax Rate Differences 2.9 (1.4 ) 0.4 (0.1 ) (1.4 ) 3.2 Foreign Withholding Tax (0.4 ) 0.2 (0.2 ) 0.1 (0.6 ) 1.3 Undistributed Foreign Earnings — — — — 8.6 (20.0 )
Non taxable excise tax credit refunds 29.4 (13.8 ) — — — — Change in tax rate (3.6 ) 1.7 — — — — Adjustment to Tax Contingencies — — (0.1 ) 0.1 0.2 (0.5 )
Other (0.3 ) 0.1 (1.0 ) 0.5 0.5 (1.0 )
Income Tax (Expense) Benefit $ (67.4 ) 31.7 % $ (82.5 ) 41.2 % $ 229.8 (530.7 )%
In millions 2013 2012
Current Deferred Income Tax Assets:
Compensation Based Accruals $ 33.5 $ 33.4 Current Portion of Net Operating Loss Carryforward 127.1 95.5 Other 15.3 12.4 Valuation Allowance (4.6 ) (2.0 )
Net Current Deferred Income Tax Assets $ 171.3 $ 139.3 Noncurrent Deferred Income Tax Assets (Liabilities):
Net Operating Loss Carryforwards $ 257.3 $ 295.0 Postretirement Benefits 80.6 162.7 Tax Credits 13.1 13.2 Other 22.7 41.7 Valuation Allowance (45.5 ) (35.3 )
Property, Plant and Equipment (258.2 ) (233.6 )
Goodwill (270.3 ) (250.3 )
Other Intangibles (120.7 ) (131.1 )
Net Noncurrent Deferred Income Tax Liabilities $ (321.0 ) $ (137.7 )
Net Deferred Income Tax (Liability) Asset $ (149.7 ) $ 1.6

GRAPHIC PACKAGING HOLDING COMPANY NOTES TO CONSOLIDATED FINANCIAL STATEMENTS - (Conti nued)
The Company has total deferred income tax assets, excluding valuation allowance, of $ 565.5 million and $ 674.6 million as of December 31, 2013 and 2012 , respectively. The Company has total deferred income tax liabilities of $ 665.1 million and $ 635.4 million as of December 31, 2013 and 2012 , respectively.
During 2011, the Company recognized $265.2 million of Income Tax Benefit associated with the release of its U.S. federal and of a substantial portion of its state deferred tax valuation allowance. According to the Income Taxes topic of the FASB Codification, a valuation allowance is required to be established or maintained when, based on currently available information and other factors, it is more likely than not that all or a portion of a deferred tax asset will not be realized. The FASB Codification provides important factors in determining whether a deferred tax asset will be realized, including whether there has been sufficient pretax income in recent years and whether sufficient income can reasonably be expected in future years in order to utilize the deferred tax asset.
The Company has evaluated the need to maintain a valuation allowance for deferred tax assets based on its assessment of whether it is more likely than not that deferred tax assets will be realized through the generation of future taxable income. Appropriate consideration was given to all available evidence, both positive and negative, in assessing the need for a valuation allowance. In 2011, this evaluation resulted in the determination that the Company's valuation allowance on its U.S. federal and a substantial portion of its state deferred tax assets could be released. The qualitative and quantitative analysis of current and expected earnings, tax planning strategies, and general business risks resulted in a more likely than not conclusion of being able to realize a substantial portion of these deferred tax assets.
The Company reviewed its deferred income tax assets as of December 31, 2013 and 2012 , respectively, and determined that it is more likely than not that a portion will not be realized. A valuation allowance of $ 50.1 million and $ 37.3 million at December 31, 2013 and 2012 , respectively, is maintained on the deferred income tax assets for which the Company has determined that realization is not more likely than not. Of the total valuation allowance at December 31, 2013 , $ 37.4 million relates to net deferred tax assets in certain foreign jurisdictions, $ 5.4 million relates to a deferred tax asset related to a U.S. federal capital loss carryforward and the remaining $ 7.3 million relates to net operating losses in certain U.S.states. The need for a valuation allowance is made on a jurisdiction-by-jurisdiction basis. As of December 31, 2013 , the Company concluded that due to cumulative pretax losses and the lack of sufficient future taxable income of the appropriate character, realization is less than more likely than not on the deferred income tax assets related primarily to the Company’s Brazil, Canada, China, France, Spain, Germany, and certain U.S. federal and state deferred balances.
The following table represents a summary of the valuation allowances against deferred tax assets as of and for the three years ended December 31, 2013 , 2012 , and 2011 , respectively:
The U.S. federal net operating loss carryforwards expire as follows:
73
December 31,
In millions 2013 2012 2011
Balance Beginning of Period $ 37.3 $ 37.0 $ 308.3 Charges (Credits) 15.2 1.8 (262.8 )
Deductions (2.4 ) (1.5 ) (8.5 )
Balance at End of Period $ 50.1 $ 37.3 $ 37.0

GRAPHIC PACKAGING HOLDING COMPANY NOTES TO CONSOLIDATED FINANCIAL STATEMENTS - (Conti nued)
U.S. state net operating loss carryforward amounts total $ 731.6 million and expire in various years through 2031. International net operating loss carryforward amounts total $ 140.0 million , of which substantially all have no expiration date.
Tax Credit carryforwards total $ 13.1 million , of which approximately $ 10 million have no expiration date, and the remainder expire starting
in 2020.
As of December 31, 2013 , the Company has only provided for deferred U.S. income taxes on $ 4.6 million of undistributed earnings related to the Company's equity investment in the joint venture, Rengo Riverwood Packaging, Ltd. The Company has not provided for deferred U.S. income taxes on approximately $ 8.1 million of undistributed earnings of international subsidiaries because of its intention to indefinitely reinvest these earnings outside the U.S. The determination of the amount of the unrecognized deferred U.S. income tax liability on these unremitted earnings is not practicable because of the complexities associated with the hypothetical calculation.
Uncertain Tax Positions
A reconciliation of the beginning and ending amount of unrecognized tax benefits is as follows:
At December 31, 2013 , $ 0.8 million of the total gross unrecognized tax benefits, if recognized, would affect the annual effective income tax
rate.
The Company recognizes potential accrued interest and penalties related to unrecognized tax benefits within its global operations in Income Tax Expense. The Company did not have a significant accrual for the payment of interest and penalties at December 31, 2013 and 2012 .
The Company anticipates that total unrecognized tax benefits of $ 6.6 million could change within the next 12 months.
The Company files income tax returns in the U.S. federal jurisdiction, and various states and foreign jurisdictions. With few exceptions, the Company is no longer subject to U.S. federal, state and local tax examinations for years before 2010 or non-U.S. income tax examinations for years before 2004.
74
In millions
2018 $ 137.4 2019 193.0 2021 140.8 2022 67.9 2023 117.8 2025 22.3 2026 91.8 2027 10.6 2028 110.7 Total $ 892.3
In millions 2013 2012
Balance at January 1, $ 0.8 $ 0.5 Additions for Tax Positions of Prior Years 6.6 0.3 Reductions for Tax Positions of Prior Years — — Balance at December 31, $ 7.4 $ 0.8
NOTE 9. FINANCIAL INSTRUMENTS, DERIVATIVES AND HEDGING ACTI VITIES
GRAPHIC PACKAGING HOLDING COMPANY NOTES TO CONSOLIDATED FINANCIAL STATEMENTS - (Conti nued)
The Company enters into derivative instruments for risk management purposes only, including derivatives designated as hedging instruments under the Derivatives and Hedging topic of the FASB Codification and those not designated as hedging instruments under this guidance. The Company uses interest rate swaps, natural gas swap contracts, and forward exchange contracts. These derivative instruments are designated as cash flow hedges and, to the extent they are effective in offsetting the variability of the hedged cash flows, changes in the derivatives’ fair value are not included in current earnings but are included in Accumulated Other Comprehensive Loss. These changes in fair value will subsequently be reclassified to earnings.
Interest Rate Risk
The Company uses interest rate swaps to manage interest rate risks on future interest payments caused by interest rate changes on its variable rate term loan facility. The differential to be paid or received under these agreements is recognized as an adjustment to Interest Expense related to the debt. At December 31, 2013 , the Company had interest rate swap agreements with a notional amount of $ 560 million which expire in April 2016 under which the Company will pay fixed rates of 0.45% to 0.82% and receive one-month LIBOR rates.
These derivative instruments are designated as cash flow hedges and, to the extent they are effective in offsetting the variability of the hedged cash flows, changes in the derivatives’ fair value are not included in current earnings but are included in Accumulated Other Comprehensive Income (Loss). These changes in fair value will subsequently be reclassified into earnings as a component of Interest Expense as interest is incurred on amounts outstanding under the term loan facility. Ineffectiveness measured in the hedging relationship is recorded in earnings in the period it occurs.
During 2013 and 2012 , there were minimal amounts of ineffectiveness. Additionally, there were no amounts excluded from the measure of effectiveness.
Commodity Risk
To manage risks associated with future variability in cash flows and price risk attributable to certain commodity purchases, the Company enters into natural gas swap contracts to hedge prices for a designated percentage of its expected natural gas usage. The Company has hedged a portion of its expected usage for 2014. Such contracts are designated as cash flow hedges. The contracts are carried at fair value with changes in fair value recognized in Other Comprehensive Income (Loss), and the resulting gain or loss is reclassified into Cost of Sales concurrently with the recognition of the commodity purchased. The ineffective portion of the swap contract’s change in fair value, if any, would be recognized immediately in earnings.
During 2013 and 2012 , there were minimal amounts of ineffectiveness related to changes in the fair value of natural gas swap contracts. Additionally, there were no amounts excluded from the measure of effectiveness.
Foreign Currency Risk
The Company enters into forward exchange contracts to manage risks associated with future variability in cash flows resulting from anticipated foreign currency transactions that may be adversely affected by changes in exchange rates. Such contracts are designated as cash flow hedges. The contracts are carried at fair value with changes in fair value recognized in Accumulated Other Comprehensive Income (Loss), and gains/losses related to these contracts are recognized in Other Income, Net when the anticipated transaction affects income.
At December 31, 2013 and 2012 , multiple forward exchange contracts existed that expire on various dates throughout the following year. Those purchased forward exchange contracts outstanding at December 31, 2013 and 2012 , when aggregated and measured in U.S. dollars at contractual rates at December 31, 2013 and 2012 , had notional amounts totaling $ 65.3 million and $ 63.9 million , respectively.
No amounts were reclassified to earnings during 2013 and 2012 in connection with forecasted transactions that were no longer considered probable of occurring, and there was no amount of ineffectiveness related to changes in the fair value of foreign currency forward contracts. Additionally, there were no amounts excluded from the measure of effectiveness during 2013 and 2012 .
Derivatives not Designated as Hedges
75

GRAPHIC PACKAGING HOLDING COMPANY NOTES TO CONSOLIDATED FINANCIAL STATEMENTS - (Conti nued)
The Company enters into forward exchange contracts to effectively hedge substantially all of accounts receivable resulting from transactions denominated in foreign currencies in order to manage risks associated with foreign currency transactions adversely affected by changes in exchange rates. At December 31, 2013 and 2012 , multiple foreign currency forward exchange contracts existed, with maturities ranging up to three months. Those foreign currency exchange contracts outstanding at December 31, 2013 and 2012 , when aggregated and measured in U.S. dollars at exchange rates at December 31, 2013 and 2012 , respectively, had net notional amounts totaling $ 32.5 million and $ 19.5 million . Unrealized gains and losses resulting from these contracts are recognized in Other Income, Net and approximately offset corresponding recognized but unrealized gains and losses on these accounts receivable. Foreign Currency Movement Effect
Net currency exchange gains (losses) included in determining Income from Operations for the years ended December 31, 2013 , 2012 and 2011 were $ 5.4 million , $ 1.1 million and $ (4.2) million , respectively.
The Company follows the fair value guidance integrated into the Fair Value Measurements and Disclosures topic of the FASB Codification in regards to financial and nonfinancial assets and liabilities. Nonfinancial assets and nonfinancial liabilities include those measured at fair value in goodwill impairment testing, asset retirement obligations initially measured at fair value, and those assets and liabilities initially measured at fair value in a business combination.
The FASB’s guidance defines fair value, establishes a framework for measuring fair value and expands the fair value disclosure requirements. The accounting guidance applies to accounting pronouncements that require or permit fair value measurements. It indicates, among other things, that a fair value measurement assumes that the transaction to sell an asset or transfer a liability occurs in the principal market for the asset or liability or, in the absence of a principal market, the most advantageous market for the asset or liability. The guidance defines fair value based upon an exit price model, whereby fair value is the price that would be received to sell an asset or paid to transfer a liability in an orderly transaction between market participants at the measurement date. The guidance clarifies that fair value should be based on assumptions that market participants would use, including a consideration of non-performance risk.
Valuation Hierarchy
The Fair Value Measurements and Disclosures topic establishes a valuation hierarchy for disclosure of the inputs to valuation used to measure fair value. This hierarchy prioritizes the inputs into three broad levels as follows:
Level 1 inputs — quoted prices (unadjusted) in active markets for identical assets or liabilities.
Level 2 inputs — quoted prices for similar assets and liabilities in active markets or inputs that are observable for the asset or liability, either directly or indirectly through market corroboration, for substantially the full term of the financial instrument.
Level 3 inputs — unobservable inputs based on the Company’s own assumptions used to measure assets and liabilities at fair value.
An asset or liability’s classification within the hierarchy is determined based on the lowest level input that is significant to the fair value measurement.
The Company has determined that its financial assets and financial liabilities include derivative instruments which are carried at fair value and are valued using Level 2 inputs in the fair value hierarchy. The Company uses valuation techniques based on discounted cash flow analyses, which reflects the terms of the derivatives and uses observable market-based inputs, including forward rates and uses market price quotations obtained from independent derivatives brokers, corroborated with information obtained from independent pricing service providers. Fair Value of Financial Instruments
76
NOTE 10. FAIR VALUE MEASUREMENT

GRAPHIC PACKAGING HOLDING COMPANY NOTES TO CONSOLIDATED FINANCIAL STATEMENTS - (Conti nued)
The fair value of the Company’s derivative instruments is as follows:
As of December 31, 2013 , there has not been any significant impact to the fair value of the Company’s derivative liabilities due to its own
credit risk. Similarly, there has not been any significant adverse impact to the Company’s derivative assets based on evaluation of the Company’s counterparties’ credit risks.
The fair values of the Company’s other financial assets and liabilities at December 31, 2013 and 2012 approximately equal the carrying values reported on the Consolidated Balance Sheets except for Long-Term Debt. The fair value of the Company’s Long-Term Debt (excluding capital leases) was $ 2,267.6 million and $ 2,399.1 million as compared to the carrying amounts of $ 2,248.0 million and $ 2,325.5 million as of December 31, 2013 and 2012 , respectively. The fair value of the Company's Long-Term Debt, including the Senior Notes, are based on quoted market prices (Level 2 inputs). Level 2 valuation techniques for Long-Term Debt are based on quotations obtained from independent pricing service providers.
Effect of Derivative Instruments
The pre-tax effect of derivative instruments in cash flow hedging relationships on the Company’s Consolidated Statements of Operations for the year ended December 31, 2013 and 2012 is as follows:
The effect of derivative instruments not designated as hedging instruments on the Company’s Consolidated Statements of Operations for the
years ended December 31, 2013 and 2012 is as follows:
77
Derivative Assets Derivative Liabilities
Balance Sheet December 31, December 31, Balance Sheet December 31, December 31,
In millions Location 2013 2012 Location 2013 2012
Derivative Contracts Designated as Hedging Instruments
Commodity Contracts Other Current Assets $ 0.8 $ — Other Accrued Liabilities $ — $ 0.2
Foreign Currency Contracts Other Current Assets 1.5 0.1 Other Accrued Liabilities 0.6 0.2
Interest Rate Swap Agreements Other Current Assets — —
Other Accrued Liabilities, Other Noncurrent Liabilities and Interest Payable 3.6 6.0
Derivative Contracts Not Designated as
Hedging Instruments
Foreign Currency Contracts Other Current Assets — — Other Accrued Liabilities 0.3 — Total Derivative Contracts $ 2.3 $ 0.1 $ 4.5 $ 6.4
Amount of Loss (Gain) Recognized in Accumulated Other
Comprehensive Loss
Location in Statement of Operations (Effective
Portion)
Amount of Loss (Gain) Recognized in Statement of
Operations (Effective Portion)
Location in Statement of Operations (Ineffective
Portion)
Location in Statement of Operations (Ineffective Portion)
Twelve Months Ended December
31, Twelve Months Ended December
31, Twelve Months Ended
December 31,
In millions 2013 2012 2013 2012 2013 2012
Commodity Contracts $ 0.2 $ 0.8 Cost of Sales $ 1.6 $ 2.4 Cost of Sales $ (0.1 ) $ (0.1 )
Foreign Currency Contracts (2.8 ) (0.9 ) Other Income, Net (2.2 ) (1.2 ) Other Income, Net — —
Interest Rate Swap Agreements 0.7 7.1 Interest Expense, Net $ 3.1 4.8 Interest Expense, Net — —
Total $ (1.9 ) $ 7.0 $ 2.5 $ 6.0 $ (0.1 ) $ (0.1 )
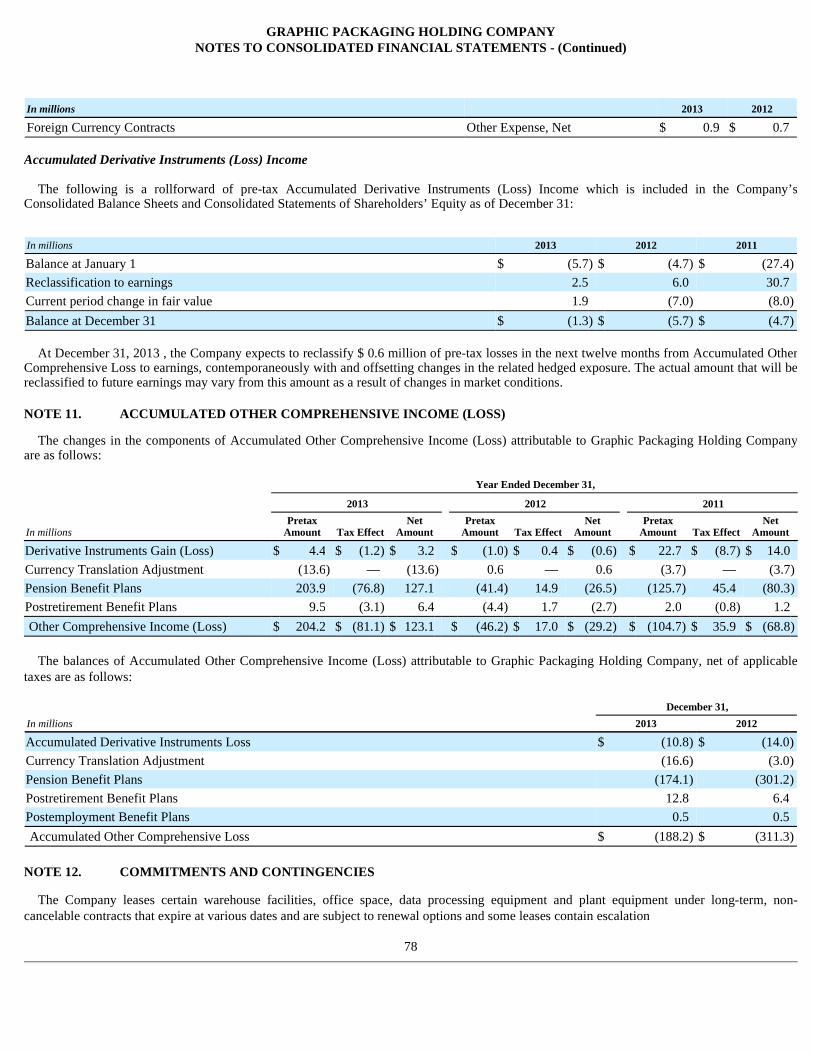
GRAPHIC PACKAGING HOLDING COMPANY NOTES TO CONSOLIDATED FINANCIAL STATEMENTS - (Conti nued)
Accumulated Derivative Instruments (Loss) Income
The following is a rollforward of pre-tax Accumulated Derivative Instruments (Loss) Income which is included in the Company’s Consolidated Balance Sheets and Consolidated Statements of Shareholders’ Equity as of December 31:
At December 31, 2013 , the Company expects to reclassify $ 0.6 million of pre-tax losses in the next twelve months from Accumulated Other
Comprehensive Loss to earnings, contemporaneously with and offsetting changes in the related hedged exposure. The actual amount that will be reclassified to future earnings may vary from this amount as a result of changes in market conditions.
The changes in the components of Accumulated Other Comprehensive Income (Loss) attributable to Graphic Packaging Holding Company are as follows:
The balances of Accumulated Other Comprehensive Income (Loss) attributable to Graphic Packaging Holding Company, net of applicable
taxes are as follows:
The Company leases certain warehouse facilities, office space, data processing equipment and plant equipment under long-term, non-cancelable contracts that expire at various dates and are subject to renewal options and some leases contain escalation
78
In millions 2013 2012
Foreign Currency Contracts Other Expense, Net $ 0.9 $ 0.7
In millions 2013 2012 2011
Balance at January 1 $ (5.7 ) $ (4.7 ) $ (27.4 )
Reclassification to earnings 2.5 6.0 30.7 Current period change in fair value 1.9 (7.0 ) (8.0 )
Balance at December 31 $ (1.3 ) $ (5.7 ) $ (4.7 )
NOTE 11. ACCUMULATED OTHER COMPREHENSIVE INCOME (LOSS)
Year Ended December 31,
2013 2012 2011
In millions
Pretax Amount Tax Effect
Net Amount
Pretax Amount Tax Effect
Net Amount
Pretax Amount Tax Effect
Net Amount
Derivative Instruments Gain (Loss) $ 4.4 $ (1.2 ) $ 3.2 $ (1.0 ) $ 0.4 $ (0.6 ) $ 22.7 $ (8.7 ) $ 14.0 Currency Translation Adjustment (13.6 ) — (13.6 ) 0.6 — 0.6 (3.7 ) — (3.7 )
Pension Benefit Plans 203.9 (76.8 ) 127.1 (41.4 ) 14.9 (26.5 ) (125.7 ) 45.4 (80.3 )
Postretirement Benefit Plans 9.5 (3.1 ) 6.4 (4.4 ) 1.7 (2.7 ) 2.0 (0.8 ) 1.2 Other Comprehensive Income (Loss) $ 204.2 $ (81.1 ) $ 123.1 $ (46.2 ) $ 17.0 $ (29.2 ) $ (104.7 ) $ 35.9 $ (68.8 )
December 31,
In millions 2013 2012
Accumulated Derivative Instruments Loss $ (10.8 ) $ (14.0 )
Currency Translation Adjustment (16.6 ) (3.0 )
Pension Benefit Plans (174.1 ) (301.2 )
Postretirement Benefit Plans 12.8 6.4 Postemployment Benefit Plans 0.5 0.5 Accumulated Other Comprehensive Loss $ (188.2 ) $ (311.3 )
NOTE 12. COMMITMENTS AND CONTINGENCIES
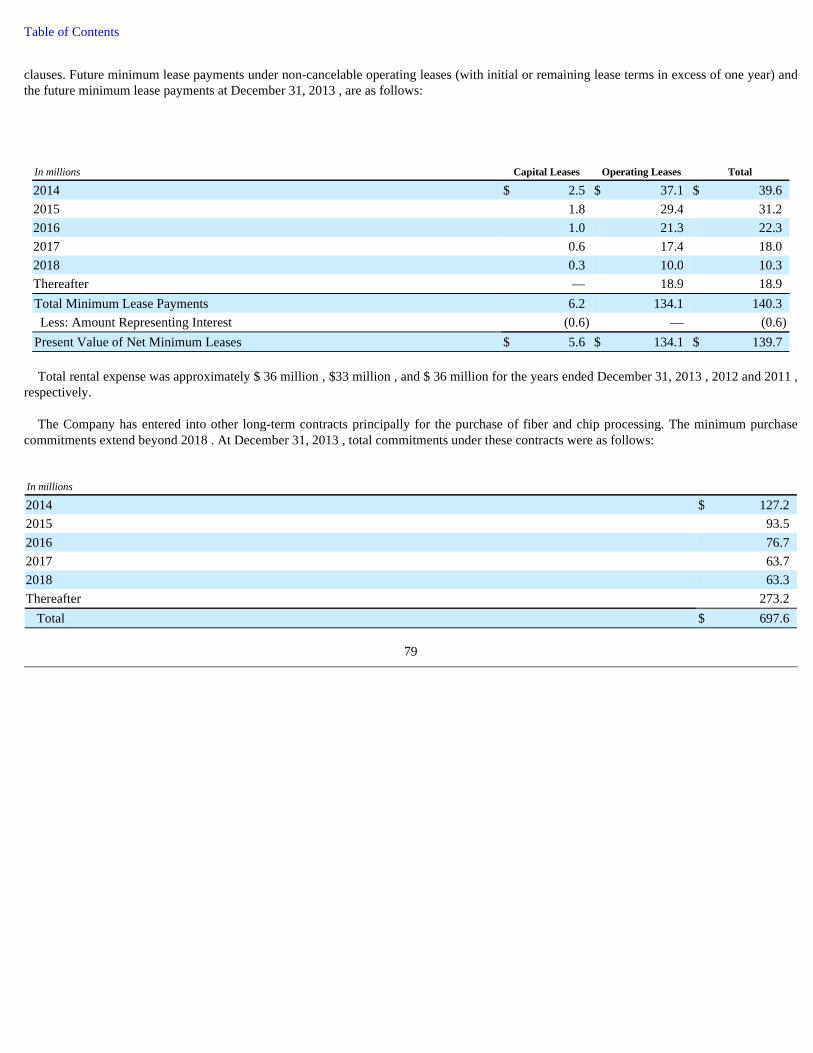
Table of Contents
clauses. Future minimum lease payments under non-cancelable operating leases (with initial or remaining lease terms in excess of one year) and the future minimum lease payments at December 31, 2013 , are as follows:
Total rental expense was approximately $ 36 million , $33 million , and $ 36 million for the years ended December 31, 2013 , 2012 and 2011 ,
respectively.
The Company has entered into other long-term contracts principally for the purchase of fiber and chip processing. The minimum purchase commitments extend beyond 2018 . At December 31, 2013 , total commitments under these contracts were as follows:
79
In millions Capital Leases Operating Leases Total
2014 $ 2.5 $ 37.1 $ 39.6 2015 1.8 29.4 31.2 2016 1.0 21.3 22.3 2017 0.6 17.4 18.0 2018 0.3 10.0 10.3 Thereafter — 18.9 18.9 Total Minimum Lease Payments 6.2 134.1 140.3 Less: Amount Representing Interest (0.6 ) — (0.6 )
Present Value of Net Minimum Leases $ 5.6 $ 134.1 $ 139.7
In millions
2014 $ 127.2 2015 93.5 2016 76.7 2017 63.7 2018 63.3 Thereafter 273.2
Total $ 697.6

Table of Contents
Environmental Matters
The Company is subject to a broad range of foreign, federal, state and local environmental, health and safety laws and regulations, including those governing discharges to air, soil and water, the management, treatment and disposal of hazardous substances, solid waste and hazardous wastes, the investigation and remediation of contamination resulting from historical site operations and releases of hazardous substances, and the health and safety of employees. Compliance initiatives could result in significant costs, which could negatively impact the Company’s consolidated financial position, results of operations or cash flows. Any failure to comply with environmental or health and safety laws and regulations or any permits and authorizations required thereunder could subject the Company to fines, corrective action or other sanctions.
Some of the Company’s current and former facilities are the subject of environmental investigations and remediations resulting from historic operations and the release of hazardous substances or other constituents. Some current and former facilities have a history of industrial usage for which investigation and remediation obligations may be imposed in the future or for which indemnification claims may be asserted against the Company. Also, potential future closures or sales of facilities may necessitate further investigation and may result in future remediation at those facilities.
The Company has established reserves for those facilities or issues where a liability is probable and the costs are reasonably estimable. The Company believes that the amounts accrued for its loss contingencies, and the reasonably possible loss beyond the amounts accrued, are not material to the Company’s consolidated financial position, results of operations or cash flows. Currently the Company expects to spend less than $10 million , in aggregate, during 2014 and 2015 to achieve compliance with the National Emission Standards for Hazardous Air Pollutants for units at major sources (known as "Boiler MACT"). The Company cannot estimate with certainty other future corrective compliance, investigation or remediation costs. Costs relating to historic usage that the Company considers to be reasonably possible of resulting in liability are not quantifiable at this time. The Company will continue to monitor environmental issues at each of its facilities, as well as regulatory developments, and will revise its accruals, estimates and disclosures relating to past, present and future operations, as additional information is obtained.
Legal Matters
The Company is a party to a number of lawsuits arising in the ordinary conduct of its business. Although the timing and outcome of these lawsuits cannot be predicted with certainty, the Company does not believe that disposition of these lawsuits will have a material adverse effect on the Company’s consolidated financial position, results of operations or cash flows.
NOTE 14. REDEEMABLE NONCONTROLLING INTERESTS
As discussed in Note 4 - Acquisitions, on December 8, 2011, the Company combined its multi-wall bag and specialty plastics packaging businesses with the kraft paper and multi-wall bag businesses of DNK, both wholly owned subsidiaries of CVI, and the Company formed a new limited liability company, GFP. After the combination, the Company owns approximately 87% of GFP and consolidates its results of operations. The remaining 13% of GFP is owned by CVI. CVI's noncontrolling interest in GFP is recorded as Redeemable Noncontrolling Interests in the Company's financial statements.
CVI has the right, at certain times, to require the Company to acquire their ownership interests in GFP at fair value. Since it is probable that the noncontrolling interests will become redeemable in the future, based on the passage of time, the noncontrolling interests subject to the put options are adjusted to their estimated redemption amounts each reporting period with a corresponding adjustment to Capital in Excess of Par Value. The adjustment to the carrying amount will be determined after attribution of comprehensive income of the redeemable noncontrolling interests. The adjustment to the carrying amount will not impact net income or comprehensive income in the Company’s Consolidated Financial Statements and will not impact earnings per share since the shares of the redeemable noncontrolling interests are redeemable at fair value. For accounting purposes, the redemption value at which the redeemable noncontrolling interests is recorded on the Consolidated Balance Sheets cannot be less than the initial amount plus attribution of comprehensive income of the noncontrolling interest. At December 31, 2013, the book value of the redeemable noncontrolling interests was determined as follows:
80
NOTE 13. ENVIRONMENTAL AND LEGAL MATTERS

Table of Contents
The calculation of fair value (a Level 3 measurement) of the redeemable noncontrolling interest is determined by using a discounted cash flow analysis based on the Company's forecasts discounted using a weighed average cost of capital and market indicators of terminal year cash flows based upon a multiple of EBITDA.
During November 2013, certain stockholders of the Company sold approximately 47.9 million shares of common stock in a secondary public
offering at $8.38 per share. The shares were sold by certain affiliates of TPG Capital, L.P. (the “TPG Entities”), certain Coors family trusts and the Adolph Coors Foundation (the “Coors Family Stockholders”), Clayton, Dubilier & Rice Fund V Limited Partnership (the “CD&R Fund”) and Old Town, S.A. (“Old Town”), and together with the TPG Entities, the Coors Family Stockholders, and the CD&R Fund, the "Selling Stockholders"). In connection with the offerings, the Company repurchased and retired approximately 23.9 million shares at $8.38 per share resulting in aggregate purchase price of $200 million (the "Share Repurchase"). The Share Repurchase was funded with a combination of cash on hand and borrowings under the Company’s revolving credit facility. After these transactions, the shares outstanding held by the Selling Stockholders decreased from approximately 35% to approximately 23% .
Prior to November 2013, the Selling Stockholders sold 15 million , 15 million and 28 million shares of common stock in separate secondary public offerings in March, May and August 2013 at prices of $7.00 , $7.73 and $8.45 per share, respectively. The shares outstanding held by the Selling Stockholders in these offerings decreased from approximately 53% at December 31, 2012 to approximately 35% .
The beneficial ownership changes of the Selling Stockholders at December 31, 2013, 2012 and 2011 are as follows:
81
In millions
Balance at December 31, 2011 $ 14.8 Adjustments Related to Combination (2.1 )
Net Loss Attributable to Redeemable Noncontrolling Interests (2.0 )
Other Comprehensive Income 0.1 Change in Fair Value of Redeemable Securities —
Balance at December 31, 2012 $ 10.8 Net Income Attributable to Redeemable Noncontrolling Interests 0.1 Other Comprehensive Income 0.4 Change in Fair Value of Redeemable Securities —
Balance at December 31, 2013 $ 11.3
NOTE 15. RELATED PARTY TRANSACTIONS
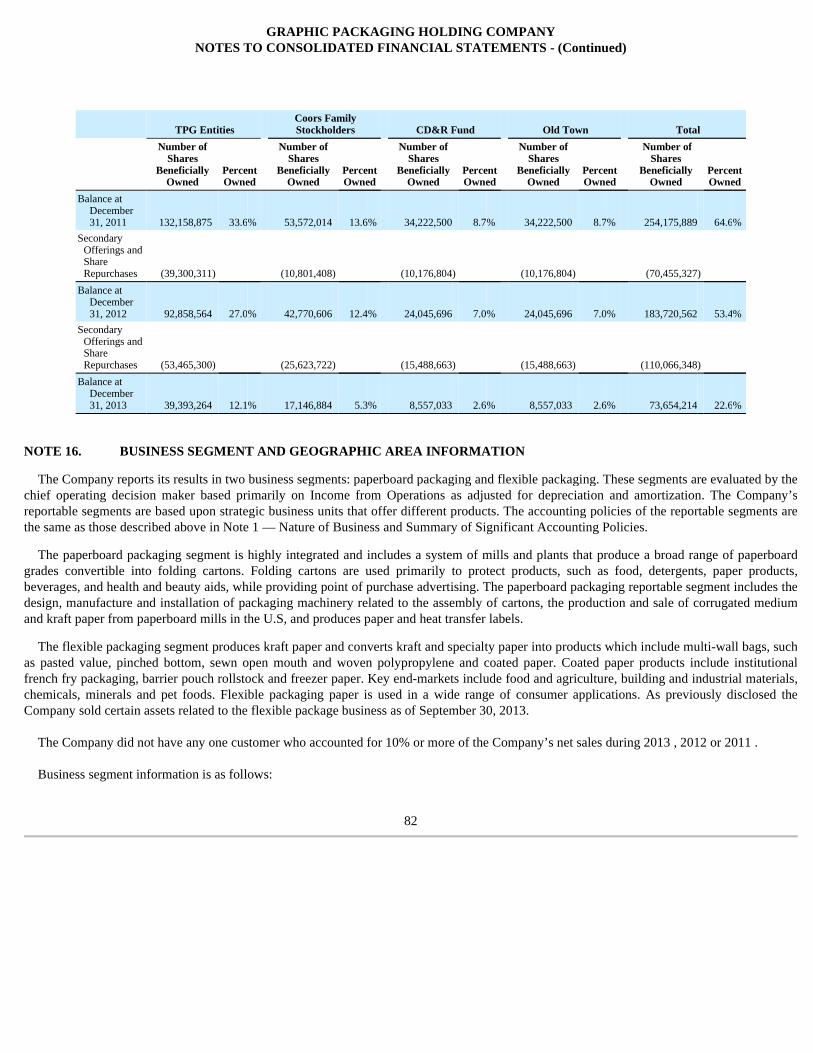
GRAPHIC PACKAGING HOLDING COMPANY NOTES TO CONSOLIDATED FINANCIAL STATEMENTS - (Conti nued)
The Company reports its results in two business segments: paperboard packaging and flexible packaging. These segments are evaluated by the chief operating decision maker based primarily on Income from Operations as adjusted for depreciation and amortization. The Company’s reportable segments are based upon strategic business units that offer different products. The accounting policies of the reportable segments are the same as those described above in Note 1 — Nature of Business and Summary of Significant Accounting Policies.
The paperboard packaging segment is highly integrated and includes a system of mills and plants that produce a broad range of paperboard grades convertible into folding cartons. Folding cartons are used primarily to protect products, such as food, detergents, paper products, beverages, and health and beauty aids, while providing point of purchase advertising. The paperboard packaging reportable segment includes the design, manufacture and installation of packaging machinery related to the assembly of cartons, the production and sale of corrugated medium and kraft paper from paperboard mills in the U.S, and produces paper and heat transfer labels.
The flexible packaging segment produces kraft paper and converts kraft and specialty paper into products which include multi-wall bags, such as pasted value, pinched bottom, sewn open mouth and woven polypropylene and coated paper. Coated paper products include institutional french fry packaging, barrier pouch rollstock and freezer paper. Key end-markets include food and agriculture, building and industrial materials, chemicals, minerals and pet foods. Flexible packaging paper is used in a wide range of consumer applications. As previously disclosed the Company sold certain assets related to the flexible package business as of September 30, 2013.
The Company did not have any one customer who accounted for 10% or more of the Company’s net sales during 2013 , 2012 or 2011 .
Business segment information is as follows:
82
TPG Entities Coors Family Stockholders CD&R Fund Old Town Total
Number of Shares
Beneficially Owned
Percent Owned
Number of Shares
Beneficially Owned
Percent Owned
Number of Shares
Beneficially Owned
Percent Owned
Number of Shares
Beneficially Owned
Percent Owned
Number of Shares
Beneficially Owned
Percent Owned
Balance at December 31, 2011 132,158,875 33.6 % 53,572,014 13.6 % 34,222,500 8.7 % 34,222,500 8.7 % 254,175,889 64.6 %
Secondary Offerings and Share Repurchases (39,300,311 ) (10,801,408 ) (10,176,804 ) (10,176,804 ) (70,455,327 )
Balance at December 31, 2012 92,858,564 27.0 % 42,770,606 12.4 % 24,045,696 7.0 % 24,045,696 7.0 % 183,720,562 53.4 %
Secondary Offerings and Share Repurchases (53,465,300 ) (25,623,722 ) (15,488,663 ) (15,488,663 ) (110,066,348 )
Balance at December 31, 2013 39,393,264 12.1 % 17,146,884 5.3 % 8,557,033 2.6 % 8,557,033 2.6 % 73,654,214 22.6 %
NOTE 16. BUSINESS SEGMENT AND GEOGRAPHIC AREA INFORMATION

GRAPHIC PACKAGING HOLDING COMPANY NOTES TO CONSOLIDATED FINANCIAL STATEMENTS - (Conti nued)
Business geographic area information is as follows:
83
Year Ended December 31,
In millions 2013 2012 2011
NET SALES:
Paperboard Packaging $ 3,844.3 $ 3,617.0 $ 3,580.3 Flexible Packaging 633.8 720.1 626.0 Total $ 4,478.1 $ 4,337.1 $ 4,206.3
INCOME (LOSS) FROM OPERATIONS:
Paperboard Packaging $ 402.2 $ 417.3 $ 361.3 Flexible Packaging (a) (1.3 ) (24.3 ) (98.8 )
Corporate (b) (59.3 ) (70.6 ) (72.2 )
Total $ 341.6 $ 322.4 $ 190.3
CAPITAL EXPENDITURES:
Paperboard Packaging $ 185.6 $ 182.8 $ 150.3 Flexible Packaging 17.8 16.2 6.2 Corporate 5.8 4.3 3.6 Total $ 209.2 $ 203.3 $ 160.1
DEPRECIATION AND AMORTIZATION:
Paperboard Packaging $ 246.4 $ 232.1 $ 245.8 Flexible Packaging 28.6 31.9 28.5 Corporate 2.4 2.8 4.1 Total $ 277.4 $ 266.8 $ 278.4
December 31,
In millions 2013 2012
ASSETS AT DECEMBER 31:
Paperboard Packaging $ 4,198.4 $ 4,173.6 Flexible Packaging 317.6 377.3 Corporate (c) 43.3 80.7 Total $ 4,559.3 $ 4,631.6
Year Ended December 31,
In millions 2013 2012 2011
NET SALES:
U.S./Canada $ 3,973.6 $ 4,096.9 $ 3,979.8 Central/South America 75.3 76.4 80.7 Europe 462.5 170.6 185.1 Asia Pacific 132.6 170.9 163.2 Eliminations (d) (165.9 ) (177.7 ) (202.5 )
Total $ 4,478.1 $ 4,337.1 $ 4,206.3

GRAPHIC PACKAGING HOLDING COMPANY NOTES TO CONSOLIDATED FINANCIAL STATEMENTS - (Conti nued)
Notes:
84
In millions 2013 2012
ASSETS AT DECEMBER 31:
U.S./Canada $ 3,818.7 $ 3,939.3 Central/South America 92.0 90.7 Europe 529.0 434.0 Asia Pacific 76.3 86.9 Corporate (c) 43.3 80.7 Total $ 4,559.3 $ 4,631.6
a. 2011 results include a $96.3 million goodwill impairment charge.
b. Primarily consists of unallocated general corporate expenses.
c. Corporate assets are principally cash and equivalents, other current assets, deferred income tax assets, deferred debt issue costs and a portion of property, plant and equipment, net of intercompany investments and balances.
d. Represents primarily the elimination of intergeographic sales between the Company’s U.S. and Europe, Asia Pacific and Central/South America operations.

GRAPHIC PACKAGING HOLDING COMPANY NOTES TO CONSOLIDATED FINANCIAL STATEMENTS - (Conti nued)
Results of operations for the four quarters of 2013 and 2012 are shown below.
85
NOTE 17. QUARTERLY FINANCIAL INFORMATION (UNAUDITED)
2013
In millions, except per share amounts First Second Third Fourth Total
Statement of Operations Data:
Net Sales $ 1,100.5 $ 1,139.7 $ 1,163.0 $ 1,074.9 $ 4,478.1 Gross Profit 182.9 188.6 180.7 173.4 725.6 Restructuring and Other Special Charges (Credits) 1.4 8.3 (14.8 ) 18.2 13.1 Income from Operations 85.2 87.7 105.7 63.0 341.6 Net Income 34.6 21.1 45.7 45.3 146.7 Net Income Attributable to Graphic Packaging Holding Company 34.9 21.2 44.5 46.0 146.6
Income Per Share Attributable to Graphic Packaging Holding Company — Basic $ 0.10 $ 0.06 $ 0.13 $ 0.13 $ 0.42
Income Per Share Attributable to Graphic Packaging Holding Company — Diluted $ 0.10 $ 0.06 $ 0.13 $ 0.13 $ 0.42
2012
In millions, except per share amounts First Second Third Fourth Total
Statement of Operations Data:
Net Sales $ 1,067.2 $ 1,111.9 $ 1,104.7 $ 1,053.3 $ 4,337.1 Gross Profit 169.6 196.4 188.9 164.7 719.6 Restructuring and Other Special Charges 3.5 5.2 3.4 14.3 26.4 Income from Operations 71.0 96.7 91.4 63.3 322.4 Net Income 17.3 41.4 38.9 22.5 120.1 Net Income Attributable to Graphic Packaging Holding Company 17.2 42.4 40.1 22.9 122.6
Income Per Share Attributable to Graphic Packaging Holding Company — Basic $ 0.04 $ 0.11 $ 0.10 $ 0.06 $ 0.31
Income Per Share Attributable to Graphic Packaging Holding Company — Diluted $ 0.04 $ 0.11 $ 0.10 $ 0.06 $ 0.31
NOTE 18. EARNINGS PER SHARE

GRAPHIC PACKAGING HOLDING COMPANY NOTES TO CONSOLIDATED FINANCIAL STATEMENTS - (Conti nued)
The following are the potentially dilutive securities excluded from the above calculation because the effect would have been anti-dilutive:
The following represents changes in Accumulated Other Comprehensive (Loss) Income by component for the year ended December 31, 2013 (a) :
(b) See following table for details about these reclassifications.
86
Year Ended December 31,
In millions, except per share data 2013 2012 2011
Net Income Attributable to Graphic Packaging Holding Company $ 146.6 $ 122.6 $ 276.9 Weighted Average Shares:
Basic 347.3 393.4 376.3 Dilutive effect of RSUs and stock options 2.4 2.8 5.4
Diluted 349.7 396.2 381.7 Earnings Per Share — Basic $ 0.42 $ 0.31 $ 0.74 Earnings Per Share — Diluted $ 0.42 $ 0.31 $ 0.73
Year Ended December 31,
2013 2012 2011
Employee Stock Options 773,542 2,346,818 4,692,106
NOTE 19. OTHER COMPREHENSIVE (LOSS) INCOME
In millions Derivatives Instruments
Pension Benefit Plans
Postretirement Benefit Plans
Postemployment Benefit Plans
Currency Translation Adjustment Total
Balance at December 31, 2012 $ (14.0 ) $ (301.2 ) $ 6.4 $ 0.5 $ (3.0 ) $ (311.3 )
Other Comprehensive Income (Loss) before Reclassifications 1.4 104.2 7.4 — (13.6 ) 99.4
Amounts Reclassified from Accumulated Other Comprehensive Income (Loss) (b) 1.8 22.9 (1.0 ) — — 23.7
Net Current-period Other Comprehensive Income (Loss) 3.2 127.1 6.4 — (13.6 ) 123.1
Balance at December 31, 2013 $ (10.8 ) $ (174.1 ) $ 12.8 $ 0.5 $ (16.6 ) $ (188.2 )
(a) All amounts are net-of-tax.
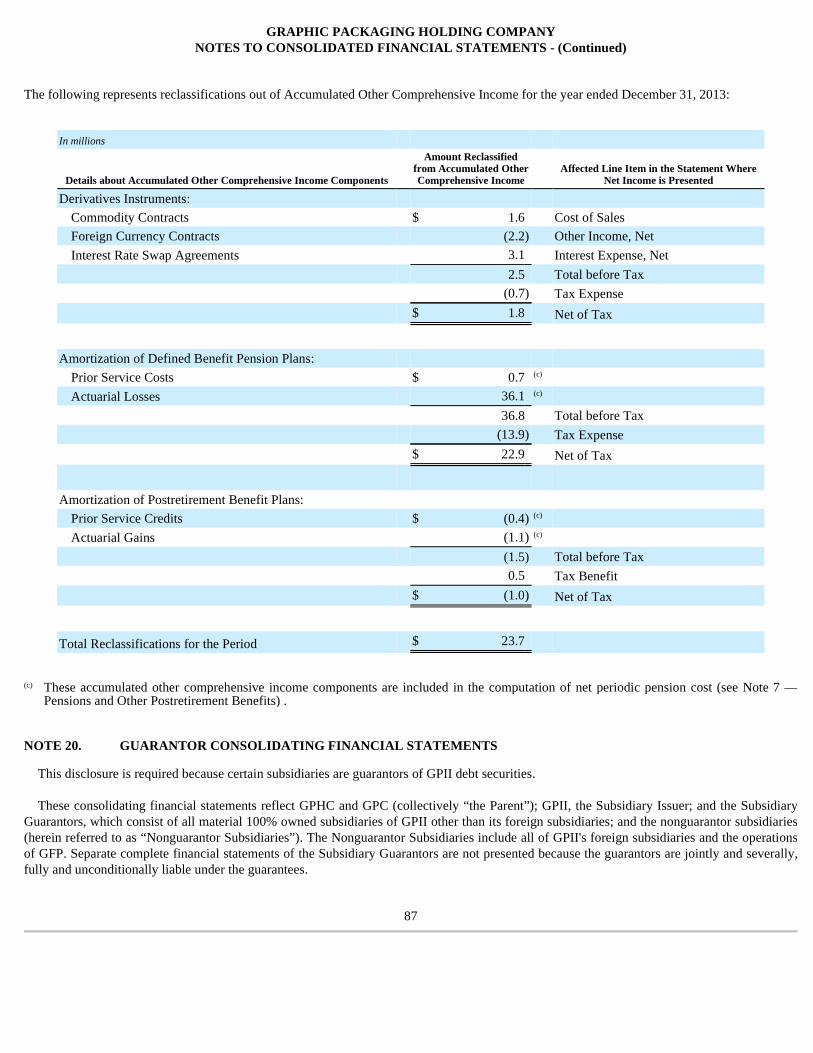
GRAPHIC PACKAGING HOLDING COMPANY NOTES TO CONSOLIDATED FINANCIAL STATEMENTS - (Conti nued)
The following represents reclassifications out of Accumulated Other Comprehensive Income for the year ended December 31, 2013:
This disclosure is required because certain subsidiaries are guarantors of GPII debt securities.
These consolidating financial statements reflect GPHC and GPC (collectively “the Parent”); GPII, the Subsidiary Issuer; and the Subsidiary Guarantors, which consist of all material 100% owned subsidiaries of GPII other than its foreign subsidiaries; and the nonguarantor subsidiaries (herein referred to as “Nonguarantor Subsidiaries”). The Nonguarantor Subsidiaries include all of GPII's foreign subsidiaries and the operations of GFP. Separate complete financial statements of the Subsidiary Guarantors are not presented because the guarantors are jointly and severally, fully and unconditionally liable under the guarantees.
87
In millions
Details about Accumulated Other Comprehensive Income Components
Amount Reclassified from Accumulated Other Comprehensive Income
Affected Line Item in the Statement Where Net Income is Presented
Derivatives Instruments:
Commodity Contracts $ 1.6 Cost of Sales
Foreign Currency Contracts (2.2 ) Other Income, Net
Interest Rate Swap Agreements 3.1 Interest Expense, Net
2.5 Total before Tax
(0.7 ) Tax Expense
$ 1.8 Net of Tax
Amortization of Defined Benefit Pension Plans:
Prior Service Costs $ 0.7 (c)
Actuarial Losses 36.1 (c)
36.8 Total before Tax
(13.9 ) Tax Expense
$ 22.9 Net of Tax
Amortization of Postretirement Benefit Plans:
Prior Service Credits $ (0.4 ) (c)
Actuarial Gains (1.1 ) (c)
(1.5 ) Total before Tax
0.5 Tax Benefit
$ (1.0 ) Net of Tax
Total Reclassifications for the Period $ 23.7
(c) These accumulated other comprehensive income components are included in the computation of net periodic pension cost (see Note 7 —Pensions and Other Postretirement Benefits) .
NOTE 20. GUARANTOR CONSOLIDATING FINANCIAL STATEMENTS

GRAPHIC PACKAGING HOLDING COMPANY NOTES TO CONSOLIDATED FINANCIAL STATEMENTS - (Conti nued)
88
Year Ended December 31, 2013
In millions Parent Subsidiary
Issuer
Combined Guarantor
Subsidiaries
Combined Nonguarantor Subsidiaries
Consolidating Eliminations Consolidated
Net Sales $ — $ 3,298.4 $ 65.3 $ 1,305.4 $ (191.0 ) $ 4,478.1 Cost of Sales — 2,680.1 49.1 1,214.3 (191.0 ) 3,752.5 Selling, General and Administrative — 260.7 6.8 116.8 — 384.3 Other Income, Net — (7.3 ) — (6.1 ) — (13.4 )
Restructuring and Other Special Charges — 4.6 — 8.5 — 13.1 Income (Loss) from Operations — 360.3 9.4 (28.1 ) — 341.6 Interest Expense, Net — (91.5 ) — (10.4 ) — (101.9 )
Loss on Modification or Extinguishment of Debt — (27.1 ) — — — (27.1 )
Income (Loss) before Income Taxes and Equity Income of Unconsolidated Entities — 241.7 9.4 (38.5 ) — 212.6
Income Tax Expense — (63.0 ) (3.6 ) (0.8 ) — (67.4 )
Income (Loss) before Equity Income of Unconsolidated Entities — 178.7 5.8 (39.3 ) — 145.2
Equity Income of Unconsolidated Entities — — — 1.5 — 1.5 Equity in Net Earnings of Subsidiaries 146.7 (32.0 ) (2.0 ) — (112.7 ) — Net Income (Loss) 146.7 146.7 3.8 (37.8 ) (112.7 ) 146.7 Net Income Attributable to Noncontrolling Interests (0.1 ) (0.1 ) — — 0.1 (0.1 )
Net Income (Loss) Attributable to Graphic Packaging Holding Company $ 146.6 $ 146.6 $ 3.8 $ (37.8 ) $ (112.6 ) $ 146.6
Comprehensive Income (Loss) Attributable to Graphic Packaging Holding Company $ 269.7 $ 269.7 $ 3.3 $ (45.6 ) $ (227.4 ) $ 269.7

GRAPHIC PACKAGING HOLDING COMPANY NOTES TO CONSOLIDATED FINANCIAL STATEMENTS - (Conti nued)
89
Year Ended December 31, 2012
In millions Parent Subsidiary
Issuer
Combined Guarantor
Subsidiaries
Combined Nonguarantor Subsidiaries
Consolidating Eliminations Consolidated
Net Sales $ — $ 3,335.6 $ 65.2 $ 1,138.4 $ (202.1 ) $ 4,337.1 Cost of Sales — 2,717.5 49.0 1,053.1 (202.1 ) 3,617.5 Selling, General and Administrative — 283.1 7.5 87.5 — 378.1 Other Income, Net — (6.4 ) (0.2 ) (0.7 ) — (7.3 )
Restructuring and Other Special Charges — 11.0 — 15.4 — 26.4 Income (Loss) from Operations — 330.4 8.9 (16.9 ) — 322.4 Interest Expense, Net — (103.4 ) — (7.7 ) — (111.1 )
Loss on Modification or Extinguishment of Debt — (11.0 ) — — — (11.0 )
Income (Loss) before Income Taxes and Equity Income of Unconsolidated Entities — 216.0 8.9 (24.6 ) — 200.3
Income Tax (Expense) Benefit — (79.4 ) (3.4 ) 0.3 — (82.5 )
Income (Loss) before Equity Income of Unconsolidated Entities — 136.6 5.5 (24.3 ) — 117.8
Equity Income of Unconsolidated Entities — — — 2.3 — 2.3 Equity in Net Earnings of Subsidiaries 120.1 (16.5 ) (1.2 ) — (102.4 ) — Net Income (Loss) 120.1 120.1 4.3 (22.0 ) (102.4 ) 120.1 Net Loss Attributable to Noncontrolling Interests 2.5 2.5 — — (2.5 ) 2.5 Net Income (Loss) Attributable to Graphic Packaging Holding Company $ 122.6 $ 122.6 $ 4.3 $ (22.0 ) $ (104.9 ) $ 122.6
Comprehensive Income (Loss) Attributable to Graphic Packaging Holding Company $ 93.4 $ 93.4 $ 7.2 $ (15.6 ) $ (85.0 ) $ 93.4

GRAPHIC PACKAGING HOLDING COMPANY NOTES TO CONSOLIDATED FINANCIAL STATEMENTS - (Conti nued)
90
Year Ended December 31, 2011
In millions Parent Subsidiary
Issuer
Combined Guarantor
Subsidiaries
Combined Nonguarantor Subsidiaries
Consolidating Eliminations Consolidated
Net Sales $ — $ 3,316.8 $ 63.9 $ 1,057.6 $ (232.0 ) $ 4,206.3 Cost of Sales — 2,786.2 48.5 966.1 (232.0 ) 3,568.8 Selling, General and Administrative — 272.9 6.6 62.9 — 342.4 Other (Income) Expense, Net — (1.3 ) 0.1 (1.5 ) — (2.7 )
Restructuring, Goodwill Impairment and Other Special Charges — 11.2 — 96.3 — 107.5
Income (Loss) from Operations — 247.8 8.7 (66.2 ) — 190.3 Interest Expense, Net — (143.0 ) — (1.9 ) — (144.9 )
Loss on Modification or Extinguishment of Debt — (2.1 ) — — — (2.1 )
Income (Loss) before Income Taxes and Equity Income of Unconsolidated Entities — 102.7 8.7 (68.1 ) — 43.3
Income Tax (Benefit) Expense — 235.5 (0.2 ) (5.5 ) — 229.8 Income (Loss) before Equity Income of Unconsolidated Entities — 338.2 8.5 (73.6 ) — 273.1
Equity Income of Unconsolidated Entities — — — 2.1 — 2.1 Equity in Net Earnings of Subsidiaries 275.2 (63.0 ) 2.7 — (214.9 ) — Net Income (Loss) $ 275.2 $ 275.2 $ 11.2 $ (71.5 ) $ (214.9 ) $ 275.2 Net Loss Attributable to Noncontrolling Interests 1.7 1.7 — — (1.7 ) 1.7 Net Income (Loss) Attributable to Graphic Packaging Holding Company $ 276.9 $ 276.9 $ 11.2 $ (71.5 ) $ (216.6 ) $ 276.9
Comprehensive Income (Loss) Attributable to Graphic Packaging Holding Company $ 208.1 $ 208.1 $ 6.4 $ (97.7 ) $ (116.8 ) $ 208.1

GRAPHIC PACKAGING HOLDING COMPANY NOTES TO CONSOLIDATED FINANCIAL STATEMENTS - (Conti nued)
91
Year Ended December 31, 2013
In millions Parent Subsidiary
Issuer
Combined Guarantor
Subsidiaries
Combined Nonguarantor Subsidiaries
Consolidating Eliminations Consolidated
ASSETS
Current Assets:
Cash and Cash Equivalents $ — $ 1.3 $ — $ 50.9 $ — $ 52.2 Receivables, Net — 218.0 7.0 187.8 — 412.8 Inventories, Net — 368.0 4.4 184.7 — 557.1 Deferred Income Tax Assets — 171.9 — — (0.6 ) 171.3 Intercompany 59.0 595.5 — — (654.5 ) — Other Current Assets — 23.2 — 15.6 — 38.8 Total Current Assets 59.0 1,377.9 11.4 439.0 (655.1 ) 1,232.2
Property, Plant and Equipment, Net — 1,410.7 14.2 254.1 (0.1 ) 1,678.9 Investment in Consolidated Subsidiaries 1,014.5 — 24.2 — (1,038.7 ) — Goodwill — 1,043.2 47.2 35.0 — 1,125.4 Other Assets — 395.6 16.9 110.3 — 522.8 Total Assets $ 1,073.5 $ 4,227.4 $ 113.9 $ 838.4 $ (1,693.9 ) $ 4,559.3
LIABILITIES
Current Liabilities:
Short-Term Debt and Current Portion of Long-Term Debt $ — $ 62.7 $ — $ 14.7 $ — $ 77.4
Accounts Payable — 303.1 5.6 119.6 — 428.3 Interest Payable — 15.0 — 0.2 — 15.2 Intercompany — — 41.7 645.7 (687.4 ) — Other Accrued Liabilities — 142.5 0.9 46.9 — 190.3 Total Current Liabilities — 523.3 48.2 827.1 (687.4 ) 711.2
Long-Term Debt — 2,123.7 — 52.5 — 2,176.2 Deferred Income Tax Liabilities — 321.5 — 8.4 — 329.9 Other Noncurrent Liabilities — 233.1 — 35.3 — 268.4 Redeemable Noncontrolling Interests 11.3 11.3 — — (11.3 ) 11.3
EQUITY
Total Graphic Packaging Holding Company Shareholders' Equity 1,062.2 1,014.5 65.7 (84.9 ) (995.2 ) 1,062.3
Noncontrolling Interests — — — — — — Total Equity 1,062.2 1,014.5 65.7 (84.9 ) (995.2 ) 1,062.3 Total Liabilities and Equity $ 1,073.5 $ 4,227.4 $ 113.9 $ 838.4 $ (1,693.9 ) $ 4,559.3

GRAPHIC PACKAGING HOLDING COMPANY NOTES TO CONSOLIDATED FINANCIAL STATEMENTS - (Conti nued)
92
Year Ended December 31, 2012
In millions Parent Subsidiary
Issuer
Combined Guarantor
Subsidiaries
Combined Nonguarantor Subsidiaries
Consolidating Eliminations Consolidated
ASSETS
Current Assets:
Cash and Cash Equivalents $ — $ 5.9 $ — $ 45.6 $ — $ 51.5 Receivables, Net — 245.0 6.3 210.0 — 461.3 Inventories, Net — 341.3 4.2 187.0 — 532.5 Deferred Income Tax Assets — 138.7 — 0.6 — 139.3 Intercompany 38.3 672.5 — — (710.8 ) — Other Current Assets — 12.6 0.1 5.7 — 18.4 Total Current Assets 38.3 1,416.0 10.6 448.9 (710.8 ) 1,203.0
Property, Plant and Equipment, Net — 1,421.2 15.4 295.7 (0.1 ) 1,732.2 Investment in Consolidated Subsidiaries 944.8 2.0 26.6 — (973.4 ) — Goodwill — 1,046.6 47.2 45.2 — 1,139.0 Other Assets — 417.5 18.5 121.4 — 557.4 Total Assets $ 983.1 $ 4,303.3 $ 118.3 $ 911.2 $ (1,684.3 ) $ 4,631.6
LIABILITIES
Current Liabilities:
Short-Term Debt and Current Portion of Long-Term Debt $ — $ 62.3 $ — $ 17.5 $ — $ 79.8
Accounts Payable — 312.4 5.9 135.4 — 453.7 Interest Payable — 10.1 — — — 10.1 Intercompany — — 52.5 658.5 (711.0 ) — Other Accrued Liabilities — 165.7 0.9 42.7 — 209.3 Total Current Liabilities — 550.5 59.3 854.1 (711.0 ) 752.9
Long-Term Debt — 2,212.9 — 40.6 — 2,253.5 Deferred Income Tax Liabilities — 134.1 — 13.7 — 147.8 Other Noncurrent Liabilities — 451.9 — 42.4 — 494.3
Redeemable Noncontrolling Interests 10.8 10.8 — — (10.8 ) 10.8
EQUITY
Total Graphic Packaging Holding Company Shareholders' Equity 974.0 944.8 59.0 (39.6 ) (964.2 ) 974.0
Noncontrolling Interests (1.7 ) (1.7 ) — — 1.7 (1.7 )
Total Shareholders’ Equity 972.3 943.1 59.0 (39.6 ) (962.5 ) 972.3 Total Liabilities and Equity $ 983.1 $ 4,303.3 $ 118.3 $ 911.2 $ (1,684.3 ) $ 4,631.6

GRAPHIC PACKAGING HOLDING COMPANY NOTES TO CONSOLIDATED FINANCIAL STATEMENTS - (Conti nued)
93
Year Ended December 31, 2013
In millions Parent Subsidiary
Issuer
Combined Guarantor
Subsidiaries
Combined Nonguarantor Subsidiaries
Consolidating Eliminations Consolidated
CASH FLOWS FROM OPERATING ACTIVITIES: Net Income (Loss) $ 146.7 $ 146.7 $ 3.8 $ (37.8 ) $ (112.7 ) $ 146.7 Non-cash Items Included in Net Income (Loss): Depreciation and Amortization 223.7 4.1 49.6 — 277.4 Write-off of Deferred Debt Issuance Costs on Early Extinguishment
of Debt — — 4.5 — — 4.5 Amortization of Deferred Debt Issuance Costs — — 7.0 — — 7.0 Deferred Income Taxes — 65.3 — (2.6 ) — 62.7 Amount of Postretirement Expense Less Than Funding — (7.2 ) — (5.2 ) — (12.4 )
Gain on the Sale of Assets — — — (26.6 ) — (26.6 )
Impairment Charges/Asset Write-Offs — 3.5 — (2.0 ) — 1.5 Equity in Net Earnings of Subsidiaries (146.7 ) 32.0 2.0 — 112.7 — Other, Net — 19.3 — 0.2 — 19.5
Changes in Operating Assets and Liabilities — (176.7 ) 180.1 (24.8 ) (0.9 ) (22.3 )
Net Cash Provided by (Used in) Operating Activities — 306.6 201.5 (49.2 ) (0.9 ) 458.0
CASH FLOWS FROM INVESTING ACTIVITIES: Capital Spending — (181.4 ) (1.5 ) (26.3 ) — (209.2 )
Proceeds for Sales of Assets, Net of Selling Cost — 0.3 — 73.2 — 73.5 Other, Net (0.9 ) (8.7 ) — — 0.9 (8.7 )
Net Cash (Used in) Provided by Investing Activities (0.9 ) (189.8 ) (1.5 ) 46.9 0.9 (144.4 )
CASH FLOWS FROM FINANCING ACTIVITIES: Repurchase of Common Stock — — (200.0 ) — — (200.0 )
Proceeds from Issuance or Modification of Debt — 425.0 — — — 425.0 Retirement of Long-Term Debt — (425.0 ) — — — (425.0 )
Payments on Debt — (60.4 ) — (10.9 ) — (71.3 )
Borrowings under Revolving Credit Facilities — 1,502.7 — 226.5 — 1,729.2 Payments on Revolving Credit Facilities — (1,532.5 ) — (205.5 ) — (1,738.0 )
Debt Issuance Costs — (29.9 ) — — (29.9 )
Repurchase of Common Stock related to Share-Based Payments (11.2 ) — — — — (11.2 )
Other, Net 12.1 (1.3 ) — (0.7 ) — 10.1 Net Cash Provided by (Used in) Financing Activities 0.9 (121.4 ) (200.0 ) 9.4 — (311.1 )
Effect of Exchange Rate Changes on Cash — — — (1.8 ) — (1.8 )
Net (Decrease) Increase in Cash and Cash Equivalents — (4.6 ) — 5.3 — 0.7 Cash and Cash Equivalents at Beginning of Period — 5.9 — 45.6 — 51.5 CASH AND CASH EQUIVALENTS AT END OF PERIOD $ — $ 1.3 $ — $ 50.9 $ — $ 52.2
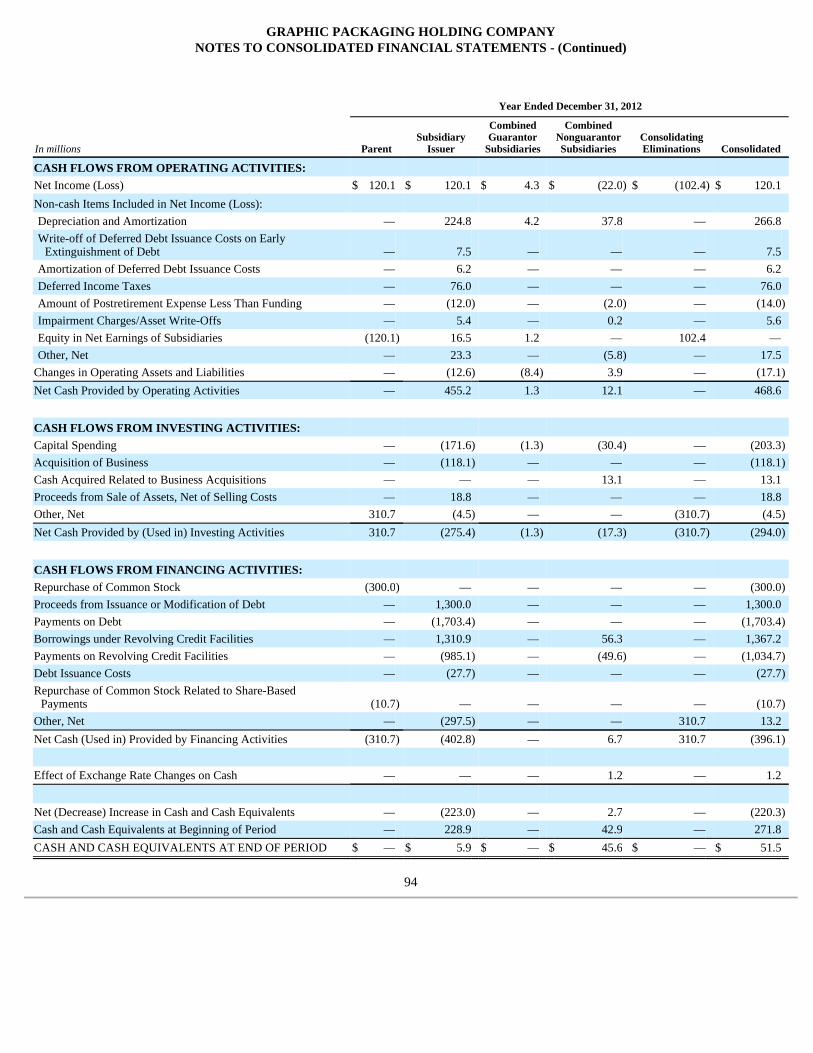
GRAPHIC PACKAGING HOLDING COMPANY NOTES TO CONSOLIDATED FINANCIAL STATEMENTS - (Conti nued)
94
Year Ended December 31, 2012
In millions Parent Subsidiary
Issuer
Combined Guarantor
Subsidiaries
Combined Nonguarantor Subsidiaries
Consolidating Eliminations Consolidated
CASH FLOWS FROM OPERATING ACTIVITIES: Net Income (Loss) $ 120.1 $ 120.1 $ 4.3 $ (22.0 ) $ (102.4 ) $ 120.1 Non-cash Items Included in Net Income (Loss): Depreciation and Amortization — 224.8 4.2 37.8 — 266.8 Write-off of Deferred Debt Issuance Costs on Early
Extinguishment of Debt — 7.5 — — — 7.5 Amortization of Deferred Debt Issuance Costs — 6.2 — — — 6.2 Deferred Income Taxes — 76.0 — — — 76.0 Amount of Postretirement Expense Less Than Funding — (12.0 ) — (2.0 ) — (14.0 )
Impairment Charges/Asset Write-Offs — 5.4 — 0.2 — 5.6 Equity in Net Earnings of Subsidiaries (120.1 ) 16.5 1.2 — 102.4 — Other, Net — 23.3 — (5.8 ) — 17.5
Changes in Operating Assets and Liabilities — (12.6 ) (8.4 ) 3.9 — (17.1 )
Net Cash Provided by Operating Activities — 455.2 1.3 12.1 — 468.6
CASH FLOWS FROM INVESTING ACTIVITIES: Capital Spending — (171.6 ) (1.3 ) (30.4 ) — (203.3 )
Acquisition of Business — (118.1 ) — — — (118.1 )
Cash Acquired Related to Business Acquisitions — — — 13.1 — 13.1 Proceeds from Sale of Assets, Net of Selling Costs — 18.8 — — — 18.8 Other, Net 310.7 (4.5 ) — — (310.7 ) (4.5 )
Net Cash Provided by (Used in) Investing Activities 310.7 (275.4 ) (1.3 ) (17.3 ) (310.7 ) (294.0 )
CASH FLOWS FROM FINANCING ACTIVITIES: Repurchase of Common Stock (300.0 ) — — — — (300.0 )
Proceeds from Issuance or Modification of Debt — 1,300.0 — — — 1,300.0 Payments on Debt — (1,703.4 ) — — — (1,703.4 )
Borrowings under Revolving Credit Facilities — 1,310.9 — 56.3 — 1,367.2 Payments on Revolving Credit Facilities — (985.1 ) — (49.6 ) — (1,034.7 )
Debt Issuance Costs — (27.7 ) — — — (27.7 )
Repurchase of Common Stock Related to Share-Based Payments (10.7 ) — — — — (10.7 )
Other, Net — (297.5 ) — — 310.7 13.2 Net Cash (Used in) Provided by Financing Activities (310.7 ) (402.8 ) — 6.7 310.7 (396.1 )
Effect of Exchange Rate Changes on Cash — — — 1.2 — 1.2 Net (Decrease) Increase in Cash and Cash Equivalents — (223.0 ) — 2.7 — (220.3 )
Cash and Cash Equivalents at Beginning of Period — 228.9 — 42.9 — 271.8 CASH AND CASH EQUIVALENTS AT END OF PERIOD $ — $ 5.9 $ — $ 45.6 $ — $ 51.5

GRAPHIC PACKAGING HOLDING COMPANY NOTES TO CONSOLIDATED FINANCIAL STATEMENTS - (Conti nued)
95
Year Ended December 31, 2011
In millions Parent Subsidiary
Issuer
Combined Guarantor
Subsidiaries
Combined Nonguarantor Subsidiaries
Consolidating Eliminations Consolidated
CASH FLOWS FROM OPERATING ACTIVITIES:
Net Income (Loss) $ 275.2 $ 275.2 $ 11.2 $ (71.5 ) $ (214.9 ) $ 275.2 Non-cash Items Included in Net Income (Loss):
Depreciation and Amortization — 250.7 2.7 25.0 — 278.4 Goodwill Impairment Charge — — — 96.3 — 96.3 Amortization of Deferred Debt Issuance Costs — 7.0 — — — 7.0 Deferred Income Taxes — (227.2 ) (11.7 ) 0.5 — (238.4 )
Amount of Postretirement Expense Less Than Funding — (34.2 ) (0.3 ) (4.3 ) — (38.8 )
Impairment Charges/Asset Write-Offs — 6.7 — 0.3 — 7.0 Equity in Net Earnings of Subsidiaries (275.2 ) 63.0 (2.7 ) — 214.9 — Other, Net — 20.9 — 1.0 — 21.9
Changes in Operating Assets and Liabilities — (1.2 ) 1.4 (21.0 ) — (20.8 )
Net Cash Provided by Operating Activities — 360.9 0.6 26.3 — 387.8
CASH FLOWS FROM INVESTING ACTIVITIES:
Capital Spending — (142.7 ) (0.6 ) (16.8 ) — (160.1 )
Acquisition of Business — (51.9 ) — — — (51.9 )
Proceeds from Sale of Assets, Net of Selling Costs — 2.3 — — — 2.3 Other, Net (204.8 ) (28.0 ) — — 230.7 (2.1 )
Net Cash Used in Investing Activities (204.8 ) (220.3 ) (0.6 ) (16.8 ) 230.7 (211.8 )
CASH FLOWS FROM FINANCING ACTIVITIES:
Net Proceeds from Issuance of Common Stock 237.7 — — — — 237.7 Repurchase of Common Stock (32.9 ) — — — — (32.9 )
Payments on Debt — (223.3 ) — (25.9 ) — (249.2 )
Borrowings under Revolving Credit Facilities — 30.0 — 62.1 — 92.1 Payments on Revolving Credit Facilities — (30.0 ) — (59.6 ) — (89.6 )
Other, Net — 204.5 — 25.9 (230.7 ) (0.3 )
Net Cash Provided by (Used in) Financing Activities 204.8 (18.8 ) — 2.5 (230.7 ) (42.2 )
Effect of Exchange Rate Changes on Cash — — — (0.7 ) — (0.7 )
Net Increase in Cash and Cash Equivalents — 121.8 — 11.3 — 133.1 Cash and Cash Equivalents at Beginning of Period — 107.1 — 31.6 — 138.7 CASH AND CASH EQUIVALENTS AT END OF PERIOD $ — $ 228.9 $ — $ 42.9 $ — $ 271.8

Report of Independent Registered Public Accounting Firm
The Board of Directors and Shareholders of Graphic Packaging Holding Company We have audited the accompanying consolidated balance sheets of Graphic Packaging Holding Company as of December 31, 2013 and 2012, and the related consolidated statements of operations, comprehensive income, shareholders' equity and cash flows for each of the three years in the period ended December 31, 2013. These financial statements are the responsibility of the Company's management. Our responsibility is to express an opinion on these financial statements based on our audits. We conducted our audits in accordance with the standards of the Public Company Accounting Oversight Board (United States). Those standards require that we plan and perform the audit to obtain reasonable assurance about whether the financial statements are free of material misstatement. An audit includes examining, on a test basis, evidence supporting the amounts and disclosures in the financial statements. An audit also includes assessing the accounting principles used and significant estimates made by management, as well as evaluating the overall financial statement presentation. We believe that our audits provide a reasonable basis for our opinion. In our opinion, the financial statements referred to above present fairly, in all material respects, the consolidated financial position of Graphic Packaging Holding Company at December 31, 2013 and 2012, and the consolidated results of its operations and its cash flows for each of the three years in the period ended December 31, 2013, in conformity with U.S. generally accepted accounting principles. We also have audited, in accordance with the standards of the Public Company Accounting Oversight Board (United States), Graphic Packaging Holding Company's internal control over financial reporting as of December 31, 2013, based on criteria established in Internal Control-Integrated Framework issued by the Committee of Sponsoring Organizations of the Treadway Commission (1992 framework) and our report dated February 6, 2014 expressed an unqualified opinion thereon.
/s/ Ernst & Young LLP Atlanta, Georgia February 6, 2014
96

Table of Contents
Report of the Independent Registered Public Accounting Firm
The Board of Directors and Shareholders of Graphic Packaging Holding Company We have audited Graphic Packaging Holding Company’s internal control over financial reporting as of December 31, 2013, based on criteria established in Internal Control-Integrated Framework issued by the Committee of Sponsoring Organizations of the Treadway Commission (1992 framework) (the COSO criteria). Graphic Packaging Holding Company’s management is responsible for maintaining effective internal control over financial reporting, and for its assessment of the effectiveness of internal control over financial reporting included in the accompanying Management’s Report on Internal Control Over Financial Reporting. Our responsibility is to express an opinion on the company’s internal control over financial reporting based on our audit. We conducted our audit in accordance with the standards of the Public Company Accounting Oversight Board (United States). Those standards require that we plan and perform the audit to obtain reasonable assurance about whether effective internal control over financial reporting was maintained in all material respects. Our audit included obtaining an understanding of internal control over financial reporting, assessing the risk that a material weakness exists, testing and evaluating the design and operating effectiveness of internal control based on the assessed risk, and performing such other procedures as we considered necessary in the circumstances. We believe that our audit provides a reasonable basis for our opinion. A company’s internal control over financial reporting is a process designed to provide reasonable assurance regarding the reliability of financial reporting and the preparation of financial statements for external purposes in accordance with generally accepted accounting principles. A company’s internal control over financial reporting includes those policies and procedures that (1) pertain to the maintenance of records that, in reasonable detail, accurately and fairly reflect the transactions and dispositions of the assets of the company; (2) provide reasonable assurance that transactions are recorded as necessary to permit preparation of financial statements in accordance with generally accepted accounting principles, and that receipts and expenditures of the company are being made only in accordance with authorizations of management and directors of the company; and (3) provide reasonable assurance regarding prevention or timely detection of unauthorized acquisition, use, or disposition of the company’s assets that could have a material effect on the financial statements. Because of its inherent limitations, internal control over financial reporting may not prevent or detect misstatements. Also, projections of any evaluation of effectiveness to future periods are subject to the risk that controls may become inadequate because of changes in conditions, or that the degree of compliance with the policies or procedures may deteriorate. In our opinion, Graphic Packaging Holding Company maintained, in all material respects, effective internal control over financial reporting as of December 31, 2013, based on the COSO criteria. We also have audited, in accordance with the standards of the Public Company Accounting Oversight Board (United States), the Consolidated Balance Sheets as of December 31, 2013 and 2012, and the related consolidated statements of operations, comprehensive income, shareholders’equity and cash flows for each of the three years in the period ended December 31, 2013 of Graphic Packaging Holding Company and our report dated February 6, 2014 expressed an unqualified opinion thereon.
/s/ Ernst & Young LLP Atlanta, Georgia February 6, 2014
97

Table of Contents
None.
Evaluation of Disclosure Controls and Procedures
The Company’s management has established disclosure controls and procedures designed to ensure that information required to be disclosed by the Company in the reports that it files or submits under the Securities Exchange Act of 1934, as amended (the “Exchange Act”) is recorded, processed, summarized and reported within time periods specified in the Securities and Exchange Commission rules and forms. Such disclosure controls and procedures include, without limitation, controls and procedures designed to ensure that information required to be disclosed by the Company in the reports that it files or submits under the Exchange Act is accumulated and communicated to the Company’s management to allow timely decisions regarding required disclosure.
Based on management’s evaluation as of the end of the period covered by this Annual Report on Form 10-K, the Company’s Chief Executive Officer and Chief Financial Officer have concluded that the Company’s disclosure controls and procedures (as defined in Rules 13a-15(e) and 15d-15(e) promulgated under the Exchange Act) were effective as of the end of the period covered by this Annual Report on Form 10-K.
Management’s Report on Internal Control Over Financial Reporting
The Company’s management is responsible for establishing and maintaining adequate internal control over financial reporting for the Company, as such term is defined in Exchange Act Rule 13a-15(f). Internal control over financial reporting is a process designed to provide reasonable assurance regarding the reliability of financial reporting and the preparation of financial statements for external purposes in accordance with generally accepted accounting principles. Internal control over financial reporting includes those policies and procedures that (i) pertain to the maintenance of records that, in reasonable detail, accurately and fairly reflect the transactions and dispositions of the Company’s assets; (ii) provide reasonable assurance that transactions are recorded as necessary to permit preparation of the financial statements in accordance with generally accepted accounting principles, and that receipts and expenditures are being made only with proper authorizations; and (iii) provide reasonable assurance regarding prevention or timely detection of unauthorized acquisition, use or disposition of the Company’s assets that could have a material effect on the financial statements.
Because of its inherent limitations, internal control over financial reporting may not prevent or detect misstatements. Also, projections of any evaluation of effectiveness to future periods are subject to the risk that controls may become inadequate because of changes in conditions, or that the degree of compliance with the policies or procedures may deteriorate.
The Company’s management, under the supervision of and with the participation of the Chief Executive Officer and the Chief Financial Officer, assessed the effectiveness of the Company’s internal control over financial reporting as of December 31, 2013 based on criteria for effective control over financial reporting described in Internal Control — Integrated Framework issued by the Committee of Sponsoring Organizations of the Treadway Commission (1992 framework). Based on this assessment, the Company’s management concluded that its internal control over financial reporting was effective as of December 31, 2013.
The effectiveness of the Company’s internal control over financial reporting as of December 31, 2013 has been audited by Ernst & Young LLP, an independent registered public accounting firm, as stated in their report which appears herein.
Changes in Internal Control Over Financial Reporting
None.
98
ITEM 9. CHANGES IN AND DISAGREEMENTS WITH ACCOUNTANTS ON ACCOUNTING AND FINANCIAL DISCLOSURE
ITEM 9A. CONTROLS AND PROCEDURES

Table of Contents
None.
99
ITEM 9B. OTHER INFORMATION

Table of Contents
PART III
Pursuant to Instruction G(3) to Form 10-K, the information relating to Directors of the Registrant, compliance with Section 16(a) of the Exchange Act and compliance with the Company’s Code of Ethics required by Item 10 is incorporated by reference to the Registrant’s definitive Proxy Statement for the 2014 Annual Meeting of Stockholders, which is to be filed pursuant to Regulation 14A within 120 days after the end of the Registrant’s fiscal year ended December 31, 2013.
Pursuant to Instruction G(3) to Form 10-K, the information required by Item 11 is incorporated by reference to the Registrant’s definitive Proxy Statement for the 2014 Annual Meeting of Stockholders, which is to be filed pursuant to Regulation 14A within 120 days after the end of the Registrant’s fiscal year ended December 31, 2013.
Pursuant to Instruction G(3) to Form 10-K, the information required by Item 12 is incorporated by reference to the Registrant’s definitive Proxy Statement for the 2014 Annual Meeting of Stockholders, which is to be filed pursuant to Regulation 14A within 120 days after the end of the Registrant’s fiscal year ended December 31, 2013.
Pursuant to Instruction G(3) to Form 10-K, the information required by Item 13 is incorporated by reference to the Registrant’s definitive Proxy Statement for the 2014 Annual Meeting of Stockholders, which is to be filed pursuant to Regulation 14A within 120 days after the end of the Registrant’s fiscal year ended December 31, 2013.
Pursuant to Instruction G(3) to Form 10-K, the information required by Item 14 is incorporated by reference to the Registrant’s definitive Proxy Statement for the 2014 Annual Meeting of Stockholders, which is to be filed pursuant to Regulation 14A within 120 days after the end of the Registrant’s fiscal year ended December 31, 2013.
100
ITEM 10. DIRECTORS, EXECUTIVE OFFICERS AND CORPORATE GOVERNANCE
ITEM 11. EXECUTIVE COMPENSATION
ITEM 12. SECURITY OWNERSHIP OF CERTAIN BENEFICIAL OWNERS AND MANAGEMENT AND RELATED STOCKHOLDER MATTERS
ITEM 13. CERTAIN RELATIONSHIPS AND RELATED TRANSACTIONS, AND DIRECTOR INDEPENDENCE
ITEM 14. PRINCIPAL ACCOUNTANT FEES AND SERVICES

Table of Contents
PART IV
a. Financial statements, financial statement schedule and exhibits filed as part of this report:
Consolidated Statements of Comprehensive Income for each of the three years in the period ended December 31, 2013
Consolidated Balance Sheets as of December 31, 2013 and 2012 Consolidated Statements of Shareholders’ Equity for each of the three years in the period ended December 31, 2013 Consolidated Statements of Cash Flows for each of the three years in the period ended December 31, 2013 Notes to Consolidated Financial Statements Reports of Independent Registered Public Accounting Firm
101
ITEM 15. EXHIBITS AND FINANCIAL STATEMENT SCHEDULES
1. Consolidated Statements of Operations for each of the three years in the period ended December 31, 2013
2. All schedules are omitted as the information required is either included elsewhere in the consolidated financial statements herein or is not applicable.
3. Exhibits to Annual Report on Form 10-K for Year Ended December 31, 2013.
Exhibit Number Description
3.1 Restated Certificate of Incorporation of New Giant Corporation. Filed as Exhibit 3.1 to Graphic Packaging Holding Company’s Current Report on Form 8-K filed on March 10, 2008 and incorporated herein by reference.
3.2 Bylaws of Graphic Packaging Holding Company, as amended on November 21, 2013. Filed as Exhibit 3.1 to Graphic Packaging Holding Company’s Current Report on Form 8-K filed on November 25, 2013 and incorporated herein by reference.
3.3 Certificate of Designation Preferences and Rights of Series A Junior Participating Preferred Stock. Filed as Exhibit 3.3 to Graphic Packaging Holding Company’s Current Report on Form 8-K filed on March 10, 2008 and incorporated herein by reference.
4.1 Registration Rights Agreement dated as of July 9, 2007, by and among New Giant Corporation, the persons listed on Schedule I thereto as Family Stockholders, any of the persons listed on Schedule I thereto as “Astro Stockholders,” Clayton, Dubilier & Rice Fund V Limited Partnership, EXOR Group S.A., TPG Bluegrass IV, L.P., TPG Bluegrass IV, Inc., TPG Bluegrass IV — AIV 2, L.P., TPG Bluegrass V. L.P., TPG Bluegrass V, Inc., TPB Bluegrass V — AIV 2, L.P., BCH Management, LLC, TPG FOF V — A, L.P., TPG FOF V — B., L.P. Filed as Annex F to New Giant Corporation’s Registration Statement on Form S-4 filed on August 31, 2007, as amended and incorporated herein by reference.
4.2 Rights Agreement entered into between Graphic Packaging Holding Company and Wells Fargo Bank, National Association. Filed as Exhibit 4.3 to Graphic Packaging Holding Company’s Current Report on Form 8-K filed on March 10, 2008 and incorporated herein by reference.
4.3 Indenture, dated as of June 16, 2009, among Graphic Packaging International, Inc., the guarantors named therein and U.S. Bank National Association, as Trustee, relating to the 9.5% Senior Notes due 2017 of Graphic Packaging International, Inc. Filed as Exhibit 4.1 to Graphic Packaging Holding Company’s Current Report on Form 8-K filed on June 18, 2009 and incorporated herein by reference.

Table of Contents
102
4.4 Supplemental Indenture, dated as of August 20, 2009, among Graphic Packaging International, Inc., the guarantors named therein and U.S. Bank National Association, as Trustee, relating to the 9.5% Senior Notes due 2017 of Graphic Packaging International, Inc. Filed as Exhibit 4.1 to Graphic Packaging Holding Company’s Current Report on Form 8-K filed on August 26, 2009 and incorporated herein by reference.
4.5 Indenture, dated as of September 29, 2010, among Graphic Packaging International, Inc. and Graphic Packaging Holding Company, Graphic Packaging Corporation and the other Note Guarantors party thereto, as Note Guarantors, and U.S. Bank National Association, as Trustee, relating to the 7.87% Senior Notes due 2018 of Graphic Packaging International, Inc. Filed as Exhibit 4.1 to Graphic Packaging Holding Company’s Current Report on Form 8-K filed on September 29, 2010 and incorporated herein by reference.
4.6 Supplemental Indenture, dated as of April 2, 2013, among Graphic Packaging International, Inc., the guarantors named therein and U.S. Bank National Association, as Trustee, relating to the 4.75% Senior Notes due 2021 of Graphic Packaging International, Inc. Filed as Exhibit 4.1 to Graphic Packaging Holding Company’s Current Report on Form 8-K filed on April 2, 2013 and incorporated herein by reference.
4.7 First Amendment dated as of July 1, 2010 to the Registration Rights Agreement dated as of July 9, 2007, by and among Graphic Packaging Holding Company, the persons listed on the signature pages thereto as Family Stockholders, Clayton, Dubilier & Rice Fund V Limited Partnership, Old Town S.A., Field Holdings, Inc., TPG Bluegrass IV, L.P., TPG Bluegrass IV, Inc., TPG Bluegrass IV — AIV 2, L.P., TPG Bluegrass V, L.P., TPG Bluegrass V, Inc., TPG Bluegrass V — AIV 2, L.P., TPG FOF V-A, L.P., TPG FOF V-B, L.P. and BCH Management, LLC. Filed as Exhibit 4.2 to Graphic Packaging Holding Company’s Quarterly Report on Form 10-Q filed on November 4, 2010 and incorporated herein by reference.
10.1* Employment Agreement, dated as of November 13, 2009, by and among Graphic Packaging International, Inc., Registrant and David W. Scheible. Filed as Exhibit 10.8 to Registrant’s Current Report on Form 8-K filed on January 22, 2010 and incorporated herein by reference.
10.2* Employment Agreement, dated as of November 5, 2009, by and among Graphic Packaging International, Inc., Registrant and Daniel J. Blount. Filed as Exhibit 10.3 to Registrant’s Current Report on Form 8-K filed on January 22, 2010 and incorporated herein by reference.
10.3* Employment Agreement, dated as of September 15, 2009, by and among Graphic Packaging International, Inc., Registrant and Stephen A. Hellrung. Filed as Exhibit 10.6 to Registrant’s Current Report on Form 8-K filed on January 22, 2010 and incorporated herein by reference.
10.4* Employment Agreement, dated as of November 9, 2009, by and among Graphic Packaging International, Inc., Registrant and Michael R. Schmal. Filed as Exhibit 10.9 to Registrant’s Current Report on Form 8-K filed on January 22, 2010 and incorporated herein by reference.
10.5* Employment Agreement, dated as of October 6, 2009, by and among Graphic Packaging International, Inc., Registrant and Michael P. Doss. Filed as Exhibit 10.4 to Registrant’s Current Report on Form 8-K filed on January 22, 2010 and incorporated herein by reference.
10.6* Employment Agreement, dated as of July 22, 2013 by and among Graphic Packaging International, Inc., Registrant and Carla J. Chaney. Filed as Exhibit 10.1 to Registrant’s Current Report on Form 8-K filed on July 23, 2013 and incorporated herein by reference.
10.7* Employment Agreement, dated as of October 26, 2009, by and among Graphic Packaging International, Inc., Registrant and Alan Nichols. Filed as Exhibit 10.7 to Registrant’s Current Report on Form 8-K filed on January 22, 2010 and incorporated herein by reference.
10.8* Amended and restated Employment Agreement dated as of November 21, 2013 by and among Graphic Packaging International, Inc., Graphic Packaging Holding Company and David W. Scheible. Filed as Exhibit 10.1 to the Company's Current Report on Form 8-K filed on November 25, 2013 and incorporated herein by reference.
10.9* Amended and restated Employment Agreement dated as of November 21, 2013 by and among Graphic Packaging International, Inc., Graphic Packaging Holding Company and Michael P. Doss. Filed as Exhibit 10.2 to the Company's Current Report on Form 8-K filed on November 25, 2013 and incorporated herein by reference.
10.10* 2003 Riverwood Holding, Inc. Long-Term Incentive Plan. Filed as Exhibit 10.15 to Registration Statement on Form S-4 (Registration Statement No. 333-104928) filed on May 2, 2003 and incorporated herein by reference.

Table of Contents
103
10.11* Graphic Packaging Excess Benefit Plan, as amended and restated, effective as of January 1, 2009. Filed as Exhibit 10.22 to Graphic Packaging Holding Company’s Annual Report on Form 10-K filed on February 23, 2010 and incorporated herein by reference.
10.12* Graphic Packaging Supplemental Retirement Plan, as amended and restated, effective as of January 1, 2009. Filed as Exhibit 10.23 to Graphic Packaging Holding Company’s Annual Report on Form 10-K filed on February 23, 2010 and incorporated herein by reference.
10.13 Form of Indemnification Agreement, dated as of September 10, 2003, entered into by and among Registrant, GPI Holding, Inc., Graphic Packaging International, Inc. and each of Jeffrey H. Coors, Stephen M. Humphrey, Kevin J. Conway, G. Andrea Botta, John D. Beckett, Harold R. Logan, Jr., John R. Miller, Robert W. Tieken, B. Charles Ames (as emeritus director) and William K. Coors (as emeritus director). Filed as Exhibit 10.30 to Graphic Packaging Corporation’s Annual Report on Form 10-K filed on March 16, 2004 and incorporated herein by reference.
10.14* Amended and Restated 2004 Stock and Incentive Compensation Plan effective May 19, 2011. Filed as Appendix A to the Registrant’s Definitive Proxy Statement on Schedule 14A filed on April 08, 2011 and incorporated herein by reference.
10.15* Form of Service-Based Restricted Stock Unit Award Agreement granted in 2012 and 2013. Filed as Exhibit 10.15 to the Company's Annual Report on Form 10-K on February 23, 2012 and incorporated herein by reference.
10.16* Form of Performance-Based Restricted Stock Unit Award Agreement granted in 2012 and 2013. Filed as Exhibit 10.16 to the Company's Annual Report on Form 10-K on February 23, 2012 and incorporated herein by reference.
10.17* Graphic Packaging International, Inc. Management Incentive Plan filed as Exhibit 10.32 to the Company's Annual Report on Form 10-K filed on February 23, 2012 and incorporated herein by reference.
10.18 Master Services Agreement dated November 29, 2007 by and between Graphic Packaging International, Inc. and Perot Systems Corporation. Filed as Exhibit 10.1 to the Company's Current Report on Form 8-K filed on December 5, 2007 and incorporate herein by reference.
10.19* Graphic Packaging International, Inc. Supplemental Plan for Participants in the Riverwood International Employees Retirement Plan, as amended and restated, effective as of January 1, 2009. Filed as Exhibit 10.36 to Graphic Packaging Holding Company’s Annual Report on Form 10-K filed on February 23, 2010 and incorporated herein by reference.
10.20* Riverwood International Change in Control Supplemental Retirement Plan, as amended and restated, effective as of January 1, 2008. Filed as Exhibit 10.37 to Graphic Packaging Holding Company’s Annual Report on Form 10-K filed on February 23, 2010 and incorporated herein by reference.
10.21 Amended and Restated Form of Indemnification Agreement for Directors. Filed as Exhibit 10.1 to Graphic Packaging Holding Company’s Quarterly Report on Form 10-Q filed on November 4, 2010 and incorporated herein by reference.
10.22* Riverwood International Employees Retirement Plan, as amended and restated through December 31, 2009. Filed as Exhibit 10.38 to the Company’s Annual Report on Form 10-K filed on March 8, 2011 and incorporated herein by reference.
10.23* First Amendment to the Riverwood International Employees Retirement Plan effective as of July 1, 2010. Filed as Exhibit 10.39 to the Company’s Annual Report on Form 10-K filed on March 8, 2011 and incorporated herein by reference.
10.24* Second Amendment to the Riverwood International Employees Retirement Plan effective as of November 5, 2010. Filed as Exhibit 10.40 to the Company’s Annual Report on Form 10-K filed on March 8, 2011 and incorporated herein by reference.
10.25* Graphic Packaging Retirement Plan, as amended and restated through December 31, 2009. Filed as Exhibit 10.41 to the Company’s Annual Report on Form 10-K filed on March 8, 2011 and incorporated herein by reference.
10.26* First Amendment to the Graphic Packaging Retirement Plan effective as of July 1, 2010. Filed as Exhibit 10.42 to the Company’s Annual Report on Form 10-K filed on March 8, 2011 and incorporated herein by reference.
10.27* Second Amendment to the Graphic Packaging Retirement Plan effective as of November 5, 2010. Filed as Exhibit 10.43 to the Company’s Annual Report on Form 10-K filed on March 8, 2011 and incorporated herein by reference.

Table of Contents
104
10.28* Graphic Packaging International, Inc. Non-Qualified Deferred Compensation Plan filed as Exhibit 10.44 to the Company’s Annual Report on Form 10-K filed on February 23, 2012 and incorporated herein by reference.
10.29 Stock Repurchase Agreement dated as of December 12, 2012 by and among Graphic Packaging Holding Company, TPG Bluegrass IV - AIV 1, L.P., TPG Bluegrass IV - AIV 2, L.P., TPG Bluegrass V - AIV 1, L.P., TPG Bluegrass V - AIV 2, L.P., TPG FOF V - A, L.P., TPG FOF V - B, L.P., Adolph Coors Jr. Trust, Augusta Coors Collbran Trust, Bertha Coors Munroe Trust, Grover C. Coors Trust, Herman F. Coors Trust, Louise Coors Porter Trust, May Kistler Coors Trust, Adolph Coors Foundation, Clayton Dubilier & Rice Fund V Limited Partnership, and Old Town, S.A. Filed as Exhibit 10.1 to the Company's Current Report on Form 8-K filed on December 18, 2012 and incorporated herein by reference.
10.30* Executive Employment Agreement dated as of July 16, 2012 by and among Graphic Packaging International, Inc., Graphic Packaging Holding Company and Allen Ennis. Filed as Exhibit 10.1 to the Company's Current Report on Form 8-K filed on July 17, 2012 and incorporated herein by reference.
10.31* First Amendment to the Graphic Packaging International, Inc. Supplemental Plan for Participants in the Riverwood International Employees Retirement Plan. Filed as Exhibit 10.1 to the Company's Current Report on Form 8-K filed on May 24, 2012 and incorporated herein by reference.
10.32* Employment Agreement dated as of April 1, 2012 by and among Graphic Packaging International, Inc., Graphic Packaging Holding Company and Stephen Scherger. Filed as Exhibit 10.1 to the Company's Current Report on Form 8-K filed on April 5, 2012 and incorporated herein by reference.
10.33 $2,000,000,000 Amended and Restated Credit Agreement dated as of March 16, 2012, by and among Graphic Packaging International, Inc., the several Lenders from time to time parties thereto, Bank of America, N.A., as Administrative Agent, L/C Issuer, Swing Line Lender and Alternative Currency Funding Fronting Lender; JPMorgan Chase Bank, N.A., Citibank, N.A., Goldman Sachs Bank USA and SunTrust Bank, as Co-Syndication Agents; and Merrill Lynch, Pierce, Fenner & Smith Incorporated, J.P. Morgan Securities LLC, Citigroup Global Markets Inc., Goldman Sachs Bank USA and SunTrust Robinson Humphrey, Inc., as Joint Lead Arrangers and Joint Book Running Managers. Filed as Exhibit 10.1 to the Company's Current Report on Form 8-K filed on March 22, 2012 and incorporated herein by reference.
10.34 Amendment No. 1 to Credit Agreement dated as of December 18, 2012 by and among Graphic Packaging International, Inc., Graphic Packaging Holding Company, Graphic Packaging Corporation, Bank of America, N.A., as administrative agent, and each of the Lenders under the Amended and Restated Credit Agreement dated as of March 16, 2012. Filed as Exhibit 10.2 to the Company's Current Report on Form 8-K filed on December 18, 2012 and incorporated herein by reference.
10.35 Amendment No. 2 dated September 13, 2013 to Amended and Restated Credit Agreement dated as of March 16, 2012, as previously amended, among Bank of America, N.A., as Administrative Agent, Swing Line Lender, L/C Issuer and Alternative Currency Funding Fronting Lender, and JP Morgan Chase Bank, N.A., Citibank, N.A., Goldman Sachs Bank USA and SunTrust Bank, as Co-Syndication Agents, and the several lenders from time to time party thereto. Filed as Exhibit 10.1 to the Company's Current Report on Form 8-K filed on September 18, 2013 and incorporated herein by reference.
10.36 First Amendment to Master Services Agreement dated as of September 22, 2008 by and between Graphic Packaging International, Inc. and Perot Systems Corporation.
10.37 Second Amendment to Master Services Agreement effective as of August 1, 2012 by and between Graphic Packaging International, Inc. and Dell Marketing L.P. (as assignee of Perot Systems Corporation).
14.1 Code of Business Conduct and Ethics. Filed as Exhibit 14.1 to the Company's Annual Report on Form 10-K filed on March 8, 2011 and incorporated herein by reference.
21.1 List of Subsidiaries.
23.1 Consent of Independent Registered Public Accounting Firm.
31.1 Certification required by Rule 13a-14(a).
31.2 Certification required by Rule 13a-14(a).
32.1 Certification required by Section 1350 of Chapter 63 of Title 18 of the United States Code.

Table of Contents
____________ * Executive compensation plan or agreement
105
32.2 Certification required by Section 1350 of Chapter 63 of Title 18 of the United States Code.

Table of Contents
SIGNATURES
Pursuant to the requirements of Section 13 or 15(d) of the Securities Exchange Act of 1934, the Registrant has duly caused this report to be signed on its behalf by the undersigned, thereunto duly authorized.
GRAPHIC PACKAGING HOLDING COMPANY (Registrant)
POWER OF ATTORNEY
Pursuant to the requirements of the Securities Exchange Act of 1934, this report on Form 10-K has been signed below by the following persons on behalf of the Registrant and in the capacities and on the dates indicated. Each of the directors of the Registrant whose signature appears below hereby appoints Daniel J. Blount and Stephen A. Hellrung, and each of them severally, as his or her attorney-in-fact to sign in his or her name and behalf, in any and all capacities stated below, and to file with the Securities and Exchange Commission any and all amendments to this report on Form 10-K, making such changes in this report on Form 10-K as appropriate, and generally to do all such things on their behalf in their capacities as directors and/or officers to enable the Registrant to comply with the provisions of the Securities Exchange Act of 1934, and all requirements of the Securities and Exchange Commission.
106
/s/ DAVID W. SCHEIBLE David W. Scheible
Chairman, President and Chief Executive Officer (Principal Executive Officer)
February 6, 2014
/s/ DANIEL J. BLOUNT Daniel J. Blount
Senior Vice President and Chief Financial Officer (Principal Financial Officer)
February 6, 2014
/s/ DEBORAH R. FRANK Deborah R. Frank
Vice President and Chief Accounting Officer (Principal Accounting Officer)
February 6, 2014
Table of Contents
107
Signatures Title Date
/s/ GEORGE V. BAYLY George V. Bayly
Director February 6, 2014
/s/ G. ANDREA BOTTA G. Andrea Botta
Director February 6, 2014
/s/ DAVID D. CAMPBELL David D. Campbell
Director February 6, 2014
/s/ KEVIN J. CONWAY Kevin J. Conway
Director February 6, 2014
/s/ JEFFREY H. COORS Jeffrey H. Coors
Director February 6, 2014
/s/ HAROLD R. LOGAN, JR. Harold R. Logan, Jr.
Director February 6, 2014
/s/ MICHAEL G. MACDOUGALL Michael G. MacDougall
Director February 6, 2014
/s/ PHILIP R. MARTENS Philip R. Martens
Director February 6, 2014
/s/ DAVID A. PERDUE David A. Perdue
Director February 6, 2014
/s/ DAVID W. SCHEIBLE David W. Scheible
Chairman and Director February 6, 2014
/s/ LYNN A. WENTWORTH Lynn A. Wentworth
Director February 6, 2014

Table of Contents
108

First Amendment
to Master Services Agreement
The Master Services Agreement dated as of November 29, 2007 (“GPI Agreement”), by and between Graphic Packaging
International, Inc., (“GPI”), and Perot Systems Corporation (“Perot Systems”) is hereby amended as of September 22,
2008 (“Amendment Date”) by this First Amendment (“Amendment”).
Whereas, Altivity Packaging, LLC (“Altivity”), and Perot Systems entered into a Master Information Technology
Services Agreement as of January 1, 2007 (the “Altivity Agreement”);
Whereas, GPI acquired Altivity as of March 10, 2008;
Whereas, under Section 11.1(c)(ii) of the GPI Agreement, Altivity is the “Target Entity,” GPI has elected “to combine
the Designated Services then provided to GPI and the Service Recipients pursuant to this Agreement with the services
then provided to the Target Entity and its Affiliates pursuant to their agreement with Perot Systems”, and GPI has further
elected to require Perot Systems to permit Altivity to terminate the Altivity Agreement without obligation to pay any
Termination Fee or similar fee or charge to Perot Systems;
Whereas, GPI represents that it has the authority to act for Altivity under the Altivity Agreement; and
Whereas Perot Systems and GPI (the “Parties”) wish to enter into this Amendment to document the termination of the
Altivity Agreement and the combination of the services being provided to Altivity with the Designated Services being
provided to GPI.
Now, therefore, the Parties agree as follows:
1. Subject to the terms of this Amendment, the Altivity Agreement is hereby terminated as of the Amendment Date
by mutual agreement of the Parties.
2. Data that were “Altivity Data” under Section 7.1 of the Altivity Agreement shall be deemed GPI Data.
3. Information that was “Confidential Information” of Altivity or Perot Systems under Section 10.1 of the Altivity
Agreement, subject to the exceptions defined in Section 10.3

(a) of the Altivity Agreement, shall be Confidential Information of GPI or Perot Systems, respectively, under the GPI Agreement.
4. Subject to Section 5 of this Amendment, “Charges” as defined in and incurred under the Altivity Agreement
before the Amendment Date and not previously paid by Altivity shall be deemed “Charges” payable by GPI
under the GPI Agreement; provided that GPI shall retain the right to dispute any such amounts in accordance
with Section 4.3 (Disputed Invoices) of the GPI Agreement.
5. The modified charges payable by GPI under the GPI Agreement as a result of the consummation of the
transactions contemplated by this Amendment shall apply beginning September 1, 2008. Accordingly, any
Monthly Base Charges (as defined in the Altivity Agreement) previously invoiced by Perot Systems under the
Altivity Agreement for the month of September 2008 and any Monthly Service Charges (as defined in the GPI
Agreement) previously invoiced by Perot Systems under the GPI Agreement for the month of September 2008
shall be deemed void, and shall be superseded by a single Monthly Service Charge calculated in accordance
with the revised Schedule 4.1 (Charges) attached hereto and reflected in a new Monthly Invoice to be issued
by Perot Systems to GPI promptly after the Amendment Date, which Monthly Invoice shall thereafter be
payable by GPI in accordance with Section 4.2 (Invoicing and Payment) of the GPI Agreement.
Notwithstanding the foregoing, portions of outstanding invoices delivered by Perot Systems prior to the
Amendment Date to Altivity under the Altivity Agreement and to GPI under the GPI Agreement that represent
charges and credits with respect to services performed during periods prior to September 1, 2008 shall remain
payable in accordance with the terms of the Altivity Agreement and GPI Agreement, respectively.
6. The Service Levels under the GPI Agreement as a result of the consummation of the transactions contemplated
by this Amendment shall apply (including, without limitation, for purposes of determining the accrual of
Service Level Credits and reporting obligations) beginning on the effective dates specified in Attachment A to
Schedule 2.10 (Service Level Agreement) to the GPI Agreement, as amended by this Amendment (the “SLA
Effective Dates”). Service Levels with SLA Effective Dates later than September 1, 2008 (collectively, the
“Combined Scope Service Levels”) represent combinations of Service Levels in effect prior to the
Amendment Date under the Altivity Agreement and under the GPI Agreement (collectively, the “Legacy
Service Levels”). From September 1, 2008 until such time as each Combined Scope Service Level takes effect
on its SLA Effective Date, the Legacy Service Levels combined to create such Combined Scope Service Level
will continue to apply; provided that, in the event during such period there

occurs a Service Level Failure (as defined in the GPI Agreement) or Service Level Default (as defined in the Altivity Agreement) of any such Legacy Service Level, the amount of the resulting Service Level Credit (as defined in the GPI Agreement) will equal 50% of the Service Level Credit that would have accrued in the event of a Service Level Failure of the Combined Scope Service Level into which such Legacy Service Level is to be combined, as determined in accordance with Schedule 2.10 of the GPI Agreement, as amended. In revising Attachment A to Schedule 2.10 (Service Level Agreement) of the GPI Agreement to reflect the terms of this Amendment, the Parties have removed the “Current State Service Levels” from Attachment A. Notwithstanding, the Parties acknowledge and agree that the Current State Service Levels (as set forth in Attachment A prior to its amendment) were applicable prior to completion of Transition in accordance with Schedule 2.10 (Service Level Agreement) of the GPI Agreement.
7. The following amendments are hereby made to Section 5.2 (Charges Renegotiation) of the Agreement:
a. The following sentence is hereby added to the end of Section 5.2(a) (Underutilization of Resource Units)
of the Agreement: “With respect to RS6000 Server Services such renegotiation right will be
triggered when the consumption for all types of RS6000 LPARs is less than sixty-five percent
(65%) of the cumulative Baselines for all types of RS6000 LPARs for three (3) consecutive
months or for five (5) months in any seven (7) month period, and such reduced resource
utilization is anticipated by GPI to continue on a long term basis.”
b. The following sentence is hereby added to the end of Section 5.2(b) (Excess Utilization of Resource
Units) of the Agreement: “With respect to RS6000 Server Services such renegotiation right will
be triggered when the consumption for all types of RS6000 LPARs is greater than 135% of the
cumulative Baselines for all types of RS6000 LPARs for three (3) consecutive months or for
five (5) months in any seven (7) month period, and such excess resource utilization is
anticipated by GPI to continue on a long term basis.”
8. Subject to the terms of this Amendment, only the following sections of the Altivity Agreement shall survive its
termination, and only as to rights and obligations arising out of acts, omissions, conditions or events occurring
or existing before the Amendment Date, with GPI succeeding to Altivity’s rights and obligations under such
sections:
a. 3.14 (Compliance with Laws),
b. 4.11 (Government Contract Flow-Down Clauses),

Without limiting the foregoing, the termination of the Altivity Agreement shall not constitute a waiver or
termination of (i) any rights of Altivity (and GPI as successor thereto) arising out of a breach by Perot Systems of
any term of the Altivity Agreement prior to the Amendment Date, or (ii) any rights of Perot Systems arising out
of a breach by Altivity of any term of the Altivity Agreement prior to the Amendment Date.
c. 5.5 (Audit Rights) excluding 5.5(b) and, as to operational audits only, 5.5(d) (provided that the Parties
acknowledge and agree that GPI’s right to conduct operational audits pursuant to Section 14.1 of
the GPI Agreement shall include operational audits pertaining to Altivity, including operational
audits related to acts, omissions, conditions or events occurring or existing before the
Amendment Date),
d. 7 (Altivity Data),
e. 8.1 (Altivity Owned Materials),
f. 8.2 (Ownership of Developed Materials),
g. 8.4 (License to Service Provider),
h. 8.5 (Service Provider Pre-Existing Materials),
i. 10.1 (Confidential Information),
j. 10.2 (Obligations),
k. 10.3 (Exceptions to Confidential Treatment),
l. 11 (Representations and Warranties), except that any warranty under 11.7 shall not extend beyond the
Amendment Date,
m. 13.1 (Indemnity by Service Provider),
n. 13.2 (Indemnity by Altivity),
o. 13.3 (Additional Indemnities),
p. 13.4 (Infringement),
q. Article 14 (Sections 14.1-14.7) (Liability);
r. 16.1 (Force Majeure),
s. 18.6 (Relationship of the Parties),
t. 18.11 (Severability),
u. 18.12 (Order of Precedence),
v. 18.13 (Waiver of Default; Cumulative Remedies),
w. 18.14 (Third Party Beneficiaries),
x. 18.19 (Binding Nature and Assignment),
y. 18.21 (Entire Agreement), and
z. 18.23 (Covenant of Good Faith).
9. From and after the Amendment Date, (i) “Altivity Owned Materials” existing under and as defined in the Altivity
Agreement shall be deemed to be “GPI Software” and/or “GPI

Tools,” as applicable, under and as defined in the GPI Agreement; (ii) “Service Provider Owned Materials” existing under and as defined in the Altivity Agreement shall be deemed to be “Perot Systems Software” and/or “Perot Systems Tools,” as applicable, under and as defined in the GPI Agreement; and (iii) “Developed Materials” created or prepared by Perot Systems under and as defined in the Altivity Agreement (whether completed or under development at the Amendment Date) shall, subject to Section 8.2 (b&c) of the Altivity Agreement, be deemed to be “Deliverables” under and as defined in the GPI Agreement and all Intellectual Property Rights (as defined in the GPI Agreement) therein shall be owned by GPI in accordance with the GPI Agreement.
10. The terms and conditions relating to “Transitioned Employees” (as defined in the Altivity Agreement) in Section
4.6 (Training/Career Opportunities), Section 13.1(k) (Employment Claims) and Section 13.2(h) (Employment
Matters) of the Altivity Agreement and in Sections 2(b) (Benefit Plans), 4 (Employment Status with Altivity),
and 6 (Other Employee Matters) of Schedule 5 to the Altivity Agreement, shall survive the termination of the
Altivity Agreement with GPI succeeding Altivity as to Altivity’s rights and obligations with respect to such
terms and conditions.
11. Any Projects that are being performed pursuant to the Altivity Agreement as of the Amendment Date shall
continue to be performed by Perot Systems in accordance with the applicable Statement of Work or Project
Plans under which such Projects were commissioned.
12. For purposes of calculating the Damages Limitation defined in the first sentence of Section 18.2(a) of the GPI
Agreement during the first twelve months after the Amendment Date, “Charges” as defined in the GPI
Agreement shall be calculated so as to include the total “Charges” as defined in the Altivity Agreement that
were payable to Perot Systems for performance of the Services under the Altivity Agreement (exclusive of
Out-of-Pocket Expenses, Pass-Through Expenses, cost-plus Charges or taxes as those terms are defined in the
Altivity Agreement) for the period between (i) twelve months prior to the assertion of the claim and (ii) the
Amendment Date.
13. Any disputes that arise under the Altivity Agreement after the Amendment Date relating to periods prior thereto
shall be administered in accordance with the Dispute Resolution Procedures in the GPI Agreement. Any
indemnity proceedings arising under the terms of the Altivity Agreement after the Amendment Date relating
to periods prior thereto shall be administered in accordance with the indemnification procedures set forth in
Section 17.3 (Indemnification Procedures) of the GPI Agreement.

“Operational Change Control is sometimes referred to as Change Management.”
“This refresh obligation does not apply to the following GPI Equipment which prior to the Amendment
Date was Altivity Equipment: mainframe hardware; AS400 hardware; Wintel Type 7, 8, and 9 servers;
network equipment for locations listed in Schedule 10.2 in the worksheet with the tab entitled “GPI
Locations (Former ALT)”; and one IBM DS8100. The foregoing exceptions do not apply to 24 Wintel
Type 8 Servers and two IBM DS8100s in service as of the Amendment Date, which the Parties
acknowledge were GPI Equipment prior to the Amendment Date.”
1.1(a), Service Recipients;
2.1.1, Service Towers;
2.2(a), Statement of Work;
2.8(b), Managed Agreements;
14. Schedule A is amended by adding the following sentence to the definition of “Operational Change Control
Procedures”:
15. Section 15.11(b) of the GPI Agreement is amended, by adding the phrase “the amount set forth in Schedule
15.11(b) for the month in which the effective date of termination occurs,” to state as follows:
“(b) Notwithstanding anything to the contrary in this Agreement, regardless of the grounds for any termination, GPI shall pay Perot Systems for all Charges payable by GPI arising prior to the effective date of termination, any accrued and unpaid Transition Fees applicable to Transition tasks completed by Perot Systems prior to the effective date of termination, any Charges for Termination Assistance (which could include payment for Designated Services), the amount set forth in Schedule 15.11(b) for the month in which the effective date of termination occurs, and any expenses incurred by Perot Systems prior to the effective date of termination for which GPI is financially responsible under this Agreement, and GPI will continue to be responsible for all Taxes for which it is responsible under this Agreement.”
16. Section 8.3(a)(i) of the GPI Agreement is amended by adding the following after the end of the second sentence:
17. The following Schedules and Attachments of the GPI Agreement are amended and restated, or added, as of the
Amendment Date and, as so amended and restated or added, are attached hereto and made part hereof:

2.10, Service Level Agreement (Attachments only);
2.13, Reports (provided that, during the 30-day period after the Amendment Date, the Parties will review
and validate the version of Schedule 2.13 attached hereto and may further amend such version by
agreement);
4.1, Charges (including Attachments A, B & D-H) (E-H are added);
8.2, Financial Responsibilities Matrix;
9.2(a)(i)(A), Key and Critical Personnel;
9.2(a)(i)(B), GPI Competitors;
10.2, Service Locations (Attachments only);
15.11(b), Unamortized Costs (added as new Schedule); and
19.1, Insurance.
In addition, the Parties intend to revise Schedule 4.2(b), Invoices, by mutual agreement within 30 days after the
Amendment Date. Further, during the 60-day period after the Amendment Date, Perot Systems will develop supplements
to the Procedures Manual that describe, at a reasonable level of detail, release management and records retention
procedures; provided, that, in the case of the supplement pertaining to records retention, GPI will make available to
Perot Systems sufficient information regarding GPI’s record retention policies and confer with Perot Systems as
reasonably requested regarding the interpretation of such policies and their application to the Designated Services.
IN WITNESS WHEREOF, the Parties have duly executed and delivered this First Amendment as of the Amendment Date.
GRAPHIC PACKAGING INTERNATIONAL, INC.
By: /s/ Stephen A. Hellrung
Name: Stephen A. Hellrung
Title: SVP, General Counsel and Secretary
PEROT SYSTEMS CORPORATION
By: /s/ Charles S. Martel
Name: Charles S. Martel
Title: Client Executive

Confidential
Second Amendment
to Master Services Agreement
The Master Services Agreement dated as of November 29, 2007, consisting of the terms and conditions set forth
therein and the attached schedules, all as previously amended, (the “Agreement”) by and between Graphic Packaging International, Inc. (“GPI”) and Perot Systems Corporation is hereby amended effective as of August 1, 2012 (“Second Amendment Effective Date”) by this Second Amendment (“Second Amendment”). The Parties to this Second Amendment are GPI and Dell Marketing L.P. (“Dell”) (as assignee of Perot Systems Corporation). Capitalized terms used without definition in this Second Amendment have the meanings provided in the Agreement. In the event of any conflict or inconsistency between the terms and conditions of this Second Amendment and those of the Agreement, the terms and conditions of this Second Amendment shall control to the extent of such conflict or inconsistency. All other terms and conditions in the Agreement not amended by this Second Amendment shall remain in full force and effect.
In consideration of the terms and conditions of this Second Amendment and the Agreement, and for other good and valuable consideration, the receipt and sufficiency of which the Parties acknowledge, the Parties agree as follows:
1. Term of Agreement. Section 1.2 (Term) of the Agreement is deleted in its entirety and replaced with the following:
The term of this Agreement (the “Term”) will begin on the Effective Date and, unless terminated earlier pursuant to Article XV (Termination) or extended pursuant to Section 1.3 (Extension), will continue until 11:59 p.m. Atlanta, Georgia time on July 31, 2017 (the “Term Expiration Date”).
2. Extension. Section 1.3(b) of the Agreement is deleted in its entirety and replaced with the following:
Notwithstanding Section 1.3(a), GPI shall have two (2) options to extend the Term for a period of up to twelve (12) months each (each such twelve (12) month period, an “Option Period”), resulting in aggregate Option Periods of up to twenty-four (24) months. Dell will provide Notice to GPI of the Term Expiration Date no less than one hundred twenty (120) days prior thereto, and, if Dell has provided such Notice to GPI in accordance with this Section 1.3(b), then GPI shall be deemed to have elected to exercise its option to extend the Term for twelve (12) months unless, by sixty (60) days prior to the Term Expiration Date, GPI provides Notice to Dell that it either (i) declines to extend the Term or (ii) elects to extend the Term but specifies a first Option Period of less than twelve (12) months. If GPI elects (or is deemed to have elected) to extend the Term for a first Option Period, then Dell also will provide Notice to GPI of the expiration of the first Option Period no less than one hundred twenty (120) days prior thereto, and, if Dell has provided such Notice to GPI in accordance with this Section 1.3(b), then GPI shall be deemed to have elected to exercised its option to extend the Term for twelve (12)
GPI/Dell Confidential 1

SECOND AMENDMENT EXECUTION COPY
months following the expiration of the first Option Period unless, by sixty (60) days prior to the expiration of the first Option Period, GPI provides Notice to Dell that it either (i) declines to extend the Term or (ii) elects to extend the Term but specifies a second Option Period of less than twelve (12) months. Dell will provide the Notices described in this Section 1.3(b) to both the GPI recipients identified in Section 21.8 (Notices) and the Vice President of IT Operations at GPI, all in accordance with Section 21.8 (Notices). GPI may also exercise its right to extend the Term for the Option Periods by providing Dell with Notice of such election no less than sixty (60) days prior to the original Term Expiration Date (in the case of GPI’s exercise of its right to extend the Term for the first Option Period), and no less than sixty (60) days prior to the expiration of the first Option Period (in the case of GPI’s exercise of its right to extend the Term for the second Option Period), regardless of whether Dell has provided Notice of the Term Expiration Date or the expiration of the first Option Period as provided in this Section 1.3(b). Each such extension shall be at the Charges and terms and conditions in effect (i) as of the Term Expiration Date, in the case of the first Option Period; and (ii) as of the expiration of the first Option Period, in the case of the second Option Period.
3. Procedures Manual. Dell will update the Procedures Manual as appropriate to ensure the policies and procedures as set out in the Procedures Manual are accurate and complete in accordance with Section 3.3 (Procedures Manual) of the Agreement on and after the Amendment Date, and deliver the updated Procedures Manual to GPI within ninety (90) days after the Amendment Date. The updated Procedures Manual will be subject to the written approval of GPI and Dell pursuant to the Contract Change Control Procedures.
4. Payment Terms.
4.1. Section 4.2(a) (Monthly Invoice) is deleted in its entirety and replaced with the following:
i. Monthly Invoice. Not before the fifteenth (15 th ) calendar day of each calendar month (the “Base Month”), Dell will provide GPI with an invoice (the “Monthly Invoice”) setting forth the following: (i) the Monthly Service Charges for the Designated Services to be provided by Dell during that Base Month; and (ii) Adjustments to the Charges relating to Designated Services performed during the month prior to the Base Month (e.g., if the Base Month is April, the Adjustments will be made to Charges for Designated Services performed in March). Together with each Monthly Invoice, Dell will deliver to GPI such reports as are necessary for GPI to understand, evaluate and independently calculate the Adjustments reflected in the Monthly Invoice and to track its internal use of the Designated Services for charge-back purposes. Subject to Section 4.3 (Disputed Invoices), GPI will pay all amounts on the Monthly Invoice within sixty (60) days after receipt, by means of a wire transfer or other electronic means reasonably acceptable to Dell. Interest will accrue on unpaid undisputed invoiced Charges, and on unpaid disputed invoiced Charges that are in excess of the Disputed Charges Limitation, at the rate of one percent (1%) per month, commencing on the first day after such Charges were due.
2 GPI/Dell Confidential LEGAL02/33539525v3

SECOND AMENDMENT EXECUTION COPY
4.2. Section 4.3(e) is deleted in its entirety and replaced with the following:
(e) If it is finally determined, pursuant to the Dispute Resolution Procedures, that GPI owes Dell any withheld disputed amounts, then GPI will pay Dell such amounts, plus interest thereon accruing from the date such amounts were actually due (i.e., sixty (60) days following the date such amounts were invoiced) at the rate of one percent (1%) per month;
5. Benchmarking. Section 5.1(a) of the Agreement is deleted in its entirety and replaced with the following: (a) GPI may, beginning in the 12 th month following the Second Amendment Effective Date, measure
the Charges under this Agreement as compared to other organizations receiving similar services (a “Benchmark”). At the option of GPI, for each Benchmark, GPI may Benchmark (a) all Designated Services or (b) the Designated Services under one or more Service Towers (the “Benchmarked Services”). GPI may not perform a Benchmark more frequently than twice during the Term. Furthermore, GPI may not Benchmark a New Service during the first twelve (12) months after Dell commences delivery of such New Services; provided that GPI may Benchmark the Service Tower that includes the New Service during such twelve (12) month period, but may not include such New Service in the Benchmark.
6. Technology Plan. Section 8.1(b) (Technology Plan) of the Agreement is deleted in its entirety and replaced with the following:
(b) Technology Plan . GPI and Dell will jointly prepare a technology plan that addresses GPI’s service and technology requirements (the “Technology Plan”). The Technology Plan will include, among other things (i) a comprehensive assessment and strategic analysis of the Designated Services, (ii) an analysis of the Software and Equipment then utilized in connection with the Designated Services and whether modifications are necessary, and (iii) performance discussion of Key Personnel. The Technology Plan will also include a three (3) year roadmap setting direction and planning for the Designated Services and the technologies used by Dell therein (including all Equipment and Software used therein), taking into account GPI’s business priorities and strategies, and competitive market forces. At each Semi-Annual Technology Review Meeting, the Parties will update the Technology Plan. Such updates should include specific information regarding requirements, upcoming Projects and such other information that the Parties believe should be included in short-term planning. At the second Semi-Annual Technology Review Meeting for a Contract Year, the Parties will review the Technology Plan and update, as appropriate, the three (3) year technology roadmap. The Parties agree that they will use reasonable commercial efforts to use the resources theretofore allocated to the GPI account to accommodate any change to the Technology Plan, and that Dell will attempt to mitigate increases, if any, to the Charges to accommodate such change. Notwithstanding the foregoing and except as set forth in Section 8.1(c) (Changes to Technology Plan) the Parties will agree at the Semi-Annual Technology Review Meetings, upon any increased Charges for a change to the Technology Plan, and unless any such changes to Charges are agreed upon at the Semi-
3 GPI/Dell Confidential LEGAL02/33539525v3

SECOND AMENDMENT EXECUTION COPY
Annual Technology Review Meetings, all work related to a change to the Technology Plan will be included in the then-existing Charges. The Parties agree to cooperate in good faith to prepare and finalize the Technology Plan within the first ninety (90) days following the Second Amendment Effective Date.
7. Data Transfer Agreement. New Section 10.9 (Data Transfer Agreement) is added to the Agreement as follows:
10.9 Data Transfer Agreement. On or about the Second Amendment Effective Date, Dell as the data processor and GPI as the data controller will execute and deliver, as an addendum to this Agreement, the standard contractual clauses for international transfers of personal data that are included within European Commission Decision 2010/87/EU, in the form attached as Schedule 10.9 (Data Transfer Agreement). For the purposes of this Section 10.9 and Section 13.1(a), “personal data”, “process/processing”, “controller”, and “processor” shall have the same meaning as in Directive 95/46/EC of the European Parliament and of the Council of 24 October 1995 on the protection of individuals with regard to the processing of personal data and on the free movement of such data.
8. Data. Section 13.1(a) of the Agreement is deleted in its entirety and replaced with the following:
(a) Ownership and Use of Data. As between Dell and GPI, GPI Data is the exclusive property of GPI. Dell will use the GPI Data only in connection with providing the Designated Services and conducting necessary testing pursuant to this Agreement, all in accordance with Dell’s obligations under this Agreement. GPI has and will have the right to transfer to Dell such GPI Data that GPI transfers to Dell that constitutes personal data. Dell has and will have the right to transfer to GPI the personal data that Dell transfers to GPI hereunder or that Dell otherwise requires to transfer to GPI to administer lawful business processing by Dell, except to the extent such personal data is GPI Data covered by GPI instructions. Except as otherwise expressly agreed in writing, Dell will not, and will not attempt to, sell, license, provide, disclose, use, pledge, hypothecate and/or in any other way transfer the GPI Data. All such attempts by Dell will be void, without legal effect and deemed a material breach of this Agreement. All access to GPI Data will be subject to the Confidentiality provisions set forth in Section 13.2 (Confidentiality).
9. Disentanglement Services. Section 15.12(a) of the Agreement is deleted in its entirety and replaced with the following:
15.12 Termination Assistance.
(a) For a period specified by GPI in its discretion, commencing on the date designated by GPI, which may be no earlier than the first to occur of (i) the date on which GPI provides notice of termination, or (ii) ninety (90) days prior to the applicable date of expiration, and ending no later than twenty-four (24) months following
4 GPI/Dell Confidential LEGAL02/33539525v3

SECOND AMENDMENT EXECUTION COPY
the expiration or termination of this Agreement or any Service Tower for any reason (the “Termination Assistance Period”), Dell will perform, at the request of GPI, the terminated or expired Designated Services and provide to GPI or a Successor Provider any and all assistance reasonably requested by GPI to allow the terminated or expired Designated Services to continue without interruption or adverse effect, to mitigate any disruption to GPI’s business, and to facilitate the orderly transfer of responsibility for the terminated or expired Designated Services to GPI or one or more Successor Providers (collectively, the “Termination Assistance Services”). GPI acknowledges that Dell may require the Successor Provider to enter into a commercially reasonable confidentiality agreement prior to Dell sharing any Dell Confidential Information with such Successor Provider.
10. Export Controls. Section 10.4(b) of the Agreement is deleted in its entirety and replaced with the following:
(b) Each Party agrees to comply with (i) all United States export laws and regulations issued by any U.S. Governmental Authority that govern the export or reexport of Software, hardware or technology provided hereunder (the “Products”) and any of the Designated Services, including without limitation the U.S. Export Administration Regulations, the International Traffic in Arms Regulations (“ITAR”) and any regulations administered by the Department of the Treasury’s Office of Foreign Assets Control, and (ii) any applicable Laws and regulations of countries other than the United States that govern the importation, use, export or reexport of the Products and Designated Services. Each Party further agrees (a) to obtain appropriate export authorizations, consents or licenses that may apply to such Party’s export of any Products or Designated Services, and (b) to comply with any conditions that are contained in any export licenses pertaining to the Products upon notice of such conditions by the other Party. Without limiting the generality of the foregoing, neither Party will export or reexport, directly or indirectly, any of the Products or Designated Services to Cuba, Iran, Libya, Syria, Sudan or North Korea. Each Party agrees to comply with any reporting requirements that may apply to the export or reexport of the Products and Designated Services and to provide to the other Party or the appropriate Governmental Authority any periodic reports containing such information as may be required under applicable Law. Dell further agrees to provide GPI with Notice of any federal, state, or local U.S. taxes or tariffs that may apply to import, export or reexport of any Products or Designated Services, and, either GPI will pay such taxes or tariffs or, at the request of GPI, Dell will pay any such taxes or tariffs and GPI will promptly reimburse Dell for the amount so paid by Dell. Notwithstanding the foregoing, the Parties do not anticipate the need to disclose technical data that is subject to ITAR. Accordingly, each Party agrees that it will shall not provide any ITAR-controlled information to the other Party unless (1) the disclosing Party provides prior Notice to the receiving Party specifically identifying the type of ITAR-controlled information to be disclosed and the purpose for the disclosure, and (2) the receiving Party, upon receipt of the requisite Notice, gives its Notice to the disclosing Party of its consent to receive the ITAR-controlled information.
5 GPI/Dell Confidential LEGAL02/33539525v3

SECOND AMENDMENT EXECUTION COPY
11. SSAE 16 Reviews. Section 14.9 (SAS 70 Reviews) of the Agreement is deleted in its entirety, re-titled “SSAE 16 Reviews” and replaced with the following:
(b) Dell will cause its independent auditor to perform no fewer than one (1) Service Organization Controls 1 (“SOC1”) Type II Review (a “SOC1 Review”) under Statement on Standards for Attestation Engagements (SSAE”) No. 16 (or its successor standard) per calendar year for each Dell Service Location that is a data center from which the Designated Services are provided. Dell will provide GPI with SOC1 reports from the SOC1 Reviews (each, a “SOC1 Report”) within thirty (30) days of receipt of the SOC1 Reports from the independent auditor on approximately November 1 of each year. The audit period covered by the SOC1 Reports is January 1 to September 30 of each year.
(c) Prior to initiating the SOC1 Review in subsection (a), Dell will Notify GPI if the scope of the upcoming review differs, in any material respect, from the scope of the prior year’s SOC1 Review. GPI may request that Dell modify the scope of the SOC1 Review such that GPI can reasonably rely upon the SOC1 Review as evidence (assuming a favorable result from such review) that Dell’s internal controls are effective in order that GPI and the GPI Auditors can make their necessary or required attestations, certifications or other statements that GPI’s internal controls over its financial reporting are adequate in accordance with Section 404 of Sarbanes Oxley (“Section 404”). Dell will consider GPI’s request, and if practicable Dell will incorporate any such scope modifications; provided that it will not be deemed practical for Dell to implement such scope changes if doing so would cause Dell to incur additional costs or would have a negative impact on its other customers in the applicable data center. If Dell does not incorporate such modifications in accordance with the previous sentence, or if after GPI receives the SOC1 Report and determines that an additional audit is necessary for it to meet its control requirements, then Dell, at the request of GPI, will request its independent auditor performing the SOC1 Review in subsection (a) to coordinate with GPI and its auditors to perform a supplementary audit to Dell’s SOC1 Review that includes GPI’s requested modifications. Any incremental costs related to the supplemental audit will be borne by GPI.
(d) Dell will cause its subcontractors who control a data center from which Designated Services are being performed to perform SOC1 Reviews that Complement the SOC1 Reviews performed pursuant to this Agreement. If Dell is unable to cause its subcontractors to perform SOC1 Reviews, then Dell will perform audits of the internal controls of its subcontractors that perform the Designated Services to ensure that such internal controls Complement the internal controls of Dell. For purposes of this Section 14.9(c), “Complement” means that the internal controls of the subcontractors, when taken in combination with the internal controls of Dell represents the entire control environment applicable to the Service Location that is the subject of the SOC1 Review.
(e) During the period in which Dell’s independent auditor is conducting the SOC1 Review, Dell will provide GPI periodic updates on the status of the review, and
6 GPI/Dell Confidential LEGAL02/33539525v3

SECOND AMENDMENT EXECUTION COPY
specifically notify GPI of any significant weaknesses that are identified in the internal controls at the applicable Service Location(s).
(f) Upon completion of each SOC1 Review, Dell will provide GPI the SOC1 Report within the time frames set forth in subsection (a). If the Dell independent auditor conducting the SOC1 Report concludes that any control issue has not been met in the SOC1 Report (i.e., the SOC1 Report auditor opinion is qualified for failure to achieve a control objective relating to the Designated Services) (a “Control Deficiency”) and to the extent that such Control Deficiency relates to the Designated Services and Dell has reasonable control over such Control Deficiency, then Dell’s failure to promptly remedy the Control Deficiency will be deemed a material breach of this Agreement. Dell shall provide GPI with a written plan for remediating all Control Deficiencies promptly upon discovery, including the remediation activities to be taken by Dell and the target date for the completion of such remediation activities; and shall remediate all Control Deficiencies as promptly as is reasonably possible.
12. Representations, Warranties and Additional Covenants.
12.1. Organization and Qualification . Section 16.1(a) (Organization and Qualification) of the Agreement is deleted in its entirety and replaced with the following:
(a) Organization and Qualification. As of the Second Amendment Effective Date, Dell (i) is duly organized, validly existing and in good standing under the laws of Texas (ii) is duly qualified and in good standing as a foreign limited partnership in every jurisdiction in which the character of its business requires such qualification, and (iii) has the power to own its property and the authority to carry on its business as conducted as of the Effective Date.
12.2. Non-Solicitation . Section 16.1(j) (Non-Solicitation) and Section 16.2(f) (Non-Solicitation) of the Agreement each are deleted in their entirety and retitled “ Reserved. ” and a new Section 21.13 (Non-Solicitation), which reads as follows, is added to the Agreement:
21.13 Non-Solicitation. Except as set forth in Section 15.12(e), without the prior written Consent of Dell, GPI will not, directly or indirectly, solicit for employment, hire, or otherwise retain the services of any employee of Dell or Dell’s Affiliate who was involved in the performance of Dell’s obligations under this Agreement during the preceding 12 months. Without the prior written Consent of GPI, Dell will not, directly or indirectly, solicit for employment, hire, or otherwise retain the services of any employee of GPI or GPI’s Affiliates with whom Dell came into contact in connection with the activities under this Agreement during the preceding 12 months. This prohibition on soliciting and hiring shall extend for 90 days after the termination of the employee’s employment if such employee voluntarily resigns. Neither (i) the publication of classified advertisements in newspapers, periodicals, Internet bulletin boards, or other publications of general availability or circulation, or (ii) a solicitation that targets individuals with particular work experience or skills based on information available to subscribers, members or the general public on professional or social network websites
7 GPI/Dell Confidential LEGAL02/33539525v3

SECOND AMENDMENT EXECUTION COPY
or job boards, nor the consideration and hiring of persons responding to such advertisements or solicitation shall be deemed a breach of this Section, unless the advertisement, solicitation or other recruiting activity is undertaken as a means to circumvent or conceal a violation of this provision or by representatives of a Party acting with knowledge of this hiring prohibition.
13. Data Loss Event
13.1. Property Indemnification by Dell . Section 17.1(a) (Injury and Property Indemnification by Dell) is deleted in its entirety and replaced by the following:
Injury and Property Indemnification by Dell. Dell will indemnify, defend and hold the GPI Indemnitees harmless from and against all Losses for bodily injury (including death) and damage to real and tangible personal property (other than GPI Data or information) arising out of or resulting from tortious conduct of Dell or any employee, agent or subcontractor of Dell, including the negligent failure of such an employee, agent, or subcontractor to comply with any security requirements and other rules and regulations established by GPI applicable to all similarly situated employees of GPI.
13.2. Section 18.2(b) is deleted in its entirety and replaced by the following:
The Damages Limitation is not applicable to: (1) amounts due and payable under this Agreement for Designated Services, Milestone Credits, Service Level Credits, procurement pass-throughs and reimbursements, similar charges, and interest thereon; (2) Losses subject to an indemnification obligation under Sections 17.1(a) (Injury and Property Indemnification by Perot Systems), 17.1(b) (Intellectual Property Indemnification By Perot Systems), 17.1(d) (Data Loss) to the extent the Data Loss Event was caused by Perot Systems’ Gross Negligence or willful misconduct, 17.1(g) (Failure to Comply with Regulatory Requirements), 17.1(h) (Taxes), 17.1(i) (Obligations to Subcontractors), 17.2(a) (Injury and Property Indemnification by GPI), 17.2(b) (Intellectual Property Indemnification by GPI),17.2(d) (Failure to Comply with Regulatory Requirements), or 17.2(g) (Taxes); (3) damages resulting from, arising out of or relating to the willful misconduct of a Party; (4) damages resulting from the wrongful termination of this Agreement; (5) Section 19.3 (Property Damage); and (6) damages resulting from the wrongful refusal by Perot Systems to fulfill its Termination Assistance obligations.
13.3. Property Damage . Section 19.3 (Property Damage) of the Agreement is deleted in its entirety and replaced by the following:
Property Damage. Each Party shall be liable to the other Party, subject to Article XVIII, on direct claims by the other Party for damage to the other Party’s real and tangible personal property (other than GPI Data, data owned by Dell, or information) arising from the tortious conduct of the liable Party or its respective employees, agents or subcontractors; provided, that the liable Party’s liability shall be secondary to any insurance of the other Party.
8 GPI/Dell Confidential LEGAL02/33539525v3

SECOND AMENDMENT EXECUTION COPY
14. Notices. The Parties’ addresses and designees for notification purposes as specified in Section 21.8(a) of the Agreement are revised as follows. Notice to GPI either by fax or by electronic mail will no longer be effective as of January 1, 2013.
Notices delivered on or prior to December 31, 2012:
Graphic Packaging International, Inc. 814 Livingston Ct. Marietta, Georgia 30067 Attn: Joe Pekala E-mail Address: [email protected] Fax: (770) 644-2929
with a copy to:
Graphic Packaging International, Inc. 814 Livingston Ct. Marietta, Georgia 30067 Attn: Law Department Fax: (770) 644-2929
Effective on and after January 1, 2013:
Graphic Packaging International, Inc. 1500 River Edge Parkway Sandy Springs, Georgia 30328 Attn: Chief Information Officer with a copy to:
Graphic Packaging International, Inc. 1500 River Edge Parkway Sandy Springs, Georgia 30328 Attn: Law Department
Dell Marketing L.P. 2300 West Plano Parkway Plano, Texas 75075-8499 Attn: Kevin Jones, Vice President, Infrastructure and Cloud Computing E-mail Address: [email protected] Facsimile Number: (972) 577-6424
9 GPI/Dell Confidential LEGAL02/33539525v3
(ii) If to GPI:
(iii) If to Dell:

SECOND AMENDMENT EXECUTION COPY
with a copy to:
Dell Marketing L.P. 2300 West Plano Parkway Plano, Texas 75075-8499 Attn: Thomas D. Williams, Vice President – Legal E-mail Address: [email protected] Facsimile Number: (972) 577-6085
15. Equipment Refresh. Section 16 of the First Amendment to Master Services Agreement is deleted in its entirety and retitled “ Reserved. ” Section 8.3(a) and Section 8.3(a)(i) of the Agreement are deleted in their entirety and replaced with the following:
(b) Refreshes. Dell will implement the refresh of Equipment in accordance with the following requirements:
(ii) Dell will refresh GPI Equipment pursuant to Project IMACs, in accordance with the applicable Project Plan, or, at GPI’s option if all of the refresh-related effort requested by GPI is encompassed by the IMAC rates or One-Time Charges defined in Schedule 4.1, such IMACs or One-Time Charges. The Parties anticipate that such Project IMACs or IMACs will be requested by GPI and performed by Dell consistent with GPI’s refresh guidelines set forth in the Financial Responsibilities Matrix . At each Semi-Annual Technology Review Meeting, GPI will notify Dell of any deviation from such refresh policy, and which GPI Equipment will be impacted from any such deviation.
16. Taxes . The Parties agree to negotiate in good faith the terms of (i) local country agreements pursuant to Section 1.1(a) of the Agreement to allocate responsibility for any taxes that may arise in Canada and Mexico due to certain Service Recipients’ receipt of Designated Services in those countries, consistent with the allocation of responsibility for Taxes stated in Article VI (Taxes), and (ii) modifications to the Parties’ respective tax indemnities contained in Section 17.1(h) (Taxes) and 17.2(g) (Taxes) to reflect such agreed allocation of responsibility. No Party shall be indemnified under Section 17.1(h) (Taxes) or 17.2(g) (Taxes) by the other Party for taxes that such Party (or an Affiliate of such Party) has assumed responsibility for in a local country agreement. The Parties will attempt to reach agreement on such terms within the first ninety (90) days following the Second Amendment Effective Date and, when such terms are agreed, promptly execute such local country agreements and add such terms as outlined in (ii) above to the Agreement pursuant to an amendment.
17. Assignment and Assumption of Master Services Agreement. Perot Systems Corporation and Dell
Marketing L.P. are parties to that certain Assignment and Assumption Agreement dated as of the Second Amended Effective Date with respect to the Agreement. Subject to Section 21.5 (Binding Nature; Assignment) of the Agreement, the Parties accordingly agree that references in the Agreement to Perot Systems Corporation and Perot Systems, including as part of any defined term in the Agreement, shall be deemed references to Dell. By way of example, references in the Agreement to Perot Systems Excuse shall be deemed references to Dell Excuse, 10 GPI/Dell Confidential LEGAL02/33539525v3

SECOND AMENDMENT EXECUTION COPY
as such term is defined in amended Schedule A attached hereto. Notwithstanding the foregoing, all references to Perot Systems contained in Section 1.1(b) of the Agreement shall be deemed references to both Perot Systems and Dell.
18. Schedules and Attachments. The following Schedules and Attachments to the Agreement are amended
and restated, effective as of the Second Amendment Effective Date, (except Schedule 10.9 (Data Transfer Agreement), which is added to the Agreement effective as of the Second Amendment Effective Date) and, as so amended and restated, are attached to and a part of this Second Amendment.
Schedule A Definitions and Rules of Interpretation
Schedule 1.1(a) Service Recipients
Schedule 2.1.1 Service Towers
Schedule 2.2(a) Statement of Work
Schedule 2.5 Critical Milestones and Milestone Credits
Schedule 2.7 Project Guidelines and In-Flight Projects
Schedule 2.8(b) Managed Agreements
Schedule 2.10 Service Level Agreement
Schedule 2.13 Reports
Schedule 3.2 Account Governance
Schedule 3.4 Customer Satisfaction Surveys
Schedule 3.5(b) Contract Change Control Procedures
Schedule 4.1 Charges
Schedule 4.2 Invoices
Schedule 5.1(c) Benchmark Methodology
Schedule 8.2 Financial Responsibilities Matrix
Schedule 9.2(a)(i)(A) Key Personnel and Critical Personnel
Schedule 9.2(a)(i)(B) GPI Competitors
Schedule 9.3(b) Consented Subcontractors
Schedule 10.2 Service Locations 11 GPI/Dell Confidential LEGAL02/33539525v3
SECOND AMENDMENT EXECUTION COPY
Schedule 10.7(a) Physical Security Guidelines
Schedule 10.7(b) Logical Security Guidelines
Schedule 10.9 Data Transfer Agreement
Schedule 15.1 Termination Fees
Schedule 19.1 Insurance
Schedule 20.1 Dispute Resolution Procedure
IN WITNESS WHEREOF, the Parties have duly executed and delivered this Second Amendment as of the date(s) set forth below.
GRAPHIC PACKAGING INTERNATIONAL, INC.
By: /s/ David W. Scheible
Name: David W. Scheible
Title: President & CEO
Date: August 3, 2012
DELL MARKETING L.P. (as assignee of Perot Systems Corporation)
By: /s/ Eric Hutto
Name: Eric Hutto
Title: VP, General Manager, Dell Services
Date: August 3, 2012
12 GPI/Dell Confidential LEGAL02/33539525v3
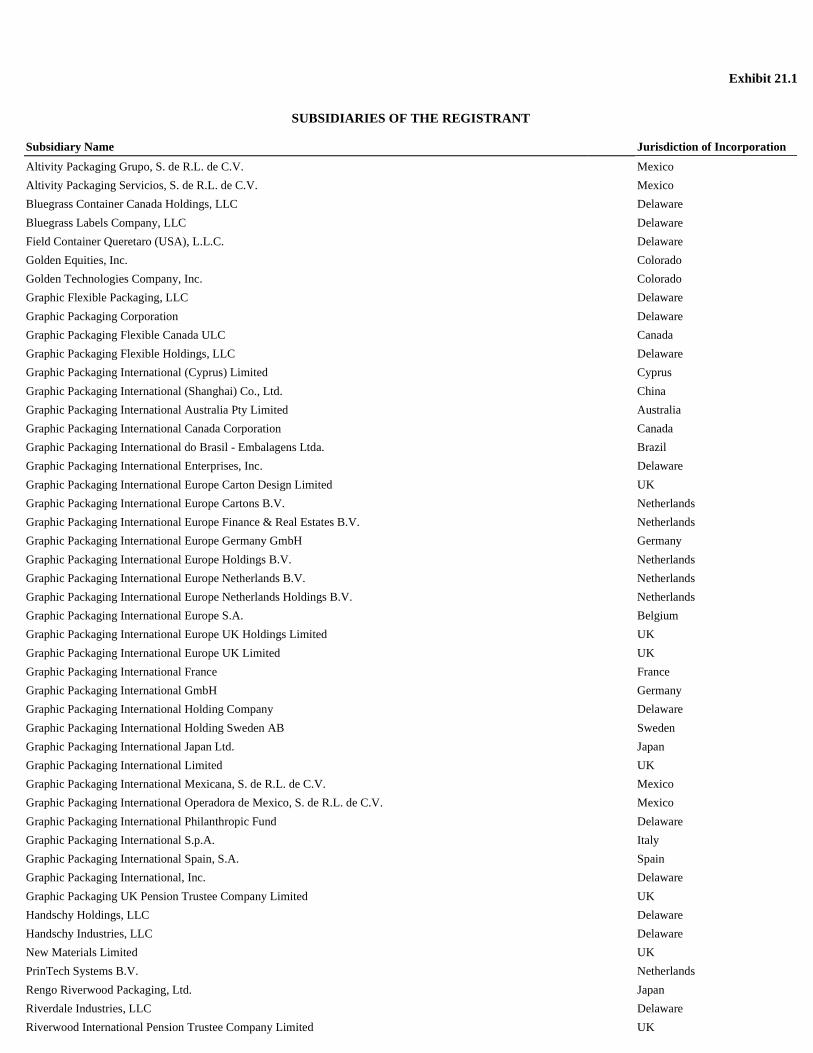
Exhibit 21.1
SUBSIDIARIES OF THE REGISTRANT
Subsidiary Name Jurisdiction of Incorporation
Altivity Packaging Grupo, S. de R.L. de C.V. Mexico
Altivity Packaging Servicios, S. de R.L. de C.V. Mexico
Bluegrass Container Canada Holdings, LLC Delaware
Bluegrass Labels Company, LLC Delaware
Field Container Queretaro (USA), L.L.C. Delaware
Golden Equities, Inc. Colorado
Golden Technologies Company, Inc. Colorado
Graphic Flexible Packaging, LLC Delaware
Graphic Packaging Corporation Delaware
Graphic Packaging Flexible Canada ULC Canada
Graphic Packaging Flexible Holdings, LLC Delaware
Graphic Packaging International (Cyprus) Limited Cyprus
Graphic Packaging International (Shanghai) Co., Ltd. China
Graphic Packaging International Australia Pty Limited Australia
Graphic Packaging International Canada Corporation Canada
Graphic Packaging International do Brasil - Embalagens Ltda. Brazil
Graphic Packaging International Enterprises, Inc. Delaware
Graphic Packaging International Europe Carton Design Limited UK
Graphic Packaging International Europe Cartons B.V. Netherlands
Graphic Packaging International Europe Finance & Real Estates B.V. Netherlands
Graphic Packaging International Europe Germany GmbH Germany
Graphic Packaging International Europe Holdings B.V. Netherlands
Graphic Packaging International Europe Netherlands B.V. Netherlands
Graphic Packaging International Europe Netherlands Holdings B.V. Netherlands
Graphic Packaging International Europe S.A. Belgium
Graphic Packaging International Europe UK Holdings Limited UK
Graphic Packaging International Europe UK Limited UK
Graphic Packaging International France France
Graphic Packaging International GmbH Germany
Graphic Packaging International Holding Company Delaware
Graphic Packaging International Holding Sweden AB Sweden
Graphic Packaging International Japan Ltd. Japan
Graphic Packaging International Limited UK
Graphic Packaging International Mexicana, S. de R.L. de C.V. Mexico
Graphic Packaging International Operadora de Mexico, S. de R.L. de C.V. Mexico
Graphic Packaging International Philanthropic Fund Delaware
Graphic Packaging International S.p.A. Italy
Graphic Packaging International Spain, S.A. Spain
Graphic Packaging International, Inc. Delaware
Graphic Packaging UK Pension Trustee Company Limited UK
Handschy Holdings, LLC Delaware
Handschy Industries, LLC Delaware
New Materials Limited UK
PrinTech Systems B.V. Netherlands
Rengo Riverwood Packaging, Ltd. Japan
Riverdale Industries, LLC Delaware
Riverwood International Pension Trustee Company Limited UK

Slevin South Company Arkansas

Exhibit 23.1
CONSENT OF INDEPENDENT REGISTERED PUBLIC ACCOUNTING FIRM
We consent to the incorporation by reference in the Registration Statements (Form S-3 No. 333-176606, No. 333-173512 and No. 333-166324) and the related Prospectuses of Graphic Packaging Holding Company and in the Registration Statements (Form S-8 No. 333-176598, No. 333-162912 and No. 333-149625) of Graphic Packaging Holding Company of our reports dated February 6, 2014, with respect to the consolidated financial statements of Graphic Packaging Holding Company, and the effectiveness of internal control over financial reporting of Graphic Packaging Holding Company, included in this Annual Report (Form 10-K) for the year ended December 31, 2013.
/s/ Ernst & Young LLP
Atlanta, Georgia February 6, 2014

Exhibit 31.1
CERTIFICATION
I, David W. Scheible certify that:
1. I have reviewed this Annual Report on Form 10-K of Graphic Packaging Holding Company;
2. Based on my knowledge, this report does not contain any untrue statement of a material fact or omit to state a material fact necessary to make the statements made, in light of the circumstances under which such statements were made, not misleading with respect to the period covered by this report;
3. Based on my knowledge, the financial statements, and other financial information included in this report, fairly present in all material respects the financial condition, results of operations and cash flows of the registrant as of, and for, the periods presented in this report;
4. The registrant’s other certifying officer and I are responsible for establishing and maintaining disclosure controls and procedures (as defined in Exchange Act Rules 13a-15(e) and 15d-15(e)) and internal control over financial reporting (as defined in Exchange Act Rules 13a-15(f) and 15d-15(f)) for the registrant and have:
5. The registrant’s other certifying officer and I have disclosed, based on our most recent evaluation of internal control over financial reporting, to the registrant’s auditors and the audit committee of the registrant’s board of directors (or persons performing the equivalent functions):
(a) Designed such disclosure controls and procedures, or caused such disclosure controls and procedures to be designed under our supervision, to ensure that material information relating to the registrant, including its consolidated subsidiaries, is made known to us by others within those entities, particularly during the period in which this report is being prepared;
(b) Designed such internal control over financial reporting, or caused such internal control over financial reporting to be designed under our supervision, to provide reasonable assurance regarding the reliability of financial reporting and the preparation of financial statements for external purposes in accordance with generally accepted accounting principles;
(c) Evaluated the effectiveness of the registrant’s disclosure controls and procedures and presented in this report our conclusions about the effectiveness of the disclosure controls and procedures, as of the end of the period covered by this report based on such evaluation; and
(d) Disclosed in this report any change in the registrant’s internal control over financial reporting that occurred during the registrant’s most recent fiscal quarter (the registrant’s fourth fiscal quarter in the case of an annual report) that has materially affected, or is reasonably likely to materially affect, the registrant’s internal control over financial reporting; and
(a) All significant deficiencies and material weaknesses in the design or operation of internal control over financial reporting which are reasonably likely to adversely affect the registrant’s ability to record, process, summarize and report financial information; and
(b) Any fraud, whether or not material, that involves management or other employees who have a significant role in the registrant’s internal control over financial reporting.
/s/ David W. Scheible
David W. Scheible,
Chairman, President and Chief Executive Officer
(Principal Executive Officer)
February 6, 2014

Exhibit 31.2
CERTIFICATION
I, Daniel J. Blount certify that:
1. I have reviewed this Annual Report on Form 10-K of Graphic Packaging Holding Company;
2. Based on my knowledge, this report does not contain any untrue statement of a material fact or omit to state a material fact necessary to make the statements made, in light of the circumstances under which such statements were made, not misleading with respect to the period covered by this report;
3. Based on my knowledge, the financial statements, and other financial information included in this report, fairly present in all material respects the financial condition, results of operations and cash flows of the registrant as of, and for, the periods presented in this report;
4. The registrant’s other certifying officer and I are responsible for establishing and maintaining disclosure controls and procedures (as defined in Exchange Act Rules 13a-15(e) and 15d-15(e)) and internal control over financial reporting (as defined in Exchange Act Rules 13a-15(f) and 15d-15(f)) for the registrant and have:
5. The registrant’s other certifying officer and I have disclosed, based on our most recent evaluation of internal control over financial reporting, to the registrant’s auditors and the audit committee of the registrant’s board of directors (or persons performing the equivalent functions):
(a) Designed such disclosure controls and procedures, or caused such disclosure controls and procedures to be designed under our supervision, to ensure that material information relating to the registrant, including its consolidated subsidiaries, is made known to us by others within those entities, particularly during the period in which this report is being prepared;
(b) Designed such internal control over financial reporting, or caused such internal control over financial reporting to be designed under our supervision, to provide reasonable assurance regarding the reliability of financial reporting and the preparation of financial statements for external purposes in accordance with generally accepted accounting principles;
(c) Evaluated the effectiveness of the registrant’s disclosure controls and procedures and presented in this report our conclusions about the effectiveness of the disclosure controls and procedures, as of the end of the period covered by this report based on such evaluation; and
(d) Disclosed in this report any change in the registrant’s internal control over financial reporting that occurred during the registrant’s most recent fiscal quarter (the registrant’s fourth fiscal quarter in the case of an annual report) that has materially affected, or is reasonably likely to materially affect, the registrant’s internal control over financial reporting; and
(a) All significant deficiencies and material weaknesses in the design or operation of internal control over financial reporting which are reasonably likely to adversely affect the registrant’s ability to record, process, summarize and report financial information; and
(b) Any fraud, whether or not material, that involves management or other employees who have a significant role in the registrant’s internal control over financial reporting.
/s/ Daniel J. Blount
Daniel J. Blount
Senior Vice President and Chief Financial Officer
(Principal Financial Officer)
February 6, 2014

Exhibit 32.1
CERTIFICATION
Pursuant to 18 United States Code Section 1350,
As adopted pursuant to Section 906 of the
Sarbanes-Oxley Act of 2002
The undersigned hereby certifies that, to my knowledge, the Annual Report on Form 10-K for the period ended December 31, 2013 of Graphic Packaging Holding Company (the “Company”) filed with the Securities and Exchange Commission on the date hereof fully complies with the requirements of section 13(a) or 15(d) of the Securities Exchange Act of 1934 and that the information contained in such report fairly presents, in all material respects, the financial condition and results of operations of the Company.
/s/ David W. Scheible
Name: David W. Scheible,
Title: Chairman, President and Chief Executive Officer
February 6, 2014

Exhibit 32.2
CERTIFICATION
Pursuant to 18 United States Code Section 1350,
As adopted pursuant to Section 906 of the
Sarbanes-Oxley Act of 2002
The undersigned hereby certifies that, to my knowledge, the Annual Report on Form 10-K for the period ended December 31, 2013 of Graphic Packaging Holding Company (the “Company”) filed with the Securities and Exchange Commission on the date hereof fully complies with the requirements of section 13(a) or 15(d) of the Securities Exchange Act of 1934 and that the information contained in such report fairly presents, in all material respects, the financial condition and results of operations of the Company.
/s/ Daniel J. Blount
Name: Daniel J. Blount
Title: Senior Vice President and Chief Financial Officer
February 6, 2014