graphing activity describing the motion of an object is occasionally hard to do with words....
TRANSCRIPT

Graphing Activity
Describing the motion of an object is occasionally hard to do with words. Sometimes graphs help make motion easier to picture, and therefore
understand.

REMEMBER!
• Motion is a change in position measured by distance and time.
• Speed tells us the rate at which an object moves.
• Velocity tells the speed and direction of a moving object.
• Acceleration tells us the rate speed or direction changes.

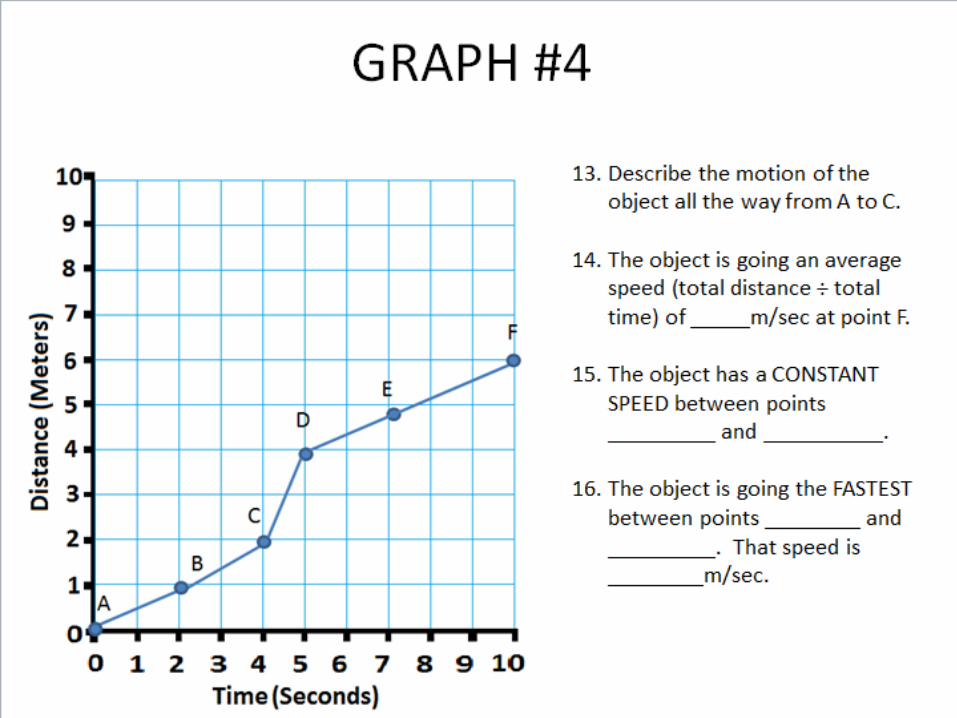
DISTANCE-TIME GRAPHS
Time is always plotted on the X-axis(bottom of the graph). The further tothe right on the axis, the longer thetime from the start.
Distance is plotted on the Y-axis (sideof the graph). The higher up thegraph, the further from the start.

At Rest.
Time is increasing to the right, but its distance does not change. It is not moving. We say it is At Rest.

Constant SpeedTime is increasing to the right, and distance is increasing constantly with time. The object moves at a constant speed.
Constant speed is shown by straightlines on a graph.

Steeper Line = Higher SpeedA steeper line indicates a larger distancemoved in a given time. In other words,higher speed.

Upward curve = increase in speed
In a given time, the distance the object moves is changing (getting larger). It is accelerating.

Speed vs. Average Speed
Speed = Distance ÷ Time• Between points C and D the speed is
4 meters ÷ 3 seconds=1.33 m/sec
AB
C
D
Average speed = Total distance ÷ Total time• At point D the average speed was
7 meters ÷ 10 seconds = 0.7 m/sec


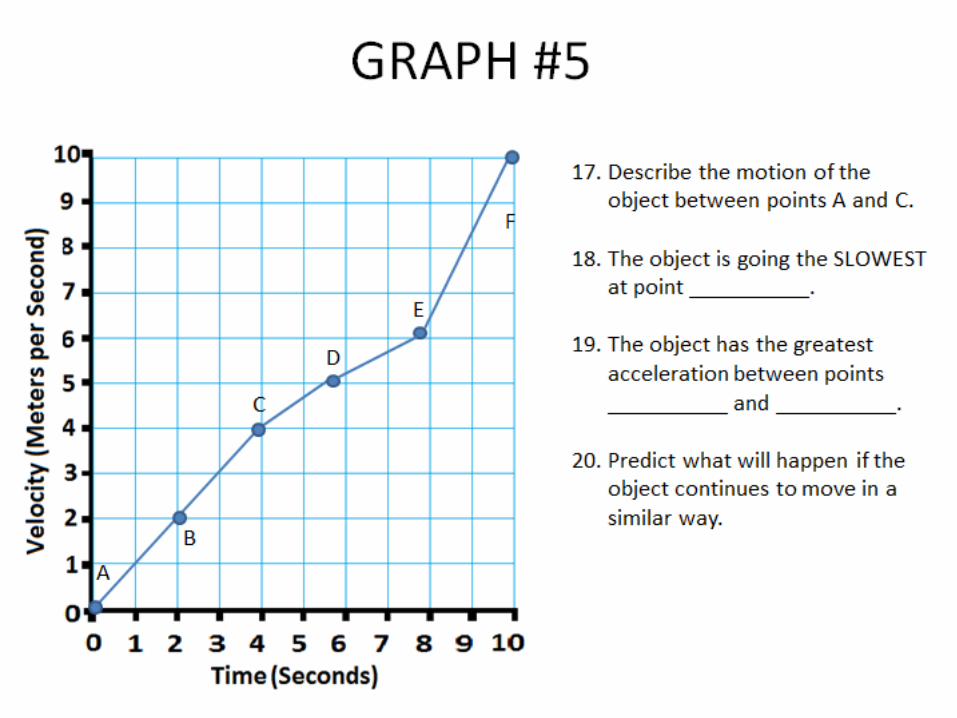
SPEED-TIME GRAPHS
• Speed-Time graphs look much like Distance- Time graphs.
• Be sure to read the labels!! Time is plotted on the X-axis. Speed or velocity is plotted on the Y-axis.

Constant Speed• A straight horizontal line on a
speed-time graph means that speed is constant. It is not changing over time.
• A straight line does not mean that the object is at rest!

Constant acceleration• This graph shows increasing speed.• The moving object is accelerating
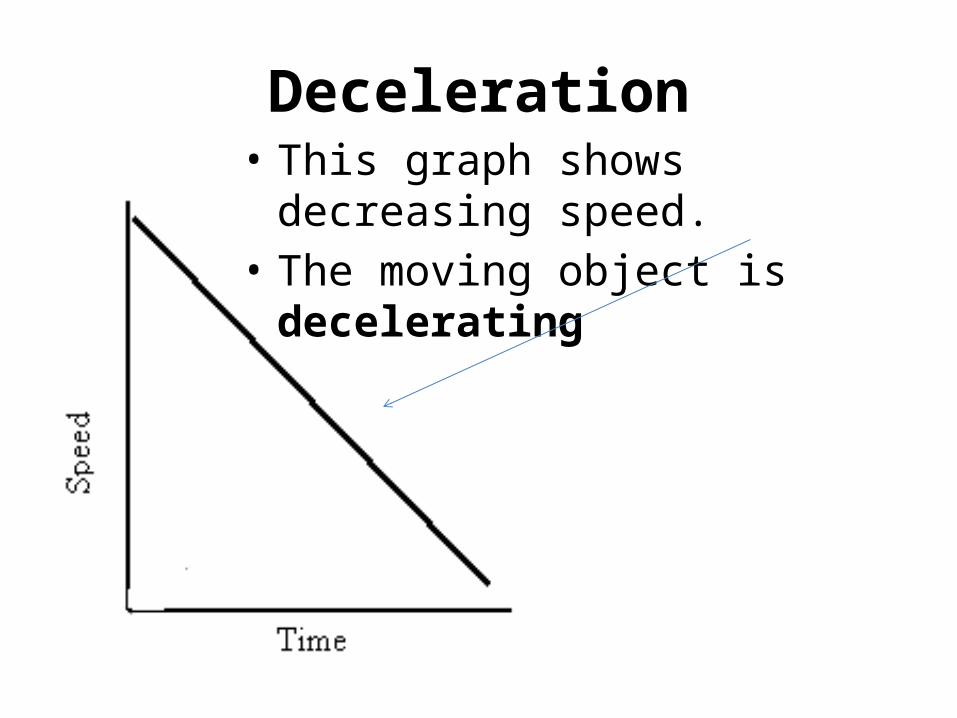
Deceleration• This graph shows decreasing speed.• The moving object is decelerating