graphing consumption & determinants of consumption consumption part 2
TRANSCRIPT

Graphing Consumption & Graphing Consumption & Determinants of ConsumptionDeterminants of Consumption
Consumption Part 2

45
$1000
$1000
$6000
?$6000

Graphing the Consumption Function
If Consumption rose at the same rate as Disposable Income . . . A graph of this function would be a 45 line
Disposable income ($)
45û
1,000
1,000
2,000
3,000
2,000 3,000
Copyright 2002 by The McGraw-Hill Companies, Inc. All rights reserved.
Exp
end
itu
re (
$)
Disposable Income ($)

C
$6000
5700
$6000
Saving = $300
$2700
$3000
Dissaving = $300
$2700
Saving = - $300

C
Dissaving
Saving

Graphing the Consumption Function
Consumption is the vertical distance between the bottom (horizontal) axis and the “C” line.
DI C S
3000 1750
5-32Copyright 2002 by The McGraw-Hill Companies, Inc. All rights reserved.
Disposable income ($)
45û
C
1,000 2,000 3,0001,000
1,000
2,000
3,000
Exp
end
itu
re (
$)
Disposable Income ($)

Graphing the Consumption Function
DI C S
3000 1750 1250
5-33
Disposable income ($)
45û
C
1,000 2,000 3,0001,000
1,000
2,000
3,000
Saving is the vertical distance between the “C” line and the 45 degree line
Exp
end
itu
re (
$)
Disposable Income ($)

Graphing the Consumption Function
DI C S
3000 1750 1250 2000 1440
5-34
Disposable income ($)
45û
C
1,000 2,000 3,0001,000
1,000
2,000
3,000
Consumption is the vertical distance between the bottom (horizontal) axis and the “C” line.

Graphing the Consumption Function
DI C S
3000 1750 1250 2000 1440 560
Disposable income ($)
45û
C
1,000 2,000 3,0001,000
1,000
2,000
3,000
Saving is the vertical distance between the “C” line and the 45 degree line
Exp
end
itu
re (
$)

Graphing the Consumption Function
DI C S
3000 1750 1250 2000 1440 560 1000 1000
Disposable income ($)
45û
C
1,000 2,000 3,0001,000
1,000
2,000
3,000
Consumption is the vertical distance between the bottom (horizontal) axis and the “C” line.

Graphing the Consumption Function
DI C S
3000 1750 1250 2000 1440 560 1000 1000 0
5-37
Disposable income ($)
45û
C
1,000 2,000 3,0001,000
1,000
2,000
3,000
Saving is “0” at 1000 DI because there is NO distance between the C line and the 45 degree line.

Graphing the Consumption Function
DI C S
3000 1750 1250 2000 1440 560 1000 1000 0 0 625
5-38
Disposable income ($)
45û
C
1,000 2,000 3,0001,000
1,000
2,000
3,000
Consumption is the vertical distance between the bottom (horizontal) axis and the “C” line.

Graphing the Consumption Function
DI C S
3000 1750 1250 2000 1440 560 1000 1000 0 0 625
5-39
Disposable income ($)
45û
C
1,000 2,000 3,0001,000
1,000
2,000
3,000
When DI is “0” the level of Consumption is called Autonomous Consumption (AC)

Graphing the Consumption Function
DI C S
3000 1750 1250 2000 1440 560 1000 1000 0 0 625 -625
Disposable income ($)
45û
C
1,000 2,000 3,0001,000
1,000
2,000
3,000
Saving is the vertical distance between the “C” line and the 45 degree line. Saving is negative to the left of where the C line crosses the 45 degree line

Autonomous vs. Induced
• Autonomous means Self Governing

Autonomous Consumption versus Induced Consumption
• Autonomous consumption (AC) is the level of consumption when disposable income is “0”–It is called autonomous
because it is independent of change in disposable income
5-41

Induced Consumption• Induce consumption (IC) is that
part of consumption which varies with the level of disposable income
–As disposable income rises, induced income rises
–As disposable income fall, induced income falls

C = Autonomous C + Induced C
So
Induced C = C – Autonomous C

C
$0
This is your This is your Autonomous Autonomous ConsumptionConsumption

Graphing the Consumption Function
DI C S
3000 1750 1250 2000 1440 560 1000 1000 0 0 625 -625
5-42
Disposable income ($)
45û
C
1,000 2,000 3,0001,000
1,000
2,000
3,000
DI = 0
What is IC?
IC = C - AC
IC = 625 - 625
IC = 0

Graphing the Consumption Function
DI C S
3000 1750 1250 2000 1440 560 1000 1000 0 0 625 -625
5-43
Disposable income ($)
45û
C
1,000 2,000 3,0001,000
1,000
2,000
3,000
DI = 1000
What is IC?
IC = C - AC
IC = 1000 - 625
IC = 375

Graphing the Consumption Function
DI C S
3000 1750 1250 2000 1440 560 1000 1000 0 0 625 -625
5-44
Disposable income ($)
45û
C
1,000 2,000 3,0001,000
1,000
2,000
3,000
DI = 2000
What is IC?
IC = C - AC
IC = 1440 - 625
IC = 815

Graphing the Consumption Function
DI C S
3000 1750 1250 2000 1440 560 1000 1000 0 0 625 -625
5-45
Disposable income ($)
45û
C
1,000 2,000 3,0001,000
1,000
2,000
3,000
DI = 3000
What is IC?
IC = C - AC
IC = 1750 - 625
IC = 1125
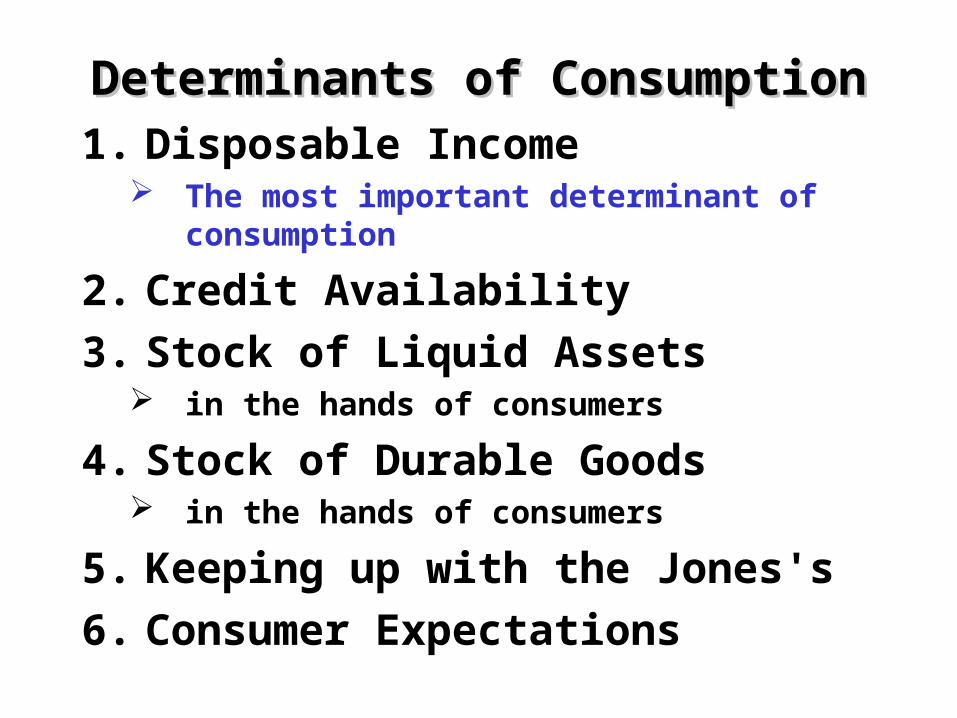
Determinants of ConsumptionDeterminants of Consumption1. Disposable Income
The most important determinant of consumption
2. Credit Availability
3. Stock of Liquid Assets in the hands of consumers
4. Stock of Durable Goods in the hands of consumers
5. Keeping up with the Jones's
6. Consumer Expectations

Permanent Income Hypothesis
(Milton Friedman)• People gear their consumption to
their expected lifetime average earnings more than to their current income– Apparently there are quite a few deviations
from the behavior predicted by the permanent income hypothesis

The Determinants of Saving
• There is no single reason why people save
• Some spend virtually all of their disposable income
• Some spend more than they earn• Americans now save less than 5% of
disposable income• Americans used to save 7-10% of
disposable income

Copyright 2002 by The McGraw-Hill Companies, Inc. All rights reserved.
Why Do We Spend So Much and Save So Little?
• Americans have been on a spending binge the past 20 years–Mottos
• Buy now, pay later.• Shop till you drop.• We want it all, and we want it all
now!