graphing inequalities
TRANSCRIPT
Graphing inequalities THAT INVOLVE VERTICAL & HORIZONTAL LINES
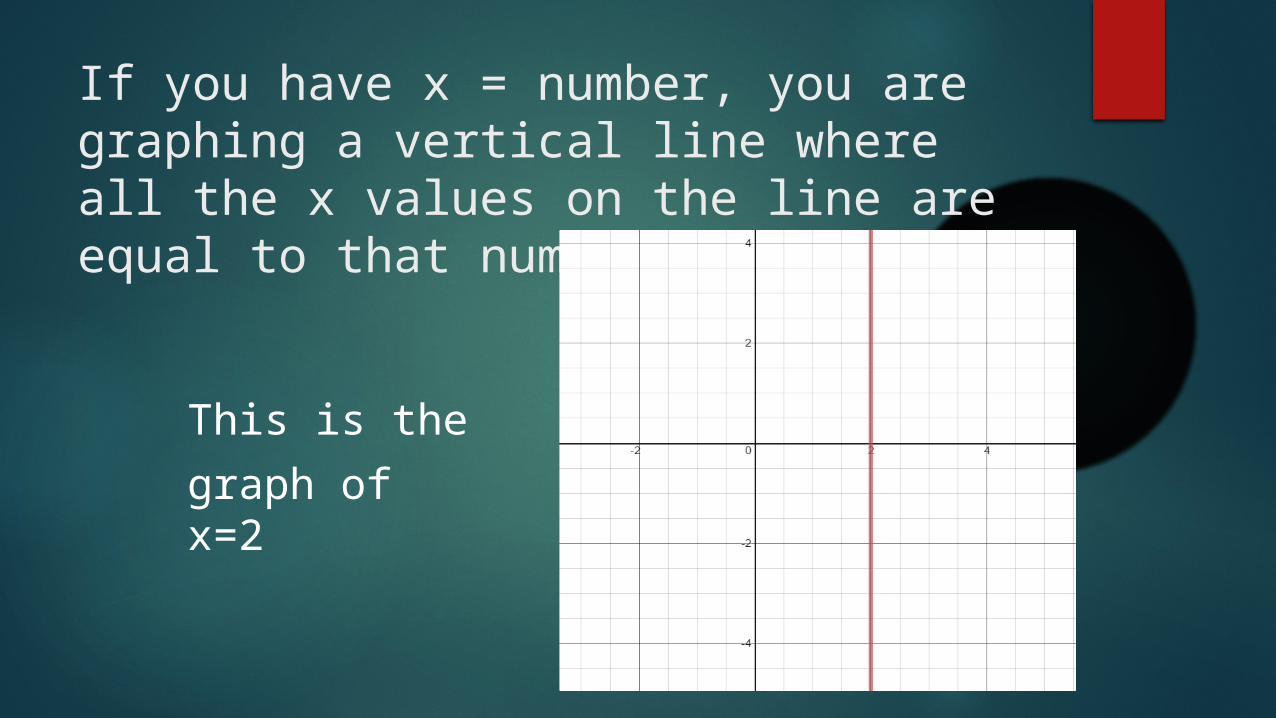
If you have x = number, you are graphing a vertical line where all the x values on the line are equal to that number.
This is the
graph of x=2
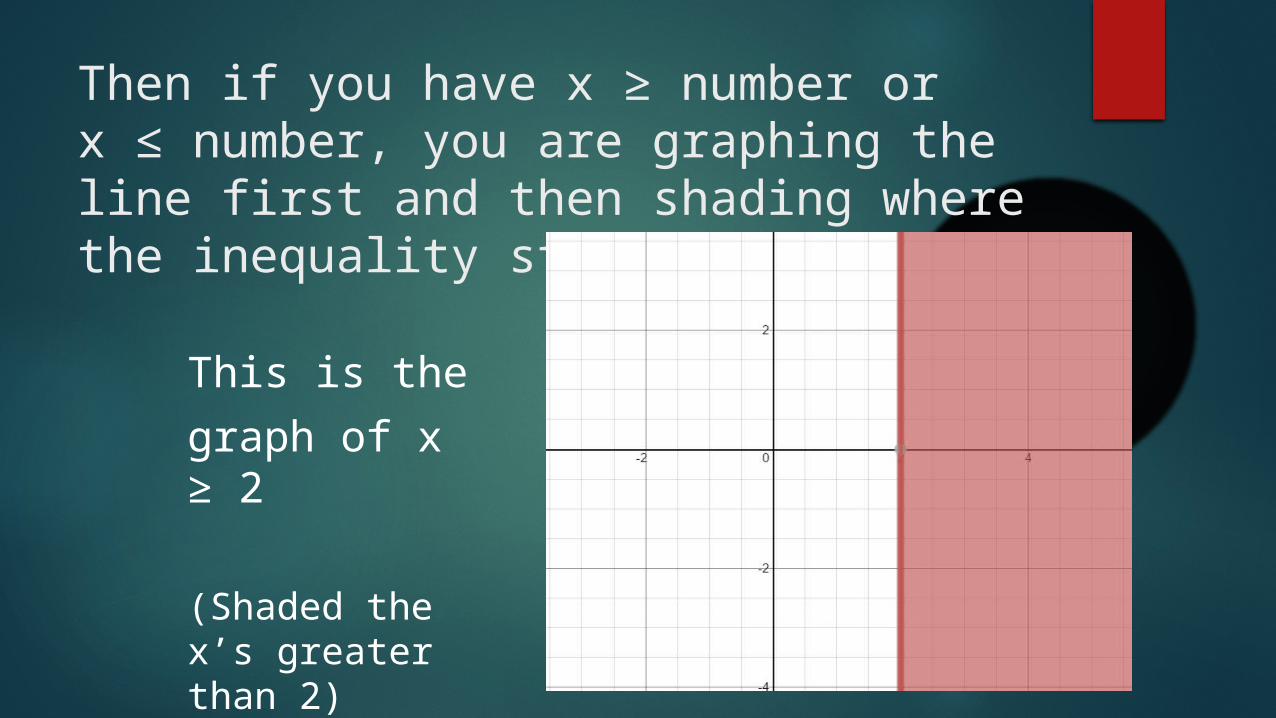
Then if you have x ≥ number or x ≤ number, you are graphing the line first and then shading where the inequality states.
This is the
graph of x ≥ 2
(Shaded the x’s greater than 2)
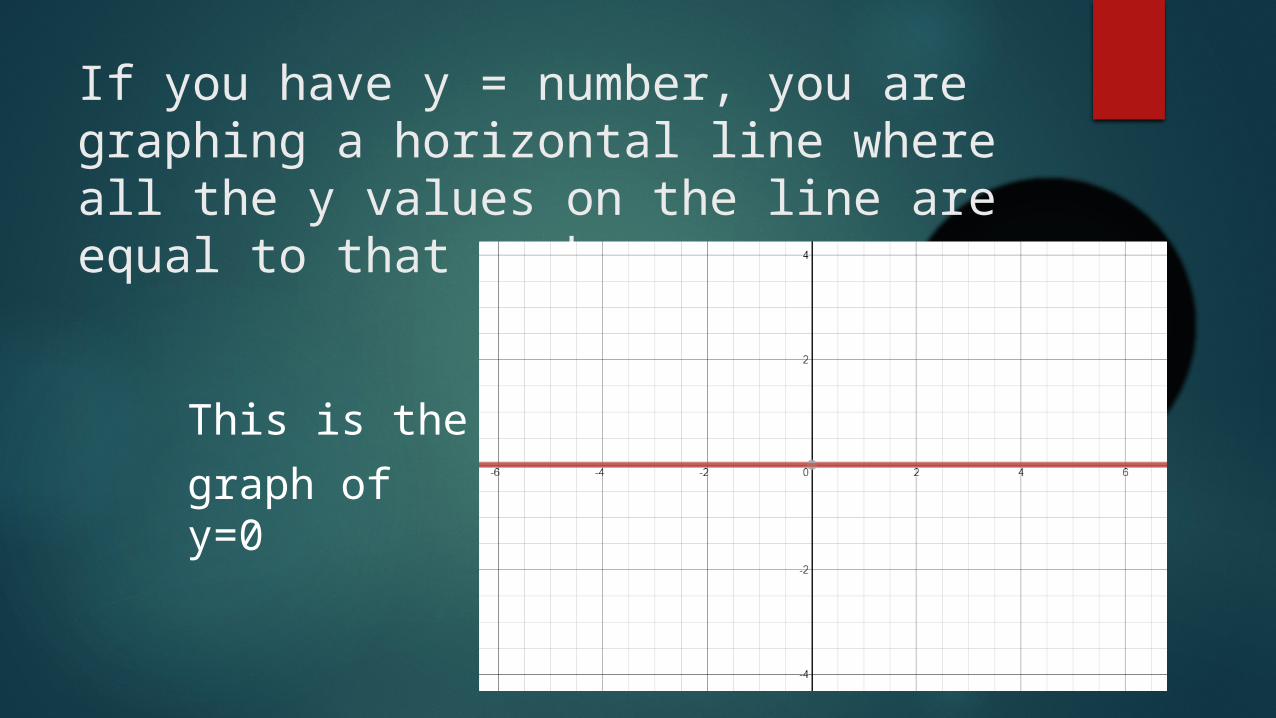
If you have y = number, you are graphing a horizontal line where all the y values on the line are equal to that number.
This is the
graph of y=0
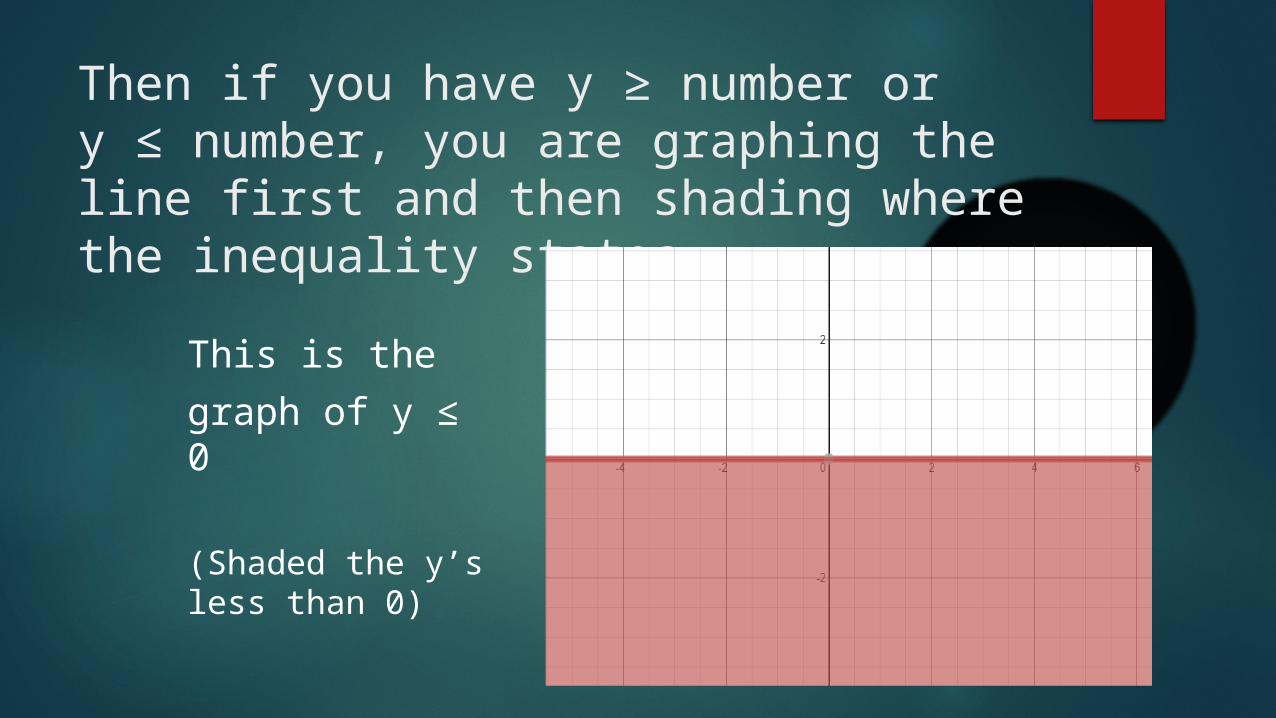
Then if you have y ≥ number or y ≤ number, you are graphing the line first and then shading where the inequality states.
This is the
graph of y ≤ 0
(Shaded the y’s less than 0)
Remember ≤ and ≥ mean you use a solid line when graphing.
But > and < mean you use a dotted line when graphing.
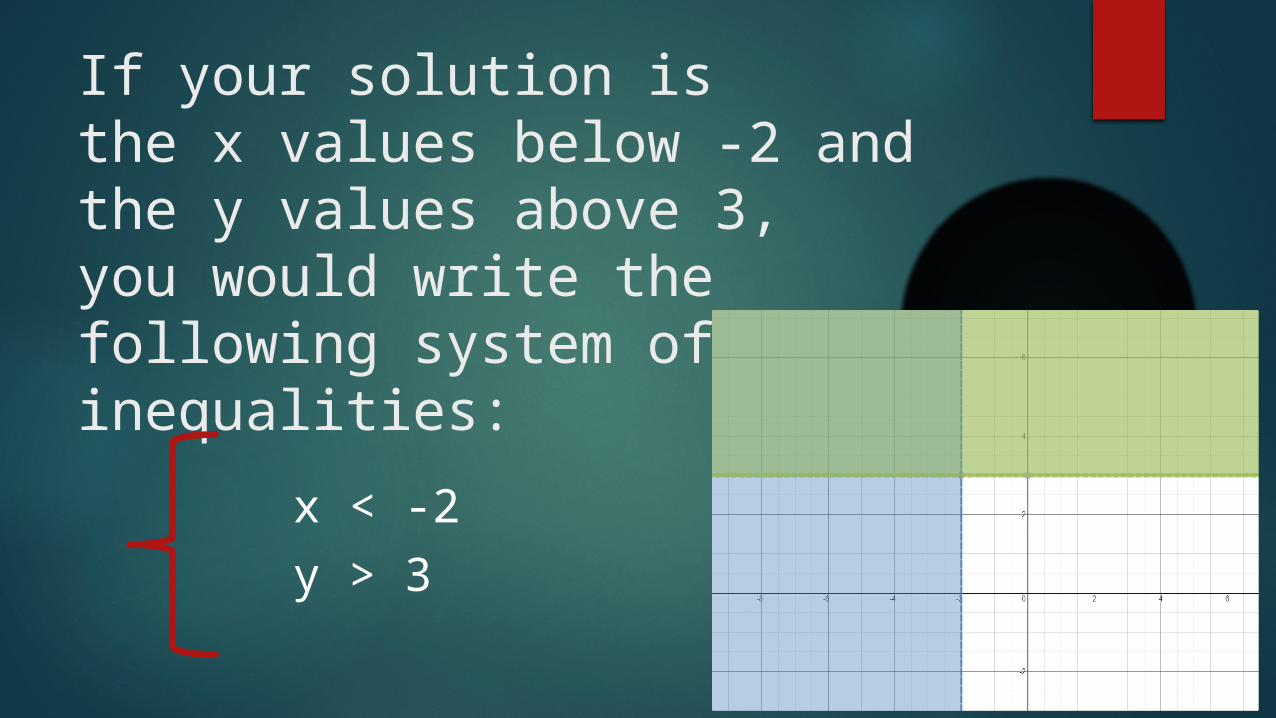
If your solution is the x values below -2 and the y values above 3, you would write the following system of inequalities:
x < -2 graphed:
y > 3