graphite–cement paste: a new coating of reinforced concrete
TRANSCRIPT
coatings
Article
Graphite–Cement Paste: A New Coating ofReinforced Concrete Structural Elements for theApplication of ElectrochemicalAnti-Corrosion TreatmentsMiguel-Ángel Climent *, Jesús Carmona † and Pedro Garcés †
Civil Engineering Department, University of Alicante, P.O. Box 99, 03080 Alicante, Spain; [email protected] (J.C.);[email protected] (P.G.)* Correspondence: [email protected]; Tel.: +34-96-590-3707† These authors contributed equally to this work.
Academic Editor: Paul LambertReceived: 31 May 2016; Accepted: 15 July 2016; Published: 28 July 2016
Abstract: This paper reviews research carried out towards the development of a novel conductivecoating for reinforced concrete structures in order to enable the application of electrochemicalanti-corrosion treatments. The coating is composed of a hardened paste containing graphitepowder and cement. The applied techniques were electrochemical chloride extraction (ECE),cathodic protection (CP), and cathodic prevention, as well as combined treatments such as ECE-CP.This research has demonstrated their efficiency when using the new conductive coating as ananode system. The influence of the shape of the structural elements on the performance of theelectrochemical treatments was also studied. Several characteristics of the coating have beendetermined, such as conductivity, durability, adhesion to the concrete surfaces, and ease of application.The results demonstrate the adequacy of using this coating as the anode for anti-corrosion treatmentson reinforced concrete structural elements of different shapes, for the purpose of extending service life.
Keywords: reinforced concrete; graphite-cement paste; electrochemical chloride extraction;cathodic protection; cathodic prevention
1. Introduction
The Multifunctional Materials and Durability research teams of the Polytechnic School ofthe University of Alicante have been working together to develop a research line dedicated tounderstanding the behavior of graphite–cement pastes as a coating for reinforced concrete structures.This development starts from the certainty that the main enemy of reinforced concrete is steel rebarcorrosion, and that the triggers of this corrosion are principally carbonation and chloride ion (Cl´)penetration into the concrete mass.
It is true that, with today’s technology and the current knowledge about corrosion processes,it is possible to manufacture reinforced concrete resistant to corrosion. However, permanent orcircumstantial aggressive environments will continue to exist, and this will always be the casefor structures whose construction quality controls are not very demanding. It is common to findconstruction works of high economic and strategic value, and it is necessary to extend their service lifeas long as possible. To achieve this goal, it is desirable to develop new methods allowing an effectivepreservation of these infrastructures from the reinforcement corrosion processes. Electrochemicaltreatments combined with other techniques, depending on the damage degree of the structures, haveproven to be the most efficient in practice. Electrochemical chloride extraction (ECE) and cathodicprotection (CP) are the most commonly used rehabilitation techniques [1–8]. All these techniques are
Coatings 2016, 6, 32; doi:10.3390/coatings6030032 www.mdpi.com/journal/coatings
Coatings 2016, 6, 32 2 of 21
based on the application of a direct electric current in order to cause an ionic transport through theconcrete mass, from the rebar to the outer surface [1–3], or to create the electrochemical conditionsmaking impossible the corrosion of steel [9,10]. The electric field is applied by connecting the steelbars, acting as a cathode, to the negative pole of the power source, and an anode, typically located atthe outer surface, is connected to the positive pole. Some previous studies have proposed the use ofconductive cement-based overlays as the anode, especially for CP treatments [11–14]. These conductivelayers put on the surface of the structural element must fulfill a number of features, among whichthe following would seem to be particularly noteworthy: good adherence with concrete, conductivity,durability, adaptability to various surfaces of the structures to be treated, ease of application, andlow cost. Undoubtedly, it is one of the most complicated elements of the system. Hence, the anodesystem has been and still remains today one of the most recurrent subjects of research regarding theseelectrochemical treatments.
The research leading this work is aimed at designing an anodic system that successfully meets theabovementioned requirements. For this purpose, the development of multifunctional materials such asthe conductive cement-based ones was pursued [15–20]. The final goal consists of a paste composed ofgraphite powder and cement (GCP) applied as a coating on the structural element to be treated. In theearly stages of this research the influence of the thickness of the GCP overlay on the ECE efficiencywas studied, establishing a minimum thickness about 2 mm as the most suitable for these uses [21].Then, the GCP anodes were tested on vertical reinforced concrete elements with a dimension accordingto real structures, in order to improve the methods of application, wetting, and electric managementfor ECE treatments [22]. Another part of the research was dedicated to determining how the shapeand the rebar arrangement of treated elements influence the ECE efficiency [23,24]. GCP can be usedin cathodic protection treatments for highly chloride contaminated concrete elements, and in cathodicprevention (CPrev) applied to other initially chloride free but subjected to salt environments [25,26].Another study was carried out to assess the possibility of using the GCP anodes for the successiveapplication of ECE and CP to elements with high chloride content [27].
One of the most significant results of this extensive research is the suitability of a GCP coating onstructural elements of reinforced concrete, for the application of electrochemical protective treatments.In the case of newly constructed structures, the coating may serve as the anode of a CPrev systemin order to preserve the steel rebar free of corrosion, despite being the reinforced concrete elementexposed to an aggressive Cl´ environment. Given the durability of GCP coatings, the treatments canbe applied permanently or intermittently. In old structures already contaminated with Cl´ ions, a GCPcoating allows for the application of ECE or CP, depending on the degree of contamination. With thiscoating even the successive application of ECE and CP is possible [27]. This combined treatmentis warranted when the structure is highly contaminated and it is expected that the environmentwill remain aggressive (marine environment), or when its operation entails actions involving risk ofcontamination (use of de-icing salt in wintertime on road structures such as bridges or parking lots).
Regarding the technological characteristics of the GCP anodic overlays, they provide enoughconductivity to make efficient the electrochemical treatments, an excellent adherence with the concretebecause of their cementitious nature, and an easy application by spraying or by hand. They have anadequate capacity of moisture retention of the electrolyte, enough durability for the application ofsuccessive treatments, and a much lower cost than those of other generally employed anode systems,such as the activated titanium mesh anode.
2. Materials and Methods
The body of research is composed of the following studies:
‚ Case Study 1: Competency of a GCP anode system versus a reference anode system (mesh ofTi-RuO2), in applying ECE on pillar-size structural reinforced concrete elements.
‚ Case Study 2: Differences in the shape effect of the structural element during ECE applicationbetween both abovementioned types of anode systems.

Coatings 2016, 6, 32 3 of 21
‚ Case Study 3: Ability of GCP anode system to apply CP, CPrev, and combined ECE-CP treatments.
2.1. Materials and Methods Used in Case Studies 1 and 2
2.1.1. Reinforced Concrete Laboratory Specimens
For Case Studies 1 and 2, reinforced concrete laboratory specimens were molded as structuralsupports 1 m long; three of them had a cylindrical shape with 200 mm diameter, and another threewere 200 ˆ 300 mm2 prisms. The cylindrical ones were reinforced with six longitudinal rebars of 8 mmdiameter, hexagonally arranged, including three stirrups of 6 mm diameter, uniformly distributed.Regarding the prism shapes, the reinforcement was composed of four rebars of 16 mm diameterlocated in the corners and four stirrups of 8 mm diameter. In all cases, concrete cover was 40 mm thick.Concrete had a composition as shown in Table 1. The water/cement ratio (w/c) was 0.6, higher thanusual in construction [28]. The reason is to obtain a porous concrete, in order to make easier the ionictransport across the concrete mass, evidencing in a clearer way the ECE efficiency difference betweenboth types of anode systems. In order to simulate a serious Cl´ contamination, 3.3% NaCl was addedto the mixing water. Thus, the concrete contained 2% of Cl´ relative to cement mass.
The hardened concrete reached a compressive strength of 17.8 N/mm2 [29], a porosity of17.0% [30], and a bulk density of 2.16 T/m3 [31].
Table 1. Dosage of the concrete for laboratory specimens.
Material Dosage
Portland cement 350 kg/m3
w/c Ratio 0.6Distilled water 210 kg/m3
Limestone aggregate 4/6 466 kg/m3
Limestone aggregate 6/12 679 kg/m3
Limestone sand 630 kg/m3
NaCl 3.3% (2% Cl´ relative to cement mass)
2.1.2. Experimental Details of the ECE Tests
Two types of anodes were tested in this study. The reference anodic system consisted of amesh of braided Ti-RuO2 wire, 1 mm thick. This wire is braided in diamond shapes 33 mm per12 mm. of diagonal length. The mesh was firmly attached, covering the whole vertical surface ofthe specimens, between two layers of absorbent synthetic fabric to keep moisture in. The electricalresistance of this mesh per unit length (1 m length ˆ 1.2 m width) is 0.041 Ω/m. The mesh is connectedto the positive pole of the electric source by a copper wire. On the other hand, the conductivegraphite–cement paste (GCP) anode is the product of the hardening of a homogeneous mixture ofgraphite powder, Portland cement, and distilled water, as detailed in Table 2. The fresh paste is appliedby spraying with a compressed air gun on the vertical specimen surfaces, forming a 2-mm thick overlay.The high water-to-solid ratio (w/s = 0.8) is necessary for meeting the fluidity requirements of thespraying application system. The dosage and thickness of the GCP anodic overlay were adopted as aconsequence of the good performances shown by this anode system in recent research by the sameauthors [21,22].
Table 2. Dosage of the graphite–cement paste.
Material Dosage (for 5 kg of Paste)
Portland cement 1.39 kgGraphite powder 1.39 kg
Distilled water 2.22 kg
Coatings 2016, 6, 32 4 of 21
The problem of keeping the anodic systems moist (both the Ti-RuO2 mesh embedded into layersof absorbent fabric, and the GCP overlay) during the ECE treatments was overcome by using a systemthat consisted of a water pump and several pipes with droppers, assembled around the surface of eachspecimen. The circulated electrolyte was tap water. This periodic drip irrigation system ensures theright action of the electrolyte during the electrochemical procedure [8,22].
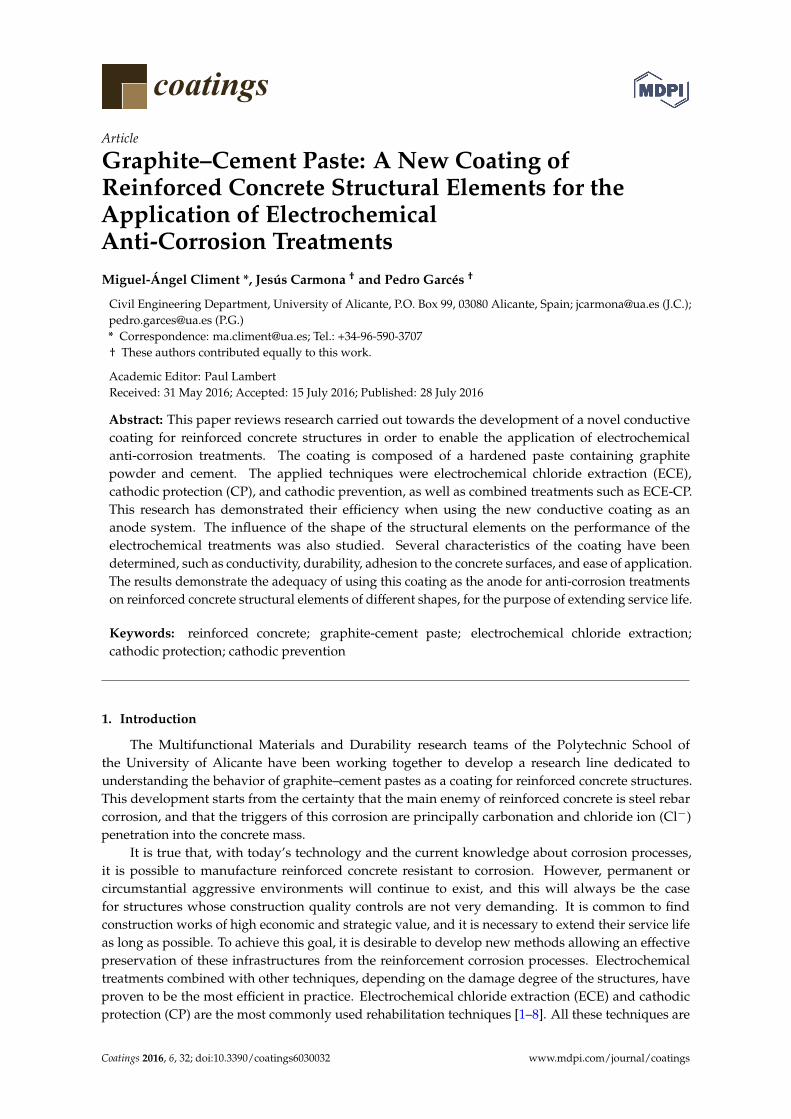
Regarding the assembly of the ECE systems, one of each of the cylindrical and prismatic specimenswas equipped with a conventional anode composed of a Ti-RuO2 mesh, as described previously.The system consisted of two absorbent polymeric layers housing the Ti-RuO2 mesh between them.Those three layers were successively and firmly set up, covering the whole exposed concrete surfaceof specimens (see Figure 1). In this way, the specimens were able to retain moisture and thus avoidincreasing the necessary feeding voltage during the ECE process. Specimens assembled as mentionedwere placed into a recipient with water in order to immerse the pump of the drip irrigation system.As for electrical connection, a protrusion was made in an extremity of the mesh to connect with thepositive pole of the current source, closing the anodic circuit.
Coatings 2016, 6, 32 4 of 21
The problem of keeping the anodic systems moist (both the Ti‐RuO2 mesh embedded into layers
of absorbent fabric, and the GCP overlay) during the ECE treatments was overcome by using a system
that consisted of a water pump and several pipes with droppers, assembled around the surface of
each specimen. The circulated electrolyte was tap water. This periodic drip irrigation system ensures
the right action of the electrolyte during the electrochemical procedure [8,22].
Regarding the assembly of the ECE systems, one of each of the cylindrical and prismatic
specimens was equipped with a conventional anode composed of a Ti‐RuO2 mesh, as described
previously. The system consisted of two absorbent polymeric layers housing the Ti‐RuO2 mesh
between them. Those three layers were successively and firmly set up, covering the whole exposed
concrete surface of specimens (see Figure 1). In this way, the specimens were able to retain moisture
and thus avoid increasing the necessary feeding voltage during the ECE process. Specimens
assembled as mentioned were placed into a recipient with water in order to immerse the pump of the
drip irrigation system. As for electrical connection, a protrusion was made in an extremity of the
mesh to connect with the positive pole of the current source, closing the anodic circuit.
Figure 1. Anodic system composed by a Ti‐RuO2 mesh embedded between two absorbent polymeric
layers, wrapping a reinforced concrete specimen. Adapted from [24].
As for the rest of the specimens (one of each type), a layer of GCP was applied by spraying on
all vertical surfaces. The spray was made with a compressed air gun, as a shotcrete system, forming
an overlay around 2 mm thick. Then, the GCP overlays were moist‐cured for 10 days in a curing
chamber of relative humidity >95%. Finally, the GCP coating was covered by the same polymeric
layer mentioned above, and the same irrigation system was also installed to ensure the presence of
the electrolyte. Anodic connections were made through two interconnected graphite felt fabric strips,
4 cm wide, firmly attached to the GCP layer, and connected to the positive pole of the electric power
source.
All specimens closed its cathodic circuit by connecting a rebar to the negative pole of the current
source. The stirrups guaranteed the interconnection of all the steel reinforcement bars.
The ECE experiments were performed under galvanostatic control, i.e., under constant direct
current density, which was set in the range of 2–5 A/m2 relative to the exposed concrete surface of the
specimen. The total electric charge density passed was of 5 × 10⁶ C/m2, also relative to the exposed
concrete surface. The imposed feeding voltage, which was continuously monitored, is therefore a
consequence of the constant current density and the resistance of the system. This voltage tends to
rise as the ECE process progresses, since the resistivity of the specimens increases. The European
Standard CEN/TS 14038‐2 recommends not exceeding the level of 40 V, for safety reasons as well as
to prevent damage in the anode [32]. In order to avoid exceeding the safety level, the voltage must
be monitored and controlled throughout the treatment. To control the voltage evolution and any
circumstances during the whole treatment, the specimens were remotely monitored by using a WIFI
IP camera.
Figure 1. Anodic system composed by a Ti-RuO2 mesh embedded between two absorbent polymericlayers, wrapping a reinforced concrete specimen. Adapted from [24].
As for the rest of the specimens (one of each type), a layer of GCP was applied by spraying onall vertical surfaces. The spray was made with a compressed air gun, as a shotcrete system, formingan overlay around 2 mm thick. Then, the GCP overlays were moist-cured for 10 days in a curingchamber of relative humidity >95%. Finally, the GCP coating was covered by the same polymericlayer mentioned above, and the same irrigation system was also installed to ensure the presence of theelectrolyte. Anodic connections were made through two interconnected graphite felt fabric strips, 4 cmwide, firmly attached to the GCP layer, and connected to the positive pole of the electric power source.
All specimens closed its cathodic circuit by connecting a rebar to the negative pole of the currentsource. The stirrups guaranteed the interconnection of all the steel reinforcement bars.
The ECE experiments were performed under galvanostatic control, i.e., under constant directcurrent density, which was set in the range of 2–5 A/m2 relative to the exposed concrete surface of thespecimen. The total electric charge density passed was of 5 ˆ 106 C/m2, also relative to the exposedconcrete surface. The imposed feeding voltage, which was continuously monitored, is therefore aconsequence of the constant current density and the resistance of the system. This voltage tends to riseas the ECE process progresses, since the resistivity of the specimens increases. The European StandardCEN/TS 14038-2 recommends not exceeding the level of 40 V, for safety reasons as well as to preventdamage in the anode [32]. In order to avoid exceeding the safety level, the voltage must be monitoredand controlled throughout the treatment. To control the voltage evolution and any circumstancesduring the whole treatment, the specimens were remotely monitored by using a WIFI IP camera.

Coatings 2016, 6, 32 5 of 21
The observed feeding voltage evolution during the ECE treatments was slightly different forthe two anodic systems: the specimens tested with GCP anodic systems showed higher feedingvoltages. In order to prevent reaching values over 40 V, two types of actions were taken: the reductionof the current density values (never under 1 A/m2), and the inclusion of pauses of the treatments.Nevertheless, in all cases the total applied electric charge density was the same: 5 ˆ 106 C/m2, relativeto the exposed concrete surface. It has been shown previously that the ECE efficiency is mainlygoverned by the applied electric charge density, with little influence of the duration of the ECE trialsand of the current density [33–35]. The duration of the ECE experiments was between 325 and 350 h.
The ECE efficiencies were calculated as the percentages of reduction of the initial chloride content.The obtention of chloride content profiles before and after the ECE trials allows for calculating thelocal and overall efficiencies. The Cl´ profiles were obtained following RILEM’s recommendedprocedures [36]. Cylindrical concrete cores, 95 mm diameter and 40 mm height (up to the rebar depth),were extracted before and after the ECE treatments. From these cores, concrete dust samples wereobtained by grinding thin (2 mm thick) successive parallel layers to the exposed surface [36]. In thisway 20 concrete dust samples were gained from each core, thus allowing the obtention of sufficientlydetailed chloride content profiles. The determination of the samples’ acid soluble chloride contentswas carried out by potentiometric titration [37,38]. All the chloride content values are expressed in thiswork as % Cl´ relative to cement mass.
For Case Study 2, and when checking the shape effect of the structural elements on the ECEefficiencies, both circular sections (cylindrical columns) and rectangular sections (prismatic columns)were tested. In the case of the rectangular columns, two types of positions were selected for extractingthe concrete cores for determining the Cl´ content profiles and the ECE efficiencies (see Figure 2):
‚ Position number 1 in Figure 2, which corresponds to the center of the biggest face of the specimen.‚ Position number 2 in Figure 2, which corresponds to the concrete cover zone over the steel rebar.
Coatings 2016, 6, 32 5 of 21
The observed feeding voltage evolution during the ECE treatments was slightly different for the
two anodic systems: the specimens tested with GCP anodic systems showed higher feeding voltages.
In order to prevent reaching values over 40 V, two types of actions were taken: the reduction of the
current density values (never under 1 A/m2), and the inclusion of pauses of the treatments.
Nevertheless, in all cases the total applied electric charge density was the same: 5 × 10⁶ C/m2, relative
to the exposed concrete surface. It has been shown previously that the ECE efficiency is mainly
governed by the applied electric charge density, with little influence of the duration of the ECE trials
and of the current density [33–35]. The duration of the ECE experiments was between 325 and 350 h.
The ECE efficiencies were calculated as the percentages of reduction of the initial chloride
content. The obtention of chloride content profiles before and after the ECE trials allows for
calculating the local and overall efficiencies. The Cl− profiles were obtained following RILEM’s
recommended procedures [36]. Cylindrical concrete cores, 95 mm diameter and 40 mm height (up to
the rebar depth), were extracted before and after the ECE treatments. From these cores, concrete dust
samples were obtained by grinding thin (2 mm thick) successive parallel layers to the exposed surface
[36]. In this way 20 concrete dust samples were gained from each core, thus allowing the obtention
of sufficiently detailed chloride content profiles. The determination of the samples’ acid soluble
chloride contents was carried out by potentiometric titration [37,38]. All the chloride content values
are expressed in this work as % Cl− relative to cement mass.
For Case Study 2, and when checking the shape effect of the structural elements on the ECE
efficiencies, both circular sections (cylindrical columns) and rectangular sections (prismatic columns)
were tested. In the case of the rectangular columns, two types of positions were selected for extracting
the concrete cores for determining the Cl− content profiles and the ECE efficiencies (see Figure 2):
Position number 1 in Figure 2, which corresponds to the center of the biggest face of the
specimen.
Position number 2 in Figure 2, which corresponds to the concrete cover zone over the steel rebar.
Figure 2. Extraction of two different concrete core samples on prismatic reinforced concrete specimens
(Case Study 2). Point 1 is on the center of the biggest face of the specimen, and point 2 on the concrete
cover, over the steel bar. Adapted from [24].
2.2. Materials and Methods Used in Case Study 3
The purpose of this study was to investigate the possibility of using the GCP coating as an anode
for applying protective treatments of CP, CPrev, ECE+CP, and ECE+CPrev, to laboratory model
reinforced concrete specimens. Table 3 establishes the adopted nomenclature of the specimens and
the electrochemical treatments applied to each one. The specimens intended for CPrev trials (P and
B) were prepared with chloride‐free concrete, since the CPrev treatments are designed for being
continuously applied to newly constructed structures, starting from the very beginning of the
structure’s service life [25,26]. On the other hand, the rest of the specimens dedicated to testing the
CP, ECE+CP, or ECE+CPrev were prepared with concrete admixed with Cl− ions. The CP treatments
Figure 2. Extraction of two different concrete core samples on prismatic reinforced concrete specimens(Case Study 2). Point 1 is on the center of the biggest face of the specimen, and point 2 on the concretecover, over the steel bar. Adapted from [24].
2.2. Materials and Methods Used in Case Study 3
The purpose of this study was to investigate the possibility of using the GCP coating as ananode for applying protective treatments of CP, CPrev, ECE+CP, and ECE+CPrev, to laboratorymodel reinforced concrete specimens. Table 3 establishes the adopted nomenclature of the specimensand the electrochemical treatments applied to each one. The specimens intended for CPrev trials(P and B) were prepared with chloride-free concrete, since the CPrev treatments are designed forbeing continuously applied to newly constructed structures, starting from the very beginning of thestructure’s service life [25,26]. On the other hand, the rest of the specimens dedicated to testing theCP, ECE+CP, or ECE+CPrev were prepared with concrete admixed with Cl´ ions. The CP treatments
Coatings 2016, 6, 32 6 of 21
are known to allow stopping an ongoing reinforcement corrosion process due to chlorides [25,26].Finally, the combined treatments (ECE+CP and ECE+CPrev) are tested here to represent situations inwhich a structure is exposed to an aggressive Cl´ environment, and an analytical determination ofconcrete’s Cl´ content reveals an excessive value from the point of view of reinforcement corrosion.In these conditions the ECE technique is first applied to reduce the Cl´ content, and afterwardsa continuous protective treatment (CP or CPrev) is applied to preserve the steel reinforcement inprotective conditions [21,27]. It must be stressed that all specimens included in Table 3, even thosethat were not given any of the electrochemical treatments (R and P), were subjected to the samesalting regime during the 24-week period of the CP or CPrev treatments: 65 mL NaCl 0.5 M wassprayed weekly onto the concrete or anodic overlay surface, in order to simulate the continued chloridecontamination due to exposure to a very aggressive environment, as mentioned above.
Table 3. Nomenclature of specimens for the application of CP, CPrev, and combined treatmentsECE+CP and ECE+CPrev in Case Study 3.
Studied Techniques Initial % Cl´ in Concrete Reference Sample Treated Samples
CP 2 R (no electrochemicaltreatment) A (CP treated)
CPrev 0 P (no electrochemicaltreatment) B (CPrev treated)
ECE+CP 2 ER (treated only with ECE) EA (ECE+CP treated)ECE+CPrev 2 EB (ECE+CPrev treated)
2.2.1. Reinforced Concrete Laboratory Specimens
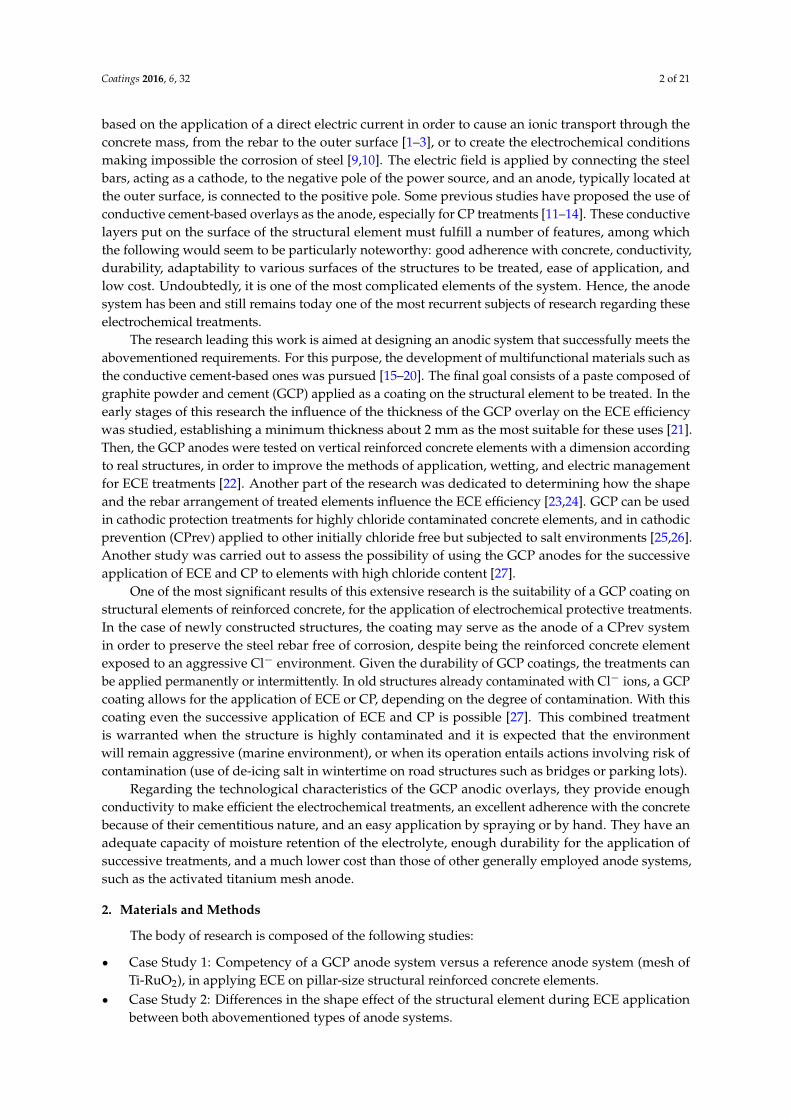
In this case the specimens were prism-shaped reinforced concrete elements, with dimensions of18 ˆ 18 ˆ 8 cm3, which were reinforced by a grid of 16 ˆ 16 cm2 composed of six steel bars (5 mmdiameter) soldered symmetrically, forming squares of 5 cm per side, and placed 2 cm under theanode (Figure 3). The concrete dosage was as shown in Table 4. Two mixes were prepared: onewithout added chloride for preparing the specimens intended for pure cathodic prevention (CPrev)treatments, and another mix containing 2% Cl´ relative to cement mass for the specimens used incathodic protection (CP) applications or combined treatments (ECE+CP) and (ECE+CPrev) (see Table 4).Once the formwork was removed, the specimens were moist-cured at 95%–98% relative humidity(RH) for 28 days. The characteristics of the hardened concrete were as follows: compressive strength37.8 N/mm2 [29], porosity 11.1% [30], and bulk density 2.38 T/m3 [31].
Coatings 2016, 6, 32 6 of 21
are known to allow stopping an ongoing reinforcement corrosion process due to chlorides [25,26].
Finally, the combined treatments (ECE+CP and ECE+CPrev) are tested here to represent situations in
which a structure is exposed to an aggressive Cl− environment, and an analytical determination of
concrete’s Cl− content reveals an excessive value from the point of view of reinforcement corrosion.
In these conditions the ECE technique is first applied to reduce the Cl− content, and afterwards a
continuous protective treatment (CP or CPrev) is applied to preserve the steel reinforcement in
protective conditions [21,27]. It must be stressed that all specimens included in Table 3, even those
that were not given any of the electrochemical treatments (R and P), were subjected to the same
salting regime during the 24‐week period of the CP or CPrev treatments: 65 mL NaCl 0.5 M was
sprayed weekly onto the concrete or anodic overlay surface, in order to simulate the continued
chloride contamination due to exposure to a very aggressive environment, as mentioned above.
Table 3. Nomenclature of specimens for the application of CP, CPrev, and combined treatments
ECE+CP and ECE+CPrev in Case Study 3.
Studied Techniques Initial % Cl− in Concrete Reference Sample Treated Samples
CP 2 R (no electrochemical
treatment)A (CP treated)
CPrev 0 P (no electrochemical
treatment)B (CPrev treated)
ECE+CP 2 ER (treated only
with ECE)
EA (ECE+CP treated)
ECE+CPrev 2 EB (ECE+CPrev treated)
2.2.1. Reinforced Concrete Laboratory Specimens
In this case the specimens were prism‐shaped reinforced concrete elements, with dimensions of
18 × 18 × 8 cm³, which were reinforced by a grid of 16 × 16 cm² composed of six steel bars (5 mm
diameter) soldered symmetrically, forming squares of 5 cm per side, and placed 2 cm under the anode
(Figure 3). The concrete dosage was as shown in Table 4. Two mixes were prepared: one without
added chloride for preparing the specimens intended for pure cathodic prevention (CPrev)
treatments, and another mix containing 2% Cl− relative to cement mass for the specimens used in
cathodic protection (CP) applications or combined treatments (ECE+CP) and (ECE+CPrev) (see
Table 4). Once the formwork was removed, the specimens were moist‐cured at 95%–98% relative
humidity (RH) for 28 days. The characteristics of the hardened concrete were as follows: compressive
strength 37.8 N/mm2 [29], porosity 11.1% [30], and bulk density 2.38 T/m3 [31].
Figure 3. Sketch of reinforcement of samples and connection of the cathodic system for the specimens
tested in Case Study 3. Adapted from [27]. Figure 3. Sketch of reinforcement of samples and connection of the cathodic system for the specimenstested in Case Study 3. Adapted from [27].

Coatings 2016, 6, 32 7 of 21
Table 4. Concrete dosage of laboratory specimens for Case Study 3.
Material Dosage
Portland cement CEM I 42.5 R 250 kg/m3
w/c Ratio 0.65Limestone aggregate max. size 12 mm 1890 kg/m3
Superplasticizer 2.50 kg/m3
NaCl Nil or 3.3% (2% Cl´ relative to cement mass)
Figure 3 also shows the system used for connecting the reinforcement (cathode system) to thenegative pole of the electric power source, through plastic isolated copper connectors screwed tothe rebar.
2.2.2. Common Experimental Details of the Electrochemical Tests in Case Study 3
All the electrochemical tests in this section were performed using the GCP anodic overlay. To formthe anode system, a graphite–cement paste was prepared by mixing graphite powder and Portlandcement at 50%/50% in mass. The water to solid mix ratio was 0.8. Secondly, a 2 mm thick layerof this paste was applied on the surface of each specimen, and then all of them were moist-curedfor 10 days. After that, two grooves were performed lengthwise onto the anodic overlay, withoutreaching the concrete surface, in order to allow both graphite rods to connect to the positive pole ofthe electric source. To finish up, these rods were overlaid with graphite–cement paste in order to joinwith the anode system perfectly, but avoiding any contact between graphite rods and concrete. A PVCreceptacle was assembled on top of the samples to retain both ECE electrolyte (distilled water) and/orthe dissolution used during CP or CPrev applications to simulate a continued chloride contamination(65 mL NaCl 0.5 M applied weekly), Figure 4. The ratio between the surface of concrete covered bythe anodic overlay and the surface of the primary anodes (graphite rods) was 9.6; the ratio betweenthe surface of concrete covered by the anodic overlay and the total surface of the steel bars was 1.7(Figure 4). All current density and electric charge density values reported in this work are relative tothe surface of concrete (equal to the anode surface) unless otherwise stated.
The resistivity of the graphite–cement paste was measured through the four-probe method. To thisend, paste specimens were cast in 4 ˆ 4 ˆ 16 cm3 molds and moist-cured at 95%–98% RH for 14 days.The experimental details of the measurements can be found elsewhere [39]. The average obtainedresistivity was 1.5 Ω¨m.
Coatings 2016, 6, 32 7 of 21
Table 4. Concrete dosage of laboratory specimens for Case Study 3.
Material Dosage
Portland cement CEM I 42.5 R 250 kg/m3
w/c Ratio 0.65
Limestone aggregate max. size 12 mm 1890 kg/m3
Superplasticizer 2.50 kg/m³
NaCl Nil or 3.3% (2% Cl− relative to cement mass)
Figure 3 also shows the system used for connecting the reinforcement (cathode system) to the
negative pole of the electric power source, through plastic isolated copper connectors screwed to the
rebar.
2.2.2. Common Experimental Details of the Electrochemical Tests in Case Study 3
All the electrochemical tests in this section were performed using the GCP anodic overlay. To
form the anode system, a graphite–cement paste was prepared by mixing graphite powder and
Portland cement at 50%/50% in mass. The water to solid mix ratio was 0.8. Secondly, a 2 mm thick
layer of this paste was applied on the surface of each specimen, and then all of them were moist‐
cured for 10 days. After that, two grooves were performed lengthwise onto the anodic overlay,
without reaching the concrete surface, in order to allow both graphite rods to connect to the positive
pole of the electric source. To finish up, these rods were overlaid with graphite–cement paste in order
to join with the anode system perfectly, but avoiding any contact between graphite rods and concrete.
A PVC receptacle was assembled on top of the samples to retain both ECE electrolyte (distilled water)
and/or the dissolution used during CP or CPrev applications to simulate a continued chloride
contamination (65 mL NaCl 0.5 M applied weekly), Figure 4. The ratio between the surface of concrete
covered by the anodic overlay and the surface of the primary anodes (graphite rods) was 9.6; the ratio
between the surface of concrete covered by the anodic overlay and the total surface of the steel bars
was 1.7 (Figure 4). All current density and electric charge density values reported in this work are
relative to the surface of concrete (equal to the anode surface) unless otherwise stated.
The resistivity of the graphite–cement paste was measured through the four‐probe method. To
this end, paste specimens were cast in 4 × 4 × 16 cm3 molds and moist‐cured at 95%–98% RH for 14
days. The experimental details of the measurements can be found elsewhere [39]. The average
obtained resistivity was 1.5 Ω m.
Figure 4. Sketch of specimen assembly. Adapted from [27].
The measurements of steel corrosion potential (Ecorr) and all the single electrode potentials, were
performed using Ag‐AgCl reference electrodes. These electrodes were housed in respective holes
Figure 4. Sketch of specimen assembly. Adapted from [27].

Coatings 2016, 6, 32 8 of 21
The measurements of steel corrosion potential (Ecorr) and all the single electrode potentials, wereperformed using Ag-AgCl reference electrodes. These electrodes were housed in respective holesdrilled from the exposed surface of the concrete specimen (that bearing the graphite–cement anode) tothe vicinity of the rebar (Figure 4). For this purpose, the holes were sheathed with a plastic tube andfilled with a KOH 0.2 M solution, trying to approach the physico-chemical conditions of the concrete’sinner pore solution.
In this way nine specimens were prepared, seven of them with salt in the mixing water and twowithout it. Two of the salted specimens were used only for determining the efficiency of the ECEprocess. Concrete cores were extracted from them and their chloride content profiles were determined,in one case before and in the other case after ECE. These two specimens were discarded after coring.The seven remaining specimens were intended for the tests corresponding to CP, Cprev, and thecombined treatments (ECE+CP and ECE+CPrev).
2.2.3. ECE Treatments in Case Study 3
Initially four of the specimens made with saline mixing water were subjected to ECE. For thispurpose, the specimens were electrically connected in series by pairs to a direct current source.The relevant parameters of the ECE treatments are shown in Table 5. A low charge density was applied,only 1.5 MC/m2 relative to the concrete surface (2.6 MC/m2 relative to steel surface). The currentsource feeding voltage (∆Efeed) was controlled at a level below 40 V during the processes, for safetyreasons. It was necessary in this respect to interrupt the current passage two times (two pauses of24 h each) along the treatment. The whole process was performed inside a fume hood to eliminate thechlorine (Cl2(g)) produced by electrochemical oxidation of the Cl´ ions extracted from the concrete.When the ECE processes were finished, the pH values of the electrolytes were measured in order tocheck the acidifying effect caused by the electrochemical anodic reactions.
Table 5. Summary of ECE data for Case Study 3.
Initial % Cl´ Current Density Initial ∆Efeed Final ∆Efeed Electric Charge Density
2 % relative tocement mass
2 A/m2 of concreteexposed surface
(3.4 A/m2 of steel surface)16–24 V 23–22 V
1.5 MC/m2 of concreteexposed surface
(2.6 MC/m2 of steel surface)
ECE: Specimens with GCP as anode; Electrolyte: dammed distilled water.
2.2.4. Application of CP, CPrev, and the Combined Treatments ECE+CP and ECE+CPrev
This section describes the details of the experiments carried out to demonstrate the applicabilityof the GCP anodes for protective treatments of CP, CPrev, ECE+CP, and ECE+CPrev (please refer toTable 3).
The CP treatments were applied with 15 mA/m2 of current density (relative to concrete or anodesurface) to two specimens, one of those previously treated with ECE (EA in Table 3) and the other onewithout prior treatment (A in Table 3). On the other hand, we applied CPrev with 2 mA/m2 of currentdensity (relative to concrete surface) to a sample previously ECE treated (EB in Table 3) and to anothermanufactured without salt and not ECE treated (B in Table 3). The values of the current densitiesrelative to the steel bars’ surface are 25.5 mA/m2 and 3.4 mA/m2 for the CP and Cprev treatments,respectively. The direct current source was programmed to maintain a constant current density alongthe whole process. Each application has its reference sample without treatment of CP or CPrev tocompare the results. The reference sample for the specimens subjected to combined treatments (EA forECE+CP, and EB for ECE+CPrev) is ER. R is the reference for A, and P is the reference for B.
The application of CP and CPrev consisted of two phases:
Phase 1. First 24 weeks. The aforementioned treatments CP and CPrev were continuouslyapplied during the first 13 weeks. Then, the current was switched off for four weeks and after that

Coatings 2016, 6, 32 9 of 21
treatments were resumed to the end. Chloride contamination was continuously applied, even duringthe switch-off periods.
While applying the CP and CPrev treatments, some parameters representative of the corrosionstate of steel were measured in open-circuit conditions. During the first two weeks, the steel corrosionpotential (Ecorr) was daily measured by means of an Ag-AgCl reference electrode. Since the thirdweek both the corrosion potential and the steel corrosion rate icorr (µA/cm2) were determined weekly.The icorr measurements were taken with a Gecor6 device (Geocisa, Madrid, Spain). Gecor6 is aportable measurement unit based on the linear polarization resistance method. The equipment uses amodulation confinement technique, allowing the quantitative determination of the corrosion rate [40].During the current passing periods the feeding voltage of each specimen, ∆Efeed, was obtained as thepotential difference between cathode and anode; and the individual anodic and cathodic potentials, Ea
and Ec, respectively, were measured against the reference electrode Ag-AgCl. Finally, in order to checkthe efficiency of CP and CPrev as maintainers of protection conditions of steel, the “100 mV decay”criterion was used, as is specified in ISO 12696:2012 [41]. This criterion has been also extensivelyemployed for this purpose by several researchers [14,42]. The method consists in obtaining thefour-hour potential decay (∆Edecay) that is the difference between E4h
c (the value of Ec four hours afterthe current switch-off), and the instant-off cathodic potential Eio
c , which in this case was measured 1 safter the current switch-off. The minimum value of the four-hour depolarization must be 100 mV foran adequate corrosion protection of steel [41]. The values of Eio
c were monitored with an automaticdata logger able to obtain and record 500 measurements in 6 s after the current switch-off.
Once the 24-week processes were fulfilled, cores were extracted from all specimens of Table 3,and their respective Cl´ content profiles were obtained.
Phase 2. At the end of Phase 1 it was observed that all the specimens had lost the steel protectioncondition, evidenced by ∆Edecay values lower than 100 mV. Then, it was decided to start this secondphase with the objective of recovering the protection conditions of steel by adjusting the current densityof the CP treatments. The procedure was to increase progressively the current density over four weeks,starting with a value of 20 mA/m2, until the protection conditions were obtained.
Chloride content profiles were experimentally determined, following the methodology describedin Section 2.1.2, for the specimens listed in Table 3, in order to understand the net effect of theelectrochemical treatments on the Cl´ ion uptake by the reinforced concrete specimens during thecontinued exposure to a very aggressive environment.
3. Results and Discussion
3.1. Case Study 1: Competency of a GCP Anode System versus a Reference Anode System (Mesh of Ti-RuO2)in Applying ECE on Pillar-Size Structural Reinforced Concrete Elements
This section describes the results obtained in the experiments carried out to compare the ECEefficiencies obtained with the GCP anodic overlay and the classical Ti-RuO2 mesh anode, in terms ofpercentage of reduction of the initial Cl´ content; refer to Section 2.1.
Figures 5 and 6 show the initial and final chloride content profiles, before and after ECE, togetherwith the distributions of local efficiencies of the ECE treatment. Figure 7 shows the comparisons of thelocal efficiencies obtained with the two types of anodes. The averaged efficiencies along the concretecover zone of steel (40 mm width) were 79.4% for the Ti-RuO2 anode, and 79.2% for the GCP anode.Another observation extracted from Figure 7 is that for both anodes the ECE process is more efficientin the zone closer to the concrete surface. These results clearly show the feasibility of using a GCPanode for ECE treatments, without losing the efficiency of the process, in comparison with the classicalTi-RuO2 mesh anode, in agreement with the results of similar research [43].

Coatings 2016, 6, 32 10 of 21Coatings 2016, 6, 32 10 of 21
Figure 5. Chloride content profiles and ECE efficiencies using the reference anode system based on a
Ti‐RuO2 mesh. Adapted from [22].
Figure 6. Chloride content profiles and ECE efficiencies using a GCP coating as anode system.
Adapted from [22].
Figure 7. Compared ECE efficiencies for the Ti‐RuO2 mesh and GCP anodes. Adapted from [22].
0 5 10 15 20 25 30 35 400.0
0.5
1.0
1.5
2.0
2.5
3.0
3.5
4.0
4.5
5.0
Final content
Initial content
Efficie
ncy (%)
Ch
lorid
e C
on
tent
(%
)
Depth (mm)
Efficiency
0
10
20
30
40
50
60
70
80
90
100
0 5 10 15 20 25 30 35 400.0
0.5
1.0
1.5
2.0
2.5
3.0
3.5
4.0
4.5
5.0
Final content
Initial content
Efficie
ncy (%
)
Depth (mm)
Efficiency
0
10
20
30
40
50
60
70
80
90
100
0 5 10 15 20 25 30 35 400
10
20
30
40
50
60
70
80
90
100
Effi
cie
ncy
(%
)
Depth (mm)
Ti-RuO2 mesh
CCP
Figure 5. Chloride content profiles and ECE efficiencies using the reference anode system based on aTi-RuO2 mesh. Adapted from [22].
Coatings 2016, 6, 32 10 of 21
Figure 5. Chloride content profiles and ECE efficiencies using the reference anode system based on a
Ti‐RuO2 mesh. Adapted from [22].
Figure 6. Chloride content profiles and ECE efficiencies using a GCP coating as anode system.
Adapted from [22].
Figure 7. Compared ECE efficiencies for the Ti‐RuO2 mesh and GCP anodes. Adapted from [22].
0 5 10 15 20 25 30 35 400.0
0.5
1.0
1.5
2.0
2.5
3.0
3.5
4.0
4.5
5.0
Final content
Initial content
Efficie
ncy (%)
Ch
lorid
e C
on
tent
(%
)
Depth (mm)
Efficiency
0
10
20
30
40
50
60
70
80
90
100
0 5 10 15 20 25 30 35 400.0
0.5
1.0
1.5
2.0
2.5
3.0
3.5
4.0
4.5
5.0
Final content
Initial content
Efficie
ncy (%
)
Depth (mm)
Efficiency
0
10
20
30
40
50
60
70
80
90
100
0 5 10 15 20 25 30 35 400
10
20
30
40
50
60
70
80
90
100
Effi
cie
ncy
(%
)
Depth (mm)
Ti-RuO2 mesh
CCP
Figure 6. Chloride content profiles and ECE efficiencies using a GCP coating as anode system.Adapted from [22].
Coatings 2016, 6, 32 10 of 21
Figure 5. Chloride content profiles and ECE efficiencies using the reference anode system based on a
Ti‐RuO2 mesh. Adapted from [22].
Figure 6. Chloride content profiles and ECE efficiencies using a GCP coating as anode system.
Adapted from [22].
Figure 7. Compared ECE efficiencies for the Ti‐RuO2 mesh and GCP anodes. Adapted from [22].
0 5 10 15 20 25 30 35 400.0
0.5
1.0
1.5
2.0
2.5
3.0
3.5
4.0
4.5
5.0
Final content
Initial content
Efficie
ncy (%)
Ch
lorid
e C
on
tent
(%
)
Depth (mm)
Efficiency
0
10
20
30
40
50
60
70
80
90
100
0 5 10 15 20 25 30 35 400.0
0.5
1.0
1.5
2.0
2.5
3.0
3.5
4.0
4.5
5.0
Final content
Initial content
Efficie
ncy (%
)
Depth (mm)
Efficiency
0
10
20
30
40
50
60
70
80
90
100
0 5 10 15 20 25 30 35 400
10
20
30
40
50
60
70
80
90
100
Effi
cie
ncy
(%
)
Depth (mm)
Ti-RuO2 mesh
CCP
Figure 7. Compared ECE efficiencies for the Ti-RuO2 mesh and GCP anodes. Adapted from [22].

Coatings 2016, 6, 32 11 of 21
3.2. Case Study 2: Differences in the Shape Effect Structural Elements during ECE Application in Both Types ofAnode Systems
In 1998 Tritthart [3] applied the concept of electric flow produced during ECE to predictingdifferences in the local efficiencies of ECE, due to the lack of homogeneity in the intensity of the electricfield acting between the steel rebar and the external anodes. This has some consequences regardingthe practical application of ECE to reinforced concrete elements. Specimens of circular section witha regular rebar distribution, coupled with an anode with a symmetric concentric distribution, canprovide an isotropic electric field for the ECE treatment. Conversely, the more habitual geometryand heterogeneous rebar arrangements of rectangular section reinforced concrete elements mayproduce local differences in the electric field intensity between different zones of the surface of theconcrete structure, thus leading to differences in the ECE efficiency (Figure 8). The aim of this sectionis to provide further quantitative experimental confirmation of these statements, and to evaluatethe influence of the type of anode on the abovementioned anisotropic effect caused by the typicalrebar arrangements in reinforced concrete elements [24]. To this end, chloride content profiles weredetermined both before and after ECE for reinforced concrete elements of circular sections (isotropicelectric field), and rectangular sections (anisotropic electric field). For the latter, different samplingpositions were selected in order to prove the mentioned effect. (Refer to Figure 2 in Section 2.1.).
Coatings 2016, 6, 32 11 of 21
3.2. Case Study 2: Differences in the Shape Effect Structural Elements during ECE Application in Both
Types of Anode Systems
In 1998 Tritthart [3] applied the concept of electric flow produced during ECE to predicting
differences in the local efficiencies of ECE, due to the lack of homogeneity in the intensity of the
electric field acting between the steel rebar and the external anodes. This has some consequences
regarding the practical application of ECE to reinforced concrete elements. Specimens of circular
section with a regular rebar distribution, coupled with an anode with a symmetric concentric
distribution, can provide an isotropic electric field for the ECE treatment. Conversely, the more
habitual geometry and heterogeneous rebar arrangements of rectangular section reinforced concrete
elements may produce local differences in the electric field intensity between different zones of the
surface of the concrete structure, thus leading to differences in the ECE efficiency (Figure 8). The aim
of this section is to provide further quantitative experimental confirmation of these statements, and
to evaluate the influence of the type of anode on the abovementioned anisotropic effect caused by the
typical rebar arrangements in reinforced concrete elements [24]. To this end, chloride content profiles
were determined both before and after ECE for reinforced concrete elements of circular sections
(isotropic electric field), and rectangular sections (anisotropic electric field). For the latter, different
sampling positions were selected in order to prove the mentioned effect. (Refer to Figure 2 in Section
2.1.).
Figure 8. Different electric flow schemes during ECE application in an isotropic vertical element
(circular section and regularly reinforced) and in an anisotropic vertical specimen (rectangular section
and conventionally reinforced with rebar in the corners). Current streamlines, calculated using a
standard finite element method, are shown. Adapted from [24].
The ECE tests in this section were performed using current density values between 2 and 5 A/m2,
but the electric charge density passed was of 5 × 10⁶ C/m2 in all cases; both densities refer to the
concrete surface. Figures 9–12 show the initial and final Cl− content profiles, together with the
distributions of local ECE efficiencies through the concrete cover over steel for the specimens of a
rectangular section at sampling positions 1 and 2 (refer to Figure 2).
Figures 9–12 and Table 6 gather the relevant results in relation to the shape effect of the structural
element on the ECE efficiency. As for circular section specimens (chloride profiles not shown), the
mean ECE efficiencies are practically equal for both anode systems. The high ECE efficiency, in either
anode system and either sampling point, can be attributed to the uniformity and high density of
electric flow lines established between a regular cathode (rebars uniformly distributed) and an
equidistant anodic surface, as was exposed previously.
Figure 8. Different electric flow schemes during ECE application in an isotropic vertical element(circular section and regularly reinforced) and in an anisotropic vertical specimen (rectangular sectionand conventionally reinforced with rebar in the corners). Current streamlines, calculated using astandard finite element method, are shown. Adapted from [24].
The ECE tests in this section were performed using current density values between 2 and 5 A/m2,but the electric charge density passed was of 5 ˆ 106 C/m2 in all cases; both densities refer to theconcrete surface. Figures 9–12 show the initial and final Cl´ content profiles, together with thedistributions of local ECE efficiencies through the concrete cover over steel for the specimens of arectangular section at sampling positions 1 and 2 (refer to Figure 2).
Figures 9–12 and Table 6 gather the relevant results in relation to the shape effect of the structuralelement on the ECE efficiency. As for circular section specimens (chloride profiles not shown), themean ECE efficiencies are practically equal for both anode systems. The high ECE efficiency, in eitheranode system and either sampling point, can be attributed to the uniformity and high density of electricflow lines established between a regular cathode (rebars uniformly distributed) and an equidistantanodic surface, as was exposed previously.

Coatings 2016, 6, 32 12 of 21Coatings 2016, 6, 32 12 of 21
Figure 9. ECE with Ti‐RuO2 anode. Rectangular section reinforced concrete specimen. Core extracted
in the center of the biggest face of the specimen (position 1 in Figure 2). Cl− content profiles before and
after ECE and distribution of local ECE efficiencies. Adapted from [24].
Figure 10. ECE with Ti‐RuO2 anode. Rectangular section reinforced concrete specimen. Core extracted
in the cover zone over the steel (position 2 in Figure 2). Cl− content profiles before and after ECE and
distribution of local ECE efficiencies. Adapted from [24].
Figure 11. ECE with GCP anode. Rectangular section reinforced concrete specimen. Core extracted in
the center of the biggest face of the specimen (position 1 in Figure 2). Cl− content profiles before and
after ECE and distribution of local ECE efficiencies. Adapted from [24].
Figure 9. ECE with Ti-RuO2 anode. Rectangular section reinforced concrete specimen. Core extractedin the center of the biggest face of the specimen (position 1 in Figure 2). Cl´ content profiles before andafter ECE and distribution of local ECE efficiencies. Adapted from [24].
Coatings 2016, 6, 32 12 of 21
Figure 9. ECE with Ti‐RuO2 anode. Rectangular section reinforced concrete specimen. Core extracted
in the center of the biggest face of the specimen (position 1 in Figure 2). Cl− content profiles before and
after ECE and distribution of local ECE efficiencies. Adapted from [24].
Figure 10. ECE with Ti‐RuO2 anode. Rectangular section reinforced concrete specimen. Core extracted
in the cover zone over the steel (position 2 in Figure 2). Cl− content profiles before and after ECE and
distribution of local ECE efficiencies. Adapted from [24].
Figure 11. ECE with GCP anode. Rectangular section reinforced concrete specimen. Core extracted in
the center of the biggest face of the specimen (position 1 in Figure 2). Cl− content profiles before and
after ECE and distribution of local ECE efficiencies. Adapted from [24].
Figure 10. ECE with Ti-RuO2 anode. Rectangular section reinforced concrete specimen. Core extractedin the cover zone over the steel (position 2 in Figure 2). Cl´ content profiles before and after ECE anddistribution of local ECE efficiencies. Adapted from [24].
Coatings 2016, 6, 32 12 of 21
Figure 9. ECE with Ti‐RuO2 anode. Rectangular section reinforced concrete specimen. Core extracted
in the center of the biggest face of the specimen (position 1 in Figure 2). Cl− content profiles before and
after ECE and distribution of local ECE efficiencies. Adapted from [24].
Figure 10. ECE with Ti‐RuO2 anode. Rectangular section reinforced concrete specimen. Core extracted
in the cover zone over the steel (position 2 in Figure 2). Cl− content profiles before and after ECE and
distribution of local ECE efficiencies. Adapted from [24].
Figure 11. ECE with GCP anode. Rectangular section reinforced concrete specimen. Core extracted in
the center of the biggest face of the specimen (position 1 in Figure 2). Cl− content profiles before and
after ECE and distribution of local ECE efficiencies. Adapted from [24].
Figure 11. ECE with GCP anode. Rectangular section reinforced concrete specimen. Core extracted inthe center of the biggest face of the specimen (position 1 in Figure 2). Cl´ content profiles before andafter ECE and distribution of local ECE efficiencies. Adapted from [24].
Coatings 2016, 6, 32 13 of 21Coatings 2016, 6, 32 13 of 21
Figure 12. ECE with GCP anode. Rectangular section reinforced concrete specimen. Core extracted in
the cover zone over the steel (position 2 in Figure 2). Cl− content profiles before and after ECE and
distribution of local ECE efficiencies. Adapted from [24].
Table 6. Summary of obtained average efficiencies in the different tests carried out applying ECE to
reinforced concrete specimens.
Trial Horizontal Section
of Specimen Anode System Core Sample Location
Average
Efficiency (%)
1 Circular section Ti‐RuO2 – 82.8
2 Circular section GCP – 82.6
3 Rectangular section Ti‐RuO2 Center of the biggest face 52.5
4 Rectangular section Ti‐RuO2 Concrete cover over steel 85.2
5 Rectangular section GCP Center of the biggest face 64.4
6 Rectangular section GCP Concrete cover over steel 76.2
Regarding the specimens with rectangular sections and no uniformly distributed rebar
(anisotropic element), the different ECE efficiencies obtained at different sampling positions of the
concrete surface can be ascribed to differences in the electric flow density at those positions,
confirming the hypothesis. Indeed, the experiments carried out with a Ti‐RuO2 anode gave
significantly different ECE efficiencies: 52.5% for the center of the biggest face versus 85.2% for the
concrete cover over the rebar. The same effect was detected for the GCP anode, but the difference in
ECE efficiency was significantly lower than that found for the Ti‐RuO2 anode system (Table 6). This
effect could be related to the different nature of both anodic systems. There is some difficulty in
obtaining a good contact between the Ti‐RuO2 mesh anodic system and the concrete surface, because
of the rigidity and elasticity of the metal mesh [8]. On the other hand, the GCP coating probably
provided a good electrolytic contact with the concrete surface, thus avoiding the appearance of zones
of high electric resistance, which can be responsible for low ECE efficiency. This quality, coupled with
the fact that the cost of the GCP materials is 8–10 times lower than that of the Ti‐RuO2 mesh, confirms
GCP as a suitable anode system for ECE treatments.
3.3. Case Study 3: Ability of the GCP Anode System to Apply CP, CPrev, and Combined ECE‐CP
Treatments
In this section we describe the tests carried out to investigate the possibility of using the GCP
anodes for applying protective electrochemical treatments to reinforced concrete elements affected
by steel corrosion due to chloride contamination, such are CP, CPrev, and combined treatments of
ECE plus CP or CPrev. The possibility of keeping the GCP anodes as permanent concrete coatings
allows the subsequent application of a temporary treatment like ECE, for reducing an excessive Cl−
content, followed by a permanent protection like CP, in cases of exposure of the structure to a very
aggressive chloride environment. Refer to Section 2.2 for experimental details.
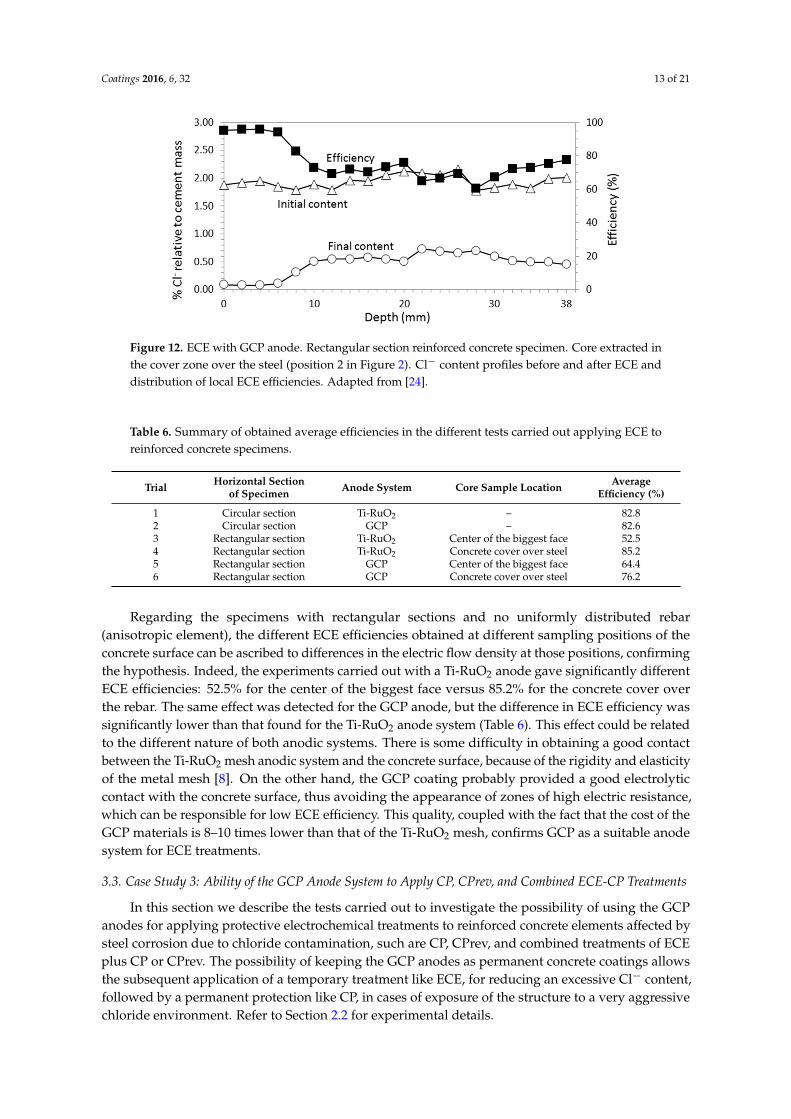
Figure 12. ECE with GCP anode. Rectangular section reinforced concrete specimen. Core extracted inthe cover zone over the steel (position 2 in Figure 2). Cl´ content profiles before and after ECE anddistribution of local ECE efficiencies. Adapted from [24].
Table 6. Summary of obtained average efficiencies in the different tests carried out applying ECE toreinforced concrete specimens.
Trial Horizontal Sectionof Specimen Anode System Core Sample Location Average
Efficiency (%)
1 Circular section Ti-RuO2 – 82.82 Circular section GCP – 82.63 Rectangular section Ti-RuO2 Center of the biggest face 52.54 Rectangular section Ti-RuO2 Concrete cover over steel 85.25 Rectangular section GCP Center of the biggest face 64.46 Rectangular section GCP Concrete cover over steel 76.2
Regarding the specimens with rectangular sections and no uniformly distributed rebar(anisotropic element), the different ECE efficiencies obtained at different sampling positions of theconcrete surface can be ascribed to differences in the electric flow density at those positions, confirmingthe hypothesis. Indeed, the experiments carried out with a Ti-RuO2 anode gave significantly differentECE efficiencies: 52.5% for the center of the biggest face versus 85.2% for the concrete cover overthe rebar. The same effect was detected for the GCP anode, but the difference in ECE efficiency wassignificantly lower than that found for the Ti-RuO2 anode system (Table 6). This effect could be relatedto the different nature of both anodic systems. There is some difficulty in obtaining a good contactbetween the Ti-RuO2 mesh anodic system and the concrete surface, because of the rigidity and elasticityof the metal mesh [8]. On the other hand, the GCP coating probably provided a good electrolyticcontact with the concrete surface, thus avoiding the appearance of zones of high electric resistance,which can be responsible for low ECE efficiency. This quality, coupled with the fact that the cost of theGCP materials is 8–10 times lower than that of the Ti-RuO2 mesh, confirms GCP as a suitable anodesystem for ECE treatments.
3.3. Case Study 3: Ability of the GCP Anode System to Apply CP, CPrev, and Combined ECE-CP Treatments
In this section we describe the tests carried out to investigate the possibility of using the GCPanodes for applying protective electrochemical treatments to reinforced concrete elements affected bysteel corrosion due to chloride contamination, such are CP, CPrev, and combined treatments of ECEplus CP or CPrev. The possibility of keeping the GCP anodes as permanent concrete coatings allowsthe subsequent application of a temporary treatment like ECE, for reducing an excessive Cl´ content,followed by a permanent protection like CP, in cases of exposure of the structure to a very aggressivechloride environment. Refer to Section 2.2 for experimental details.

Coatings 2016, 6, 32 14 of 21
Figures 13 and 14 show the evolution of the open-circuit Ecorr values for the specimens of Table 3during the duration of the first phase of the CP or CPrev experiments (24 weeks). In a similar manner,Figures 15 and 16 show the evolution of the icorr values for the same specimens. It must be recalled that,during the 24-week treatments, all specimens were subjected to an intense chloride loading regime(weekly sprayed applications of 65 mL of NaCl 0.5 M).
Coatings 2016, 6, 32 14 of 21
Figures 13 and 14 show the evolution of the open‐circuit Ecorr values for the specimens of Table
3 during the duration of the first phase of the CP or CPrev experiments (24 weeks). In a similar
manner, Figures 15 and 16 show the evolution of the icorr values for the same specimens. It must be
recalled that, during the 24‐week treatments, all specimens were subjected to an intense chloride
loading regime (weekly sprayed applications of 65 mL of NaCl 0.5 M).
Figure 13. Evolution of Ecorr during the treatments post ECE. EA: ECE+CP; EB: ECE+CPrev; ER: treated
only with ECE. All of them were subjected to Cl− contamination during the 24 weeks. Current density
values: CP: 15 mA/m2, CPrev: 2 mA/m2, both related to exposed concrete surface. Adapted from [27].
Figure 14. Evolution of Ecorr during the CP and CPrev treatments, without previous ECE. A: CP; B:
CPrev; R (2% Cl− in the mix, not CP treated): reference specimen for A; P (no Cl− in the mix, not CPrev
treated): reference specimen for B. All of them were subjected to Cl− contamination during the 24
weeks. Current density values: CP: 15 mA/m2, CPrev: 2 mA/m2, both related to exposed concrete
surface. Adapted from [27].
For the three specimens previously treated with ECE, Figure 13 shows that the initial Ecorr values
were equal or higher than −100 mV, typical values of steel corrosion potentials after ECE [6]. The Ecorr
values of EB (ECE+CPrev) quickly fell to values below −400 mV; for six weeks the EA specimen
(ECE+CP) remained at about −100 mV, finally falling below −400 mV after 10 weeks; the reference
specimen ER (only treated with ECE) showed an intermediate behaviour, falling to values of about
−200 mV and finally reaching values below −400 mV after 11 weeks. It seems that a CP treatment with
current density of 15 mA/m2 (EA) was able to maintain protective conditions for steel for about 10
weeks despite the high chloride loading. On the other hand, CPrev treatment of 2 mA/m2 (EB) was
not able to provide protective conditions. This was expected since such low current density values
Figure 13. Evolution of Ecorr during the treatments post ECE. EA: ECE+CP; EB: ECE+CPrev; ER: treatedonly with ECE. All of them were subjected to Cl´ contamination during the 24 weeks. Current densityvalues: CP: 15 mA/m2, CPrev: 2 mA/m2, both related to exposed concrete surface. Adapted from [27].
Coatings 2016, 6, 32 14 of 21
Figures 13 and 14 show the evolution of the open‐circuit Ecorr values for the specimens of Table
3 during the duration of the first phase of the CP or CPrev experiments (24 weeks). In a similar
manner, Figures 15 and 16 show the evolution of the icorr values for the same specimens. It must be
recalled that, during the 24‐week treatments, all specimens were subjected to an intense chloride
loading regime (weekly sprayed applications of 65 mL of NaCl 0.5 M).
Figure 13. Evolution of Ecorr during the treatments post ECE. EA: ECE+CP; EB: ECE+CPrev; ER: treated
only with ECE. All of them were subjected to Cl− contamination during the 24 weeks. Current density
values: CP: 15 mA/m2, CPrev: 2 mA/m2, both related to exposed concrete surface. Adapted from [27].
Figure 14. Evolution of Ecorr during the CP and CPrev treatments, without previous ECE. A: CP; B:
CPrev; R (2% Cl− in the mix, not CP treated): reference specimen for A; P (no Cl− in the mix, not CPrev
treated): reference specimen for B. All of them were subjected to Cl− contamination during the 24
weeks. Current density values: CP: 15 mA/m2, CPrev: 2 mA/m2, both related to exposed concrete
surface. Adapted from [27].
For the three specimens previously treated with ECE, Figure 13 shows that the initial Ecorr values
were equal or higher than −100 mV, typical values of steel corrosion potentials after ECE [6]. The Ecorr
values of EB (ECE+CPrev) quickly fell to values below −400 mV; for six weeks the EA specimen
(ECE+CP) remained at about −100 mV, finally falling below −400 mV after 10 weeks; the reference
specimen ER (only treated with ECE) showed an intermediate behaviour, falling to values of about
−200 mV and finally reaching values below −400 mV after 11 weeks. It seems that a CP treatment with
current density of 15 mA/m2 (EA) was able to maintain protective conditions for steel for about 10
weeks despite the high chloride loading. On the other hand, CPrev treatment of 2 mA/m2 (EB) was
not able to provide protective conditions. This was expected since such low current density values
Figure 14. Evolution of Ecorr during the CP and CPrev treatments, without previous ECE. A: CP;B: CPrev; R (2% Cl´ in the mix, not CP treated): reference specimen for A; P (no Cl´ in the mix, notCPrev treated): reference specimen for B. All of them were subjected to Cl´ contamination during the24 weeks. Current density values: CP: 15 mA/m2, CPrev: 2 mA/m2, both related to exposed concretesurface. Adapted from [27].
For the three specimens previously treated with ECE, Figure 13 shows that the initial Ecorr valueswere equal or higher than ´100 mV, typical values of steel corrosion potentials after ECE [6]. The Ecorr
values of EB (ECE+CPrev) quickly fell to values below ´400 mV; for six weeks the EA specimen(ECE+CP) remained at about ´100 mV, finally falling below ´400 mV after 10 weeks; the referencespecimen ER (only treated with ECE) showed an intermediate behaviour, falling to values of about´200 mV and finally reaching values below ´400 mV after 11 weeks. It seems that a CP treatmentwith current density of 15 mA/m2 (EA) was able to maintain protective conditions for steel for about10 weeks despite the high chloride loading. On the other hand, CPrev treatment of 2 mA/m2 (EB) was

Coatings 2016, 6, 32 15 of 21
not able to provide protective conditions. This was expected since such low current density values areonly effective for preventative treatments of reinforced concrete not previously contaminated withchlorides [25,26], while the three specimens of Figure 13 started the 24-week trials with an initial Cl´
content of about 1% (relative to cement mass). Indeed, ECE was applied to specimens manufacturedwith 2% Cl´ relative to cement mass. With the previously described conditions, ECE was able toreduce the Cl´ content of the specimens to approximately 51% of their initial content (51% averagedECE efficiency).
The evolution of the Ecorr values of the specimens not previously treated with ECE, Figure 14,shows that in this case the CP treatment with 15 mA/m2 current density (A) was not able to protectsteel from corrosion, since the corrosion potential of steel in A reached values below ´400 mV in twoweeks, and its values were only slightly higher than those of the non-CP-treated reference specimen(R). This different behavior, when compared to the observations of the precedent paragraph, can beexplained by taking into account that the A and R specimens started the 24-week experiments withan initial Cl´ content of 2% (relative to cement mass). To this must be added the large progressiveCl´ contamination due to the weekly salting regime. On the other hand, the CPrev treatment with2 mA/m2 current density, given to the initially Cl´ free specimen (B) allowed it to maintain valuesof Ecorr higher than ´400 mV, and clearly higher than those corresponding to the non-CPrev-treatedreference specimen (P), up to the current interruption at the 13th week. This is a further confirmationof the tolerance increase to chloride-induced corrosion for CPrev treated steel (current densities in therange 0.5–2 mA/m2 of concrete surface). These low cathodic currents, applied from the beginning ofthe service life of a reinforced concrete structure, decrease the steel potential, thus leading to importantincreases in the critical chloride content for pitting corrosion of steel [25,26].
From the observation of the evolution of the steel corrosion rates during the 24-week treatments(Figures 15 and 16), little difference appears between the behavior of the treated specimens (EA, EB, A,B) and their corresponding reference specimens (ER, R, P). Furthermore, in all cases icorr values higherthan 0.1–0.2 µA/cm2 were obtained, which means that in no case was a repassivation of steel obtainedin open-circuit conditions. A correct interpretation of these observations needs to consider that mostof the tested specimens had experienced corrosion before starting the treatments, since the concretewas admixed with 2% Cl´ relative to cement mass; and all the specimens were subjected to a severechloride load during the 24-week treatments. In these conditions it is practically impossible to obtain apermanent repassivation of steel with temporary electrochemical rehabilitation methods [44,45]; evenCP or CPrev treatments need to be continuously applied for maintaining the protective conditionsfor steel.
Coatings 2016, 6, 32 15 of 21
are only effective for preventative treatments of reinforced concrete not previously contaminated
with chlorides [25,26], while the three specimens of Figure 13 started the 24‐week trials with an initial
Cl− content of about 1% (relative to cement mass). Indeed, ECE was applied to specimens manufactured
with 2% Cl− relative to cement mass. With the previously described conditions, ECE was able to
reduce the Cl− content of the specimens to approximately 51% of their initial content (51% averaged
ECE efficiency).
The evolution of the Ecorr values of the specimens not previously treated with ECE, Figure 14,
shows that in this case the CP treatment with 15 mA/m2 current density (A) was not able to protect
steel from corrosion, since the corrosion potential of steel in A reached values below −400 mV in two
weeks, and its values were only slightly higher than those of the non‐CP‐treated reference specimen
(R). This different behavior, when compared to the observations of the precedent paragraph, can be
explained by taking into account that the A and R specimens started the 24‐week experiments with
an initial Cl− content of 2% (relative to cement mass). To this must be added the large progressive Cl−
contamination due to the weekly salting regime. On the other hand, the CPrev treatment with 2
mA/m2 current density, given to the initially Cl− free specimen (B) allowed it to maintain values of
Ecorr higher than −400 mV, and clearly higher than those corresponding to the non‐CPrev‐treated
reference specimen (P), up to the current interruption at the 13th week. This is a further confirmation
of the tolerance increase to chloride‐induced corrosion for CPrev treated steel (current densities in
the range 0.5–2 mA/m2 of concrete surface). These low cathodic currents, applied from the beginning
of the service life of a reinforced concrete structure, decrease the steel potential, thus leading to
important increases in the critical chloride content for pitting corrosion of steel [25,26].
From the observation of the evolution of the steel corrosion rates during the 24‐week treatments
(Figures 15 and 16), little difference appears between the behavior of the treated specimens (EA, EB,
A, B) and their corresponding reference specimens (ER, R, P). Furthermore, in all cases icorr values
higher than 0.1–0.2 μA/cm2 were obtained, which means that in no case was a repassivation of steel
obtained in open‐circuit conditions. A correct interpretation of these observations needs to consider
that most of the tested specimens had experienced corrosion before starting the treatments, since the
concrete was admixed with 2% Cl− relative to cement mass; and all the specimens were subjected to
a severe chloride load during the 24‐week treatments. In these conditions it is practically impossible
to obtain a permanent repassivation of steel with temporary electrochemical rehabilitation methods
[44,45]; even CP or CPrev treatments need to be continuously applied for maintaining the protective
conditions for steel.
Figure 15. Evolution of icorr during the treatments post ECE. EA: ECE+CP; EB: ECE+CPrev; ER: treated
only with ECE. All of them were subjected to Cl− contamination during the 24 weeks. Current density
values: CP: 15 mA/m2, CPrev: 2 mA/m2, both related to exposed concrete surface. Adapted from [27].
Figure 15. Evolution of icorr during the treatments post ECE. EA: ECE+CP; EB: ECE+CPrev; ER: treatedonly with ECE. All of them were subjected to Cl´ contamination during the 24 weeks. Current densityvalues: CP: 15 mA/m2, CPrev: 2 mA/m2, both related to exposed concrete surface. Adapted from [27].

Coatings 2016, 6, 32 16 of 21Coatings 2016, 6, 32 16 of 21
Figure 16. Evolution of icorr during the CP and CPrev treatments, without previous ECE. A: CP; B:
CPrev; R (2% Cl− in the mix, not CP treated): reference specimen for A; P (no Cl− in the mix, not CPrev
treated): reference specimen for B. All of them were subjected to Cl− contamination during the 24
weeks. Current density values: CP: 15 mA/m2, CPrev: 2 mA/m2, both related to exposed concrete
surface. Adapted from [27].
To verify the effectiveness of CP and CPrev treatments for protecting steel from corrosion, the
“100 mV decay” criterion [41] was used, as stated in Section 2.2.4. Figure 17 shows the evolution of
the ∆Edecay values for all the specimens in Table 3 during the 24‐week experiments. Regarding the EA
specimen (ECE+CP), the protection conditions of steel were kept steady for 11 weeks because of
cathodic current circulation, despite external Cl− loading. On the other hand, the ∆Edecay values of the
A specimen (CP only) practically never reached the threshold value of 100 mV. These observations
are in good agreement with the observed evolution of the Ecorr values (Figures 13 and 14), and are
evidence that cathodic protection of 15 mA/m2 current density (relative to concrete surface) is able to
stabilise protective conditions for the steel reinforcement if the initial Cl− content of the specimen is
about 1% (EA). In the case of the specimen with an initial Cl− content of about 2% (A), a higher current
density would be needed for reaching the protection conditions.
Figure 17. Evolution of ∆Edecay during the CP or CPrev treatments. A: CP; B: CPrev; EA: ECE+CP; EB:
ECE+CPrev. All of them were subjected to Cl− contamination during the 24 weeks. The electrochemical
treatments were interrupted between week 13 and week 17. Adapted from [27].
Figure 16. Evolution of icorr during the CP and CPrev treatments, without previous ECE. A: CP;B: CPrev; R (2% Cl´ in the mix, not CP treated): reference specimen for A; P (no Cl´ in the mix, notCPrev treated): reference specimen for B. All of them were subjected to Cl´ contamination during the24 weeks. Current density values: CP: 15 mA/m2, CPrev: 2 mA/m2, both related to exposed concretesurface. Adapted from [27].
To verify the effectiveness of CP and CPrev treatments for protecting steel from corrosion, the“100 mV decay” criterion [41] was used, as stated in Section 2.2.4. Figure 17 shows the evolution ofthe ∆Edecay values for all the specimens in Table 3 during the 24-week experiments. Regarding theEA specimen (ECE+CP), the protection conditions of steel were kept steady for 11 weeks because ofcathodic current circulation, despite external Cl´ loading. On the other hand, the ∆Edecay values of theA specimen (CP only) practically never reached the threshold value of 100 mV. These observationsare in good agreement with the observed evolution of the Ecorr values (Figures 13 and 14), and areevidence that cathodic protection of 15 mA/m2 current density (relative to concrete surface) is ableto stabilise protective conditions for the steel reinforcement if the initial Cl´ content of the specimenis about 1% (EA). In the case of the specimen with an initial Cl´ content of about 2% (A), a highercurrent density would be needed for reaching the protection conditions.
Coatings 2016, 6, 32 16 of 21
Figure 16. Evolution of icorr during the CP and CPrev treatments, without previous ECE. A: CP; B:
CPrev; R (2% Cl− in the mix, not CP treated): reference specimen for A; P (no Cl− in the mix, not CPrev
treated): reference specimen for B. All of them were subjected to Cl− contamination during the 24
weeks. Current density values: CP: 15 mA/m2, CPrev: 2 mA/m2, both related to exposed concrete
surface. Adapted from [27].
To verify the effectiveness of CP and CPrev treatments for protecting steel from corrosion, the
“100 mV decay” criterion [41] was used, as stated in Section 2.2.4. Figure 17 shows the evolution of
the ∆Edecay values for all the specimens in Table 3 during the 24‐week experiments. Regarding the EA
specimen (ECE+CP), the protection conditions of steel were kept steady for 11 weeks because of
cathodic current circulation, despite external Cl− loading. On the other hand, the ∆Edecay values of the
A specimen (CP only) practically never reached the threshold value of 100 mV. These observations
are in good agreement with the observed evolution of the Ecorr values (Figures 13 and 14), and are
evidence that cathodic protection of 15 mA/m2 current density (relative to concrete surface) is able to
stabilise protective conditions for the steel reinforcement if the initial Cl− content of the specimen is
about 1% (EA). In the case of the specimen with an initial Cl− content of about 2% (A), a higher current
density would be needed for reaching the protection conditions.
Figure 17. Evolution of ∆Edecay during the CP or CPrev treatments. A: CP; B: CPrev; EA: ECE+CP; EB:
ECE+CPrev. All of them were subjected to Cl− contamination during the 24 weeks. The electrochemical
treatments were interrupted between week 13 and week 17. Adapted from [27].
Figure 17. Evolution of ∆Edecay during the CP or CPrev treatments. A: CP; B: CPrev; EA: ECE+CP; EB:ECE+CPrev. All of them were subjected to Cl´ contamination during the 24 weeks. The electrochemicaltreatments were interrupted between week 13 and week 17. Adapted from [27].

Coatings 2016, 6, 32 17 of 21
Regarding the CPrev treated specimens (cathodic current density 2 mA/m2 relative to concretesurface), Specimen B showed ∆Edecay values higher than 100 mV up to the current switch off at the13th week, confirming the capacity of continuously applied CPrev treatments to keep steel protectionconditions for an initially Cl´-free reinforced concrete, despite extensive external Cl´ load [25,26,46,47].On the other hand, such a low current density is unable to protect steel if concrete is previouslycontaminated at a level of about 1% relative to cement mass, as shown for specimen EB (ECE+CPrev)in Figure 17.
Given that after 24 weeks of treatments, including rest periods between the 13th and 17th weeks,the reinforcements had completely lost their protection conditions, and a CP of 15 mA/m2 was unableto restore the protective conditions (Figure 17), the second phase was started. The external Cl´ loadwas discontinued since all the specimens had reached very high Cl´ contents (see Table 7).
Table 7. Final averaged chloride contents (expressed in % Cl´ relative to cement mass) at the end of24 weeks of exposure to a severe Cl´ load (first phase of CP and CPrev treatments).
Specimen Initial Cl´ Content(% ref. cem. mass)
ElectrochemicalTreatment Previous to
the 24-week First Phase
ElectrochemicalTreatment during the24-week First Phase
Final Averaged*Cl´ Content
(% ref. cem. mass)
P 0 – – 4.93R 2 – – 6.08
ER 2 ECE – 4.26A 2 – CP 5.39B 0 – CPrev 3.94
EA 2 ECE CP 3.41EB 2 ECE CPrev 3.42
* The final Cl´ content was calculated as the mean value of those found in the Cl´ content profile determinedthrough the concrete cover zone (20 mm width).
In these conditions, CP was applied with higher current densities. The question was if it would bepossible to recover the protection conditions of steel by increasing the current density to the appropriatevalue. In the beginning of this last phase, current density was set at 20 mA/m2. After four weeksof operation 100 mV of ∆Edecay was not reached, i.e. the protection conditions were not obtained(Figure 18). Neither was success obtained in a second attempt with 25 mA/m2 (data not shown inFigure 18). Finally, a third step of 40 mA/m2 was set. In this case, after four weeks, the rule of 100 mVof ∆Edecay was achieved for EA, A, and B specimens.
Coatings 2016, 6, 32 17 of 21
Regarding the CPrev treated specimens (cathodic current density 2 mA/m2 relative to concrete
surface), Specimen B showed ∆Edecay values higher than 100 mV up to the current switch off at the
13th week, confirming the capacity of continuously applied CPrev treatments to keep steel protection
conditions for an initially Cl−‐free reinforced concrete, despite extensive external Cl− load
[25,26,46,47]. On the other hand, such a low current density is unable to protect steel if concrete is
previously contaminated at a level of about 1% relative to cement mass, as shown for specimen EB
(ECE+CPrev) in Figure 17.
Given that after 24 weeks of treatments, including rest periods between the 13th and 17th weeks,
the reinforcements had completely lost their protection conditions, and a CP of 15 mA/m² was unable
to restore the protective conditions (Figure 17), the second phase was started. The external Cl− load
was discontinued since all the specimens had reached very high Cl− contents (see Table 7).
Table 7. Final averaged chloride contents (expressed in % Cl− relative to cement mass) at the end of
24 weeks of exposure to a severe Cl− load (first phase of CP and CPrev treatments).
Specimen Initial Cl− Content
(% ref. cem. mass)
Electrochemical
Treatment previous to
the 24‐week First Phase
Electrochemical
Treatment during the
24‐week First Phase
Final Averaged*
Cl− Content
(% ref. cem. mass)
P 0 – – 4.93
R 2 – – 6.08
ER 2 ECE – 4.26
A 2 – CP 5.39
B 0 – CPrev 3.94
EA 2 ECE CP 3.41
EB 2 ECE CPrev 3.42
* The final Cl− content was calculated as the mean value of those found in the Cl− content profile
determined through the concrete cover zone (20 mm width).
In these conditions, CP was applied with higher current densities. The question was if it would
be possible to recover the protection conditions of steel by increasing the current density to the
appropriate value. In the beginning of this last phase, current density was set at 20 mA/m². After four
weeks of operation 100 mV of ∆Edecay was not reached, i.e. the protection conditions were not obtained
(Figure 18). Neither was success obtained in a second attempt with 25 mA/m2 (data not shown in
Figure 18). Finally, a third step of 40 mA/m² was set. In this case, after four weeks, the rule of 100 mV
of ∆Edecay was achieved for EA, A, and B specimens.
Figure 18. Evolution of ∆Edecay during Phase 2 of CP. First step of four weeks with 20 mA/m2 of current
density, and third step with 40 mA/m². Specimens A, B, EA, and EB. Adapted from [27].
Figure 18. Evolution of ∆Edecay during Phase 2 of CP. First step of four weeks with 20 mA/m2 ofcurrent density, and third step with 40 mA/m2. Specimens A, B, EA, and EB. Adapted from [27].
Coatings 2016, 6, 32 18 of 21
Moreover, protection conditions were verified with the measurement of depolarization potentialdifference values seven days after switch-off [41]. In fact, more than 150 mV of ∆Edecay was reachedafter seven days (209 mV for EA, 211 mV for A and 153 mV for B). This efficiency of CP is similar to thatobtained by other researchers [10,42]. However, this was not the case for EB. After four weeks with thehighest cathodic current density, the protection conditions were not recovered for this latter specimen.
4. Conclusions
Based on the results and observations obtained from this research, the following conclusions havebeen made:
1. For ECE treatments on structural concrete elements, including vertical or those of complex shape,the use of a GCP sprayed coating as anode is feasible, and achieves a similar efficiency (about80%) to a conventional reference anode (Ti-RuO2 mesh) when passing a typical electric chargedensity of 5 MC/m2. Also, a substantial proportion of Cl´ was removed with a low appliedcharge density, achieving 51% ECE efficiency at 1.5 MC/m2.
2. The results provide confirmation regarding the shape effect of the structural elements on the ECEefficiency. The typical spatial distribution of the steel rebar within certain concrete elements, forexample vertical columns of the rectangular section, gives rise to an anisotropic configurationof the electric flow lines. This leads to variations in the local ECE efficiencies found at differentsampling points for such types of reinforced concrete elements. The use of GCP anodes, ratherthan the more commonly employed Ti-RuO2 mesh embedded between polymeric layers, appearsto reduce the differences found in the local ECE efficiencies due to the shape effect. This may bedue to the nature of the electrolytic contact between the GCP coating and the concrete surface,which may avoid possible zones of high electric resistance due to defective contact between thesomewhat rigid and springy metal mesh anodic system and the concrete surface.
3. According to the results of the CP applied with a GCP coating as anode, this electrochemicaltechnique is able to provide protection to steel, despite severe internal and external chloridecontamination, provided an appropriate current density value is selected based on the Cl´
content present. Its ability to recover the lost protection conditions through an increase of currentdensity has also been demonstrated.
4. Continuously applied CPrev (at a current density of 2 mA/m2) with a GCP coating as anode isable to maintain a conventional, initially Cl´-free concrete in a protection condition despite beingexposed to a severe Cl´ load. However, subject to the same experimental external chloride load,it is unable to recover protection conditions if the initial Cl´ content is equal to or higher than 1%relative to cement mass.
5. A GCP coating allows the application of a combined treatment of ECE followed by CP, changingonly the current density provided by the DC power source. No damage was observed in thisanode after the full combined process. This combination has been shown to be capable ofmaintaining or recovering protection conditions if the cathodic current density is set to theappropriate value according to the Cl´ content present.
6. Given the novel nature of the GCP coating and its relatively short track record, it is recommendedthat further research is carried out to assess the GCP coating in a range of operating conditions tofully ascertain its suitability for practical applications.
Acknowledgments: This research was funded by the Spanish Ministerio de Economía y Competitividad (andformerly by the Spanish Ministerio de Ciencia e Innovación) and ERDF (European Regional Development Fund)through projects BIA2010-20548 and MAT2009-10866, and also through the project PROMETEO/2013/035 ofGeneralitat Valenciana (Spain).
Author Contributions: J. Carmona performed the experiments in the framework of his Ph.D. thesis, co-supervisedby P. Garcés and M.A. Climent, and contributed to the redaction of the article; P. Garcés conceived the idea ofusing GCP coatings for different applications (multifunctional material concept), the method of application of
Coatings 2016, 6, 32 19 of 21
the coatings, and details of the ECE experiments; M.A. Climent conceived the methods for determining the ECEefficiencies and the experiments on CP and CPrev, and contributed to the redaction of the article. The analysis ofdata was performed by the whole team.
Conflicts of Interest: The authors declare no conflict of interest.
References
1. Lankard, D.R.; Slater, J.E.; Hedden, W.A.; Niesz, D.E. Neutralization of Chloride in Concrete. In BattelleColumbus Laboratories; Report No. FHWA-RD-76-60; Federal Highway Administration: Washington, DC,USA, 1975; p. 143.
2. Slater, J.E.; Lankard, D.R.; Moreland, P.J. Electrochemical removal of chlorides from concrete bridge decks.Mater. Perform. 1976, 15, 21–26.
3. Tritthart, J. Electrochemical Chloride Removal: An Overview and Scientific Aspects; The American Ceramic Society:Westerville, OH, USA, 1998; pp. 401–441.
4. Mietz, J. Electrochemical Rehabilitation Methods for Reinforced Concrete Structures: A State of the ArtReport. In Publication Number 24 of the European Federation of Corrosion; IOM Communications Ltd.: London,UK, 1998; p. 57.
5. Andrade, C.; Castellote, M.; Alonso, C. An overview of electrochemical realkalisation and chlorideextraction. In Rehabilitation of Structures, Proceedings of 2nd International RILEM/CSIRO/ACRA Conference,Melbourne, Australia, 21–23 September 1998; Ho, D.W.S., Godson, I., Collins, F., Eds.; RILEM: Melbourne,Australia, 1998; pp. 1–12.
6. Pedeferri, P.; Bertolini, L. La Durabilità del Calcestruzzo Armato; McGraw-Hill: Milano, Italy, 2000. (In Italian)7. Bertolini, L.; Elsener, B.; Pedeferri, P.; Polder, R. Corrosion of Steel in Concrete; Wiley-Vch.: Weinheim,
Germany, 2004.8. Climent, M.A.; Sánchez de Rojas, M.J.; de Vera, G.; Garcés, P. Effect of type of anodic arrangements on
efficiency of electrochemical chloride removal from concrete. ACI Mater. J. 2006, 103, 243–250.9. Glass, G.K.; Chadwick, J.R. An investigation into the mechanisms of protection afforded by a cathodic
current and the implications for advances in the field of cathodic protection. Corros. Sci. 1994, 36, 2193–2209.[CrossRef]
10. Christodoulou, C.; Glass, G.; Webb, J.; Austin, S.; Goodier, C. Assessing the long term benefits of impressedcurrent cathodic protection. Corros. Sci. 2010, 52, 2671–2679. [CrossRef]
11. Fu, X.; Chung, D.D.L. Carbon fiber reinforced mortar as an electrical contact material for cathodic protection.Cem. Concr. Res. 1995, 25, 689–694. [CrossRef]
12. Hou, J.; Chung, D.D.L. Cathodic protection of steel reinforced concrete facilitated by using carbon fiberreinforced mortar or concrete. Cem. Concr. Res. 1997, 27, 649–656. [CrossRef]
13. DePeuter, F.; Lazzari, L. New conductive overlay for CP in concrete: Results of long term testing. InProceedings of Corrosion/93-National Association of Corrosion Engineers Annual Conference, New Orleans,LA, USA, 7–12 March 1993; no. 325.
14. Bertolini, L.; Bolzoni, F.; Pastore, T.; Pedeferri, P. Effectiveness of a conductive cementitious mortar anode forcathodic protection of steel in concrete. Cem. Concr. Res. 2004, 34, 681–694. [CrossRef]
15. Chung, D.D.L. Electrically conductive cement-based materials. Adv. Cem. Res. 2004, 16, 167–176. [CrossRef]16. Garcés, P.; Fraile, J.; Vilaplana-Ortego, E.; Cazorla, D.; Alcocel, E.G.; Andión, L.G. Effects of carbon fibres on
the mechanical properties and corrosion levels of reinforced Portland cement mortars. Cem. Concr. Res. 2005,35, 324–331. [CrossRef]
17. Garcés, P.; Andión, L.G.; de la Varga, I.; Catalá, G.; Zornoza, E. Corrosion of steel reinforcement in structuralconcrete with carbon material addition. Corros. Sci. 2007, 49, 2557–2566. [CrossRef]
18. Zornoza, E.; Catalá, G.; Jiménez, F.; Andión, L.G.; Garcés, P. Electromagnetic interference shielding withPortland cement paste containing carbon materials and processed fly ash. Mater. Constr. 2010, 60, 21–32.
19. Garcés, P.; Zornoza, E.; Alcocel, E.G.; Galao, Ó.; Andión, L.G. Mechanical properties and corrosion of CACmortars with carbon fibers. Constr. Build. Mater. 2012, 34, 91–96. [CrossRef]
20. Han, B.; Yu, X.; Ou, J. Multifunctional and Smart Carbon Nanotube Reinforced Cement-Based Materials.In Nanotechnology in Civil Infrastructure: A Paradigm Shift; Gopalakrishnan, K., Birgisson, B., Taylor, P.,Attoh-Okine, N.O., Eds.; Springer: Berlin, Heidelberg, Germany, 2011; pp. 1–47.

Coatings 2016, 6, 32 20 of 21
21. Pérez, A.; Climent, M.A.; Garcés, P. Electrochemical extraction of chlorides from reinforced concrete using aconductive cement paste as the anode. Corros. Sci. 2010, 52, 1576–1581. [CrossRef]
22. Cañón, A.; Garcés, P.; Climent, M.A.; Carmona, J.; Zornoza, E. Feasibility of electrochemical chlorideextraction from structural reinforced concrete using a sprayed conductive graphite powder-cement as anode.Corros. Sci. 2013, 77, 128–134. [CrossRef]
23. Garcés, P.; Sánchez de Rojas, M.J.; Climent, M.A. Effect of the reinforcement bar arrangement on the efficiencyof electrochemical chloride removal technique applied to the reinforced concrete structures. Corros. Sci. 2006,48, 531–545. [CrossRef]
24. Carmona, J.; Climent, M.A.; Antón, C.; de Vera, G.; Garcés, P. Shape effect of electrochemical chlorideextraction in structural reinforced concrete elements using a new cement-based anodic system. Materials2015, 8, 2901–2917. [CrossRef]
25. Pedeferri, P. Cathodic protection and cathodic prevention. Constr. Build. Mat. 1996, 10, 391–402. [CrossRef]26. Bertolini, L.; Bolzoni, F.; Pedeferri, P.; Lazzari, L.; Pastore, T. Cathodic protection and cathodic prevention in
concrete principles and applications. J. Appl. Electrochem. 1998, 28, 1321–1331. [CrossRef]27. Carmona, J.; Garcés, P.; Climent, M.A. Efficiency of a conductive cement-based anodic system for the
application of cathodic protection, cathodic prevention and electrochemical chloride extraction to controlcorrosion in reinforced concrete structures. Corros. Sci. 2015, 96, 102–111. [CrossRef]
28. Comisión Permanente del Hormigón. Instrucción de Hormigón Estructural EHE-08 (Spanish Code on StructuralConcrete EHE-08); Ministerio de Fomento: Madrid, Spain, 2008. (In Spanish)
29. UNE EN 12390–3:2009 Ensayos de Hormigón Endurecido. Parte 3: Determinación de la Resistencia a Compresión deProbetas (Testing Hardened Concrete–Part 3: Compressive Strength of Test Specimens); Asociación Española deNormalización y Certificación AENOR: Madrid, Spain, 2009. (In Spanish)
30. UNE 83980:2014 Durabilidad del Hormigón. Métodos de Ensayo. Determinación de la Absorción de Agua, laDensidad y la Porosidad Accesible al Agua del Hormigón (Concrete Durability. Test Methods. Determination of theWater Absorption, Density and Accessible Porosity for Water in Concrete); Asociación Española de Normalizacióny Certificación AENOR: Madrid, Spain, 2014. (In Spanish)
31. UNE EN 12390–7:2009 Ensayos de HormigóN Endurecido. Parte 7: Densidad del HormigóN Endurecido (TestingHardened Concrete–Part 7: Density of Hardened Concrete); Asociación Española de Normalización y CertificaciónAENOR: Madrid, Spain, 2009. (In Spanish)
32. CEN/TS 14038–2 Technical Specification. Electrochemical Re-alkalization and Chloride Extraction Treatments forReinforced Concrete–Part 2: Chloride Extraction; European Committee of Standardization CEN: Brussels,Belgium, 2011.
33. Elsener, B.; Molina, M.; Böhni, H. The electrochemical removal of chlorides from reinforced concrete.Corros. Sci. 1993, 35, 1563–1570. [CrossRef]
34. Elsener, B.; Angst, U. Mechanism of electrochemical chloride removal. Corros. Sci. 2007, 49, 4504–4522.[CrossRef]
35. Sánchez de Rojas, M.J.; Garcés, P.; Climent, M.A. Electrochemical extraction of chlorides from reinforcedconcrete: variables affecting treatment efficiency. Mater. Constr. 2006, 56, 17–26.
36. Vennesland, Ø.; Climent, M.A.; Andrade, C. Recommendation of RILEM TC 178-TMC: Testing and modelingchloride penetration in concrete. Methods for obtaining dust samples by means of grinding concrete in orderto determine the chloride concentration profile. Mater. Struct. 2013, 46, 337–344.
37. Climent, M.A.; Viqueira, E.; de Vera, G.; López, M.M. Analysis of acid-soluble chloride in cement, mortar andconcrete by potentiometric titration without filtration steps. Cem. Concr. Res. 1999, 29, 893–898. [CrossRef]
38. Climent, M.A.; de Vera, G.; Viqueira, E.; López, M.M. Generalization of the possibility of eliminating thefiltration step in the determination of acid-soluble chloride content in cement and concrete by potentiometrictitration. Cem. Concr. Res. 2004, 34, 2291–2295. [CrossRef]
39. Galao, O.; Baeza, F.J.; Zornoza, E.; Garcés, P. Strain and damage sensing properties on multifunctional cementcomposites with CNF. Cem. Concr. Comp. 2014, 46, 90–98. [CrossRef]
40. Andrade, C.; Alonso, C.; Gulikers, J.; Polder, R.; Cigna, R.; Vennesland, Ø.; Salta, M. Test methods for on-sitereinforcement corrosion rate measurement of steel reinforcement in concrete by means of the PolarizationResistance method. RILEM Recommendation of TC-154. Electrochemical Techniques for measuring metalliccorrosion. Mater. Struct. 2004, 37, 623–643. [CrossRef]
41. ISO 12696: 2012(en) Cathodic Protection of Steel in Concrete; ISO: Geneva, Switzerland, 2012.

Coatings 2016, 6, 32 21 of 21
42. Glass, G.K.; Hassanein, A.M.; Buenfeld, N.R. Cathodic protection afforded by an intermittent current appliedto reinforced concrete. Corros. Sci. 2001, 43, 1111–1131. [CrossRef]
43. Pellegrini-Cervantes, M.J.; Barrios-Durstewitz, C.P.; Núñez-Jaquez, R.E.; Almeraya-Calderón, F.;Rodríguez-Rodríguez, M.; Castorena-González, J.H.; Garcés-Velázquez, E.; Maldonado-Bandala, E.E.;Nieves-Mendoza, D.; García-Contreras, J.P. Conductive cement pastes with carbon fibers as anodes inthe electrochemical chloride extraction. Int. J. Electrochem. Sci. 2015, 10, 3830–3840.
44. Miranda, J.M.; González, J.A.; Cobo, A.; Otero, E. Several questions about electrochemical rehabilitationmethods for reinforced concrete structures. Corros. Sci. 2006, 48, 2172–2188. [CrossRef]
45. Miranda, J.M.; Cobo, A.; Otero, E.; González, J.A. Limitations and advantages of electrochemical chlorideremoval in corroded reinforced concrete structures. Cem. Concr. Res. 2007, 37, 596–603. [CrossRef]
46. Liu, Y.; Shi, X. Modeling cathodic prevention for unconventional concrete in salt-laden environment.Anti-Corros. Methods Mater. 2012, 59, 121–131. [CrossRef]
47. Dugarte, M.; Sagüés, A.A.; Williams, K. Cathodic prevention for reinforcing steel in cracked concrete ofchloride contaminated structures. In Proceedings of CORROSION 2015 Conference, NACE-2015-6102,NACE International, Houston, TX, USA, 15–19 March 2015; p. 11.
© 2016 by the authors; licensee MDPI, Basel, Switzerland. This article is an open accessarticle distributed under the terms and conditions of the Creative Commons Attribution(CC-BY) license (http://creativecommons.org/licenses/by/4.0/).