graphs and their uses - · pdf filewhat is graph? ya graph is a convenient method used to...
TRANSCRIPT
GRAPHS AND THEIR USESGRAPHS AND THEIR USES
Vikasana – Bridge Course 2012
In this chapter, we shall consider theIn this chapter, we shall consider the following aspects about graphs.
1. What is graph?2. How to plot a graph?3. Importance of graph.p g p
Vikasana – Bridge Course 2012

What is Graph?
A graph is a convenient method used to present pictorially the information aboutpresent pictorially the information about variety of events. By looking at the graph, we can extract many information about certain events. For example, let us consider the graphs represented by vertical bars providing information about an one day cricket match.
Vikasana – Bridge Course 2012

ExampleA sample graph providing information about first
10 overs is shown in the following figure
10
12Team A team B
4
6
8
0
2
4
Vikasana – Bridge Course 2012
01 2 3 4 5 6 7 8 9 1

ExampleIn the example mentioned above, numbers marked along X-axis shows gthe number of overs bowled and that along the Y-axis shows the number of gruns scored. The two sets of vertical bars representThe two sets of vertical bars represent runs scored in each over by team-1 and team-2 respectively.
Vikasana – Bridge Course 2012
team 2 respectively.

If we consider the complete graph, then by looking at the graph various features of the match can be analyzed like, At what stage of the math twoAt what stage of the math two teams are evenly balanced, At what stage one team took advantage over the other, etc.
Vikasana – Bridge Course 2012
g ,

Similarly one can plot such graphs in connection with rain fall in different months of a calendar yearState wise number of seats won byState wise number of seats won by national parties during a lok sabha
l ti telection, etc.
Vikasana – Bridge Course 2012

pi‐ chart
You are also familiar with pi-chart. The pi-chart is equivalent to aThe pi chart is equivalent to a bared graph.
All the information contained in a bared graph, like the one shown in g p ,fig-2, can be transferred into a pi-chart
Vikasana – Bridge Course 2012
chart.

pi‐ chartRuns scored in each over
12344567789
Vikasana – Bridge Course 2012
10

How to plot a pi‐chart?In order to understand how to draw an equivalent pi-chart corresponding to a q p p gbared graph, let us consider the following example of rain fall from Jan. g pto June of a particular calendar year at a given place.g
Vikasana – Bridge Course 2012
How to plot a pi‐chart?Table-1 below provides the rain fall record at the given place. Where we g phave used X=1,2,….,6 to indicate the monthsX 1,2,….,6 to indicate the months Jan.,…..,June (independent variable) of a calendar year and Y to indicatea calendar year and Y to indicate amount of rain fall in cm. (dependent variable).
Vikasana – Bridge Course 2012
variable).

Bared graph & an equivalent pi‐chart for the given data
X 1 2 3 4 5 6
y 2 1 2 3 4 6
Vikasana – Bridge Course 2012

Bared graph
RAIN FALL RECORD
567
in c
m.)
234
IN F
ALL
(
01
1 2 3 4 5 6
RAI
Vikasana – Bridge Course 2012
MONTHS
Equivalent pi‐chartTo plot a corresponding pi-chart, considerTotal rain fall = ΣY = 2+1+2+3+4+6 = 18Since the total rain fall corresponds toSince the total rain fall corresponds to 360 deg.18cm of rain fall = 360 deg18cm. of rain fall = 360 deg.
Vikasana – Bridge Course 2012

Equivalent pi‐chart1cm. of rain fall = 360/18 = 20deg. Therefore, 2cm.,3cm., 4cm. and 6cm. ofTherefore, 2cm.,3cm., 4cm. and 6cm. of rain fall are respectively correspond to 40, 60, 80 and 120 degrees. Hence the40, 60, 80 and 120 degrees. Hence the equivalent pi-chart may be plotted as shown in the following figure.shown in the following figure.
Vikasana – Bridge Course 2012

Equivalent pi‐chart
1
2
3
4
5
6
Vikasana – Bridge Course 2012

The bared graph or pi-chart is normally used to present the information aboutused to present the information about the events which are not correlated ie., like runs scored in 5th over of a one daylike runs scored in 5th over of a one day match is neither related to that in 4th over nor to that in 6th over. Secondly,over nor to that in 6th over. Secondly, what happens between two consecutive overs is insignificant.
Vikasana – Bridge Course 2012
overs is insignificant.

However in physics, we come across situation where one quantity ‘y’ is q y yrelated to another quantity ‘x’ through a particular law. Then we call ‘x’ to be an pindependent continuous variable and ‘y’ to be the dependent continuous variable.
Vikasana – Bridge Course 2012
The graph showing the relation between x and y is a curve. Such graphs are y g pusually referred to as line graphs.Let us consider some of the examplesLet us consider some of the examples that we come across while we consider a linear motion.a linear motion.
Vikasana – Bridge Course 2012

Linear MotionFollowing are some of the examples of a body describing linear motion1. A car moving along a straight level road2. A body falling freely from certain height3. A metal sphere falling through a column of liquid when it is dropped f th t f l ti l l
Vikasana – Bridge Course 2012
from the top of a long vertical vessel.

Linear MotionIn the examples mentioned above, the kinematical properties like how the p pdistance is changing w.r.t. to time, how the velocity is changing w.r.t. to time y g getc. are different even though they are all describing linear motion.g
Vikasana – Bridge Course 2012
Linear MotionAll the kinematical properties pertaining to a body describing linear motion may y g ybe illustrated conveniently by plotting appropriate graphs.pp p g p
Vikasana – Bridge Course 2012
Linear MotionIf x, v and a denote distance, velocity and acceleration respectively of a body p y ymoving along a straight line and t denotes the time then the graph of x g pagainst t is called x-t graph, v against t is called v-t graph while a against t is g gcalled a-t graph.
Vikasana – Bridge Course 2012
Linear Motion
While plotting a graph we must keep in p g g p pour mind the following points
x v and a are to be specified withx, v and a are to be specified with respect to a frame of reference- a conveniently chosen line with aconveniently chosen line with a reference point ‘O’ called the origin.
Vikasana – Bridge Course 2012

Linear Motion
One side of ‘O’ is positive while the pother side is negative. The positive and negative sides should be decided in gadvance.
Th iti d ti i fThe positive and negative signs of v and a will indicate their directions.
Vikasana – Bridge Course 2012

Linear Motion‐ Equations of motion
You are familiar with the equations of motionv = u+ats = ut+½at2s = ut+½at2in connection with a body describing linear motion here the s mbols ha elinear motion, where the symbols have their usual meaning.
Vikasana – Bridge Course 2012
Linear Motion‐ Equations of motion
Let us apply the above mentioned equations to certain special cases and q panalyze the respective graphs. In particular if we consider the motion punder gravity we may consider g≈10ms-2.we may consider g 10ms 2.
Vikasana – Bridge Course 2012

x‐t, v‐t and a‐t graphs
Ex.1: a body is at restFollowing table gives values of ‘x’ for different ‘t’t (s) 0 10 20 30 40(m) 2 2 2 2 2x(m) 2 2 2 2 2
v(ms-1) 0 0 0 0 0
( 2) 0 0 0 0 0a(ms-2) 0 0 0 0 0
Vikasana – Bridge Course 2012

x‐t, v‐t and a‐t graphs
x-t -GRAPH
2 5
1.5
2
2.5
AN
CE
0
0.5
1
DIS
TA
00 10 20 30 40
TIME
Vikasana – Bridge Course 2012

x‐t, v‐t and a‐t graphsEx.2: a body is moving with constant velocity
t (s) 0 1 2 3 4
x(m) 0 5 10 15 20
v(ms-1) 5 5 5 5 5
( 2) 0 0 0 0 0a(ms-2) 0 0 0 0 0
Vikasana – Bridge Course 2012

x‐t, v‐t and a‐t graphs
v-t graph x-t graph
25
4
5
6
ity 15
20
25
e1
2
3
velo
c
5
10dist
anc
00 1 2 3 4
time
00 1 2 3 4
time
Vikasana – Bridge Course 2012

x‐t, v‐t and a‐t graphs
Ex.3: a body stars from rest and moves with constant acceleration (freely falling body)constant acceleration (freely falling body).
t (s) 0 1 2 3 4( )x(m) 0 5 20 45 80
v(ms-1) 0 10 20 30 40v(ms ) 0 10 20 30 40a(ms-2) 10 10 10 10 10
Vikasana – Bridge Course 2012

x‐t, graphx-t graph
100
6080
100
ance
02040
dist
a
00 1 2 3 4
time
Vikasana – Bridge Course 2012
time

v‐t graphv-t graph
50
304050
ocity
1020ve
lo
00 1 2 3 4
ti
Vikasana – Bridge Course 2012
time
a‐t graphsa-t graph
12
81012
ratio
n
246
acce
ler
00 1 2 3 4
Vikasana – Bridge Course 2012
time
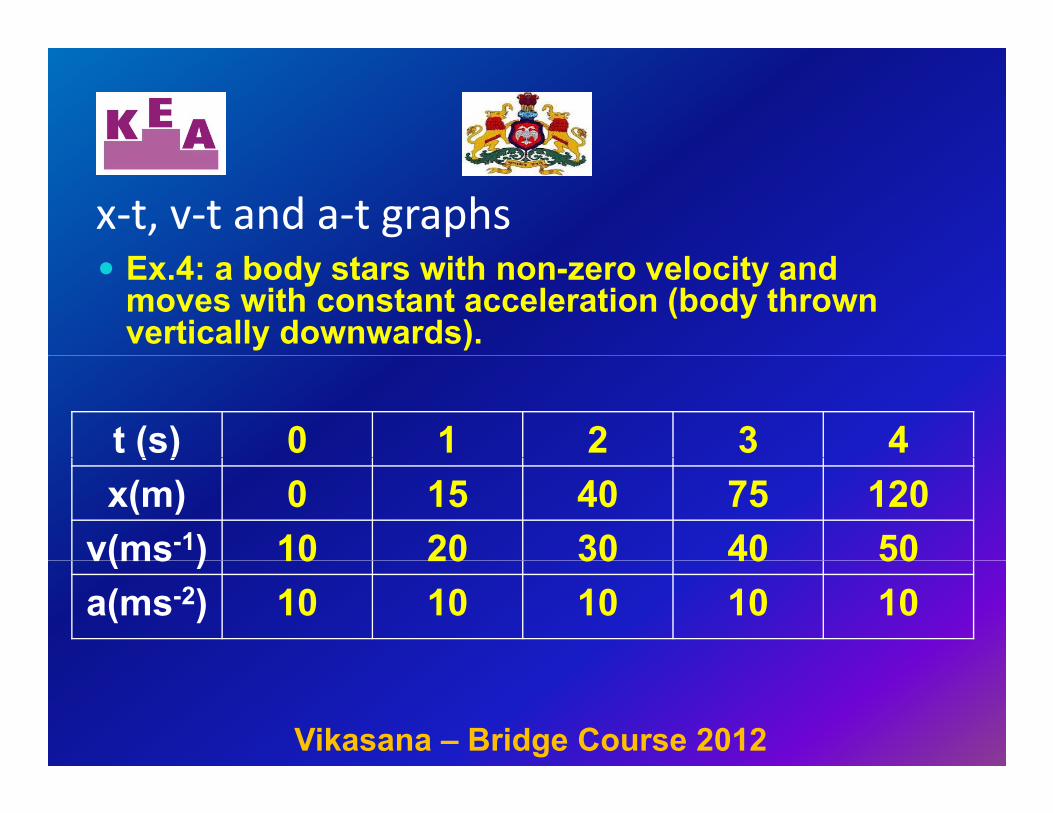
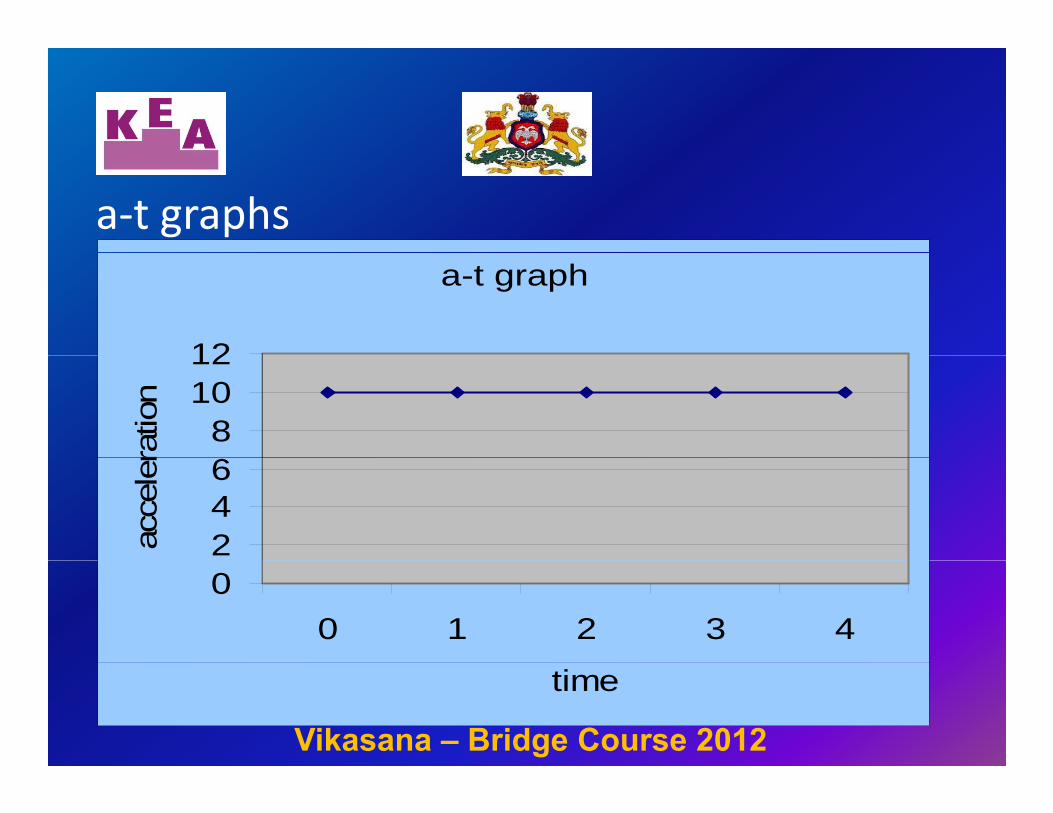
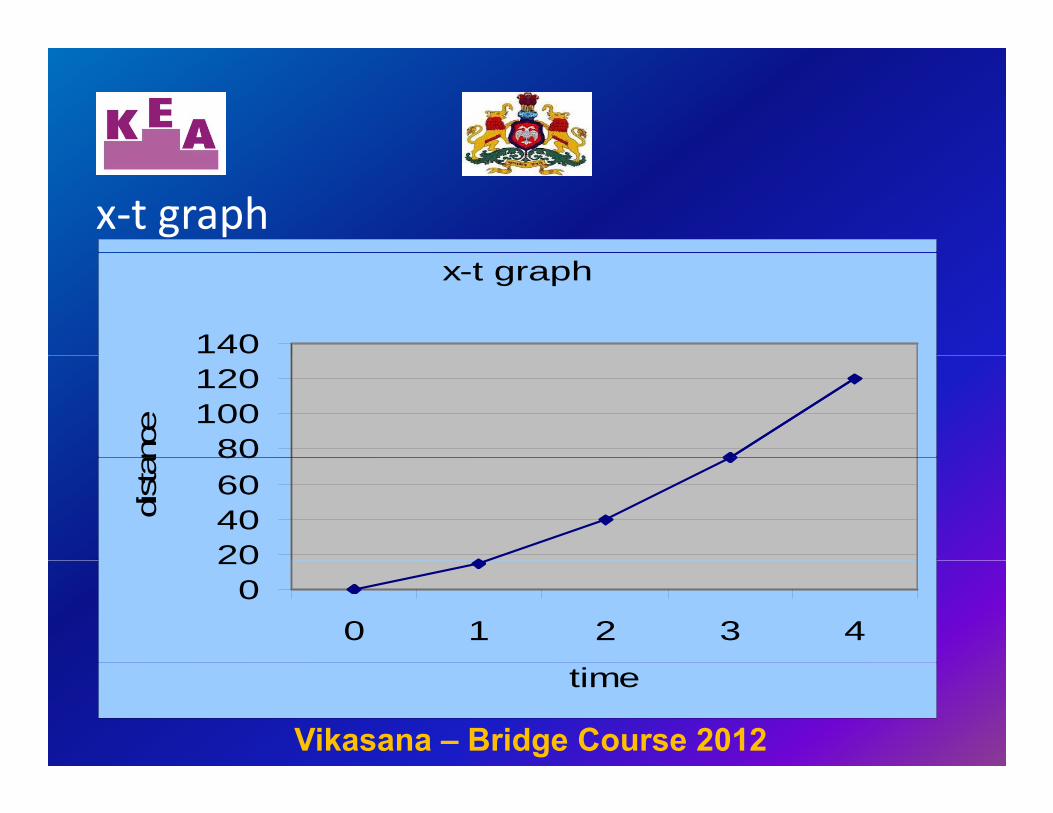
x‐t, v‐t and a‐t graphsEx.4: a body stars with non-zero velocity and moves with constant acceleration (body thrown vertically downwards).
t (s) 0 1 2 3 4( )x(m) 0 15 40 75 120
v(ms-1) 10 20 30 40 50v(ms ) 10 20 30 40 50a(ms-2) 10 10 10 10 10
Vikasana – Bridge Course 2012
x‐t graphx-t graph
140
80100120
ance
20406080
dista
020
0 1 2 3 4
Vikasana – Bridge Course 2012
time
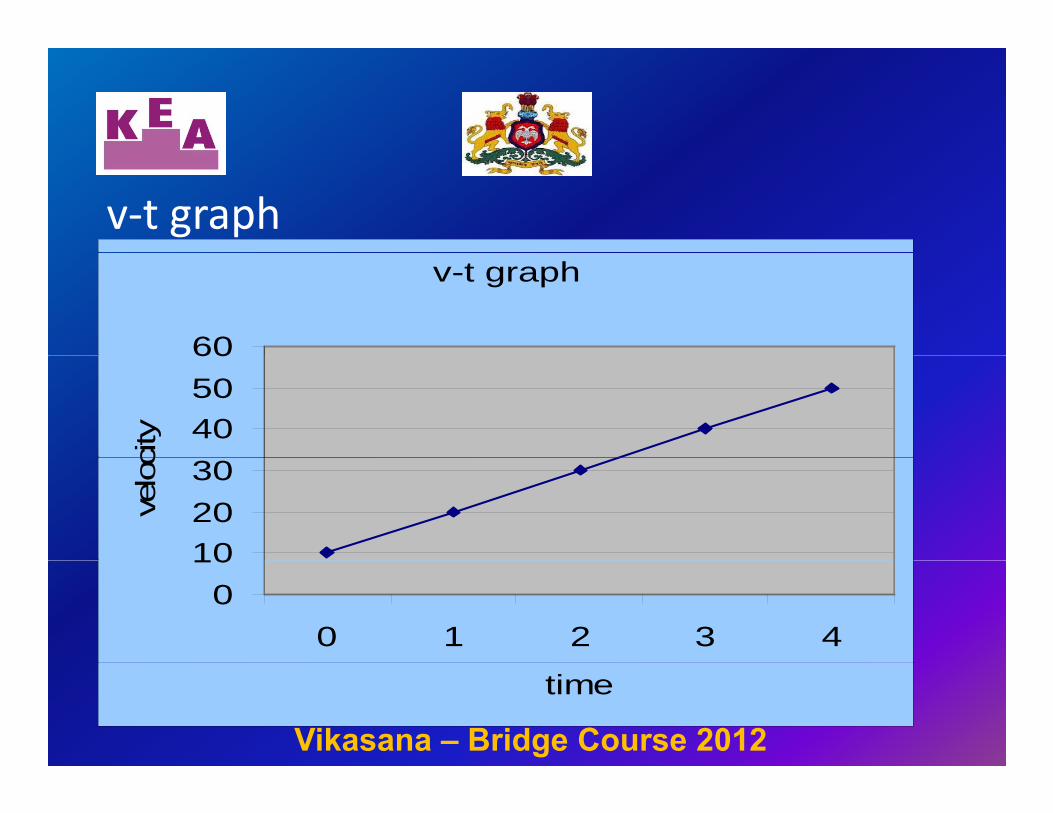
v‐t graphv-t graph
60
405060
city
102030
velo
c
010
0 1 2 3 4
Vikasana – Bridge Course 2012
time

a‐t grapha-t graph
15
10
15
erat
ion
0
5
acce
le
00 1 2 3 4
time
Vikasana – Bridge Course 2012
time

x‐t, v‐t and a‐t graphsEx.5: a body stars with non-zero velocity and moves with constant retardation (body thrown vertically upwards).e t ca y up a ds)
t (s) 0 1 2 3 4x(m) 0 35 60 75 80
v(ms-1) 40 30 20 10 0v(ms ) 40 30 20 10 0a(ms-2) -10 -10 -10 -10 -10
Vikasana – Bridge Course 2012

x‐t graphx-t graph
100
6080
100
ance
2040
dist
a
00 1 2 3 4
ti
Vikasana – Bridge Course 2012
time

v‐t graphv-t graph
50
304050
ocity
01020
velo
00 1 2 3 4
time
Vikasana – Bridge Course 2012
time

a‐t grapha-t graph
0
-5
00 1 2 3 4
atio
n
-10
5
acce
lera
-15
a
Vikasana – Bridge Course 2012
time

Importance of v‐t graphImagine a body starts with non-zero velocity and moves with uniform yacceleration as discussed in ex.4. Let us look at the v-t graph describing this g p gsituation and understand what are the information that we can extract from the graph.
Vikasana – Bridge Course 2012
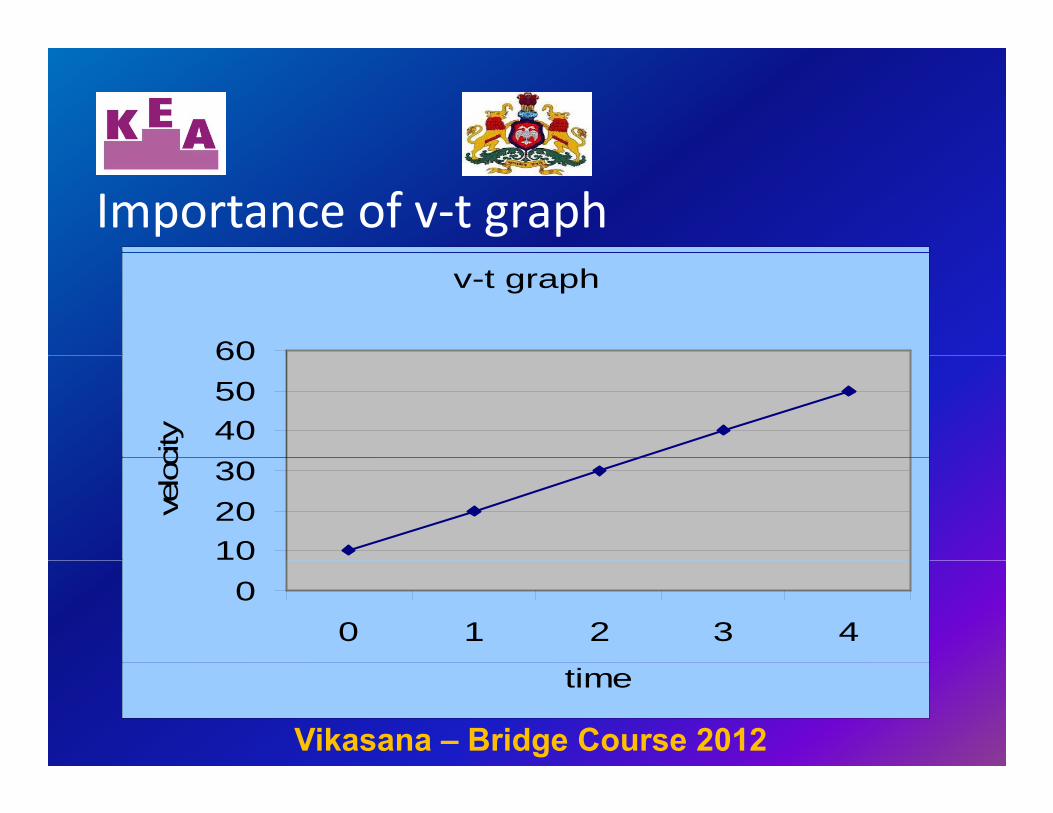
Importance of v‐t graphv-t graph
60
405060
city
102030
velo
c
00 1 2 3 4
Vikasana – Bridge Course 2012
time
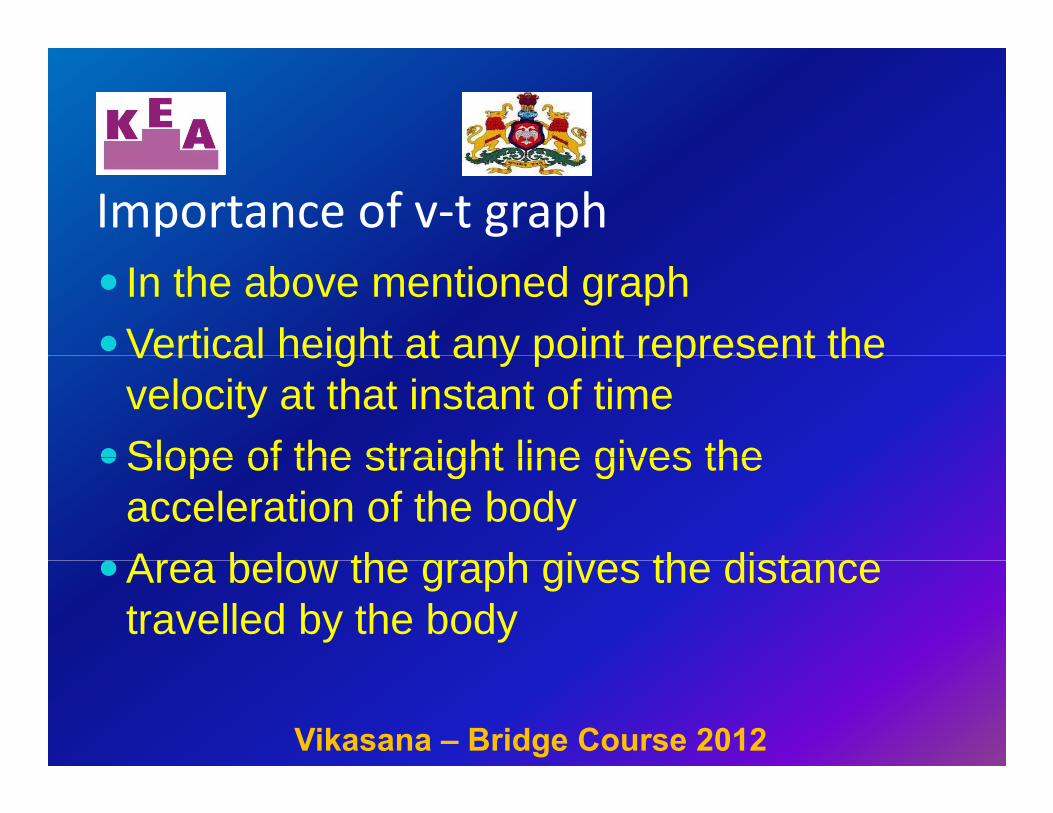
Importance of v‐t graphIn the above mentioned graphVertical height at any point represent theVertical height at any point represent the velocity at that instant of timeSlope of the straight line gives theSlope of the straight line gives the acceleration of the bodyArea belo the graph gi es the distanceArea below the graph gives the distance travelled by the body
Vikasana – Bridge Course 2012

Three dimensional graphOften in physics we come across a physical quantity say ‘z’ which depends on p y q y y pmore than one independent variable i.e., ‘z’ may depend on ‘x’ as well as on ‘y’. For y p yexample, volume occupied by the gas depends on pressure as well as on temperature.
Vikasana – Bridge Course 2012

Three dimensional graphIn such a scenario dependence of ‘z’ on ‘x’ and ‘y’ may be represented by a surface in y y p ythree dimensional space. However, we can still use a system of line graphs to y g prepresent the relationship between such variables.
Vikasana – Bridge Course 2012

system of line graphs
You know that volume occupied by a given mass of gas is directly proportional to the g y p ptemperature but it is inversely proportional to the pressure. We may show the p ydependence between the by plotting system of line graphs.y g
Vikasana – Bridge Course 2012

system of line graphsWe may either draw volume occupied by the gas against temperature for different g g ppressures (V-T graph), orPressure exerted by the gas againstPressure exerted by the gas against volume for different temperatures (P-V graph).graph).System of graphs representing these two cases is shown below
Vikasana – Bridge Course 2012
cases is shown below.
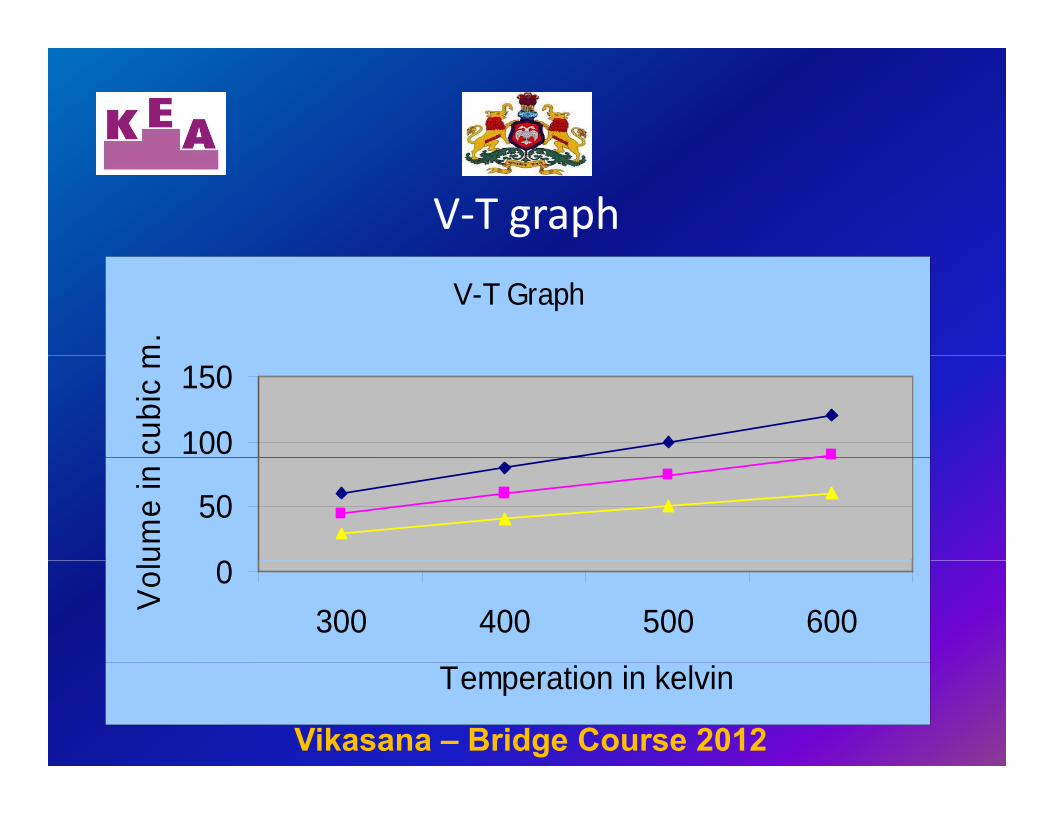
V‐T graph
V-T Graph
m.
100
150
cubi
c m
0
50
ume
in
0300 400 500 600
Vol
u
Vikasana – Bridge Course 2012
Temperation in kelvin

P‐V graphP-V Graph
200
300
e in
Pa.
0
100
Pre
ssur
e
01 2 3 4 5
V l i bi
P
Vikasana – Bridge Course 2012
Volume in cubic m.
Assignment questions
I am going to show you certain graphs inI am going to show you certain graphs in connection with a body describing linear motion. By looking at the graph, give themotion. By looking at the graph, give the suitable answer to the questions mentioned adjacent to it.mentioned adjacent to it.
Vikasana – Bridge Course 2012

Assignment questions‐1a) What is the velocity
of the body at 2s?x-t Graph
b) What type of motion does the graph i di t ?
20
30
e in
m.
indicate?c) What is the distance
traveled by the body0
10
dist
ance
traveled by the body after 4.5s?
00 1 2 3 4 5
time in s.
Vikasana – Bridge Course 2012

Assignment questions‐2
v-t Graph Graph shows linear motion described by th t b di th
40
60
in m
/s the two bodies- the one represented by black color represents
0
20
velo
city
black color represents the motion of the body A and the other with 0
0 5 10 15 20 25
time in s
v
pink color represents the body B. Then,
Vikasana – Bridge Course 2012
time in s.

Assignment questions‐2a) What is the type of motion described by
the body i) A? ii) B?y ) )b) What are the accelerations of A and B ?c) What are the distances covered by thec) What are the distances covered by the
two bodies after 25s?
Vikasana – Bridge Course 2012
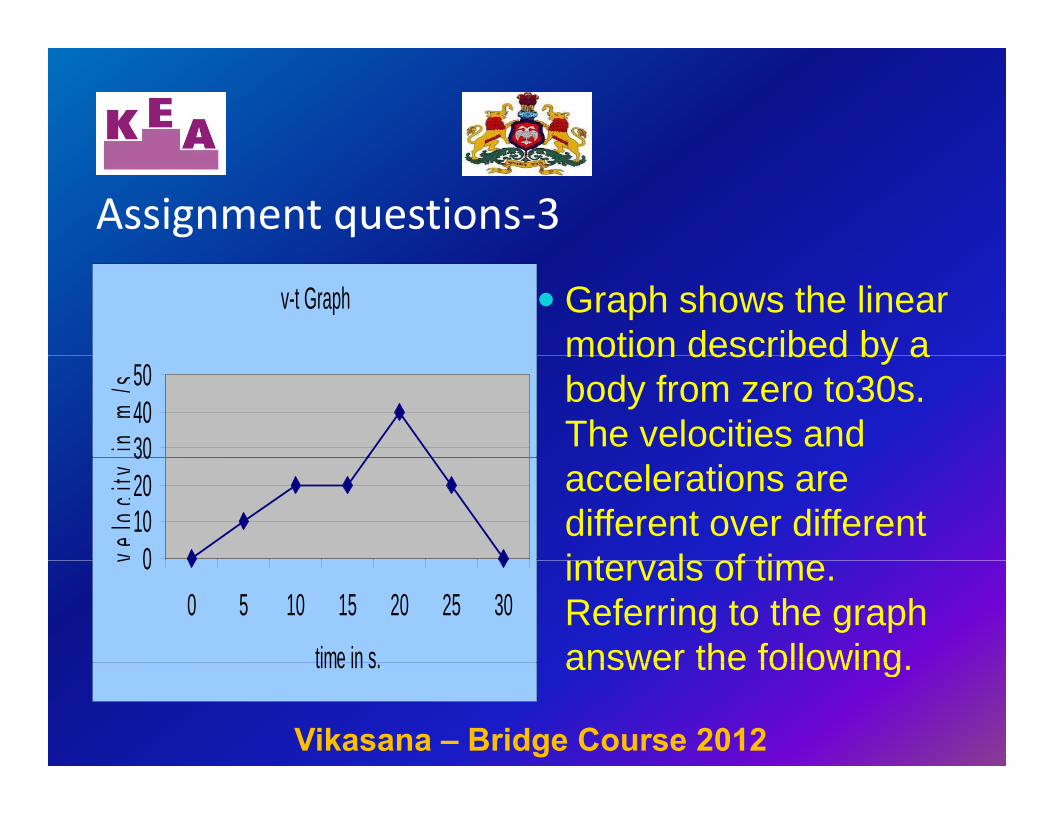
Assignment questions‐3
v-t Graph Graph shows the linear motion described by a
304050
inm
/s
motion described by a body from zero to30s. The velocities and
0102030
velo
city accelerations are
different over different i t l f ti0
0 5 10 15 20 25 30
time in s
v intervals of time. Referring to the graph answer the following
Vikasana – Bridge Course 2012
time in s. answer the following.
Assignment questions‐3a) What is the acceleration of the body
between i) o to 10s?)ii)15 to 20s?iii)20 to 30s?iii)20 to 30s?
b) What is the distance traveled between 10 to 15s?to 15s?
c) What is the over all distance traveled?
Vikasana – Bridge Course 2012

Assignment questions‐4Graph shows linear motion described by th t b di th
v-t Graph
the two bodies- the one represented by black color represents
40
60
inm
/s
black color represents the motion of the body A and the other with 0
20
velo
city
pink color represents the body B. Then,
00 1 2 3 4 5
time in s.
Vikasana – Bridge Course 2012
time in s.

Assignment questions‐4a) What are the accelerations of A and B?b) Give an example for each of them.b) Give an example for each of them.c) What does the point of intersection of the
two straight lines indicate?two straight lines indicate?d) Compare the distance traveled by A and
B after 2 5sB after 2.5s.e) After what time, distance traveled by A
Vikasana – Bridge Course 2012
becomes equal to that of B?
Answers to assignment questionsAssignment-1a) 5m/sa) 5m/s b) Uniform motion / a body moving with constant velocityconstant velocityc) 22.5m.
Vikasana – Bridge Course 2012

Answers to assignment questionsAssignment-2a) Both A and B moves with uniforma) Both A and B moves with uniform accelerationb) Acceleration of A is 2m/sq s while that ofb) Acceleration of A is 2m/sq.s while that of B is 1m/sq.s.c) 625m and 312 5mc) 625m and 312.5m
Vikasana – Bridge Course 2012
Answers to assignment questionsAssignment-3a) i) 2m/sq.s ii) 4m/sq.s iii) -4m/sq.s ) ) q ) q ) qb) 100m.c) 550mc) 550m
Vikasana – Bridge Course 2012

Answers to assignment questionsAssignment-4a) 10m/sq.s and -10m/sq.s respectively) q q p yb) i) A body dropped from certain height
ii) A body thrown vertically upwardsii) A body thrown vertically upwardsc) The two bodies will have the same magnitude of velocitymagnitude of velocityd) 1:3e) after 5s
Vikasana – Bridge Course 2012
e) after 5s