graphs, basically...right? data visualisation: concepts and practice
TRANSCRIPT
Graphs, basically...right?Data Visualisation: Concepts & Practice

WHAT WE’LL COVER
● A Brief History of Data Visualisation● Why Visualize Data?● What Does Your Data Say?● The Importance of Narrative● Visual Grammar & Gestalt Principles● Infographics● Some Simple (but effective) Visualisations● Taking it to the Next Level
Graphs, basically...right?

A WORKING DEFINITION
Graphs, basically...right?
Data visualization is a general term that describes any effort to help
people understand the significance of data by placing it in a visual
context.

A BRIEF HISTORY OF DATA VISUALISATION
Graphs, basically...right?
Babylonian World Map600BC
Ptolemy’s world map2nd century AD
CELESTIAL POSITIONS950AD
A BRIEF HISTORY OF DATA VISUALISATION
Graphs, basically...right?
Millwright Engineer
Draftsman
Accountant
InventorSilversmith
Merchant
investment broker
Economist
Statistician
Pamphleteer
TranslatorPublicist
Land speculator
Convict
Banker
Ardent royalist
Editor
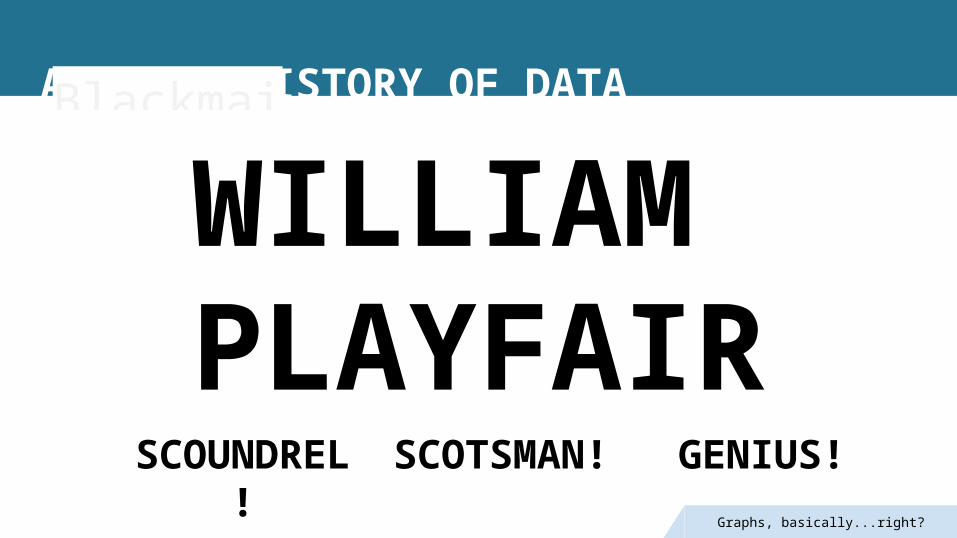
Blackmailer Jour
nalist
WILLIAM PLAYFAIR
SCOUNDREL!
SCOTSMAN!
GENIUS!
A BRIEF HISTORY OF DATA VISUALISATION
Graphs, basically...right?
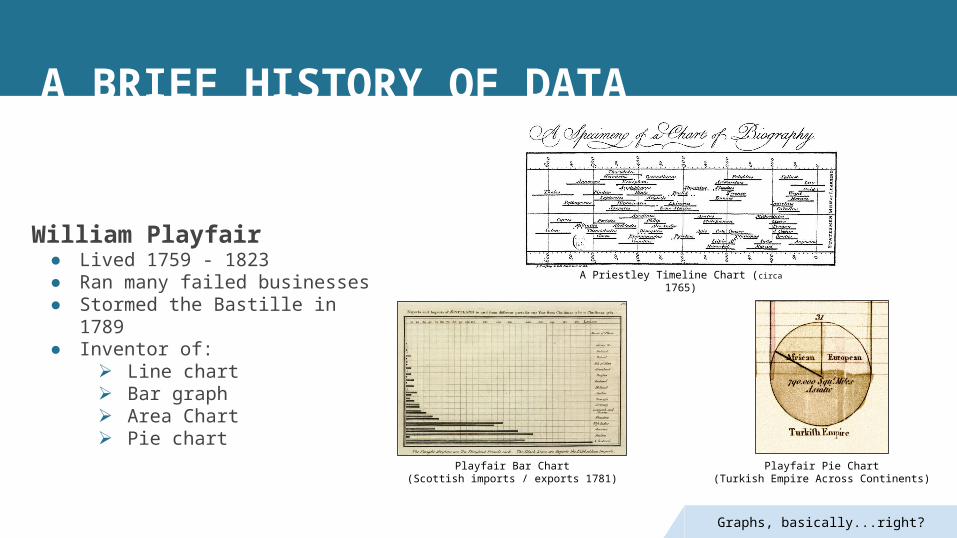
William Playfair● Lived 1759 - 1823● Ran many failed businesses● Stormed the Bastille in 1789● Inventor of:
➢ Line chart➢ Bar graph➢ Area Chart➢ Pie chart
A Priestley Timeline Chart (circa 1765)
Playfair Bar Chart(Scottish imports / exports 1781)
Playfair Pie Chart(Turkish Empire Across Continents)

WHY VISUALIZE DATA?
Graphs, basically...right?
● Humans are visual creatures■ We evolved to see things and make decisions; 30-
50% of the brain is devoted to visual processing■ We can communicate ideas quickly and simply
because our brains work this way■ It is easy to engage and influence an audience
through the visual medium● Data can be complicated
■ Visualisation translates the complicated to the simple
■ Most datasets are useless in their raw form■ In tests, subjects performed 300% better when
learning with images compare to without ● Revelation!
■ Successful data visualisations can reveal something we didn’t know, or didn’t expect
■ A good visualisation teaches the audience something, not simply confirms an idea
WHY VISUALIZE DATA?
Graphs, basically...right?
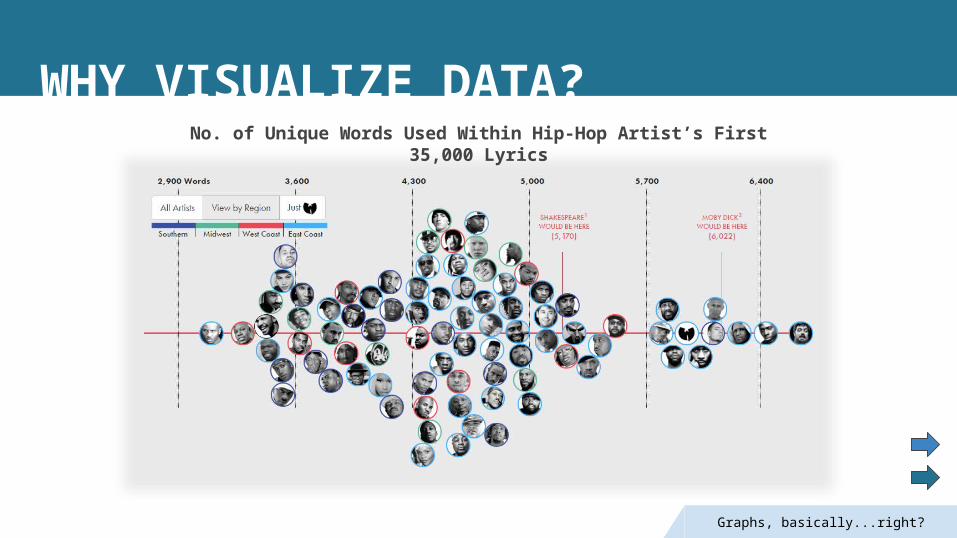
No. of Unique Words Used Within Hip-Hop Artist’s First 35,000 Lyrics
WHAT DOES YOUR DATA SAY?
Graphs, basically...right?
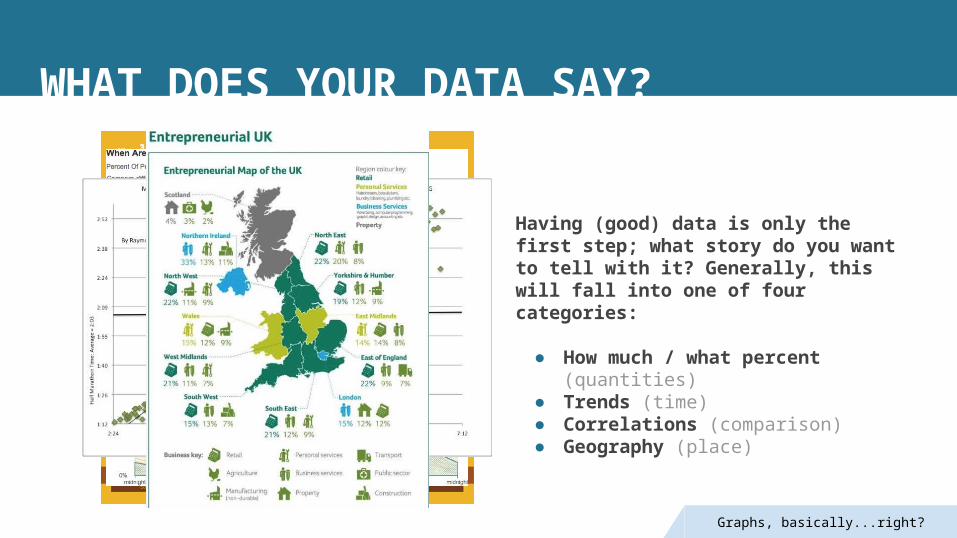
Having (good) data is only the first step; what story do you want to tell with it? Generally, this will fall into one of four categories:
● How much / what percent (quantities)
● Trends (time)● Correlations (comparison)● Geography (place)
THE IMPORTANCE OF NARRATIVE
Graphs, basically...right?
“If history were taught in the form of stories, it would never be forgotten.” - Rudyard Kipling
● Data isn’t always intrinsically interesting. By presenting it as a story it engages people and will stay with them
● How data is presented becomes a response to the necessities of the narrative
THE IMPORTANCE OF NARRATIVE
Graphs, basically...right?
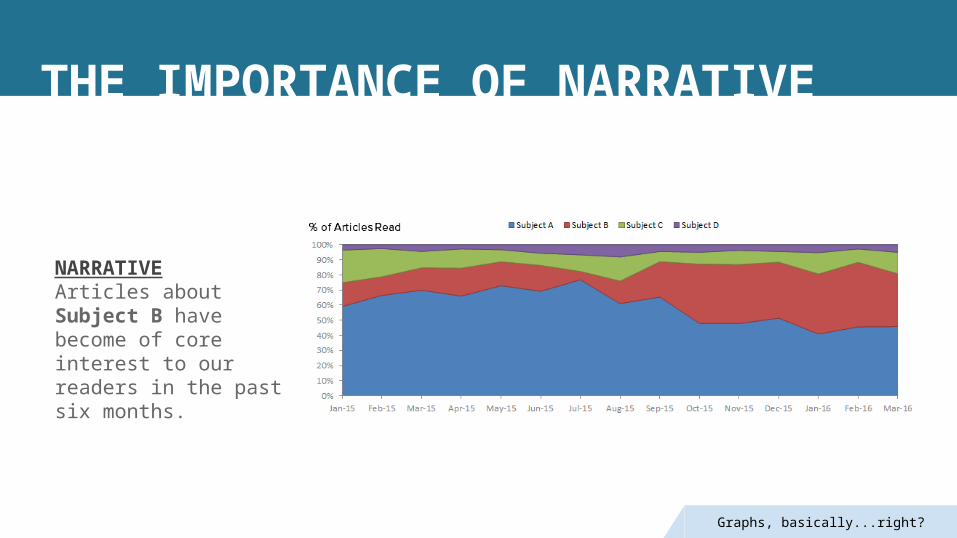
NARRATIVEArticles about Subject B have become of core interest to our readers in the past six months.
THE IMPORTANCE OF NARRATIVE
Graphs, basically...right?
Think about your audience and what narrative suit their expertise and needs. They can be thought of in four groups:
● Watercooler (The Novice)● Cafe (The Generalist)● Library (The Manager)● The Lab (The Executive)

THE IMPORTANCE OF NARRATIVE
Graphs, basically...right?
Peak Breakup Times on Facebook
VISUAL GRAMMAR & GESTALT PRINCIPLES
Graphs, basically...right?
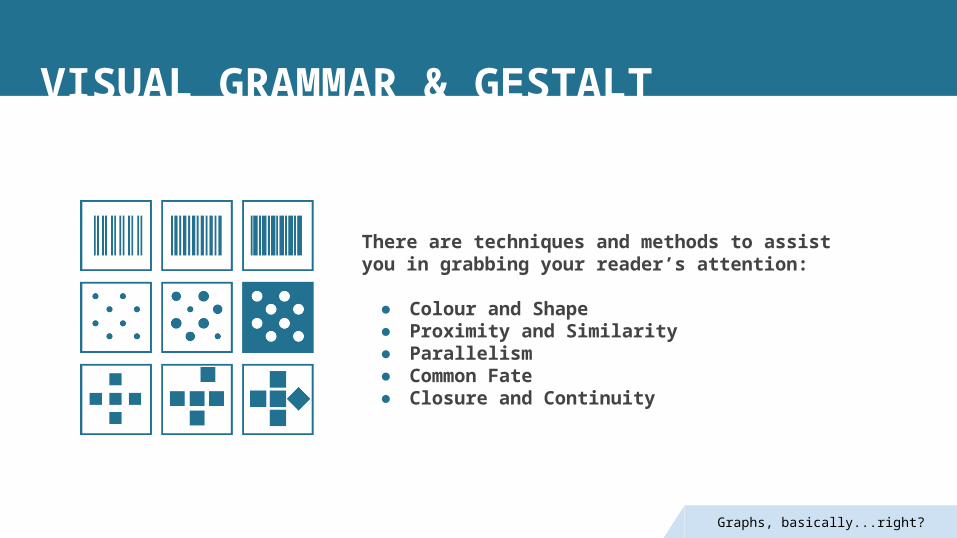
There are techniques and methods to assist you in grabbing your reader’s attention:
● Colour and Shape ● Proximity and Similarity● Parallelism● Common Fate● Closure and Continuity

COLOURS
MATTER
COLOURS
MATTER

VISUAL GRAMMAR & GESTALT PRINCIPLES
Graphs, basically...right?
Figure / GroundWe perceive the thing at bottom as being in the
foreground
VISUAL GRAMMAR & GESTALT PRINCIPLES
Graphs, basically...right?
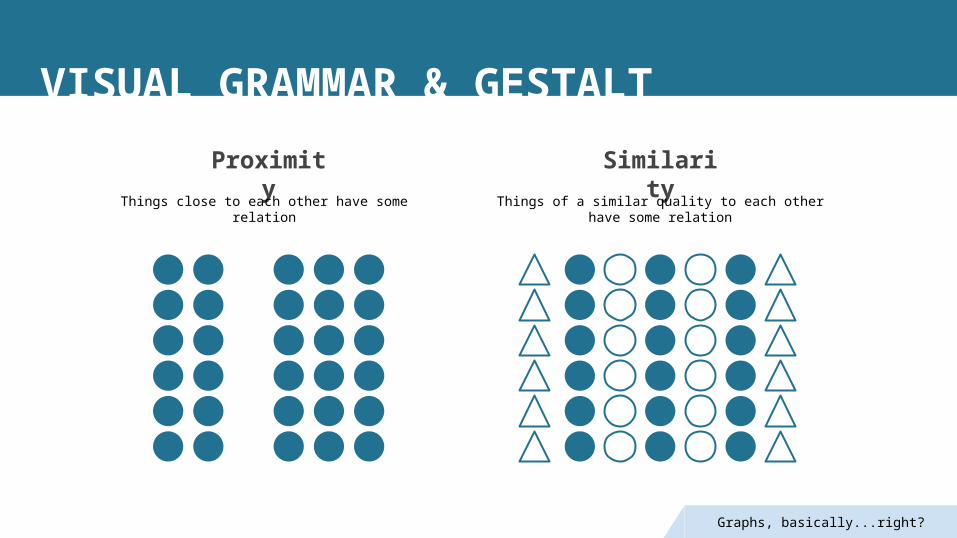
Proximity
SimilarityThings close to each other have some
relationThings of a similar quality to each other have some
relation
VISUAL GRAMMAR & GESTALT PRINCIPLES
Graphs, basically...right?
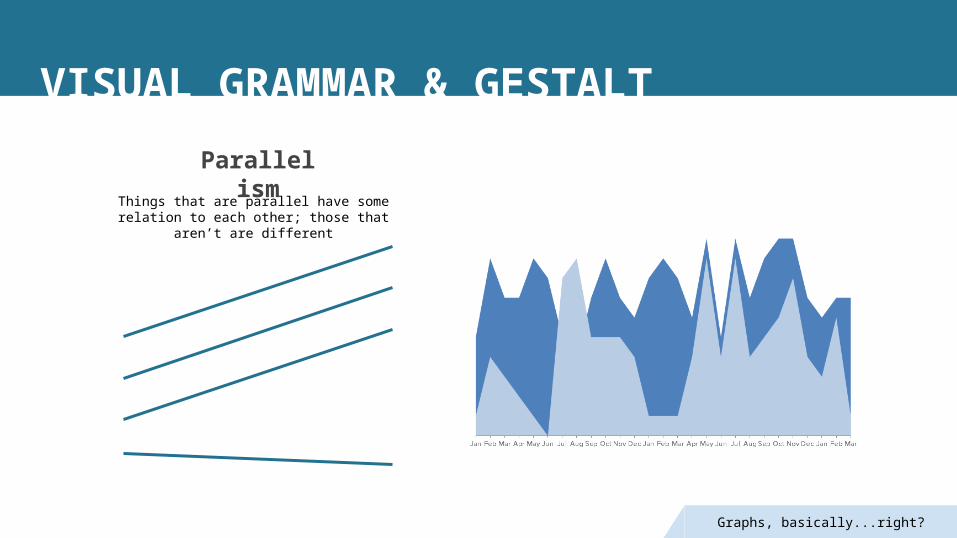
ParallelismThings that are parallel have some relation
to each other; those that aren’t are different

VISUAL GRAMMAR & GESTALT PRINCIPLES
Graphs, basically...right?
VISUAL GRAMMAR & GESTALT PRINCIPLES
Graphs, basically...right?
VISUAL GRAMMAR & GESTALT PRINCIPLES
Graphs, basically...right?
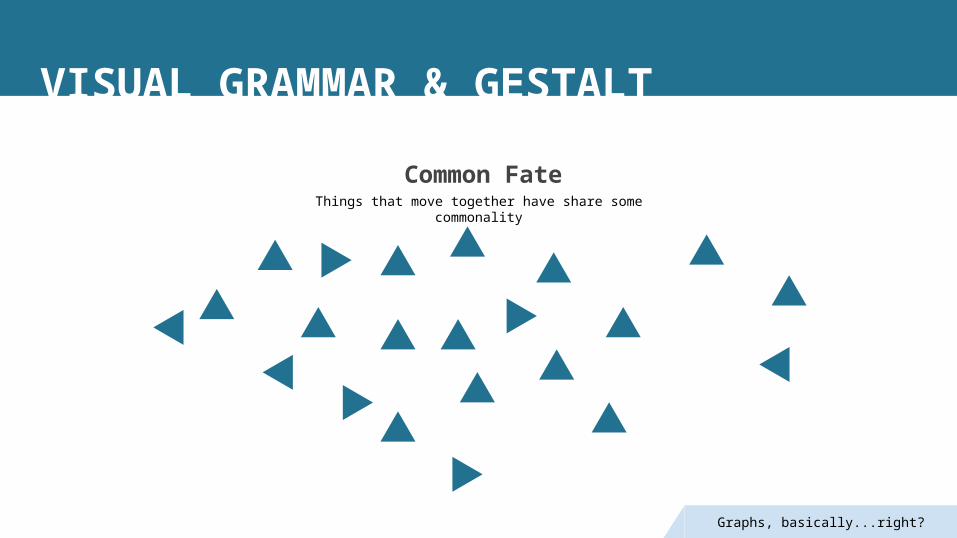
Common FateThings that move together have share some
commonality
VISUAL GRAMMAR & GESTALT PRINCIPLES
Graphs, basically...right?
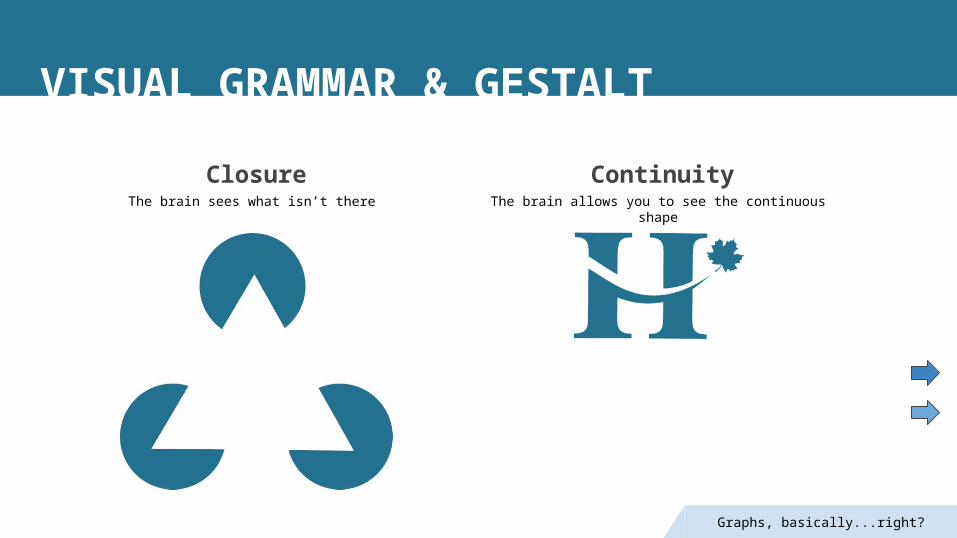
ClosureThe brain sees what isn’t there
ContinuityThe brain allows you to see the continuous shape
Graphs, basically...right?
INFOGRAPHICS
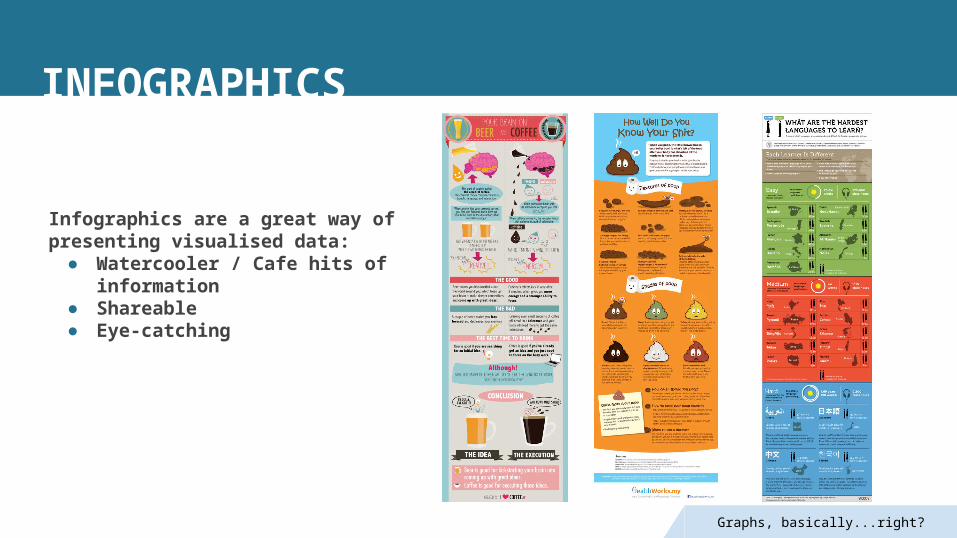
Infographics are a great way of presenting visualised data:
● Watercooler / Cafe hits of information
● Shareable● Eye-catching
Graphs, basically...right?
INFOGRAPHICS
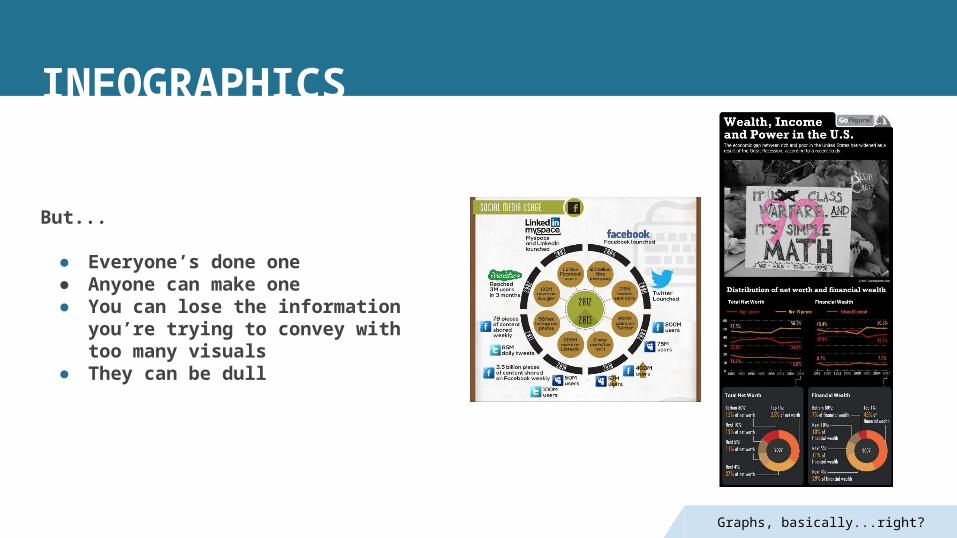
But...
● Everyone’s done one● Anyone can make one● You can lose the information
you’re trying to convey with too many visuals
● They can be dull
SOME SIMPLE (BUT EFFECTIVE) VISUALISATIONS
Graphs, basically...right?
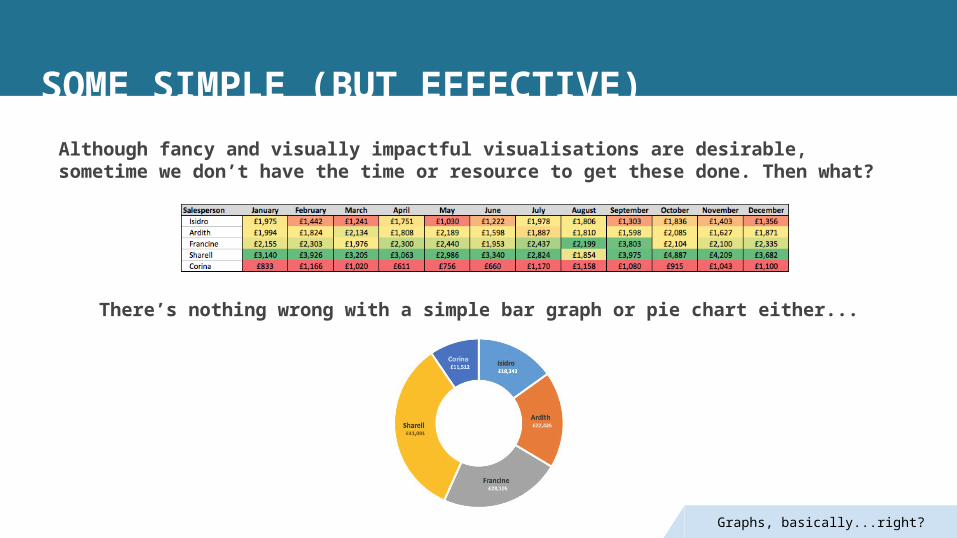
Although fancy and visually impactful visualisations are desirable, sometime we don’t have the time or resource to get these done. Then what?
There’s nothing wrong with a simple bar graph or pie chart either...

Graphs, basically...right?
TAKING IT TO THE NEXT LEVEL
“But how do we create the fancy stuff?”
● Tableau● Visually● D3.js● Gephi● Sisense● Good Data● ...and don’t forget Cxense
and Google Analytics!
Graphs, basically...right?
KEY POINTS
● Data visualization is a general term that describes any effort to help people understand the significance of data by placing it in a visual context.
● A story told through data will engage and entice your audience.● Let the data inform you how it should be presented.● The quality of your data will be reflected in your visualisations.● Who your audience is is key to how to you visualise the data.● Following simple visual rule can have huge impact on your audience.● Not every visualisation needs to be a work of art● AUDIENCE! AUDIENCE! AUDIENCE!
Graphs, basically...right?
THANKS!Any questions?
LINKS
Graphs, basically...right?
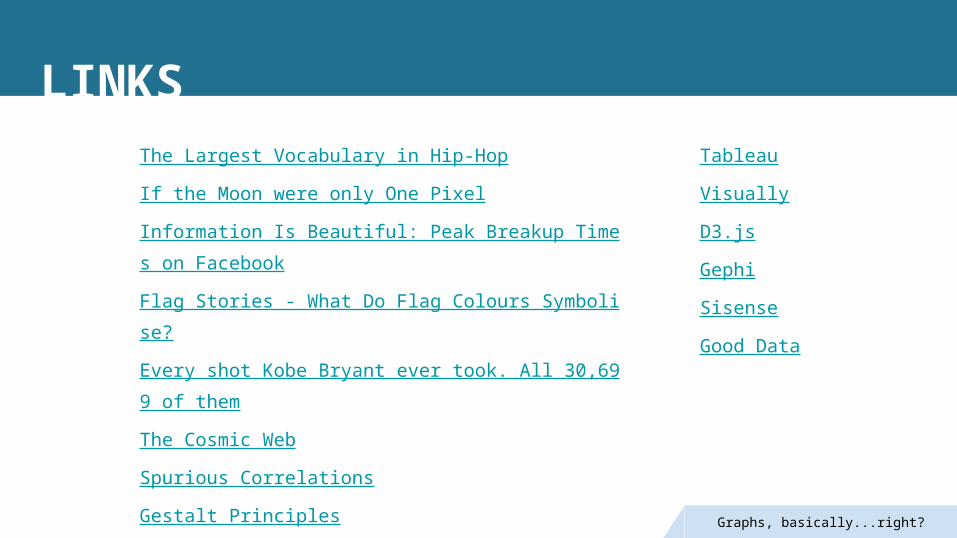
The Largest Vocabulary in Hip-HopIf the Moon were only One PixelInformation Is Beautiful: Peak Breakup Times on FacebookFlag Stories - What Do Flag Colours Symbolise?Every shot Kobe Bryant ever took. All 30,699 of themThe Cosmic WebSpurious CorrelationsGestalt PrinciplesYour Brain on Beer vs. Coffee [Infographic]How Well Do You Know Your Shit? [Infographic]What are the Hardest Languages to Learn? [Infographic]
TableauVisuallyD3.jsGephiSisenseGood Data