graphs in big data: challenges and...
TRANSCRIPT

Graphs in Big Data: Challenges and Opportunities
Yinglong Xia05/16/2016
Mission-Critical Big Data Analytics (MCBDA’2016)

2
Graph is the way we remember, we associate, and we understand.

3

4
BackgroundGraph Analytics and SystemsChallengesBreakthrough & OpportunitiesMini Hands-on
5
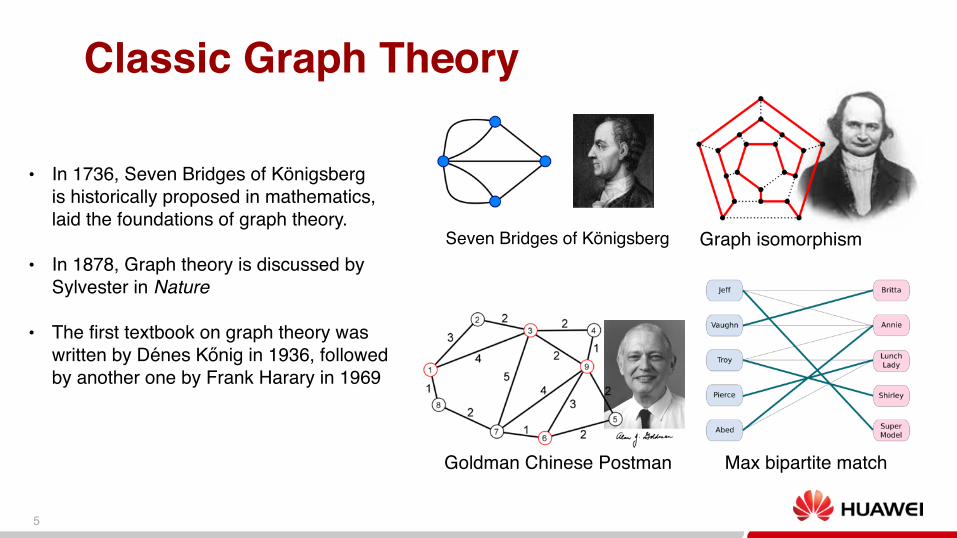
Classic Graph Theory
Seven Bridges of Königsberg
Goldman Chinese Postman
Graph isomorphism
Max bipartite match
• In 1736, Seven Bridges of Königsberg is historically proposed in mathematics,laid the foundations of graph theory.
• In 1878, Graph theory is discussed by Sylvester in Nature
• The first textbook on graph theory was written by Dénes Kőnig in 1936, followed by another one by Frank Harary in 1969

6
Brief History
N.T. Bliss, Confronting the Challenges of Graphs and Networks, Lincoln Laboratory Journal, 2013
2016
Neuronal network @ Human Brain Project 89 billion V & 100 trillion E
61.6 million V1.47 billion E
40 million V300 million E

7
Diversity in Graph TechnologyDynamic graph helps analyze thespatial and temporal influence overthe entities in the network
RDF graph enables knowledge inference over linked data
Streaming graph monitorssentiment propagation overtime and how the graph structure can impact
Property graph is widely used as a data storage model to manage the properties of entities as well as the interconnections
Vertex ID
Edge label
Edge property
Graph technology leads to rich analytic abilities
Graphical models leverages statistics to inference latentfactors in a complex system

8
Graphs in Big DataCDR graph: Call detailed record can form a graph by linking the numbers called each other.
Social network is a scale-free graph with small-world effect
From IBM Big Data Webpage
Some recommender system such as collaborative filter can be constructed on a bipartite graph
Graphical Models can be used to find latent variables from noisy data

9
Graph Analytics

Import properties/metrics:- Small-world effect- Betweenness- Eccentricity/Centrality- Transitivity- Resilience- Community structure- Clustering coefficient- Matching index
10
Complex Network AnalysisReal world complex networks include WWW, Social Network, Biological network, Citation Network, Power Grid, Food Web, Metabolic network, etc.
Complex network models:- Poisson random graph
- degree~Poisson- Small world effect
- Watts and Strogatz graph- Transitivity- Small world effect
- Barabasi and Albert graph- Small world- Power law

11
Information Propagation
12
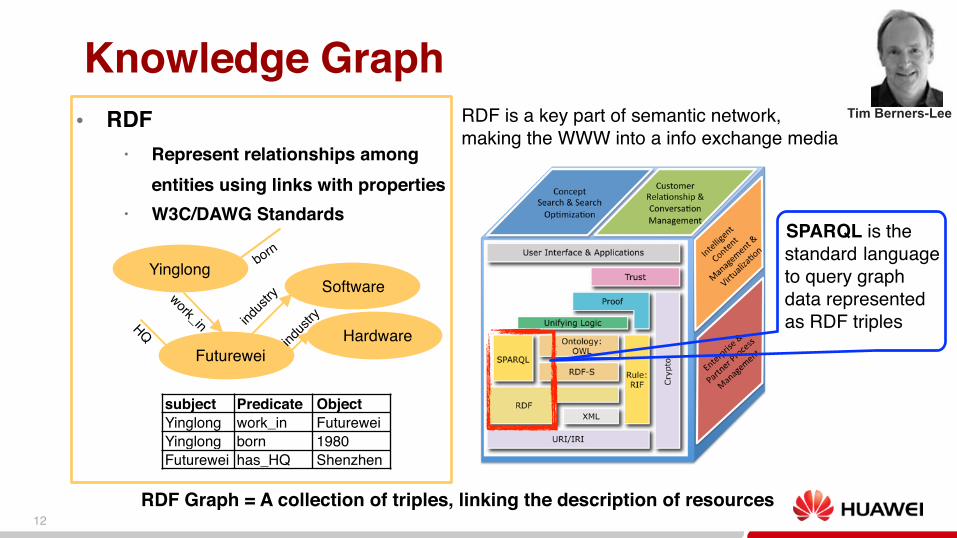
Knowledge Graph● RDF
• Represent relationships among entities using links with properties
• W3C/DAWG Standards
Yinglong
Futurewei
Software
Hardwareind
ustry
indus
trywork_in
born
HQ
subject Predicate ObjectYinglong work_in FutureweiYinglong born 1980Futurewei has_HQ Shenzhen
RDF is a key part of semantic network, making the WWW into a info exchange media
Tim Berners-Lee
RDF Graph = A collection of triples, linking the description of resources
SPARQL is the standard language to query graph data represented as RDF triples
13
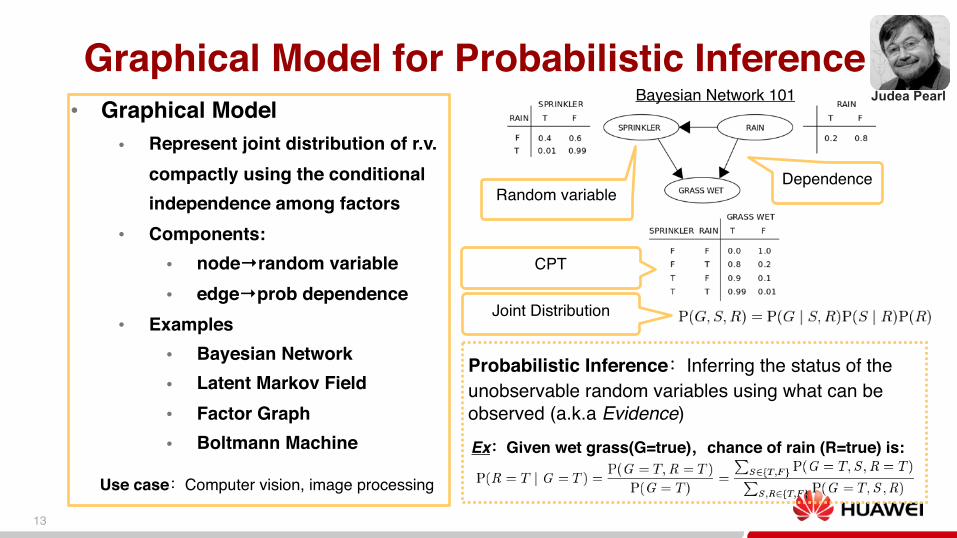
Graphical Model for Probabilistic Inference● Graphical Model
● Represent joint distribution of r.v. compactly using the conditionalindependence among factors
● Components:● node→random variable● edge→prob dependence
● Examples● Bayesian Network● Latent Markov Field● Factor Graph● Boltmann Machine
Use case Computer vision, image processing
Bayesian Network 101
Random variable
CPT
Dependence
Joint Distribution
Probabilistic Inference Inferring the status of the unobservable random variables using what can be observed (a.k.a Evidence)Ex Given wet grass(G=true) chance of rain (R=true) is:
Judea Pearl

14
Property Graph and Data Management● Property graph is a data representation model with strong expressiveness● Property graph is supported by most graph databases (NoSQL) and also
forms the foundation of graph analysis.• Vertices
■ Unique ID for each■ A set of (directed) edges■ Property: a set of key-value pairs
• Edges■ Unique ID for each■ Two end vertices■ With at least a label■ Property: a set of key-value pairs

15
Property Graph Implementation● Adjacent list
● Similar to CSR with improvements ● Utilized by ScaleGraph etc
● Adjacent matrix● Graph —> Sparse Matrix● Suit to some algorithms (e.g. PageRank), ● Utilized by IBM GPI
● Vertex property list edge property list● Utilized by Spark/GraphX ● Straightforward and effective data organization

16
Basic Operators in Property Graph● Traversal
● Def Visit/Modify vertices following the edges
● Implementation BFS, DFS,
● Application SSSP CF Loopy Bayesian Inference
● Graph Editing● Def add/delete/modify vertices, edges, or the property
● Implementation local update (graphDB), new graphs (Spark/GraphX)
● Application Finance Surveillance Hypergraph construction
Unvisited
Graph Traversal
Gaussian Elimination
Remove verticesAdd edges

17
Graph Systems

18
Some Existing Products
Visualization
Analytics
Frameworks
Storage
ScaleGraph
Flink/Gelly

19
Neo4j System Architecture and Storage FormatTraversals Core API Cypher
Vertex/Edge Cache Thread local diffs
FS Cache HA
Record filesTransaction log
Disk
Graph structure and data buffers
i.e. mmap
LFU-protocol
Link edges inclined to a vertex using the relationship data structure, imposing some performance issue for handling celebrates in power-law graphs e.g. social network
Neo’s declarative query language
for TX roll-back
changes in a TX
High Availability based on TX
Easy to implement horizontal partitioning in FS

20
Titan System Architecture and Storage Format
Store Manager
Transaction store
Relations
Index Store

21
OrientDB System ArchitectureGraph JDBC
DocDB based storage
Support distributed platforms, offering key-value store, docDB, and graphDB in one system

22
IBM System G Graph Data Organization
…
Latest TSK
…
Latest TS1
Latest TS0
…
Latest TSK
…
Latest TS1
Latest TS0
Key table TS table
propM…prop1prevTSN-1
…
propM…prop1prevTSN
…
…
propM…prop1prevTSN-1
…
propM…prop1prevTSN
…
…
Property Files
...
………
next……
...
...
………
next……
...
...
………
next……
...
...
………
next……
...
…
prop1 propM
Cache the latest set of pointers in Key table to reduce disk access. Furthermore, cache the Key table in memory when there is enough memory. Contiguously store properties
for vertex K
Reduce disk access latency
Load entire list likely in a single disk access
Contiguously store adjacency edges for vertex K
Reference counter
• Keeping a chunk of graph data in memory for efficient data retrieval • On-demand loading loads data only when the vertices and/or edges are accessed • Stitching graph data together in memory → increase data locality • Behaving as a in-memory database
Multiversioning
22
Edges Property

23
Glance at Graph Computing EnginesSpark/GraphX
GraphChi

24
Issues within Existing Systems● Separation of data management and analytics layers results in
unnecessary data duplication, adversely hurting the overall performance
• GraphLab, GraphX —> No data management available• Titan —> No clear model for data computing/analytics
● Limited consideration on Scale-up but relaying on Scale-out
for performance improvement, which is inherently different• GraphX and Titan cannot use the low-cost sync. • Irregularity in graph data access brings high cost to IO,
slowing down the overall graph data processing time
GraphDB
AnalyticsData copy & transform/map
Data wipe &rewrite
#machine
runn
ing
time
comp. timecomm. time
overall time

25
Issues within Existing Systems - 2● JVM constraints
• Productivity and open-source amenable. Java and Scala run on JVMs• Irregular data access in graph forms pressure
■ Poor data locality leads to increased workload in GC■ E.g. Importing 200M edges into Neo4j on one shot on a server with 1TB results in out of
memory issue; Tuning the transaction size in Titan is also quite challenging.• JVM abstraction makes it difficult to use low level features such as NUMA-
awareness, GPU devices, etc.● Impact by the constraints of RDD
• Spark gives up JVM based GC which may help improve the performance of
GraphX; Due to the characteristics of RDD, dynamics graph can result in a lot of data copy, rather than in-place data update
Every coin has two sides

26
Challenges

27
Challenges▪Challenges in graph topology
– Different types of edges – Randomness in graph structure
• Celebrity nodes in social graph – Dynamic change in graph structure
▪Challenges in graph properties – Schema-less in vertices/edges – Property type can be arbitrary
• Simple property => label • Complex ones => JSON
– Some property can be volatile
▪Challenges in infrastructure – Latency can be more sensitive than bandwidth
▪Performance challenges in Graph DB 40M users, 1.2B edges → 34.8 B trianglesC. Guestrin, GraphLab Conference 2013.
We process a big graph using 1000 computers
But the graph data fitsinto a single machine
Do we abuse “Big”?

28
Challenges● Poor data locality results in high IO cost
● The way how data is stored in memory or disk is not inherently designed for graph● Data access patterns in graph computing are highly irregular
● Cost of graph Partition/Sharding● Complexity of MinCut can be much higher than some basic graph computing● Not really helpful for dynamic graphs
● ParMETIS takes seconds to hours for partitioning a graph
● Limits of RDBMs on graphs→Native GraphDB● Graph is covered by relational model and can be converted● Property graph can be represented by tables of vertices, edges and properties● Join operation can be the killer

29
Challenges - Performance● Understand performance bottleneck by
breaking down the execution time● Bottleneck comes from the memory sub-system
● DTLB is inefficient● Cache performs well● Cache MPKI rate is high
Core graph algorithms from 21 real-world use cases
3 different types of graph computing, with focus on structural traversal, property processing, and graph editing, respectively

30
Challenges — Input Sensitivity● Impact from graph topology
● Power-law graph results in imbalanced workload due to dense vertices
● Dense subgraph, sparse backbone
● Dense subgraph can be converted into matrices
● Iterative update in a subgraph● Road net is easy to decompose
● Property type matters● More time spent on property
management● Computing performance can be
negatively impacted
Performance is inconsistent across different graph types

31
Challenges Impact of H/W Accelerator● GPU can be helpful
● Sufficient acceleration by GPU● Requires re-design of the
algorithms
● Challenges● Data must be transferred to GPU● Cost of Host to Device data transfer● Difficulty in putting large graph into
GPU (Double buffering)● Sensitive to input graph data
Speedup of NVIDIA Tesla K40 over 16-core Intel Xeon E5-2670
Memory divergency shows higher sensitivity for graph computing on GPU

32
Challenges Scale-out Issue● Poor data locality and difficult partitioning result in
challenges in scaling out the computing ● Scale-out challenges can be
seen in Graph500 analysis● Single machine with big
memory can help● Must be cautious to use
many computing nodes
degraded performance when #core is 100~1000
Analysis of data from Graph500
from Peter Kogge

33
Breakthrough and Opportunities

34
Breakthrough on Distributed Graph Traversal Engine
● Traversal is the core operation in graph computing
• Pretty high throughput achieved● Variety of techniques are
utilized to achieve the goal • Efficient scale-free graph partition
for parallelization• Dynamic workload balance• Beamer-based algorithmic
innovation• Architecture aware optimization

35
Breakthrough on Graph Analytics for Social Media

36
Breakthrough on Graph for Cognitive Computing
Combing graph technology and big data, we provide insights to the data by especially exploring the relationship among various entities. Based the same dataset and infrastructure, we are able to provides information from 12 difference aspects.

37
Breakthrough on Graph for Anomaly Detection
Use Probabilistic graphical models, we can model the behavior of a complex system, such as the employees in a large enterprise, or a node in a SDN, and detecting possible abnormal behaviors before the real damage occurs.

38
Opportunities in Graph Technology for Big Data● Develop high performance graph computing kernels and primitives
• Graph500 technique based architecture-awareness for graph computing• Heterogeneous computing and computing near-data technology
● Reinvent graph technology for supporting cognitive computing• One open platform with multiple graph and graph-related technologies• Integral consideration on graphical model, streaming graphs, etc. for AI/IoT
● Offer vertical solutions to break through separation among technique stacks• Holistic solution for rapidly building industry-level graph analytics solutions• Incorporating with market segmentation, such as security, finance, etc.
● Collaborations and Standardization• Foster collaboration with relevant professional communities to educate the market• Developing domain or cross-domain standardizations

39
Opportunities on Novel Hardware Support to GraphClone the Code
Code: https://github.com/graphbig/graphBIGDoc: https://github.com/graphbig/GraphBIG-Doc
CompStruct CompDynCompProp
0%
20%
40%
60%
80%
100%
Bre
akd
ow
n o
f Ex
ecu
tio
n
Cyc
les
Backend
Retiring
BadSpeculation
Frontend
A group of graph analytics for benchmarking underlying platforms
A simplified IBM System G in-memory graph layer, with similar APIs
Come with performance profiler by taking hardware performance counters, breaking down the execution time into multiple stages to reveal the performance bottleneck
GraphBIG@Github

40
Opportunities through Community Collaborations
• Co-chair the IEEE Big Data Standardization under BDI
• Co-chair the IEEE Big Data Conference Government & Industry Program in 2016
• Directed the LDBC board,studying graph query standards
• General Vice Chair of HiPC’16• Program Chair of CBDCom’16

41
GraphBIG@Github Mini Hands-On
42
Features of GraphBIG● Framework
• Based on the property graph framework from real-world graph computing practices
● Representativeness• Workloads are selected from real-world use cases
● Coverage• Covers multiple graph computation types, much more than just graph traversal
● Multicore/GPU• Provides Multicore/GPU workloads under the unified framework
● Standalone package• Can be compiled without external libraries
● Profiling tools• Provides tools to profile the code section of interest with hardware performance counters (libpfm code is integrated)
● Recognition• First comprehensive graph analytics benchmark for architecture research• Tech papers announcement in SC’2015 and will be on VLDB’2016

43
Graph Analytics Benchmark
Rich analytics available
Each analytics may have multiple algorithms

44
Mini Hands-on: Clone the Source⎮Fetch Code
! Code: https://github.com/graphbig/graphBIG ! Doc: https://github.com/graphbig/GraphBIG-Doc

45
Mini Hands-on: Compile⎮Compile
! Require: gcc/g++ (>4.3), gnu make ! Just “make all”

46
Mini Hands-on: Test Run⎮Test Run
! Just “make run” ! Using default
“small” dataset

47
Mini Hands-on: User-Defined AnalyticsArbitrary vertex/edge property support through template programming
Self-explained graph traversal and property access

48
Mini Hands-on: Dataset Download⎮More Datasets
! Download: https://github.com/graphbig/graphBIG/wiki/GraphBIG-Dataset
! Untar and specify the correct path in benchmark argument “--dataset”
! Other 3rd party datasets (.csv format) are also possible
