grasim industries limited _nov2015.pdf– market leader in white cement & putty (1.4 mn. tpa)...
TRANSCRIPT

Grasim Industries Limited
A VSF and Cement Major
November 2015

2
Statements in this ‘Presentation’ describing the Company’s objectives, estimates, expectations or predictions may be ‘forward looking statements’ within
the meaning of applicable securities laws and regulations. Actual results could differ materially from those expressed or implied. Important factors that
could make a difference to the Company’s operations include global and Indian demand supply conditions, finished goods prices, feedstock availability and
prices, cyclical demand and pricing in the Company’s principal markets, changes in Government regulations, tax regimes, economic developments within
India and the countries within which the Company conducts business and other factors such as litigation and labour negotiations. The Company assumes
no responsibility to publicly amend, modify or revise any forward looking statement, on the basis of any subsequent development, information or events,
or otherwise.
Cautionary Statement
Glossary VSF : Viscose Staple Fiber, MT : Metric Ton, TPA : Tons Per Annum, YoY: Year on Year Comparison, CY : Current Year
EBITDA : Earnings before Interest, Tax, Depreciation and Amortisation,
ROAvCE : Return on Avg. Capital Employed, RONW : Return on Avg. Net Worth

3
Presentation Structure
Introduction
Financial Highlights
Capex
Our Businesses
4
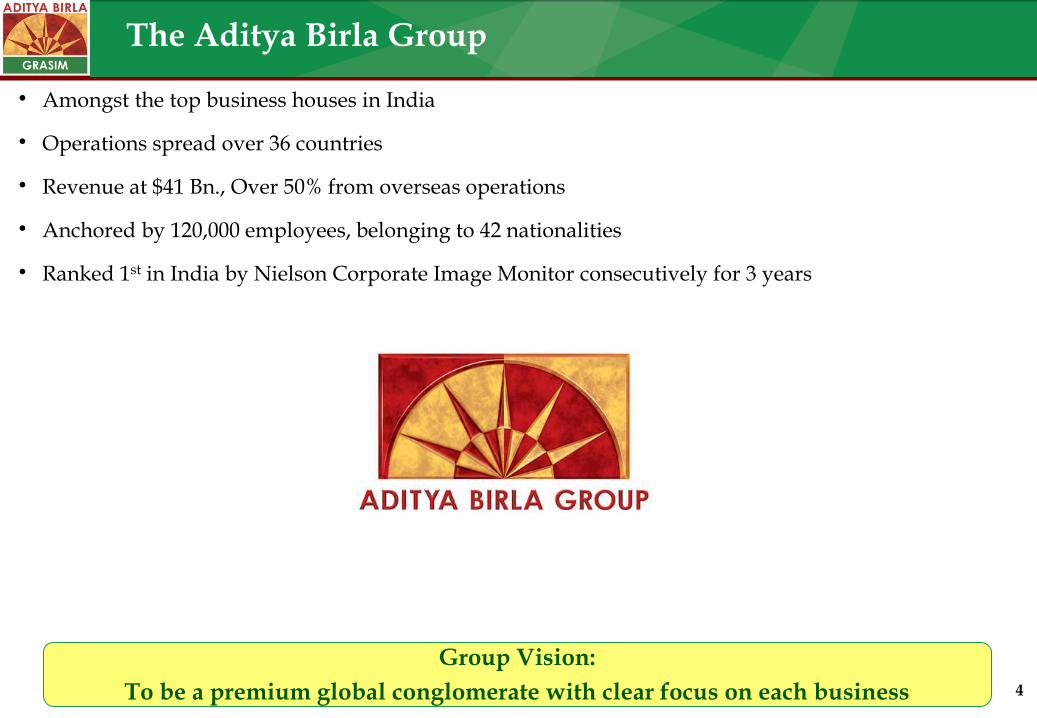
Amongst the top business houses in India
Operations spread over 36 countries
Revenue at $41 Bn., Over 50% from overseas operations
Anchored by 120,000 employees, belonging to 42 nationalities
Ranked 1st in India by Nielson Corporate Image Monitor consecutively for 3 years
The Aditya Birla Group
Group Vision:
To be a premium global conglomerate with clear focus on each business

5
The Aditya Birla Group : Leadership Across Businesses
Leading Global Player
– Hindalco – Novelis is the largest aluminum rolling company
– Largest producer of carbon black
– One of the two largest producers of VSF
– Fourth-largest producer of insulators and acrylic fibre
Leadership position in India
– VSF, Cement, Aluminium, Carbon Black, VFY, Branded Apparels, Linen, Copper,
Chlor-alkali and Insulators
– Among top three mobile telephony companies
– Among top four in Asset Management
– Among top six in Life Insurance (Private players)

6
Grasim: Market leader across Business Segments
Cement Revenue ` 244 Bn.
(US$ 4.0 Bn.)
Largest manufacturer in India
– Capacity : 67.7 Mn. TPA
– Total capacity to reach ~75 Mn. TPA on completion of ongoing Brownfield expansion projects and acquisition in process
– Market leader in White Cement & Putty (1.4 Mn. TPA) and Ready Mix Concrete
Viscose Staple Fibre
Revenue ` 66 Bn. (US$ 1.1 Bn.)
Leading Global Player
– Capacity : 498K TPA
– Grasim commands 9% Global share; ABG share 17%
– Integrated model with experience of more than six decades
Chemical Revenue ` 17 Bn.
(US$ 278 Mn.)
Largest Chlor-Alkali Manufacturer in India
– Capacity : 452K TPA
– Post merger of ABCIL, capacity to reach 804K TPA
– Portfolio of value added products – Epoxy (52K TPA) and Chlorine Derivatives (243K TPA)

7
Investment in Growth
Consolidated Financials.
– Capital Employed ` 471 Bn.
– Net Debt at ` 59 Bn. (Net surplus of ` 3.1 Bn. at standalone level)
– Net Debt / Equity : 0.18
– Net Debt / EBITDA : 0.98
H1 FY16 Return Ratio (consolidated) :
– ROAvCE : 10.0%, RONW : 8.2%
Substantial Investment made across Businesses – US$ 4 Bn. over last five years.....
.....Balance Sheet Continues to be Strong – Net worth of ~ US$ 4 Bn.
Full Benefit to flow with ramping up of capacity utilisations and expected upturn in business cycle
48.8 63.2 69.3
FY 10 FY 15 FY 16
Cement * Mn. TPA
74.8#
FY 10 FY 15
334 498
FY 10 FY 15
VSF * KTPA
50%
258 452
804
FY 10 FY 15 FY 16
Caustic * KTPA
75%
30%
Gross Fixed Asset Rs. Cr
110%
21717
45577
* Capacity
Leading Global Player Largest in India Largest in India
310%
55%
# Post acquisition of JAL’s MP assets

8
Driving Robust Volume Growth
.....and Revenue Growth
……Yielding Results
7
308 305 307
336
367
403
FY10 FY11 FY12 FY13 FY14 FY15
VSF ('000)
230 241 266 269
314
409
FY10 FY11 FY12 FY13 FY14 FY15
Caustic ('000)
39.6 41.6
44.0 43.6 44.7
48.2
FY10 FY11 FY12 FY13 FY14 FY15
Cement (Mn. Tons)
39.4
48.2 50.1 54.3
63.3 66.4
FY10 FY11 FY12 FY13 FY14 FY15
VSF
4.9 5.4 7.8
9.5 10.7
17.0
FY10 FY11 FY12 FY13 FY14 FY15
Caustic Soda
154.7 159.4
192.3
213.2 216.5
243.5
FY10 FY11 FY12 FY13 FY14 FY15
Cement
` Bn.

9
Consolidated Business Mix – H1 FY16
Net Revenue - ` 170 Bn. EBITDA - ` 30 Bn.
124.4
26.9
8.3 10.1
0.2
23.9
3.5
1.9
0.9

10
Presentation Structure
Introduction
Our Businesses
Financial Highlights
Capex

Viscose Staple Fibre (VSF)
Birla Viscose Birla Modal Birla Excel

12
58%
18%
17%
Cotton 26%
VSF 5%
Synthetic 67%
Wool 1%
Others 1%
VSF: A cellulosic fibre
5% of global fibre market
7% of global man-made fibre market
Major Global Players’ Capacity
ABG group (incl. Grasim) : 935
of which Grasim : 498
Lenzing : 992
(Austria, Indonesia & China)
Niche business where Grasim has relative cost
advantage due to backward integration and long
experience
VSF Global Industry Scenario
‘000 TPA
Global Fibre Pie (92 Mn. MT)
Source: Company estimate, Fibre Organon (for CY 2014)
Chinese Players
Lenzing
ABG Group
Grasim 9% Others 7%
VSF Business Global Market Share

13
3.5
5.5
2.7
4.8
2009 2014
VSF : Fastest Growing Fibre
22.2
26.2 25.3 24.4
8.6
21.9
2009-10 2014-15 Production Consumption
Season End Stock
17.0
24.5
12.6 15.5
2009 2014
VSF PSF Cotton (Mn. Ton)
VSF fastest growing among competing fibres
– Rising prosperity in emerging economies
– High cotton prices in China lead to substitution
Overcapacity across Fibres leading to pressure on prices
Source : ICAC, Fibre Organon, Company Estimates
Capacity Demand
CAGR -1%

14
VSF: Global Presence
• 4 VSF plants
• 1 Pulp plant
• 2 Caustic soda
plants
India
• 3 Pulp plants
JVs
Canada
• 2 VSF plants of AVB
Group Cos.
South East Asia
VSF Plant - Own
VSF Plant - JV
VSF Plant - Group Co.
Pulp Plant - Own
Pulp Plant - JV
• VSF JV
China,Hubei
• Domsjo pulp plant
JV
Sweden

15
VSF : Sustainable Competitive Strengths
Amongst the low cost producers globally
Highly integrated operations
Captive raw materials - Pulp & Caustic Soda
Five pulp manufacturing plants – India : 1, Overseas JVs : 4 (Canada : 3, Sweden : 1)
Captive power and steam
Self managed water supply resources
In-house R&D capabilities
Global brand positioning :“Birla Cellulose”
Our Integrated Business Model will continue to provide Sustainable Competitive Advantage

16
(` Bn.) 2013-14 2014-15 H1
2015-16
Capacity (‘000 Ton)* 375 434 249
Sales Volume (‘000 MT) 367 403 216
Net Revenue 47.1 49.7 26.9
EBIDTA 7.2 4.7 3.5
EBIDTA Margin 15% 9% 13%
EBIT 5.7 3.1 2.4
VSF: H1 FY16 Performance
Global Industry Scenario
Increase in global prices in H1 FY16 after prolonged decline
Rise in raw material cost and stoppage of few plants in China for environmental issues and maintenance
Business performance
Sales volume up by 16% with ramping up of Vilayat plant
Achieved 100% utilisation in Q2
Business development activities coupled with LIVA brand launch supported increase in domestic volumes
Standalone EBITDA increased by 51% YoY
Higher volumes
Improved margins from 9% to 13%
o Lower pulp and other input cost
o Operational efficiency gains
* Effective capacity for the period

17
Sep
- 1
5 0.7
0.9 1.1 1.3 1.5 1.7 1.9 2.1 2.3
Ap
r-1
3
Jun
-13
A
ug-
13
O
ct-1
3
Dec
-13
Fe
b-1
4
Ap
r-1
4
Jun
-14
A
ug-
14
O
ct-1
4
Dec
-14
Fe
b-1
5
Ap
r-1
5
Jun
-15
A
ug-
15
International Fibre Prices
VSF continues to hold favorable position in comparison to other
fibres
Preference for comfort fabric leading to increase in demand for high
quality cellulosic fibre
Rising population and increasing prosperity in developing
economies
Prices likely to be influenced by
Development in China - Resumption of operations of shut capacities
Competing fibre prices trend
Developments in the down stream industry
Concerted market and product development activities for demand
expansion in domestic segment
Liva brand to improve usage of VSF products
Continued focus on improving quality and share of specialty
products
VSF: Outlook
1.52
0.94
1.90
Grey VSF Cotton PSF
$/ Kg

18
Chemical
Largest Chlor-Alkali manufacturer in India
Largest producer of Epoxy Resins in India
Largest value-added product portfolio including water
treatment chemicals

19
Business Performance
Revenue up by 21%
Epoxy volumes up by 78% with product
approvals from major customers in place
Vilayat Caustic plant achieved ~96% capacity
utilisation for the period
EBITDA up by 10% at ` 1.9 bn.
Increase in volume
Healthy EBITDA margin
Chemical Business : H1 FY16 Performance
(` Bn.) 2013-14 2014-15 H1
2015-16
Capacity (000’ Ton)* 352 452 226
Sales Volume Caustic Soda (‘000 MT)
314 409 220
Net Revenue 10.7 17.0 10.1
EBIDTA 2.3 2.9 1.9
EBIDTA Margin 21% 18% 18%
EBIT 1.6 2.0 1.4
Merger of Aditya Birla Chemicals (India) Ltd. with the Company under process (w.e.f.
1.4.2015) Caustic Soda capacity to increase from 452K TPA to 804K TPA
ABCIL completed acquisition of Odisha plant (59K TPA) from Jayshree Chemicals
* Effective capacity for the period
20
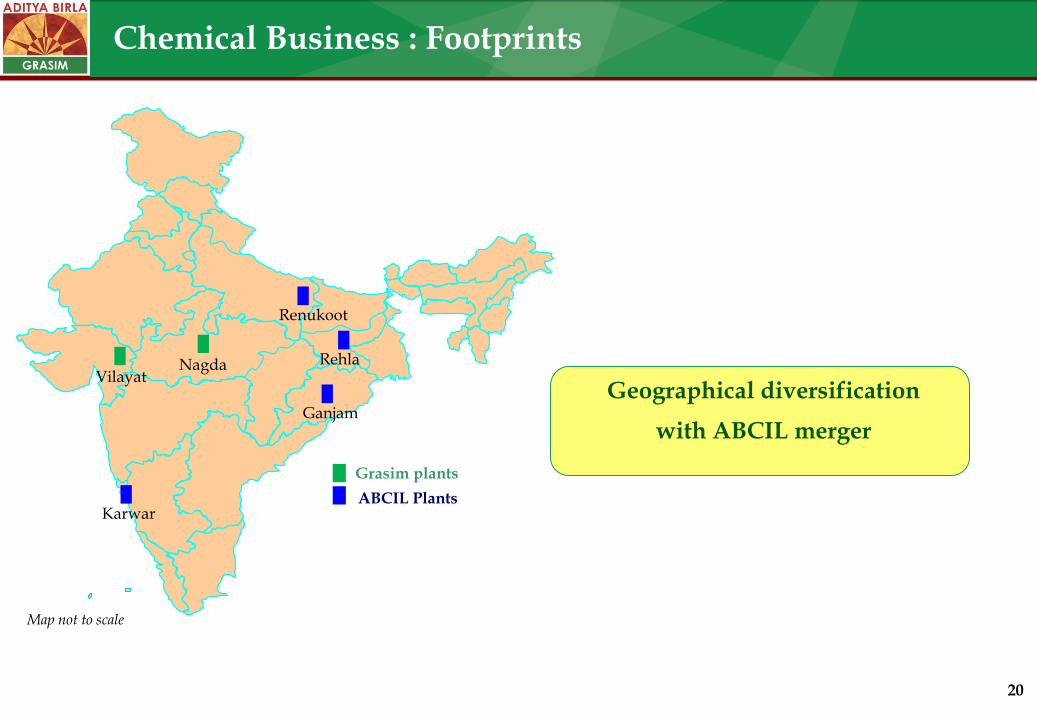
Map not to scale
Chemical Business : Footprints
Grasim plants
ABCIL Plants
Nagda
Vilayat
Karwar
Renukoot
Rehla
Geographical diversification
with ABCIL merger
Ganjam

Cement
No. 1 RMC player in India
With > 100 plants No.1 Player of White Cement
& Cement based Putty
Different Products to provide
complete Building Solutions
``q
India’s Largest Selling
Brand
22
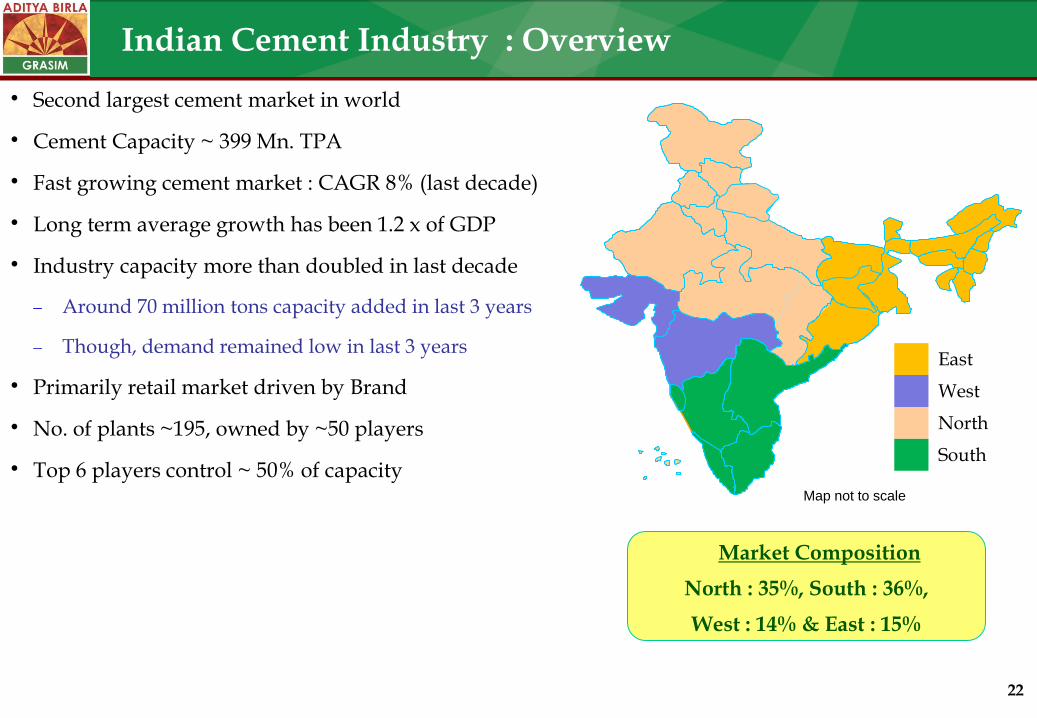
Indian Cement Industry : Overview
Second largest cement market in world
Cement Capacity ~ 399 Mn. TPA
Fast growing cement market : CAGR 8% (last decade)
Long term average growth has been 1.2 x of GDP
Industry capacity more than doubled in last decade
Around 70 million tons capacity added in last 3 years
Though, demand remained low in last 3 years
Primarily retail market driven by Brand
No. of plants ~195, owned by ~50 players
Top 6 players control ~ 50% of capacity Map not to scale
East
West
North
South
Market Composition
North : 35%, South : 36%,
West : 14% & East : 15%

23
Global Cement Capacity and Per Capita Consumption
Top Cement Producing Countries - 2014 Per Capita Consumption - 2014
________________________________________________________ Source: Cembureau ,Company Estimate
_________________________________________________________ Source: Cembureau, Company estimates, Population - IMF
India’s per capita consumption (200 kgs) is lowest among developing nations
(Brazil ~355 kgs, China ~1,780 kgs, World Average ~600 kgs)
Low per capita consumption reflects significant potential for future growth
1,780
830
600 470
355 280
200
Ch
ina
Tu
rkey
Wo
rld
Ru
ssia
Bra
zil
US
A
Ind
ia
Kgs/person
2,438
255 81 71 72 68
Ch
ina
Ind
ia
US
A
Tu
rkey
Bra
zil
Ru
ssia
Mn. Tons

24
Cement – Major Growth Drivers in India
Housing
Infrastructure
Favorable demographics with growing young population
Rising affordability - Increasing income level
Government vision of house for every family by 2022
Rapid Urbanisation (28.7% in 2005 to exceed 40% by 2030)
No. of Cities with population of 1Mn.+ to grow from 33 in 2005 to 68 in 2030
Demand from urban housing to improve with softening of interest rates
Investment projected across various Infrastructure segments
Government’s focus on building concrete highways
Western and Eastern dedicated freight corridor with investment of ~$ 13 Bn.
Metro projects in tier II cities (~$ 17 Bn.)
5 new Mega Power Projects each of 4000 MW in the Plug-and-Play mode (~$ 16 Bn.)
Target of 175,000 MW renewable energy by 2022
30% higher allocation for infrastructure (~$ 48 Bn.)
Commercial & Industrial Investments
Demand from IT / ITES
Expected revival in corporate capex
Emerging growth from resources based industries from Eastern India

25
8.5
12.1
5.7
7.1
5.2
2.6 3.5
0
2
4
6
8
10
12
14
08-09 09-10 10-11 11-12 12-13 13-14 14-15
Capacity addition pace slowing down….. Leading
towards improvement in utilisation
Setting up new Cement capacity becoming more
challenging due to
Tougher land acquisition process
Increased gestation period
Lower availability of new limestone mines
Softening of energy prices in global markets augur
well for the Cement sector
Cement Sector Outlook
Industry Capacity Trend
% Growth
Source: Company Estimates, DIPP data
Cement Demand Growth Trend
216
276 304 319
353 364 386
178 203 214
229 241 247 256
0
100
200
300
400
08-09 09-10 10-11 11-12 12-13 13-14 14-15
Capacity Production
Mn. Tons

26
Cement Business : Key Strengths
Excellent growth record
From 8 Mn. TPA in FY2000 to ~75 Mn. TPA
Grew organically as well as inorganically
Market Leadership
“UltraTech” – Premium brand, largest in India
Leadership in key consuming markets
Strong nationwide distribution network
Cost leadership
Economy of scale with large size kilns
Latest technology plants
Assured power supply thru’ captive thermal power plants meeting 80% of power requirement
Hub and Spoke model thru’ split grinding units / terminals near markets and efficient logistics
Leadership in Ready Mix Concrete and White Cement business
Strong brand with pan India presence
8.2 14.2
29.7 35.0
51.8
63.2
99-00 03-04 04-05 07-08 11-12 14-15 15-16
Capacity (Mn. Tons)
Continuous Growth in Capacity
74.8#
# Post acquisition of JAL’s MP assets
67.7

27
Hyderabad
Map not to scale
Shambhupura
Jawad
Raipur
Malkhed
Jodhpur
Reddipalayam
Bangalore
Bhatinda
Hotgi
Pipavav
Jafrabad
Magdalla Awarpur
Hirmi
Durgapur
Tadpatri
Arakonam
Ratnagiri
B Navi Mumbai
B Mangalore
Kotputli
Dadri
Panipat
Jharsuguda
Aligarh
Ginigera
Integrated Plants 12
Integrated plants under acquisition 2
Grinding units 14
Grinding Units in progress 2
White Cement Plant 1
Putty Plant 2
Bulk Terminals 6
B
Cement Business Footprint – A Pan India Player
P Katni
P
P
B Cochin
Sewagram
Wanakbori
Bela Sidhi
Dankuni
Patliputra
Jhajjar
Nagpur
Current Mix FY16 Mix
North 19.0 29% 23.9 34%
East 9.8 15% 11.4 16%
West 20.5 32% 20.5 28%
South 15.5 24% 15.5 22%
All India 64.7 100% 71.2 100%
Overseas 3.0 3.6
Total 67.7 74.8
B
B
B Pune

28
Industry Scenario
Industry off take estimated flat at ~1%
Low capacity utilisation for the sector
Positive signs on cost front with softening of petcoke costs
Raw material cost impacted with increased royalty on limestone
Business Performance
Revenue up by 5%
- Volume growth of 5% despite slowdown
Capacity utilisation for the Indian operations
at 76%
EBITDA up by 5% at ` 23.9 Bn.
- Saving in energy cost with higher usage of petcoke and decline in fuel prices
- Offset partially due to District Mineral Development levy
Cement Business : H1 FY16 Performance
(` Bn.) 2013-14 2014-15 H1
2015-16
Capacity (Mn. Ton) 57.0 63.2 33.8
Sales Volume Cement and Clinker (Mn. Tons)
44.7
48.2
24.5
Net Revenue 216.5 243.5 124.4
EBIDTA 43.6 47.8 23.9
EBIDTA Margin 20% 19% 19%
EBIT 32.2 35.7 14.4

29
Cement Business: Strategy for profitable growth
7
Capacity to increase to ~75 Mn. TPA on completion of existing projects and acquisition
Grinding unit in Bihar : 1.6 Mn. TPA
Grinding unit in Bahrain : 0.6 Mn. TPA
Acquisition of JAL’s Bela and Siddhi units : 4.9 Mn. TPA
Strengthening cost competitiveness
Investments in logistics infrastructure – grinding units, bulk terminal in Maharashtra and jetty expansion in
Gujarat
Continuous increase in use of petcoke to optimise fuel mix
Putting up waste heat recovery system for cheaper power

30
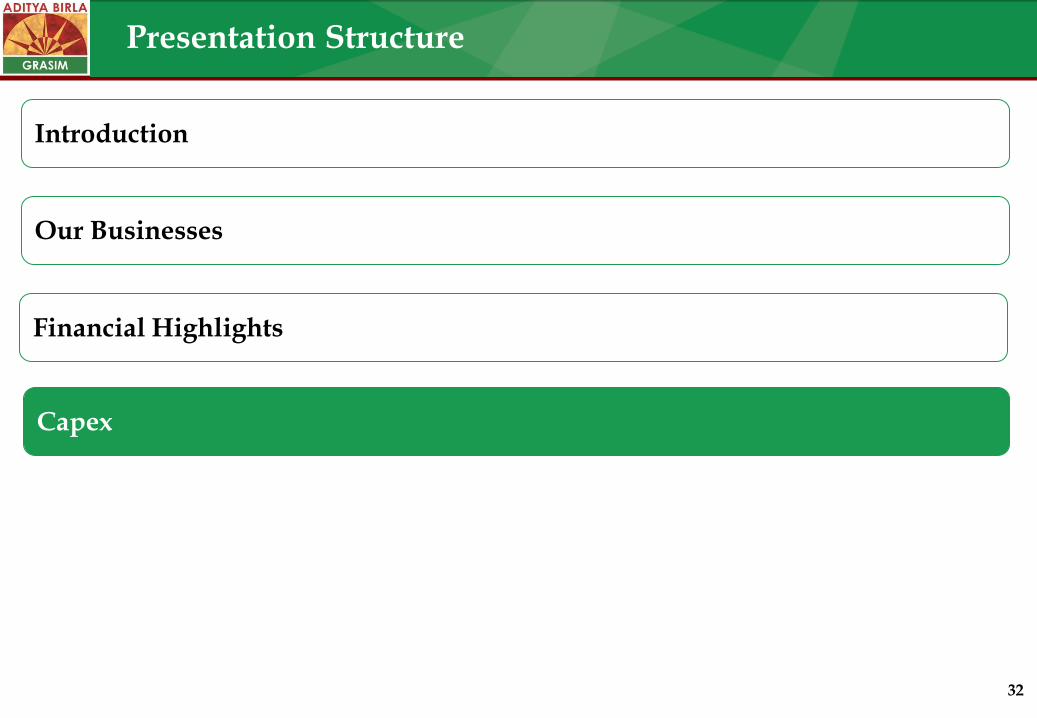
Presentation Structure
Introduction
Our Businesses
Financial Highlights
Capex
Summary

31 Q2FY15 Q2FY16 H1FY15 H1FY16
EBITDA
4.3 4.9
6.2 7.3
16.0 18.4
30.4
35.0
4.2 4.9
9.0 9.7
12.8 14.9
27.7 30.2
79.4 83.9
159.9 169.9
3.0 3.4
4.1 4.4
Net Profit Revenue
Financial Performance – Q2 / H1FY16
Q2FY15 Q2FY16 H1FY15 H1FY16
15%
Standalone
Revenue
Q2FY15 Q2FY16 H1FY15 H1FY16
Net Profit EBITDA
16%
Consolidated
Q2FY15 Q2FY16 H1FY15 H1FY16 Q2FY15 Q2FY16 H1FY15 H1FY16
Q2FY15 Q2FY16 1FY15 H1FY16
15%
Amount in ` Cr.
6%
13%
17%
17% 15%
10%
9% 6% 8%
32
Presentation Structure
Introduction
Our Businesses
Financial Highlights
Capex

33
Capex plan
# Represents residual capex of brownfield expansion projects already commissioned and Grinding unit at Bihar
Capex
(Net of CWIP as on
1-4-15)
Cash Outflow
FY16 FY17 onward
Standalone
VSF Expansion : Vilayat (120K TPA) – Residual Capex 1.6
Nagda Revamp 1.5
Normal Capex : VSF 2.6
: Chemical & Others 1.5
Standalone Capex (A) 7.2 4.3 3.0
Cement Subsidiary
Capacity expansion # 16.8
Logistic Infrastructure 6.6
RMC Business 1.2
Modernisation, Upgradation, Coal Mines and others (Incl. Land) 24.3
Cement Business Capex (B) 48.9 27.1 21.8
Capex (A + B) 56.1 31.4 24.8

34
Grey Cement
67.7 Mn. TPA
Pulp & Fibre
VSF 498K TPA
VSF JV China
Overseas
Pulp JVs
AV Terrace Bay 353K TPA (40%)
Domsjo 255K TPA (33.3%)
AV Nackawic 190K TPA (45%)
AV Cell 130K TPA (45%)
Grasim Bhiwani Textiles
18 Mn. Mtr. (100%)
UltraTech Cement (60.25%)
Grasim Group Structure
Idea Cellular (4.75%)
Birla Jingwei
70K TPA (26%)
Pulp 70K TPA
Others
Domestic
Overseas 3 Mn. TPA,
(UAE, Bangladesh, Sri Lanka)
12 Composite Plants
14 Split Grinding Units
>100 RMC Plants
White Cement & Putty
1.4 Mn. TPA
Nagda 162K TPA
Kharach 128K TPA
Harihar 87K TPA
Vilayat 120K TPA
Nagda 270K TPA
Vilayat 182K TPA
23
Epoxy 51K TPA
Caustic 452K TPA
BCML (26%)
Chemical
Harihar
70K TPA
Standalone Subsidiary JV JV Associate

Thank You
Contacts:
Grasim Industries Limited
(Corporate Finance Division)
Aditya Birla Centre,
S.K. Ahire Marg, Worli, Mumbai - 400 030
CIN: L17124MP1947PLC000410
Sharad Agarwal +91-22-66525062 [email protected]
Shirin Sancheti +91-22-66525097 [email protected]

Grasim Industries Limited - A VSF and Cement Major
(Supplement)

37
Supplement
• Consolidated Financial Performance
• Standalone Financial Performance
• Balance Sheet - Grasim
• Balance Sheet – UltraTech (Consolidated)
• Consolidated Businesswise Performance
38
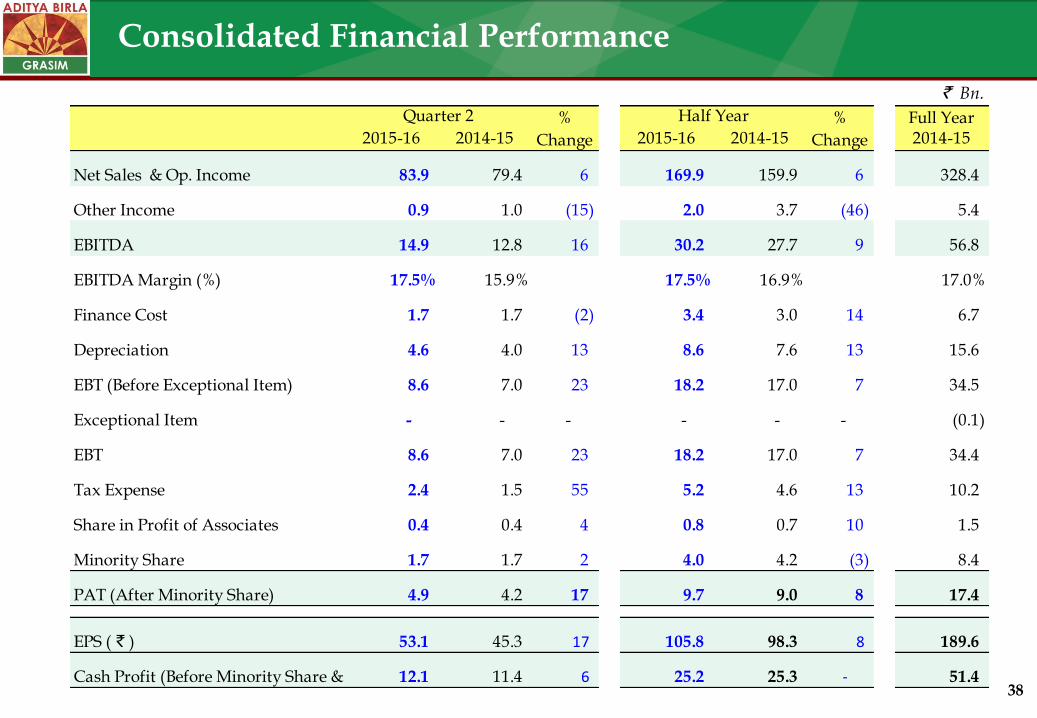
Consolidated Financial Performance
` Bn.
Full Year2015-16 2014-15 2015-16 2014-15 2014-15
Net Sales & Op. Income 83.9 79.4 6 169.9 159.9 6 328.4
Other Income 0.9 1.0 (15) 2.0 3.7 (46) 5.4
EBITDA 14.9 12.8 16 30.2 27.7 9 56.8
EBITDA Margin (%) 17.5% 15.9% 17.5% 16.9% 17.0%
Finance Cost 1.7 1.7 (2) 3.4 3.0 14 6.7
Depreciation 4.6 4.0 13 8.6 7.6 13 15.6
EBT (Before Exceptional Item) 8.6 7.0 23 18.2 17.0 7 34.5
Exceptional Item - - - - - - (0.1)
EBT 8.6 7.0 23 18.2 17.0 7 34.4
Tax Expense 2.4 1.5 55 5.2 4.6 13 10.2
Share in Profit of Associates 0.4 0.4 4 0.8 0.7 10 1.5
Minority Share 1.7 1.7 2 4.0 4.2 (3) 8.4
PAT (After Minority Share) 4.9 4.2 17 9.7 9.0 8 17.4
EPS ( ` ) 53.1 45.3 17 105.8 98.3 8 189.6
Cash Profit (Before Minority Share & EI) 12.1 11.4 6 25.2 25.3 - 51.4
Half YearQuarter 2 %
Change
%
Change
39
Full Year 2015-16 2014-15 2014-15 2013-14 2014-15
Net Sales & Op. Income 18.4 16.0 15 35.0 30.4 15 63.3
Other Income 2.1 2.1 (2) 2.3 2.7 (14) 3.5
EBIDTA 4.9 4.3 15 7.3 6.2 17 10.1
EBIDTA Margin (%) 24.0% 23.5% 19.5% 18.8% - 15.2%
Finance Cost 0.14 0.09 - 0.3 0.15 88 0.4
Depreciation 0.8 0.6 35 1.6 1.2 41 2.6
EBT (Before Exceptional Item) 3.9 3.5 11 5.4 4.9 9 7.1
Exceptional Item - - - - - - (0.3)
EBT 3.9 3.5 11 5.4 4.9 9 6.8
Tax Expense 0.5 0.5 0 0.9 0.9 9 1.6
PAT 3.4 3.0 13 4.4 4.1 10 5.3
EPS ( ` ) 36.8 32.6 13 48.3 44.1 10 57.6
Cash Profit (Excl. EI) 4.8 4.2 14 7.0 6.1 15 9.7
Scenario Actual Actual #REF!
Year 2013 2012 2011
Period Sep Sep Mar
View Qtd Qtd #REF!
Value <Entity Curr Total><Entity Curr Total> #REF!
ICP [ICP TOP] [ICP TOP] #REF!
Entity GIL_IFS GIL_IFS #REF!
Custom1 TOTC1 TOTC1 #REF!
Custom2 TOTC2 TOTC2 #REF!
Custom3 TOTC3 TOTC3 #REF!
Custom4 TOTC4 TOTC4 #REF!
Full Year
2015-16 2014-15 2015-16 2014-15 2014-15
Net Sales & Op. Income 1,838.1 1,599.8 15 3,495.4 3,039.3 15 6,332.6
Other Income 206.7 211.4 (2) 228.6 266.6 (14) 348.1
PBIDT 490.5 425.4 15 728.0 621.3 17 1,013.0
PBIDT Margin (%) 24.0% 23.5% 19.5% 18.8% 15.2%
Finance Cost 13.8 9.0 53 27.5 14.6 88 39.3
Depreciation 84.1 62.4 35 162.8 115.4 41 262.5
PBT 392.6 353.9 11 537.7 491.3 9 711.2
Exceptional Item - - - - - - (26.2)
PBT (After Exceptional Item) 392.6 353.9 11 537.7 491.3 9 684.9
Tax Expense 54.4 54.5 0 93.7 86.1 9 155.0
PAT 338.2 299.4 13 444.0 405.3 10 529.9
EPS 36.8 32.6 13 48.3 44.1 10 57.6
Cash Profit 476.7 416.3 14 700.5 606.7 15 973.7
Cash Profit 476.7 416.3 14 700.5 606.7 15 973.7
Quarter 2 %
Change
%
Change
Quarter 2 %
Change
Half Year %
Change
Half Year
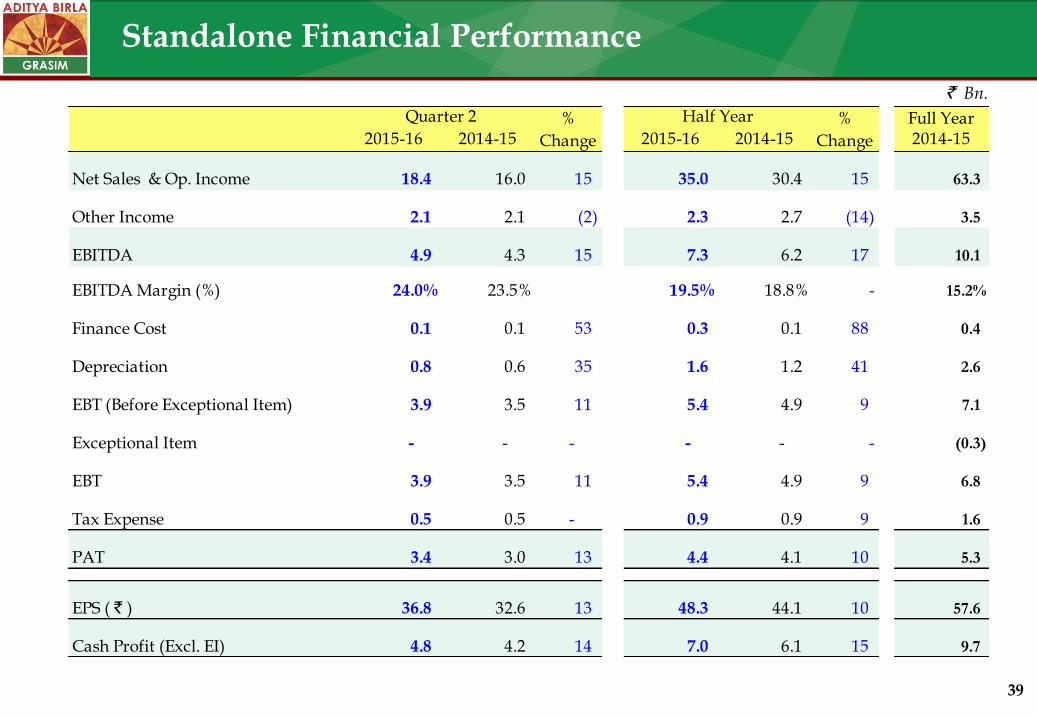
Standalone Financial Performance
` Bn.
Full Year 2015-16 2014-15 2015-16 2014-15 2014-15
Net Sales & Op. Income 18.4 16.0 15 35.0 30.4 15 63.3
Other Income 2.1 2.1 (2) 2.3 2.7 (14) 3.5
EBITDA 4.9 4.3 15 7.3 6.2 17 10.1
EBITDA Margin (%) 24.0% 23.5% 19.5% 18.8% - 15.2%
Finance Cost 0.1 0.1 53 0.3 0.1 88 0.4
Depreciation 0.8 0.6 35 1.6 1.2 41 2.6
EBT (Before Exceptional Item) 3.9 3.5 11 5.4 4.9 9 7.1
Exceptional Item - - - - - - (0.3)
EBT 3.9 3.5 11 5.4 4.9 9 6.8
Tax Expense 0.5 0.5 - 0.9 0.9 9 1.6
PAT 3.4 3.0 13 4.4 4.1 10 5.3
EPS ( ` ) 36.8 32.6 13 48.3 44.1 10 57.6
Cash Profit (Excl. EI) 4.8 4.2 14 7.0 6.1 15 9.7
Quarter 2 %
Change
%
Change
Half Year

40
Balance Sheet - Grasim
* ` Bn.
30th Sep'15 31st Mar'15 EQUITY & LIABILITIES 30th Sep'15 31st Mar'15
116.3 111.8 Net Worth 241.6 231.4
- - Minority Interest 79.9 76.8
10.1 11.2 Borrowings 112.6 119.3
7.1 6.2 Deferred Tax Liability (Net) 36.9 34.1
13.7 14.5 Liabilities & Provisions 79.9 78.7
147.2 143.7 SOURCES OF FUNDS 550.9 540.3
ASSETS
51.6 51.9 Net Fixed Assets 293.2 285.5
5.6 5.2 Capital WIP & Advances 34.2 35.1
- - Goodwill on Consolidation 33.5 32.8
Investments
26.4 26.4 Cement Subsidiary - -
13.2 11.0 Liquid Investments 53.6 57.9
16.2 16.2 Other Investments 16.8 14.7
34.2 33.0 Current Assets, Loans & Advances 119.6 114.3
147.2 143.7 APPLICATION OF FUNDS 550.9 540.3
(3.1) 0.2 Net Debt 58.9 61.4
- - Net Debt : Equity 0.18 0.20
- 0.02 Net Debt : EBIDTA 0.98 1.08
Standalone Consolidated

41
Balance Sheet – UltraTech (Consolidated)
* ` Bn.
EQUITY & LIABILITIES 30th Sep'15 31st Mar'15
Net Worth 200.8 190.4
Minority Interest 0.1 0.2
Borrowings 93.2 98.3
Deferred Tax Liability (Net) 29.7 27.9
Liabilities & Provisions 63 63.8
SOURCES OF FUNDS 386.9 380.5
ASSETS
Net Fixed Assets 230.8 222.9
Capital WIP & Advances 27.6 29.0
Goodwill on Consolidation 11.0 10.5
Investments
Liquid Investments 39.8 46.3
Other Investments 0.2 0.2
Current Assets, Loans & Advances 77.5 71.6
APPLICATION OF FUNDS 386.9 380.5
Net Debt 53.3 52.0
Net Debt : Equity 0.27 0.27
Net Debt : EBITDA 1.12 1.09

42
Viscose Staple Fibre : Summary (Standalone)
* Operational capacity during the period
Full Year
2015-16 2014-15 2015-16 2014-15 2014-15
Capacity* K TPA 125 108 15 249 202 23 434
Production K MT 121 101 20 215 191 13 408
Sales Volumes K MT 114 101 13 216 187 16 403
Net Revenue ` Bn. 14.4 12.7 13 26.9 23.6 14 49.7
EBITDA ` Bn. 2.1 1.5 40 3.5 2.3 51 4.7
EBITDA Margin % 14.6% 11.8% -- 12.9% 9.7% -- 9.3%
EBIT ` Bn. 1.6 1.1 37 2.4 1.7 45 3.1
Capital Employed (Incl. CWIP) ` Bn. 51.9 52.3 (1) 51.9 52.3 (1) 52.8
ROAvCE (Excl. CWIP) % 13.1% 12.5% -- 10.0% 9.1% -- 7.5%
Quarter 2 %
Change
Half Year %
Change

43
Full Year
2015-16 2014-15 2015-16 2014-15 2014-15
Capacity K TPA 113 113 - 226 226 - 453
Production K MT 113 102 12 213 202 6 412
Sales Volumes K MT 118 98 20 220 196 12 409
Net Revenue ` Bn. 5.2 4.2 26 10.1 8.3 21 17.0
EBITDA ` Bn. 0.9 0.8 17 1.9 1.7 10 2.9
EBITD Margin % 17.7% 18.9% -- 18.4% 20.4% -- 18.0%
EBIT ` Bn. 0.7 0.6 - 1.4 1.22 12 2.0
Capital Employed (Incl. CWIP) ` Bn. 19.8 19.5 2 19.8 19.5 2 19.2
ROAvCE (Excl. CWIP) % 14.4% 12.2% -- 14.7% 13.4% -- 10.9%
Half YearQuarter 2 %
Change
%
Change
Chemical : Summary

44
Cement : Summary
Includes captive consumption for RMC
$$ Includes captive consumption for value added products
Full Year
2015-16 2014-15 2015-16 2014-15 2014-15
Grey Cement
Capacity Mn. TPA 16.90 15.45 9 33.80 30.85 10 63.15
Production Mn. MT 11.45 10.91 5 24.30 22.95 6 46.71
Cement Sales Volumes $ Mn. MT 11.44 10.92 5 24.31 23.09 5 47.09
Clinker Sales Volumes Mn. MT 0.07 0.25 (72) 0.15 0.51 (71) 1.08
White Cement & Putty
Sales Volumes $$ Lac MT 3.22 2.99 8 5.89 5.56 6 12.24
Net Revenue ` Bn. 60.1 57.7 4 124.4 118.0 5 243.4
EBITDA ` Bn. 11.0 9.9 12 23.9 22.8 5 47.8
EBITD Margin % 18.2% 17.0% -- 19.0% 18.9% -- 19.3%
EBIT ` Bn. 7.5 6.7 13 14.4 14.2 1 35.7
Capital Employed (Incl. CWIP) ` Bn. 342.9 327.4 5 342.9 327.4 5 346.8
ROAvCE (Excl. CWIP) % 9.6% 9.2% -- 9.1% 10.3% -- 12.4%
Half Year %
Change
Quarter 2 %
Change