grasping an object at floor-level: is movement strategy a
TRANSCRIPT
HAL Id: hal-01912635https://hal.archives-ouvertes.fr/hal-01912635
Submitted on 5 Nov 2018
HAL is a multi-disciplinary open accessarchive for the deposit and dissemination of sci-entific research documents, whether they are pub-lished or not. The documents may come fromteaching and research institutions in France orabroad, or from public or private research centers.
L’archive ouverte pluridisciplinaire HAL, estdestinée au dépôt et à la diffusion de documentsscientifiques de niveau recherche, publiés ou non,émanant des établissements d’enseignement et derecherche français ou étrangers, des laboratoirespublics ou privés.
Distributed under a Creative Commons Attribution - NonCommercial - NoDerivatives| 4.0International License
Grasping an object at floor-level: Is movement strategya matter of age?
Martine A. Gilles, Pascal Wild
To cite this version:Martine A. Gilles, Pascal Wild. Grasping an object at floor-level: Is movement strategy a matterof age?. Applied Ergonomics, Elsevier, 2018, 70, pp.34 - 43. �10.1016/j.apergo.2018.02.002�. �hal-01912635�

Grasping an object at floor-level: Is movement strategy a matter of age?
Martine A. GILLES and Pascal WILD
Département Homme au Travail, INRS Lorraine, 1, rue du Morvan, CS60027, 54 519 Vandœuvre
Cedex, France
Highlights
7 postural strategies to pick up parts were identified based on simultaneous analysis of 17
kinematics variables.
Most operators used more than one strategy when collecting parts.
No strategy was observed to be specific to a particular age group.
The number of strategies used by an operator decreased with increasing age.
Abstract
Bending down to pick things up off the floor is something that we do every day. This multisegment
task can be done in a considerable number of postural configurations because of the large number of
degrees of freedom to be controlled when executing it. In this study where volunteers performed a
repetitive bending task, multisegment kinematic analysis allowed us to identify seven different
bending strategies. Most operators used more than one bending strategy, but no particular strategy-
type was found to be specific for a specific age group. However, the number of strategies used by an
operator decreased with increasing age. It therefore appears that this factor influences the variability
of the strategies used when repeatedly executing a movement involving the lower limbs to collect
small objects from floor-level. This decrease in movement variability in senior operators may
contribute to their increased risk of developing musculoskeletal disorders.
Key words: bending strategy, age, work pace, squat and stoop
Introduction
Picking objects up off the floor is an action that we perform every day. Adult humans are familiar
with this movement and no longer need to learn it. However, this multisegment task can take a
considerable number of postural configurations as there are a large number of degrees of freedom to
control when executing it. The action of squatting has been the subject of a large number of studies
aiming to determine the biomechanical constraints on the lumbar region during transport of heavy
loads (Anderson and Chaffin 1986, van Dieën 1999, Sheppard 2012). Three types of lifting
techniques have often been compared: the squat, the semi-squat, and the stoop (Burgess-Limerick
and Abernethy 1997, van Dieën et al. 1999, Straker 2003). Several studies have compared the
respective benefits and advantages of these different techniques, and various factors have been found
to promote use of one or the other. Some of these factors are linked to the object carried – such as its
weight (Hoozemans et al. 2008), how cumbersome it is, the height from which it must be collected
and that at which it must be deposited (Burgess-Limerick et al. 2001), the speed of transfer (Lin et al.
1999) or its trajectory (de Looze et al. 1998) – while others correspond to the functional capacities of
the carrier – such as their gender (Lindbeck and Kjellberg 2001, Plamondon et al. 2014b, Sheppard et
al. 2016) or age (van Dieën et al. 1994), the muscles solicited (Trafimow et al. 1993), the
physiological cost (Kumar 1984), the oxygen consumption during the exercise (Hagen and Harms-
Ringdhal 1994) or how much experience the carrier has with transporting heavy loads (Plamondon et
al. 2010, 2014a). This last point illustrates how expertise causes carriers to adapt their posture
depending on the context, as determined by the object (weight, dimensions, fragility) or the trajectory
to be covered between the initial point and the destination.
In these previous studies, the expertise which determines how the carrier moves appears to be closely
linked to the characteristics of the object to be transported. But what variations in movement would
be observed if the external constraints such as the volume of the object, or its weight, were no longer
the main constraints for the task? In this type of situation, internal constraints, directly linked to the
subject such as age (which could influence their functional capacities), appear to be one of the most
significant factors determining the variability of the final movement (Gaudez et al, 2016). These
constraints take on even greater importance in the current socio-economic context where older
workers remain at work for longer. With advancing age, changes to muscle properties can combine
with a worker’s capacity to repeat a physically demanding movement, such as collecting objects from
the floor (Duchateau et al. 2006, Gibo et al. 2013). The capacity to repeat this movement will be all
the more hampered when a rapid work pace is added to age-related constraints (Gilles et al., 2017).
Nevertheless, numerous elements remain to be modulated when performing the movement. For
example, the trajectories of the limbs are involved, the speed of execution and any obstacles that
must be avoided have to be considered (Rosenbaum et al. 2001). Planning a movement also involves
a conscious decision to grasp an object with the aim of doing something with it. This aspect gives
sense to the movement (Bril and Goasdoué 2009, Bril 2015). To study and analyse motor variability,
it is important to provide the means to give sense to a movement when planning it. It was with this
objective in mind that the task analysed in this study was designed. The task involves collecting parts
stored at floor-level, for their assembly with another part on a mounting table.
A previous paper presented results from classical movement analysis performed on the same task
(Gilles et al., 2017). This exhaustive analysis of the data provided us with an extensive range of
information through which we could understand the physiological limitations involved in performing
a task requiring squatting. These limitations were determined by the age of the person executing the
task and/or the pace of the work. However, examining the different joints independently makes it
difficult to understand the overall posture adopted when performing a task. Thus, a certain number of
questions relating to the segmentary strategy implemented when collecting the parts could not be
solved by this method. Indeed, the disparity of results obtained during the first analysis suggested the
existence of intra-subject postural variability, but also of inter-subject postural variability determined
by internal factors, such as age, or external factors, such as pace. In this paper, we hypothesize that
the disparity of results observed might be due to a series of co-existing strategies.
The objective of the work described in this paper was to perform a multisegment analysis to better
identify the postural strategies adopted during the task requiring collection of objects placed at floor-
level. With respect to these strategies, the questions were twofold: First, is there a dominant strategy
characteristic of each age group? Second, does the same person use more than one strategy? And, if

more than one strategy is identified, what is level of variability in these strategies? Is this level of
variability influenced by age or the pace of work?
Methods
Participants
Sixty-three right-handed men voluntarily participated in this experiment. Volunteers were recruited
based on two main selection criteria. First, subjects had to be in one of the three following age-
groups: junior (J) from 30 to 35 years old, median (M) from 45 to 50 years old, or senior (S) 60 to 65
years old. The characteristics of subjects in each of these age-groups are presented in Table 1. In
addition, all subjects had to have worked or still be working in what is considered a "physically
demanding" job to ensure relatively homogeneous evolving functional capacities. Volunteers were
recruited either through temporary employment agency or through advertisements published in local
newspapers. Participants’ functional capacities were assessed before the experiment based on tests of
flexibility, dexterity (based on the Purdue pegboard test (Desrosiers et al., 1995)), speed of upper
limb movement, and analysis of the muscular force of the upper and lower limbs. All subjects gave
their free and informed consent for participation in this study, the protocol for which was approved
by the ethics committee for biomedical research at our Institute.
Procedure
Subjects were asked to perform an assembly task in conditions similar to those encountered at an
assembly-line workstation. The height of the workstation was adapted to the size of each subject. The
task involved several successive actions executed in a cyclic and repetitive manner at a defined work
pace. A single assembly cycle involved collecting an assembly base from a distributor/collector of
parts, moving between the distributor and the workstation, collecting parts stored at floor-level under
the assembly table, assembly of the parts with the base on the worktable, and finally, once all parts
had been assembled, return to the distributor/collector (Figure 1). In this paper, analysis focused on
the action of collection of the parts, one handle (200 g) and two nuts (7 g each), stored under the
workstation. No recommendations were made on how to proceed when collecting the parts stored at
floor-level. The only obligation was that, during each assembly round, the precise number of parts
required should be collected, rather than amassing a reserve for subsequent assembly tasks.
The repeated assembly cycles, which included collection of spare parts from the floor-level reserve,
were performed during two work sessions, each of which lasted 20 minutes. For each of these
sessions, a different work pace was imposed by the base distributor. Subjects had access to real-time
visual information on their progress with respect to the prescribed work pace. The pace was either
comfortable, corresponding to 25 seconds per assembly cycle, i.e., a total of 49 assemblies, or rapid,
at 20 seconds per assembly cycle, i.e., 60 assembly cycles to be completed. The order in which
sessions were completed was randomised, but as many subjects from each age-group started by one
or other of the paces. The pace was monitored continuously throughout the work session. A verbal
reminder of the requirement to maintain the pace was given to subjects if they slowed down.

Apparatus
The postures adopted during repeated assembly cycles involving collection of parts from floor-level,
were video recorded throughout the experimental sessions.
3D modelling of each assembly cycles was computed with Motion Inspector® software. Modelling
was based on three superimposed models: i) an anthropometric model using 67 anthropometric
measurements for each subject (Hanavan, 1964); ii) an inverse dynamic model using the forces and
moments exerted at ground-level, as recorded using an AMTI®-type force plate, and the forces and
moments exerted on the assembly table, recorded using an ATI® sensor. All dynamic signals were
recorded at a frequency of 200 Hz. iii) a kinematic model using the displacement of 37 passive
markers - placed on the subject in relation to anatomical landmarks - measured at a frequency of
50 Hz using an optoelectronic system (Vicon 460®). These three combined models allowed us to
compute 14 body segments (two feet, two legs, two thighs, one pelvis, one abdomen, one thorax, two
arms, two forearms, and one head) and to reconstruct joint centres corresponding to the joints linking
the different segments.
Among all of the variables modelled, 17 were selected to characterise the movement involved in
collecting the spare parts. These variables were measured and calculated from an orthonormal
reference position (Figure 2a). The variables were as follows:
- the amplitude of downwards motion of the joint centre for the sacrum. This measurement
corresponds to the difference in vertical position of the joint centre for the sacrum between the
upright posture and the posture at its lowest point relative to the ground during collection of the
parts.
- the distances between the joint centres for the right and left toes and between those of the right and
left knees, relative to the anteroposterior, medio-lateral and vertical axes, and the distances
between the joint centres of the heels relative to the medio-lateral and vertical axes. These
distances were measured when the sacrum was located at its lowest point relative to the ground.
They were used to record differences in position between the joint centres associated with the
lower left limb and those associated with the lower right limb. They were calculated for each test
and relative to each of the axes. The anteroposterior distance between the heels was not included
among the variables as it was redundant with the anteroposterior distance between the toes.
Therefore, it would have given too much weight to this information in the analysis. A positive
distance indicates that the lower left limb is located anterior to the anteroposterior axis, or higher
relative to the vertical axis, than the lower right limb.
- the Euler angles for flexion of the ankles, knees and hips, as well as the abduction angles for the
hips. These angles were calculated in line with the recommendations provided by the International
Society for Biomechanics (Wu & Cavanagh, 1995, Wu et al., 2002). The angles were measured
when the joint centre of the sacrum was located at its lowest point relative to the ground, and were
compared to those measured for the reference posture (subject standing upright, arms aligned with
the trunk) recorded at the start of the experimental session. The detailed procedure through which
the angles were calculated was presented for the kinematic analyses of the full assembly task
(Gilles et al., 2017).
Statistical analysis
All statistical analyses were carried out using Stata software (StataCorp LLC, Tx). The first objective
of the analysis was to identify postural strategies. An agglomerative hierarchical clustering method
based on the Euclidean distance was performed. This clustering algorithm was based on 17 variables
after normalisation of each variable, using a complete linkage algorithm that is using the farthest pair
of observations between two groups to determine the proximity of the two groups. This normalisation
consisted in substracting from each variable its overall mean and dividing by the overall standard
deviation. This classification aims to identify, from all the recordings analysed, the different
categories of movement used when collecting parts. The strategies were characterised by a side-to-
side box plot of the 17 variables on which they were based. From these box-plots, each strategy was
assigned a posture name. The posture names were validated by both the video and the model.
The second objective was to assess whether the dominant strategy (the strategy that was most often
employed) is characteristic of the age group in both paces. The dominant strategy was cross-tabulated
with the age-group by work pace. The association was tested for each table using Fisher’s exact test.
A more formal approach was based on a mixed effect multinomial logistic regression fitted using a
generalized structural equation model (stata command gsem).
The third objective was to document the level of variability observed in the strategies used. In order
to do so, the number of strategies used was cross-tabulated with the age-group by pace and with pace.
Each table was tested using Fisher’s exact test. A more formal approach was based on a mixed effect
Poisson regression model (stata command mepoisson). In this model both main effects with and
without interactions were tested.
Results
Identification and characterisation of strategies
The agglomerative hierarchical clustering identified seven classes of postures used when collecting
parts from floor-level. These strategies were matched with the ones observed during parts-collection
when comparing with the video recordings. Segmental postures describing each of these seven
strategies could be interpreted from the data presented in boxplots (Figure 2). The dichotomy
between squatting and stooping can be observed in Figure 2b, which illustrates the difference in
amplitude of vertical displacement of the sacrum. For each strategy, Figure 2c shows the distribution
of the values for the distances between the right and left joint centres for the toes, heels and knees,
and Figure 2d shows how the values for the flexion angles for the lower limbs and for hip abduction
distributed. The order of presentation of the strategies in the classification is arbitrary. A full
description of the seven strategies is presented in Figure 3.
For five of the seven strategies, subjects used a large amplitude of flexion of the knees. The different
position configurations of the right and left lower limbs distinguish between the squatting techniques
in these different strategies. Not all of the mirror strategies between the right and the left were
observed. Among the five strategies, three of them are readily distinguished:
- Squat Knees Equally Descended (SKED): in this “sumo”-type position, subjects descend
symmetrically by bending their two lower limbs. All of the anteroposterior and vertical distances

between the left and right joint centres for the toes, the heels and the knees were null, and there was
significant abduction of the hips.
- Squat Right Knee Down 1, 2 and 3 (SRiKD 1 to 3): these strategies could be described as a “servant
knight” position, with the left foot placed flat on the floor forward of the right foot, which is flexed.
The right knee descends towards the ground whereas the lower left limb is at a right angle relative to
the ground. The distinctions between the three SRiKD strategies are quite subtle. SRiKD2 is
distinguished by the extent of abduction of the hips, whereas the distinction between SRiKD 1 and 3
is linked to an accumulation of small differences across all of the variables analysed.
- Squat Left Knee Down (SLeKD): this strategy is the mirror strategy of the SRiKD strategies, with
inversion of the values for the distances which translate the fact that in this position the right foot is
placed flat on the ground forward of the left foot; the lower right limb is at a right angle to the ground
and the left knee points towards the ground.
The remaining strategies were characterised by significant flexion of the hips combines with only
minor flexion of the knees. Among the stooping technique, two strategies were distinguished:
- Mstoop: in this strategy the greatest flexion is at the level of the hips. However, there is still a low
amplitude of downwards motion of the joint centre for the sacrum, linked to the low, but
symmetrical, amplitude of flexion of the knees.
- Stoop: This strategy is very similar to the previous one, but in this case, there is practically no
downwards motion of the joint centre associated with the sacrum.
Dominant strategy by age and pace
The frequency with which these strategies were observed for each age-group and pace of work is
shown in Table 2. In general, and whatever the age-group, no dominant strategy was observed,
although the SRiKD1, SRiKD3 and SLeKD strategies were the most frequently observed at both
work paces.
At the comfortable pace, the frequency of observation of the strategies was not significantly
associated with age (p=0.157), although the SRiKD3 strategy was more frequently encountered in the
junior age-group (35%) followed by the SRiKD1 strategy (25%). The other strategies were more
weakly represented (from 5 to 15%). The Stoop strategy was never observed in this age-group. For
subjects in the median age-group, the SRiKD1, SRiKD2, SRiKD3 and SLeKD strategies were
observed in equivalent proportions (20 to 25%). The SKED and Stoop strategies were only observed
in a small number of cases (5%) and the MStoop strategy was never observed. For the senior age-
group, the most frequently observed strategies were the SLeKD and MStoop strategies (26% each).
The other strategies were rarely observed (4 to 13%). Even if the predominant strategy does not
significantly depend on age-group, it was nevertheless observed that the strategies characterised by a
very small angle of flexion at the knees corresponded to 30% of all movements to collect objects
from floor-level at the comfortable pace in the senior age-group, and a much lower percentage in the
other two age-groups.
At the rapid pace, the frequency of observation of the strategies was not significantly associated with
age (p=0.063), although the SRiKD3 strategy was still the most frequently encountered in the junior
age-group (55%) followed by the SRiKD1 strategy (20%). The SRiKD2 and Stoop strategies were
never observed with this age-group at this pace. For subjects in the median age-group, the SRiKD1
(35%) and SLeKD (30%) strategies were the most frequently observed, followed by the SRiKD3

strategy (20%). The Stoop strategy was not observed at this pace. For the senior age-group, the
SLeKD and MStoop strategies were once again observed in the majority of cases (26% and 22%,
respectively), while the SRiKD2 strategy was never observed. Thus, once again, the predominant
strategy used does not significantly depend on the age-group.
All groups combined, few modifications to the frequency of use of the different strategies were
observed when the pace of work changed, although the SRiKD2 strategy was less frequently
observed at the rapid pace (1.6%) than at the comfortable pace (12.7%). Indeed, 41subjects (65%)
used the same dominant strategy at the two paces (data not shown). Nevertheless, the analysis of the
three age-groups showed some slight but noticeable differences. For the younger age-group, the
dominant use at the comfortable pace of the SRiKD3 strategy (35%) was increased by 20% at the
rapid pace, whereas the use of the SKED strategy dropped by 10%. For subjects in the median age-
group, with the increasing pace, a 10% accentuation of the use of the SRiKD1 strategy was observed,
while the number of observations of use of the SRiKD2 strategy decreased by 15%. For the senior
subjects, the use of the SKED strategy doubled while the SRiKD2 strategy was no longer used at the
faster pace.
In summary, although some slight differences were observed, the formal regression analysis showed
no significant global effect of age or pace in the distribution of the dominant strategies.
Number of strategies observed by age and pace
The number of strategies used by each age-group at each pace of work is shown in Table 3. The
number of strategies used was seen to decrease with age. Overall, the relationship between age-group
and the number of strategies used was already significant at the comfortable pace (p=0.039), and
became even more so at the rapid pace (p=0.007). Thus, we observed that, all age-groups combined,
at the comfortable pace the majority of subjects used two to three strategies, whereas at the rapid
pace the trend was to use only one or two strategies.
For the junior age-group, a maximum of five strategies were observed for each subject, whatever the
pace. The number of strategies used tended to decrease for all age-groups as the pace of work
increased.
Applying the formal regression modelling to the number of strategies revealed no significant global
effect of pace on the distribution of the number of strategies used, but the number did decrease
significantly with age (figure 4).
Discussion
Our aim was to determine whether, multisegment analysis rather than variable by variable analysis
could identify different motor strategies used when performing a movement to accomplish the same
goal repeatedly. The strategies identified could then be used to investigate to what extent their use
varied between individuals or conditions, and how this variation was linked age or the pace of work.
The method of agglomerative hierarchical clustering used to identify the different strategies
implemented by subjects agreed well with visual observations made during the experiments, and with

the groups of postures calculated. The characterisation of strategies based on box plots representing
each of the variables is compatible with the results obtained by kinematic modelling. Indeed, for each
collection of parts from floor-level, the segmental positions observed with the kinematics model
corresponded to the strategy name.
Seven strategies, five types of squat and two types of stoop, were identified by the multisegment
analysis. No strategy was found to be specific of any age-group in any pace. However, older subjects
tended to more frequently use strategies requiring less flexion of the knees (MStoop and Stoop).
Similar age-related differences in the postural kinematics during repetitive lifting were previously
reported (Shin et al., 2006, Burgess et al., 2009, Song and Qu, 2014, Gilles et al., 2017). In all cases,
differences were observed between the strategies adopted by older and younger subjects when
performing lifting tasks. Different hypotheses were advanced to explain these differences, such as
that change could be an adaptation to fatigue or as a means to protect against pain. It is also probable
that older subjects adopt strategies with less knee flexion as a result of age-related increased muscle
stiffness, reduced speed of muscle contraction and reduced muscular force in the knee extensors
(Macaluso and De Vito 2004, Duchateau et al. 2006). The effort required to counteract gravity when
raising the bust during the return to an upright position after squatting is also known to be significant
(Kumar 1984), and it becomes more intense with increasing age. However, most studies dealing with
postural differences during repetitive lifting examined the task as an isolated movement.
Furthermore, the position of the feet, imposed by the experimenter, left the subject few possibilities
to vary his/her strategy. Our experimental setup, first, left subjects free to choose the position of their
feet when performing the task. This allows them more opportunity to be creative when collecting
objects from floor-level. Secondly, the collecting task used in this study was part of a succession of
tasks. As a result, subjects did not focus their attention on his position when collecting the parts,
rather they concentrated on completing the job in the allotted time. Thus, our experimental set-up is
thus suitable for observing variability in the movement strategies used to collect parts, in a process
mimicking that that would take place in a real-life workplace.
The number of strategies used by each subject appears to be more significant indicator than the actual
strategies used. Indeed, this number was observed to significantly decrease with age and at both
paces. However, the effect of pace, a slight non-significant reduction in the number of strategies used
at the fast pace, was only weakly discernible. It is therefore not possible to confirm the existence of
an effect of pace on the number of strategies implemented by the subjects. Despite the large amount
of data available in our study, the regression model would require even more data to show a
significant effect of pace on the number of strategies used. Several other studies have described
motor variability, even when performing repetitive occupational tasks which tend to be very
constrained in terms of motricity. This variability was observed both between different operators
(Boocock et al., 2015) and for the same operator (Madeleine and Madsen 2009, Madeleine 2010,
Mathiassen and Paquet 2010, Wahlstrom et al. 2010, Srinivasan and Mathiassen 2012, Ciccarelli et
al. 2013, Srinivasan 2015). The factors influencing motor variability have been linked to the
characteristics of the operator and/or those of the task (see Gaudez et al. 2016 for review). However,
although motor variability is made possible due to the large number of degrees of freedom resulting
from the multiple joints involved in performing the task, it is also used more or less deliberately, and
more or less consciously, by the person performing the task. Thus, one hypothesis proposed to
explain the use of different strategies in the context of repetitive movement, is that, by differential
muscle recruitment, it could allow mini rest phases for different muscle groups, which would reduce

the risk of damaging soft tissues (Mathiassen 2006, Black et al. 2011, Boocock et al., 2015).
Integrating these mini rest phases appears to suggest that they are taken into account by the operator
when planning the movement. Indeed, planning is a central process which has been shown to be
linked to variability (Churchland et al. 2006); it requires decision-making when faced with a choice
of strategies. This decision-making involves analysis of the situation based on past experience.
According to a recent study (Van den Berg et al., 2016), being confident of one's actions assists with
decision-making, and it is reasonable to suppose that experience allows operators to acquire and
reinforce this confidence.
Picking an object up off the ground is a movement which is performed nearly every day by everyone
regardless of age or occupation. For this reason, the experience level for the part of the task requiring
subjects to collect parts from floor-level can be considered to be similar for all operators, across all
three age-groups. However, the decision to perform this movement using a particular strategy,
selected from among several possible strategies is a costly neurological process which often leads
subjects to reach a compromise between speed and precision (Drugowitsch et al., 2014, 2015). In this
work, not only was the pace of work defined, but the instruction was that it had to be respected.
Although subjects in the junior age-group were apparently able to readily adapt to changes of pace,
older subjects, due to age-related changes in their functional capacities, had more difficulty (Gilles et
al., 2017). Reducing the number of strategies used could be considered as a timesaver as it reduces
the number of options to consider. Older subjects could already be using this means of saving time
when performing tasks at the comfortable pace as they were seen to limit the number of strategies
employed compared to younger subjects. This might explain why the slight reduction in the number
of strategies at the fast pace appears more pronounced in the senior age group.
This analysis has some limitations, which should be considered. Indeed, several types of
agglomerative hierarchical clustering methods exist, not all of which identify the same number of
groups. The differences mainly affected the SRiKD class, where the characteristics of the three
postures were very similar, and the overall number of groups may thus vary. Based on this
observation, the variables selected for use in the analysis has an impact on the results. As mentioned
above, if some of the variables chosen provide redundant information, the weight of this information
will be overestimated, which will influence the result of the classification. Finally, the number of
levels of dichotomies in the classification is determined by the researcher. All of these points mean
that this type of analysis must be associated with an initial hypothesis. In this work, our initial
hypothesis was suggested by visual observation of how subjects changed their strategy when
collecting spare parts. These observations were supported by the qualitative comparison based on the
video recordings and by quantitative information provided by the 3-D modelling analysis.
Nevertheless, a global analysis method has advantages when searching for movement variability. For
example, through our analysis of the 3D models, we were able to take into account the disparity in
the measurement of flexion or abduction angle for a lower limb joint. This disparity can be the result
of variation in the postural configuration for several segments upstream and downstream of the joint
in question. Because of its revelatory potential, this method should be more widely used to complete
by-variable kinematic analyses.

Conclusion
Using agglomerative hierarchical clustering, we identified seven bending strategies used when
collecting elements stored at floor-level as part of an assembly task. These strategies were identified
by simultaneous analysis of 17 kinematic variables. Our results indicated that most subjects used
more than one bending strategy when performing the task, but that no specific strategy-type was
associated with a particular age group or pace. However, we did observe that the number of strategies
used by a subject decreased with increasing age. It therefore appears that the variability of the
strategies used when performing repetitive movements is mainly influenced by age, while the effect
of pace is less discernible. As assembly-line operators must repeatedly reproduce the same
movement, decreased movement variability employed by senior workers may be a factor contributing
to their higher risk of developing musculoskeletal disorders.
References
Anderson C.K., and Chaffin D.B. (1986). A biomechanical evaluation of five lifting techniques.
Applied Ergonomics, 17, 2-8
Black N.L., Rickards J. and Sims R. (2011). Enhancing digital human modelling: Recognising
variation in repetitive motion patterns. First International Symposium on Digital Human Modeling,
Event of the Technical Committee on Human Simulation and Virtual Environment of the
International Ergonomics Association, June 14-16, 2011, Lyon, France, 5 p.
Boocock M.G., Mawston G.A., Taylor S. (2015). Age-related differences do affect postural
kinematics and joint kinetics during repetitive lifting. Clinical Biomechanics, 30, 136-143.
Bril B. (2015). Learning to use tools: A functional approach to action. Filliettaz L., Billett S. (eds.),
Francophone perspectives of learning through work: conceptions, traditions and practices, Springer,
95-118
Bril B. et Goasdoué R. (2009). Du mouvement sans sens ou du sens sans mouvement : rôle des
finalités et des contextes dans l'étude de comportements moteurs. Intellectica, 1, 51, 273-293
Burgess R.J., Hillier S., Keogh D., Kollmitzer J. and Oddsson L. (2009) Multi-segment trunk
kinematics during a loaded lifting task for elderly and young subjects. Ergonomics, 52, 2, 222-231
Burgess-Limerick R. and Abernethy B. (1997). Toward a quantitative definition of manual lifting
postures. Human Factors, 39, 1, 141-148
Burgess-Limerick R., Shemmell J., Barry B.K., Carson RG and Abernethy B. (2001). Spontaneous
transitions in the coordination of a whole body task. Human Movement Science, 20, 4–5, 549–562
Ciccarelli M., Straker L., Mathiassen S.E. and Pollock C. (2013). Variation in muscle activity among
office workers when using different information technologies at work and away-from-work. Human
factors and ergonomics, 55, 5, 911-923
Churchland M.M., Afshar A. and Shenoy K.V. (2006). A central source of movement variability,
Neuron, 52, 1085–1096 DOI 10.1016/j.neuron.2006.10.034

de Looze, M.P., Dolan, P., Kingma, I., & Baten, C.T.M. (1998). Does an asymmetric straddlelegged
lifting movement reduce the low back load? Human Movement Science, 17, 243-259
Desrosiers J., Hebert R., Bravo G., Dutil E., (1995). The Purdue pegboard test: normative data for
people aged 60 and over. Disability Rehabilitation 17, 5, 217-224
Duchateau J., Klass M. and Baudry S. (2006). Évolution et adaptations à l'entraînement du système
neuromusculaire au cours du vieillissement. Science & Sports 21, 4, 199–203
Drugowitsch J., DeAngelis G.C., Angelaki D.E., Pouget A. (2015). Tuning the speed-accuracy trade-
off to maximize reward rate in multisensory decision-making, eLIFE, 32p, DOI:
http://dx.doi.org/10.7554/eLife.06678
Drugowitsch J., DeAngelis G.C., Klier E.M., Angelaki D.E., Pouget A. (2014). Optimal multisensory
decision-making in a reaction-time task, eLIFE, 19p, DOI: http://dx.doi.org/10.7554/eLife.03005
Gaudez C., Gilles M.A. and Savin J. (2016). Intrinsic movement variability at work. How long is the
path from motor control to design engineering? Applied Ergonomics, 53, 71-78
Gibo T.L., Bastian A.J. and Okamura A.M. (2013). Effect of age on stiffness modulation during
postural maintenance of the arm. International Conference on Rehabilitation Robotics (ICORR),
IEEE, 24-26 June 2013, 5p, DOI: 10.1109/ICORR.2013.6650395
Gilles M.A., Guelin J.C., Desbrosses K. and Wild P. (2017). Motor adaptation capacity as a function
of age in carrying out a repetitive assembly task at imposed work paces. Applied Ergonomics, 64, 47-
55
Hagen K.B. and Harms-Ringdahl K. (1994). Ratings of perceived thigh and back exertion in forest
workers during repetitive lifting using squat and stoop techniques. Spine, 19, 2511-2517
Hanavan E.P. (1964). A mathematical model of the human body. A.F. Base Ohio; Aero Medical
Research Laboratories Technical Report. 73p
Hoozemans M.J.M., Kingma I., de Vries W.H., van Dieën J.H. (2008). Effect of lifting height and
load mass on low back loading. Ergonomics, 51, 7, 1053-1063
Kumar S. (1984). The physiological cost of three different methods of lifting in sagittal and lateral
planes. Ergonomics, 27, 4, 425-433
Lin C.J., Bernard T.M. and Ayboud M.M. (1999). A biomechanical evaluation of lifting speed using
work- and moment-related measures, Ergonomics, 42, 8, 1051-1059
Lindbeck L. and Kjellberg K. (2001). Gender differences in lifting technique. Ergonomics, 44, 2,
202-214
Macaluso A. and De Vito G. (2004). Muscle strength, power and adaptations to resistance training in
older people. European Journal of Applied Physiology 91, 4, 450-472

Madeleine P. (2010). On functional motor adaptations: from the quantification of motor strategies to
the prevention of musculoskeletal disorders in the neck–shoulder region. Acta Physiologica, 199, 1-
46
Madeleine P. and Madsen T. M. T. (2009). Changes in the amount and structure of motor variability
during a deboning process are associated with work experience and neck-shoulder discomfort.
Applied Ergonomics, 40, 887-894
Mathiassen S.E. (2006). Diversity and variation in biomechanical exposure: what is it, and why
would we like to know? Applied Ergonomics. 37, 419-427
Mathiassen S.E. and Paquet V. (2010). The ability of limited exposure sampling to detect effects of
interventions that reduce the occurrence of pronounced trunk inclination. Applied Ergonomics, 41, 2,
295-304
Plamondon A., Delisle A., Bellefeuille S., Denis D., Gagnon D., Larivière C. (2014a). Lifting
strategies of expert and novice workers during a repetitive palletizing task. Applied Ergonomics, 45,
471-481
Plamondon A., Denis D., Delisle A., Larivière C., Salazar E. (2010). Biomechanical differences
between expert and novice workers in a manual material handling task. Ergonomics, 53, 10, 1239-
1253
Plamondon A., Larivière C., Denis D., St-Vincent M., Delisle A. (2014b). Sex differences in lifting
strategies during a repetitive palletizing task. Applied Ergonomics, 45, 1558-1569
Sheppard P.S. (2012). Sex-based differences in lifting technique under increasing load conditions: A
principal component analysis Thesis, 125p
Sheppard P.S., Stevenson J.M., Graham R.B. (2016). Sex-based differences in lifting technique under
increasing load conditions: A principal component analysis. Applied Ergonomics, 54, 186-195
Srinivasan D., Mathiassen S.E. (2012). Motor variability in occupational health and performance.
Clinical Biomechanics, 27, 979-993
Srinivasan D., Rudolfsson T. and Mathiassen S.E. (2015). Between- and within-subject variance of
motor variability metrics in females performing repetitive upper-extremity precision work. Journal of
Electromyography and Kinesiology, 25, 1, 121-129
Rosenbaum D.A., Meulenbroek R.J., Vaughan J. and Chris J. (2001). Posture-based motion planning:
Applications to grasping. Psychological Review, 108, 4, 709-734
Straker L. (2003). Evidence to support using squat, semi-squat and stoop techniques to lift low lying
objects. International Ergonomics, 31, 149-160
Shin G.�, Nance M.L., Mirka G.A. (2006). Differences in trunk kinematics and ground reaction
forces between older and younger adults during lifting. International Journal of Industrial
Ergonomics, 36, 767–772

Song J. and Qu X. (2014). Effects of age and its interaction with task parameters on lifting
biomechanics. Ergonomics, 57, 5, 653-668
Trafimow J.H., Schipplein O.D., Novak G.J. and Anderson G.B.J. (1993). The effects of quadriceps
fatigue on the technique of lifting. Spine, 18, 3, 364-367
van den Berg R., Zylberberg A., Kiani R., Shadlen M.N. and Wolpert D.M. (2016). Confidence is the
bridge between multi-stage decisions. Current Biology, 26, 23, 3157–3168
Van Dieën J.H., Creemers M., Draisma I. (1994). Repetitive lifting and spinal shrinkage, effects of
age and lifting technique. Clinical Biomechanics, 9, 367-374
van Dieën J.H., Hoozemans M.J.M. and Toussaint H. M. (1999). Stoop and squat: A review of
biomechanical studies on lifting technique. Clinical Biomechanics, 14, 685-696
Wahlstrom J., Mathiassen S.E., Liv P., Hedlund P., Ahlgren C. and Forsman M. (2010). Upper arm
postures and movements in female hairdressers across four full working days. Annals of
Occupational Hygiene 54, 5, 584 - 594
Wu G., Siegler S., Allard P., Kirtley C., Leardini A., Rosenbaum D., Whittle M., D’lima D.D.,
Cristofolini L., Witte H., Schmid O. and Stokes I. (2002). ISB recommendation on definitions of
joint coordinate system of various joints for the reporting of human joint motion—part I: ankle, hip,
and spine. J Biomech. 35, 543-548
Wu G. and Cavanagh P.R. (1995). ISB recommendations for standardization in the reporting of
kinematic data. J Biomech. 28, 1257-1261

Figure 1: Experimental set-up used during the assembly task. Participants started near the table.
They had to go to the distributor to collect a base part. Then, they had to go back to the work station
where they had to fetch component parts stored under the table. All parts were assembled together on
the assembly table. Upon completion of the assembly, participants had to place it on the
distributor/collector and immediately start a new assembly cycle. This paper only deals with the part
of the assembly where subjects collected the component parts stored under the table.
Base
distributor/collector Vicon system
Assembly
table
Force
plates
Reserve of component parts

a – Coordinate system;
left (L) and right (R) foot
b – Amplitude of vertical displacement of
the joint centre for the sacrum
c – Distance between joint centres on the left and right lower limbs. A positive value indicates that the left
side was positioned to the fore of the anteroposterior axis, or above the vertical axis.

d - Inter-segment angles measured for the lower limbs
Figure 2: Distribution of the 17 variables based on the seven strategies identified by the
agglomerative hierarchical clustering. a- Reference measurement used in the experiments; b-
Amplitude of downward movement of the sacrum; c- Anteroposterior, medio-lateral and vertical
distances between the toes, heels and knees relative to appropriate reference planes; d- Angles of
flexion at the ankles, knees and hips, and abduction angles at the hips. Distances and inter-segment
angles were measured when the sacrum was located at its lowest point relative to the ground.
Strategies: SKED: squat knees equally descended; SRiKD1: squat right knee down 1; SRiKD2: squat
right knee down 2; SRiKD3: squat right knee down 3; SLeKD: squat left knee down; MStoop: mid-
stoop; Stoop.

Squat Knees Equally Descended (SKED): Sacrum significantly lowered relative to initial position. The toes are relatively well-aligned in the anteroposterior direction and are quite widely-spaced. The heels are positioned vertically at the same level. The knees present only slight anteroposterior displacement but have the most extensive lateral spacing observed, vertically they are placed at the same level. The angles of flexion for the ankles, knees and hips are relatively symmetrical between the right and the left. Abduction of the hips is also relatively symmetrical.
Squat Right Knee Down 1 (SRiKD1): Sacrum significantly lowered relative to initial position. The right foot is placed behind the left foot. The toes are more widely-spaced than the heels. Based on the vertical positions of the toes and heels, the right foot is flexed, with the heel raised, whereas the left foot is placed flat on the floor. The right knee is placed forward the left and has a lower position. Ankle extension and knee flexion are n the right side. Flexion of the hips is greater on the left, but on the right there is significant variability. Hip abduction indicates opening of the right thigh towards the exterior whereas the left hip remains closer to the body’s mid-line.
Squat Right Knee Down 2 (SRiKD2): Sacrum significantly lowered relative to initial position. The right foot is placed behind the left foot. The toes are more widely-spaced than the heels. Based on the vertical positions of the toes and heels, the right foot is flexed, with the heel raised, whereas the left foot is placed flat on the floor. The knees are aligned in the anteroposterior direction; the level of dispersion tends to place the right knee in front. The left knee is higher than the right. Ankle extension and knee flexion are on the right side. The flexions and abduction of the left and right hips are symmetrical. This is the only strategy that presents significant abduction of the hips.
Squat Right Knee Down 3: (SRiKD3) Sacrum significantly lowered relative to initial position. The right foot is placed behind the left foot. The toes are more widely-spaced than the heels. Based on the vertical positions of the toes and heels, the right foot is flexed, with the heel raised, whereas the left foot is placed flat on the floor. The right heel is not as high as in the two previous strategies. The knees are aligned in the anteroposterior plane and present significant dispersion in terms of medio-lateral spacing. The left knee is higher than the right. Right ankle presents the largest extension observed. Flexion of the knees is relatively symmetrical, like that of the hips. Opening of the hip is more marked on the right.

Squat Left Knee Down: (SLeKD) Sacrum significantly lowered relative to initial position. The left foot is placed behind the right foot. Based on the vertical positions of the toes and heels, the left foot is flexed, with the heel raised, whereas the right foot is placed flat on the floor. This is a “mirror” strategy compared to the three previous strategies. The right knee is placed posterior to and higher than the left. Flexion at the ankles is relatively symmetrical, whereas flexion of the left knee is greater than that of the right. Flexion of the hips is greater on the right than on the left. Abduction of the hips is symmetrical.
Mid-Stoop (MStoop) Sacrum slightly lowered relative to initial position, with a small dispersion. The left foot is placed slightly behind the right foot with significant lateral spacing. There are no differences in the vertical levels of the toes or heels, with a very small dispersion in both cases. The two feet are placed flat on the floor. The lateral spacing between the heels is small. The right knee is placed posterior to the left, but they are at the same vertical level. Flexion of the ankles and knees are symmetrical and of low amplitude. The right hip is slightly more flexed than the left. Abduction is relatively symmetrical.
Stoop The amplitude of downwards movement of the sacrum is the smallest observed, with a very small dispersion. The left foot is placed behind the right foot and lateral spacing of the toes and heels is the smallest observed. There are no differences in the vertical levels of the toes or heels, with a very small dispersion in both cases. The two feet are placed flat on the floor. The right knee is placed posterior to the left. The lateral spacings between the toes, the heels and the knees are the smallest observed. No difference in vertical placement of the knees is observed. Flexion of the ankles and knees are symmetrical and slight. Flexion at the knees is the smallest observed, with very little dispersion. Flexion of the hips is greater on the left. The abduction is the largest observed and symmetrical between left and right.
Figure 3: Definitions of the seven strategies identified by agglomerative hierarchical clustering based
on analysis of the box plots.

Figure 4: The number of strategies used decreases with age but is unaffected by pace. Model-
predicted number of strategies used with 95%CIs by age and pace.
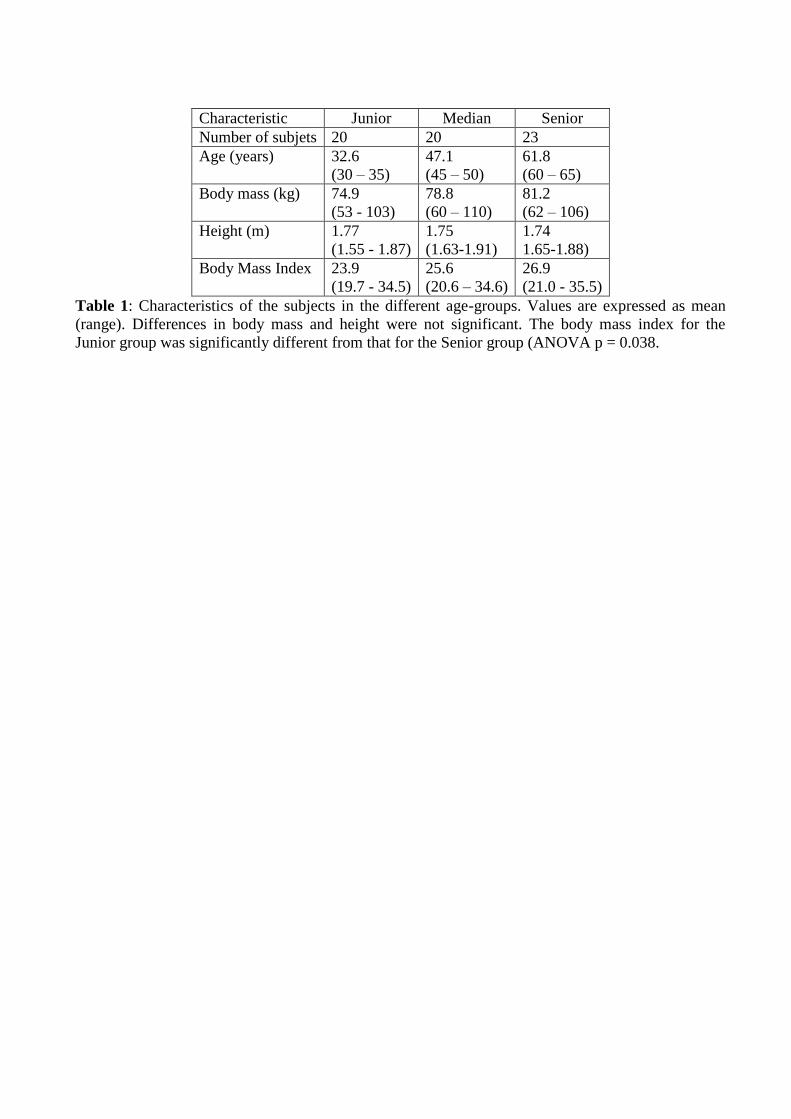
Characteristic Junior Median Senior
Number of subjets 20 20 23
Age (years)
32.6
(30 – 35)
47.1
(45 – 50)
61.8
(60 – 65)
Body mass (kg)
74.9
(53 - 103)
78.8
(60 – 110)
81.2
(62 – 106)
Height (m)
1.77
(1.55 - 1.87)
1.75
(1.63-1.91)
1.74
1.65-1.88)
Body Mass Index
23.9
(19.7 - 34.5)
25.6
(20.6 – 34.6)
26.9
(21.0 - 35.5)
Table 1: Characteristics of the subjects in the different age-groups. Values are expressed as mean
(range). Differences in body mass and height were not significant. The body mass index for the
Junior group was significantly different from that for the Senior group (ANOVA p = 0.038.

Comfortable pace
Age Strategy Total
group SKED SRiKD1 SRiKD2 SRiKD3 SLeKD MStoop Stoop
J N
%
3
15.0
5
25.0
1
5.0
7
35.0
2
10.0
2
10.0
-
20
100
M N
%
1
5.0
5
25.0
4
20.0
4
20.0
5
25.0
-
1
5.0
20
100
S N
%
2
8.7
3
13.0
3
13.0
2
8.7
6
26.1
6
26.1
1
4.4
23
100
Total N
%
6
9.6
13
20.6
8
12.7
13
20.6
13
20.6
8
12.7
2
3.2
63
100
Fisher’s exact test p=0.157
Rapid pace
Age Strategy Total
group SKED SRiKD1 SRiKD2 SRiKD3 SLeKD MStoop Stoop
J N
%
1
5.0
4
20.0
-
11
55.0
2
10.0
2
10.0
-
20
100
M N
%
1
5.0
7
35.0
1
5.0
4
20.0
6
30.0
1
5.0
-
20
100
S N
%
4
17.4
4
17.4
-
3
13.0
6
26.1
5
21.7
1
4.4
23
100
Total N
%
6
9.5
15
23.8
1
1.6
18
28.6
14
22.2
8
12.7
1
1.6
63
100
Fisher’s exact test p=0.063
Table 2: Dominant strategies used by each age-group at the two work paces: e.g. at the rapid pace,
the SKED strategy is the most used by only one subject in the young age-group. It thus represents 5%
of the dominant strategies for this age-group. N= number of subjects; J = junior; M = median; S =
senior age-group.

Comfortable pace
Group Number of strategies used Total
age 1 2 3 4 5
J N
%
1
5.0
9
45.0
5
25.0
2
10.0
3
15.0
20
100
M N
%
6
30.0
8
40.0
6
30.0
-
-
20
100
S N
%
10
43.5
6
26.1
6
26.1
1
4.3
-
23
100
Total N
%
17
27.0
23
36.4
17
27.0
3
4.8
3
4.8
63
100
Fisher’s exact test p=0.039
Rapid pace
Group Number of strategies used Total
age 1 2 3 4 5
J N
%
5
25.0
5
25.0
5
25.0
1
5.0
4
20
20
100
M N
%
4
20
14
70
2
10
-
-
20
100
S N
%
12
52.2
8
34.8
2
8.7
1
4.3
-
23
100
Total N
%
21
33.3
27
42.8
9
14.3
2
3.2
4
6.4
63
100
Fisher’s exact test p=0.007
Table 3: Number of strategies used by each age-group at the two work paces: e.g. at the rapid pace, 5
members (25%) of the junior age-group only used a single strategy. N= number of subjects;
J = junior; M = median; S = senior age-group.