gravity data from the sierra vista subwatershed, … · gravity data from the sierra vista...
TRANSCRIPT

U.S. Department of the InteriorU.S. Geological Survey
Open-File Report 2015–1086
Prepared in cooperation with The Nature Conservancy
Gravity Data from the Sierra Vista Subwatershed, Upper San Pedro Basin, Arizona


Gravity Data from the Sierra Vista Subwatershed, Upper San Pedro Basin, Arizona
By Jeffrey R. Kennedy
Prepared in cooperation with The Nature Conservancy
Open-File Report 2015–1086
U.S. Department of the Interior U.S. Geological Survey

U.S. Department of the Interior SALLY JEWELL, Secretary
U.S. Geological Survey Suzette M. Kimball, Acting Director
U.S. Geological Survey, Reston, Virginia: 2015
For more information on the USGS—the Federal source for science about the Earth, its natural and living resources, natural hazards, and the environment—visit http://www.usgs.gov or call 1–888–ASK–USGS
For an overview of USGS information products, including maps, imagery, and publications, visit http://www.usgs.gov/pubprod
Any use of trade, firm, or product names is for descriptive purposes only and does not imply endorsement by the U.S. Government.
Although this information product, for the most part, is in the public domain, it also may contain copyrighted materials as noted in the text. Permission to reproduce copyrighted items must be secured from the copyright owner.
Suggested citation: Kennedy, J.R., 2015, Gravity data from the Sierra Vista Subwatershed, Upper San Pedro Basin, Arizona: U.S. Geological Survey Open-File Report 2015-1086, 26 p., http://dx.doi.org/10.3133/ofr20151086. ISSN 2331-1258 (online)

iii
Contents Abstract ......................................................................................................................................................................... 1 Introduction .................................................................................................................................................................... 1
Purpose and Scope ................................................................................................................................................... 2 Methods ......................................................................................................................................................................... 4
Absolute-Gravity Measurements ................................................................................................................................ 4 Relative-Gravity Measurements ................................................................................................................................. 5 Least-Squares Network Adjustment ........................................................................................................................... 7
Results ........................................................................................................................................................................... 8 Observed Gravity Values ........................................................................................................................................... 8 Uncertainty ................................................................................................................................................................18 Comparison with Historical Data ...............................................................................................................................20
Conclusions ..................................................................................................................................................................25 References Cited ..........................................................................................................................................................25
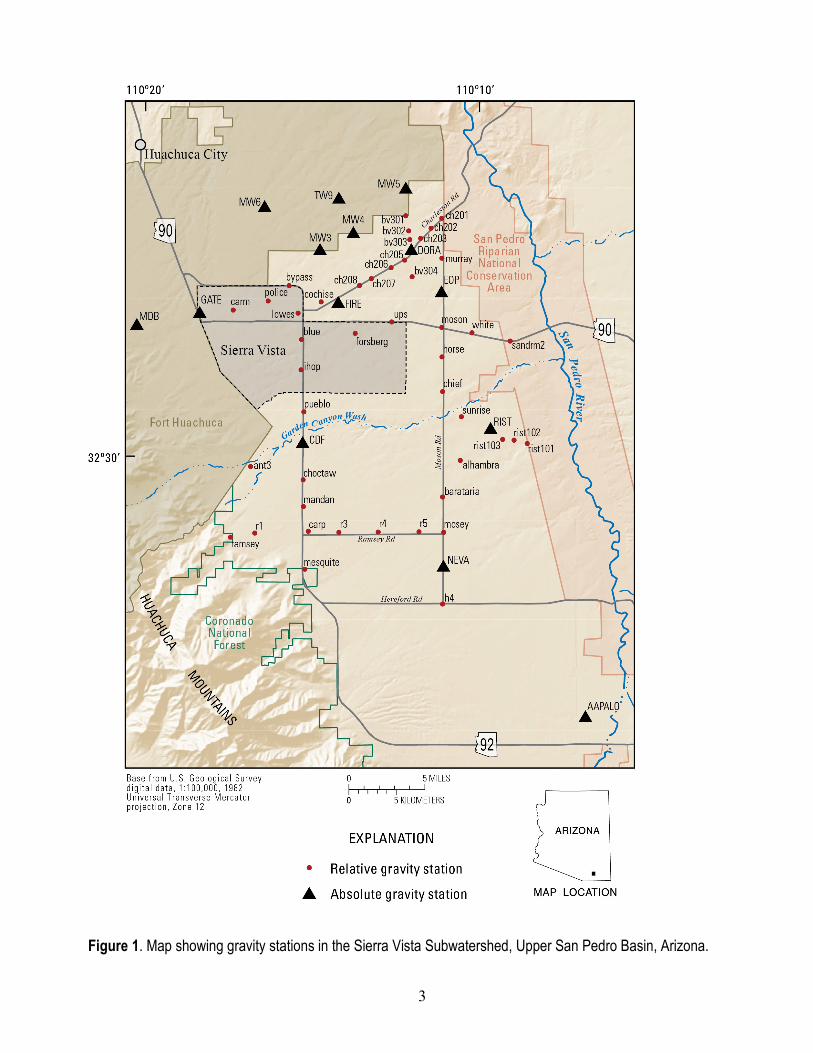
Figures Figure 1. Map showing gravity stations in the Sierra Vista Subwatershed, Upper San Pedro Basin, Arizona .............. 3 Figure 2. Map showing relative-gravity observations, Sierra Vista Subwatershed, Upper San Pedro Basin, Arizona. ......................................................................................................................................................................... 6 Figure 3. Observed drift and modeled drift curves for each subset of relative-gravity observations collected June 3–17, 2014, Sierra Vista Subwatershed, Upper San Pedro Basin, Arizona. ....................................................... 16 Figure 4. Histogram showing distribution of observation residuals for the network-adjusted gravity values for the June 2014 gravity survey, Sierra Vista Subwatershed, Upper San Pedro Basin, Arizona ........................................... 19 Figure 5. Time-series plots of absolute gravity, Sierra Vista Subwatershed, Upper San Pedro Basin, Arizona, 2005–15 ....................................................................................................................................................................... 21 Figure 6. Map showing monsoonal precipitation, Sierra Vista Subwatershed, Upper San Pedro Basin, Arizona, July–October 2014....................................................................................................................................................... 23 Figure 7. Map showing change in gravity from June 2014 to January 2015 and percentage of average summertime (July–October) precipitation, Sierra Vista Subwatershed, Upper San Pedro Basin, Arizona .................. 24
Tables Table 1. Relative-gravity observations from the Sierra Vista Subwatershed, Upper San Pedro Basin, Arizona, and network adjustment residuals, June 3–17, 2014 ....................................................................................... 8 Table 2. Observed absolute-gravity values and uncertainty, Sierra Vista Subwatershed, Upper San Pedro Basin, Arizona, 2005–15 ................................................................................................................. 13 Table 3. Vertical gravity gradients and land-surface transfer values, Sierra Vista Subwatershed, Upper San Pedro Basin, Arizona, 2014 ....................................................................................................................... 15 Table 4. Network-adjusted gravity values, Sierra Vista Subwatershed, Upper San Pedro Basin, Arizona, June 2014 ...................................................................................................................................................... 17
iv
Conversion Factors Multiply By To obtain
Length
centimeter (cm) 0.3937 inch (in.)
meter (m) 3.281 foot (ft)
meter (m) 1.094 yard (yd)
Acceleration
microGal (μGal) 10 nanometer per second squared (nm/s2)
microGal (μGal) 0.328 × 10⁻⁹ feet per second squared (ft/s2)
Datums Vertical coordinate information is referenced to the North American Vertical Datum of 1988 (NAVD 88).
Horizontal coordinate information is referenced to the North American Datum of 1983 (NAD 83).

1
Gravity Data from the Sierra Vista Subwatershed, Upper San Pedro Basin, Arizona
By Jeffrey R. Kennedy
Abstract Observations of very small changes of Earth’s gravitational field (time-lapse gravity) provide a
direct, non-invasive method for measuring changes in aquifer storage change. An existing network of gravity stations in the Sierra Vista Subwatershed was revised in 2014 to better understand the spatial distribution of changes in aquifer storage, especially with relation to ephemeral channel recharge and a groundwater cone of depression associated with pumping in the greater Sierra Vista area. In addition, the network was extended to provide baseline data for possible future enhanced-recharge projects.
This report (1) summarizes changes to the Sierra Vista Subwatershed regional time-lapse gravity network with respect to station locations and (2) presents 2014 and 2015 gravity measurements and gravity values at each station. A prior gravity network, established between 2000 and 2005, was revised in 2014 to cover a larger number of stations over a smaller geographic area in order to decrease measurement and interpolation uncertainty. The network currently consists of 59 gravity stations, including 14 absolute-gravity stations. Following above-average rainfall during summer 2014, gravity increased at all but one of the absolute-gravity stations that were observed in both June 2014 and January 2015. This increase in gravity indicates increased groundwater storage in the aquifer and (or) unsaturated zone as a result of rainfall and infiltration.
Introduction The Earth’s gravitational field, as described by Newton’s law of gravitation, varies temporally as
a result of changes in subsurface and atmospheric mass. In groundwater systems, changes in water storage in unconfined aquifers or in the unsaturated zone between an aquifer and the land surface cause changes in the magnitude of Earth’s gravity. Measurements of changes in gravity have proven useful for many applications, including mapping aquifer storage change (Pool and Anderson, 2008), determining specific yield (Pool and Eychaner, 1995), resolving total water-storage-change into various partitions (Creutzfeldt and others, 2010), and monitoring the depth of the wetting front at an artificial recharge facility (Kennedy and others, 2014).

2
Previous gravity surveys to monitor aquifer storage change were conducted in the Sierra Vista Subwatershed of the Upper San Pedro Basin from 2005 to 2010 (Kennedy and Winester, 2011). In rural and undeveloped parts of the subwatershed away from the city of Sierra Vista, changes in gravity resulting from groundwater pumping were small and at or below the detection limit of the gravity method. Large increases in gravity were observed near Garden Canyon Wash in 2008 and 2010 (Kennedy and Winester, 2011), indicative of recharge, but these changes were largely constrained to the nearby vicinity of Garden Canyon Wash (and presumably, other washes where recharge occurred) and were not adequately captured by the spatial distribution of gravity stations. Additionally, the absolute-gravity stations ASA1570, BUSBY, R2, and R6 (Kennedy and Winester, 2011) were destroyed between 2010 and 2014.
The gravity network was modified in 2014 to better capture changes in aquifer storage in a smaller, more focused network in and around the city of Sierra Vista (fig. 1). To address the shortcomings listed above, many additional stations were located along Charleston Road, to the northeast of Sierra Vista, to better capture the evolution of the cone of depression associated with groundwater pumping (Schmerge and others, 2009; Lacher and others, 2014), and the increasing aquifer storage resulting from wastewater recharge at the City’s Environmental Operations Park. Although the current network is smaller in spatial extent, stations are spaced closer together and the total number of stations is greater than in the previous network (53 and 45, respectively; this number excludes absolute-gravity stations not included in the network adjustment). The result is greater measurement precision and lower uncertainty. Furthermore, interpolation uncertainty at locations between gravity stations is reduced.
Gravity data are reported in units of microgal (µgal). The gal is defined as 1 cm/s2, or about 1/1,000th of Earth’s gravitational field. One µgal is about 1 × 10⁻⁹, or 1 part per billion, of Earth’s gravitational field. If the water table in an unconfined aquifer moves vertically up and down without significant horizontal flow (due to groundwater mounding or pumping, for example), the horizontal infinite-slab model is appropriate to directly convert gravitational units (that is, acceleration in µgal) to a thickness of water. This model, also known as the Bouguer slab model, indicates that 41.9 μGal of gravity change is equivalent to 1 m of water in the aquifer, regardless of aquifer porosity (Torge, 1989). The gravity method thus has the advantage of not being sensitive to aquifer porosity, because it directly measures the change in the mass of water stored in the aquifer. In contrast, water levels measured in wells require a porosity estimate to convert the measured change in water level to the amount of water stored in the aquifer; a high-porosity aquifer may store a large amount of water with a relatively small change in water level, whereas a low-porosity aquifer may show a much larger change in water level for the same change in storage. Porosity can be difficult or impossible to measure over a representative portion of the aquifer.
Purpose and Scope This report summarizes changes in the Sierra Vista Subwatershed regional time-lapse gravity
network with respect to station location and 2014 and 2015 measurements of the local gravitational field. Absolute-gravity observations are presented for 14 stations. In total, 172 differenced relative-gravity observations between stations are presented. Least-squares network adjustment is used to provide final gravity values and associated uncertainty at 53 stations, including 8 absolute-gravity stations; an additional 6 stations have only absolute-gravity values. Gravity change from the previous survey in 2010 is presented for 8 absolute-gravity stations, and gravity change between June 2014 and January 2015 is presented for 13 absolute-gravity stations.
3
Figure 1. Map showing gravity stations in the Sierra Vista Subwatershed, Upper San Pedro Basin, Arizona.

4
Methods Gravity data were collected using both absolute and relative gravimeters. Absolute gravimeters
measure gravity directly by measuring the acceleration of a free-falling test mass. Relative gravimeters measure an arbitrary value at each station; only the relative differences in gravity between two stations measured in relatively quick succession are considered accurate. Additionally, the change in gravity owing to instrumental “drift” must be established and removed from relative-gravity measurements. Absolute- and relative-gravity measurements are analogous to fixed benchmarks and relative height differences, respectively, in leveling surveys; absolute-gravity measurements establish the datum for a particular survey. In most surveys, including this one, absolute-gravity measurements are made at a relatively small number of stations, and relative-gravity differences are observed between the absolute-gravity stations and the remaining stations. As with leveling, a least-squares network adjustment is performed to combine all data and derive final values for each station while accounting for uncertainty in the measurements and accommodating redundant measurements.
Absolute-Gravity Measurements Absolute-gravity data were collected at 14 stations (fig. 1) using a Micro-g Lacoste, Inc. A-10
absolute gravimeter. The A-10 uses a length scale determined by a laser interferometer and a time scale determined by a rubidium oscillator. A spring mechanism isolates the interferometer from long-period seismic noise. Each measurement consists of between 720 and 1,200 drops of a free-falling test mass, collected in sets of 120 drops, over 15–30 minutes. Measurement sets were occasionally removed from final processing if they were not consistent with other sets by visual inspection. Nominal accuracy as reported by the manufacturer is ±10 µGal for the A-10. Earth-tide corrections (to account for gravity changes caused by the periodic elastic deformation of the Earth) for absolute-gravity measurements were determined using the ETGTAB model with the default wave groups in the Micro-g Lacoste, Inc. software (http://www.microglacoste.com/). Ocean-loading corrections (to account for gravity changes caused by surface-loading changes induced by the oceans) were determined using the finite element solution tide model FES2004, produced by Laboratoire d’Etudes en Géophysique et Océanographie Spatiales (http://www.legos.obs-mip.fr/) and Collecte Localisation Satellites’ Space Oceanography Division, distributed by AVISO (Archiving, Validation and Interpretation of Satellite Oceanographic Data), with support from Centre National d’Etudes Spatiales (http://www.aviso.altimetry.fr/). Polar-motion corrections were determined using coordinates provided by the U.S. Naval Observatory (http://toshi.nofs.navy.mil/). The barometric-pressure correction was calculated using measured barometric pressure and an admittance factor of 0.3 μGal/mBar.
Absolute-gravity monuments are constructed using various methods, based on the suitability of existing infrastructure and local conditions. The construction method does not unduly influence data quality. Five gravity stations on the East Range of Fort Huachuca (MW3, MW4, MW5, MW6, TW9) are located on concrete well pads. Six stations (MDB, GATE, FIRE, CDF, NEVA, AAPALO) are located on existing concrete slabs, usually sidewalks, deemed to be sufficiently stable. GATE, FIRE, CDF, and NEVA are new stations in 2014. The remaining three stations (EOP, DORA, RIST) are survey monuments constructed according to the National Geodetic Survey Class A standard. Stations EOP and DORA comprise a 12-in. diameter concrete cylinder, about 24-in. deep, anchored in caliche. Station RIST was constructed with a central, isolated survey rod driven to refusal (16 ft), with a surrounding concrete cylinder on which the A-10 sits. Station EOP was constructed in 2009; stations DORA and RIST were constructed in 2014.

5
Absolute gravimeters use the local vertical-gravity gradient to calculate a gravity value from observed interferometry data, and to transfer gravity values from the instrument height to the survey mark. Local gradients may differ from the free-air gradient owing to local topographic and density effects. For each of the A-10 stations from which relative-gravity measurements were made, the vertical gradient was measured between the A-10 instrument height (71.7 cm) and the Burris relative gravimeter height (about 5.6 cm). The instrument height refers to the height above ground of the respective instrument’s sensor. The gradient is calculated as the gravity interval divided by the height interval. At other absolute-gravity stations where relative-gravity measurements were not made, a -3 μGal/cm gradient was used.
Relative-Gravity Measurements Relative-gravity observations were made at 53 stations (fig. 2) using a ZLS Corporation, Inc.,
Burris gravimeter. Relative gravimeters are hindered by low-frequency instrument “drift,” which causes the measured value at any given station to change continually (this instrumental effect is independent of other sources of gravity change, such as Earth tides). Repeat measurements at one or more stations are necessary to identify and remove this instrumental drift. For the surveys included in this report, stations were generally observed in the order A-B-C-B-A-C, where each letter represents a station; each time a repeat measurement is made at a station, an estimate of instrument drift is obtained. If instrumental drift is considered continuous over some time period (typically 1 day) a curve, or model, can be fitted to the individual estimates of instrumental drift. Then, drift-corrected values can be calculated by subtracting the modeled drift from the observed values. Modeled drift curves for each survey-day are presented in section “Results.”
Each relative-gravity observation is accompanied by an estimate of standard deviation provided by the relative gravimeter. Because the basic observation is the difference in gravity between two stations, and the measurement at each station is considered independent, the uncertainty (standard deviation) of the differenced measurement is obtained by taking the square-root of the sum of squares:
𝜎𝑑𝑑 = �𝜎12 + 𝜎22+𝜎𝑖, (1)
where 𝜎𝑑𝑑 is the standard deviation of the differenced measurement, 𝜎12 and 𝜎22 are the standard deviations at stations 1 and 2, respectively, and 𝜎𝑖 is additional instrument uncertainty.
The station standard deviations 𝜎12 and 𝜎22 are estimated to be the observational standard deviation of several observations recorded over about 1 minute at a particular station. Because this represents the observational uncertainty only, and not the uncertainty inherent in the relative gravimeter, the resultant standard deviations are generally lower than the actual measurement error. A more realistic uncertainty estimate is obtained by setting 𝜎𝑖 equal to 2 μGal. The accuracy of the 𝜎𝑑𝑑 estimate is evaluated during the network adjustment as described in section, “Uncertainty.” When performing the network adjustment, 𝜎𝑑𝑑 is used to weight each observation.

6
Figure 2. Map showing relative-gravity observations, Sierra Vista Subwatershed, Upper San Pedro Basin, Arizona.

7
Least-Squares Network Adjustment Least-squares network adjustment, a common method for combining survey measurements of all
kinds, describes a system of linear equations solved to arrive at a single value, such as elevation or gravity, for each station (Strang and Borre, 1997). Network adjustment is the method by which measurement error is distributed across a network. For example, if differences (either height or gravity differences) are observed in a loop (from A to B, B to C, and C to A), there will be some misclosure—the observations will not sum to exactly zero. If the uncertainty in each observation is identical, the misclosure can simply be distributed evenly, but more often some observations are better than others, and therefore assigned greater weight. For the relative-gravity observations presented in this report, uncertainty is determined using the observed standard deviations at the two stations forming the difference observation. Using this uncertainty measurement, we can determine a weighted least-squares solution in which greater weight is placed on those measurements having lower uncertainty.
The advantage of the least-squares method is that it has the ability to combine all available information to determine consistent gravity values across the network. Also, it provides an estimate of the precision of the gravity value at a particular station based on the uncertainty in, and consistency of, the observations to and from that station. The primary disadvantage of the least squares method is that it implies the gravitational field does not change during the course of making measurements. For this report, all gravity observations were collected over 4 weeks with no intervening precipitation, and changes in the gravity field owing to aquifer-storage change are not considered to be a significant source of uncertainty.
The basic network-adjustment equation is:
∆𝑔 = 𝑔2 − 𝑔1 + 𝑒 (2)
where ∆𝑔 is the observed gravity difference between two stations having the observed values 𝑔1
and 𝑔2, and e is the error between the observed and predicted value.
Least-squares network adjustment minimizes e by finding the set of gravity values for all stations that minimizes the squared-error. Unlike some network adjustment equations (Hwang and others, 2002), neither instrument drift nor circular (screw) error is considered, although a first-order linear term is included to estimate any calibration error between the relative gravimeter and absolute gravimeter used in the study. Drift was removed prior to the adjustment by fitting a polynomial or LOWESS (locally weighted scatterplot smooth) model to repeat gravity observations at a single station, which provide point estimates of drift. This allows a non-linear drift model and is generally more flexible. Circular error describes error introduced as a result of imperfect calibration of the gravimeter screw mechanism. Because the Burris relative gravimeter used in the survey is equipped with an electronic feedback system with a relatively large range, any two successive stations are observed at the same dial setting and, therefore, circular error can be ignored.

8
Results Observed Gravity Values
From June 3 to 17, 2014, 172 relative-gravity differences were observed on the network of 53 stations (table 1). Absolute gravity was observed at 14 stations from June 11 to 13, 2014, and from January 15 to 16, 2015. These data, along with older previously-published data (Kennedy and Winester, 2011), are shown in table 2. Vertical gradients were measured at seven of the eight stations used in the network adjustment (table 3). The vertical gradient at station MW5 was estimated to be the same as that at the nearest station, DORA. These gradient measurements are used both to process the absolute-gravity data (because gravity varies over the height of the fall in the dropping chamber) and to transfer the gravity value measured at the instrument height of the absolute gravimeter (71.7 cm) to the height of the relative-gravity station so that it can be used in the network adjustment.
Table 1. Relative-gravity observations from the Sierra Vista Subwatershed, Upper San Pedro Basin, Arizona, and network adjustment residuals, June 3–17, 2014. [Capital letters in station name indicate an absolute-gravity station; –, observation not used in the network adjustment; UTC, Universal Time Coordinated]
From station To station Gravity
difference (µgal)
Standard deviation
(µgal)
From observation, date and time
(UTC)
To observation, date and time
(UTC)
Residual of adjusted
observation (µgal)
alhambra barataria -3,563.9 3.1 6/4/14 17:55 6/4/14 18:06 -2.1 alhambra barataria -3,565.2 3.0 6/4/14 18:15 6/4/14 18:06 -0.8 alhambra h4 -12,614.8 2.9 6/4/14 19:36 6/4/14 19:23 -0.8 alhambra mosey -6,792.1 3.3 6/4/14 19:36 6/4/14 19:45 -0.6 alhambra sunrise 3,171.6 3.3 6/4/14 17:55 6/4/14 17:41 -3.4 alhambra sunrise 3,173.0 3.5 6/4/14 18:15 6/4/14 18:27 -4.8 barataria mosey -3,224.5 3.3 6/4/14 19:07 6/4/14 19:00 -2.2 blue bypass 4,240.7 3.4 6/5/14 16:35 6/5/14 16:24 -0.7 blue ihop -3,717.6 3.5 6/5/14 16:35 6/5/14 16:46 1.1 blue ihop -3,717.1 4.6 6/5/14 17:14 6/5/14 17:05 0.5 blue lowes 2,335.8 3.0 6/5/14 16:05 6/5/14 16:15 -0.5 blue lowes 2,335.9 3.2 6/5/14 16:05 6/5/14 15:54 -0.6 blue pueblo -7,406.7 3.6 6/5/14 17:14 6/5/14 17:26 1.7 bv forsberg -14,425.4 2.9 6/6/14 17:12 6/6/14 15:48 – bv moson -9,063.8 3.4 6/6/14 17:12 6/6/14 17:37 4.7 bv301 bv302 -1,886.3 3.0 6/17/14 21:17 6/17/14 21:43 – bv301 bv302 -1,889.3 2.9 6/17/14 22:00 6/17/14 21:43 3.1 bv301 GATE -38,525.4 3.1 6/17/14 21:01 6/17/14 19:40 – bv301 MW5 4,054.8 3.1 6/17/14 21:17 6/17/14 21:10 0.1 bv301 MW5 4,046.8 3.4 6/17/14 22:00 6/17/14 22:10 -1.5 bv301 MW5 4,047.0 3.4 6/17/14 22:17 6/17/14 22:10 -1.7

9
From station To station Gravity
difference (µgal)
Standard deviation
(µgal)
From observation, date and time
(UTC)
To observation, date and time
(UTC)
Residual of adjusted
observation (µgal)
bv302 bv303 -2,229.0 3.5 6/17/14 16:37 6/17/14 16:11 3.7 bv302 bv303 -2,227.4 3.6 6/17/14 16:37 6/17/14 16:49 2.1 bv303 DORA -5,067.1 3.4 6/17/14 16:49 6/17/14 17:07 2.8 bv303 EOP -10,810.6 2.9 6/17/14 16:11 6/17/14 15:54 0.5 bypass lowes -1,905.2 2.9 6/5/14 15:45 6/5/14 15:54 0.4 bypass lowes -1,905.7 3.1 6/5/14 16:24 6/5/14 16:15 0.9 bypass pueblo -11,639.6 4.6 6/5/14 20:56 6/5/14 20:33 -5.4 carm police 3,141.1 2.9 6/5/14 0:37 6/5/14 0:53 0.1 carm police 3,140.2 3.1 6/5/14 1:06 6/5/14 0:53 1.0 carp choctaw -719.5 4.3 6/5/14 19:17 6/5/14 19:08 0.2 carp ihop 9,892.9 3.1 6/10/14 22:31 6/10/14 22:44 – carp mandan -910.5 4.1 6/5/14 18:54 6/5/14 18:35 1.4 carp mandan -908.6 4.2 6/5/14 18:54 6/5/14 19:01 -0.4 carp mesquite -5,701.6 4.3 6/5/14 19:17 6/5/14 19:26 -4.0 carp mosey 4,816.5 3.6 6/10/14 22:31 6/10/14 22:21 5.3 carp r1 -12,756.6 3.6 6/10/14 20:39 6/10/14 20:29 -4.9 carp r1 -12,766.8 3.0 6/10/14 20:40 6/10/14 20:47 5.2 carp r3 4,835.5 3.9 6/10/14 21:07 6/10/14 21:15 -3.3 carp r3 4,831.4 3.2 6/10/14 21:36 6/10/14 21:29 0.9 carp r4 6,431.4 3.3 6/10/14 21:36 6/10/14 21:46 -0.4 carp ramsey -20,644.2 3.0 6/10/14 21:07 6/10/14 20:57 -2.5 CDF ant3 -4,013.8 4.0 6/13/14 18:03 6/13/14 18:13 -0.7 CDF ant3 -4,013.1 4.0 6/13/14 18:03 6/13/14 17:52 -1.4 CDF choctaw -3,150.4 3.6 6/5/14 17:39 6/5/14 17:47 -0.8 CDF choctaw -3,151.3 6.9 6/5/14 17:59 6/5/14 17:47 0.0 CDF DORA 34,727.9 4.0 6/13/14 18:50 6/13/14 19:08 -5.1 CDF FIRE 20,230.2 4.0 6/13/14 20:08 6/13/14 20:25 – CDF GATE 5,349.1 4.0 6/13/14 20:08 6/13/14 19:55 3.3 CDF ihop 7,442.6 4.2 6/5/14 19:40 6/5/14 19:49 0.5 CDF mesquite -8,137.1 3.3 6/5/14 19:40 6/5/14 19:26 -0.4 CDF NEVA -936.5 4.0 6/13/14 18:50 6/13/14 18:35 0.5 CDF pueblo 3,754.6 3.1 6/5/14 17:39 6/5/14 17:26 0.1 CDF pueblo 3,753.0 8.0 6/5/14 17:59 6/5/14 18:09 1.7 ch201 ch202 -3,166.0 4.7 6/3/14 19:43 6/3/14 19:51 1.2 ch201 ch202 -3,167.6 3.6 6/3/14 20:09 6/3/14 20:03 2.8 ch201 ch203 -5,585.9 3.8 6/3/14 20:09 6/3/14 20:16 2.7 ch201 murray -10,049.9 2.9 6/4/14 15:26 6/4/14 15:34 -0.7 ch201 murray -10,049.5 2.9 6/4/14 15:26 6/4/14 15:18 -1.1 ch201 murray -10,050.2 2.7 6/4/14 15:59 6/4/14 15:49 -0.4

10
From station To station Gravity
difference (µgal)
Standard deviation
(µgal)
From observation, date and time
(UTC)
To observation, date and time
(UTC)
Residual of adjusted
observation (µgal)
ch202 ch203 -2,420.8 3.5 6/3/14 19:51 6/3/14 19:56 2.4 ch202 ch203 -2,419.0 3.1 6/3/14 20:03 6/3/14 19:56 0.6 ch203 ch205 -5,908.5 3.4 6/3/14 20:47 6/3/14 20:53 2.0 ch205 ch206 -2,152.5 3.3 6/3/14 20:53 6/3/14 21:01 -3.5 ch205 ch206 -2,160.3 3.8 6/3/14 21:24 6/3/14 21:16 4.3 ch205 ch207 -5,830.6 3.5 6/3/14 21:24 6/3/14 21:31 6.5 ch206 ch207 -3,663.4 3.6 6/3/14 21:01 6/3/14 21:08 -4.7 ch206 ch207 -3,665.5 3.8 6/3/14 21:16 6/3/14 21:08 -2.6 ch207 ch208 -2,908.8 3.2 6/3/14 21:31 6/3/14 21:38 -1.3 ch207 ch208 -2,909.2 3.1 6/3/14 22:14 6/3/14 22:08 -0.9 chief horse 4,569.3 4.1 6/4/14 17:07 6/4/14 16:55 0.0 choctaw mandan -189.5 5.1 6/5/14 18:21 6/5/14 18:35 -0.3 choctaw mandan -189.0 3.9 6/5/14 19:08 6/5/14 19:01 -0.8 choctaw pueblo 6,904.7 6.7 6/5/14 18:21 6/5/14 18:09 1.3 cochise lowes -3,819.1 3.2 6/5/14 1:49 6/5/14 1:59 2.8 cochise lowes -3,817.7 2.7 6/5/14 1:49 6/5/14 1:35 1.4 cochise police -6,912.5 3.7 6/5/14 2:15 6/5/14 2:06 2.9 DORA bv -3,355.6 3.6 6/17/14 17:51 6/17/14 17:36 9.1 DORA bv -3,368.8 3.1 6/17/14 19:01 6/17/14 19:16 – DORA ch201 9,925.8 3.0 6/3/14 23:07 6/3/14 23:00 -3.3 DORA ch203 4,340.4 3.0 6/3/14 20:24 6/3/14 20:16 -1.1 DORA ch203 4,340.1 3.9 6/3/14 20:41 6/3/14 20:47 -0.8 DORA ch205 -1,565.6 4.1 6/3/14 20:24 6/3/14 20:33 -1.5 DORA ch205 -1,569.8 4.5 6/3/14 20:41 6/3/14 20:33 2.6 DORA ch206 -3,719.2 2.8 6/3/14 22:40 6/3/14 22:33 -3.9 DORA ch207 -7,388.4 2.8 6/3/14 23:07 6/3/14 23:16 -2.8 DORA EOP -5,754.4 4.0 6/13/14 19:08 6/13/14 19:19 8.6 DORA EOP -5,752.9 4.0 6/13/14 19:29 6/13/14 19:19 7.0 DORA EOP -5,749.6 3.5 6/17/14 17:07 6/17/14 17:16 3.7 DORA FIRE -14,472.5 3.1 6/3/14 22:40 6/3/14 22:49 -4.5 DORA FIRE -14,493.4 4.0 6/13/14 19:29 6/13/14 19:38 – DORA RIST -19,514.5 3.4 6/17/14 19:01 6/17/14 18:30 -3.2 DORA sunrise -22,372.9 3.4 6/17/14 17:51 6/17/14 18:08 0.9 EOP bv 2,394.7 3.2 6/17/14 17:16 6/17/14 17:36 4.6 EOP ch201 15,664.6 2.8 6/4/14 16:09 6/4/14 15:59 3.7 EOP horse -9,810.9 3.8 6/4/14 16:46 6/4/14 16:55 – EOP moson -6,657.9 3.0 6/4/14 16:09 6/4/14 16:18 -1.7 EOP moson -6,653.1 3.0 6/4/14 16:46 6/4/14 16:36 -6.6 EOP murray 5,616.4 2.6 6/4/14 15:41 6/4/14 15:34 1.4

11
From station To station Gravity
difference (µgal)
Standard deviation
(µgal)
From observation, date and time
(UTC)
To observation, date and time
(UTC)
Residual of adjusted
observation (µgal)
EOP murray 5,616.8 2.7 6/4/14 15:41 6/4/14 15:49 0.9 EOP white -1,452.0 3.2 6/17/14 15:54 6/17/14 15:44 3.7 FIRE ch201 24,398.8 3.3 6/3/14 22:49 6/3/14 23:00 0.8 FIRE ch206 10,753.2 2.9 6/3/14 22:22 6/3/14 22:33 0.8 FIRE ch207 7,084.9 3.1 6/3/14 22:22 6/3/14 22:14 1.0 FIRE ch208 4,171.9 3.5 6/3/14 21:52 6/3/14 21:38 3.9 FIRE ch208 4,175.6 3.6 6/3/14 21:52 6/3/14 22:08 0.1 FIRE cochise -2,940.4 3.4 6/6/14 20:07 6/6/14 20:14 5.8 FIRE forsberg -3,366.4 3.5 6/6/14 19:21 6/6/14 19:29 -1.8 FIRE GATE -14,888.9 3.0 6/6/14 20:07 6/6/14 19:54 -4.6 FIRE GATE -14,883.6 4.0 6/13/14 19:38 6/13/14 19:55 -9.9 FIRE lowes -6,748.3 3.2 6/6/14 19:21 6/6/14 19:14 -2.6 forsberg ihop -9,432.1 3.6 6/6/14 19:29 6/6/14 19:40 -2.4 forsberg lowes -3,383.1 2.9 6/6/14 19:01 6/6/14 19:14 0.4 forsberg moson 5,439.8 3.2 6/6/14 19:01 6/6/14 18:53 0.0 forsberg ups 4,051.5 3.1 6/6/14 18:39 6/6/14 18:32 0.0 forsberg ups 4,051.7 3.7 6/6/14 18:39 6/6/14 18:46 -0.2 GATE bv 26,029.0 2.9 6/17/14 19:40 6/17/14 19:16 -5.0 GATE carm 1,907.1 2.7 6/5/14 0:27 6/5/14 0:37 1.1 GATE carm 1,908.2 3.2 6/5/14 1:14 6/5/14 1:06 0.0 GATE ihop 2,090.3 3.4 6/6/14 19:54 6/6/14 19:40 0.4 GATE police 5,052.8 3.6 6/5/14 1:14 6/5/14 1:25 -3.4 h4 mosey 5,823.8 3.5 6/4/14 19:52 6/4/14 19:45 -1.0 horse moson 3,158.3 3.1 6/4/14 16:27 6/4/14 16:18 0.5 horse moson 3,159.2 3.0 6/4/14 16:27 6/4/14 16:36 -0.5 ihop lowes 6,054.7 4.2 6/5/14 19:49 6/5/14 20:00 -2.8 ihop pueblo -3,689.7 3.3 6/5/14 16:46 6/5/14 16:58 1.3 ihop pueblo -3,689.1 4.2 6/5/14 17:05 6/5/14 16:58 0.7 lowes mesquite -21,634.9 3.5 6/5/14 20:00 6/5/14 20:20 2.4 lowes police -3,093.1 3.5 6/5/14 1:35 6/5/14 1:25 -0.1 lowes police -3,091.9 3.7 6/5/14 1:59 6/5/14 2:06 -1.3 mesquite pueblo 11,894.5 4.3 6/5/14 20:20 6/5/14 20:33 -2.3 mosey r4 1,607.1 3.6 6/10/14 22:21 6/10/14 22:14 2.1 mosey r5 2,282.3 3.8 6/10/14 22:01 6/10/14 22:07 1.1 mosey r5 2,284.2 3.6 6/10/14 22:01 6/10/14 21:55 -0.7 mosey sunrise 9,968.8 4.6 6/4/14 18:43 6/4/14 18:27 -7.8 moson sandrm2 6,845.1 2.8 6/6/14 18:09 6/6/14 18:17 0.0 moson ups -1,388.6 3.8 6/6/14 18:53 6/6/14 18:46 0.4 moson white 5,212.9 3.4 6/6/14 17:37 6/6/14 17:48 -1.4

12
From station To station Gravity
difference (µgal)
Standard deviation
(µgal)
From observation, date and time
(UTC)
To observation, date and time
(UTC)
Residual of adjusted
observation (µgal)
moson white 5,213.8 3.4 6/6/14 18:09 6/6/14 18:04 -2.4 NEVA ant3 -3,066.3 4.0 6/13/14 17:31 6/13/14 17:52 – NEVA ant3 -3,080.7 4.0 6/13/14 18:35 6/13/14 18:13 2.1 NEVA barataria 6,551.8 3.4 6/4/14 19:16 6/4/14 19:07 0.7 NEVA h4 -2,497.2 3.2 6/4/14 19:16 6/4/14 19:23 0.2 NEVA mosey 3,326.4 3.3 6/4/14 18:53 6/4/14 19:00 -0.6 NEVA mosey 3,326.4 4.5 6/4/14 18:53 6/4/14 18:43 -0.7 r1 ramsey -7,893.8 4.0 6/10/14 20:29 6/10/14 20:18 8.6 r1 ramsey -7,882.8 3.0 6/10/14 20:47 6/10/14 20:57 -2.4 r3 r4 1,598.8 3.8 6/10/14 21:15 6/10/14 21:22 -0.1 r3 r4 1,599.6 3.0 6/10/14 21:29 6/10/14 21:22 -0.9 r4 r5 674.6 3.3 6/10/14 21:46 6/10/14 21:55 -0.4 r4 r5 674.0 3.6 6/10/14 22:14 6/10/14 22:07 0.3 RIST alhambra -6,019.6 3.2 6/12/14 1:36 6/12/14 1:55 -2.9 RIST alhambra -6,017.7 4.0 6/13/14 0:04 6/12/14 23:45 -4.8 RIST alhambra -6,014.6 4.0 6/13/14 0:19 6/13/14 0:32 -7.9 RIST sunrise -2,862.3 3.2 6/17/14 18:30 6/17/14 18:08 8.0 rist101 RIST -5,481.8 4.0 6/13/14 1:37 6/13/14 1:50 1.2 rist101 RIST -5,481.5 4.0 6/13/14 1:37 6/13/14 1:22 0.9 rist101 rist102 -2,704.9 3.1 6/12/14 0:44 6/12/14 0:55 2.3 rist101 rist102 -2,704.8 3.0 6/12/14 1:18 6/12/14 1:11 2.1 rist101 rist103 -4,574.8 2.4 6/12/14 1:18 6/12/14 1:27 – rist101 rist103 -4,567.3 4.0 6/13/14 1:05 6/13/14 1:16 -3.1 rist101 rist103 -4,563.5 4.0 6/13/14 1:05 6/13/14 0:54 -7.0 rist102 rist103 -1,869.9 3.1 6/12/14 0:55 6/12/14 1:04 2.1 rist102 rist103 -1,870.2 3.1 6/12/14 1:11 6/12/14 1:04 2.4 rist103 alhambra -6,931.9 4.0 6/13/14 0:54 6/13/14 0:32 -0.7 rist103 RIST -910.9 2.8 6/12/14 1:27 6/12/14 1:36 0.8 rist103 RIST -908.9 4.0 6/13/14 0:10 6/13/14 0:19 -1.2 rist103 RIST -908.2 4.0 6/13/14 0:10 6/13/14 0:04 -1.9 rist103 RIST -910.3 4.0 6/13/14 1:16 6/13/14 1:22 0.2 sandrm2 ups -8,233.2 2.9 6/6/14 18:17 6/6/14 18:32 -0.1 sandrm2 white -1,633.9 3.4 6/6/14 17:56 6/6/14 17:48 0.3 sandrm2 white -1,633.4 3.8 6/6/14 17:56 6/6/14 18:04 -0.3

13
Table 2. Observed absolute-gravity values and uncertainty, Sierra Vista Subwatershed, Upper San Pedro Basin, Arizona, 2005–15. [Latitude and Longitude, North American Datum of 1983; Elevation, North American Vertical Datum of 1988 using GEOID03]
Absolute gravity station
Latitude Longitude Elevation (meters)
Date Gravity (µgal) Set scatter (µgal)
Precision (µgal)
Uncertainty (µgal)
CDF 31.5044 -110.2580 1,411 6/11/2014 979,002,564.0 1.69 0.69 5.27
1/16/2015 979,002,568.6 1.74 0.62 5.97
DORA 31.5831 -110.2044 1,288 6/11/2014 979,037,255.2 1.71 0.70 5.27
1/15/2015 979,037,262.7 1.79 0.57 5.97
EOP 31.56611 -110.18997 1,292.3 6/18/2009 979,031,537.4* 1.06 0.37 5.31
12/2/2009 979,031,525.9* 2.41 0.85 5.32
12/8/2010 979,031,522.7* 1.09 0.38 5.31
6/12/2014 979,031,535.8 2.06 0.84 5.30
1/15/2015 979,031,536.0 1.58 0.5 5.96
FIRE 31.5623 -110.2401 1,300 6/12/2014 979,022,781.4 1.27 0.52 5.25
1/15/2015 979,022,793.2 2.91 0.92 6.01
GATE 31.5583 -110.3075 1,405 6/13/2014 979,007,890.3 1.20 0.49 5.25
1/15/2015 979,007,910.2 2.23 0.70 5.98
MDB 31.55012 -110.34232 1,475 9/27/2011 978,997,664.6 1.29 0.46 5.24
6/13/2014 978,997,669.5 1.52 0.62 5.27
1/16/2015 978,997,672.2 0.64 0.26 5.95
MW3 31.58397 -110.24905 1,334.83 7/8/2005 979,027,309.3 2.79 0.88 5.32
5/8/2008 979,027,340.0 2.12 0.71 5.32
1/13/2009 979,027,336.6 1.72 0.70 5.32
6/17/2009 979,027,340.1 2.41 0.76 5.32
12/3/2009 979,027,354.7 1.79 0.63 5.32
5/20/2010 979,027,352.1 2.6 0.82 5.32
12/7/2010 979,027,361.0 1.20 0.42 5.31
6/11/2014 979,027,338.3 1.12 0.50 5.25
1/16/2015 979,027,350.8 2.00 0.82 6.00
MW4 31.59163 -110.23229 1,317.73 7/8/2005 979,035,517.8 1.13 0.36 5.31
5/8/2008 979,035,570.0 2.80 0.99 5.33
1/13/2009 979,035,559.7 0.41 0.14 5.31
6/17/2009 979,035,561.7 3.02 0.96 5.32
12/3/2009 979,035,577.5 1.41 0.50 5.31
5/20/2010 979,035,582.5 2.10 0.66 5.32
12/7/2010 979,035,571.7 1.11 0.39 5.31
6/11/2014 979,035,561.7 2.56 0.91 5.30
1/16/2015 979,035,589.7 1.58 0.64 5.98

14
Absolute gravity station
Latitude Longitude Elevation (meters)
Date Gravity (µgal) Set scatter (µgal)
Precision (µgal)
Uncertainty (µgal)
MW5 31.60913 -110.20687 1,283.98 7/8/2005 979,050,435.8 2.75 0.87 5.32
5/8/2008 979,050,434.9 2.51 0.79 5.32
1/14/2009 979,050,441.3 2.32 0.95 5.32
6/17/2009 979,050,437.1 1.36 0.48 5.31
12/3/2009 979,050,440.0 1.59 0.56 5.32
5/20/2010 979,050,460.3 2.06 0.69 5.32
12/7/2010 979,050,459.4 1.85 0.59 5.32
6/12/2014 979,050,450.6 2.01 1.01 5.32
1/16/2015 979,050,466.7 1.89 0.77 5.99
MW6 31.60271 -110.27541 1,348 1/14/2009 979,028,332.7 1.81 0.64 5.32
6/17/2009 979,028,343.4 3.22 1.02 5.33
12/3/2009 979,028,340.9 1.04 0.37 5.31
5/20/2010 979,028,351.5 3.23 1.02 5.33
12/7/2010 979,028,358.8 1.63 0.47 5.32
6/12/2014 979,028,363.8 1.16 0.41 5.36
1/16/2015 979,028,358.7 1.55 0.63 5.98
NEVA 31.4526 -110.1895 1,359 6/12/2014 979,001,620.9 0.68 0.28 5.24
1/16/2015 979,001,626.7 1.44 0.51 5.96
AAPALO 31.38844 -110.12208 1,294.3 10/29/2007 979,004,708.6 1.82 0.57 5.32
4/15/2008 979,004,713.6 4.94 1.56 5.34
11/20/2008 979,004,714.3 3.03 0.96 5.32
6/16/2009 979,004,712.0 1.73 0.61 5.32
12/2/2009 979,004,706.2 1.29 0.46 5.31
5/21/2010 979,004,710.5 1.81 0.64 5.32
12/8/2010 979,004,706.4 1.72 0.54 5.32
6/13/2014 979,004,696.8 1.29 0.53 5.25
RIST 31.5095 -110.1666 1,300 6/11/2014 979,017,748.0 1.08 0.48 5.25
1/15/2015 979,017,754.2 2.04 0.64 5.98
TW9 31.60594 -110.23878 1,312 6/18/2008 979,038,405.3 3.44 1.40 5.34
1/13/2009 979,038,396.8 0.38 0.19 5.31
6/17/2009 979,038,407.7 2.51 0.89 5.32
12/3/2009 979,038,404.8 3.81 1.20 5.33
5/20/2010 979,038,404.0 1.85 0.58 5.32
12/7/2010 979,038,402.1 1.50 0.48 5.31
6/12/2014 979,038,405.0 1.81 0.74 5.28
1/16/2015 979,038,406.0 1.15 0.47 5.96
* Value differs by about 1 μGal from that in Kennedy and Winester (2011)

15
Table 3. Vertical gravity gradients and land-surface transfer values, Sierra Vista Subwatershed, Upper San Pedro Basin, Arizona, 2014.
Absolute gravity station
Transfer from A-10 height to Burris meter height
(71.7 cm to 5.6 cm; µgal) Vertical gradient
(µgal/cm) Standard
deviation (µgal)
GATE 203.0 -3.15 0.84 CDF 196.8 -3.06 0.50 NEVA 195.5 -3.04 0.69 RIST 197.8 -3.08 0.74 EOP 191.5 -2.97 0.30 DORA 201.2 -3.13 0.53 FIRE 198.2 -3.09 0.34
Relative gravimeter drift during each survey was estimated using either a 1st, 2nd, or 3rd order
linear model, or using locally weighted scatterplot smoothing (LOWESS), a nonlinear method useful for making predictions over short intervals of the independent (x-axis) variable when the overall variation is not well-described by linear models (Helsel and Hirsch, 2002). When possible, a single drift curve was fitted for all repeat occupations during a single day, and the modeled drift was subtracted from the observed gravity value at all stations visited on that day. On some days, surveys are divided into shorter-duration drift curves if the dial setting on the relative gravimeter was changed, which can cause changes in the drift behavior. Dial setting changes are necessary when the gravity value moves beyond a preset calibration point. All data were collected at one of two dial settings. The total gravity range for all stations in the network is about 71 mGal. For all surveys, instrumental drift was acceptably modeled using one of the above models (fig. 3). Although one survey, 2014-06-17a, is not well simulated by a linear model, the drift rate for this survey is low (around -5 μGal/hr), and the required correction is minor. Using the interpolated drift curves (fig. 3), the accumulated drift at each station occupation is subtracted from the observed value prior to doing the network adjustment. Final, adjusted gravity values are provided in table 4.
Mapping-grade station positions (table 4) were obtained at most stations by a handheld (autonomous) Global Positioning System (GPS) receiver. Survey-grade accuracy (that is, less than 2 cm in the vertical) is required to monitor vertical movement, and a thorough differential-GPS survey is needed. Nonetheless, previous evaluation of station stability and land-surface elevation change using GPS data suggests it is reasonable to expect little to no station movement from year to year (Kennedy and Winester, 2011). Photographs taken during reconnaissance and station installation before the 2014 survey will be used to verify station stability prior to the next round of measurements.

16
Figure 3. Observed drift and modeled drift curves for each subset of relative-gravity observations collected June 3–17, 2014, Sierra Vista Subwatershed, Upper San Pedro Basin, Arizona. (UTC, Universal Time Coordinated).

17
Table 4. Network-adjusted gravity values, Sierra Vista Subwatershed, Upper San Pedro Basin, Arizona, June 2014. [Capital letters in station name indicate an absolute-gravity station. Latitude and Longitude, North American Datum of 1983]
Station Adjusted gravity,
(µgal)
Standard deviation
(µgal) Latitude Longitude alhambra 979,011,929.9 2.9 31.4969 -110.1814 ant3 978,998,742.5 4.4 31.4950 -110.2831 barataria 979,008,366.5 3.4 31.4818 -110.1901 blue 979,013,905.4 3.1 31.5473 -110.2580 bv 979,034,107.2 3.4 31.5731 -110.2041 bv301 979,046,620.3 4.5 31.5983 -110.2069 bv302 979,044,735.5 4.4 31.5920 -110.2056 bv303 979,042,511.8 4.0 31.5883 -110.2051 bypass 979,018,142.4 3.2 31.5697 -110.2638 carm 979,010,009.2 3.4 31.5583 -110.2908 carp 979,000,323.9 4.2 31.4675 -110.2564 CDF 979,002,754.0 3.4 31.5044 -110.2580 ch201 979,047,366.5 4.6 31.5971 -110.1895 ch202 979,044,204.0 4.7 31.5930 -110.1947 ch203 979,041,787.4 4.1 31.5888 -110.1998 ch205 979,035,885.3 3.6 31.5799 -110.2077 ch206 979,033,730.9 3.3 31.5768 -110.2143 ch207 979,030,065.5 3.1 31.5724 -110.2239 ch208 979,027,157.6 3.2 31.5695 -110.2296 chief 979,017,332.6 5.7 31.5254 -110.1897 choctaw 978,999,605.1 4.4 31.4893 -110.2576 cochise 979,020,052.5 3.0 31.5629 -110.2483 DORA 979,037,451.3 3.2 31.5831 -110.2044 EOP 979,031,709.7 2.8 31.5661 -110.1900 FIRE 979,022,984.9 2.4 31.5623 -110.2401 forsberg 979,019,619.1 2.9 31.5498 -110.2319 GATE 979,008,102.4 3.0 31.5583 -110.3075 h4 978,999,323.6 4.2 31.4381 -110.1899 horse 979,021,898.5 3.6 31.5398 -110.1899 ihop 979,010,191.6 3.1 31.5349 -110.2583 lowes 979,016,239.0 2.7 31.5582 -110.2596 mandan 978,999,415.5 4.7 31.4782 -110.2576 mesquite 978,994,622.5 4.7 31.4523 -110.2571 mosey 979,005,142.1 3.4 31.4672 -110.1897 moson 979,025,054.9 2.8 31.5520 -110.1899 murray 979,037,323.2 3.6 31.5806 -110.1896 MW5 979,050,662.6 4.7 31.6091 -110.2069

18
Station Adjusted gravity,
(µgal)
Standard deviation
(µgal) Latitude Longitude NEVA 979,001,818.8 3.5 31.4526 -110.1895 police 979,013,148.0 3.2 31.5634 -110.2740 pueblo 979,006,505.9 3.4 31.5175 -110.2571 r1 978,987,571.8 5.9 31.4673 -110.2813 r3 979,005,152.5 4.1 31.4675 -110.2405 r4 979,006,750.1 3.8 31.4675 -110.2214 r5 979,007,423.9 3.9 31.4674 -110.2017 ramsey 978,979,692.4 6.9 31.4658 -110.2930 RIST 979,017,947.9 2.7 31.5095 -110.1666 rist101 979,023,424.4 3.5 31.5036 -110.1489 rist102 979,020,723.8 3.5 31.5051 -110.1553 rist103 979,018,857.4 3.1 31.5054 -110.1608 sandrm2 979,031,894.9 3.6 31.5461 -110.1567 sunrise 979,015,095.7 3.0 31.5149 -110.1807 ups 979,023,667.7 3.3 31.5544 -110.2142 white 979,030,262.5 3.3 31.5496 -110.1753
Uncertainty An important factor in time-lapse gravity surveys is the accuracy of the datum of each survey. In
this case, the datum is established by the absolute gravimeter. The absolute gravimeter is difficult to calibrate because of the lack of an absolute-gravity standard. Because gravity is constantly changing at all locations, there is no static gravity “reference station.” To compensate, absolute gravimeters are periodically compared at “intercomparisons,” where several gravity meters operate side-by-side over a period of several days. The A-10 gravimeter used in the present study has been operated at four intercomparisons, in 2003, 2005, 2011, and 2014, each time with favorable results (Francis and van Dam, 2003; Jiang and others, 2011; Schmerge and others, 2012).
The accuracy of the relative-gravity measurements is checked through the method of least squares by (1) calculating the standard deviation of unit weight (also called the network reference factor), (2) testing the estimated accuracy of the relative-gravity differences using a chi-square statistical test, (3) evaluating the observation residuals (the difference between the observed relative-gravity differences and the adjusted differences), and (4) evaluating the standard deviation of the predicted gravity value at each station. The reference factor provides a comparison between the estimated accuracy of the relative-gravity observations and the accuracy of the network adjustment. Values close to 1 indicate good agreement between the two. If the reference factor is lower than 1, the measurements are better than expected; values greater than 1 indicate the expected precision has not been attained. In either instance, the reference factor is adjusted and the least squares procedure repeated. A chi-square test is used to compare the reference factor to an expected value, based on the chi-square distribution and the degrees of freedom in a particular survey network (the total number of observations minus the number of non-redundant observations). The chi-square test provides a pass/fail criterion for accepting or rejecting adjustment results (Hwang and others, 2002).

19
As a first step in the network adjustment, outlier observations were identified in the dataset. Outliers, informally defined as observations that are unusually inconsistent with the rest of the data, are not uncommon in relative-gravity data (Hwang and others, 2002). The search for outliers was guided by evaluating “loop closures,” the effect of individual observations on the overall quality of the network, and Pope’s τ-test method (Pope, 1976) as implemented in Gravnet software (Hwang and others, 2002). Ten observations, or 5.8 percent of all observations, were excluded from the adjustment (table 1). Of these, five were between the same two stations as another observation that was included in the adjustment.
After performing the network adjustment, the largest observation residual is -9.9 μGal (table 1), the average absolute observation residual is 2.2 μGal, and the standard deviation of the observation residuals is 2.1 μGal. The residuals are approximately Gaussian, and 100 out of 165 observations lie within ±1 standard deviation (fig. 4). The network reference factor is 1.085, close to the desired value of 1, and a chi-square test indicates the original estimate of observation uncertainty is appropriate. The gravimeter scale factor (a correction to the gravimeter calibration) determined during the network adjustment was 1.0007.
The largest estimated station standard deviation is 6.9 μGal and the average estimated station standard deviation is 3.7 μGal (table 4). The network adjustment procedure incorporates the measurement uncertainty of the absolute-gravity measurements; as a result, the estimated value at each of these stations is not fixed in the network adjustment, and the adjusted value may be different than the value measured using the A-10 absolute gravimeter. The differences between the network-adjusted gravity values (table 4) and the measured gravity values (table 2) at stations EOP and MW5 are relatively large, -16.7 and 10.3 μGal, respectively. This discrepancy may indicate either error in the transfer measurement from the A-10 instrument height to the relative-gravimeter instrument height, simply a bad measurement with the A-10, or an incorrect estimate of either A-10 or relative-gravimeter measurement standard deviation. During a future survey, the transfer measurements at these stations should be re-measured.
Figure 4. Histogram showing distribution of observation residuals for the network-adjusted gravity values for the June 2014 gravity survey, Sierra Vista Subwatershed, Upper San Pedro Basin, Arizona.

20
Comparison with Historical Data Gravity data were collected in a large portion of the Sierra Vista Subwatershed from 2005
through 2010 (Kennedy and Winester, 2011); no surveys were made from 2011 through 2013. The original network included several stations east of the San Pedro River and south of Ramsey Road. Comparison of 2014 measurements with previous data from 2010 is primarily limited to the eight absolute-gravity stations observed during both surveys. Direct comparison of network-adjusted gravity measurements is difficult because a different relative gravimeter, the Burris Zero-Length-Spring meter, was used on the 2014 survey instead of the Lacoste and Romberg D-meter used on previous surveys. Each relative gravimeter has a unique calibration; the increased uncertainty inherent in trying to cross-calibrate two gravimeters results in excessive uncertainty in measured gravity differences for the purpose of monitoring aquifer storage change. Furthermore, the two instruments have different measurement heights. The variation in the change in gravity with height (vertical gravity gradient) from station to station means additional uncertainty is introduced. Nonetheless, the improved measurement characteristics of the Burris gravimeter outweigh the drawbacks of changing instruments.
Time-series plots of absolute-gravity change show that gravity, and therefore aquifer storage, decreased between 2010 and 2014 at stations MW3, MW4, MW5, TW9, and AAPALO, and increased at stations MW6, EOP, and MDBLDG (fig. 5). This decrease in aquifer storage is consistent with measured declines in groundwater levels in the region (data available at http://az.water.usgs.gov/projects/9671-BU2/), although the large groundwater-level decline at some stations (MW3, MW4, MW5, TW9, AAPALO) indicates there may also be a decrease in the amount of water stored in the unsaturated zone between the land surface and the aquifer. The magnitude of gravity change at these stations is larger than would be expected from the change in water levels at co-located wells.
Monsoonal (July–October) 2014 rainfall was relatively large across the study area. Between 14 and 18 in. of precipitation (36 and 46 cm) is estimated at most stations in the gravity network (fig. 6), based on rain-gauge-corrected radar estimates (National Weather Service, 2015). Compared to average rainfall estimated for July–October using the Parameter-elevation Relationships on Independent Slopes Model (PRISM Climate Group, 2014), about one-half of the study area received 150 percent or greater than normal precipitation for this period (fig. 7). The large volume of precipitation resulted in increased gravity at all absolute-gravity stations, except one, between June 2014 and January 2015 (figs. 5 and 7), and the magnitude of the increase is generally, but not exactly, correlated with the spatial distribution of precipitation (station AAPALO was not measured in January 2015). The large increase in gravity (28.0 µGal) at station MW4 is greater than would be expected simply from infiltration of rainfall at the land surface based on the infinite-slab approximation (1 m of free-standing water equals 41.9 μGal). One explanation is that focused recharge in nearby ephemeral channels and (or) groundwater underflow results in a greater increase in aquifer storage at this station than would be expected from rainfall alone. That is, total subsurface storage increases both as the result of precipitation stored near the land surface (some of which will eventually become recharge), and as the result of an increase in water stored at depth in the aquifer.

21
Figure 5. Time-series plots of absolute gravity, Sierra Vista Subwatershed, Upper San Pedro Basin, Arizona, 2005–15.

22
Figure 5.—Continued

23
Figure 6. Map showing monsoonal precipitation, Sierra Vista Subwatershed, Upper San Pedro Basin, Arizona, July–October 2014.

24
Figure 7. Map showing change in gravity from June 2014 to January 2015 and percentage of average summertime (July–October) precipitation, Sierra Vista Subwatershed, Upper San Pedro Basin, Arizona.

25
Conclusions This report presents the status of the Sierra Vista Subwatershed gravity network and gravity data
from June 2014 and January 2015. Although the gravity data can be used directly to study the geologic structure of the basin, that is already relatively well-known based on prior studies (Pool and Coes, 1999; Gettings and Houser, 2000; Wynn, 2005). The primary value of the data is to provide a “snapshot” of the gravity field so that the change in gravity, and therefore aquifer storage, can be estimated in the future. Comparison to measurements at the relative-gravity stations observed in previous surveys (Kennedy and Winester, 2011) is not attempted because of the uncertainty introduced by the use of a different relative gravimeter and the change in the configuration of the gravity network. Going forward, however, the new gravity network configuration has significant benefits—additional absolute gravity stations increase accuracy and precision and the closer station spacing facilitates spatial interpolation of measured gravity values.
Gravity generally remained the same or decreased from the prior round of measurements in 2010 to 2014. Because of greater-than-average precipitation in 2014, gravity increased at all absolute-gravity stations but one between June 2014 and January 2015. Precipitation was 150 percent of normal or greater at more than one-half of the stations in the study area. The large increase in gravity at station MW4, 28.0 μGal, indicates a greater amount of water-storage increase than can be accounted for by infiltrated rainfall alone; this station is likely also sensitive to increased aquifer storage at depth, either through nearby focused recharge or by groundwater underflow.
References Cited Creutzfeldt, B., Güntner, A., Vorogushyn, S., and Merz, B., 2010, The benefits of gravimeter
observations for modelling water storage changes at the field scale: Hydrology and Earth System Sciences, v. 14, no. 9, p. 1,715–1,730. [Also available at http://www.hydrol-earth-syst-sci.net/14/1715/2010.]
Francis, O., and van Dam, T., 2006, Analysis of results of the international comparison of absolute gravimeters in Walferdange (Luxembourg) of November 2003, in Jekeli, C., Bastos, L., and Fernandes, J., eds., Gravity, geoid and space missions: International Association of Geodesy Symposia, v. 129, p. 272–275.
Gettings, M.E., and Houser, B.B., 2000, Depth to bedrock in the Upper San Pedro Valley, Cochise County, southeastern Arizona: U.S. Geological Survey Open-File Report 00-138, Online version 1.0., accessed Dec. 1, 2014, at http://pubs.usgs.gov/of/2000/of00-138/.
Helsel, D.R., and Hirsch, R.M., 2002, Statistical methods in water resources: U.S. Geological Survey Techniques of Water Resources Investigations, book 4, chap. A3, 522 p.
Hwang, C., Wang, C.G., and Lee, L.H., 2002, Adjustment of relative gravity measurements using weighted and datum-free constraints: Computers & Geosciences, v. 28, no. 9, p. 1,005–1,015.
Jiang, Z., Francis, O., Vitushkin, L., Palinkas V., Germak, A., Becker, M., D’Agostino, G., Amalvict, M., Bayer, R., Bilker-Koivula, M., Desogus, S., Faller, J., Falk, R., Hinderer, J., Gagnon, C., Jakob, T., Kalish, E., Kostelecky, J., Chiungwu, L., Liard, J., Lokshyn, Y., Luck, B.,Mäkinen, J., Mizushima, S., Le Moigne, N., Origlia, C., Pujol, E.R., Richard, P., Robertsson, L., Ruess, D., Schmerge, D., Stus, Y., Svitlov, S., Thies, S., Ullrich, C., Van Camp, M., Vitushkin, A., Ji, W., and Wilmes, H., 2011, Final report on the seventh international comparison of absolute gravimeters (ICAG-2005): Metrologia, v. 48, p. 246–260.

26
Kennedy, J.R., and Winester, D., 2011, Gravity data from the Upper San Pedro Basin, Cochise County, Arizona: U.S. Geological Survey Open-File Report 2011-1287, 11 p. and data files, accessed November 1, 2014, at http://pubs.usgs.gov/of/2011/1287/.
Kennedy, J., Ferré, T.P.A., Güntner, A., Abe, M., and Creutzfeldt, B., 2014, Direct measurement of subsurface mass change using the variable baseline gravity gradient method: Geophysical Research Letters, v. 41, no. 8, p. 2,827–2,834, accessed November 1, 2014, at http://dx.doi.org/10.1002/2014GL059673.
Lacher, LJ., Turner, D.S., Gungle, Bruce, Bushman, B.M., and Richter, H.E., 2014, Application of hydrologic tools and monitoring to support managed aquifer recharge decision making in the upper San Pedro River, Arizona, USA: Water, v. 6, p. 3,495–3,527, accessed December 1, 2014, at http://dx.doi.org/10.3390/w6113495.
National Weather Service, [2015], Advanced hydrologic prediction service data download page: National Weather Service, accessed January 15, 2015, at http://water.weather.gov/precip/download.php.
PRISM Climate Group, [2014], PRISM Climate Data: Oregon State University Web page, accessed October 10, 2014, at http://prism.oregonstate.edu.
Pool, D.R., and Eychaner, J.H., 1995, Measurements of aquifer-storage change and specific yield using gravity surveys: Ground Water, v. 33, no. 3, p. 425–432.
Pool, D.R., and Coes, A.L., 1999, Hydrogeologic Investigations of the Sierra Vista Subwatershed of the Upper San Pedro Basin, Cochise County, southeast Arizona: U.S. Geological Survey Water-Resources Investigations Report 99-4197, 38 p. [Also available at http://pubs.er.usgs.gov/publication/wri994197]
Pool, D.R., and Anderson, M.T., 2008, Ground-water storage change and land subsidence in Tucson Basin and Avra Valley, southeastern Arizona, 1998–2002: U.S. Geological Survey Scientific Investigations Report 2007-5275, 34 p.
Pope, A.J., 1976, The statistics of residuals and the detection of outliers: Rockville, Maryland, National Oceanic and Atmospheric Administration Technical Report no. S65 NGS1, 133 p.
Schmerge, D., Corkhill, F., and Flora, S., 2009, Water-level conditions in the Upper San Pedro Basin, Arizona, 2006: Arizona Department of Water Resources, ADWR Water Level Change Map Series Report No. 3, 3 plates.
Schmerge, D., Francis, O., Henton, J., Ingles, D., Jones, D., Kennedy, J., Krauterbluth, K., Liard, J., Newell, D., Sands, R., Schiel, A., Silliker, J., and van Westrum, D., 2012, Results of the first North American comparison of absolute gravimeters, NACAG-2010: Journal of Geodesy, v. 86, no. 8, p. 591–596, accessed December 1, 2014, at http://dx.doi.org/10.1007/s00190-011-0539-y.
Strang, G., and Borre, K., 1997, Linear algebra, geodesy, and GPS: Wellesley, Massachusetts, Wellesley-Cambridge Press, 624 p.
Torge, W., 1989, Gravimetry: Berlin, De Gruyter, 482 p. Wynn, J., 2005, Mapping ground water in three dimensions—An analysis of airborne geophysical
surveys of the Upper San Pedro Basin, Cochise County, Southeastern Arizona: U.S. Geological Survey Professional Paper 1674, one CD-ROM, accessed November 1, 2014, at http://pubs.usgs.gov/pp/2006/1674/.

Publishing support provided by the U.S. Geological SurveyPublishing Network, Menlo Park and Tacoma Publishing Service Center
For additional information contact: Director, Arizona Water Science Center
U.S. Geological Survey 520 N. Park Avenue Tucson, AZ 85719 http://az.water.usgs.gov

Kennedy—G
ravity Data from
the Sierra Vista Subwatershed, U
pper San Pedro Basin, A
rizona—Open-File Report 2015–1086
ISSN 2331-1258 (online)http://dx.doi.org/10.3133/ofr20151086