gravity-fed water distribution system - mtudwatkins/idesign09/2016/ce4916_fall2016_mesele... · the...
TRANSCRIPT

December 9, 2016
Michigan Technological University
Gravity-Fed Water Distribution System
Bucori, Panama
iDesign CE 4916 David Watkins, PhD, PE Mike Drewyor, PE, PS
Terrianna Bradley Samantha Fentress Courtney Fournier
Kristina Rushlau

LETTER OF TRANSMITTAL
To: Dr. David Watkins, PhD, PE Copy: Mike Drewyor, PE, PS [email protected] [email protected] Description:
Mesele’s mission was to create a pipe network that will distribute water from three natural springs to the neighborhood of Central Bucori. Water will be treated individually at home.
The water from the springs will be fed to a holding tank with PVC piping; from the holding tank the water will be distributed directly to the community homes and buildings. The water piping network will cross seven streams, one river, and one valley.
Mesele created a water distribution design, performed a cost analysis, and developed a construction schedule and manual.
The system will cost 15,300 dollars and take 40 work days to complete. The water will be treated in home using chlorine.
Mesele would like to thank instructors Mike Drewyor and David Watkins for their support on the project. Mesele would like to also thank Taylor Domagalla for her support in the community and providing information in the United States. Mesele would also like to thank Kiko de Melo e Silva and the Community of Bucori for all the support in collecting the necessary data.
This report, titled “Gravity-Fed Water Distribution System; Bucori, Panama”, represents the efforts of undergraduate students in the Environmental and Geological Engineering Departments of Michigan Technological University. While the students worked under the supervision and guidance of associated faculty members, the contents of this report should not be considered professional engineering. By Team Mesele:
Terrianna Bradley
Samantha Fentress
Courtney Fournier
Kristina Rushlau
Date: December 9, 2016 Project: Gravity-Fed Water Distribution System; Bucori, Panama Submittal: Final Report Re: CE 4916 International Senior Design Fall 2016

Mesele Final Report i December 9, 2016
Table of Contents
Executive Summary ..................................................................................................... iv
Introduction .................................................................................................................. 1
Community Background ........................................................................................... 1
Project Information .................................................................................................. 2
Methodology ................................................................................................................ 3
On Site Data Gathering ............................................................................................. 3
Other Project Information ........................................................................................ 4
Design ........................................................................................................................... 5
Spring Boxes ............................................................................................................. 6
Holding Tank ............................................................................................................. 8
Piping Network ....................................................................................................... 11
River Crossing ......................................................................................................... 14
Cable Calculations ............................................................................................... 14
Anchor Calculations ............................................................................................ 15
Stringer Lengths .................................................................................................. 17
Stream Crossings .................................................................................................... 19
Water Treatment .................................................................................................... 21
Construction Schedule ................................................................................................ 22
Cost Estimate .............................................................................................................. 22
Conclusion .................................................................................................................. 24
References .................................................................................................................. 25
Appendices ................................................................................................................. 27

Mesele Final Report ii December 9, 2016
List of Tables Table 1 Anchor Slab Dimensions ................................................................................ 16 Table 2 Stringer Lengths and Location ....................................................................... 18 Table 3 Concrete Anchor Dimensions for Valley Anchor ............................................ 20 Table 4. Spring Box Dimensions .................................................................................. 36 Table 5. Spring Volumes (m3) ..................................................................................... 36 Table 6. Spring Volumes (ft3) ...................................................................................... 36 Table 7. Concrete Mix Ratios for Spring Boxes ........................................................... 36 Table 8. Spring A Concrete Volumes (ft3) ................................................................... 37 Table 9. Springs B & C Concrete Volumes (ft3) ........................................................... 37 Table 10. Concrete for Spring A, B, & C ...................................................................... 37 Table 11. Rebar for Springs A, B & C ........................................................................... 38 Table 12 Measurements of the Water Holding Tank ................................................. 40 Table 13 Data for the Cable Calculations for the River Crossing ................................ 53 Table 14 Concrete Anchor Data for River Crossing .................................................... 53 Table 15 Stringer Data for River Crossing ................................................................... 54 Table 16 Stringer Calculations and Total Cable Required........................................... 54 Table 17 Final Cable Length for River Crossing ........................................................... 54 Table 18 Data for the Cable Calculations for the Stream Crossing ............................. 55 Table 19 Concrete Anchor data for Stream Crossing ................................................. 55 Table 20 Stringer Data for Stream Crossing ............................................................... 56 Table 21 Stringer Calculations and Total Cable Required........................................... 56 Table 22 Final Cable Length for River Crossing ........................................................... 56 Table 23 Tasks, Man-hours, and Schedule for Construction ...................................... 63 Table 24 Cost Estimate of Materials for Water Distribution System ......................... 71 Table 25 Cost Estimate of Equipment for Water Distribution System ....................... 72
Mesele Final Report iii December 9, 2016
List of Figures Figure 1 Location of Bucori, Panama [6] ....................................................................... 1 Figure 2 Spring Box A Schematic Highlighting Major Components .............................. 8 Figure 3 Model of Water Holding Tank ........................................................................ 9 Figure 4 Image to Show Ladder Rungs Shape and Placement [10]........................... 10 Figure 5 Image of Roof Slab Reinforced with Rebar [10] ........................................... 11 Figure 6 Layout of Network Zones .............................................................................. 12 Figure 7 Cleanout Valve Fitting ................................................................................. 13 Figure 8 HGL and Elevation of Pipeline .................................................................... 13 Figure 9 Conceptual Sketch of River Crossing ............................................................ 14 Figure 10 Model of Concrete Anchor ......................................................................... 16 Figure 11 Rebar Cage and Stirrups for Concrete Support .......................................... 17 Figure 12 Stringer Connections .................................................................................. 18 Figure 13 Design 1: Narrow Stream with No Wash-Out Risk ..................................... 19 Figure 14 Design 2: Stream Crossings with a Wash Out Risk...................................... 20 Figure 15 Design 3: Wide Valley Crossing ................................................................... 20 Figure 16 Valley Concrete Anchor .............................................................................. 21 Figure 17 Breakdown of Project Costs ........................................................................ 23 Figure 18. EPANet Model ............................................................................................ 29 Figure 19. Pressure Profile .......................................................................................... 30 Figure 20. Demand Pattern ........................................................................................ 30 Figure 21. Pressure profile .......................................................................................... 31 Figure 22. Demand Pattern ........................................................................................ 31 Figure 23. System Flow Balance ................................................................................. 32 Figure 24. System Flow Balance ................................................................................. 32 Figure 25. Head Throughout Network ........................................................................ 33 Figure 26. Head Throughout Network ........................................................................ 34 Figure 27 Engineering Drawing of the Water Holding Tank ....................................... 42 Figure 28 Layout of Network Zones ............................................................................ 44 Figure 29 Zone A1 Map (Yellow Highlights are 1.5-inch pipe) ................................... 44 Figure 30 Zone B1 Map (Yellow Highlights are 1.5-inch pipe) .................................... 45 Figure 31 Zone B2 Map (Yellow Highlights are 1.5-inch pipe) .................................... 46 Figure 32 Zone B3 Map (Yellow Highlights are 1.5-inch pipe) .................................... 47 Figure 33 Zone B4 Map (Yellow Highlights are 1.5-inch pipe) .................................... 48 Figure 34 Zone C1 Map (Yellow Highlights are 1.5-inch pipe) .................................... 49 Figure 35 Zone C2 Map (Yellow Highlights are 1.5-inch pipe) .................................... 50 Figure 36 Zone C3 Map (Yellow Highlights are 1.5-inch pipe) .................................... 51 Figure 37 Zone C6 Map (Yellow Highlights are 1.5-inch pipe) .................................... 51

Mesele Final Report iv December 9, 2016
Executive Summary Mesele’s mission was to create a pipe network that will distribute
water from three natural springs to the neighborhood of Central Bucori. Water
will be treated individually at home.
The water from the springs will be fed to a holding tank with PVC
piping, from the holding tank the water will be distributed directly to the
community homes and buildings. The water piping network will cross seven
streams, one river, and one valley.
Mesele created a water distribution design, performed a cost analysis,
and developed a construction schedule and manual.
The system will cost 15,300 dollars and take 40 work days to
complete. The water will be treated in home using chlorine.

Mesele Final Report 1 December 9, 2016
Introduction
Community Background
The village of Bucori is located on the Valiente peninsula in the
Ngabe-Bugle region of Panama (Figure 1). Currently, the community has no
access to potable water for drinking and cooking. The mission of Mesele was
to “Create a pipe network that will distribute water from 3 natural springs to
the neighborhood of Central Bucori. Water will be treated individually at
home”.
Figure 1 Location of Bucori, Panama [6]
The history of Bucori stems back to many years ago when a Ngabe
man moved to Bucori to work for a German banana farmer. After some time,
the farmer stopped paying the workers so the man sued the farmer. The man
won the lawsuit and all of the farmer’s land, including Bucori. The man’s
grandson, Faustino, is now the chief and landowner of the community.
Throughout Bucori there are seven neighborhoods. To travel between
most of the neighborhoods, it is necessary to take a canoe. The terrain is too
treacherous, and no trail has been created to connect the neighborhoods by
land, although there are currently a few community members working on
creating trails, especially for children to commute by land to school in
inclement weather conditions. The school is located in Central Bucori, which
requires students to have to row themselves in a canoe for up to an hour and a
Bucori, Panama

Mesele Final Report 2 December 9, 2016
half. In bad weather it becomes dangerous to travel between the
neighborhoods.
The houses in the community are all made from wood with thatched
roofs. All of the houses are raised about one meter off the ground on stilts.
Raising up the houses is done so the houses will not be affected by the heavy
rains that occur often. Some of the houses are located on docks over the water,
while others are inland. The neighborhood of Central Bucori is mostly
connected by a sidewalk that was constructed in the 1980’s. Areas where the
sidewalk does not run are often muddy and rougher terrain. There are also
many docks used to connect houses to the community. There are streams that
run through some areas of the community. Bridges of concrete or wood planks
are used to cross the streams, although the conditions of these crossings are
often poor. There is also a large river through the community that is only
crossable by boat.
The community currently obtains fresh water from harvesting
rainwater in large plastic drums. Chlorine is then used to sanitize the water.
An outdated 5,000-gallon capacity concrete tank exists near one of the older
spring boxes and is not functional. There are remnants of disconnected PVC
pipes, throughout the community, that once transported water from the
holding tank to the buildings. There is also a water distribution system already
in place from a local creek, and this water is used for laundry and bathing.
Project Information
According to the United States Geological Survey, a spring is a water
resource formed when the side of a hill, a valley bottom or other excavation
intersects a flowing body of groundwater at or below the local water table,
below which the subsurface material is saturated with water [13]. A spring is
the result of an aquifer being filled to the point that the water overflows onto
the land surface. The water system being designed will run from three natural
springs in the jungle of Bucori to a large holding tank. The water will be piped
to the community from the holding tank. Each house willing to pay a dollar
per month for system maintenance will have water delivered to their faucet.

Mesele Final Report 3 December 9, 2016
The community has three stores, a school, a health center, a
community kitchen, a church and 31 homes that will be receiving water. Most
of the faucets will be located one to three meters off the ground to reach the
kitchens of each home.
Seven stream crossings and one river crossing have been designed
throughout the system. All crossings will be independent of the bridges and/or
have their own suspension system associated with them. The largest river
crossing is 39.5 meters across. The stream crossings in the community
averaged from two to eight meters.
The rest of this report explains how information on the project was
gathered, the design of different components in the system, a recommended
construction schedule for the system, and a cost estimate for the project.
Methodology
On Site Data Gathering
Design for the water network is based on data collected on-site and
research conducted at Michigan Technological University. Data collected
during the on-site survey includes; flowrates of springs, water quality of
springs, elevation changes throughout the network, and distances from the
springs.
The volume-time method was used to calculate the flowrates of the
springs. A stopwatch was used to determine how long it takes to fill a gallon
bucket. The flowrates were then calculated using the volume of the container
divided by time.
Water quality tests were performed at each spring using 3M Petri-films
[19]. These Petri-films displayed the amount of coliform and E. coli colonies
present in the water sample. To use the Petri-films, 1 mL of the water was
extracted from the spring source and placed on the Petri-film plate. Light
pressure was applied across the water sample using the plastic 3M Petri-film
spreader to distribute the sample equally throughout the plate. Three samples
were taken at each spring. The plates were then incubated, lying flat, for 48
hours. After incubation, the coliforms present were counted. Blue colonies

Mesele Final Report 4 December 9, 2016
represent E. coli colonies and red colonies represent coliform colonies.
Colonies on the ring or foam are not counted.
Multiple points were surveyed along the network. Elevations of the
points from the springs to the proposed water tank were measured using a
water level. The water level is a simple apparatus prepared by using water and
a tube. The tube can be attached to a meter stick for elevation reference. Since
water equalizes its level, the difference in elevation can then be measured
from both ends of the tube that are attached to the meter sticks, making sure
there are no air bubbles in the tube [17]. Water level data for the network was
measured by Peace Corps Volunteer Taylor Domagalla and community
members.
All data points following the proposed water holding tank were
collected using a Nikon Rangefinder, measuring tape, and Garmin GPS. GPS
points were recorded along the route from the springs to the holding tank, at
significant elevation changes, and observed water crossings. The distance
between points was measured with measuring tape. A Nikon Rangefinder was
utilized to measure the angle of elevation between two points. Sticks of equal
length were placed at each point. A foresight angle was measured by placing
the Range Finder on the first stick and aiming towards the top of the second
stick. The back sight angle was recorded by measuring from the top of the
second stick to the top of the first stick. During this process, it was important
to keep the sticks vertical. The process was then repeated along the proposed
water route, measuring points at any significant elevation change or water
crossing.
Other Project Information
Further research has been conducted at Michigan Tech University to
create an optimal design for the water network. Improvements in
Sustainability in Gravity-Fed Water Systems [9] paper has been utilized as
guidance for spring box construction. For design of the holding tank,
recommendations from the Handbook of Gravity-Flow Water Systems [10]
have been incorporated. Stream and river crossing designs have been designed

Mesele Final Report 5 December 9, 2016
based on technical guidance from Standard dimensions and weight of PVC -
Polyvinyl Chloride [14]. Anchor calculations for stream and river crossings
were researched referencing Pipeline Crossings [18].
Additional data about functionality of the network has been obtained
from EPANet model analyses. This software models the water distribution
within the network over a 24-hour period. Team Mesele chose to use the
Hazen-Williams approximation for estimation of head loss in the network
(Eq.1) [11].
ℎ𝐿𝐿 = 4.727𝐶𝐶−1.852𝑑𝑑−4.871𝐿𝐿
ℎ𝐿𝐿 = 𝐻𝐻𝐻𝐻𝐻𝐻𝑑𝑑 𝐿𝐿𝐿𝐿𝐿𝐿𝐿𝐿 (𝑚𝑚)
𝐶𝐶 = 𝐻𝐻𝐻𝐻𝐻𝐻𝐻𝐻𝐻𝐻 −𝑊𝑊𝑊𝑊𝑊𝑊𝑊𝑊𝑊𝑊𝐻𝐻𝑚𝑚𝐿𝐿 𝑅𝑅𝐿𝐿𝑅𝑅𝑅𝑅ℎ𝐻𝐻𝐻𝐻𝐿𝐿𝐿𝐿 𝐶𝐶𝐿𝐿𝐻𝐻𝐶𝐶𝐶𝐶𝑊𝑊𝐶𝐶𝑊𝑊𝐻𝐻𝐻𝐻𝐶𝐶
𝑑𝑑 = 𝑃𝑃𝑊𝑊𝑃𝑃𝐻𝐻 𝐷𝐷𝑊𝑊𝐻𝐻𝑚𝑚𝐻𝐻𝐶𝐶𝐻𝐻𝐷𝐷 (𝑚𝑚𝑚𝑚)
𝐿𝐿 = 𝑃𝑃𝑊𝑊𝑃𝑃𝐻𝐻 𝐿𝐿𝐻𝐻𝐻𝐻𝑅𝑅𝐶𝐶ℎ (𝑚𝑚)
Eq. 1 Hazen-Williams Head Loss Equation
The pipe roughness coefficient, C, was assigned a value of 140. Two-
inch (50.8 mm) pipe diameter was used for the main network. There are three
springs in the network. EPANET does not provide an input for springs. Due to
this limitation, springs were simulated based on Arnalich’s book, EPANET
and Development. Springs were designated with a node and were assigned a
demand value that represented the observed spring flow rate [20]. An
overflow tank was connected to the spring(s) to assist in pressurized flow
from springs to the holding tank. Lastly a check valve was attached to the
pipes connected to the overflow tanks. Check-valves helped ensure that water
flowed only from the springs and that any excess water would be diverted to
the overflow tank.
Two scenarios were modeled in EPANET. One scenario used the
yearly average spring flow rates in the simulation. The second scenario used
the rainiest month spring flow rates in the simulation. Pressure profile plots
for each case show how the elevation head varies over a 24-hour period in the
holding tank. Water consumption is based on average, yearly spring flow
rates, and is very conservative. The conservative water consumption scenario

Mesele Final Report 6 December 9, 2016
shows less variance in the water level of the tank over a 24-hour period
(Appendix 1). In the second scenario, water consumption is based on the
rainiest season of the year where spring flowrates are highest. The water
elevation of the holding tank varies a lot more because consumption rises due
to increased availability of resources (Appendix 1). Additionally, a system
flow balance profile was created in EPANET to show the relation between
water supplied by springs and water consumption rates. For both cases, there
is sufficient water to supply community needs. Lastly, a hydraulic head
profile was created displaying the relation between head in the holding tank
and head in selected nodes within the network. This profile was produced for
both scenarios. Results can be found in Appendix 1.
Spring Boxes
There are three spring captures within the network, located at Springs
A, B, and C. The spring captures will serve to capture and protect freshwater
flowing from the natural geologic source until it reaches the storage tank.
Spring A is a concentrated spring located at an elevation of 5 meters above the
storage tank. Spring B is a seepage spring elevated at 16 meters above the
storage tank; it requires excavation to expose more eyes (inlets) of the spring.
Spring C is also a seepage spring elevated at 10 meters above the storage tank.
This spring has been excavated to discover more eyes, but it typically dries up
in the summer months. Underneath this spring are two smaller inlets that will
need to be exposed to yield more water.
Spring capture dimensions should be determined from a proper
topographic survey of the spring capture area. This is done by determining the
cross sectional dimensions of the eyes of the spring and the depth to the
impermeable layer [9]. Current dimensions of the spring capture areas in
Bucori are unknown because the eyes have not been fully exposed.
The inlets should be clearly exposed, after the excavation of the spring areas,
so the depth to the impermeable layer can be measured. Next adequate spring
capture dimensions can be determined.

Mesele Final Report 7 December 9, 2016
Dimensions for the spring boxes were determined based on World
Health Organization (WHO) data. Length, width, and height of the spring box
were chosen using engineering judgement and should not be regarded as a
final decision until the eyes of the spring and impermeable layers are clearly
exposed, after excavation has taken place. Thickness of base, cover, and walls
of the spring box were determined per recommendation of WHO [12].
Thickness dimensions for the cover, base, and walls of the spring boxes will
be 50mm, 100mm, and 100mm respectively. Spring box A will have length,
width, and height dimensions of 1m x 1m x 0.6m. The base will be 1m x 1m
with rebar spaced in 0.33m across the width and 0.33m spacing across the
length of the base. The dimensions for the side walls of spring box A will be
1m x 0.6m. Rebar will be spaced 0.15m across the height of the wall and
0.15m across the length of the wall. The front wall will have dimensions of
1m x 0.6m with rebar spaced in 0.15m intervals across the width and height.
The cover of the spring box will be 1m x 1m with rebar spaced 0.4m across
the length of the cover and 0.4m across the width of the cover [9].
The base dimensions for spring boxes B and C will have length, width,
and height dimensions of 0.5m x 1m x 0.4m. The base of spring boxes B and
C will have length and width dimensions of 0.5m x 1m. Rebar will be spaced
in 0.33m across the width of the base and in 0.33m across the length of the
base. The side walls of spring boxes B and C will have dimensions of 0.5m x
0.4m with rebar spaced in 0.15m intervals across the length and width. The
front walls of both spring boxes will have dimensions of 1m x 0.4m with rebar
spaced in 0.15m across the width and height of the box. Calculations for
spring box dimensions, concrete mix ratios, and rebar can be found in
Appendix 2.
The spring boxes will be designed with reinforced concrete with 3/8”
rebar. The eye(s) of the spring will flow directly into the spring box. The
spring box will be enclosed on five sides with reinforced concrete walls and
the back of the box open to collect water from the spring inlets. The top of the
spring box will be covered to prevent contamination from runoff, mosquitos,

Mesele Final Report 8 December 9, 2016
and other debris. An access lid/cap will be designed in the cover to allow for
cleanout of the spring box (Figure 2). Lastly overflow and cleanout pipes will
be screened with mesh to prevent contamination from entering the pipes.
Figure 2 Spring Box A Schematic Highlighting Major Components
Holding Tank
The holding tank will be built to hold 22m3 (5810 gallons) of water.
This was determined to be a satisfactory volume of water by Mesele for
multiple reasons. The first reason was this amount of water would meet the
current demand of the community for 4 days based on the water census. This
seems to be plenty of backup and will be helpful in the dry season when water
use will have to be reduced. The second reason was this would provide the
villagers with 109 L of water per person when the tank is full. The United
Nations (UN) says every person has the right to access 50 – 100 L of water a
day [6]. The UN number includes; cooking, dishes, laundry and bathing. The
system being designed is for drinking, cooking and dishes alone, so 109 L far
exceeds UN recommendations. The third reason was physical size of the tank.
The group did not want the tank to be too tall for structural reasons. Also the
group did not want the tank to be too large to make the building of the tank
Overflow Pipe
Access Lid
Perm
eabl
e La
yers
Impermeable Layers
Cleanout Pipe
Outflow Pipe
D = 5.08cm
D = 2.54cm
D = 2.54cm

Mesele Final Report 9 December 9, 2016
difficult or too expensive. After the volume was chosen, a reasonable height
was selected. Mesele determined the inside height of the tank should be 2m so
the community member cleaning the tank will be able to stand. This height
will also make building the tank easier because tall ladders will not be
necessary to reach the top. Also, it will make accessing the manhole easier
when cleaning is necessary.
Next, the thickness for different parts of the tank had to be determined.
These values were chosen using information from the Handbook of Gravity-
Flow Water Systems by Thomas Jordan [10]. The thickness of the floor was
determined to be 0.10m for reinforced concrete. For the walls of the tank, the
thickness was determined to be 0.30m. There will also be concrete footings
for the walls which will be 0.20m thick. The roof will be 0.10m thick [10].
Using the water volume, maximum height and thickness of different aspects
of the tank, the rest of the measurements were determined. All measurements
can be found in Appendix 3, along with the Engineering Drawing in Appendix
4 and the model in Figure 3.
Figure 3 Model of Water Holding Tank
There are three inlets to the tank from the three natural springs. Each
of the inlets will have a valve on them so inflow can be stopped when the tank
Inflow from Springs
Outflow
Overflow
Clean Out
3.92 m 3.92 m
3.92 m
0.8
Mesele Final Report 10 December 9, 2016
needs to be cleaned. There will be one outlet to the community from the tank.
This outlet will also have a valve on it in case any piping needs to be repaired.
There will also be a fifth opening that will act both as a pressure release and
an overflow pipe. As water flows into the tank this overflow will allow air to
escape and water to escape when the tank is full. A sixth opening will be
located near the outlet and will be used as a cleanout valve to flush sediment
as needed.
Also on the tank will be a manhole access to allow the tank to be
cleaned regularly. The manhole will be 0.6m by 0.6m, as suggested in
the Handbook of Gravity-Flow Water Systems by Thomas Jordan [10]. The
cover for the hole will be 0.8 m by 0.8 m by 0.08 m, which will allow the
cover to overlap the edges of the hole. The cover will have two handles, made
of rebar, for easily moving the cover. The cover will need to be reinforced
with wire mesh, and the handles will be able to attach to this.
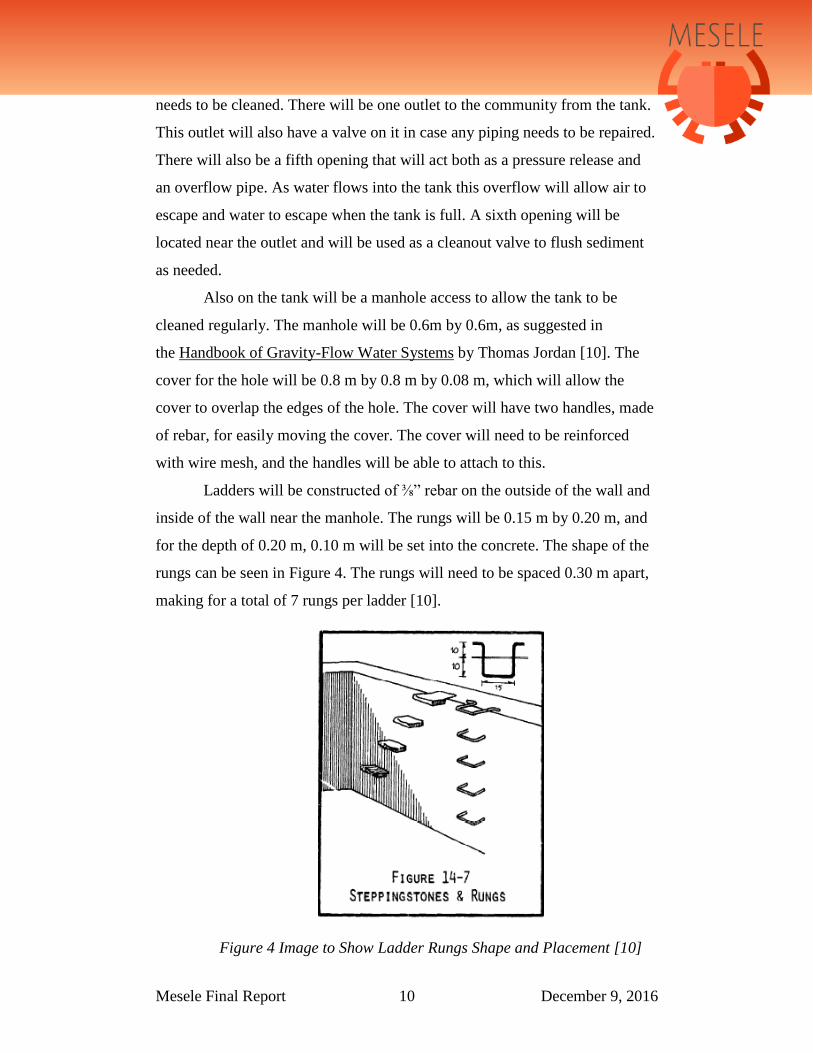
Ladders will be constructed of ⅜” rebar on the outside of the wall and
inside of the wall near the manhole. The rungs will be 0.15 m by 0.20 m, and
for the depth of 0.20 m, 0.10 m will be set into the concrete. The shape of the
rungs can be seen in Figure 4. The rungs will need to be spaced 0.30 m apart,
making for a total of 7 rungs per ladder [10].
Figure 4 Image to Show Ladder Rungs Shape and Placement [10]

Mesele Final Report 11 December 9, 2016
Rebar (⅜”) will be used in the floor, walls and roof to support the
concrete. Rebar of 3.32 m lengths will be placed every 0.40 m, for the floor
[10]. A total of 17 rebar lengths will be required for the floor. Rebar in the
walls will be spaced every 0.40 m. In total, there will be 34 lengths of rebar
2.08 m long and 20 lengths of rebar 3.32 m long needed for the walls. The
roof will use lengths of rebar of 4.22 m, which will run through the roof slab
and extend into the walls on either side 0.30 m (Figure 5). The roof rebar will
be spaced 0.33 m apart [10], requiring 24 lengths for the roof. The total length
of rebar required will be 333 m.
Figure 5 Image of Roof Slab Reinforced with Rebar [10]
Piping Network
The piping within the network will consist of SDR 26 PVC pipe with
2-inch and 1.5-inch diameters. There is a total of 1600 m of 2-inch pipe, and
approximately 800 m of 1.5-inch pipe. Pipe will be in 6 m sections plus
coupling for the pipe joints that will join both plain ends of the pipe by solvent
welding the ends using PVC cement. Pressure standards for the pipe within
the network were taken into consideration. SDR 26 has a pressure rating of
160 psi, which is a much higher pressure value than what is expected from the
entire network; the highest pressure is expected to reach a maximum value of

Mesele Final Report 12 December 9, 2016
9 psi. There will also be a number of fittings, including three cleanout valves
that occur at local low points in the network, two air valves at local high
points, 135 elbows, 400 unions, and 35 Y/T fittings. The total number of
fittings includes a 10% overestimate for error and breakage. Although there
will be some locations along the pipeline where a slight bend will be
necessary, the PVC pipe and couplings are expected to allow a 10% bend.
These locations occur at points V43 and V55 at distances of 850m and 974m
along the network.
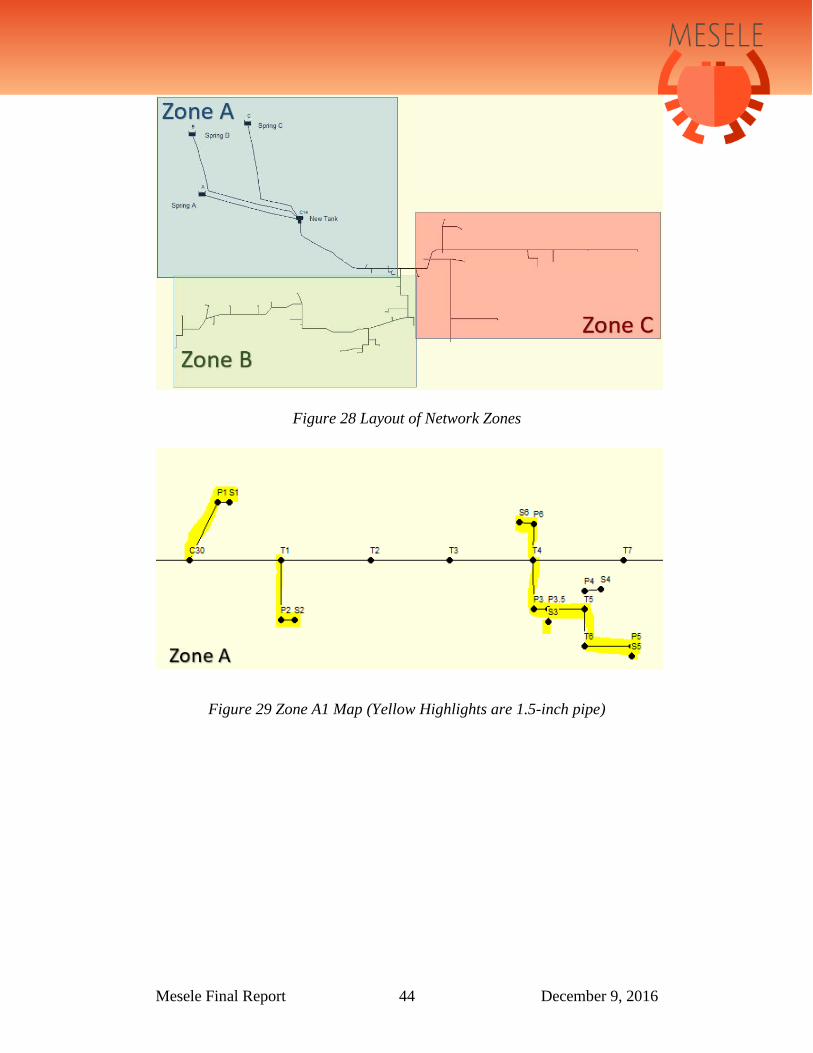
Counting the number of pipes and fittings, the entire network was
broken into zones, as seen in Figure 6 below. This data division was done to
create organization and reference when installing the network, allowing for
easier tracking of inventory and a better estimation for manpower required to
install certain parts of the network. Located in the appendices is a breakdown
of the zones, highlighting the 1.5in pipe that should be installed at each
location.
Figure 6 Layout of Network Zones
Protection and maintenance within the pipe network will include UV
spray paint coating for the pipes that are exposed to sunlight. Maintenance
along the network will include scheduled upkeep at the cleanout valves,
starting every four weeks and adjusting in frequency if needed based on the

Mesele Final Report 13 December 9, 2016
amount of sediment buildup. The cleanout valves will be located at 247m,
394m and 680m along the network and will consist of a Y-fitting placed for
easy access (Figure 7). These distances along the network are based on the
HGL plot in Figure 8. The length of the stem on the Y-fitting will be
dependent on the accessibility and location of each valve. The air valves will
be located at two local high points to release air blocks. These points are
located at 196m and 550m along the network. The community’s goal is to
bury as much of the piping as possible due to the harsh weather conditions, so
a network test for water flow will need to be conducted before burying the
pipe.
Figure 7 Cleanout Valve Fitting
Figure 8 HGL and Elevation of Pipeline
170
175
180
185
190
195
200
0 34 83 144
207
248
308
336
358
424
485
509
524
549
600
620
668
Elev
atio
n (m
)
Cumulative Distance (m)
Elevation (m)HGL (m)

Mesele Final Report 14 December 9, 2016
River Crossing
There will be a pipeline crossing over the 40-meter-wide river in the
community (Figure 9). The suspension over the river will consist of
galvanized wire rope with stringers to hold the pipe. The 2” PVC pipe will be
covered with a 4” PVC pipe to protect it from the natural elements.
Additionally, the 4” PVC pipe will be sprayed with a UV protection spray.
The pipe is run through the ground to a knot in the tree on the other side of the
river. A cable will support the pipe with multiple stringers. The cable will be
held on one side by a concrete anchor buried in the ground. The cable will be
wrapped around the tree with cable clamps on the other side of the river.
There is an existing pipe through one of the knots on the tree therefore,
Mesele believes the tree will be sturdy enough to support the pipe. Starting
from the knot in the tree, the pipe will have a 90-degree elbow to run it
parallel to the tree with extra cable and cable clamps for support. Once the
pipe reaches the ground, there will be another 90-degree elbow to run the
piping to the last houses in the system.
Figure 9 Conceptual Sketch of River Crossing
Cable Calculations
The diameter of cable supporting the pipe was determined by the total
weight it must support. The total weight was calculated by adding the weight
of the 2” PVC pipe, the 4” PVC pipe, and the weight of water in the 2” pipe.
Anchor Block
Tree
Mesele Final Report 15 December 9, 2016
The weight of 2” PVC pipe and weight of 4” PVC pipe is 2.23 lb/m and 6.59
lb/m respectively; this was then multiplied by the pipe length to get the total
weight of piping [14]. The density was multiplied by the volume of the pipe to
calculate the weight of water in the pipe.
The allowable sag of the cable was chosen to be 2 m. The horizontal
tension was calculated using Eq. 5 (Appendix 7). The total tension was then
calculated using the angle of tension and horizontal tension. The total tension
on the cable is 1,317 lb.; therefore, the cable diameter needed is ¼” of
galvanized wire rope. The minimum breaking strength of ¼” wire rope is
5,480lb of force, and dividing the minimum breaking strength by the safety of
factor of 3 gives a force of 1,827 lb. Since breaking strength with a safety
factor of 3 is greater than the total tension in the cable, the ¼” diameter is
sufficient for this design.
Anchor Calculations
The anchor design Mesele chose was a tower and slab anchor mass
constructed out of concrete (Figure 10). The size of the anchor was based on
the volume of concrete needed to withstand the total horizontal force,
including the safety factor. Once the dimensions were chosen and volume was
calculated, the anchor was checked for sliding. The friction angle from Table
2 is 33° based on the soil type of well-graded sand [18]. To check for sliding,
the safety factor was calculated by balancing forces. The safety factor was
calculated to be 3.0, which is a sufficient safety factor for the anchor to not
slide.

Mesele Final Report 16 December 9, 2016
Figure 10 Model of Concrete Anchor
Table 1 Anchor Slab Dimensions
Length1 0.25 m Length 2 1 m Width 1 1 m Width 2 1 m Height 1 1.25 m Height 2 0.75 m
Volume Tower 0.313 m3 Volume Slab 0.750 m3 Total Volume 1.06 m3
The anchor will be supported with a rebar cage (Figure 11). There will
be a jaw and eye turnbuckle to connect the cable to the rebar hook within the
anchor.
The anchor for the river crossing was checked for turnover by
calculating the moment about the point (Appendix 7). The safety factor for the
river crossing was calculated to be 3.2 which is a sufficient safety to ensure
the anchor will not turn over.

Mesele Final Report 17 December 9, 2016
Figure 11 Rebar Cage and Stirrups for Concrete Support
Stringer Lengths
The stringer lengths (Table 2) were calculated by using the equations
below. The cable used will have a diameter of ¼-inch. The C value is the
value that represents the curve of the cable and can be determined from a table
with the corresponding sag ratio. The C value was determined to be 2.51 using
a sag ratio of 0.05 and an elevation difference of 0 [18]. The stringers will be
placed every 5 meters along the main cable. There will also be a turn back
length needed to wrap around the cable eyelet and the pipe itself (Figure 12).
To estimate how much cable would be needed for the turn back length, 2/3 of
the sag allowance was calculated. The calculated turn back length was then
added to the sag allowance to calculate the total amount of cable needed for
each stringer.

Mesele Final Report 18 December 9, 2016
Table 2 Stringer Lengths and Location
Distance from Apex (m)
Sag Allowance
(m)
Turn Back Length (m)
Total (m)
20 2.025 1.35 3.38 15 1.138 0.76 1.90 10 0.505 0.34 0.84 5 0.126 0.08 0.21
Apex (0) 0.000 0.00 0.00 5 0.126 0.08 0.21 10 0.505 0.34 0.84 15 1.138 0.76 1.90 20 2.025 1.35 3.38
Grand Total 12.65
Figure 12 Stringer Connections

Mesele Final Report 19 December 9, 2016
The final length of the cable can be calculated by using a designated C
value representing the curve of the cable. How much the cable stretches is
calculated in Eq.11 (Appendix 7). Because the stretch of the cable is less than
1 cm, it can be ignored. The final length of the cable is based on the curve of
the cable, and is expected to be 39.76 m.
Stream Crossings
Mesele came up with three different designs for river, stream, and
valley crossings. Mesele did not analyze the wash-out risk; therefore, the
design decisions for each stream will be based on the Peace Corps Volunteer’s
judgement. Design 1 (Figure 13) is for streams that are narrow enough not to
need additional support, and have no risk of being. The piping will run
through the streambed with no extra support. Design 2 should be implemented
if the Peace Corps Volunteer or community feels there is a risk of the pipe
washing out.
Figure 13 Design 1: Narrow Stream with No Wash-Out Risk
Design 2 (Figure 14) is for streams that have a wash-our risk or are
wide. Mesele discovered one stream before the holding tank that is very
shallow and had a high-water table; therefore, each of the three pipes from the
spring boxes to the holding tank must cross a one-meter stream. The pipe will
be elbowed vertically from 0.5 m from the ground and supported with two
steel columns. The steel columns will be supported by a concrete platform
beneath the ground.

Mesele Final Report 20 December 9, 2016
Figure 14 Design 2: Stream Crossings with a Wash Out Risk
Design 3 (Figure 15) is for a valley crossing. Rather than go down and
back up the hills, the pipe will have the same type of suspension system as the
river crossing (¼” galvanized wire rope and concrete anchors). The concrete
anchor dimensions are given in Table 3.
Figure 15 Design 3: Wide Valley Crossing
Table 3 Concrete Anchor Dimensions for Valley Anchor
Length1 0.25 m
Length 2 0.5 m
Width 1 0.5 m
Width 2 0.5 m
Height 1 0.5 m
Height 2 0.5 m
0.5m

Mesele Final Report 21 December 9, 2016
Figure 16 Valley Concrete Anchor
The valley crossing was checked for turnover by calculating the
moment about the point (Appendices 5). The safety factor for the river
crossing was calculated to be 2.6 which is a sufficient safety factor to ensure
the anchor will not turn over.
Water Treatment
Mesele looked at two different options for water treatment either
household chlorination or community chlorination within the holding tank.
The amount of chlorine needed for proper disinfection would be based on the
spring flow rates and water usage. This can be calculated by performing field
tests.
During the community visit, Mesele learned that there are only four
members on the water committee when the country regulations require seven,
showing a lack of commitment to bettering the community water quality.
There was also a lack of enthusiasm and commitment in regard to the water
distribution project from the community as a whole. However, the PCV is
working on educating and gathering support from community. In addition to
the lack of commitment, the holding tank and springs are not easily accessible.
The whole community would suffer if the person responsible failed to treat the

Mesele Final Report 22 December 9, 2016
holding tank water. Because of these factors, Mesele concluded the best
option for water treatment would be personal, in-home treatment. The
recommended chlorine for treatment is 1 mL/L [2]. The ideal water usage per
day per person is 50 L which would need 50 mL to be properly treated. For a
family of 5 this will require 250 mL of chlorine a day. In home chlorination
will require training from the PCV so families will know how to properly treat
their water.
Construction Schedule
A schedule was developed for completion of a water distribution
network in Bucori, Panama. The major components of the network are the
spring captures, holding tank, and piping. This schedule details the
construction phase for each component. Tasks and descriptions for work are
included in addition to duration, manpower, and man hours estimated to
complete the project. Tasks can be found in Appendix 8, with descriptions and
a Gantt Chart enclosed.
Total labor estimated to complete the system is 3624 person-hours.
Labor rates for Panama are currently estimated at $5 for 8 hours of hard
labor, which yields a total labor cost of $2,265 for constructing this system.
This number is an estimate, but the community members are expected to help
with the building of the system for free.
Cost Estimate
Mesele created a cost estimate for the materials, tools and
transportation of tools for the construction of the water distribution system.
The total cost estimate was determined to be $15,300 for materials, equipment
and transportation. Information on the cost of materials can be found in
Appendix 9. The quantity of materials was determined from the design of
each component holding tank, spring boxes, piping network, and pipeline
water crossings, with a 10% safety factor added for all materials. The unit cost
was determined from the Do It Center website, Home Depot website and
“Improvements in Sustainability of Gravity-Fed Water Systems in The
Comarca Ngäbe-Buglé, Panama: Spring Captures and Circuit Rider Model”

Mesele Final Report 23 December 9, 2016
by Jones (2014).
Also calculated was the price of equipment needed to build the system.
All information on equipment costs can be found in Appendix 9. Equipment
needs were based on number of people estimated per task, prices for the
equipment was found on the Do It Center website. Transportation of material
will be by boat from Chiriquí Grande to Bucori. The cost of one round trip is
$125. A conservative estimate of the number of trips needed is 25, which
leads to a total transportation cost of $3125. A breakdown of all cost
components can be found in Figure 17.
Water treatment will be done in home with the addition of 1 mL of
chlorine to liter of water. The cost of chlorine will be covered by the families
for their use. The cost of a bottle of 237 mL of chlorine is $0.50. For a family
of 5 people each using 50 L of water a day, 1750 mL of chlorine will be
needed a week. This means a family of 5 will need to spend $3.70 a
week on chlorine.
Figure 17 Breakdown of Project Costs
49%
20%3%
8%
20%
Total Cost = $15, 300
Piping Transportation Equipment Other Concrete

Mesele Final Report 24 December 9, 2016
Conclusion
Mesele will provide water directly to 31 homes and 7 other community
buildings within Bucori. The water will run from three springs to a holding
tank, and from the holding tank it will be distributed throughout the
community. The system will cross seven streams, one valley, and one
river. The water will be treated in-home using chlorine. The total material and
equipment cost is $12,200, with transportation costing an additional
$3,125. The construction of the project will take 40, 6-8 hour work days with
varying man-hours at different points in the project, dependent on zone
requirements. The project schedule does not include rain-out days and
weekends. The Peace Corps Volunteer will be applying for a grant to
implement this system. If the grant does not cover the entire project, the
Peace Corps Volunteer with have to look into further funding or make edits to
the system. Instead of the piping running to individual homes there could be
community faucets. This would cut down on piping cost. The Peace Corps
Volunteer and community should develop a strong water committee upon
finishing the project to maintain the system.

Mesele Final Report 25 December 9, 2016
References 1. 6 strand x 19 wire (6x19) - minimum breaking strength, safe loads and
weight <http://www.engineeringtoolbox.com/wire-rope-strength-d_1518.html>
2. Benjamin A. Yoakum. "Improving Implementation of a Regional In-Line Chlorinator in Rural Panama Through Development of a Regionally Appropriate Field Guide." Scholar Commons, University of South Florida (2013): n. page. Web.
3. Construction Supplies. Home Depot. United States. www.homedepot.com.web. Accessed Oct 30 2016
4. Construction Supplies. Do-it Center. Panama.www.doitcenter.com.pa. web. Accessed Oct 30 2016
5. Domagalla, Taylor. "Evaluación Comunitario Y Plan De Desarrollo De Bucori." N.p., n.d. Accessed19 Aug. 2016.
6. "Global Issues at the United Nations: Water." UN News Center. UN, n.d. Web. 24 Oct. 2016.
7. Google Maps. (2014). Panama. Retrieved from https://www.google.com/maps/@8.4379782,-80.1538796,8z
8. Hawley. R.J. A Technical Brief for Springbox Construction. Michigan Technological University. Houghton MI. April 2003
9. Jones.E.K. Improvements in Sustainability of Gravity-Fed Water Systems in Comarca Ngabe-Bugle Panama. Michigan Technological University. Houghton, MI. 2014
10. Jordan, Thomas D. A Handbook of Gravity-Flow Water Systems for Small Communities. N.p.: Practical Action, 1984. Print.
11. Rossman.L.A. EPANET 2 User’s Manual. Environmental Protection Agency. United States. September 2000
12. Springs Fact Sheet. World Health Organization. www.survivallandusa.com.web. Accessed Oct 30 2016.
13. "Springs - The Water Cycle.”, from USGS Water-Science School. N.p., n.d. Web. 25 Aug. 2016. <http://water.usgs.gov/edu/watercyclesprings.html>
14. Standard dimensions and weight of PVC - Polyvinyl Chloride - and CPVC - Chlorinated Polyvinyl Chloride - pipes according ASTM D1785 <http://www.engineeringtoolbox.com/pvc-cpvc-pipes-dimensions-d_795.html >
15. Struct. Mortar Mix Ratios. www.structx.com. 2016. Accessed Nov 4 2016.
16. Van Dam, Tom. “Civil Engineering Materials for Least Developed Countries.” Michigan Technological University, Department of Civil and Environmental Engineering. Lecture Prepared for: CE5993-Field Engineering in the Developing World. March 27, 2003.
17. Water Level: Inkblotter. "Use a Water Level." WikiHow. N.p., n.d. Web. 19 Aug. 2016. <http://www.wikihow.com/Use-a-Water-Level>.
18. Water Supply and Treatment. Pipeline Crossings. Pages: 241-265.

Mesele Final Report 26 December 9, 2016
19. 3M™ Petrifilm™ E. coli/Coliform Count Plates http://www.3m.com/3M/en_US/company-us/all-3m-products/~/3M-Petrifilm-E-coli-Coliform-Count-Plates?N=5002385+3293785155&rt=rud
20. Arnalich, Santiago. EPANET and Development. N.p.: Santiago Arnalich Castaneda, 2011. Arnalich Water and Habitat. Web. 20 Oct. 2016.

Mesele Final Report 27 December 9, 2016
Appendices 1. EPANet Results
2. Spring Box Dimension Calculations 3. Measurements of the Water Holding Tank
4. Engineering Drawing of the Water Holding Tank 5. Maps of Pipe Network
6. Data for River Crossing Calculations 7. River Crossing Equations
8. Schedule: Table and Descriptions 9. Cost Estimate Tables

Mesele Final Report 28 December 9, 2016
Appendix 1. EPANet Results

Mesele Final Report 29 December 9, 2016
Figure 18. EPANet Model
Springs are treated as nodes. Overflow tank creates pressurized flow. Check valve ensures flow comes from springs and that excess flow is diverted to the
overflow tank.
Spr
ing
A
Spr
ing
B
Spr
ing
C
New
Tan
k
Mesele Final Report 30 December 9, 2016
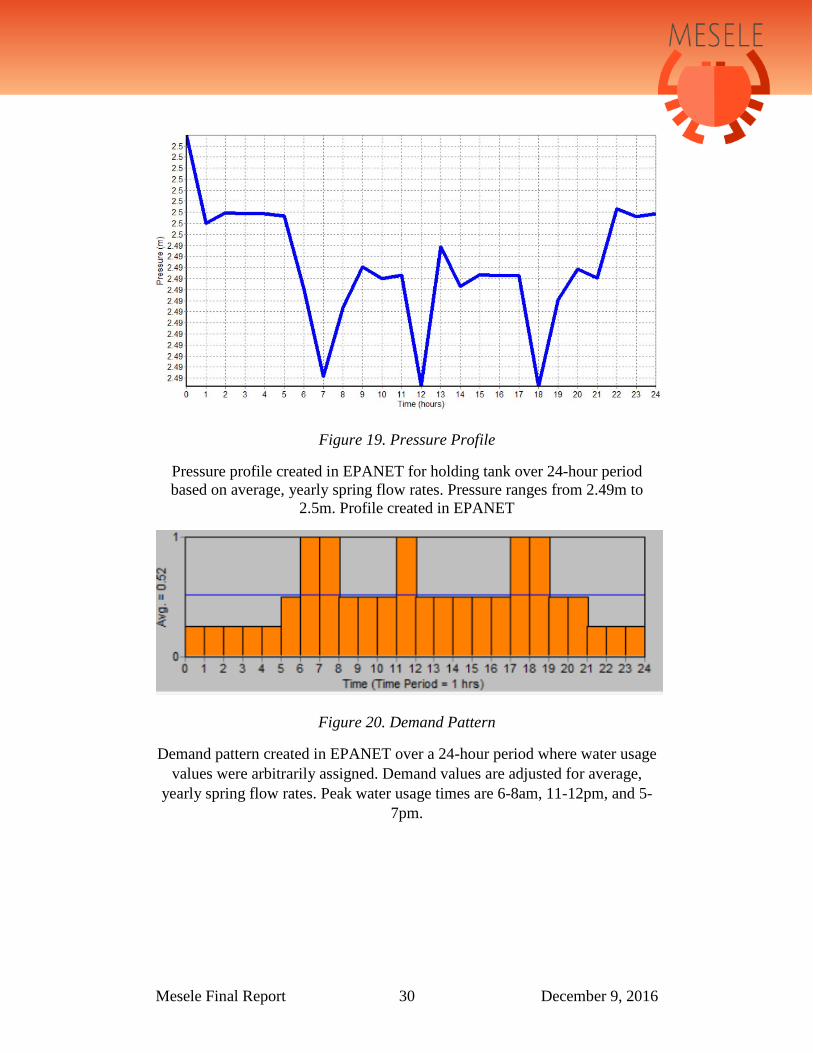
Figure 19. Pressure Profile
Pressure profile created in EPANET for holding tank over 24-hour period based on average, yearly spring flow rates. Pressure ranges from 2.49m to
2.5m. Profile created in EPANET
Figure 20. Demand Pattern
Demand pattern created in EPANET over a 24-hour period where water usage values were arbitrarily assigned. Demand values are adjusted for average,
yearly spring flow rates. Peak water usage times are 6-8am, 11-12pm, and 5-7pm.

Mesele Final Report 31 December 9, 2016
Figure 21. Pressure profile
Pressure profile created in EPANET for holding tank over 24-hour period based on rainiest season spring flow rates. Pressure ranges from 2.47m to
2.5m. Profile created in EPANET
Figure 22. Demand Pattern
Demand pattern created in EPANET over a 24-hour period where water usage values were arbitrarily assigned. Demand values adjusted for rainiest season.
Peak water usage times are 6-8am, 11-12pm, and 5-7pm.

Mesele Final Report 32 December 9, 2016
Figure 23. System Flow Balance
System flow balance for the rainy season show water produced by springs and water consumed by the community. Created in EPANET.
Figure 24. System Flow Balance
System flow balance based average yearly spring flow rates. This figure shows water produced by springs and water consumed by the community.
Created in EPANET.

Mesele Final Report 33 December 9, 2016
Figure 25. Head Throughout Network
Head throughout network over a 24-hour period during the rainy season. Created in EPANET
Head in Tank
Head in Selected Nodes

Mesele Final Report 34 December 9, 2016
Figure 26. Head Throughout Network
Head throughout network over a 24-hour period using average yearly spring flow rates. Created in EPANET
Head in Tank
Head in Selected Nodes

Mesele Final Report 35 December 9, 2016
Appendix 2. Spring Box Dimension Calculations

Mesele Final Report 36 December 9, 2016
Table 4. Spring Box Dimensions
Springs Length (m) Width (m) Height (m) A 1 1 0.6 B 0.5 1 0.4 C 0.5 1 0.4
Spring box dimensions are chosen arbitrarily. After excavation has occurred, dimensions for box should be adequately chosen.
Table 5. Spring Volumes (m3)
Springs Base (m)
Side Walls (m)
Front Wall (m)
Cover (m)
L*W*tb 2(L*H*tw) W*H*tw L*W*tc A 0.1 0.12 0.06 0.05 B 0.05 0.04 0.04 0.025 C 0.05 0.04 0.04 0.025
Where tb=100mm, tw=100mm, tc=50mm
Table 6. Spring Volumes (ft3)
Springs Base (ft)
Side Walls (ft)
Front Wall (ft)
Cover (ft)
L*W*tb 2(L*H*tw) W*H*tw L*W*tc A 3.53 4.23 2.12 1.77 B 1.77 1.41 1.41 0.88 C 1.77 1.41 1.41 0.88
Where tb=100mm, tw=100mm, tc=50mm
Table 7. Concrete Mix Ratios for Spring Boxes
Base (1:4:8)
Walls (1:2:4)
Cover (1:2:4)
Cement Cement Cement Sand Sand Sand
Gravel Gravel Gravel

Mesele Final Report 37 December 9, 2016
Table 8. Spring A Concrete Volumes (ft3)
Base Walls Cover Totals ft3 Cement Cement Cement Cement
0.27 0.91 0.35 1.53 Sand Sand Sand Sand 1.09 1.81 0.51 3.41
Gravel Gravel Gravel Gravel 2.17 3.63 1.01 6.81
𝐵𝐵𝐻𝐻𝐿𝐿𝐻𝐻𝑆𝑆𝑆𝑆𝑆𝑆𝑆𝑆 =4
13∗ 𝐵𝐵𝐻𝐻𝐿𝐿𝐻𝐻𝑉𝑉𝑉𝑉𝑉𝑉𝑉𝑉𝑉𝑉𝑉𝑉
Table 9. Springs B & C Concrete Volumes (ft3)
Base Walls Cover Totals ft3 B & C Totals ft3 Cement Cement Cement Cement Cement
0.14 0.81 0.13 1.07 2.14 Sand Sand Sand Sand Sand 0.54 0.81 0.25 1.60 3.20
Gravel Gravel Gravel Gravel Gravel 1.09 0.81 0.50 2.40 4.80
Volume of concrete materials are combined for Springs B and C since they have the same dimension.
Table 10. Concrete for Spring A, B, & C
Cement (lbs.) Sand (ft3) Gravel (ft3) 3.67 6.61 11.61

Mesele Final Report 38 December 9, 2016
Table 11. Rebar for Springs A, B & C
A B C Cover Length (m) 2.5 0.63 0.63 Cover Width (m) 2.5 2.5 2.5 Base Length (m) 3.03 1.67 1.67 Base Width (m) 3.03 6.67 6.67
Wall Lengths (m) 6.67 1.67 1.67 Wall Heights (m) 2.4 1.07 1.07 Wall Width (m) 6.67 6.67 6.67 Wall Height (m) 2.4 1.07 1.07
Sum (m) 29.2 21.95 21.95 Sum (ft) 95.8 72.0 72.0
Total Rebar 239.8 ft
𝐿𝐿𝐻𝐻𝐻𝐻𝑅𝑅𝐶𝐶ℎ𝑆𝑆𝑃𝑃𝐻𝐻𝐶𝐶𝑊𝑊𝐻𝐻𝑅𝑅
∗ 𝐿𝐿𝐻𝐻𝐻𝐻𝑅𝑅𝐶𝐶ℎ
Where recommended spacing’s for cover, base, and walls are 0.4m, 0.33 m and 0.15m respectively.

Mesele Final Report 39 December 9, 2016
Appendix 3. Measurements of the Water Holding Tank

Mesele Final Report 40 December 9, 2016
Table 12 Measurements of the Water Holding Tank
Description Value Units Walls 2,4 Volume of Water 22 m3 Description Value Units Volume of Water 22,000 L Height 2.08 m
Volume of Concrete 12.73 m3 Width 3.92 m Volume of Concrete 66,978 lb. Thickness 0.3 m
Number of Pipe Openings 6 # Wall Footings 2,4 Diameter of Pipe Openings 0.0508 m Description Value Units
Floor Length 4.12 m Description Value Units Width 0.5 m
Length 3.32 m Thickness 0.2 m Width 3.32 m Roof
Thickness 0.1 m Description Value Units Walls 1,3 Length 3.92 m
Description Value Units Width 3.92 m Height 2.08 m Thickness 0.1 m Width 3.32 m Manhole
Thickness 0.3 m Description Value Units Wall Footings 1,3 Length 0.6 m
Description Value Units Width 0.6 m Length 3.52 m Manhole Cover Width 0.5 m Description Value Units
Thickness 0.2 m Length 0.8 m Width 0.8 m Thickness 0.08 m

Mesele Final Report 41 December 9, 2016
Appendix 4. Engineering Drawing of the Water Holding Tank

Mesele Final Report 42 December 9, 2016
Figure 27 Engineering Drawing of the Water Holding Tank

Mesele Final Report 43 December 9, 2016
Appendix 5. Maps of Pipe Network
Mesele Final Report 44 December 9, 2016
Figure 28 Layout of Network Zones
Figure 29 Zone A1 Map (Yellow Highlights are 1.5-inch pipe)

Mesele Final Report 45 December 9, 2016
Figure 30 Zone B1 Map (Yellow Highlights are 1.5-inch pipe)
Mesele Final Report 46 December 9, 2016
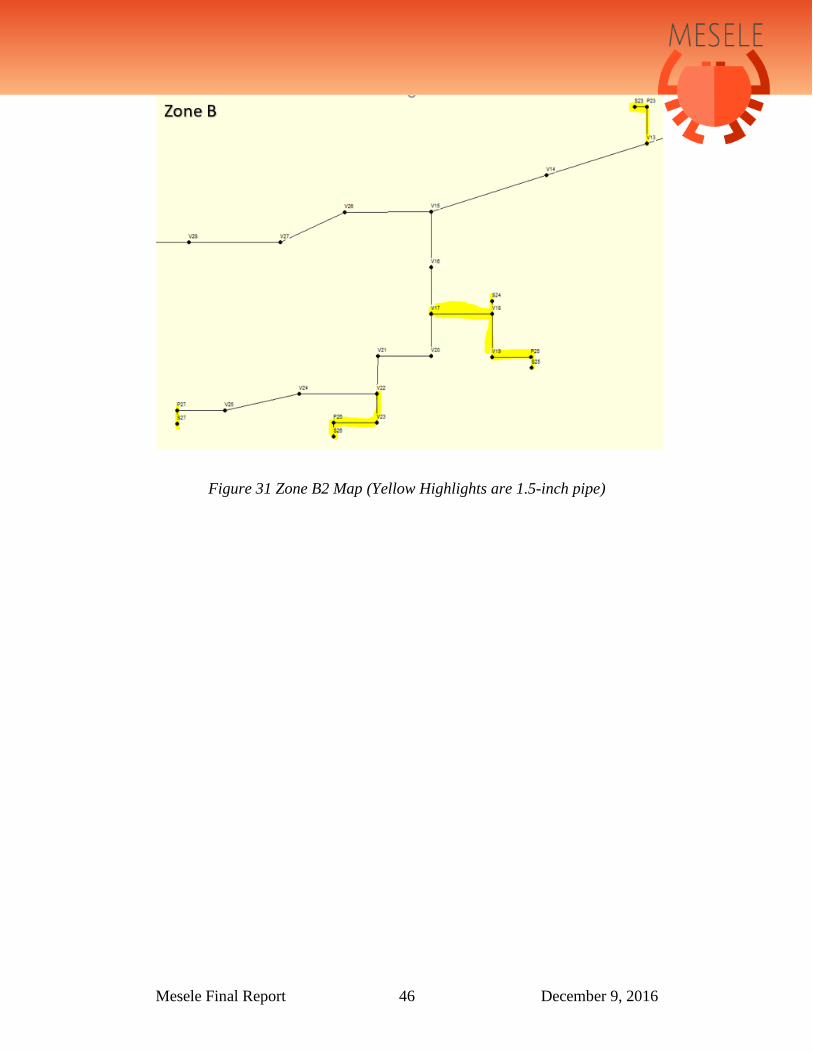
Figure 31 Zone B2 Map (Yellow Highlights are 1.5-inch pipe)

Mesele Final Report 47 December 9, 2016
Figure 32 Zone B3 Map (Yellow Highlights are 1.5-inch pipe)

Mesele Final Report 48 December 9, 2016
Figure 33 Zone B4 Map (Yellow Highlights are 1.5-inch pipe)
Mesele Final Report 49 December 9, 2016
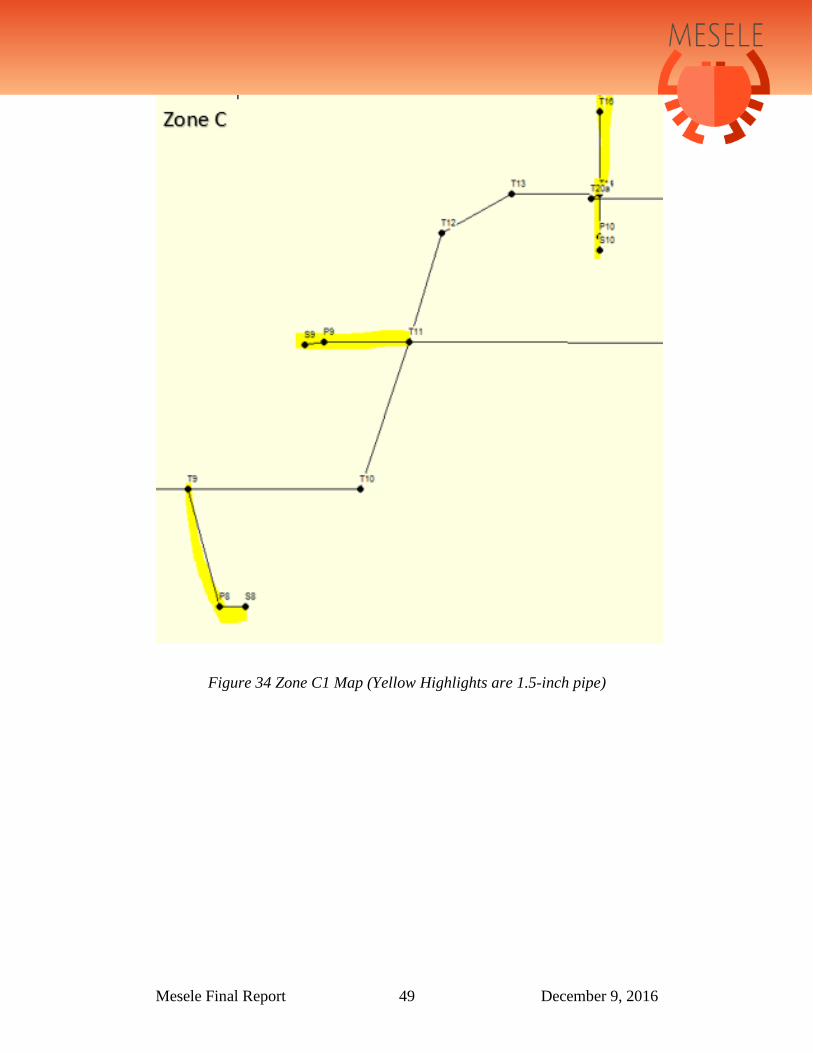
Figure 34 Zone C1 Map (Yellow Highlights are 1.5-inch pipe)

Mesele Final Report 50 December 9, 2016
Figure 35 Zone C2 Map (Yellow Highlights are 1.5-inch pipe)

Mesele Final Report 51 December 9, 2016
Figure 36 Zone C3 Map (Yellow Highlights are 1.5-inch pipe)
Figure 37 Zone C6 Map (Yellow Highlights are 1.5-inch pipe)

Mesele Final Report 52 December 9, 2016
Appendix 6. Data for River Crossing

Mesele Final Report 53 December 9, 2016
Table 13 Data for the Cable Calculations for the River Crossing
Pipe Weight / ft. 0.68 lb./ft. Pipe Weight / m 2.23 lb./m
Pipe weight 88.12 lb. Weight of Water in Pipe 4.41 lb./m Weight of Water in Pipe 176 lb.
Outer Pipe weight/ft. 2.01 lb./ft. Outer Pipe weight/m 6.59 lb./m Outer Pipe Weight lb. 260.5 lb.
Total Weight 525.0 lb. Sag allowed 2 m
Horizontal Tension 1291 lb. Angle of Tension 0.20 radians
Total Tension 1317 lb. SF 3
Total Tension w/SF 3951 lb. Min Breaking Strength (1/4) 1827
Rope Diameter 1/4 in Sag Calc. 2
Table 14 Concrete Anchor Data for River Crossing
Length1 0.25 m Length 2 1 m Width 1 1 m Width 2 1 m Height 1 1.25 m Height 2 0.75 m
Volume Tower 0.313 m3 Volume Slab 0.750 m3 Total Volume 1.06 m3
Check for Sliding 3783 Solved SF 3.0

Mesele Final Report 54 December 9, 2016
Table 15 Stringer Data for River Crossing
Length 39.5 X1 20
Sag Ratio 0.05 C 2.51
Determining Sag 1.97 C Value 99.08
Table 16 Stringer Calculations and Total Cable Required
Distance from Apex
(m)
Sag Allowance
(m)
Connections (m)
Total (m)
20 2.025 1.35 3.38 15 1.138 0.76 1.90 10 0.505 0.34 0.84 5 0.126 0.08 0.21
Apex (0) 0.000 0.00 0.00 5 0.126 0.08 0.21 10 0.505 0.34 0.84 15 1.138 0.76 1.90 20 2.025 1.35 3.38
Grand Total 12.65
Table 17 Final Cable Length for River Crossing
Final Cable y 20 m
ΔL 1.4E-03 m Total Length 39.76 m

Mesele Final Report 55 December 9, 2016
Table 18 Data for the Cable Calculations for the Stream Crossing
Pipe Weight / ft. 0.68 lb./ft. Pipe Weight / m 2.23 lb./m
Pipe weight 30.11 lb. Weight of Water in Pipe 1.50 lb./m Weight of Water in Pipe 60.30 lb.
Outer Pipe weight/ft. 2.01 lb./ft. Outer Pipe weight/m 6.59 lb./m Outer Pipe Weight lb. 89.02 lb.
Total Weight 179.44 lb. Sag allowed 1 m
Horizontal Tension 235.39 lb. Angle of Tension 0.28 radians
Total Tension 245.51 lb. SF 3
Total Tension w/SF 736.54 lb. Min Breaking Strength (1/4) 1826.66
Rope Diameter ¼ in Sag Calc. 1
Table 19 Concrete Anchor data for Stream Crossing
Length1 0.25 m Length 2 0.5 m Width 1 0.5 m Width 2 0.5 m Height 1 0.5 m Height 2 0.5 m
Volume Tower 0.0625 m3 Volume Slab 0.125 m3 Total Volume 0.1875 m3
Check for Sliding 714.01 Solved SF 3.03
Mesele Final Report 56 December 9, 2016
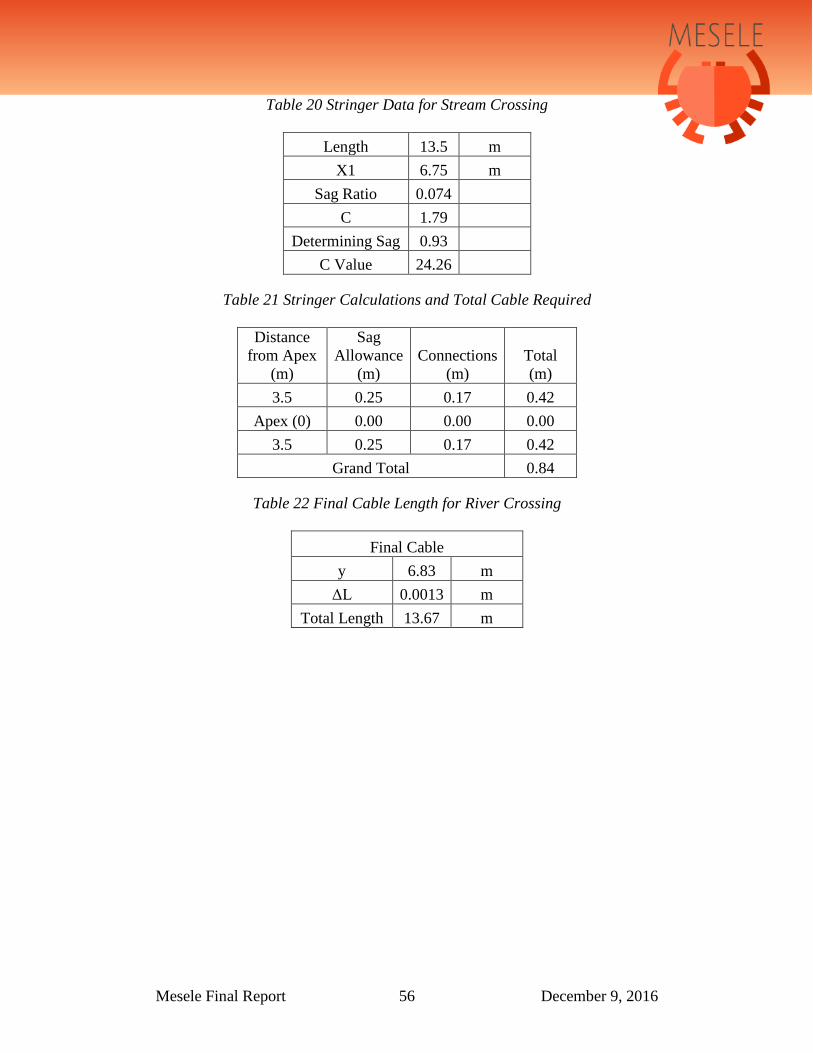
Table 20 Stringer Data for Stream Crossing
Length 13.5 m X1 6.75 m
Sag Ratio 0.074 C 1.79
Determining Sag 0.93 C Value 24.26
Table 21 Stringer Calculations and Total Cable Required
Distance from Apex
(m)
Sag Allowance
(m) Connections
(m) Total (m)
3.5 0.25 0.17 0.42 Apex (0) 0.00 0.00 0.00
3.5 0.25 0.17 0.42 Grand Total 0.84
Table 22 Final Cable Length for River Crossing
Final Cable y 6.83 m
ΔL 0.0013 m Total Length 13.67 m
Mesele Final Report 57 December 9, 2016
Appendix 7. River Crossing Equations

Mesele Final Report 58 December 9, 2016
𝑤𝑤𝐻𝐻𝑊𝑊𝑅𝑅ℎ𝐶𝐶 =𝑤𝑤𝐻𝐻𝑊𝑊𝑅𝑅ℎ𝐶𝐶𝑊𝑊𝐻𝐻𝐻𝐻𝑅𝑅𝐶𝐶ℎ
∗ 𝐶𝐶𝐿𝐿𝐶𝐶𝐻𝐻𝑊𝑊 𝑊𝑊𝐻𝐻𝐻𝐻𝑅𝑅𝐶𝐶ℎ
2.23𝑊𝑊𝑙𝑙𝑚𝑚∗ 40.𝑚𝑚 = 88.1 𝑊𝑊𝑙𝑙
Eq. 2 Calculating Weight of 2” PVC Pipe
𝑤𝑤𝐻𝐻𝑊𝑊𝑅𝑅ℎ𝐶𝐶 =𝑤𝑤𝐻𝐻𝑊𝑊𝑅𝑅ℎ𝐶𝐶𝑊𝑊𝐻𝐻𝐻𝐻𝑅𝑅𝐶𝐶ℎ
∗ 𝐶𝐶𝐿𝐿𝐶𝐶𝐻𝐻𝑊𝑊 𝑊𝑊𝐻𝐻𝐻𝐻𝑅𝑅𝐶𝐶ℎ
6.59 𝑊𝑊𝑙𝑙𝑚𝑚∗ 40.𝑚𝑚 = 250.5 𝑊𝑊𝑙𝑙
Eq. 3 Calculating Weight of 4” PVC Pipe
𝑤𝑤𝐻𝐻𝑊𝑊𝑅𝑅ℎ𝐶𝐶 = 𝜌𝜌 ∗ 𝑉𝑉
1000𝑘𝑘𝑅𝑅𝑚𝑚3 ∗ 40𝑚𝑚 ∗ 𝜋𝜋 ∗ (0.0254 𝑚𝑚)2 ∗
2.205 𝑊𝑊𝑙𝑙1 𝑘𝑘𝑅𝑅
176 𝑊𝑊𝑙𝑙
Eq. 4 Calculating Weight of Water
𝑇𝑇ℎ𝑉𝑉𝑜𝑜𝑜𝑜𝑜𝑜𝑉𝑉𝑆𝑆𝑜𝑜𝑆𝑆𝑉𝑉 =
𝐶𝐶𝐿𝐿𝐶𝐶𝐻𝐻𝑊𝑊 𝑤𝑤𝐻𝐻𝑊𝑊𝑅𝑅ℎ𝐶𝐶𝑊𝑊𝐻𝐻𝐻𝐻𝑅𝑅𝐶𝐶ℎ ∗ 𝑊𝑊𝐻𝐻𝐻𝐻𝑅𝑅𝐶𝐶ℎ2
8 ∗ 𝐿𝐿𝐻𝐻𝑅𝑅
𝑇𝑇ℎ𝑉𝑉𝑜𝑜𝑜𝑜𝑜𝑜𝑉𝑉𝑆𝑆𝑜𝑜𝑆𝑆𝑉𝑉 =(2.23 + 260.5 + 176) 𝑊𝑊𝑙𝑙
𝑚𝑚 ∗ 40𝑚𝑚2
8 ∗ 2= 1,291 𝑊𝑊𝑙𝑙
Eq. 5 Calculating the Horizontal Tensions
𝐴𝐴𝐻𝐻𝑅𝑅𝑊𝑊𝐻𝐻 𝐿𝐿𝐶𝐶 𝐶𝐶𝐻𝐻𝐻𝐻𝐿𝐿𝑊𝑊𝐿𝐿𝐻𝐻 =arctan(4 ∗ 𝐿𝐿𝐻𝐻𝑅𝑅)𝑊𝑊𝐻𝐻𝐻𝐻𝑅𝑅𝐶𝐶ℎ 𝐿𝐿𝐶𝐶 𝐿𝐿𝑃𝑃𝐻𝐻𝐻𝐻
𝐴𝐴𝐻𝐻𝑅𝑅𝑊𝑊𝐻𝐻 𝐿𝐿𝐶𝐶 𝐶𝐶𝐻𝐻𝐻𝐻𝐿𝐿𝑊𝑊𝐿𝐿𝐻𝐻 =arctan(4 ∗ 2𝑚𝑚)
40𝑚𝑚= 0.20 𝐷𝐷𝐻𝐻𝑑𝑑𝑊𝑊𝐻𝐻𝐻𝐻𝐿𝐿
Eq. 6 Calculating Angle of Tension
𝑇𝑇𝑇𝑇 =𝑇𝑇𝐻𝐻
𝐶𝐶𝐿𝐿𝐿𝐿(𝜙𝜙)

Mesele Final Report 59 December 9, 2016
𝑇𝑇𝑇𝑇 =1,291 𝑊𝑊𝑙𝑙𝐶𝐶𝐿𝐿𝐿𝐿(0.20)
= 1,317
Eq. 7 Calculating the Total Tension
𝑣𝑣𝐻𝐻𝐷𝐷𝐶𝐶𝑊𝑊𝐶𝐶𝐻𝐻𝑊𝑊 𝐶𝐶𝐿𝐿𝐷𝐷𝐶𝐶𝐻𝐻 = ℎ𝐿𝐿𝐷𝐷𝑊𝑊𝐻𝐻𝐿𝐿𝐻𝐻𝐶𝐶𝐻𝐻𝑊𝑊 𝐶𝐶𝐿𝐿𝐷𝐷𝐶𝐶𝐻𝐻 ∗ tan (𝐻𝐻𝐻𝐻𝑅𝑅𝑊𝑊𝐻𝐻 𝐿𝐿𝐶𝐶 𝐶𝐶𝐻𝐻𝐻𝐻𝐿𝐿𝑊𝑊𝐿𝐿𝐻𝐻)
𝑣𝑣𝐻𝐻𝐷𝐷𝐶𝐶𝑊𝑊𝐶𝐶𝐻𝐻𝑊𝑊 𝐶𝐶𝐿𝐿𝐷𝐷𝐶𝐶𝐻𝐻 = 1,291 𝑊𝑊𝑙𝑙 ∗ tan(0.20) = 261 𝑊𝑊𝑙𝑙
Eq. 8 Calculating the Vertical Force
0 = (𝑆𝑆𝑆𝑆 ∗ 𝑇𝑇𝐻𝐻𝑉𝑉𝑜𝑜𝑜𝑜𝑜𝑜𝑉𝑉𝑆𝑆𝑜𝑜𝑆𝑆𝑉𝑉) − [(𝑉𝑉𝑇𝑇𝑉𝑉𝑇𝑇𝑉𝑉𝑜𝑜 ∗ 𝑉𝑉𝑠𝑠𝑉𝑉𝑆𝑆𝑠𝑠 ∗ 𝜌𝜌𝑐𝑐𝑉𝑉𝑆𝑆𝑐𝑐𝑜𝑜𝑉𝑉𝑜𝑜𝑉𝑉) ∗ tan(𝜙𝜙)]
− (𝑇𝑇𝑉𝑉𝑉𝑉𝑜𝑜𝑜𝑜𝑜𝑜𝑐𝑐𝑆𝑆𝑉𝑉)
0 = (𝑆𝑆𝑆𝑆 ∗ 1,291 𝑊𝑊𝑙𝑙) − [0.525 𝑚𝑚3 ∗ 0.5 𝑚𝑚3 ∗ 5,291𝑊𝑊𝑙𝑙𝑚𝑚3 ∗ tan(0.576)]
− 261 𝑊𝑊𝑙𝑙
𝑆𝑆𝑆𝑆 = 2.9
Eq. 9 Calculating the Safety Factor to Check for Sliding
𝑦𝑦 = 𝐶𝐶 ∗ cosh �𝑥𝑥𝐶𝐶� − 𝐶𝐶
𝑦𝑦 = 99.08 ∗ cosh �5𝑚𝑚
99.08� − 99.08 = 0.13 𝑚𝑚
Eq. 10 Calculating the Length at Each Stringer
∆𝐿𝐿𝑐𝑐𝑆𝑆𝑠𝑠𝑉𝑉𝑉𝑉 = �20% 𝐿𝐿𝐶𝐶 𝑚𝑚𝑊𝑊𝐻𝐻. 𝑙𝑙𝐷𝐷𝐻𝐻𝐻𝐻𝑘𝑘𝑊𝑊𝐻𝐻𝑅𝑅 𝐿𝐿𝐶𝐶𝐷𝐷𝐻𝐻𝐻𝐻𝑅𝑅𝐶𝐶ℎ
𝐴𝐴𝐷𝐷𝐻𝐻𝐻𝐻 𝑥𝑥 13,500,000 𝑊𝑊𝑙𝑙. 𝑊𝑊𝐻𝐻2 �
+ �𝑇𝑇𝐿𝐿𝐶𝐶𝐻𝐻𝑊𝑊 𝑊𝑊𝐿𝐿𝐻𝐻𝑑𝑑 − 20% min𝑙𝑙𝐷𝐷𝐻𝐻𝐻𝐻𝑘𝑘𝑊𝑊𝐻𝐻𝑅𝑅 𝐿𝐿𝐶𝐶𝐷𝐷𝐻𝐻𝐻𝐻𝑅𝑅𝐶𝐶ℎ
𝐴𝐴𝐷𝐷𝐻𝐻𝐻𝐻 𝑥𝑥 15,000,000𝑊𝑊𝑙𝑙𝑊𝑊𝐻𝐻2
�
∆𝐿𝐿𝑐𝑐𝑆𝑆𝑠𝑠𝑉𝑉𝑉𝑉 = �20% ∗ 16540 𝑊𝑊𝑙𝑙
3.9 ∗ 10−4𝑚𝑚2 ∗ 20,925,041,850 𝑊𝑊𝑙𝑙𝑚𝑚2
� + �3,059− 20% ∗ 16540 𝑊𝑊𝑙𝑙
3.9 ∗ 10−4 ∗ 15,000,000𝑊𝑊𝑙𝑙𝑊𝑊𝐻𝐻2
�
= 3.8 ∗ 10−4𝑚𝑚

Mesele Final Report 60 December 9, 2016
Eq. 11 Calculating the Cable Stretch
𝑦𝑦 = 𝐶𝐶 ∗ sinh �𝑥𝑥𝐶𝐶�
𝑦𝑦 = 99.08 ∗ sinh �20 𝑚𝑚99.08
� = 39.76 𝑚𝑚
Eq. 12. Calculating Final Cable Length
𝑊𝑊1 = 𝑉𝑉1 ∗ 𝜌𝜌𝑐𝑐𝑉𝑉𝑆𝑆𝑐𝑐𝑜𝑜𝑉𝑉𝑜𝑜𝑉𝑉
𝑊𝑊1 = (0.25 ∗ 1.25 ∗ 1)𝑚𝑚3 ∗5291𝑊𝑊𝑙𝑙𝑚𝑚3 = 1653
Eq. 13
𝑊𝑊2 = 𝑉𝑉2 ∗ 𝜌𝜌𝑐𝑐𝑉𝑉𝑆𝑆𝑐𝑐𝑜𝑜𝑉𝑉𝑜𝑜𝑉𝑉
𝑊𝑊2 = (1 ∗ 1 ∗ 0.75)𝑚𝑚3 ∗5291 𝑊𝑊𝑙𝑙𝑚𝑚3 = 3968
Eq. 14
�𝑀𝑀 = 𝑆𝑆𝑐𝑐𝐿𝐿𝑐𝑐 − (𝑊𝑊1𝐿𝐿1 −𝑊𝑊2𝐿𝐿2) ∗ 𝑆𝑆𝑆𝑆 = 0 𝑊𝑊𝑙𝑙 ∗ 𝑚𝑚
�𝑀𝑀 = 0.5 ∗ (1317 𝑊𝑊𝑙𝑙 ∗ 1.25 𝑚𝑚)
= ��1653 𝑊𝑊𝑙𝑙 ∗ �0.25 𝑚𝑚
2��+ �3968 𝑊𝑊𝑙𝑙 ∗ �
1.25 𝑚𝑚2
��� 𝑆𝑆𝑆𝑆
𝑆𝑆𝑆𝑆 = 3.2
Eq. 15. Check for Overturning in River Crossing Anchor
𝑊𝑊1 = 𝑉𝑉1 ∗ 𝜌𝜌𝑐𝑐𝑉𝑉𝑆𝑆𝑐𝑐𝑜𝑜𝑉𝑉𝑜𝑜𝑉𝑉
𝑊𝑊1 = (0.25 ∗ 1 ∗ 0.5)𝑚𝑚3 ∗5291𝑊𝑊𝑙𝑙𝑚𝑚3 = 661 𝑊𝑊𝑙𝑙
Eq. 16
𝑊𝑊2 = 𝑉𝑉2 ∗ 𝜌𝜌𝑐𝑐𝑉𝑉𝑆𝑆𝑐𝑐𝑜𝑜𝑉𝑉𝑜𝑜𝑉𝑉
𝑊𝑊2 = (0.5 ∗ 0.5 ∗ 0.5)𝑚𝑚3 ∗5291 𝑊𝑊𝑙𝑙𝑚𝑚3 = 661𝑊𝑊𝑙𝑙
Eq. 17
�𝑀𝑀 = 𝑆𝑆𝑐𝑐𝐿𝐿𝑐𝑐 − (𝑊𝑊1𝐿𝐿1 −𝑊𝑊2𝐿𝐿2) ∗ 𝑆𝑆𝑆𝑆 = 0 𝑊𝑊𝑙𝑙 ∗ 𝑚𝑚

Mesele Final Report 61 December 9, 2016
�𝑀𝑀 = 0.5 ∗ (246 𝑊𝑊𝑙𝑙 ∗ 1 𝑚𝑚) = ��661 𝑊𝑊𝑙𝑙 ∗ �0.25 𝑚𝑚
2��+ �661𝑊𝑊𝑙𝑙 ∗ �
0.75 𝑚𝑚2
��� 𝑆𝑆𝑆𝑆
𝑆𝑆𝑆𝑆 = 2.6
Eq. 18. Check for Overturning in Valley Crossing Anchor

Mesele Final Report 62 December 9, 2016
Appendix 8. Schedule: Table and Descriptions

Mesele Final Report 63 December 9, 2016
Table 23 Tasks, Man-hours, and Schedule for Construction
# Task Duration (Hours) Manpower
Man Hours
Work Day
H1 Excavation of Site 8 3 24 1
H2a Place Gravel and Pour
Concrete Base 8 3 24 2
H2b Allow Concrete Base to
Set 72 0 0 3-6
P3a Dig Anchors for Valley
Crossing 1 2 2 4 P3b Prepare for Concrete 2 2 4 4 P3c Pour Concrete On Base 2 2 4 4 P3d Set Concrete Base 72 0 0 4-7
P4 UV Spray All Exposed
Piping 5 3 15 5 S1 Drainage Channel 12 4 48 5-6 S2 Water Reserve 4 4 16 7 P5a Excavate 0.5 2 1 7 P5b Prepare for concrete 1 2 2 7 P5c Anchor base 0.5 1 0.5 7 P5d Set concrete 72 0 0 7-10
P3e Pour Concrete Tower
w/Rebar 3 2 6 8 P3f Set Concrete Tower 72 0 0 8-11 P3g Prepare Stringers 2 2 4 8 S3 Excavation Springs 9 4 36 9-10 S4a SB Base Construction 8 3 24 10 S4b SB Set Concrete 72 0 0 10-13 H3a Ladder Rungs 4 1 4 11 H3b Create Wall Forms 6 2 12 12 H3c Pour Concrete Wall 8 3 24 13 H3d Allow Concrete to Set 72 0 0 13-16 P5e Concrete Tower 6 2 12 14 P5f Set Concrete 72 0 0 14-17 P6 Prepare Stringers 6 4 24 15 P8 Tree Anchor 1 3 3 15 S5a Wall Construction 12 4 48 16-17 S5b Pour Concrete 4 5 20 17 S5c Set Concrete 72 0 0 17-20 S6 Form & Pour Cover 9 3 27 18 S6a Set Concrete 72 0 0 18-21

Mesele Final Report 64 December 9, 2016
H3e Remove Base Forms 3 2 6 19 H4a Create Forms 6 2 12 19 H4b Pour Concrete 8 3 24 20 H4c Allow Concrete to Set 72 0 0 20-23 P1 Dig Trenches 168 6 1008 23-30
H5a Lay Gravel 4 2 8 31 H5b Place Rebar 4 2 8 31 H5c Pour Concrete 8 3 24 32 H5d Allow Concrete to Set 72 0 0 32-35
P7 Stringing Pipe for River
Crossing 2 6 12 33 H5d Remove Forms 3 2 6 33 H6a Handles 4 1 4 34 H6b Create Form 1 2 2 34 H6c Pour Concrete 1 3 3 34 H6d Allow Concrete to Set 72 0 0 34-37 H7 Connect Piping to Tank 8 1 8 37 P9 Test the System 1 Everyone 0 38
P9a Maintenance (as
needed) 5 2 10 39 P10 Cover All Piping 8 6 48 40
Total Man Hours 2876
Spring Captures S1. Drainage Channel
• Divert normal flow path away from spring before beginning construction
• Shovels can be used to dig channel S2. Temporary Water Reserve
• Place a temporary water container at spring, so fresh water will be readily available for concrete mixing
S3. Excavation • Dig out the soft sediments until the eyes of the spring are clearly
exposed. • Take caution not to dig into the impermeable layer of sediment. • Tools to be used are a pickaxe and shovel
S4a. Base Construction • Delineate the edges of the base with wood shuttering. [12] • The base should be close to the eye of the spring and extend
approximately one meter forward from the eye and across the full width of the base.

Mesele Final Report 65 December 9, 2016
o Base thickness should be 100mm [12] • Lay Rebar in 0.33 m spacing across width of base. Lay rebar in 0.33 m
spacing across length of base [9] • Concrete mixture should be a (1:4:8) mixture. Add water just enough
to make mixture cohesive, but ensure not to add too much water. [12] • Minimize air pockets by tamping the mixture. This can be done by
heavy banging and shaking the form or ramming within the mixture with a steel rod. [8,16]
• Concrete will take 3 days to set before any weight can be applied • While concrete is hardening, maintain moisture in the concrete by
placing old damp cement bags, rags, etc. over top. These coverings should be wetted daily. [12]
S4b. Set Concrete • Wait 3+ days for concrete to dry
S5a. Wall Construction • Use wood shuttering to create framework for 100 mm thick walls [12] • Front and side walls can be erected simultaneously. • Per recommendation of [9] walls should be reinforced with rebar in
0.15m intervals. o Position rebar in 0.15m spacing across width of wall. Position
rebar in 0.15m spacing across length of wall. S5b. Pour Concrete
• Mix concrete with cement, sand, and gravel in (1:2:4) ratio. [12] • Pour concrete
o Install overflow, outflow, and cleanout piping in the front wall. • Affix the cleanout plug to cleanout pipe and shut-off valve to outflow
pipe S5c. Set Concrete
• Concrete will take 3 days to set o While concrete is hardening, maintain moisture in the concrete
by placing old damp cement bags, rags, etc. over top. These coverings should be wetted daily.
S6. Cover Construction • Construct wooden form for 100 mm thick cover. [12] • Lay Rebar in 0.4 m spacing across width of top. Lay rebar in 0.4 m
spacing across length of top. [9] S6a. Mix concrete with cement, sand and gravel in a (1:2:4) ratio. [15]
• Pour concrete and allow concrete to sit and harden.

Mesele Final Report 66 December 9, 2016
• Minimize air pockets by tamping the mixture. This can be done by heavy banging and shaking the form or ramming within the mixture with a steel rod. [8,16]
• While concrete hardens, maintain moisture in the concrete by placing old damp cement bags, rags, etc. over mixture. These coverings should be wetted daily. [15]
Holding Tank H1. Excavation of Site - Tank site needs to be excavated to create level ground for the tank to be built on. Trenches will also need to be excavated for the wall footings. H2. Wall Footing Foundations -
H2a. Place Gravel and Pour Concrete • Place and level 0.10 m of gravel in excavated trenches. Then
pour concrete footings on top. H2b. Allow Concrete to Set H3. Wall Construction -
H3a. Ladder Rungs • 14 pieces of 0.60 m need to be formed into ladder rungs to
access the manhole.
H3b. Create Forms for Walls • Basic forms need to be built, rebar, ladder rungs and the 6
piping locations need to be placed. H3c. Pour Concrete for Walls
• Mix concrete, pour walls and let sit until concrete is dried. H3d. Allow Concrete to Set
H3e. Remove Forms H4. Roof Construction -
H4a. Create Forms for Roof • Place wood beams, plywood and rebar. Create form to leave
opening for manhole o A piece of plywood will be placed supported by
horizontal and vertical beams for the roof to be poured on top of.
H4b. Pour Concrete for Roof • Mix concrete, pour roof and let sit until concrete is dried.
H4c. Allow Concrete to Set H4d. Remove Forms
• Cut inside forms into small pieces to remove through manhole

Mesele Final Report 67 December 9, 2016
H5. Floor Construction - To be completed after roof is done so no contamination occurs
H5a. Lay Gravel • Gravel should slope towards cleanout and outlet pipe.
H5b. Place Rebar H5c. Pour Concrete for Floor
• Mix concrete, pour floor and let sit until concrete is dried. H5d. Allow Concrete to Set
H6. Manhole Cover- H6a. Handles
• Form handles from ⅜” rebar H6b. Create Form
• Build basic form, place wire mesh for support and rebar handles
H6c. Pour Concrete for Cover • Mix concrete, pour cover and let sit until concrete is dried.
H6d. Allow Concrete to Set H7. Connect Piping to Tank
Piping Network P1. Excavation of pipe network: P1a: Dig Trenches
• Dig trenches about 1ft. deep. • You will put up caution tape as you go along the network.
P2. Lay Pipe network P2a. Lay piping
• Measure out along the network the amount of pipe need at each section and cut pipe with a saw for each deviation in the network. For example, if there is a 5ft section of pipe the pipe with need to be cut shorter.
• needed before an incline you will cut a 5ft section from the 20ft pipe section provided.
P2b. Pipe Fittings • Add pipe fittings as you go along the network. This will also be
taking into consideration the coupling fittings at each pipe section. For the coupling fittings one or two people will be applying the solvent at each fitting as the rest of the crew is installing the network.
P2c. Install couplings P3a. Valley Crossing P3a. Dig anchors for valley crossings

Mesele Final Report 68 December 9, 2016
P3b. Prepare for Concrete P3c. Pour Concrete on Base
P3d. Set Concrete Base P3e. Pour Concrete Tower w/Rebar P3f. Set Concrete Tower P3g. Prepare Stringers P3h. String Pipe for Valley Crossing
P4. UV Spray • Spray the 4” PVC Pipe and 2” PVC Pipe that is going to be exposed
with the UV Protection spray P5a. Excavate
• Dig a hole for the base of the concrete anchor for the 40m river crossing.
o 21 inches deep (0.5m + 25 mm [Est]) o 1.25 m long o 1 m wide
P5b. Prepare for concrete • Place wooden planks around the hole to form the concrete • Fill bottom layer with 1 inch or 25 mm of gravel • Lay rebar across the base
o 3, 1.25-meter vertical support o 4, 1-meter horizontal support
P5c. Anchor Base P5d. Set Concrete P5e. Pour Concrete Tower
• Pour 0.25 m of concrete • Lay rebar • Pour another 0.25 m of concrete • Lay rebar • Pour 0.2 m of concrete • Lar rebar and top with the last 0.05 m of concrete
P5f. Set Concrete Tower P6. Prepare Stringers
• Lay out the main cable and pipe on solid ground with appropriate sag • Attach the cable eyelet at the appropriate distances • Cut the wire rope to the appropriate length to the coordinating sag at
that point • Wrap the 3/16” wire rope around the cable eyelet with appropriate turn
back length, attach two cable clamps alone the turn back. Wrap the bottom part around the pipe.

Mesele Final Report 69 December 9, 2016
P7: Stringing Pipe for River Crossing • A few people will guide the pipe through the stringer bottoms onto the
other side P8: Tree anchor Construction
• Use 2 elbows to guide pipe along the tree • Attach cable and clamps to tree
P9: Test system before burying pipe • Run the system after everything is connected. Have all workers along
the piping system to check for any leaks. P9a. Maintenance
• If maintenance is needed on the pipe, fix it before burying the pipe. Retest after the maintenance is complete.
P10: Bury the pipe • Cover all piping if there are no maintenance needed.

Mesele Final Report 70 December 9, 2016
Appendix 9. Cost Estimate Tables

Mesele Final Report 71 December 9, 2016
Table 24 Cost Estimate of Materials for Water Distribution System Materials
Material Quantity Units Unit Cost Cost Cement (500 lbs) 30 each $50.00 $1,477.60
Sand 345 ft3 $2.00 $690.00 Aggregate 531 ft3 $1.72 $913.32
Rebar 1,375 ft $0.20 $275.00 2in Pipe Mesh Screen 11 count $16.00 $176.00
Valves 53 count $12.79 $677.87 Cleanout Plug 7 count $6.79 $47.53
Wood shuttering (4x4m) 2 count $14.00 $28.00 Plywood (4' by 8') 80 m2 $4.03 $322.40
Wood Planks (2" by 2") 33 m $0.58 $19.14 90-degree Elbow (2in) 43 count $3.99 $171.57
Reinforcement Mesh (42" By 84") 1 sheet $7.75 $7.75 Hardware for Forms $200.00
UV Spray Paint 4 Can $5.00 $20.00 SDR 26 (2.in) 5,005 ft $0.80 $4,004.00 SDR 26 (1.5in) 2,860 ft $0.50 $1,430.00
Air Valves 5 count $19.99 $99.95 45-degree Elbow (1.5in) 13 count $2.99 $38.87 45-degree Elbow (2in) 10 count $3.99 $39.90
90-degree Elbow (1.5in) 102 count $1.99 $202.98 Couplings (1.5 in) 141 count $2.99 $421.59 Couplings (2 in) 248 count $0.69 $171.12
Y (2in) 4 count $1.99 $7.96 Y (1.5 in)* 3 count $2.99 $8.97
T (2in) 13 count $1.59 $20.67 T (1.5 in) 12 count $2.99 $35.88
Coupling Solvent 8 count $9.79 $78.32 PVC 4" (10 ft) 4 ft $4.79 $19.16
3/16" Wire rope (250 ft) 1 ft $29.49 $29.49 1/4" Wire rope (200ft) 1 ft $51.49 $51.49
1/4 SS wire rope thimble 7 count $0.99 $6.93 3/8 x 6 Jaw & Eye turnbuckle 1 count $4.59 $4.59
3/16" Stainless Steel Rope Clip 35 count $1.35 $47.25 Total $11,700
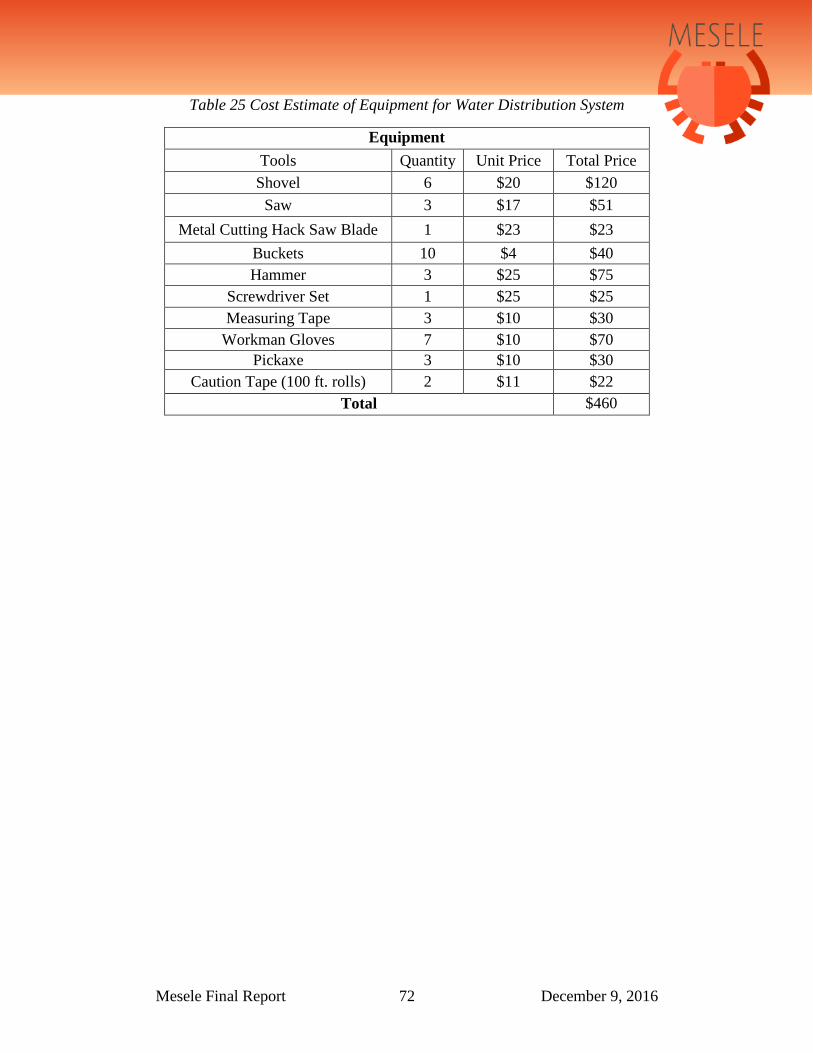
Mesele Final Report 72 December 9, 2016
Table 25 Cost Estimate of Equipment for Water Distribution System
Equipment Tools Quantity Unit Price Total Price Shovel 6 $20 $120
Saw 3 $17 $51 Metal Cutting Hack Saw Blade 1 $23 $23
Buckets 10 $4 $40 Hammer 3 $25 $75
Screwdriver Set 1 $25 $25 Measuring Tape 3 $10 $30
Workman Gloves 7 $10 $70 Pickaxe 3 $10 $30
Caution Tape (100 ft. rolls) 2 $11 $22 Total $460

Mesele Final Report 73 December 9, 2016
Enclosed Gantt Chart for Construction