great american food monitor - august 2017 food... · global food prices reached a two-year ......
TRANSCRIPT

WORLD FOOD PRICES ON THE RISE
VOLUME
251
AUGUST 2017
Food
DEMAND FOR DAIRY Increased demand from overseas caused dairy prices to surge
PRICES SOARING Global food prices reached a two-year high in July, driven by prices for meats, dairy, and wheat
WHEAT RISING Wheat prices surged through the summer months amid drought conditions

© 2017 Great American Group, LLC. All Rights Reserved.
In This Issue MONITOR FOODGREATAMERICAN.COMAUGUST 2017800-45-GREAT
VOLUME
251
Deals are a moving target. A constantly shifting mix of people, numbers,
and timing. We’re here to simplify this process for you. Our experts are
dedicated to tracking down and flushing out the values you need, even on
the most complex deals. So when the time comes to take your shot with
Great American, you’re always—right on the money.
Deals are a moving target. A constantly shifting mix of people, numbers,
and timing. We’re here to simplify this process for you. Our experts are
dedicated to tracking down and fl ushing out the values you need, even
on the most complex deals. So when the time comes to take your shot
with Great American, you’re always—right on the money.
© 2016 GREAT AMERICAN GROUP, LLC. ALL RIGHTS RESERVED
GREATAMERICAN.COM
0304050810101111
12121315161617
Trend Tracker
Overview
Meat
Seafood
Dairy
Sugar
Food Reference Sheet
Experience
Appraisal & Valuation Team
Fruits and Vegetables Monitor Information
Coffee
Corn About Great American Group
Wheat

Trend Tracker
NOLVS
• Meat: NOLVs increased versus the prior year due to a
favorable spread between acquisition costs for beef and
market prices.
• Seafood: NOLVs are mixed, as sales are down but
margin and prices have increased for certain categories.
Companies may focus on crabmeat, as this traditionally
carries a higher gross margin.
SALES TRENDS
• Meat: Sales increased driven by higher prices for meat
and continued demand in the market.
• Seafood: Sales declined due to the loss of contracts
with customers as well as companies focusing on
higher margins.
GROSS MARGIN
• Meat: Gross margins are mixed due to some companies
increasing prices to customers and others updating
standard costing.
• Seafood: Gross margins increased, particularly for
crabmeat, as companies are focusing on higher
margin products.
INVENTORY
• Meat: Inventory levels are mixed overall as some
companies are intentionally working down inventory
levels while some have seen increases due to higher
prices and demand.
• Seafood: Inventory levels have increased due to
seasonal factors such as the timing of the shrimp and
crab harvests.
PRICING
• Meat: Beef prices are increasing as compared to the
prior year due to increased demand. Pork prices have
increased due to lower supply, while poultry prices
are increasing due to higher demand from health-
conscious consumers.
• Seafood: Shrimp prices, while still down year-over-year,
stabilized in the past several months due to increased
volumes in the marketplace.
• Dairy: Milk prices increased year-over-year, as prices in
2016 were unusually low due to a global oversupply and a
lower amount of exports, but have been relatively stable in
recent months.
• Corn: Despite recent month-to-month increases, prices
remain down year-over-year due to favorable weather
patterns that resulted in an ample supply.
3 | MONITOR FOOD August 2017
Meat (Mainly Beef) Seafood
NOLVs Increasing Mixed
Sales Trends Increasing Decreasing
Gross Margin Mixed Increasing
Inventory Mixed Increasing
Pricing
Meat Increasing
Seafood (Mainly Shrimp) Consistent
Dairy Increasing
Corn Decreasing

While meat, dairy, and wheat prices continue to increase,
prices for other commodities, namely sugar and coffee, have
followed a downward trajectory. According to the FAO, global
sugar prices are down 26% year-over-year, as the main
producing area in Brazil remains on track to produce a record
crop. Within the U.S., sugar prices have been falling from a
slight peak experienced in February 2017 when demand was
higher. Similarly, global coffee prices have been on the decline
due to a buildup of large inventories and reduced export
volumes by Brazil.
One of the major current trends within the food industry is
the focus on healthier eating. According to a survey by the
research firm Label Insight, 49% of consumers have stated
that they follow a specific diet or healthy eating program.
Similarly, nearly 48% of consumers report that they consume
a larger amount of fresh (unprocessed) foods than they did
three years ago. A majority of consumers avoid specific
ingredients, such as high fructose corn syrup, artificial
sweeteners, preservatives, or artificial colors and flavors,
and regularly purchase “superfoods” such as avocado, kale,
cinnamon, green tea, or blueberries.
Gluten-free eating is also becoming increasingly popular in
today’s society due to the ingredient’s perceived effects on
the body. As a result, numerous fast-food restaurants are now
offering gluten-free options along with other healthy menu
items, such as salads, fruits, smoothies, and yogurt. The focus
on healthier eating has also resulted in higher demand for
lean protein options, such as chicken, pork, and seafood, and
lower consumption of sugar.
Overview
Worldwide food prices are on the rise, according to the latest data from the Food and Agriculture Organization (“FAO”). Prices reached a two-year high in July 2017, an increase of 2.3% from June and 10.2% above last year’s level, driven by higher costs for meats (including beef, pork, and chicken), dairy, and wheat. Year-over-year, global meat prices have risen approximately 8%, while dairy prices soared 52% above last year’s levels, bolstered by increased demand from overseas. Wheat prices have also continued to surge through the summer months, owing to drought conditions in key growing regions. In July 2017, hard red spring wheat traded 34% higher than in June 2017, its highest monthly gain since 2010.
4 | MONITOR FOOD August 2017

5 | MONITOR FOOD August 2017
Meat
BEEF
Wholesale beef prices averaged $3.24 per pound in July
2017, posting a significant decrease from the prior month,
but remained above the average of $3.12 per pound posted
in July 2016. Beef prices had increased in the first half of
2017 as demand rose in anticipation of holidays such as
Independence Day; following July 4th, prices typically decline.
Within the U.S., beef consumption per capita increased from
53.9 pounds in 2015 to 57.1 pounds in 2017.
As retail prices typically lag several months behind wholesale,
most retail beef prices rose slightly in July 2017, but remained
below the prior year, when a lack of supply had resulted in
higher overall pricing.
Retail prices for USDA ground beef averaged $3.75 per
pound in July, up from $3.68 per pound in June and were
above the prior year’s price of $3.69 per pound. Similarly,
round steak prices increased from $5.76 per pound to
$5.94 per pound year-over-year. However, sirloin decreased
from $8.52 per pound to $8.36 per pound, despite a slight
increase from June to July.
Looking ahead, retail beef prices are expected to decrease
between 1.0% and 2.0% in 2017 due to an expected increase
in production. While beef production through year-end is
lower than originally forecast, it is still predicted to exceed the
2016 level if weather and other factors remain unchanged.
Monthly Choice Beef Wholesale Value Per Pound July 2016 through July 2017 ($ per Pound)1

6 | MONITOR FOOD August 2017
Meat
PORK
Wholesale pork prices have been on the rise in recent
months, increasing on both a monthly and year-over-year
basis. In July 2017, prices climbed to an average of $1.84
per pound, up from $1.78 per pound in June 2017 and
surpassing the price of $1.64 per pound posted in July
2016, driven by lower amounts of pork in cold storage
coupled with higher consumption rates. Pork consumption
per capita increased from 49.7 pounds in 2015 to 50.8
pounds in 2017.
At the end of 2016, there were 477.2 million pounds of
pork in cold storage, representing a decrease of 8% from
the prior month and a decline of 12.5% year-over-year. This
year-end figure represented the smallest amount of frozen
pork for any month since September 2011. In particular,
pork bellies in cold storage at the end of 2016 were down
66.7% as compared to the prior year. However, pork
production rates have begun to rise, with a 4.9% increase
expected through year-end; this is likely to result in lower
prices in the months to come.
As retail prices typically lag several months behind
wholesale costs, prices at supermarkets have been mixed on
a year-over-year basis, depending on the cut. Boneless hams
were priced at $4.02 per pound in July 2017, an increase
from $3.96 per pound listed in the same month of 2016,
while bacon rose from $5.45 per pound to $5.82 per pound
year-over-year. However, pork chops decreased from $3.83
per pound to $3.42 per pound during this same period.
According to the USDA, retail pork prices are expected to be
1.0% to 2.0% lower through year-end.
POULTRY
Wholesale broiler prices have been increasing steadily
since February due to larger sizes of birds and increased
demand from health-conscious consumers. In July 2017,
USDA wholesale broiler prices averaged $0.99 per pound,
increasing from the June 2017 average of $0.98 per
pound and up considerably from July 2016’s average
of $0.76 per pound. Chicken consumption per capita
increased from 90.0 pounds in 2015 to 91.6 pounds in
2017, an all-time high.
At the retail level, year-over-year price changes have been
mixed, depending on the cut. Retail fresh whole chicken
prices in July 2017 increased from $1.44 to $1.49 per
pound year-over-year, while prices for whole turkeys
increased from $1.59 to $1.62 per pound. Chicken leg
prices decreased from $1.55 per pound to $1.42 per pound
and chicken breast prices fell two cents to $3.19 per pound.
While overall retail poultry prices are expected to increase
between 0.5% and 1.5% through year-end, the USDA
notes that such prices will remain lower than the 20-year
historical average of 2.1%.
Monthly Average Pork Wholesale Value Per Pound July 2016 through July 2017 ($ per Pound)2

7 | MONITOR FOOD August 2017
Meat
POULTRY (CONT’D)
One notable trend within the chicken segment of late has
been rising wholesale prices of chicken wings, a trend that
has negatively impacted restaurant chains such as Buffalo
Wild Wings and Chick-Fil-A. In April and May, analysts at
BMO Capital Markets reported an 11% increase in year-over-
year chicken wing prices, the largest jump since the Super
Bowl, when prices traditionally rise due to higher demand. It
remains to be seen whether this trend will continue through
the late summer and fall months.
3 Monthly Wholesale Broiler Composite July 2016 through July 2017 ($ per Pound)

8 | MONITOR FOOD August 2017
Seafood
OVERVIEW
According to market research firm IBISWorld, Inc.
(“IBISWorld”), revenue within the seafood wholesaling industry
increased at an annualized rate of 1.2% in the five years to
2017. Revenue reached $16.5 billion, with a growth rate of
1.8% expected through year-end.
The recent improvement in the industry has been the result
of overall economic growth. Per capita disposable income
has increased over the past five years, allowing consumers to
purchase more expensive protein options such as seafood.
Additionally, seafood prices decreased, allowing for greater
consumption of more expensive varieties, such as salmon
and crab.
SHRIMP
Prices have been steady to mainly flat and remain generally
lower than over the last couple of years when early mortality
syndrome hit the farmed shrimp market extremely hard.
Market prices for shrimp (No.1 shell-on headless, 26-30
count per pound, Mexican origin, New York port) fell from
an average of $12.13 per pound in May 2016 to $10.69 per
pound in May 2017. Prices have remained stable since the
end of September due to an ample supply in the market.
Imports grew 7% in June 2017 and are now 2% higher as
compared to 2016. However, the U.S. remains in third place,
with Asia purchasing over 50% of Ecuador production,
followed by Europe, at approximately 24%. With so much
demand for Ecuador shrimp overseas, offerings have
remained generally steady and somewhat disconnected from
a barely steady to weak U.S. spot market, which has resulted
in eroded margins.
Gulf of Mexico wild shrimp is a much different market than
farmed and has trended higher than the past two years due to
lower than expected harvest stocks. The highest quality wild
shrimp have higher prices year-to-date than those of the last
few years.
LOBSTER
Prices of Atlantic and New England sourced lobster were
down in July 2017, despite a lower supply than in recent
years. According to Urner Barry, the wholesale price for
1¼-pound hard shell lobsters at the end of July 2017
averaged $7.63 per pound, down from a little over $8.00 per
pound at the same time in 2016. Lobster prices historically
fluctuate in conjunction with supply and demand; if lobster
catches are high in the coming weeks, the price may drop
even further.
UB Shrimp, Cooked, Asian, Tail-On, White, 16-20 Count May 2016 through May 2017 ($ per Pound)4

9 | MONITOR FOOD August 2017
Seafood
SALMON
Norwegian frozen product imports are up 43% versus a year
ago, while the Chilean farmed salmon market continues to
struggle with algae bloom and other geo-political issues.
Imports from Chile have shrunk significantly over the last
two to three years, a trend that has continued. Regarding the
overall market, there have been lower than expected frozen
inventories, as there has been a higher demand for and
health-conscious incentives to buy and sell fresh salmon.
Fresh salmon sourcing from Norway and the UK are up 100%
over last year. Fresh salmon prices are extremely high all over
the world due to this trend, while the demand for salmon
sourced from Chile remains cool.

Prices for fresh fruits decreased 1.9% from May 2017 to June
2017, yet were up 1.1% as compared with 2016. Despite rising
prices for bananas, apples, and citrus fruits in June, prices for
all other fresh fruit decreased on a month-to-month basis due
primarily to elevated supplies. The USDA expects fresh fruit
prices to change between negative 0.5% and 0.5% through
year-end, with increases predicted for 2018.
Fresh vegetable prices fell 1.3% from May 2017 to June
2017, but prices remained 1.6% higher than June 2016. ERS
expects fresh vegetable prices to decrease between 0.5%
and 1.5% through year-end, as a stronger U.S. dollar, low oil
prices, and seasonal availability will place downward pressure
on retail fresh produce prices.
10 | MONITOR FOOD August 2017
Dairy
Global dairy prices have risen in 2017, as evidenced by the
FAO Dairy Price Index, which was up 52% year-over-year in
July. Within the U.S., milk prices were relatively flat from June
to July 2017, but remained elevated year-over-year. Retail milk
prices averaged $3.22 per gallon in July 2017, rising from
$3.21 in the previous month but above the July 2016 price of
$3.06 per gallon. Milk prices in 2016 were unusually low due
to a global oversupply and a lower amount of exports.
However, according to the USDA, dairy exports are expected
to increase in the coming months, particularly for products
with high skim-milk content as consumers opt for healthier,
lower fat options.
Domestic cheese inventories have been high in recent
months, resulting in a trend toward lower, or stable, prices.
American cheese prices declined from $4.37 per pound
to $4.28 per pound year-over-year, while cheddar cheese
declined from $5.18 per pound to $4.85 per pound. However,
cheese exports increased by 26.9% in May versus the prior
month; should this trend continue, it will likely reduce the
oversupply and result in higher prices. Additionally, domestic
consumption of cheese has increased within the last two
decades, with American cheese consumption up 20% and
Italian style cheeses up 40% on a per capita basis. Yogurt
consumption was up 139% during this period.
Demand for most dairy products is expected to increase as
the year progresses. As a result, the USDA expects retail dairy
product prices to rise between 0.5% and 1.0% through year-
end 2017.
5 Average Monthly Milk Retail Prices - Fresh, Whole, Fortified Per GallonJuly 2016 through July 2017
Fruits and Vegetables

11 | MONITOR FOOD August 2017
Corn
Prices for U.S. #2 yellow corn, used primarily for livestock
feed, have continued to decline, averaging $159.99 per metric
ton in June 2017, representing a decline from $162.70 per
metric ton in the prior year.
Corn prices have been falling since the historic highs reached
in 2012, when drought conditions drove prices to over
$330.00 per metric ton.
As mentioned in the prior monitor, the recent decrease in
pricing correlates to an plentiful supply of corn in the market.
According to the USDA, the total U.S. corn supply for 2017/18
is projected at 16.7 billion bushels, which is 265 million higher
than the previous forecast. Planted corn acreage is projected
at 90.9 million acres, up nearly 1.0 million. As a result,
corn prices are not expected to increase significantly in the
foreseeable future.
6 U.S. No. 2 Yellow Corn Prices June 2016 through June 2017 ($ Per Metric Ton)
Wheat
Global wheat prices have been rising amid concerns over a
major drought in key growing areas in the U.S. (particularly
in Montana and the Dakotas) and in Canada. This has had
a significant impacted on spring wheat, a high protein grain
used in artisan wheat foods such as rolls, breads, and pizza
crust. In June 2017, hard red spring wheat traded 34% higher
than the prior month, representing its highest monthly gain
since 2010.
According to a report by CNBC, wheat conditions in the U.S.
deteriorated in recent months, and do not seem likely to
improve in the coming weeks. While there are ample stocks
of wheat in storage, the harvest for this year is expected to
remain poor. This is predicted to result in higher prices in the
months to come.
12 | MONITOR FOOD August 2017
Coffee
According to the International Coffee Organization’s (“ICO”)
most recent Monthly Coffee Market Report, coffee prices
decreased in June 2017, partially due to a buildup of large
inventories and reduced export volumes by Brazil. The ICO
composite indicator fell 2.4% in June to 122.39 U.S. cents per
pound. In terms of the group indicators, all categories except
Robustas experienced declines, with Brazilian Naturals, Other
Milds, and Colombian Milds posting declines from the prior
month of 5.7%, 4.5%, and 3.5%, respectively.
However, Robustas posted an increase of 3.6% in June due to
concerns of a possible shortage in the coming months.
Overall exports of coffee in June were estimated at 10.9
million bags, representing an increase of 8.8% compared to
the same month in 2016. Exports by Brazil were down by
22.7 million bags, or 5.9%, compared to last year, continuing
a trend that has been ongoing for two years. The reduced
exports by Brazil, however, were partially offset by increases
by other origins such as Ethiopia, Colombia, Honduras, Peru,
Uganda, and Indonesia.
Sugar
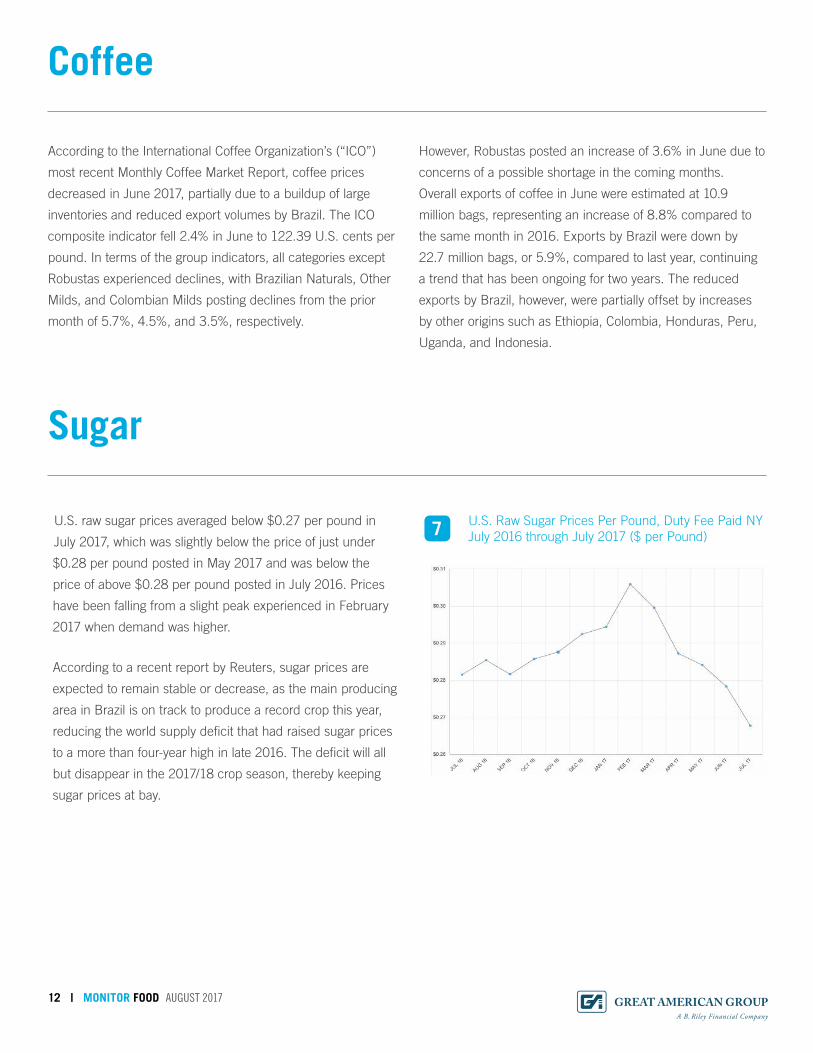
U.S. raw sugar prices averaged below $0.27 per pound in
July 2017, which was slightly below the price of just under
$0.28 per pound posted in May 2017 and was below the
price of above $0.28 per pound posted in July 2016. Prices
have been falling from a slight peak experienced in February
2017 when demand was higher.
According to a recent report by Reuters, sugar prices are
expected to remain stable or decrease, as the main producing
area in Brazil is on track to produce a record crop this year,
reducing the world supply deficit that had raised sugar prices
to a more than four-year high in late 2016. The deficit will all
but disappear in the 2017/18 crop season, thereby keeping
sugar prices at bay.
U.S. Raw Sugar Prices Per Pound, Duty Fee Paid NYJuly 2016 through July 2017 ($ per Pound)7

Food Reference Sheet
13 | MONITOR FOOD August 2017
USDA CHOICE BEEF VALUES, PRICE SPREAD, AND ALL-FRESH RETAIL VALUE DOLLARS PER POUND OF RETAIL EQUIVALENT
July 2017 June 2017 July 2016
Retail Value $6.100 $6.207 $6.090
Wholesale Value $3.247 $3.736 $3.120
Net Farm Value $2.585 $2.901 $2.550
Wholesale to Retail Spread $2.853 $2.471 $2.970
Farm to Wholesale Spread $0.662 $0.835 $0.570
Total Spread $3.515 $3.306 $3.540
All-Fresh Beef Retail Value $5.833 $5.795 $5.775
USDA PORK VALUES AND SPREADSDOLLARS PER POUND OF RETAIL EQUIVALENT
July 2017 June 2017 July 2016
Retail Value $3.833 $3.756 $3.781
Wholesale Value $1.843 $1.784 $1.635
Net Farm Value $1.138 $1.056 $0.981
Wholesale to Retail Spread $1.990 $1.972 $2.146
Farm to Wholesale Spread $0.705 $0.728 $0.654
Total Spread $2.695 $2.700 $2.800
USDA RETAIL PRICES FOR POULTRY CUTS DOLLARS PER POUND OF RETAIL EQUIVALENT
July 2017 June 2017 July 2016
Retail Broiler Composite $1.863 $1.868 $1.899
Wholesale Broiler Composite $0.991 $0.982 $0.757
Wholesale to Retail Broiler Spread $0.872 $0.886 $1.142
Chicken, Fresh, Whole $1.496 $1.497 $1.445
Chicken, Legs, Bone-In $1.418 $1.436 $1.547
Chicken, Boneless Breast $3.189 $3.215 $3.210
Turkey, Frozen, Whole $1.622 $1.576 $1.586

Food Reference Sheet
14 | MONITOR FOOD August 2017
USDA RETAIL PRICES FOR DAIRY PRODUCTS
July 2017 June 2017 July 2016
Milk, fresh, whole, fortified($/gallon)
$3.219 $3.213 $3.062
American processed cheese ($/pound)
$4.282 $4.306 $4.373
Cheddar cheese, natural ($/pound) $4.851 $4.797 $5.184
COFFEE: ICO INDICATORS AND FUTURES PRICES (NEW YORK MARKET)
June 2017 May 2017 June 2016
ICO Composite $1.2726 $1.2239 $1.3298
Columbian Milds $1.5251 $1.4612 $1.6446
Other Mild Arabicas $1.4966 $1.4322 $1.7176
Brazilian Natural Arabicas $1.2919 $1.2371 $1.4476
Robustas $1.0494 $1.0195 $0.9082

15 | MONITOR FOOD August 2017
GA has worked with and appraised many large and well-
known companies within the food service industries. While
our clients remain confidential, they have included meat
processors and distributors, seafood distributors, leading fresh
and processed fruit and vegetable distributors, and specialty
and prepared food distributors servicing restaurants, retailers,
food service companies, and wholesalers across the U.S. GA
has appraised companies such as the following:
• One of the nation’s largest independent canning and
frozen food companies and one of the world’s largest
producers of fresh and packaged fruits and vegetables.
• Processors of both conventional and organic frozen
vegetables, and manufacturers and distributors of frozen
and canned vegetable and fruit products.
• A major dairy marketing cooperative that offers cheese,
butter, non-fat dry milk, aseptic, and other dairy products.
• A producer of cheese and dairy powders, grated hard
Italian cheeses, dairy concentrates, seasonings, and
similar products for the foodservice industry.
• A leading manufacturer of private label soft drinks,
including juice, carbonated soft drinks, sport drinks, and
other beverages.
• A manufacturer and distributor of desserts, sour cream
products, and dips.
• A processor and distributor of milk and other dairy
products such as cultured yogurt, sour cream, cream,
cream cheese, and ice cream.
• A seafood distributor maintaining its own chain of
restaurants, offering a wide variety of frozen seafood items
including lobster, crab, and scallops.
• Multiple importers and distributors of fresh and frozen
seafood products to large national food wholesalers.
• Leading portion-controlled beef, pork, lamb, and poultry
cutting operations designated for the casual dining and
quick serve restaurant segments.
• A distributor of sweeteners, non-dairy creamers, croutons,
crunchy toppings, stuffing, breadcrumbs/cracker meals,
foodservice stuffing mixes, snacks, and snack mixes.
• A producer and distributor of ice cream and related
frozen goods.
• Vertically-integrated producers of high-quality coffees for
the restaurant and supermarket industries.
• A producer and distributor of various fruit juices, as well
as vitamin-enriched water and cocktail mixers.
• Producers and distributors of desserts, such as
frozen cheesecakes, gourmet cakes, mini desserts,
and brownies.
• A processor, packager, and distributor of nuts such as
pecans, cashews, almonds, and peanuts.
• An importer, producer, and bottler of olive oils, vinegars,
and specialty foods.
• Distributors of specialty food products, including pasta,
sauces, marinades, and fine artisan cheeses.
• A processor and distributor of snack and specialty foods,
such as roasted nuts and seeds, snack mixes, sesame
sticks, candies, and dried fruit.
GA has been involved in the liquidation of several food
processing and distribution companies, including South
Pacific Specialties, LLC; Metropolitan Foods; BSB, Inc.;
New Sam Woo Trading; Markel Johnson; and Gulf Shrimp
Company, as well as food processing, storage, and distribution
equipment for companies such as Winn Dixie, Maui
Pineapple Company, Humboldt Creamery, Loeb Equipment,
and Webvan. Food processing, storage, and distribution
equipment liquidated by GA included blow molding lines,
bagging machines, bottle conveyors, milk separators and
pasteurizers, filling lines, pizza manufacturing lines, vacuum
sealers, freezers and coolers, stainless steel tanks, liquid lines,
and frozen and refrigerated box trucks.
Experience
16 | MONITOR FOOD August 2017
Appraisal & Valuation Team
Daniel J. Williams
Managing Director
New York Region
(908) 251-3580
Kristi Faherty
Managing Director
(781) 429-4060
Chad P. Yutka, ASA
Managing Director, CAVS Group Head
(312) 909-6078
Jason Gomes
Associate Project Manager
(781) 429-4082
Michael Petruski
Executive Vice President
(818) 884-3737
BUSINESS DEVELOPMENT
OPERATIONS
Bill Soncini
Senior Vice President
Midwest Region
(773) 495-4534
David Seiden
Executive Vice President
Southeast Region
(404) 808-8153
Drew Jakubek
Managing Director
Southwest Region
(214) 455-7081
Jennie Kim
Vice President
Western Region
(818) 974-0602
Ryan Mulcunry
Executive Vice President
Northeast Region, Canada & Europe
(857) 231-1711
Monitor Information
The Food Monitor relates information covering most
commodity food products, including industry trends, market
pricing, and their relation to the valuation process. GA
internally tracks recovery ranges for beef, pork, poultry,
dairy products, seafood, coffee, sugar, corn, and fruits and
vegetables in all price points, but we are mindful to adhere
to your request for a simple reference document. Should
you need any further information or wish to discuss recovery
ranges for a particular segment, please feel free to contact
your GA Business Development Officer.
The information contained herein is based on a composite
of GA’s industry expertise, contact with industry personnel,
industry publications, liquidation and appraisal experience,
and data compiled from a variety of well-respected sources
believed to be reliable. GA does not make any representation
or warranty, expressed or implied, as to the accuracy or
completeness of the information contained in this issue.
Neither GA nor any of its representatives shall be liable
for use of any of the information in this issue or any errors
therein or omissions therefrom.

Great American Group is a leading provider of asset
disposition solutions and valuation and appraisal services to
a wide range of retail, wholesale, and industrial clients, as
well as lenders, capital providers, private equity investors,
and professional services firms. In addition to the Food
Monitor, GA also provides clients with industry
expertise in the form of monitors for the paper and
packaging, metals, chemicals and plastics, and building
products sectors, among many others. For more information,
please visit www.greatamerican.com.
Great American Group, LLC is a wholly owned subsidiary
of B. Riley Financial, Inc. (NASDAQ: RILY), a diversified
provider of collaborative financial and business advisory
services through several subsidiaries, including: B. Riley &
Co. LLC, a leading investment bank and a FINRA & SIPC
member, which provides corporate finance, research, and
sales & trading to corporate, institutional, and high net worth
individual clients; Great American Group, LLC; B. Riley
Capital Management, LLC, an SEC registered Investment
Advisor, which includes B. Riley Asset Management, a
provider of investment products to institutional and high net
worth investors, and B. Riley Wealth Management (formerly
MK Capital Advisors), a multi-family office practice and
wealth management firm focused on the needs of ultrahigh
net worth individuals and families; and Great American
Capital Partners, a provider of senior secured loans and
second lien secured loan facilities to middle market public
and private U.S. companies.
B. Riley Financial, Inc. is headquartered in Los Angeles
with offices in major financial markets throughout the
United States and Europe. For more information on B. Riley
Financial, Inc., please visit www.brileyfin.com.
About Great American Group
MONITOR FOOD GREATAMERICAN.COMAUGUST 2017800-45-GREAT
VOLUME
251LOS ANGELES (HQ)21255 Burbank Blvd.Suite 400Woodland Hills, CA 91367T 818.884.3737F 818.884.2976
CHARLOTTE, NC15720 Brixham Hill Ave.Suite 300Charlotte, NC 28277T 704.227.7161F 704.227.7171
ATLANTA1200 Abernathy Rd.Suite 1700Atlanta, GA 30328T 770.551.8115
WILTON, CT73 Old Ridgefield Road Suite 6Wilton, CT 06897T 203.663.5101
NEW YORKGraybar Building420 Lexington AvenueSuite 3001New York, NY 10170T 917.464.1521
MILWAUKEE10850 West Park PlaceSuite 970Milwaukee, WI 53224T 414.831.2850
BOSTON300 First AvenueSuite 201Needham, MA 02494T 781.444.1400F 781.444.1401
GERMANYPrinzregentenstr 18Fifth Floor 80538 Munchen, Germany
DALLAS17304 Preston Rd.Suite 720Dallas, TX 75252T 972.996.5630 F 972.996.5639
CHICAGO10 South LaSalle St.Suite 2170Chicago, IL 60603T 312.777.7950F 312.777.7948
AUSTRALIALevel 29, Chifley Tower 2 Chifley SquareSydney, NSW 2000 Australia
17 | MONITOR FOOD August 2017