greater expectations - ncb.org.uk · unequal childhoods: how poverty and inequality persist this...
TRANSCRIPT
i
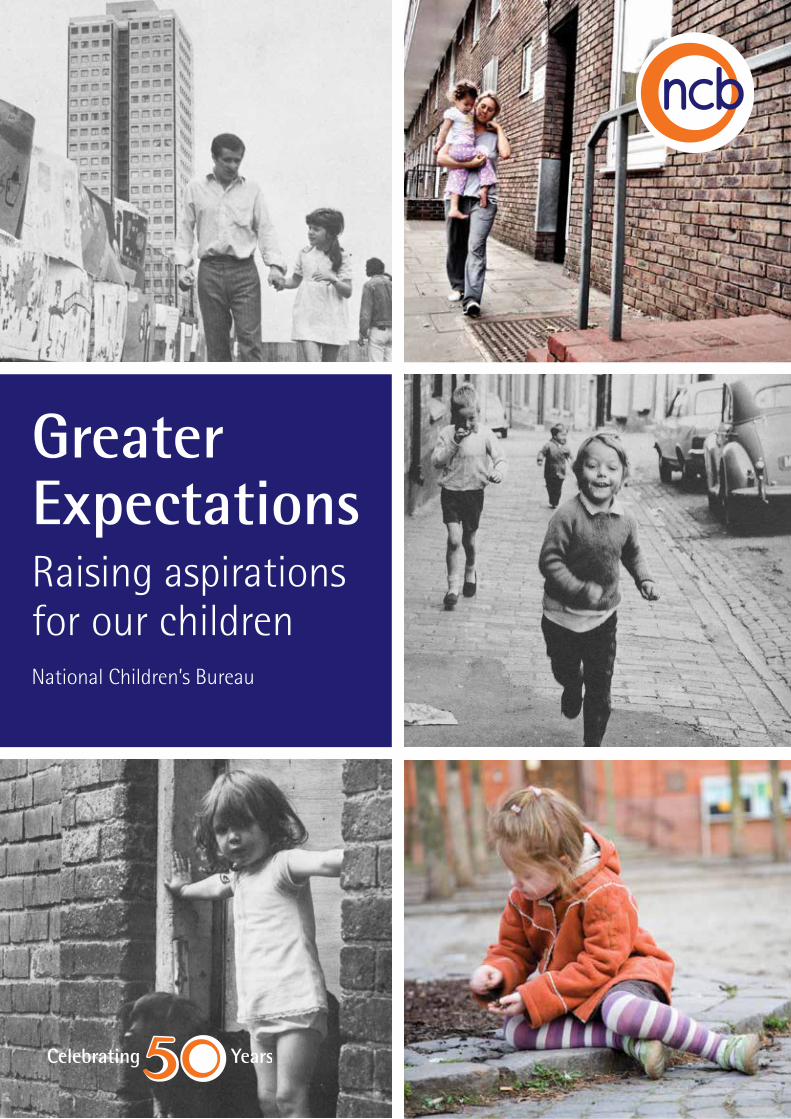
Greater Expectations Raising aspirations for our childrenNational Children’s Bureau
Contents
Summary 1
Introduction 3
Part One 5 Unequal childhoods: How poverty and inequality persist
Growing up in poverty 6
The early years 8
The school years 10
Getting a healthy start 13
Home and the neighbourhood 16
Part Two 19 Could we be doing better for our children? How we compare to other countries
Poverty 20
Early years 21
School years and beyond 22
Health 24
Home and the neighbourhood 26
Conclusion and key findings 28
What needs to change? 31
The National Children’s Bureau is a leading charity that for 50 years has been improving the lives of children and young people, especially the most vulnerable. We work with children and for children, to influence government policy, be a strong voice for young people and practitioners, and provide creative solutions on a range of social issues.
For more information visit www.ncb.org.uk
© National Children’s Bureau 2013 ISBN: 978 1 909391 12 3
Photographs taken from Born to Fail?, 1973 © G.E. Clark
Every effort has been made to trace the copyright holder and to obtain their permission for the use of images from Born to Fail. The National Children’s Bureau would be grateful for any information that should be incorporated in future reprints or editions of this report.
Published by NCB NCB, 8 Wakley Street, London EC1V 7QE Tel: 020 7843 6000 Website: www.ncb.org.uk Registered charity number: 258825
British Library Cataloguing in Publication Data A catalogue record for this book is available from the British Library.
All rights reserved. No part of this publication may be reproduced, stored in a retrieval system or transmitted in any form by any person without the written permission of the publisher.
1
Summary
In 1969, shortly after the National Children’s Bureau was founded, it conducted a major study looking at the experiences of children from poor, disadvantaged backgrounds. Born to Fail?1 revealed how growing up in these circumstances damaged children’s lives resulting in poor health, underachievement at school and lack of opportunities to fulfil their potential.
Nearly 50 years on, this report examines 12 key indicators to determine whether children in this country are still experiencing inequality and disadvantage. It shows that far from improving over time, the situation today appears to be no better than it was nearly five decades ago.
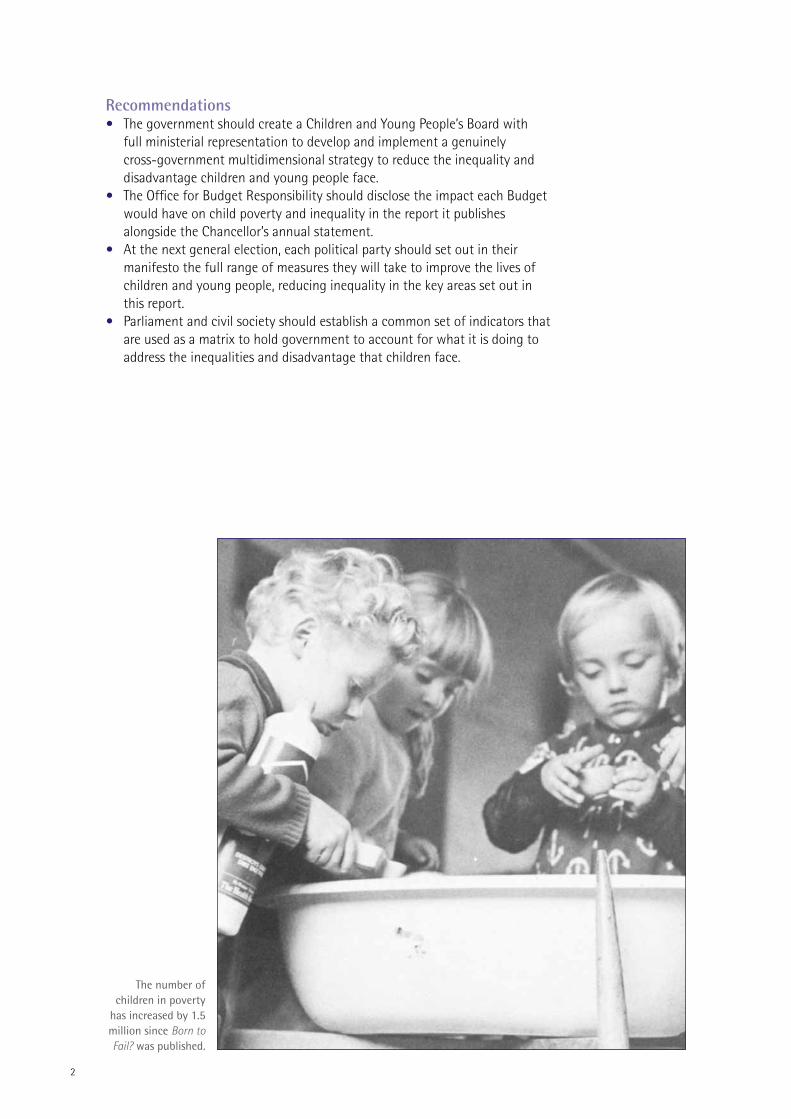
• The number of children in poverty has increased by 1.5 million since Born to Fail? was published.
• A child from a disadvantaged background is still far less likely do well in their GCSEs at 16.
• Children living in deprived areas are much more likely to be obese than those living in affluent areas.
• Children from disadvantaged backgrounds are more likely to suffer accidental injuries at home.
• Children living in the most deprived areas are much less likely to have access to green space and places to play.
Overall the inequality that existed 50 years ago still persists today, and in some respects has become worse. Clearly we could be doing much better. International comparisons show that if the UK were doing as well for our children as the best industrialised nations:
• almost 1 million children in the UK would not be living in poverty • 172 fewer children would die each year due to unintentional injury –
14 fewer deaths each month• at least 300,000 more 15–19-year-olds would be in education and training• 770,400 fewer children under 5 would be living in poor environmental
conditions.
The fact that the poverty and inequality experienced by our children remains just as prevalent today as it did nearly 50 years ago must not be ignored. Unless a new course of action is taken there is a real risk of sleepwalking into a world where inequality and disadvantage are so deeply entrenched that our children grow up in a state of social apartheid.
1 Wedge, P and Prosser, H (1973) Born to Fail? The National Children’s Bureau reports on striking differences in the lives of British children, London: Arrow Books. The book reported on the findings of the National Child Development Study, the first ever multidisciplinary, longitudinal study of 16,000 children born in 1958.
2
Recommendations• The government should create a Children and Young People’s Board with
full ministerial representation to develop and implement a genuinely cross-government multidimensional strategy to reduce the inequality and disadvantage children and young people face.
• The Office for Budget Responsibility should disclose the impact each Budget would have on child poverty and inequality in the report it publishes alongside the Chancellor’s annual statement.
• At the next general election, each political party should set out in their manifesto the full range of measures they will take to improve the lives of children and young people, reducing inequality in the key areas set out in this report.
• Parliament and civil society should establish a common set of indicators that are used as a matrix to hold government to account for what it is doing to address the inequalities and disadvantage that children face.
The number of children in poverty
has increased by 1.5 million since Born to Fail? was published.
3
Introduction
For 50 years, the National Children’s Bureau (NCB) has been working to improve the lives of children and young people, reducing the impact of inequalities.
Early on in its life, NCB published Born to Fail? 2, a groundbreaking study of the impact of inequality and disadvantage on the outcomes and experiences of a cohort of 11-year-olds living in Great Britain in 1969. The report found that one in seven of those children were growing up in poverty and one in six in poor and overcrowded housing. It also uncovered a clear relationship between growing up in disadvantaged circumstances and the children’s outcomes – the inequality in childhood.
Those children living in the most disadvantaged circumstances – whose family had a low income, were receiving benefits and who lived in poor housing – were less healthy and more likely to struggle at school than their more advantaged peers. These disadvantaged children were more likely to be born underweight, to miss school due to ill health and to be accidentally injured at home. Similar inequalities were identified in terms of children’s health and physical development and schooling, with disadvantaged children less likely than their peers to do well in reading and maths.
So, almost 50 years on, what do we know about the experiences of children and young people who continue to live in poverty and face disadvantage? Are they still ‘born to fail’, held back by poverty and inequality? This report seeks to address whether or not the gross inequalities found by NCB in 1969 still exist today. Have they become more or less entrenched? And do they continue to damage children’s life chances? It also makes comparisons with other industrialised countries and asks if we could be doing better – should we have greater expectations to be the best place in the world for all children to grow up regardless of their circumstances?
Part One of this report uses available statistical data to provide a snapshot of what it means to be a child growing up today, and to find out whether the inequalities identified almost 50 years ago in Born to Fail? persist. It sets out 12 key indicators. They are not intended to provide an exhaustive study of the state of childhood today, but instead demonstrate whether and how inequality and disadvantage continue to impact on the lives of children. We have chosen the same indicators that were identified in the Born to Fail? report and included additional ones where further related data is available. These indicators are now supported by such a compelling evidence base that they are widely considered to be critically important in determining both a child’s well-being and their well-becoming, as well as their future life chances.
2 Wedge, P and Prosser, H (1973) Born to Fail? The National Children’s Bureau reports on striking differences in the lives of British children, London: Arrow Books.
4
We recognise that it is difficult to make comparisons with data from such a long time ago due to changing definitions and different data sources existing today. However, we have sought to provide as much of a comparison as possible. Overall we have drawn together data that:
• provides a reasonable comparison with the findings of Born to Fail? • is available from official sources• has been identified by NCB and its partnerships as significant to our work
with children.
The report also uses evidence from NCB’s 1982 publication, Children in Adversity 3, which revisited the group of children studied for Born to Fail? when they were 16 years old.
Part Two of the report goes on to assess how, compared with other industrialised nations, our country is supporting children across some key areas of their lives. By doing so, we aim to give an indication of where and how we could be doing better and striving to have greater expectations for our children.
The majority of the data in Part One of the report relates to England only; where this is not the case, it is indicated. It therefore primarily provides an analysis of childhood inequality in England rather than across all, or within each, of the four nations of the UK. We know that there are variations in the four nations and NCB Northern Ireland works specifically on childhood inequality in that nation. In Part Two of the report the majority of the data covers the UK setting out what would be different for children if we were doing as well as other countries.
3 Wedge, P and Essen, J (1982) Children in Adversity After Born to Fail? The National Children’s Bureau reports on Britain’s disadvantaged 11–16 year olds, London: Pan Books.
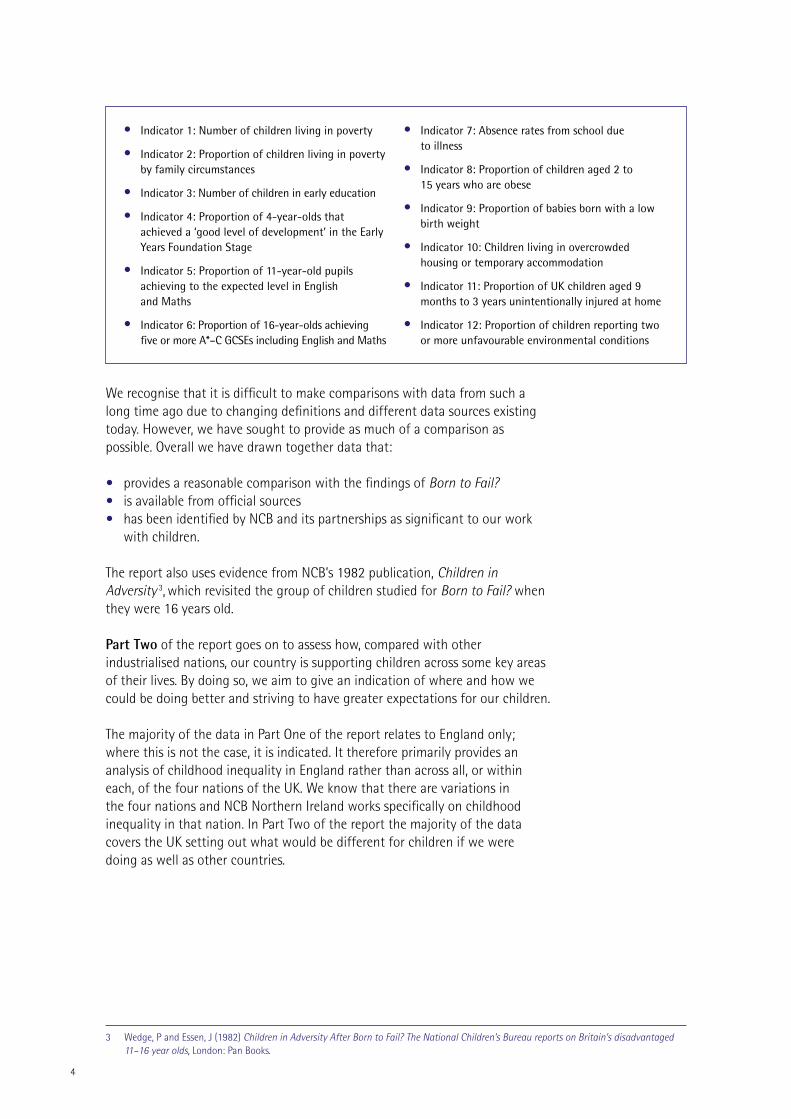
• Indicator 1: Number of children living in poverty
• Indicator 2: Proportion of children living in poverty by family circumstances
• Indicator 3: Number of children in early education
• Indicator 4: Proportion of 4-year-olds that achieved a ‘good level of development’ in the Early Years Foundation Stage
• Indicator 5: Proportion of 11-year-old pupils achieving to the expected level in English and Maths
• Indicator 6: Proportion of 16-year-olds achieving five or more A*–C GCSEs including English and Maths
• Indicator 7: Absence rates from school due to illness
• Indicator 8: Proportion of children aged 2 to 15 years who are obese
• Indicator 9: Proportion of babies born with a low birth weight
• Indicator 10: Children living in overcrowded housing or temporary accommodation
• Indicator 11: Proportion of UK children aged 9 months to 3 years unintentionally injured at home
• Indicator 12: Proportion of children reporting two or more unfavourable environmental conditions
5
PaRT OnE Unequal childhoods: How poverty and inequality persist
This chapter brings together key data relating to children’s education, health, development and home and local environment, to find out whether the inequalities identified almost 50 years ago in Born to Fail? continue to affect the experiences and life chances of children today.
We demonstrate that, despite increasing wealth and improving standards of living, widespread poverty and disadvantage still blight the lives of millions of children. In fact, far from improving over time, the situation today appears to be no better than it was nearly five decades ago.
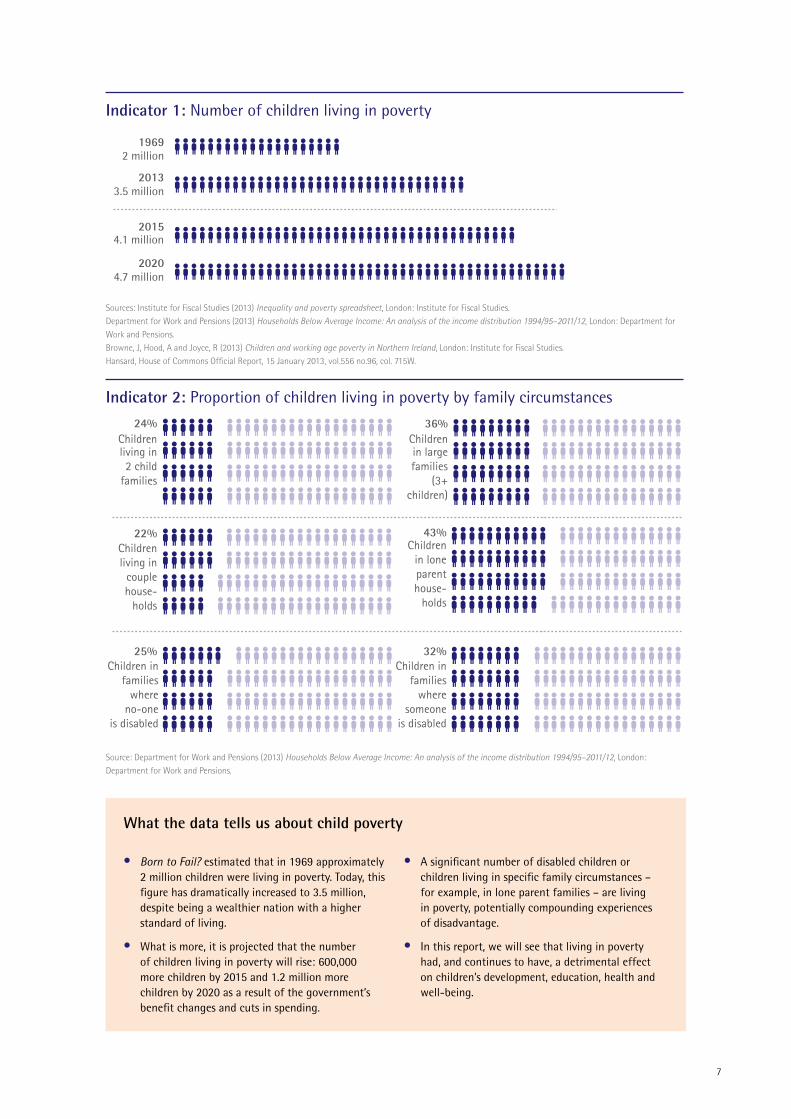
• The number of children in poverty has substantially increased from 2 million in 1969 to 3.5 million today.
• Poor housing continues to affect the lives of many children with one in every 14 children children living in overcrowded conditions.
• Children from disadvantaged backgrounds are more likely to suffer accidental injuries at home.
• Children living in the most deprived areas are much less likely than those living in the least deprived to have access to green space, places to play and to live in environments with better air quality.
Although progress has been made in the provision of early education children from disadvantaged backgrounds continue to have much worse outcomes. Compared to other children their lives are deeply scarred by the disadvantage they face. For example, we show that:
• a child from a disadvantaged poor background is still far less likely to achieve a good level of development at age 4, to achieve well at school age 11 and do well in their GCSEs at 16 compared to a child from the most well-off backgrounds
• boys living in deprived areas are three times more likely to be obese than boys growing up in affluent areas and girls are twice as likely
• babies born into disadvantaged homes are still more likely to be underweight.
Overall, this chapter demonstrates that the inequality that existed 50 years ago still persists today. It shows that unequal childhoods have become a permanent feature of our nation.
6 Poor expectations: the impact of inequality and disadvantage on children
4 In Born to Fail?, children were defined as living in a low-income family if the child was receiving free school meals or the family had received supplementary benefit (given to families where there is no father or he is unemployed) in the previous year.
5 Department for Work and Pensions (2013) Households Below Average Income: An analysis of the income distribution 1994/95–2011/12, London: Department for Work and Pensions. Here, we define children living in poverty as dependent children (under 16 years or in full-time education) living in a family receiving less than 60 per cent of the median income after housing costs (relative poverty).
6 Institute for Fiscal Studies (2013) Inequality and poverty spreadsheet, London: Institute for Fiscal Studies.7 Browne, J, Hood, A and Joyce, R (2013) Children and working age poverty in Northern Ireland, London: Institute for Fiscal Studies.8 Hansard, House of Commons Official Report, 15 January 2013, vol.556 no.96, col. 715W.
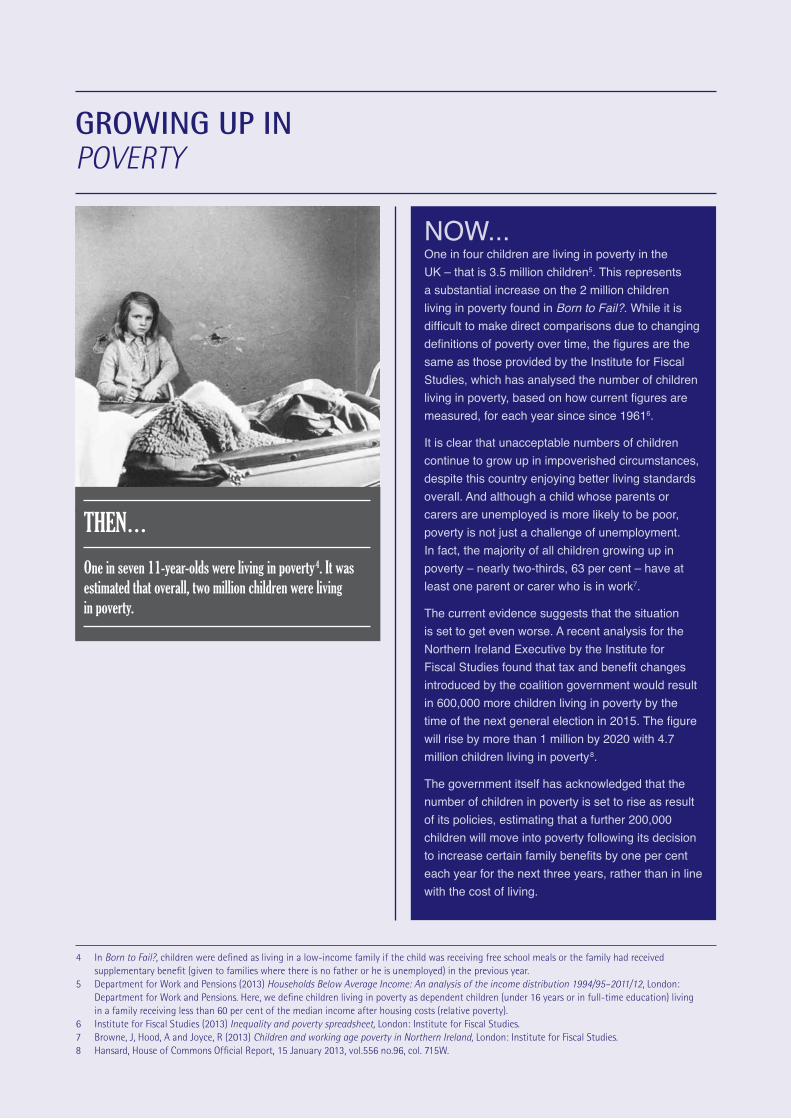
GROWInG UP In POVERTY
NOW... One in four children are living in poverty in the UK – that is 3.5 million children5. This represents a substantial increase on the 2 million children living in poverty found in Born to Fail?. While it is difficult to make direct comparisons due to changing definitions of poverty over time, the figures are the same as those provided by the Institute for Fiscal Studies, which has analysed the number of children living in poverty, based on how current figures are measured, for each year since since 19616.
It is clear that unacceptable numbers of children continue to grow up in impoverished circumstances, despite this country enjoying better living standards overall. And although a child whose parents or carers are unemployed is more likely to be poor, poverty is not just a challenge of unemployment. In fact, the majority of all children growing up in poverty – nearly two-thirds, 63 per cent – have at least one parent or carer who is in work7.
The current evidence suggests that the situation is set to get even worse. A recent analysis for the Northern Ireland Executive by the Institute for Fiscal Studies found that tax and benefit changes introduced by the coalition government would result in 600,000 more children living in poverty by the time of the next general election in 2015. The figure will rise by more than 1 million by 2020 with 4.7 million children living in poverty 8.
The government itself has acknowledged that the number of children in poverty is set to rise as result of its policies, estimating that a further 200,000 children will move into poverty following its decision to increase certain family benefits by one per cent each year for the next three years, rather than in line with the cost of living.
THEN…
One in seven 11-year-olds were living in poverty 4. It was estimated that overall, two million children were living in poverty.
7
Indicator 2: Proportion of children living in poverty by family circumstances
Indicator 1: Number of children living in poverty
What the data tells us about child poverty
• Born to Fail? estimated that in 1969 approximately 2 million children were living in poverty. Today, this figure has dramatically increased to 3.5 million, despite being a wealthier nation with a higher standard of living.
• What is more, it is projected that the number of children living in poverty will rise: 600,000 more children by 2015 and 1.2 million more children by 2020 as a result of the government’s benefit changes and cuts in spending.
• A significant number of disabled children or children living in specific family circumstances – for example, in lone parent families – are living in poverty, potentially compounding experiences of disadvantage.
• In this report, we will see that living in poverty had, and continues to have, a detrimental effect on children’s development, education, health and well-being.
24%Childrenliving in2 child
families
Childrenin largefamilies
(3+children)
36%
22%Childrenliving in
couplehouse-
holds
Childrenin loneparenthouse-
holds
43%
Children infamilies
wheresomeone
is disabled
32%25%Children in
familieswhere
no-oneis disabled
19692 million
3.5 million
4.1 million
4.7 million
2013
2015
2020
Sources: Institute for Fiscal Studies (2013) Inequality and poverty spreadsheet, London: Institute for Fiscal Studies. Department for Work and Pensions (2013) Households Below Average Income: An analysis of the income distribution 1994/95–2011/12, London: Department for Work and Pensions. Browne, J, Hood, A and Joyce, R (2013) Children and working age poverty in Northern Ireland, London: Institute for Fiscal Studies. Hansard, House of Commons Official Report, 15 January 2013, vol.556 no.96, col. 715W.
Source: Department for Work and Pensions (2013) Households Below Average Income: An analysis of the income distribution 1994/95–2011/12, London: Department for Work and Pensions.
8 Poor expectations: the impact of inequality and disadvantage on children
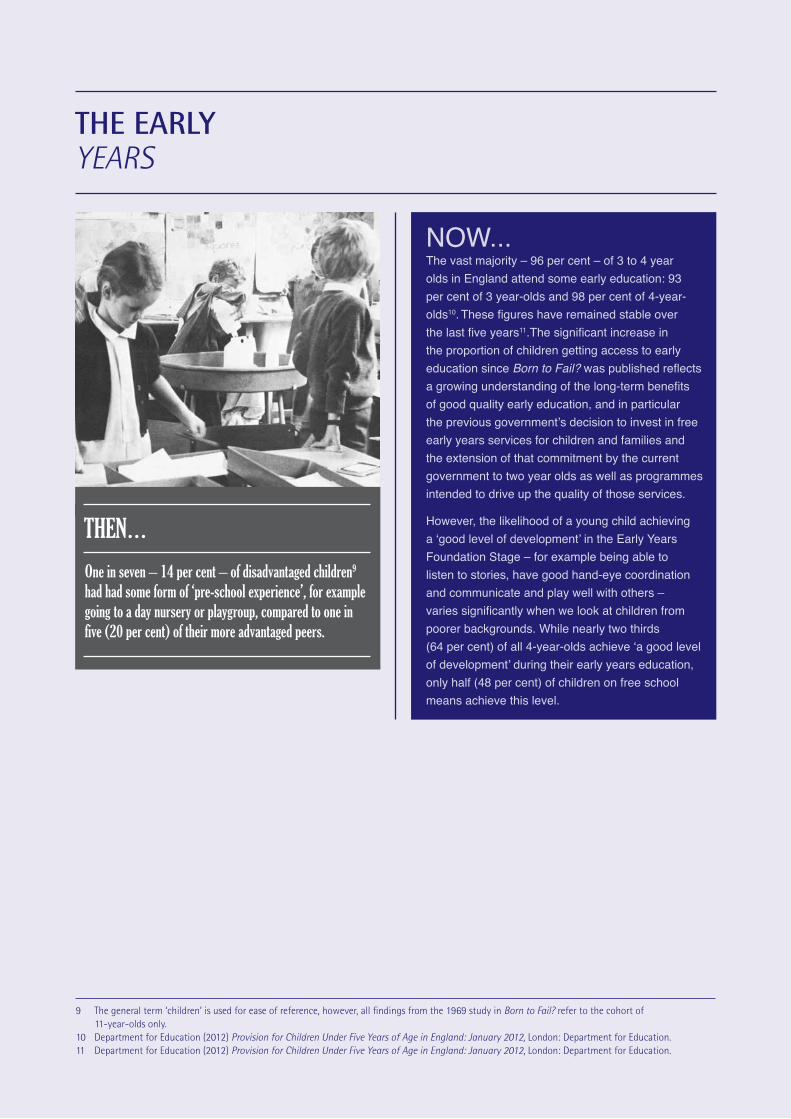
THE EaRLY YEARS
9 The general term ‘children’ is used for ease of reference, however, all findings from the 1969 study in Born to Fail? refer to the cohort of 11-year-olds only.
10 Department for Education (2012) Provision for Children Under Five Years of Age in England: January 2012, London: Department for Education.11 Department for Education (2012) Provision for Children Under Five Years of Age in England: January 2012, London: Department for Education.
NOW... The vast majority – 96 per cent – of 3 to 4 year olds in England attend some early education: 93 per cent of 3 year-olds and 98 per cent of 4-year-olds10. These figures have remained stable over the last five years11.The significant increase in the proportion of children getting access to early education since Born to Fail? was published reflects a growing understanding of the long-term benefits of good quality early education, and in particular the previous government’s decision to invest in free early years services for children and families and the extension of that commitment by the current government to two year olds as well as programmes intended to drive up the quality of those services.
However, the likelihood of a young child achieving a ‘good level of development’ in the Early Years Foundation Stage – for example being able to listen to stories, have good hand-eye coordination and communicate and play well with others – varies significantly when we look at children from poorer backgrounds. While nearly two thirds (64 per cent) of all 4-year-olds achieve ‘a good level of development’ during their early years education, only half (48 per cent) of children on free school means achieve this level.
THEN…
One in seven – 14 per cent – of disadvantaged children9
had had some form of ‘pre-school experience’, for example going to a day nursery or playgroup, compared to one in five (20 per cent) of their more advantaged peers.

9
Indicator 4: Proportion of 4-year-olds that achieved a ‘good level of development’ in the Early Years Foundation Stage
Indicator 3: Number of children in early education
What the data tells us about the early years
• We know that good quality pre-school experiences enhance children’s development, and disadvantaged children in particular benefit from these experiences12,13. Today, levels of participation in early education in England are high, which reflects policies such as the provision of free early education for 3 and 4-year-olds, as well as policies targeted at driving up the availability of early childhood services through Sure Start Children’s Centres.
• Despite almost universal enrolment among 3- and 4-year-olds, young children living in poorer
economic circumstances are less likely to develop well than their more affluent peers14. We know that children from poor backgrounds can develop well if they have access to good quality early years provision. At the same time, however, evidence suggests that the quality of early years services is weakest in areas with high levels of deprivation15.So we must and can do more to support disadvantaged young children to develop as well as their more affluent peers.
64%All
children
48%Pupils on
Free SchoolMeals
67%Pupils not
on FreeSchoolMeals
96%All 3 to
4-year-olds
3-year-olds93%
4-year-olds98%
12 Sylva, K and others (2004) The Effective Provision of Pre-School Education Project, London: Institute of Education.13 Sylva, K and others (2010) Early Childhood Matters: evidence from the Effective Pre-School and Primary Education Project,
Oxford: Routledge.14 Eligibility for free school meals can be used as a measure of economic disadvantage.15 Ofsted (2012) The report of Her Majesty’s Chief Inspector of Education, Children’s Services and Skills: Early Years, London:
The Stationery Office.
Source: Department for Education (2012) Early Years Foundation Stage Profile Attainment by Pupil Characteristics, England 2011/12. Statistical First Release. London: Department for Education.
Source: Department for Education (2012) Provision for Children Under Five Years of Age in England: January 2012. London: Department for Education.

10 Poor expectations: the impact of inequality and disadvantage on children
THE SCHOOL YEARS
THEN…
Disadvantaged children did less well than their peers in reading and maths tests.
On average, disadvantaged 11-year-olds were 3.5 years behind their more advantaged peers in reading scores. Of all those pupils considered by their teachers to be performing poorly, almost three times more were disadvantaged than advantaged – 58 per cent compared with 20 per cent. Conversely, of those considered to be doing well, five times more were advantaged than disadvantaged – 38 per cent, compared with 7 per cent.
Five years later, at the age of 16, four times fewer disadvantaged children scored highly in maths and reading tests, compared to their peers.
Only four out of 10 – 41 per cent – of disadvantaged 16-year-olds hoped to continue with their education after 16, compared with seven out of 10 – 71 per cent – of their more advantaged peers.
NOW... Nearly five decades on, there is no indication of the gap between advantaged and disadvantaged children at school disappearing. Today, a child from a disadvantaged, poorer background is still more likely to achieve a lower academic level than their peers.
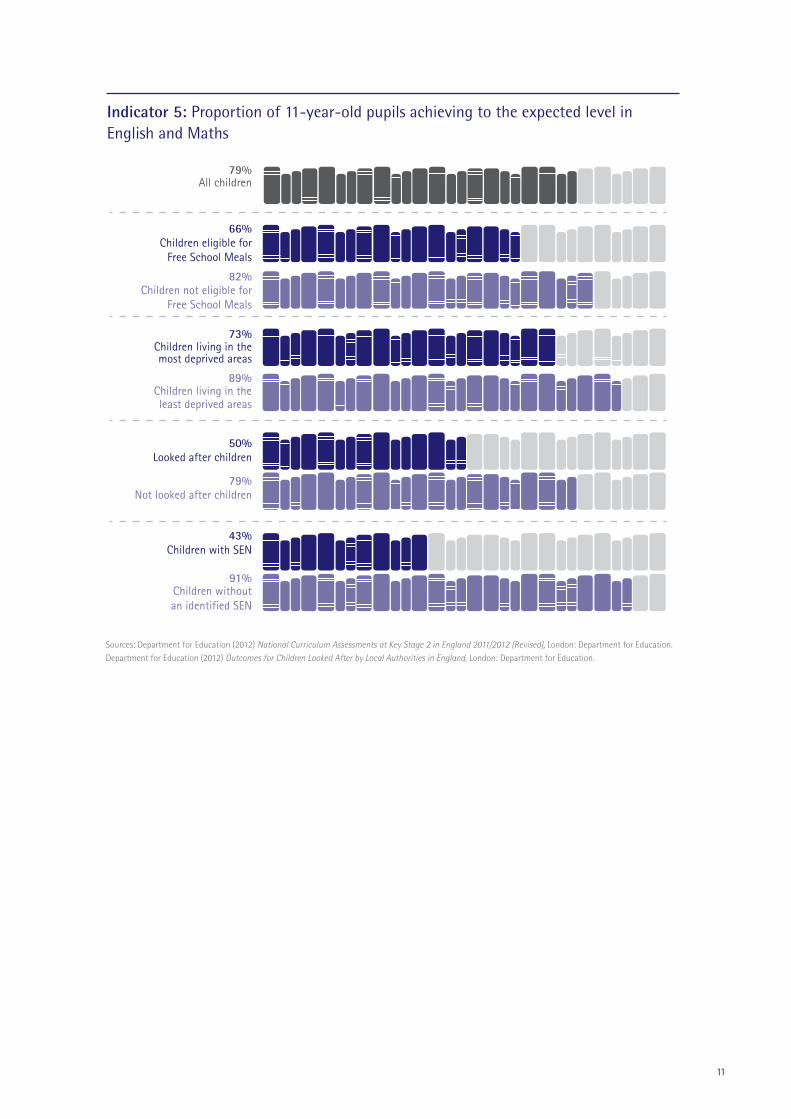
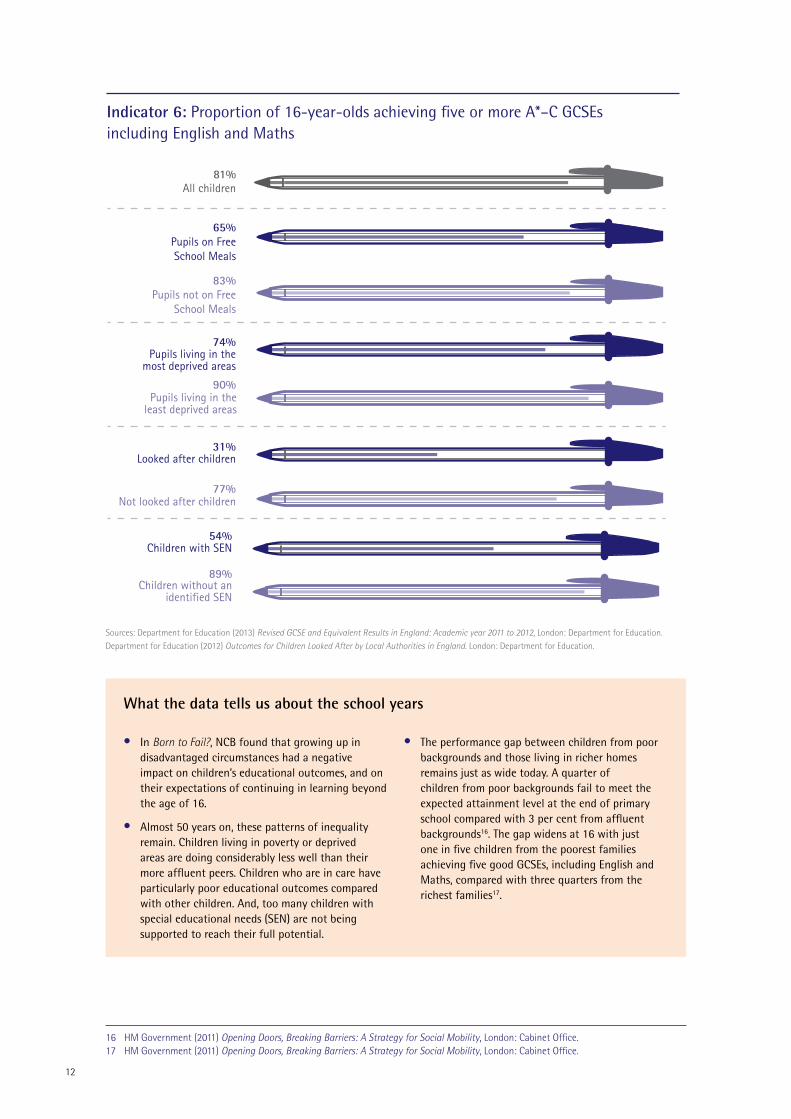
Although eighty per cent of 11 year olds achieve to the expected level in English and Maths, those children who are eligible for Free School Meals do not do as well with only 66 per cent achieving to the expected level. And the gap between the achievements of disadvantaged children and their peers continues at GCSE level, with far fewer achieving at least five A*–C grade GCSEs including English and Maths.
11
Indicator 5: Proportion of 11-year-old pupils achieving to the expected level in English and Maths
Children living in themost deprived areas
73%
79%All children
Children eligible forFree School Meals
66%
Children not eligible forFree School Meals
82%
Looked after children50%
Not looked after children79%
Children with SEN43%
Children withoutan identified SEN
91%
Children living in theleast deprived areas
89%
Sources: Department for Education (2012) National Curriculum Assessments at Key Stage 2 in England 2011/2012 (Revised), London: Department for Education. Department for Education (2012) Outcomes for Children Looked After by Local Authorities in England, London: Department for Education.
12
Indicator 6: Proportion of 16-year-olds achieving five or more A*–C GCSEs including English and Maths
81%All children
Pupils living in the most deprived areas
Pupils living in the least deprived areas
65%
83%
Pupils on FreeSchool Meals
74%
90%
Looked after children
Not looked after children
31%
77%
Children with SEN
Children without anidentified SEN
54%
89%
Pupils not on FreeSchool Meals
What the data tells us about the school years
• In Born to Fail?, NCB found that growing up in disadvantaged circumstances had a negative impact on children’s educational outcomes, and on their expectations of continuing in learning beyond the age of 16.
• Almost 50 years on, these patterns of inequality remain. Children living in poverty or deprived areas are doing considerably less well than their more affluent peers. Children who are in care have particularly poor educational outcomes compared with other children. And, too many children with special educational needs (SEN) are not being supported to reach their full potential.
• The performance gap between children from poor backgrounds and those living in richer homes remains just as wide today. A quarter of children from poor backgrounds fail to meet the expected attainment level at the end of primary school compared with 3 per cent from affluent backgrounds16. The gap widens at 16 with just one in five children from the poorest families achieving five good GCSEs, including English and Maths, compared with three quarters from the richest families17.
Sources: Department for Education (2013) Revised GCSE and Equivalent Results in England: Academic year 2011 to 2012, London: Department for Education. Department for Education (2012) Outcomes for Children Looked After by Local Authorities in England. London: Department for Education.
16 HM Government (2011) Opening Doors, Breaking Barriers: A Strategy for Social Mobility, London: Cabinet Office.17 HM Government (2011) Opening Doors, Breaking Barriers: A Strategy for Social Mobility, London: Cabinet Office.
13 Poor expectations: the impact of inequality and disadvantage on children
GETTInG a HEaLTHY START
18 Weighed 5.5 lb/2.5 kg or less.19 Marmot, M (2010) Fair Society, Healthy Lives: The Marmot review. Strategic review of health inequalities in England post-2010, London:
University College London.
THEN…
One in 11 – 9 per cent – of disadvantaged children was absent from school for one to three months due to illness, compared to one in 25 – 4 per cent – of their more advantaged peers.
One in 12 – 8 per cent – of disadvantaged children was born underweight18, which can have long-term negative effects on a child’s health and education, compared to one in 20 – 5 per cent – of their peers.
Children who were socially disadvantaged were less likely than their peers to have access to swimming baths or indoor play centres and clubs, and less likely to use those services even if they were available.
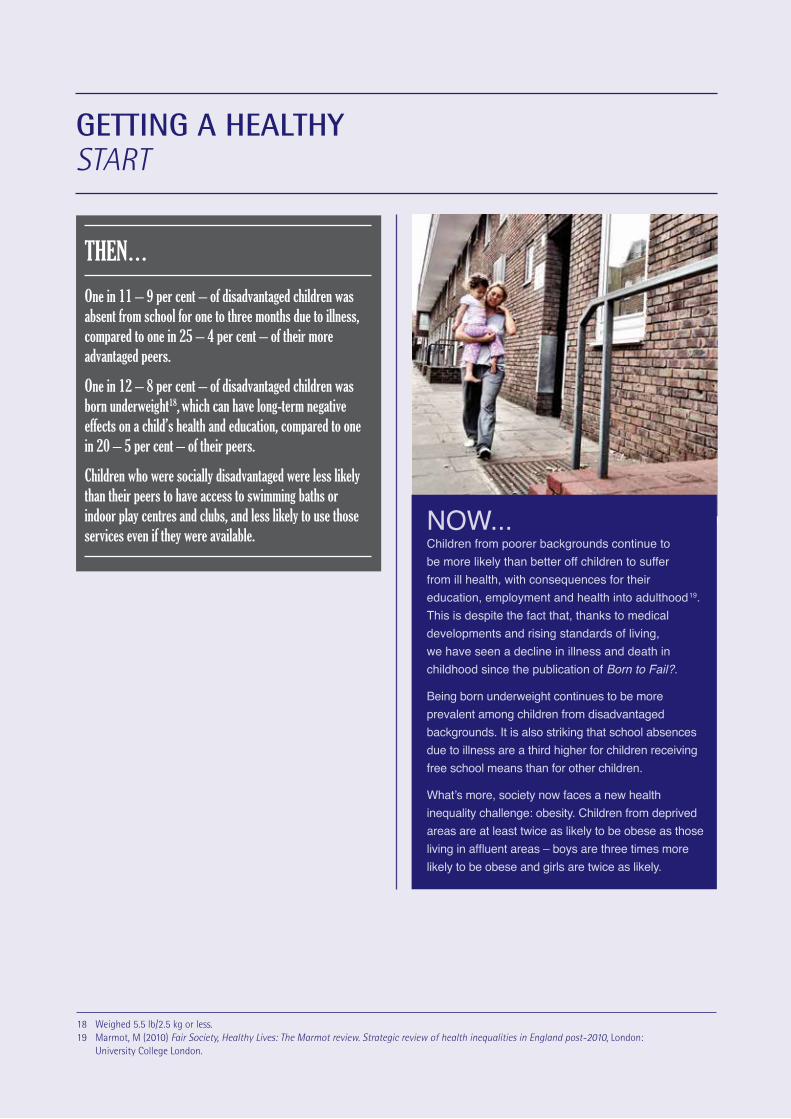
NOW... Children from poorer backgrounds continue to be more likely than better off children to suffer from ill health, with consequences for their education, employment and health into adulthood 19.This is despite the fact that, thanks to medical developments and rising standards of living, we have seen a decline in illness and death in childhood since the publication of Born to Fail?.
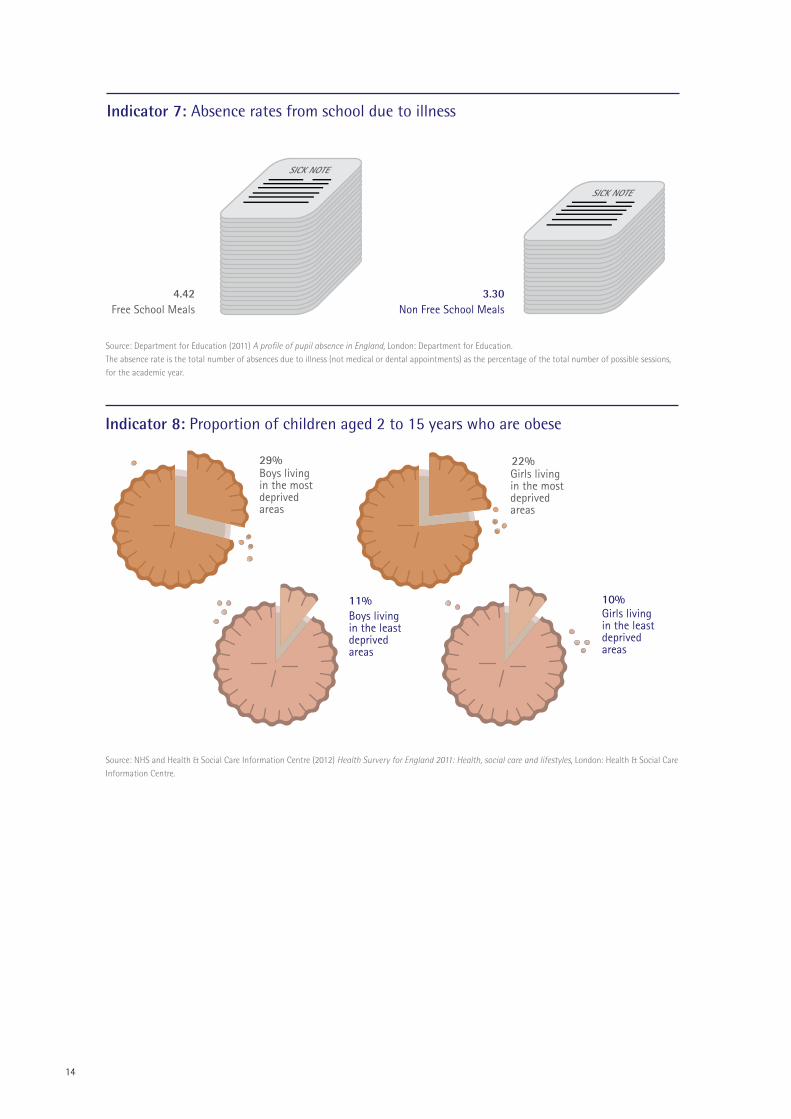
Being born underweight continues to be more prevalent among children from disadvantaged backgrounds. It is also striking that school absences due to illness are a third higher for children receiving free school means than for other children.
What’s more, society now faces a new health inequality challenge: obesity. Children from deprived areas are at least twice as likely to be obese as those living in affluent areas – boys are three times more likely to be obese and girls are twice as likely.
14
4.42Free School Meals
3.30Non Free School Meals
Boys living in the least deprived areas
Girls living in the most deprived areas
Girls living in the least deprived areas
Boys living in the most deprived areas
29%
11% 10%
22%
Indicator 7: Absence rates from school due to illness
Indicator 8: Proportion of children aged 2 to 15 years who are obese
Source: Department for Education (2011) A profile of pupil absence in England, London: Department for Education. The absence rate is the total number of absences due to illness (not medical or dental appointments) as the percentage of the total number of possible sessions, for the academic year.
Source: NHS and Health & Social Care Information Centre (2012) Health Survery for England 2011: Health, social care and lifestyles, London: Health & Social Care Information Centre.

15
8.2% 7.6%
Social classes 1–4(managerial, professional
and intermediate)
Social classes 5–8 (manual, routine and long-term
unemployed/never worked)
Indicator 9: Proportion of babies born with a low birth weight
What the data tells us about children getting a healthy start
• In his review of health inequalities, Michael Marmot found that ‘there is a social gradient in health – the lower a person’s social position, the worse his or her health20.’ These social inequalities affected children in Born to Fail? in 1969, and they are still having a significant an impact on children’s well-being today.
• Babies from lower socio-economic backgrounds are still more likely to be born underweight, which can have long-term effects on their health and learning – a pattern found in 1969.
• A new health inequality issue has arisen over the last 20 years, with a significant increase during the late 1990s and 2000s in the proportion of children and young people who are obese. Here, patterns of
disadvantage are also visible, with children living in more disadvantaged areas having higher rates of obesity – three times more boys and twice as many girls. Consequently they are more vulnerable to diseases such as diabetes.
• Today, a child’s socio-economic circumstances have an effect on some aspects of their health behaviour. For example, the more affluent school age children are, the more likely they are to eat fruit daily21 and, as set out in the next section, children living in more affluent areas have better access to play or leisure spaces than children in deprived areas.
20 Marmot, M (2010) Fair Society, Healthy Lives: The Marmot review. Strategic review of health inequalities in England post-2010, London: University College London.
21 WHO (2012) Health Behaviour in School-aged Children (HBSC) Study: International report from the 2009/2010 survey, Denmark: WHO.
Source: ONS (2013) Childhood, Infant and Perinatal Mortality in England and Wales, 2011, London: ONS.
16 Poor expectations: the impact of inequality and disadvantage on children
HOME anD THE NEIGHBOURHOOD
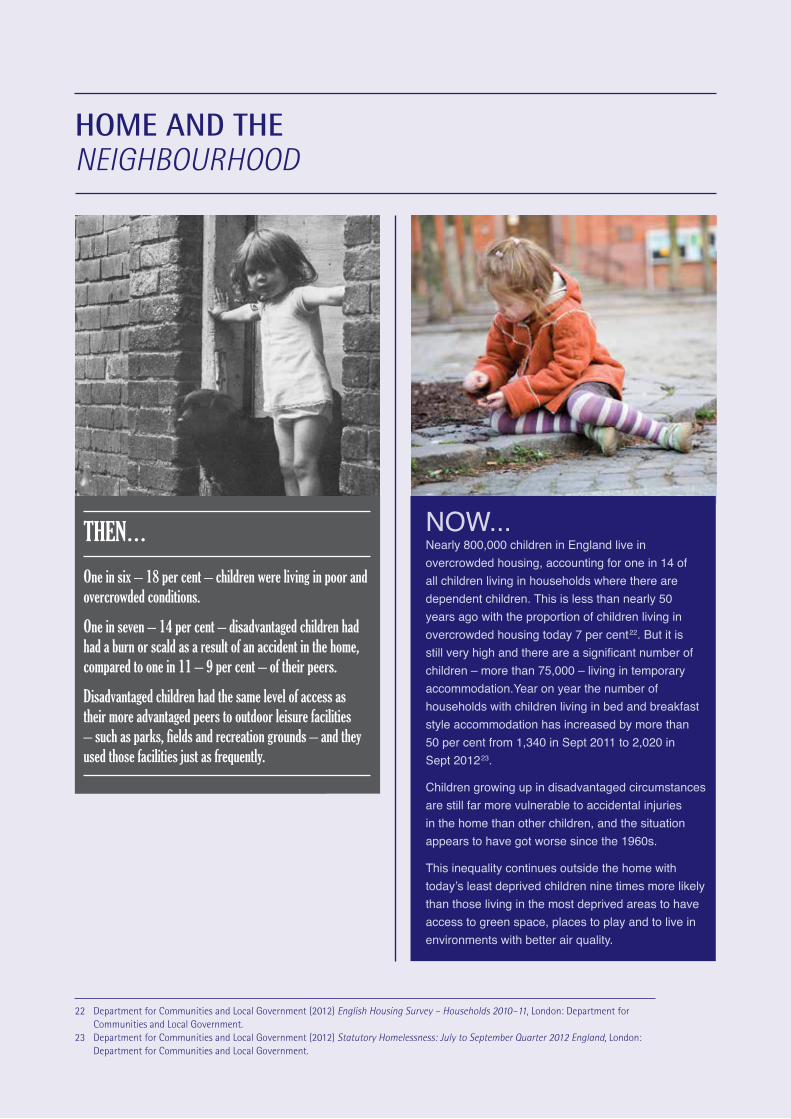
NOW... Nearly 800,000 children in England live in overcrowded housing, accounting for one in 14 of all children living in households where there are dependent children. This is less than nearly 50 years ago with the proportion of children living in overcrowded housing today 7 per cent 22. But it is still very high and there are a significant number of children – more than 75,000 – living in temporary accommodation.Year on year the number of households with children living in bed and breakfast style accommodation has increased by more than 50 per cent from 1,340 in Sept 2011 to 2,020 in Sept 2012 23.
Children growing up in disadvantaged circumstances are still far more vulnerable to accidental injuries in the home than other children, and the situation appears to have got worse since the 1960s.
This inequality continues outside the home with today’s least deprived children nine times more likely than those living in the most deprived areas to have access to green space, places to play and to live in environments with better air quality.
THEN…
One in six – 18 per cent – children were living in poor and overcrowded conditions.
One in seven – 14 per cent – disadvantaged children had had a burn or scald as a result of an accident in the home, compared to one in 11 – 9 per cent – of their peers.
Disadvantaged children had the same level of access as their more advantaged peers to outdoor leisure facilities – such as parks, fields and recreation grounds – and they used those facilities just as frequently.
22 Department for Communities and Local Government (2012) English Housing Survey – Households 2010 –11, London: Department for Communities and Local Government.
23 Department for Communities and Local Government (2012) Statutory Homelessness: July to September Quarter 2012 England, London: Department for Communities and Local Government.
17
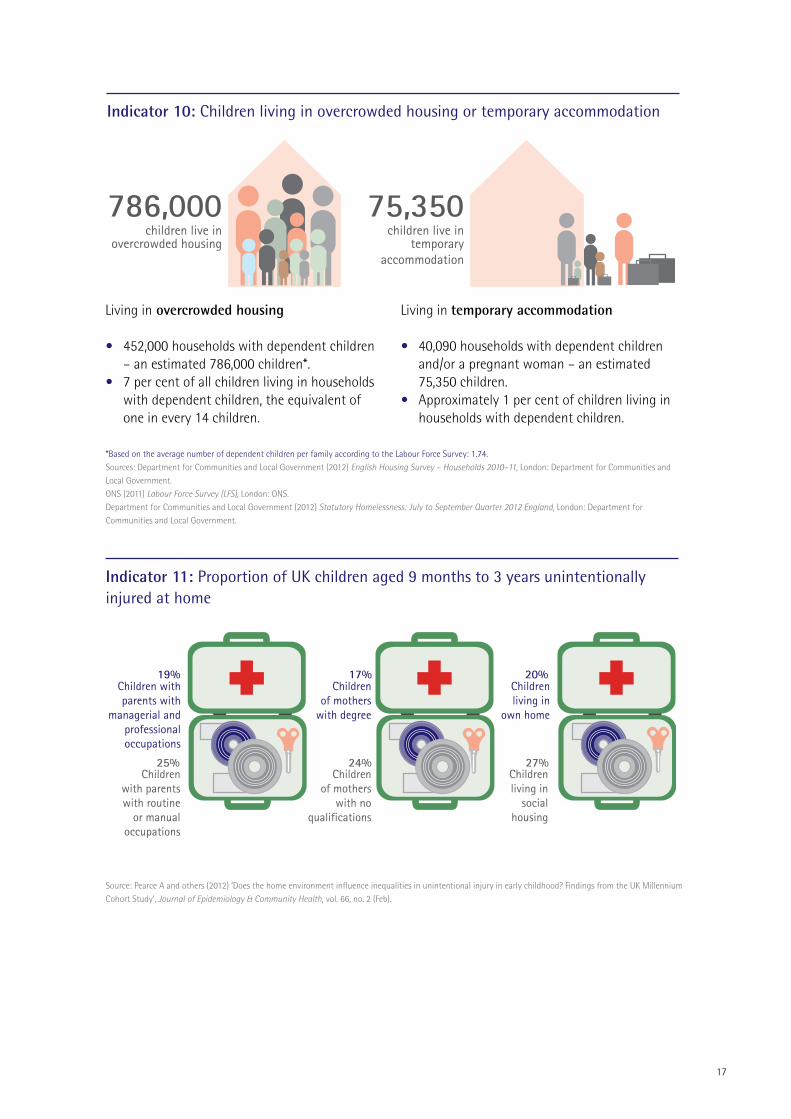
Living in overcrowded housing
• 452,000 households with dependent children – an estimated 786,000 children*.
• 7 per cent of all children living in households with dependent children, the equivalent of one in every 14 children.
Living in temporary accommodation
• 40,090 households with dependent children and/or a pregnant woman – an estimated 75,350 children.
• Approximately 1 per cent of children living in households with dependent children.
Indicator 10: Children living in overcrowded housing or temporary accommodation
75,350children live in
overcrowded housingchildren live in
temporaryaccommodation
786,000
Source: Pearce A and others (2012) ‘Does the home environment influence inequalities in unintentional injury in early childhood? Findings from the UK Millennium Cohort Study’, Journal of Epidemiology & Community Health, vol. 66, no. 2 (Feb).
*Based on the average number of dependent children per family according to the Labour Force Survey: 1.74. Sources: Department for Communities and Local Government (2012) English Housing Survey – Households 2010–11, London: Department for Communities and Local Government.ONS (2011) Labour Force Survey (LFS), London: ONS. Department for Communities and Local Government (2012) Statutory Homelessness: July to September Quarter 2012 England, London: Department for Communities and Local Government.
Indicator 11: Proportion of UK children aged 9 months to 3 years unintentionally injured at home
Childrenliving in
socialhousing
Childrenliving in
own home
Childrenof mothers
with degree
Childrenof mothers
with noqualifications
17%
Childrenwith parentswith routine
or manualoccupations
Children withparents with
managerial andprofessionaloccupations
24%
20%
27%
19%
25%

18
Source: Cited in Geddes, I and others (2011) The Marmot Review: Implications for spatial planning, UK: National Institute for Health and Care Excellence. Unfavourable environmental conditions include: poor housing, higher rates of crime, poorer air quality, lack of green spaces and places for children to play and more road traffic risks.
Indicator 12: Proportion of children reporting two or more unfavourable environmental conditions
5%Least deprived areas
45%Most deprived areas
24 Cited in Geddes, I and others (2011) The Marmot Review: Implications for spatial planning, UK: National Institute for Health and Care Excellence.
What the data tells us about housing and the neighbourhood
• Poor housing was used as a key indicator of disadvantage in the Born to Fail? study, in recognition of the negative effect of living in a cold, damp or overcrowded home on children’s life chances. Almost 50 years on, 7 per cent of children – one in 14 – are still growing up in overcrowded housing conditions, having a detrimental impact on their education, health and well-being.
• Today, official data shows a significant increase in numbers of children living in temporary accommodation, including in bed and breakfast arrangements, which are disruptive and potentially unsafe for a child. Households with children make up 76 per cent of all households in temporary accommodation. It is possible that we will see this trend continue, as the effect of changes to housing benefits hit poor families.
• Disadvantaged children in Born to Fail? were more likely than their peers to be burned, scalded or
injured as a result of an accident at home. These inequalities persist and appear to be even greater. Children from more disadvantaged backgrounds are far more likely than their peers to be injured in the home.
• Having access to good local environments, such as parks and green spaces, is a far greater challenge for children today, compared with children growing up in the late 1960s. In Born to Fail?, disadvantaged children had the same level of access as their peers to outdoor leisure facilities. However, environmental inequality is a real challenge for children today – with children living in the most deprived areas much more likely than those living in the least deprived to report two or more unfavourable environmental conditions24.
19
PaRT TWO Could we be doing better for our children? How we compare to other countries
In Part One of the report, we showed that the inequalities affecting children in 1969, are still entrenched today. Unacceptable numbers of children and young people continue to live in poverty and deprivation, and growing up in these circumstances continues to put children at a serious disadvantage in terms of their early development, educational and health outcomes, and experiences of the home and local neighbourhood.
Could we be doing better for our children? This chapter compares children’s outcomes in the UK or England with those of children in other industrialised countries, to assess whether we could be doing more to improve the experiences and life chances of our children. It shows that the UK is performing well in some areas of children’s lives – for example we have high levels of enrolment in early education and above average literacy rates. However, in other areas – poverty, health, the home and neighbourhood – we are only average or doing worse than other countries. It is of particular note that a higher proportion of young children in the UK live in poor environmental conditions compared to other countries 25.
If we were doing as well as those countries that are outperforming us:
• almost 1 million children in the UK would not be living in poverty• 172 children would not die each year due to unintentional injury – 14 lives
would be saved each month• 166,700 more 15–19-year-old males – nearly 10 per cent more – and
152,500 more 15–19-year-old females – 8 per cent more – would be in education and training
• nearly 27,000 fewer babies would be born underweight, improving their chances of being healthier in childhood and doing well at school – 3 per cent of all babies born each year
• 26,300 fewer 11-year-old girls – one in 10 of all girls that age – and 18,400 fewer 11 year old boys – one in 16 of all boys – would be obese, putting them at decreased risk of developing long-term health problems such as diabetes
• 88,000 fewer 11-year-old girls and 101,000 fewer 11-year-old boys – around a third of all children of that age – would be drinking sugary drinks daily
• 32,000 more 11-year-old girls and 31,000 more 11-year-old boys – one in 10 of children that age – would be taking daily moderate to vigorous physical activity
• 770,400 fewer children under 5 would be living in poor environmental conditions – nearly one in five of all children that age.
25 Defined by the OECD as children living in noisy areas affected by dirt, grime, pollution or litter.
20
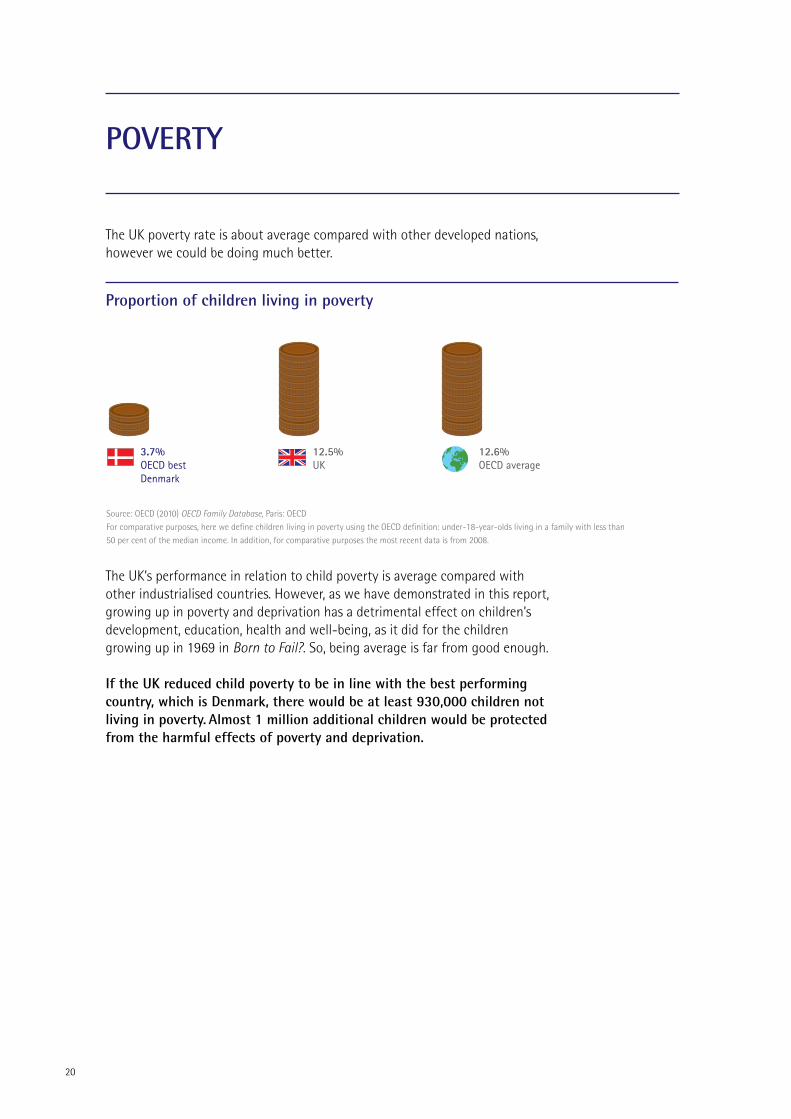
The UK poverty rate is about average compared with other developed nations, however we could be doing much better.
The UK’s performance in relation to child poverty is average compared with other industrialised countries. However, as we have demonstrated in this report, growing up in poverty and deprivation has a detrimental effect on children’s development, education, health and well-being, as it did for the children growing up in 1969 in Born to Fail?. So, being average is far from good enough.
If the UK reduced child poverty to be in line with the best performing country, which is Denmark, there would be at least 930,000 children not living in poverty. almost 1 million additional children would be protected from the harmful effects of poverty and deprivation.
3.7%OECD bestDenmark
UK12.5%
OECD average12.6%
Proportion of children living in poverty
POVERTY
Source: OECD (2010) OECD Family Database, Paris: OECDFor comparative purposes, here we define children living in poverty using the OECD definition: under-18-year-olds living in a family with less than 50 per cent of the median income. In addition, for comparative purposes the most recent data is from 2008.
21
65%OECD best
Denmark
UK41%
OECD average30%
Enrolment rates at three in 2009:
100%OECD bestFrance and
Belgium
UK80%
OECD average63%
65%OECD best
Denmark
UK41%
OECD average30%
Enrolment rates at three in 2009:
100%OECD bestFrance and
Belgium
UK80%
OECD average63%
Enrolment rates for children under 3
Enrolment rates for children aged 3
The UK is doing relatively well compared to other countries in relation to enrolment in early education, with higher enrolment rates than average. However, compared with some other European countries, we could be doing even better.
While the UK has above average levels of participation in early education, according to the most recent available comparative international data we are not doing as well as the best performing countries – France, Belgium and Denmark. If we were performing as well as these countries, 300,000 more young children under 3 – a quarter of all children of that age – would be accessing services to help them develop well.
However it is important to note that the proportion of under-3s in early education in England is set to increase substantially with more than 250,000 2-year-olds entitled to free early education under the coalition government’s childcare reforms. In addition as shown in part one of the report in England latest figures show more than 90 per cent of 3-year-olds now attend some early education.
EaRLY YEaRS
Source: OECD (2012) Quality Matters in Early Childhood Education and Care: United Kingdom (England) 2012, London: OECD Publishing.
Source: OECD (2012) Quality Matters in Early Childhood Education and Care: United Kingdom (England) 2012, London: OECD Publishing.
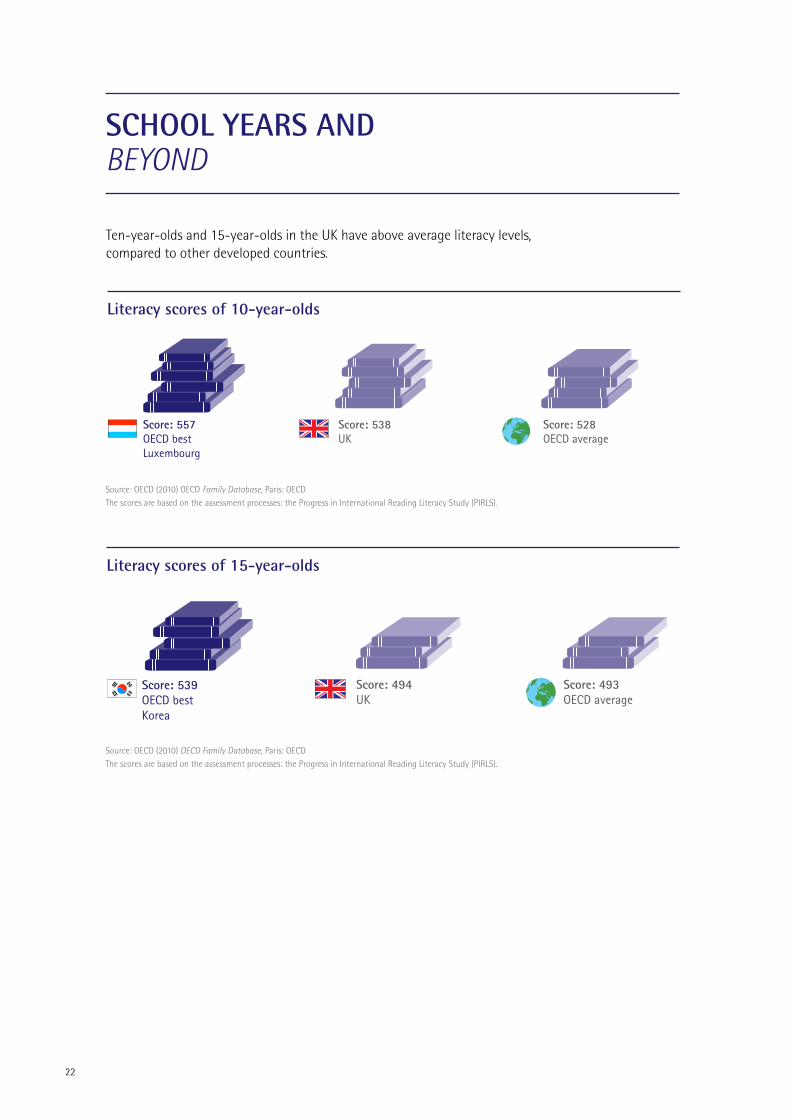
Ten-year-olds and 15-year-olds in the UK have above average literacy levels, compared to other developed countries.
Score: 557OECD bestLuxembourg
UKScore: 538
OECD average Score: 528
Score: 539OECD bestKorea
UKScore: 494
OECD average Score: 493
Score: 557OECD bestLuxembourg
UKScore: 538
OECD average Score: 528
Score: 539OECD bestKorea
UKScore: 494
OECD average Score: 493
Literacy scores of 10-year-olds
Literacy scores of 15-year-olds
SCHOOL YEaRS anD BEYOND
Source: OECD (2010) OECD Family Database, Paris: OECD The scores are based on the assessment processes: the Progress in International Reading Literacy Study (PIRLS).
Source: OECD (2010) OECD Family Database, Paris: OECD The scores are based on the assessment processes: the Progress in International Reading Literacy Study (PIRLS).
22
23
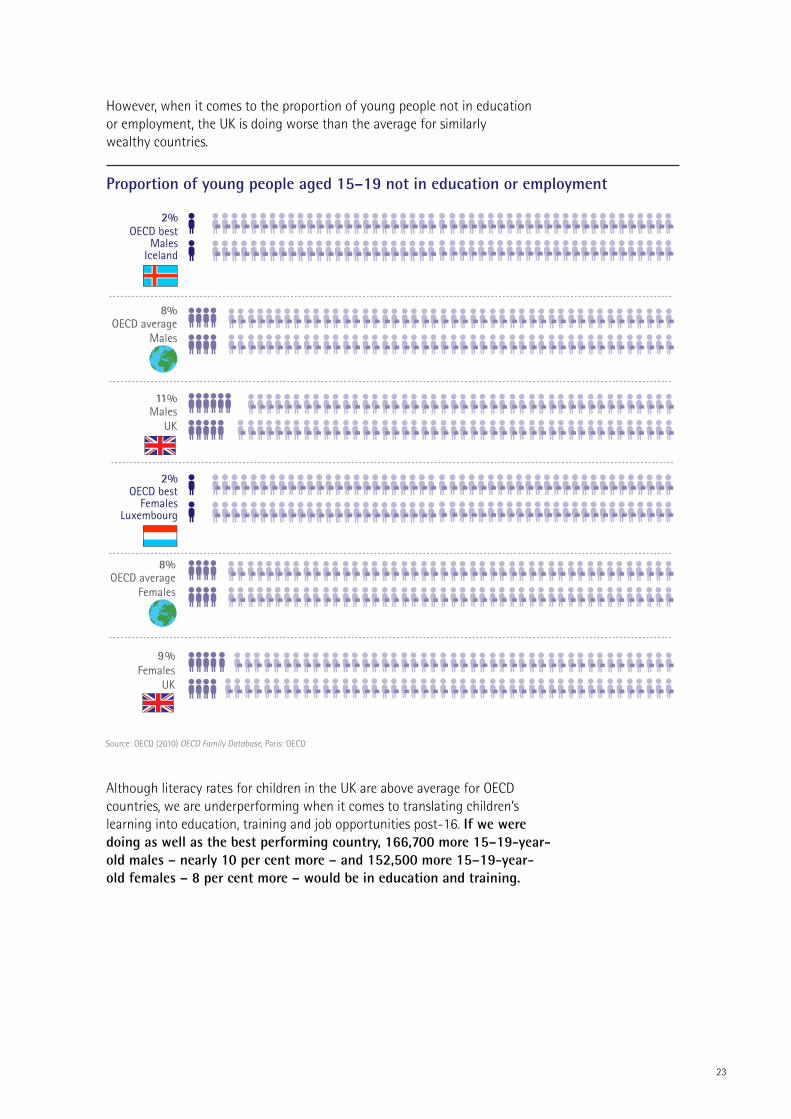
However, when it comes to the proportion of young people not in education or employment, the UK is doing worse than the average for similarly wealthy countries.
Although literacy rates for children in the UK are above average for OECD countries, we are underperforming when it comes to translating children’s learning into education, training and job opportunities post-16. If we were doing as well as the best performing country, 166,700 more 15–19-year-old males – nearly 10 per cent more – and 152,500 more 15–19-year-old females – 8 per cent more – would be in education and training.
OECD bestMales
Iceland
2%
OECD bestFemales
Luxembourg
2%
8%OECD average
Males
11%Males
UK
8%OECD average
Females
9 %Females
UK
Proportion of young people aged 15–19 not in education or employment
Source: OECD (2010) OECD Family Database, Paris: OECD
24
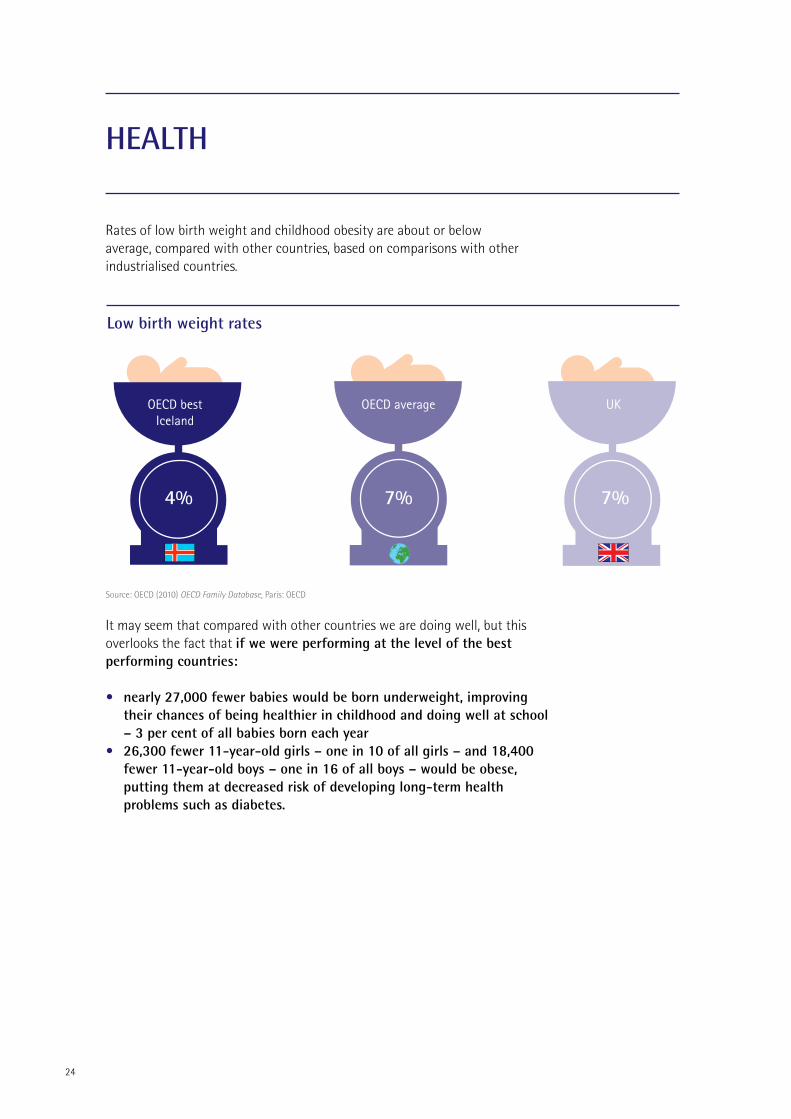
Rates of low birth weight and childhood obesity are about or below average, compared with other countries, based on comparisons with other industrialised countries.
It may seem that compared with other countries we are doing well, but this overlooks the fact that if we were performing at the level of the best performing countries:
• nearly 27,000 fewer babies would be born underweight, improving their chances of being healthier in childhood and doing well at school – 3 per cent of all babies born each year
• 26,300 fewer 11-year-old girls – one in 10 of all girls – and 18,400 fewer 11-year-old boys – one in 16 of all boys – would be obese, putting them at decreased risk of developing long-term health problems such as diabetes.
Low birth weight rates
HEaLTH
Source: OECD (2010) OECD Family Database, Paris: OECD
7%
7% 4%
OECD bestIceland
OECD average UK
25
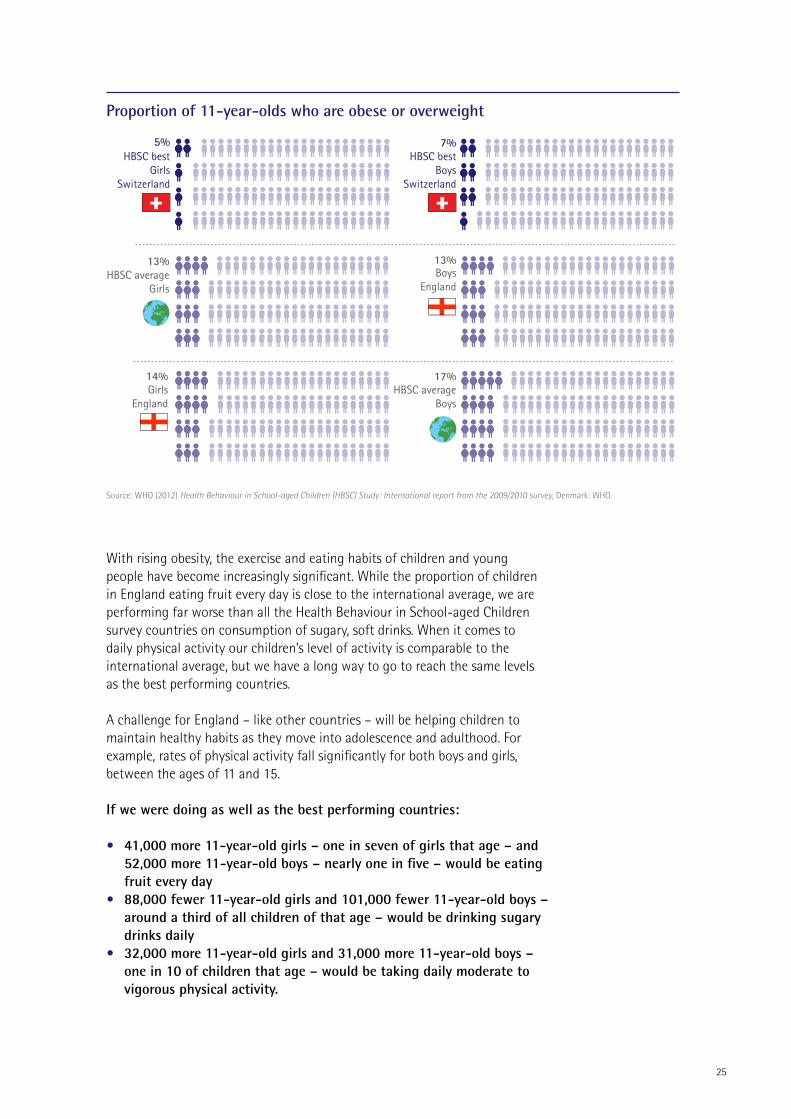
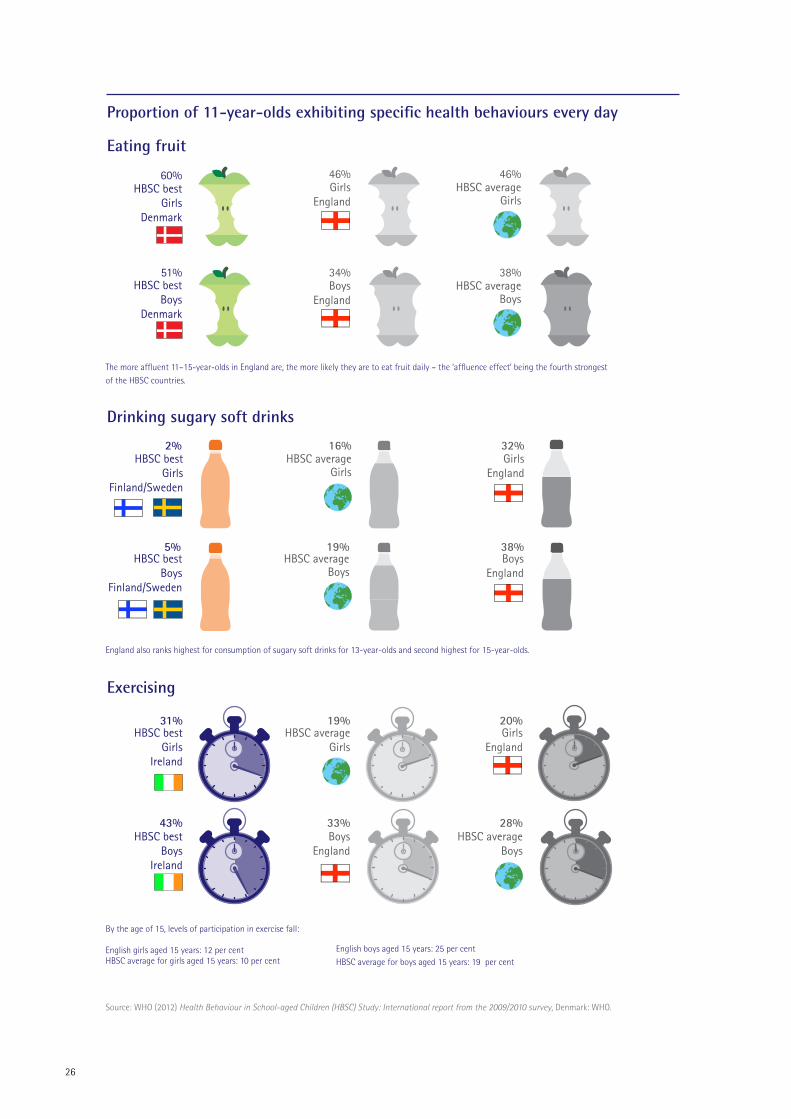
With rising obesity, the exercise and eating habits of children and young people have become increasingly significant. While the proportion of children in England eating fruit every day is close to the international average, we are performing far worse than all the Health Behaviour in School-aged Children survey countries on consumption of sugary, soft drinks. When it comes to daily physical activity our children’s level of activity is comparable to the international average, but we have a long way to go to reach the same levels as the best performing countries.
A challenge for England – like other countries – will be helping children to maintain healthy habits as they move into adolescence and adulthood. For example, rates of physical activity fall significantly for both boys and girls, between the ages of 11 and 15.
If we were doing as well as the best performing countries:
• 41,000 more 11-year-old girls – one in seven of girls that age – and 52,000 more 11-year-old boys – nearly one in five – would be eating fruit every day
• 88,000 fewer 11-year-old girls and 101,000 fewer 11-year-old boys – around a third of all children of that age – would be drinking sugary drinks daily
• 32,000 more 11-year-old girls and 31,000 more 11-year-old boys – one in 10 of children that age – would be taking daily moderate to vigorous physical activity.
Proportion of 11-year-olds who are obese or overweight
BoysEngland
17%HBSC average
Boys
HBSC bestBoys
Switzerland
13%
7%
GirlsEngland
13%HBSC average
Girls
HBSC bestGirls
Switzerland
14%
5%
Source: WHO (2012) Health Behaviour in School-aged Children (HBSC) Study: International report from the 2009/2010 survey, Denmark: WHO.
26
Proportion of 11-year-olds exhibiting specific health behaviours every day
46%Girls
England
46%HBSC average
Girls
60%HBSC best
GirlsDenmark
HBSC bestBoys
Denmark
34%Boys
England
38%HBSC average
Boys
51%
32%Girls
England
16%HBSC average
Girls
2%HBSC best
GirlsFinland/Sweden
38%Boys
England
19%HBSC average
Boys
5%HBSC best
BoysFinland/Sweden
20%Girls
England
19%HBSC average
Girls
28%HBSC average
Boys
31%HBSC best
GirlsIreland
33%Boys
England
43%HBSC best
BoysIreland
Eating fruit
Drinking sugary soft drinks
Exercising
The more affluent 11–15-year-olds in England are, the more likely they are to eat fruit daily – the ‘affluence effect’ being the fourth strongest of the HBSC countries.
England also ranks highest for consumption of sugary soft drinks for 13-year-olds and second highest for 15-year-olds.
By the age of 15, levels of participation in exercise fall: English girls aged 15 years: 12 per cent HBSC average for girls aged 15 years: 10 per cent
English boys aged 15 years: 25 per cent HBSC average for boys aged 15 years: 19 per cent
Source: WHO (2012) Health Behaviour in School-aged Children (HBSC) Study: International report from the 2009/2010 survey, Denmark: WHO.

27
The UK has the seventh lowest rate of child death (aged 0–19) due to unintentional injury, compared to the 38 countries in the World Health Organisation European region.
If the UK had the lowest rate of child death due to unintentional injuries, which would mean we were doing as well as the netherlands, 172 children would not die each year. In other words, 14 children’s lives would be saved each month.
Children in the UK are far more likely to live in poor environmental conditions (including noise, pollution, grime and traffic), compared to the average for developed OECD nations.
If we were doing as well as the best country, 770,400 fewer 0–5-year-old children would be growing up under these conditions – nearly one in five of all children that age. Proportion of children aged 0-5 living in poor environmental conditions
14%OECD bestNorway
OECD average25%
UK31%
6 deaths per 100,000WHO best Netherlands
UK
7.5 deaths per 100,000
18.4 deaths per 100,000WHO European average
Proportion of children aged 0–5 living in poor environmental conditions
number of child deaths due to unintentional injury
HOME anD THE NEIGHBOURHOOD
Source: OECD (2012) Quality Matters in Early Childhood Education and Care: United Kingdom (England) 2012, London: OECD Publishing.
Source: WHO (2008) European Report on Child Injury Prevention, Denmark: WHO.
Conclusion and key findings
Nearly 50 years on from the publication of the National Children’s Bureau’s ground breaking study, Born to Fail?, this report has sought to establish whether fundamental inequalities in childhood still persist today. In 21st- century Britain, are children who live in poverty and face disadvantage still ‘born to fail’, or have we made significant progress in tackling this inequality? The report has also looked at how we compare to other industrialised countries and based on this comparison considered if we could be doing better to improve the experiences and life chances of our children, regardless of their circumstances. Should we have greater expectations for our country to be the best place in world for all children to grow up?
In Born to Fail?, NCB found that disadvantaged children growing up in the late 1960s were more likely than their peers to live in poor conditions, suffer from poor health, struggle at school and experience a range of worse outcomes. They were more likely than their peers to be born underweight, to miss school due to ill health and to be accidentally injured at home. Similar inequalities were identified in terms of children’s development and schooling, with disadvantaged children less likely than their peers to do well in reading and maths.
Disadvantaged children todayToday, although there have been some improvements, overall the situation appears to be no better, and in some respects has got worse. Children from disadvantaged backgrounds continue to be much worse off than their peers.
• Poverty – In 1969 2 million children were living in poverty. Today, this figure has risen substantially to 3.5 million, despite being a wealthier nation with a higher standard of living. This shows that unacceptable numbers of children continue to grow up in impoverished circumstances.
• Early years – Today many more children from all backgrounds attend some early education as a result of policies by the current coaliton government and previous Labour government to extend access to free early education. However, young children from poorer backgrounds are less likely to develop well by the age of four than their more affluent peers.
• School years and beyond – In 1969 NCB found that growing up in disadvantaged circumstances had a negative impact on children’s educational outcomes, and on their expectations of continuing in learning beyond the age of 16. Almost 50 years on, these patterns of inequality remain. A child from a disadvantaged poor background is far less likely to do well at school age 11 and far less likely to do well in their GCSEs at 16 compared with a child from the most well-off backgrounds and there is no indication that this gap between advantaged and disadvantaged children is disappearing.
• Health – Health inequalities still exist today and with the rise of obesity are arguably getting worse. Babies from lower socio-economic backgrounds continue to be more likely to be born underweight, which can have long-term effects on their health and learning. And there is now the relatively new but very significant health inequality issue of obesity. Boys living in
28

29
deprived areas are three times more likely to be obese than boys growing up in wealthy areas and girls are twice as likely, which has serious consequences for their long-term health as they are more vulnerable to diseases such as diabetes.
• Home – Today there are fewer children living in poor quality overcrowded housing, which is an improvement compared to 1969. However, the numbers are still very high. Nearly 800,000 children – the equivalent of the number of children in 800 secondary schools – live in overcrowded conditions and the most recent data shows a worrying rise in the number of children living in temporary accommodation, such as bed and breakfast. Nearly 50 years ago disadvantaged children were more likely than their peers to be burned, scalded or injured as a result of an accident at home. These inequalities persist and appear to be even greater. Children from more disadvantaged backgrounds are far more likely to suffer accidental injuries at home than other children.
• Neighbourhood – Having access to good local environments, such as parks and green spaces, is a far greater challenge for children today, compared with children growing up in the late 1960s. In 1969 disadvantaged children had the same level of access as their peers to outdoor leisure facilities. However, this is not the case today. Children living in the least deprived areas are nine times more likely than those living in the most deprived areas to enjoy good local environments for play and recreation.
We should have greater expectationsOverall it is clear that the inequality and disadvantage that existed nearly 50 years ago persists today. It is of particular concern that children’s health inequalities today are no less serious, and with the rise of obesity are getting worse. A baby born to parents of low socio-economic status is more likely to be underweight, having long-term implications for that child’s health and education. Childhood obesity has risen significantly over the last 20 years, and patterns of obesity reflect the inequalities identified for low birth weight, with poorer children far more likely to be obese.
It is also startling that when looking at the home and neighbourhood environment children from poorer backgrounds are still much worse off and compared to nearly 50 years ago their predicament seems to have got even worse. The chances of disadvantaged children being burned, scalded or injured as a result of an accident in the home seem to be greater today. And children living in poorer neighbourhoods do not have access to parks and green spaces in the same way as they did in 1969. This is of particular concern given the higher rates of obesity amongst more disadvantaged children.
Clearly, we could be doing better for our children. This is particularly stark when comparisons are made with other countries. The UK is performing well in some areas of children’s lives – for example we have high levels of enrolment in early education and above average literacy rates.
30
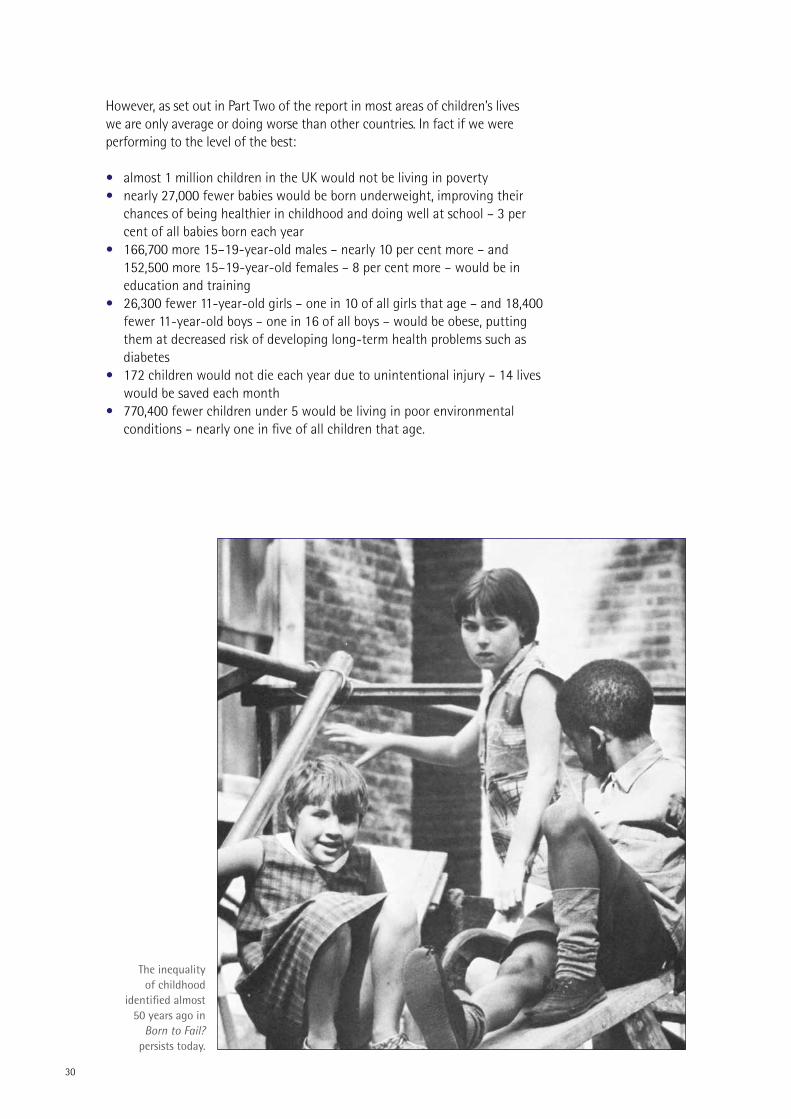
However, as set out in Part Two of the report in most areas of children’s lives we are only average or doing worse than other countries. In fact if we were performing to the level of the best:
• almost 1 million children in the UK would not be living in poverty• nearly 27,000 fewer babies would be born underweight, improving their
chances of being healthier in childhood and doing well at school – 3 per cent of all babies born each year
• 166,700 more 15–19-year-old males – nearly 10 per cent more – and 152,500 more 15–19-year-old females – 8 per cent more – would be in education and training
• 26,300 fewer 11-year-old girls – one in 10 of all girls that age – and 18,400 fewer 11-year-old boys – one in 16 of all boys – would be obese, putting them at decreased risk of developing long-term health problems such as diabetes
• 172 children would not die each year due to unintentional injury – 14 lives would be saved each month
• 770,400 fewer children under 5 would be living in poor environmental conditions – nearly one in five of all children that age.
The inequality of childhood
identified almost 50 years ago in
Born to Fail? persists today.

31
What needs to change?
The data presented in this report powerfully demonstrates that we should be doing far better for our children, and highlights the many areas where improvements could be made. It raises a serious question about whether or not we have the highest aspirations for the nation’s children. We should certainly aspire for the UK to be the best place in the world for children to grow up. Yet this is far from the case at the moment.
The report’s findings also raise a number of fundamental questions about how as a nation we support our children. Do we want every child to have the same life chances regardless of their parents’ means? Does it matter if childhood is so unequal and the experiences of growing up for children are so polarised? As one of the richest nations on earth should we have greater expectations and higher aspirations for our children?
The fact that the poverty and inequality experienced by our children remains just as prevalent today as it did nearly 50 years ago must not be ignored. And with cuts to services and welfare benefits now taking hold those children living in low income families are set to experience even greater hardship and the gap between them and others is set to grow even wider.
There is a real risk of sleepwalking into a world where inequality becomes so entrenched that our children grow up in a state of social apartheid. This would be a society in which children’s lives are so polarised that rich and poor live in separate, parallel worlds, and we tacitly accept that some children are simply destined to experience hardship and disadvantage by accident of birth.
A country in which children live in a state of social apartheid clearly matters on grounds of social justice. If children are born to fail as a result of the poverty they grow up in it is grossly unfair. They should have the opportunity to fulfil their potential regardless of their circumstances. It is also matters because it has implications for social cohesion. Inequality breeds distrust, fear and anger. It creates a ‘them and us’ society with far greater tensions. The riots of the summer of 2011 were a warning of how easily these tensions can spiral out of control. But there are economic reasons too for why we should be concerned about this situation for our children. Quite simply, we cannot afford so many of the nation’s future generation to be cut adrift, adding to the welfare bill and allowing desperately needed talents to be unfulfilled.

32
Immediate government actionThe government needs to put tackling child poverty and reducing inequality at the heart of its agenda for change. The Prime Minister and the Deputy Prime Minister should make a joint political commitment to not simply improve social mobility, which the government says is the principal goal of its current social policy26, but to address the inequality gap between rich and poor that is damaging the lives of too many children. Resources need to not only be directed to those from disadvantaged backgrounds, through policies such as the pupil premium, but also on reducing inequality itself. It is not sufficient to seek to improve the lives of those living on lowest incomes. The gap between those at the top and bottom must be narrowed.
Instead of adopting a series of small-scale, tightly focused policy initiatives there needs to be an ambitious cross-government strategy. To drive this forward there should be a central government Children and Young People’s Board with full ministerial representation. This Board should develop and implement a genuinely cross-government multidimensional strategy to reduce the inequality and disadvantage children and young people face, and to hold all government departments to account for delivery against key milestones. The strategy needs to be wide ranging to address the various policy challenges set out in this report. In particular it needs to focus on the health inequalities children face and the poor home and neighbourhood environments that blight the lives of disadvantaged children.
Equally important is a recognition that when it comes to disadvantaged children public policy and funding in this country is imbalanced. The government made a commitment to protect pensioner benefits but there has been no equivalent commitment to protect children living in the poorest families or to tackle child poverty. The evidence suggests that child poverty will worsen as a result of benefit cuts – for example the government has itself estimated that a further 200,000 children will move into poverty as a result of its decision to increase certain family benefits by 1 per cent per year for the next three years, rather than in line with the cost of living27. One way to address this imbalance would be for the independent Office for Budget Responsibility to disclose the impact each Budget would have on child poverty and inequality in the report it publishes alongside the Chancellor’s annual statement.
Fundamental change in politics and civil societyThis is a critical moment of opportunity – and a time of real risk. With continuing economic pressures, we are likely to see childhood inequalities grow. Government has a major part to play in leading the way to address this. However, there must be a wider national mobilisation of efforts and resources led by politicians from every party and involving charities, businesses and communities all playing a part in having greater expectations for our children.
Our politicians need to set the tone by having much greater expectations about what they can do. When he was leader of the opposition in 2008 David
26 HM Government (2011) Opening Doors, Breaking Barriers: A strategy for social mobility, London: Cabinet Office.27 Hansard, House of Commons Official Report, 15 January 2013, vol.556 no.96, col. 715W.
33
Cameron stated that ‘we all know in our hearts that creating a good society for children to grow up in is one of the greatest tests of any nation’s character’ and that ‘we really can make this country the best place in the world for children to grow up28’. Today this message has been lost. All political parties must be far more ambitious about raising standards so that outcomes for all children in England and the UK are equal to, if not better than, those countries who are doing the best.
At the next general election, each political party should set out in their manifesto the full range of measures they will take to improve the lives of children and young people, reducing inequality in the key areas set out in this report.
However, as vital as this political commitment is, it must be underpinned by fundamental changes to the way in which politicians and civil society function to ensure that activity to reduce inequality for children and young people continues until real, sustainable change is made.
One way to achieve this would be for Parliament and civil society to establish a common set of indicators that are used as a matrix to hold government to account for what it is doing to address the inequalities and disadvantage that children face. Part One of the report set out 12 indicators that provide the starting point for the establishment of such an indicator set. It would be a means for Parliament and civil society to annually hold government to account and also provide the basis for a shared vision of what we want to achieve for all our children.
Overall a collective endeavour is required to tackle the persistent poverty and inequality that has created a nation where unequal childhoods have become a permanent feature. Unless action is taken the danger is that in the next 50 years social apartheid will become a fact of life for every generation of children.
28 David Cameron: Making Britain the best place in the world for children to grow up’, 4 February 2008, The Conservative Party.
In 1969, shortly after the National Children’s Bureau was founded, it conducted a major study looking at the experiences of children
from poor, disadvantaged backgrounds. Born to Fail? revealed how growing up in these circumstances damaged children’s lives resulting in poor health, underachievement at school and lack
of opportunities to fulfil their potential.
Nearly 50 years on, this report examines 12 key indicators to determine whether children in this country are still experiencing inequality and disadvantage. Greater Expectations shows that far from improving over time, the situation today appears to be no
better than it was nearly five decades ago.
It also makes comparisons with other industrialised countries and asks if we could be doing better – should we have greater expectations to be the best place in the world for all children
to grow up regardless of their circumstances?
Greater Expectations Raising aspirations for our children
@ncbtweets www.facebook.com/ncbfb www.ncb.org.uk/greaterexpectations