greater halifax distribution study - halifax gateway
TRANSCRIPT

Final Report Greater Halifax Distribution Study
Presented to Greater Halifax Partnership
and Halifax Port Authority
by ©MariNova Consulting Ltd.
March 2004

Greater Halifax Distribution Study
i
Table of Contents
Executive Summary ii
1.0 Background 1 2.0 Introduction to Distribution Centres 3 3.0 Case Studies of Canadian Importers and Retailers 11 4.0 U.S. Case Studies 28 5.0 Halifax Trade Patterns 37 6.0 Prospects for 3PLs and Logistics Service Providers 49 7.0 Value Added Service and Non-Containerized Cargo 59 8.0 Port Case Study 76 9.0 Location Cost Comparison 80 10.0 Conclusions and Recommendations 83 List of Contacts 86 Appendices 87
MariNova Consulting Ltd. March 2004
Greater Halifax Distribution Study
ii
Executive Summary In September 2002, The Halifax Port Authority initiated its SmartPort Strategic Planning initiative. Out of the first session, it was decided to focus on five key issues: 1) Marketing and Strategy; 2) Productivity and Competitiveness; 3) IT / E-Commerce; 4) Value added / Distribution; 5) Security. The port's subsequent Container Growth Strategy identified the fourth item as one of the keys to future growth. Atlantic Canada only has a population of 2.4 million people, of whom 650,000 live within two hours of the Port of Halifax. However, Tthe port's hinterland now comprises Atlantic Canada, Quebec, Ontario, the U.S. mid-west and New England. Distribution activity, tends to serve the needs of the immediate region. The port's location on the Great Circle Route and its function as a lightening and topping off port for vessels on the way to or from New York, provides it and the immediate region with a myriad of shipping services to and from many world-wide destinations. Can this location and these services be leveraged to enhance the port's and the Halifax-Moncton Corridor's role as a North American distribution centre? Can niche freight or logistics fulfillment be linked to regional strengths in call centre/customer solution centres building on existing telecom and human resource capabilities/capacities? The United States has, in the past few decades, seen continued growth of large manufacturing and retail distribution centres in port cities such as Savannah and Norfolk, and in areas that are well-connected and thereby suitable locations to connect the regional and national wholesale and retail outlets. The choice of location for DCs can be based on many factors, most notably:
Proximity to transportation infrastructure (by sea, truck, and rail); Proximity to suitable, skilled workforce; Proximity to related manufacturing and wholesale/retail outlets (linking manufacturing
with distribution); The presence of locating and expansion incentives (income and property tax incentives,
land grants, government subsidies); The presence of industry clusters (companies in similar industries who share knowledge,
information, inputs, etc – often in the high-tech sector); Favorable business conditions (tax rates, property prices, occupancy rates, urban/regional
setting); Efficient and reliable scheduling of transportation (one-day turnaround, etc); and, The presence of free trade zones (FTZs), which allow product to be exported to not be
subjected to import duties if that product is not to remain in the country. Due to Canada’s geography, most retailers operate a centralized location in Ontario and have regional sites in Calgary or Montreal to service these markets. Retailers have also been cross-docking items and deconsolidating containers in Vancouver, and then loading domestic rail piggyback trailers or containers, to be distributed to their networks across
MariNova Consulting Ltd. March 2004
Greater Halifax Distribution Study
iii
western Canada. Retailers with cross-docking in Vancouver include: Sears; Canadian Tire; Home Hardware and Hudson Bay Company Regional DCs are situated across Canada in western Canada; (Calgary, Winnipeg) and in Atlantic Canada (Moncton and Halifax). Transload container sites are situated at the port cities of Vancouver and Montreal and Halifax. At these sites inbound containers are de-stuffed and loaded onto domestic equipment for direct shipment to stores. Companies’ transload locations are based upon frequency and products sourced from various trade corridors. By assessing the growth of the Top 100 Ports in the World by TEUs handled from 1996 to 2000 illustrates which ports were growing at the fastest rates. Once we identified the top growth ports we compared which container lines provide service to and from Halifax. From this assessment we then identified the countries and whether there were large import-trade houses that represented shippers, manufacturers or wholesalers, which could be approached by the Partnership and HPA as candidates for the development of DCs or transload facilities, or indeed, shipping through the port. It appears that Halifax would have first mover advantage by developing shipping links and relationships with retailers and 3PLs in the Indian sub-continent. Halifax is also unique in North America in that it handles more exports to the far East than imports from that region. This is an opportunity to balance this situation out with additional imports. Based on early interview results, and the impression that traditional DC activity was not likely to occur in the Halifax-Moncton Growth Corridor, the consultants and the client decided to focus on the potential for attracting so-called third party logistics providers (3PLs) to the corridor. Key suppliers and importers of consumer goods and logistic services for various commercial retail and wholesale sectors may offer some growth opportunities for Halifax. We evaluated some of the larger companies as well as smaller local 3PLs that provide these services and their views of growth opportunities that drive their business, which may provide Halifax with a window to see other opportunities. Although there are cases where the particular needs to be met justify a distribution centre in the Atlantic Provinces, mainstream distribution centres are likely to continue to concentrate in Central Canada. There are however a number of niche markets that can be well served out of Atlantic Canada, the Halifax area in particular. One source of niche opportunities lies in value added logistics, defined in this context by somehow increasing the value of the goods while in the transportation chain. If one looks beyond domestic transportation, and beyond retail distribution to international logistics, wholesale and exports, Halifax has many advantages to offer. Halifax’s geographic position has always been at the heart of its success in transportation. Halifax is situated along some of the busiest trade lanes in the world. It is just hours off the great circle route for most ships crossing the Atlantic and in a nearly direct line between Europe and the East Coast of North America.
MariNova Consulting Ltd. March 2004
Greater Halifax Distribution Study
iv
Several ports have seized upon the potential of attracting distribution activity close to port facilities, thus attracting shipping lines carrying cargo destined for those distribution facilities. If shipping lines want to serve these customers, they need to incorporate these ports of call. This phenomenon, plus congestion at west coast ports is leading to the re-establishment of all-water services from the Far East through the Panama Canal to east coast destinations, including Savannah, Charleston, Norfolk and New York. Our research, however, found that Halifax is not very competitive in a number of very basic areas, in terms of locating distribution centres. This could help explain why HRM has thus far only attracted DCs that serve the local market. Real estate taxes and provincial income taxes are significantly higher in Halifax than, say, Calgary, where HBC is looking at locating a DC. They are also higher than Vancouver where a number of companies have trans-load facilities. With respect to comparable Canadian cities, Halifax is only competitive with Winnipeg. There exist a number of financial incentives in other jurisdictions that have clearly contributed to DC location, and that the GHP and perhaps the province or the HRM should investigate the available options should they find a prospective company to locate in the Halifax-Moncton Growth Corridor. There are some immediate and longer term opportunities for the GHP, the HPA and their various study partners to follow up.
MariNova Consulting Ltd. March 2004
Greater Halifax Distribution Study
1
1.0 BACKGROUND In September 2002, The Halifax Port Authority initiated its SmartPort Strategic Planning initiative. Out of the first session, it was decided to focus on five key issues: 1) Marketing and Strategy; 2) Productivity and Competitiveness; 3) IT / E-Commerce; 4) Value added / Distribution; 5) Security. The port's subsequent Container Growth Strategy identified the fourth item as one of the keys to future growth. Coincidentally, the Greater Halifax Partnership, Enterprise Greater Moncton and Atlantic Canada Opportunities Agency undertook to assess strategic assets that are present along the corridor between Halifax and Moncton, which comprises the largest population base in Atlantic Canada. This study seeks to evaluate the potential for fulfillment centre activities along the Halifax-Moncton Corridor, leveraging the proximity to the Port of Halifax and multi-modal transportation connections to New England and Central Canada. The Partnership is interested in attracting high wage jobs that are uniquely suited to the port and which result in the high value usage of port lands. It seeks to leverage the existing strengths of the Port of Halifax, along with the burgeoning call centre and customer fulfillment sector, by marrying it with logistics and shipping. The notion that the Port of Halifax could serve as a North American gateway is not new. However, in the present context it was envisioned at the outset of containerization that goods would be brought to Halifax, processed and then distributed to points inland. This issue was examined in detail by Arthur D. Little and Associates in 1978. Since the advent of containerisation at Halifax, however, very little of this type of activity actually occurs in Nova Scotia. Notable exceptions are Michelin Tire, which imports raw and synthetic rubber and then exports finished tires to North American and worldwide markets. Another exception is Moirs Chocolates at Dartmouth, which imports raw chocolate and then processes it into finished product for the North American market. In the past twenty years, however, Burnside Industrial Park, and Lakeside Industrial Park emerged as distribution centres for both the Halifax and Nova Scotia markets. Likewise, Moncton and Dieppe emerged as distribution points for south and north east New Brunswick. Home Hardware also established a large warehouse in Debert, Nova Scotia serving the Atlantic region. In most cases, this activity has involved distributing goods shipped from Central Canada or the United States to points in the Maritimes and Newfoundland. In 1991, Booz Allen and Hamilton Inc., in their Strategic Analysis of Nova Scotia’s Trade Facilities and Services briefly examined the potential to attract additional distribution activity to Nova Scotia. Three case studies looked at Canadian Tire, Sobey’s and Howard Industries. At the time, Canadian Tire was moving most Far East imports through Halifax, railing them to Toronto, and then trucking goods on a store-wide basis
MariNova Consulting Ltd. March 2004
Greater Halifax Distribution Study
2
back to the Maritimes. The company acknowledged that it was less expensive to distribute them from a point in the Maritimes, but it was just completing the second of two 1 million sq. ft distribution facilities north of Toronto. Atlantic Canada only has a population of 2.4 million people, of whom 650,000 live within two hours of the Port of Halifax. The port's hinterland now comprises Atlantic Canada, Quebec, Ontario, the U.S. mid-west and New England. Distribution activity, however, tends to serve the needs of the immediate region. The port's location on the Great Circle Route and its function as a lightening and topping off port for vessels on the way to or from New York, provides it and the immediate region with a myriad of shipping services to and from many world-wide destinations. Can this location and these services be leveraged to enhance the port's and the Halifax-Moncton Corridor's role as a North American distribution centre? Can niche freight or logistics fulfillment be linked to regional strengths in call centre/customer solution centres building on existing telecom and human resource capabilities/capacities?
MariNova Consulting Ltd. March 2004
Greater Halifax Distribution Study
3
2.0 INTRODUCTION The United States has, in the past few decades, seen continued growth of large manufacturing and retail distribution centres in port cities, and in areas that are well-connected and thereby suitable locations to connect the regional and national wholesale and retail outlets. 2.1 Selecting Sites for Distribution Centers
The choice of location for DCs can be based on many factors, most notably:
Proximity to transportation infrastructure (by sea, truck, and rail); Proximity to suitable, skilled workforce; Proximity to related manufacturing and wholesale/retail outlets (linking manufacturing
with distribution); The presence of locating and expansion incentives (income and property tax incentives,
land grants, government subsidies); The presence of industry clusters (companies in similar industries who share knowledge,
information, inputs, etc – often in the high-tech sector); Favorable business conditions (tax rates, property prices, occupancy rates, urban/regional
setting); Efficient and reliable scheduling of transportation (one-day turnaround, etc); and, The presence of free trade zones (FTZs), which allow product to be exported to not be
subjected to import duties if that product is not to remain in the country. Many port authorities claim that through on-site cargo handling capabilities, or through a combination of distribution activities, handling and transport times can be minimized. For instance, the inland port of Columbus, Ohio reports that containerized cargo can be moved from New York via rail to Columbus, clear customs and be shipped back to New York in less time than it would take to clear customs in New York. Other key influencing factors are the efficiency of interstate highways at various locations, and cost-effective warehousing and transportation. The article, “How to Select an Optimal Distribution Site”1, outlines seven tips to make the site selection process more productive.
1. Define the Acceptable limits of “on time”: Reasonable turnaround times vary by industry, and by customer.
2. Determine how many distribution centers you want: With the national average
somewhere between three and four distribution centers, answering this question will help you choose between locating one distribution center in a major urban center, or many distribution points in geographically dispersed markets.
1 :Site Selection Magazine, September 1999
MariNova Consulting Ltd. March 2004
Greater Halifax Distribution Study
4
3. Select distribution markets: - based on proximity to customers, the cost of reaching
customers, the potential workforce, access to transportation, the quality of transportation infrastructure, and the weather.
4. Compare facilities within markets: Compare individual facilities according to access to
roadways, number of truck doors, cleanliness of facilities, and climate control.
5. Compare costs, but be careful: Factor in all costs and benefits to find the overall most cost-effective location, based on a variety of facility and geographic location costs.
6. Improve your flexibility and compromising skills: When the best facility or location
cannot be secured, weigh other short and medium term options. 7. Don’t assume you’re through: be adaptable and engage in re-evaluations frequently,
even up to every two years. In addition, there are other external items due to the ever-changing demands of global supply chains, investment and trade corridors. As world trade shifts between country and ports and as transportation carriers enter and exit markets, companies must continuously re-examine their distribution networks. New regulations and shifts in government policies also impact the competitiveness of ports and transportation carriers that provide services to manufacturers, imports and exporters. If companies and ports do not benchmark themselves every year they miss out on key future growth opportunities. Studies from the European Union (EU), for instance, cite the role of both public and private investment in infrastructure development as being critical to the long-term sustainability of economic growth. The EU public policy regarding infrastructure development indicates incentives are necessary to encourage location site investment by private companies. Both the private and public sectors have different time lines in terms of determining and evaluating the yield from investment. Most private companies view the long term as 5 years and compared to 10 years for public sector. 2.2. Recent US Distribution Centre Investments There is a rich and extensive literature on the subject of Distribution Centres and their location theory. The following illustrates a number of companies who have located or recently expanded operations in the United States, where they located, and some of the key factors cited for locating in these areas. Company: Bose Corp. Location: Columbia, South Carolina Influencing Factors: Incentives such as the Rural Development Act (lower property taxes, job development incentives for infrastructure improvement, job income tax credits), proximity to Columbia Metropolitan Airport, fully subsidized state-trained employee pool (a 1995 initiative)
MariNova Consulting Ltd. March 2004
Greater Halifax Distribution Study
5
Company: BMW Location: Port of Charleston, South Carolina Influencing Factors: Proximity to their manufacturing plant (for the Z3 roadster model, first plant located outside Germany), modern container facilities, intermodal capabilities, extensive interstate highway network. The port is tied to CSX International and Norfolk-Southern railroads. Recently, CSX eliminated layovers in Atlanta, cutting travel times by a day.) Company: Turbana Location: Gulfport, Mississippi Influencing Factors: A state-owned port which was recently dredged to 36 feet, Gulfport is said to be the largest handler of tropical fruit. Also, as one of two federally designated Foreign Trade Zones in Mississippi, Gulfport users benefit from duty and tax savings. A recently built air cargo facility improves transportation capabilities from Central and South America Company: Columbia Sportswear Location: Dixon, Kentucky Influencing Factors: The center is situated in the 4 Star Industrial Park (900 acres), a cooperative venture of four Kentucky counties which promotes regional cooperation and growth. The park purchased 51 acres of land from an adjacent tenant to accommodate Columbia, as well as financing the development of the site through the issuing of bonds, repayable by Columbia until all bonds are retired. The arrangement will result in Columbia not being required to pay property taxes for the 25-year payoff period, though they will pay the Henderson County school property tax for that period. The Delta Regional authority was to pay for installation of sewer lines, and other state and federal grants are available for park development aid. Company: Reebok International Location: Boston and Carlton, Massachusetts Influencing Factors: The all water routes (China and Hong Kong to Boston) used by Reebok are seen as highly reliable, despite the increase in transit time. A single carrier can retain custody of shipments from origin to destination. Company: Wal-Mart Location: Louisa County, Virginia Influencing Factors: Proximal to regional headquarters of CSX Corp and Norfolk Southern Corp railroads, with major cities such as New York, Philadelphia, Washington, Pittsburgh, Charlotte and Charleston are within 350 miles (560 km). The county boasts a large local workforce who was previously commuting outside the county for work, and state and local regional development partnerships funding transportation projects and
MariNova Consulting Ltd. March 2004
Greater Halifax Distribution Study
6
developing industry clusters. Wal-Mart operates 3 distribution centers in Virginia, in addition to 52 Supercenters, 21 Discount Stores and 13 Sam’s Clubs. Company: Staples Location: Washington County, Maryland Influencing Factors: County and State incentives packages and the establishment of a developed industrial corridor adjacent to Interstate Highway 81 (I-81) helped the Maryland location win out over Virginia. Maryland boasts Baltimore as “less than a day’s drive from one-third of the country’s population.”
Company: Home Depot Location: Hagerstown, Maryland Influencing Factors: Recently announced (2004) plans to open a 454,000 sq. ft. distribution center to employ 230, following last year’s opening of a major retail outlet in Hagerstown. Incentives are reportedly over $400,000 in state and local packages (Washington County), including $330,000, which could be converted to grants if the company reaches its hiring targets, as well as a $75,000 training grant from the Maryland Dept of Economic Development.
Company: Williams-Sonoma (expansion of distribution center) Location: Memphis, Tennessee area Influencing Factors: Memphis sells its location as having the word’s largest air cargo airport, the third largest rail center in the US, and the 4th largest inland port in the US. Many distribution centers in the Memphis area are undergoing expansion. Company: IKEA Location: Perryville, Maryland Influencing Factors: Cecil County’s labour force and access to the Port of Baltimore are reportedly major factors, as well as the ability to supply the Maryland, Washington DC and Pennsylvania regions. Ikea will benefit from income and property tax credits due to the designation of a state enterprise zone, which offsets the $5 million IKEA spent in acquiring a site larger than required. Company: Wal-Mart Location: Houston Influencing Factors: In the period since this study commenced, Wal-Mart has announced that it is building a 2m ft.² DC near the port of Houston. It is located on a 50 acre site at the intersection of two major highways. The State of Texas will purchase the building and property for $80m and lease it back for the next 30 years for $187m, providing Wal-Mart with a sizable property tax break.
MariNova Consulting Ltd. March 2004
Greater Halifax Distribution Study
7
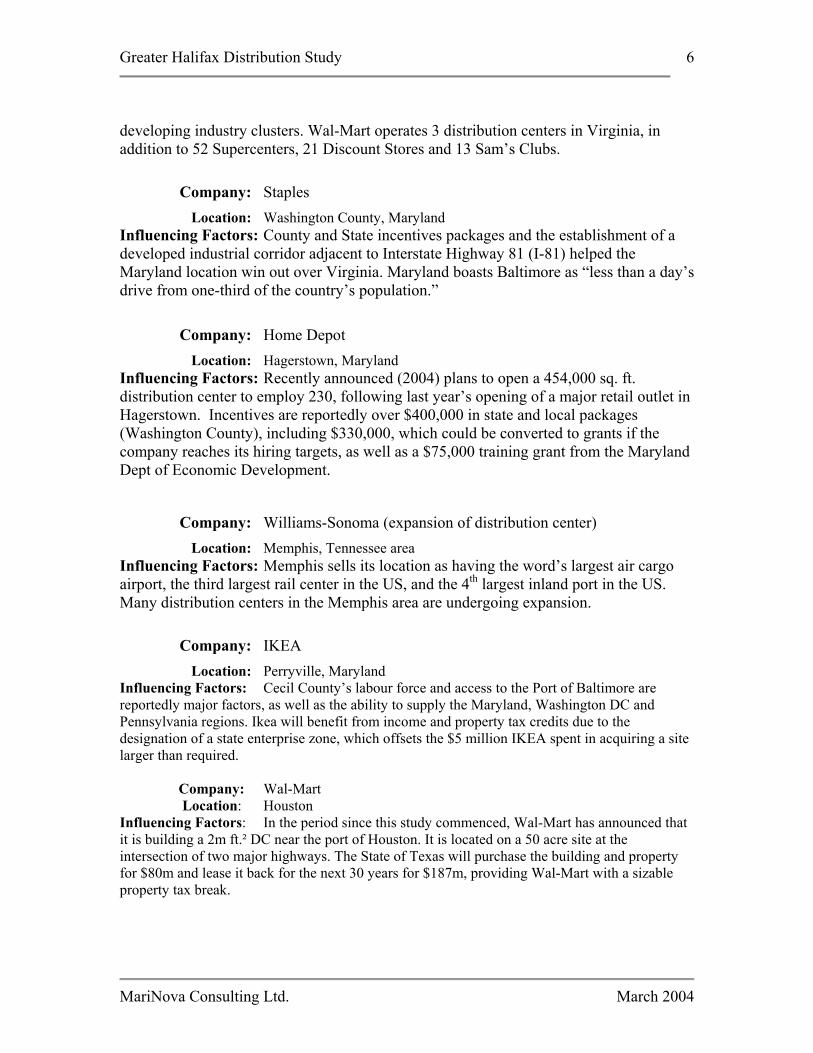
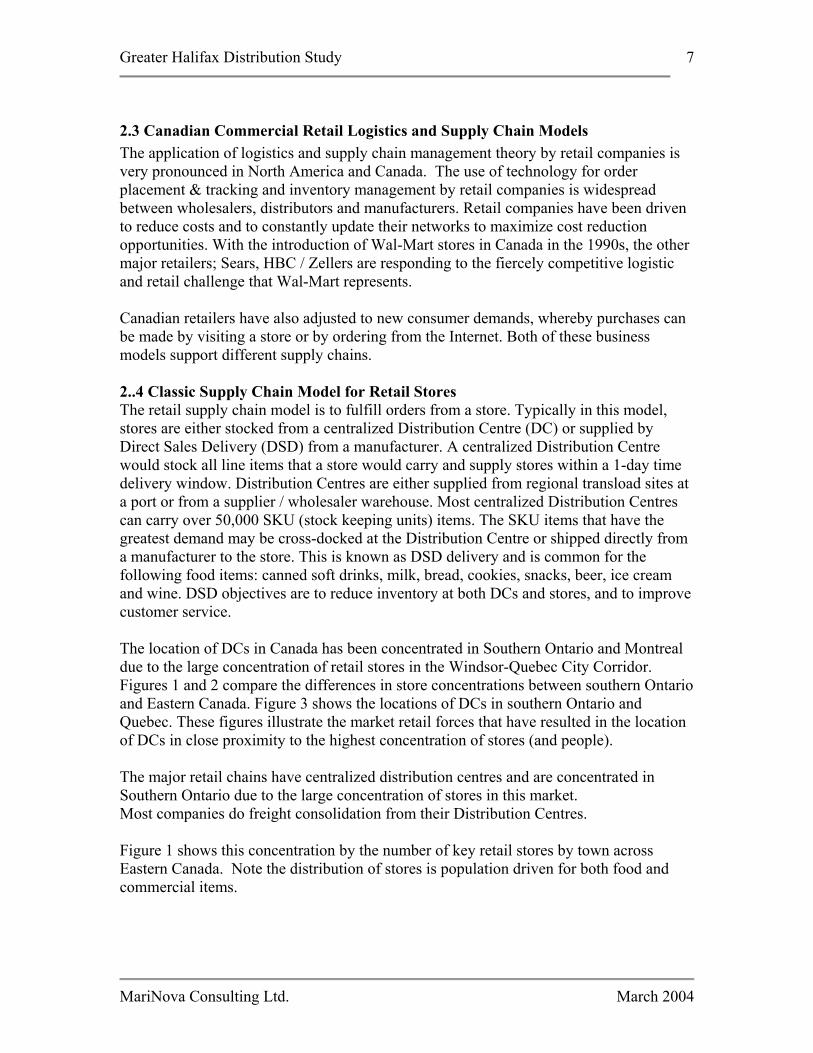
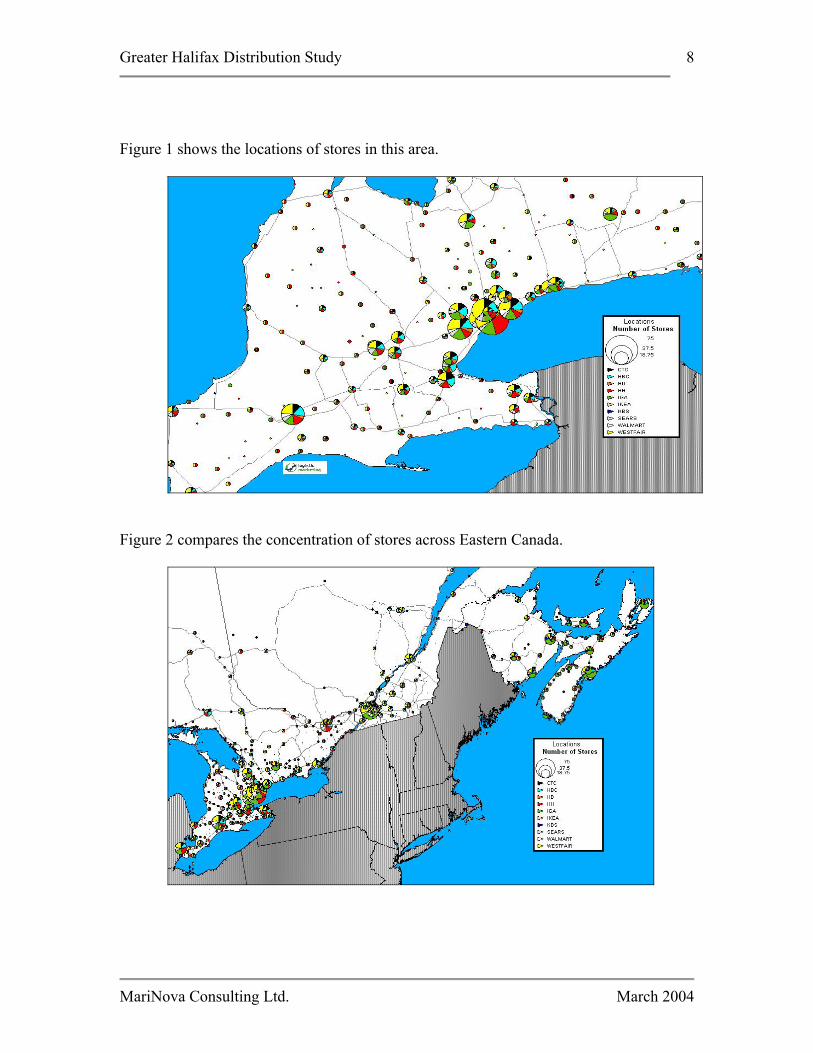
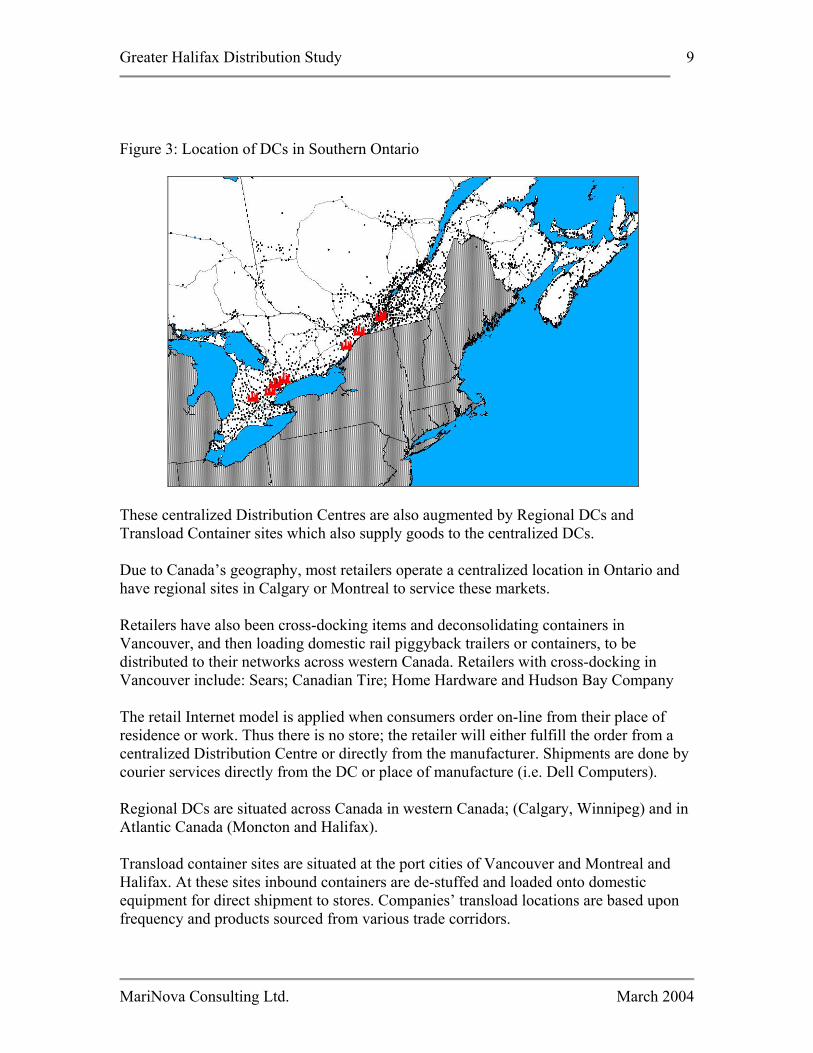
2.3 Canadian Commercial Retail Logistics and Supply Chain Models The application of logistics and supply chain management theory by retail companies is very pronounced in North America and Canada. The use of technology for order placement & tracking and inventory management by retail companies is widespread between wholesalers, distributors and manufacturers. Retail companies have been driven to reduce costs and to constantly update their networks to maximize cost reduction opportunities. With the introduction of Wal-Mart stores in Canada in the 1990s, the other major retailers; Sears, HBC / Zellers are responding to the fiercely competitive logistic and retail challenge that Wal-Mart represents. Canadian retailers have also adjusted to new consumer demands, whereby purchases can be made by visiting a store or by ordering from the Internet. Both of these business models support different supply chains. 2..4 Classic Supply Chain Model for Retail Stores The retail supply chain model is to fulfill orders from a store. Typically in this model, stores are either stocked from a centralized Distribution Centre (DC) or supplied by Direct Sales Delivery (DSD) from a manufacturer. A centralized Distribution Centre would stock all line items that a store would carry and supply stores within a 1-day time delivery window. Distribution Centres are either supplied from regional transload sites at a port or from a supplier / wholesaler warehouse. Most centralized Distribution Centres can carry over 50,000 SKU (stock keeping units) items. The SKU items that have the greatest demand may be cross-docked at the Distribution Centre or shipped directly from a manufacturer to the store. This is known as DSD delivery and is common for the following food items: canned soft drinks, milk, bread, cookies, snacks, beer, ice cream and wine. DSD objectives are to reduce inventory at both DCs and stores, and to improve customer service. The location of DCs in Canada has been concentrated in Southern Ontario and Montreal due to the large concentration of retail stores in the Windsor-Quebec City Corridor. Figures 1 and 2 compare the differences in store concentrations between southern Ontario and Eastern Canada. Figure 3 shows the locations of DCs in southern Ontario and Quebec. These figures illustrate the market retail forces that have resulted in the location of DCs in close proximity to the highest concentration of stores (and people). The major retail chains have centralized distribution centres and are concentrated in Southern Ontario due to the large concentration of stores in this market. Most companies do freight consolidation from their Distribution Centres. Figure 1 shows this concentration by the number of key retail stores by town across Eastern Canada. Note the distribution of stores is population driven for both food and commercial items.
MariNova Consulting Ltd. March 2004
Greater Halifax Distribution Study
8
Figure 1 shows the locations of stores in this area.
Figure 2 compares the concentration of stores across Eastern Canada.
MariNova Consulting Ltd. March 2004
Greater Halifax Distribution Study
9
Figure 3: Location of DCs in Southern Ontario
These centralized Distribution Centres are also augmented by Regional DCs and Transload Container sites which also supply goods to the centralized DCs. Due to Canada’s geography, most retailers operate a centralized location in Ontario and have regional sites in Calgary or Montreal to service these markets. Retailers have also been cross-docking items and deconsolidating containers in Vancouver, and then loading domestic rail piggyback trailers or containers, to be distributed to their networks across western Canada. Retailers with cross-docking in Vancouver include: Sears; Canadian Tire; Home Hardware and Hudson Bay Company The retail Internet model is applied when consumers order on-line from their place of residence or work. Thus there is no store; the retailer will either fulfill the order from a centralized Distribution Centre or directly from the manufacturer. Shipments are done by courier services directly from the DC or place of manufacture (i.e. Dell Computers). Regional DCs are situated across Canada in western Canada; (Calgary, Winnipeg) and in Atlantic Canada (Moncton and Halifax). Transload container sites are situated at the port cities of Vancouver and Montreal and Halifax. At these sites inbound containers are de-stuffed and loaded onto domestic equipment for direct shipment to stores. Companies’ transload locations are based upon frequency and products sourced from various trade corridors.
MariNova Consulting Ltd. March 2004
Greater Halifax Distribution Study
10
Materials Management and Distribution reported last year that “in both grocery and fresh product lines, inventory is going down. Some distribution centres have reduced inventory by 15-20%. Many food distributors are also currently cross-docking from suppliers to retail food stores, with 83% of the companies cross-docking products from outside storage to the main distribution centre.”2 Moreover, Canadian Grocer reported in 1997 “cross-docking with modular pallets can reduce total supply chain costs by 20% for the SKUs that ship in quantities of 10 cases or more.”3 The future trend in retail logistics is for consolidation with suppliers for Vendor Managed Inventories (inventory consignment) and increasing use of cross-docking sites to lessen the warehouse and storage space at both DCs and stores. Retailers and their suppliers are also increasingly technology driven. They use various supply chain, inventory management, order processing and tracing software. Any 3PL provider needs to have the latest technology; retailers will also demand that the 3PL use their own software to manage their business. Wal-Mart has also recently insisted that its suppliers move to Radio Frequency Identification Device (RFID) technology by January 2005.
2‘Sears Moves Into New Service Centre’ (May 2000), Materials Management and Distribution, July 1999, p.7; ‘Wal-Mart to Open New Distribution Centre’, Canadian Grocer, Jan-Feb 1999, p.13; Robert Robertson, ‘Big Food Fight: Food Distributors Face Marketplace Changes’, Materials Management and Distribution, May 2000, pp.31 3 Sally Presky, ‘ECR Report: The Case For Moving Modules’, Canadian Grocer, October 1997, pp.24
MariNova Consulting Ltd. March 2004
Greater Halifax Distribution Study
11
3.0 CASE STUDIES of CANADIAN IMPORTERS and RETAILERS 3.1 Introduction
The next section provides the results of interviews of commercial retailers. We were able to interview the following companies:
• Hudson Bay / Zellers • Canadian Tire • Home Hardware • Sears • Sobeys / IGA • Kent Building Supplies • Nova Scotia Liquor Commission • Loblaws
We have information about, but were unsuccessful in interviewing one other large industry player:
• Wal-Mart
3.1.1 Current Import Logistic Strategies We examined and interviewed seven (7) major retail companies associated with food, retail, commercial and hardware goods and services, to determine the future role of the Port of Halifax as part of their logistics strategy. We assessed each company’s store location in relation to their current DCs, and asked companies where they are presently sourcing goods and where future growth opportunities was most likely to occur. 3.2 Hudson Bay Company / Zellers Hudson Bay Company and Zellers operate two retail store operations. The HBC or Bay stores locate in larger regional malls in urban areas, whereas the Zellers stores are more dominant in smaller centres and are marketed to a lower income demographic. Company: Hudson Bay Company, ON Headquarters Location: Toronto, ON Contact: Mike Thomas Executive VP HBC Logistics, Toronto, 416.861.6634
Estimated Import Volume 2002: 1,500-2,000 FEU via Halifax Overview of Transport Network: Canadian or
US Port Cross Dock
Location DC Location Province / # Stores Montreal Scarborough ON 187 PQ 85 NB 14
MariNova Consulting Ltd. March 2004
Greater Halifax Distribution Study
12
Halifax Mississauga NS 19 PEI 2 Vancouver Vancouver
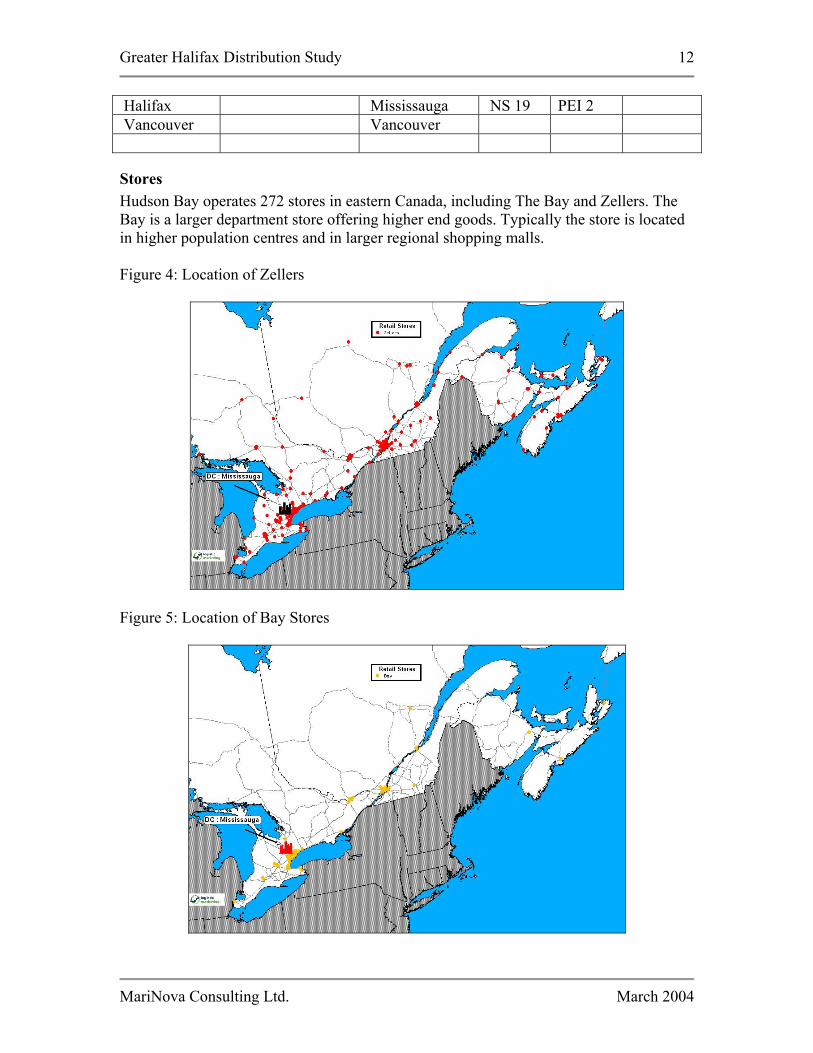
Stores Hudson Bay operates 272 stores in eastern Canada, including The Bay and Zellers. The Bay is a larger department store offering higher end goods. Typically the store is located in higher population centres and in larger regional shopping malls. Figure 4: Location of Zellers
Figure 5: Location of Bay Stores
MariNova Consulting Ltd. March 2004
Greater Halifax Distribution Study
13
3.2.1 Strategic Logistics Alliance: HBC has developed a strategic alliance with CP Rail, which Halifax / CN would have to counter, in order to participate in their business. This alliance is summarized as follows:
• CP is the major carrier of their domestic intermodal cargo from their Distribution Centres.
• They use 53’ CP Domestic Boxes (Boxes show HBC decals) which are leased by CP Rail
• From the CP terminals CP arranges local cartage with truck carriers. CP Rail also leases the truck chassis.
• CP intermodal services include the cities of Calgary, Saskatoon, Montreal, Toronto, Winnipeg, Vancouver, Edmonton, Regina
3.3 HBC Distribution Some distribution centres cater to both companies (one in Vancouver, one in Montreal). There are two DCs in Toronto for Zellers and one for The Bay, and one for furniture and appliances.
HBC uses the Port of Halifax a little, for shipments from Bangladesh, India, and Pakistan: about 1,500 to 2,000 containers per year. All shipments through Halifax go to Montreal. Goods then return to Atlantic Canada via truck (HBC owns their own trucking company.) HBC sees this as an unfortunate situation. The ocean bill to Montreal is approximately the same cost, if not cheaper, than shipping by rail from Halifax to Montreal. Some time ago, HBC attempted to negotiate freight rates with CN, but were not offered an attractive rate from Halifax. We verified this situation with a local freight forwarder who confirmed that the rate with Maersk Sealand for the shipment of bedding from India is the same for Halifax, Montreal and Toronto, thus negating any locational advantage. Some product is kept in the regional distribution centres and some is received from the vendor in Toronto and shipped to Vancouver. There is no distribution to U.S. cities. The company makes no use of 3PL warehousing. If costs were appropriate, 3PL warehousing in the Halifax-Moncton Corridor could be a consideration in the future, but this will depend heavily on CN rates. Port selection is driven by cost and transit time. According to HBC, shipping goods from Asia through Vancouver and then by rail takes 15 days less time than to ship goods through the Port of Halifax. Consideration of alternative ports, i.e. more use of Halifax, would be dependent on overall cost savings. If a DC were to be located near Halifax, it would be approximately 150,000 sq ft. Currently, there is a study underway comparing various prospective locations for an
MariNova Consulting Ltd. March 2004
Greater Halifax Distribution Study
14
additional regional DC. Recent experience with the Port of Halifax has shown it to be disorganized, with supply line delays. Vancouver is more efficient with better service at the port. The use of Halifax could depend on product growth in the European Community, such as the Czech Republic. At the moment, Asia dominates their imports, so Vancouver remains the key port.
3.4 Canadian Tire
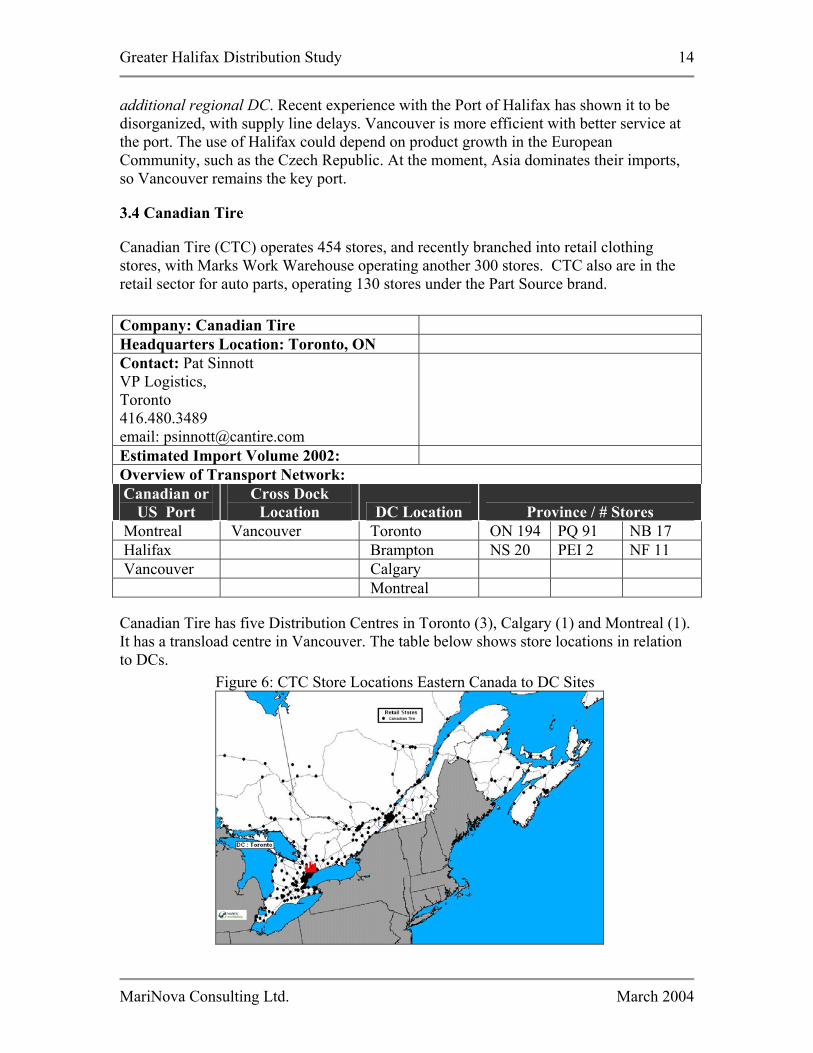
Canadian Tire (CTC) operates 454 stores, and recently branched into retail clothing stores, with Marks Work Warehouse operating another 300 stores. CTC also are in the retail sector for auto parts, operating 130 stores under the Part Source brand. Company: Canadian Tire Headquarters Location: Toronto, ON Contact: Pat Sinnott VP Logistics, Toronto 416.480.3489 email: [email protected]
Estimated Import Volume 2002: Overview of Transport Network: Canadian or
US Port Cross Dock
Location DC Location Province / # Stores Montreal Vancouver Toronto ON 194 PQ 91 NB 17 Halifax Brampton NS 20 PEI 2 NF 11 Vancouver Calgary Montreal
Canadian Tire has five Distribution Centres in Toronto (3), Calgary (1) and Montreal (1). It has a transload centre in Vancouver. The table below shows store locations in relation to DCs.
Figure 6: CTC Store Locations Eastern Canada to DC Sites
MariNova Consulting Ltd. March 2004
Greater Halifax Distribution Study
15
3.4.1 Strategic Logistic Alliances: CTC has a similar arrangement as HBC does with CP for the domestic supply of intermodal boxes and carriage of containers using CP leased equipment, and use CP ex Vancouver, Toronto and Calgary. In terms of overall distribution strategy, 92% of shipments to stores were on time in 2002. The company has improved the supply chain at the AJ Billes Distribution Centre in Toronto. It introduced new supply chain technology i.e. software at its DC in Calgary CTC uses supply chain technology extensively as, from their point of view, the supply chain starts at the DCs. With orders consolidated the software provides a list of items to be picked. The model tells them at which bays to load trucks, to which stores, based upon time and demand allocation models. It has recently introduced the “20/20 Program” to increase sales by 20% using 20% less space. It is also reducing warehouse space at CTC Stores, and pushing high volume products to stores from DCs. The transload site at Vancouver de-stuffs containers. With the increased payload using 53’ domestic trailers containers with CP rail, the company pays 33% less freight. They consolidate 2-3 containers which are then shipped to DCs at Calgary or Toronto. Canadian Tire uses CN for eastbound shipments from Toronto-Montreal to Atlantic Canada. However, they have a very tight strategic alliance with CP. In terms of Halifax’s role, the company told us it could potentially attract a transload site, with the following requirements:
• 24 hour port access for trucks • Transload site 250,000 sq ft • Need to transfer 200 to 300 containers per week to be feasible
This facility would need to service DCs at Toronto and Montreal. A full DC would not work in Halifax or the Corridor, as there is not a high concentration of stores in the service area. They would need to run their network model to see if a transload would be economical at Halifax. A potential barrier to Halifax is the extra week from China and the perceived limited number of carriers calling regarding frequency of service to Halifax. The company is amenable towards being contacted by the port in the future.
MariNova Consulting Ltd. March 2004
Greater Halifax Distribution Study
16
3.5 Home Hardware Company: Home Hardware Headquarters Location: St Jacobs, ON Estimated Import Volume 2002: Overview of Transport Network: Canadian or
US Port Cross Dock
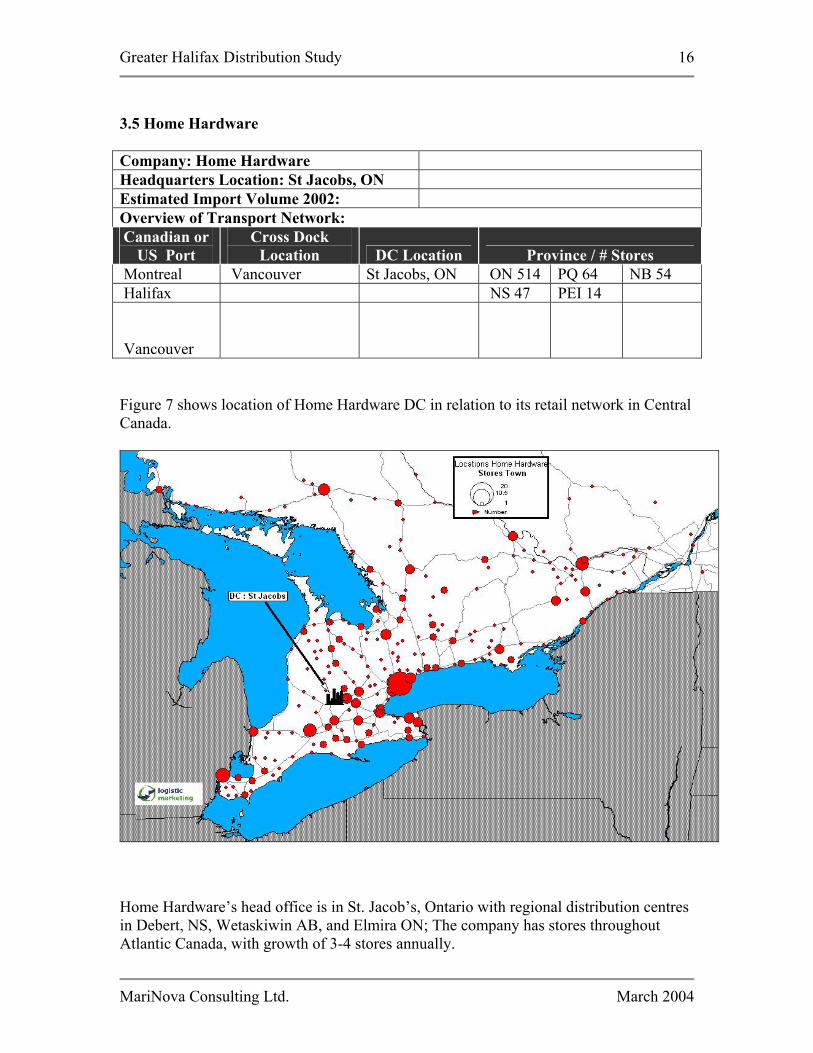
Location DC Location Province / # Stores Montreal Vancouver St Jacobs, ON ON 514 PQ 64 NB 54 Halifax NS 47 PEI 14 Vancouver Figure 7 shows location of Home Hardware DC in relation to its retail network in Central Canada.
Home Hardware’s head office is in St. Jacob’s, Ontario with regional distribution centres in Debert, NS, Wetaskiwin AB, and Elmira ON; The company has stores throughout Atlantic Canada, with growth of 3-4 stores annually.
MariNova Consulting Ltd. March 2004
Greater Halifax Distribution Study
17
Most imported goods enter Canada through Vancouver, which is their import office location. Presently, there is no importing through the Port of Halifax, although there is some “exporting” to Newfoundland and Saint-Pierre and Miquelon. Truck and rail brings shipments from the west to St. Jacobs and to Debert. Some cargo is piggybacked to Halifax, and then taken by truck to Debert.
The Debert, NS warehouse is approximately 8.5 acres or just over 450,000 sq ft. Distribution from the Debert warehouse is to approximately 190 stores, including Newfoundland and Labrador (NL), and St. Pierre et Miquelon. Exporting through the Port of Halifax is described as a “drive on, drive off” operation. Trailers or trucks (sometimes containers) are shipped and returned from NL and Saint-Pierre et Miquelon. Halifax is a convenient location from which to reach the NL and Saint-Pierre et Miquelon markets. Port selection is based on cost effectiveness and ability to meet the needs of the company. Oceanex and the feeder to St. Pierre et Miquelon are currently suiting their needs out of Halifax. In terms of their site selection process, they looked at Moncton and Halifax 25 years ago, but decided on Debert, in part because it was close to both rail and the airport. They are currently not interested in locating near the Port of Halifax. Container freight shipment is adequate using current methods (through Vancouver, Wetaskiwin, and St. Jacobs). It is difficult to tell whether circumstances will change in the future (always possible, depending on suppliers, companies, etc) 3.5.1 Strategic Logistics Alliances:
Home Hardware, like HBC and Canadian Tire, has a strategic alliance with Fastfrate Truck Company. Fastfrate, in turn, uses Armour Transport in eastern Canada as their 3PL. Fastfrate / Armour has regional terminals in Atlantic Canada that would service Home Hardware in Moncton, Halifax and St Johns.
3.6 Wal-Mart Company: Walmart Headquarters Location: Toronto, ON Contact: Doug Doust VP Supply Chain 605.821.2111 ext 4170
Estimated Import Volume 2002: n/a Overview of Transport Network: Canadian or
US Port Cross Dock
Location DC Location Province / # Stores Montreal Cornwall ON 75 PQ 44 NB 6 Halifax Mississauga NS 10 PEI 2 NF 8
MariNova Consulting Ltd. March 2004
Greater Halifax Distribution Study
18
Vancouver Belleville MB 11 SK 12 AB 29 Calgary BC 22
3.6.1 Strategic Alliances
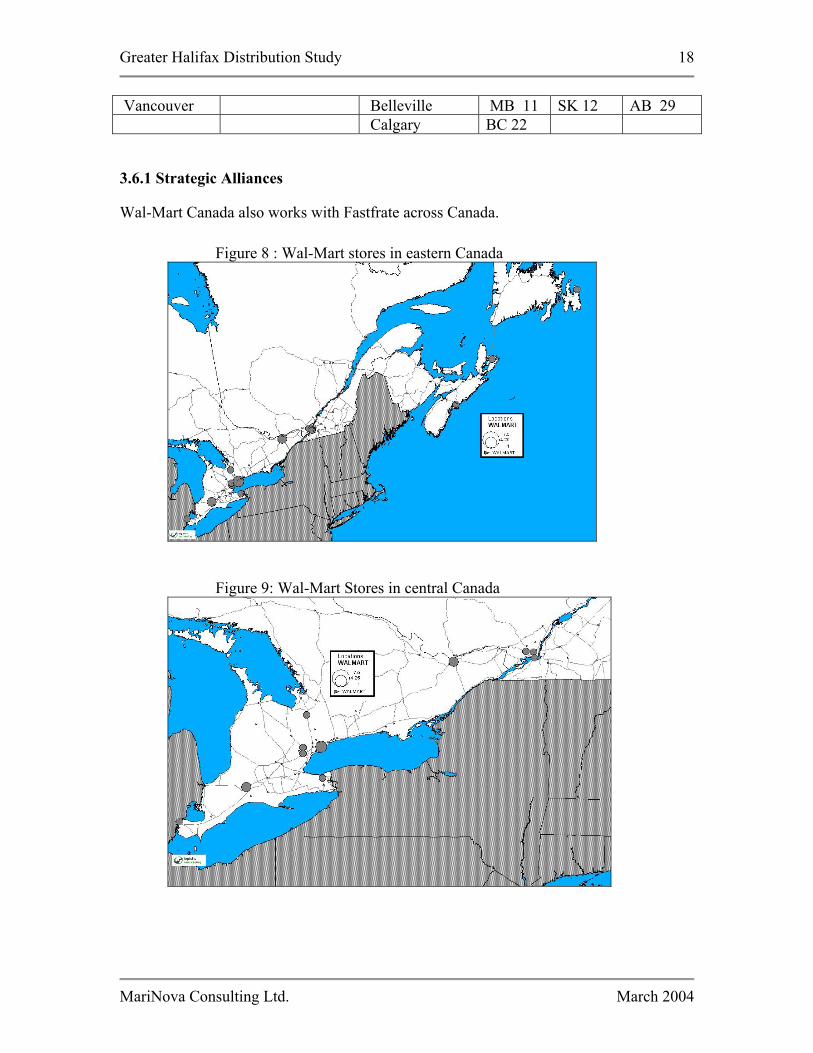
Wal-Mart Canada also works with Fastfrate across Canada.
Figure 8 : Wal-Mart stores in eastern Canada
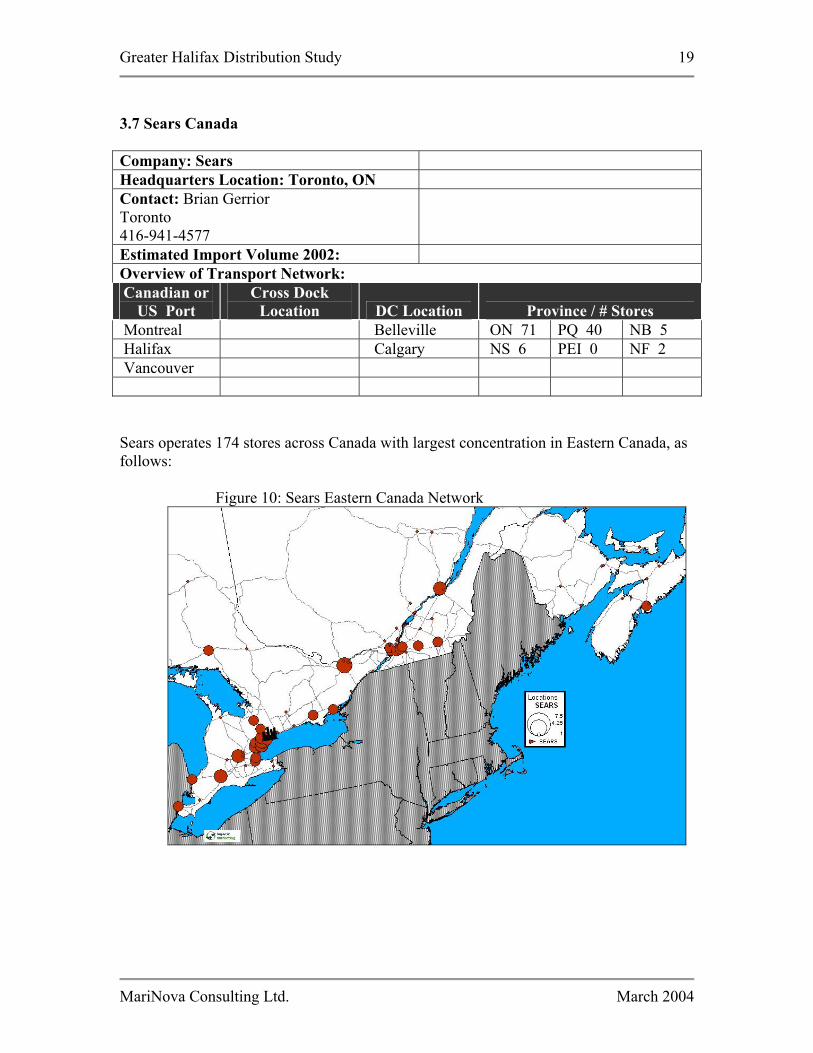
Figure 9: Wal-Mart Stores in central Canada
MariNova Consulting Ltd. March 2004
Greater Halifax Distribution Study
19
3.7 Sears Canada Company: Sears Headquarters Location: Toronto, ON Contact: Brian Gerrior Toronto 416-941-4577
Estimated Import Volume 2002: Overview of Transport Network: Canadian or
US Port Cross Dock
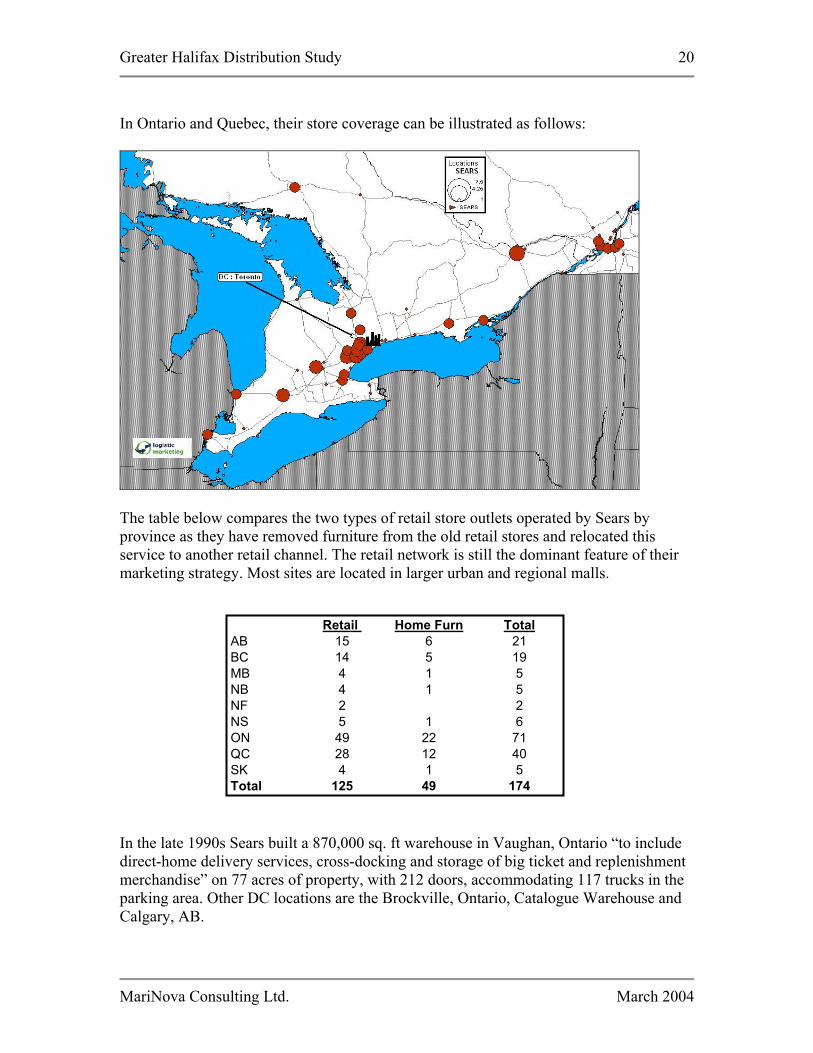
Location DC Location Province / # Stores Montreal Belleville ON 71 PQ 40 NB 5 Halifax Calgary NS 6 PEI 0 NF 2 Vancouver Sears operates 174 stores across Canada with largest concentration in Eastern Canada, as follows:
Figure 10: Sears Eastern Canada Network
MariNova Consulting Ltd. March 2004
Greater Halifax Distribution Study
20
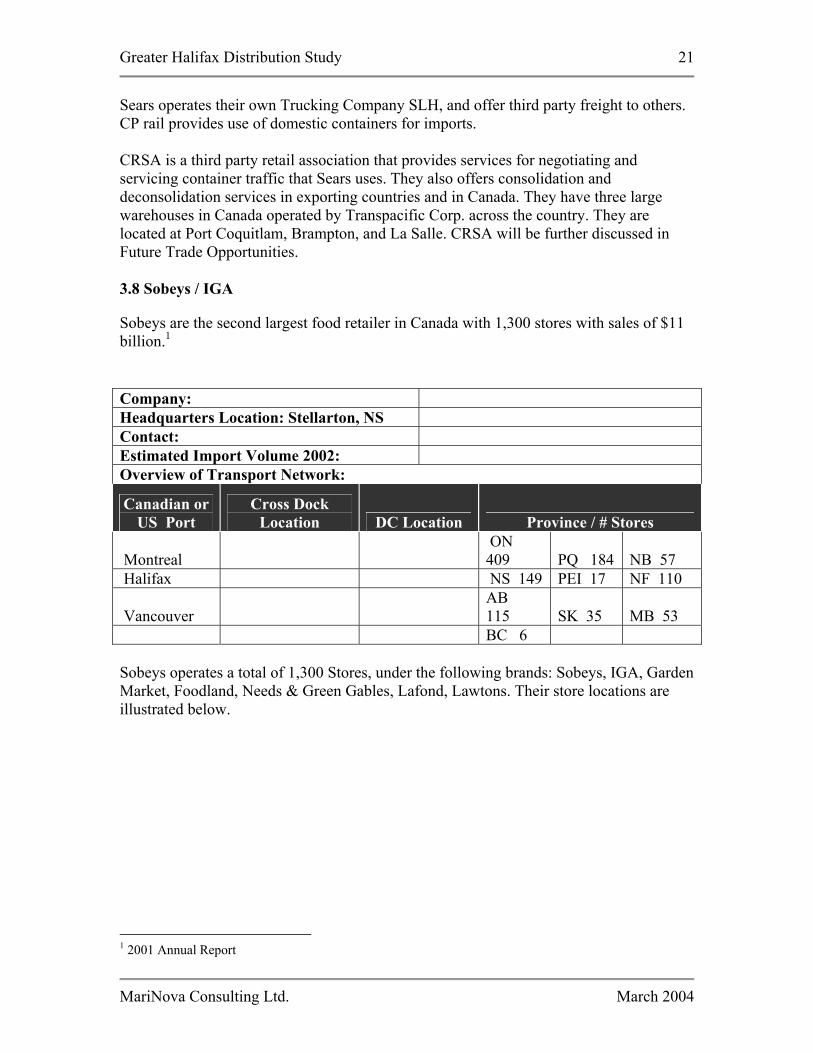
In Ontario and Quebec, their store coverage can be illustrated as follows:
The table below compares the two types of retail store outlets operated by Sears by province as they have removed furniture from the old retail stores and relocated this service to another retail channel. The retail network is still the dominant feature of their marketing strategy. Most sites are located in larger urban and regional malls.
Retail Home Furn TotalAB 15 6 21BC 14 5 19MB 4 1 5NB 4 1 5NF 2 2NS 5 1 6ON 49 22 71QC 28 12 40SK 4 1 5Total 125 49 174
In the late 1990s Sears built a 870,000 sq. ft warehouse in Vaughan, Ontario “to include direct-home delivery services, cross-docking and storage of big ticket and replenishment merchandise” on 77 acres of property, with 212 doors, accommodating 117 trucks in the parking area. Other DC locations are the Brockville, Ontario, Catalogue Warehouse and Calgary, AB.
MariNova Consulting Ltd. March 2004
Greater Halifax Distribution Study
21
Sears operates their own Trucking Company SLH, and offer third party freight to others. CP rail provides use of domestic containers for imports. CRSA is a third party retail association that provides services for negotiating and servicing container traffic that Sears uses. They also offers consolidation and deconsolidation services in exporting countries and in Canada. They have three large warehouses in Canada operated by Transpacific Corp. across the country. They are located at Port Coquitlam, Brampton, and La Salle. CRSA will be further discussed in Future Trade Opportunities. 3.8 Sobeys / IGA
Sobeys are the second largest food retailer in Canada with 1,300 stores with sales of $11 billion.1
Company: Headquarters Location: Stellarton, NS Contact: Estimated Import Volume 2002: Overview of Transport Network:
Canadian or US Port
Cross Dock Location DC Location Province / # Stores
Montreal ON 409 PQ 184 NB 57
Halifax NS 149 PEI 17 NF 110
Vancouver AB 115 SK 35 MB 53
BC 6 Sobeys operates a total of 1,300 Stores, under the following brands: Sobeys, IGA, Garden Market, Foodland, Needs & Green Gables, Lafond, Lawtons. Their store locations are illustrated below.
1 2001 Annual Report
MariNova Consulting Ltd. March 2004
Greater Halifax Distribution Study
22
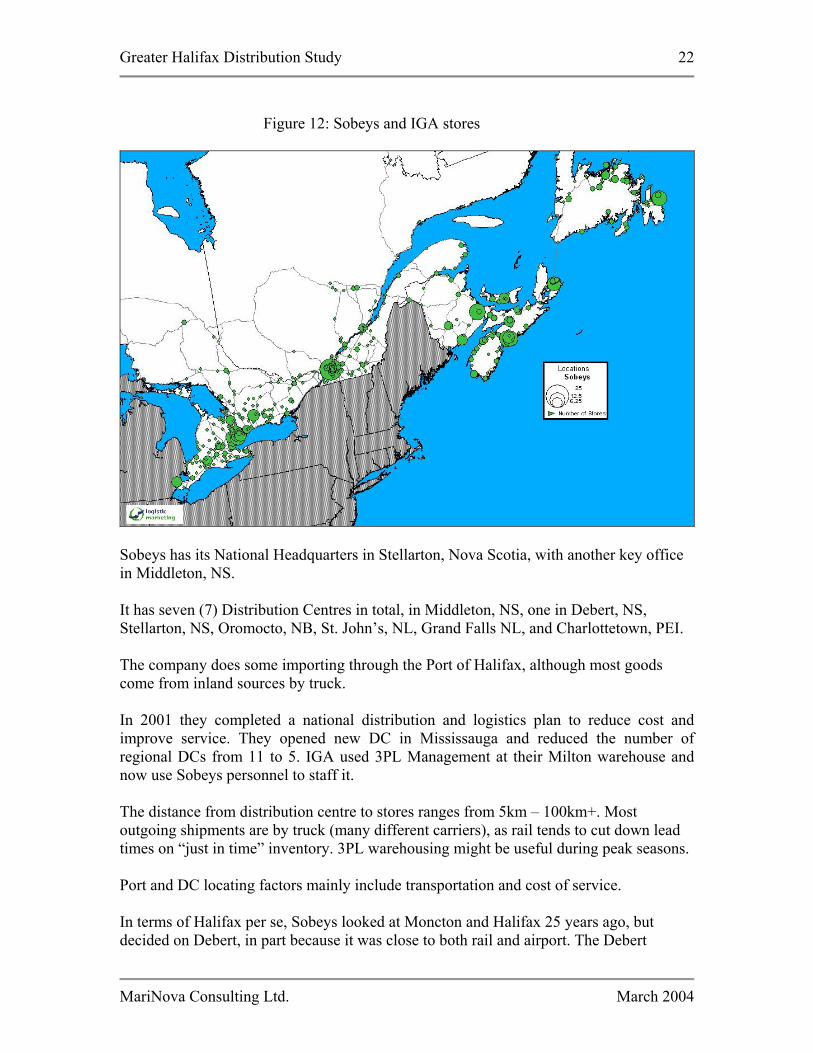
Figure 12: Sobeys and IGA stores
Sobeys has its National Headquarters in Stellarton, Nova Scotia, with another key office in Middleton, NS. It has seven (7) Distribution Centres in total, in Middleton, NS, one in Debert, NS, Stellarton, NS, Oromocto, NB, St. John’s, NL, Grand Falls NL, and Charlottetown, PEI.
The company does some importing through the Port of Halifax, although most goods come from inland sources by truck. In 2001 they completed a national distribution and logistics plan to reduce cost and improve service. They opened new DC in Mississauga and reduced the number of regional DCs from 11 to 5. IGA used 3PL Management at their Milton warehouse and now use Sobeys personnel to staff it. The distance from distribution centre to stores ranges from 5km – 100km+. Most outgoing shipments are by truck (many different carriers), as rail tends to cut down lead times on “just in time” inventory. 3PL warehousing might be useful during peak seasons. Port and DC locating factors mainly include transportation and cost of service. In terms of Halifax per se, Sobeys looked at Moncton and Halifax 25 years ago, but decided on Debert, in part because it was close to both rail and airport. The Debert
MariNova Consulting Ltd. March 2004
Greater Halifax Distribution Study
23
facility was recently expanded. They are currently not interested in locating adjacent to the Port of Halifax, and are working well with their current number of warehouses / distribution centres.
3.9 Kent Building Supplies Company: Headquarters Location: Estimated Import Volume 2002: Overview of Transport Network: Canadian or
US Port Cross Dock
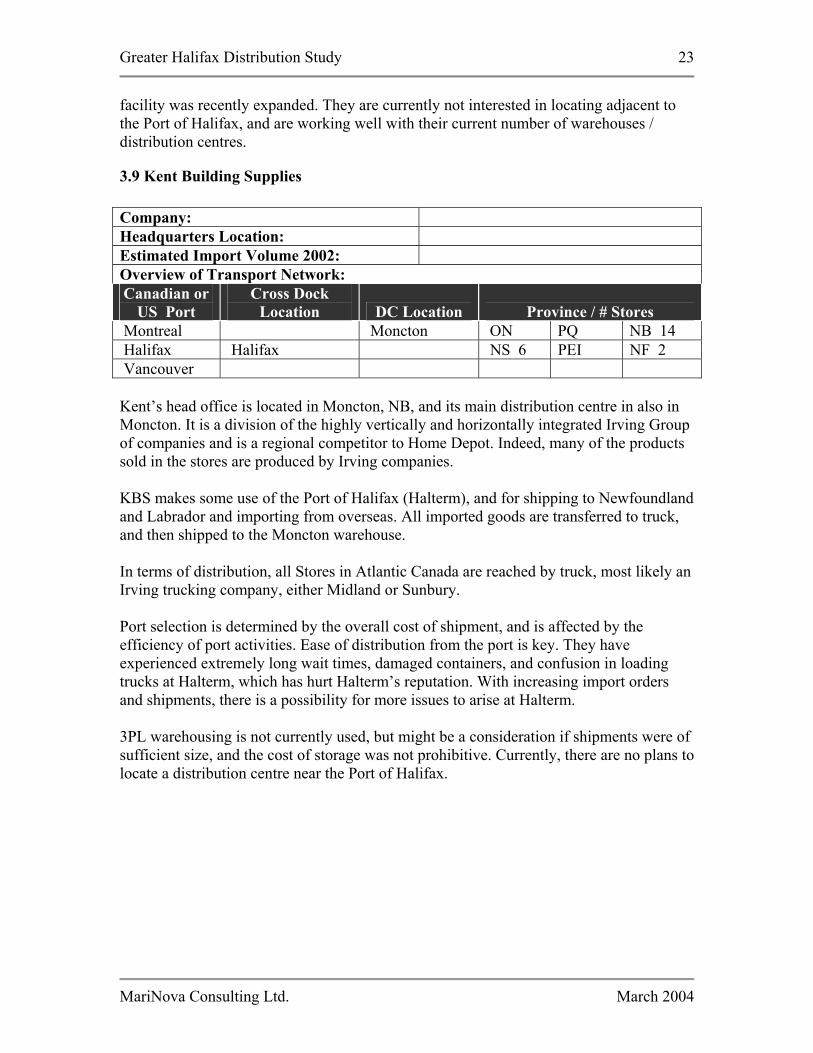
Location DC Location Province / # Stores Montreal Moncton ON PQ NB 14 Halifax Halifax NS 6 PEI NF 2 Vancouver Kent’s head office is located in Moncton, NB, and its main distribution centre in also in Moncton. It is a division of the highly vertically and horizontally integrated Irving Group of companies and is a regional competitor to Home Depot. Indeed, many of the products sold in the stores are produced by Irving companies.
KBS makes some use of the Port of Halifax (Halterm), and for shipping to Newfoundland and Labrador and importing from overseas. All imported goods are transferred to truck, and then shipped to the Moncton warehouse.
In terms of distribution, all Stores in Atlantic Canada are reached by truck, most likely an Irving trucking company, either Midland or Sunbury. Port selection is determined by the overall cost of shipment, and is affected by the efficiency of port activities. Ease of distribution from the port is key. They have experienced extremely long wait times, damaged containers, and confusion in loading trucks at Halterm, which has hurt Halterm’s reputation. With increasing import orders and shipments, there is a possibility for more issues to arise at Halterm. 3PL warehousing is not currently used, but might be a consideration if shipments were of sufficient size, and the cost of storage was not prohibitive. Currently, there are no plans to locate a distribution centre near the Port of Halifax.
MariNova Consulting Ltd. March 2004
Greater Halifax Distribution Study
24
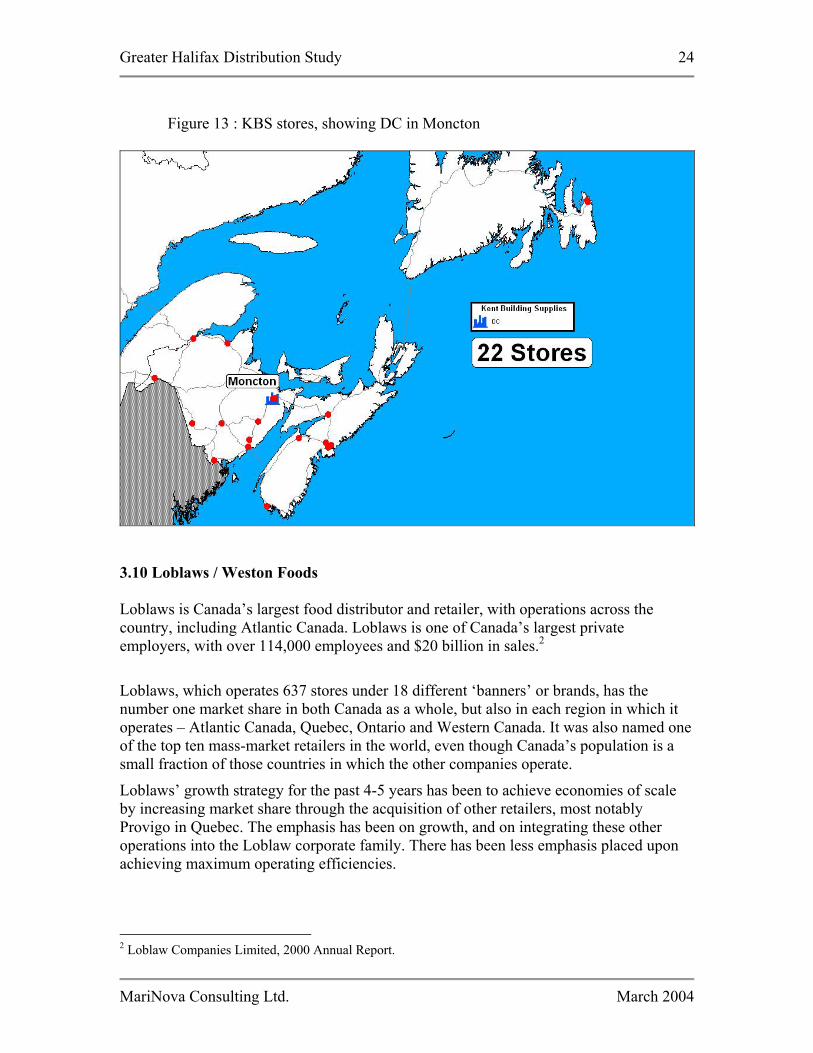
Figure 13 : KBS stores, showing DC in Moncton
3.10 Loblaws / Weston Foods Loblaws is Canada’s largest food distributor and retailer, with operations across the country, including Atlantic Canada. Loblaws is one of Canada’s largest private employers, with over 114,000 employees and $20 billion in sales.2
Loblaws, which operates 637 stores under 18 different ‘banners’ or brands, has the number one market share in both Canada as a whole, but also in each region in which it operates – Atlantic Canada, Quebec, Ontario and Western Canada. It was also named one of the top ten mass-market retailers in the world, even though Canada’s population is a small fraction of those countries in which the other companies operate.
Loblaws’ growth strategy for the past 4-5 years has been to achieve economies of scale by increasing market share through the acquisition of other retailers, most notably Provigo in Quebec. The emphasis has been on growth, and on integrating these other operations into the Loblaw corporate family. There has been less emphasis placed upon achieving maximum operating efficiencies.
2 Loblaw Companies Limited, 2000 Annual Report.
MariNova Consulting Ltd. March 2004
Greater Halifax Distribution Study
25
The company operates 1,747 stores, with 1,670 as conventional supermarkets and 77 Warehouse Stores. Store trading names include Atlantic Save Easy, Atlantic Superstore; Cash & Carry; Extra Foods; Fortinos; Loblaws; Lucky Dollar; Maxi; No Frills; Real Canadian Superstore; Real Canadian Wholesale Club; Shop Easy; Super Value; Value Mart; Zehrs . Loblaws has the number one market share in both Canada as a whole, but also in each region in which it operates – Atlantic Canada, Quebec, Ontario and Western Canada. Company: Weston: Headquarters Location: Toronto Contact: Estimated Import Volume 2002: Overview of Transport Network: Canadian or
US Port Cross Dock
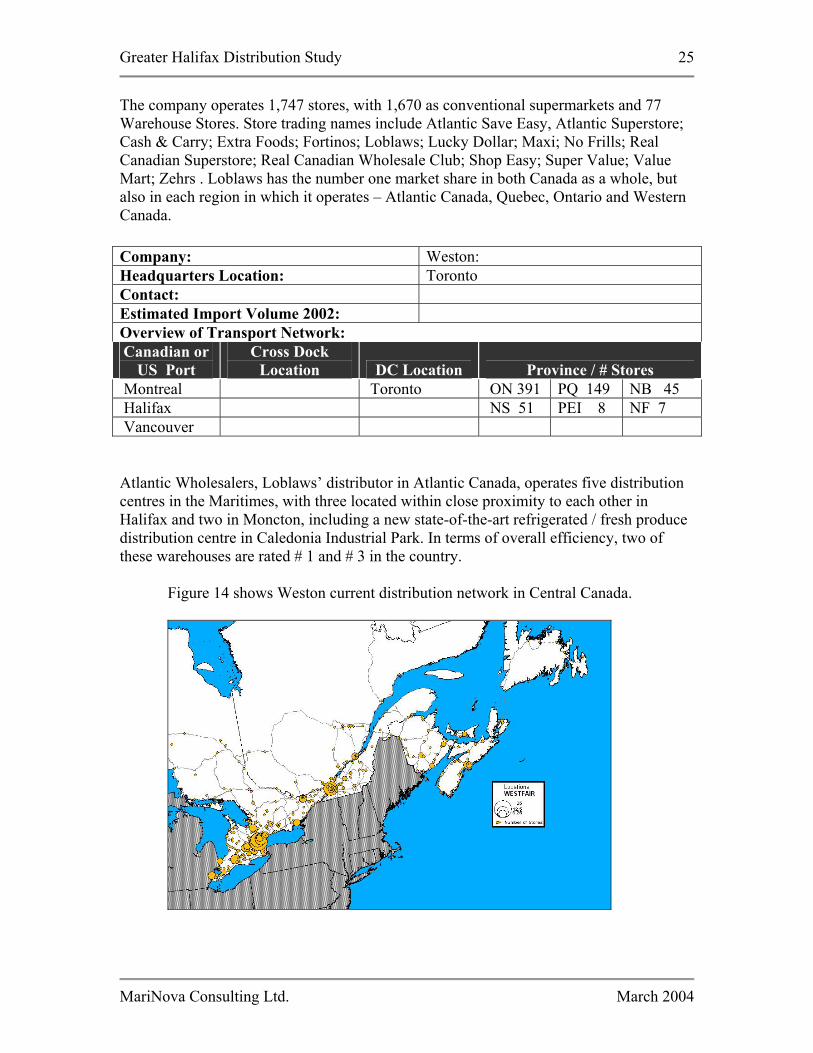
Location DC Location Province / # Stores Montreal Toronto ON 391 PQ 149 NB 45 Halifax NS 51 PEI 8 NF 7 Vancouver Atlantic Wholesalers, Loblaws’ distributor in Atlantic Canada, operates five distribution centres in the Maritimes, with three located within close proximity to each other in Halifax and two in Moncton, including a new state-of-the-art refrigerated / fresh produce distribution centre in Caledonia Industrial Park. In terms of overall efficiency, two of these warehouses are rated # 1 and # 3 in the country.
Figure 14 shows Weston current distribution network in Central Canada.
MariNova Consulting Ltd. March 2004
Greater Halifax Distribution Study
26
The location of stores is concentrated heavily in the southern Ontario marketplace. This region also is the location of the distribution centres to service their demand. Atlantic Wholesalers, Loblaws’ distributor in Atlantic Canada, operates five distribution centres in the Maritimes, with three located within close proximity to each other in Halifax and two in Moncton, including a new state-of-the-art refrigerated / fresh produce distribution centre in Caledonia Industrial Park. Each of these Maritime region warehouses handles approximately $500 million in inventory per year, or $10 million per week..
It is understood that Loblaws currently imports about 1,000 FEU per annum through the Port of Halifax. Sixty percent (60%) of this cargo is destined for Halifax and the rest for Atlantic Canada.
Loblaws currently imports 5,000 FEU through Halifax, mainly general merchandise from South East Asia and food products from Europe. About 75% of this cargo is destined for the local Halifax market. Port selection is driven primarily by price and the cost of trans-Pacific vs. Panama services. Halifax has an advantage for shorter timeline products originating in Europe. More carriers using the Suez route might result in more volume via Halifax.
Loblaws is presently having difficulties relating to the CN strike as well as what they consider to be a more militant and less co-operative union that CP’s. They have had better luck using Vancouver, which give them pause when it comes to deciding on future investment at Halifax.
All distribution is handled at the facilities described above. For imports through Halifax they use Sable Warehousing, which is a 3PL owned by the Day & Ross group. At the present time, they do not see any change in their existing arrangements, which seems to contradict the information gleaned above. They will also be looking at doing some more consolidation further up the supply chain i.e. in the Far East itself.
We have learned, unofficially, that as late as November 2003 Loblaws was examining the potential to develop a 300,000 sq. ft. transload facility in Halifax to handle European imports for eastern Canada. The facility could handle as many as 10,000 containers per annum. Trailers arriving with merchandise eastbound from Toronto and west would be discharged in this warehouse and the trucks filled with merchandise for western destinations. This would appear to be a major opportunity for the Port of Halifax.
3.11 Nova Scotia Liquor Commission The Nova Scotia Liquor Commission has one warehouse, located at Bayer’s Lake Industrial Park in Halifax. It is a 130,000 sq. ft facility. The Commission has 100 stores, 6 agencies and also provides service to four private stores. It will be opening new stores in the next 3-5 years, including a larger format attached to Loblaws and Sobeys supermarkets.
The Commission presently imports about 500 containers per year through the Port of Halifax and another 500 trailer loads are imported from the U.S. via rail. Containers arrive at the port, are sent to a 3PL (Cantrax), destuffed, and then shipped to the NSLC
MariNova Consulting Ltd. March 2004
Greater Halifax Distribution Study
27
warehouse. This procedure is costly and somewhat inefficient. They also commented on the lack of shipping service and especially frequency from some markets which may necessitate the construction of additional warehouse capacity for inventory storage.
There is no scope for handling the business of other liquor commissions, as thay are protective of their “turf” and the jobs that are created. NSLC does, however, provide some service to the PEI commission.
MariNova Consulting Ltd. March 2004
Greater Halifax Distribution Study 28
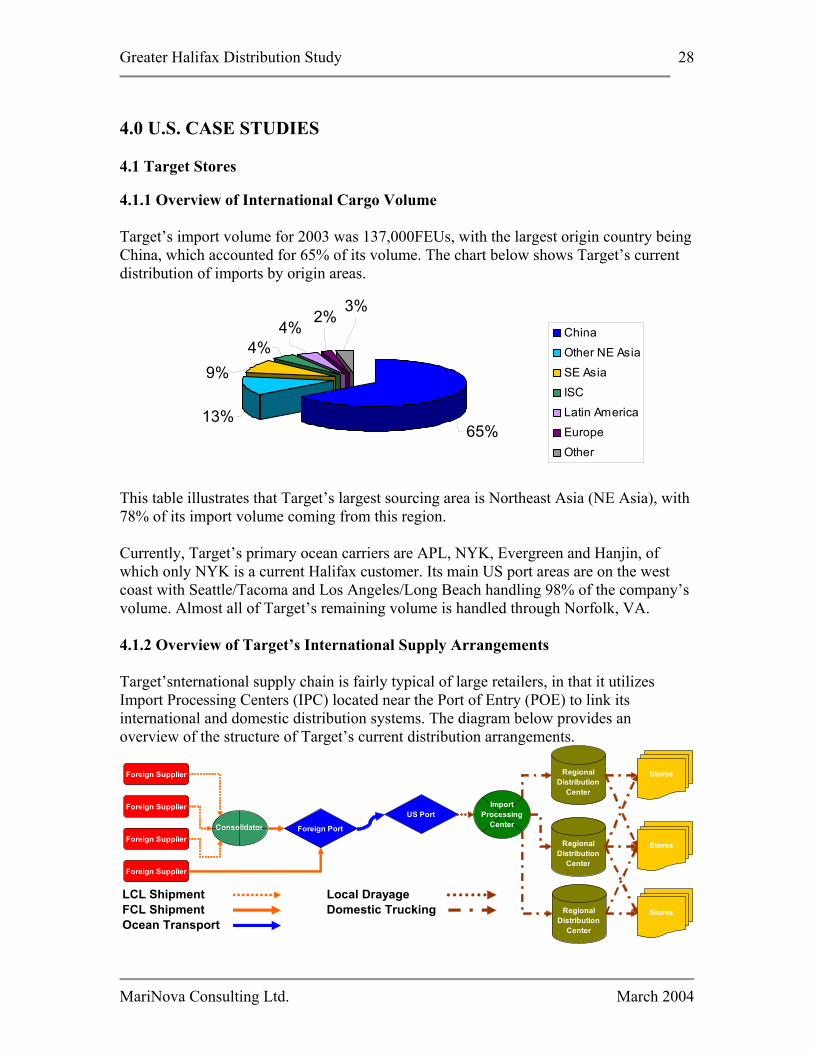
4.0 U.S. CASE STUDIES 4.1 Target Stores 4.1.1 Overview of International Cargo Volume Target’s import volume for 2003 was 137,000FEUs, with the largest origin country being China, which accounted for 65% of its volume. The chart below shows Target’s current distribution of imports by origin areas.
13%
4%
65%
2%3%
4%9%
China
Other NE Asia
SE AsiaISC
Latin America
Europe
Other
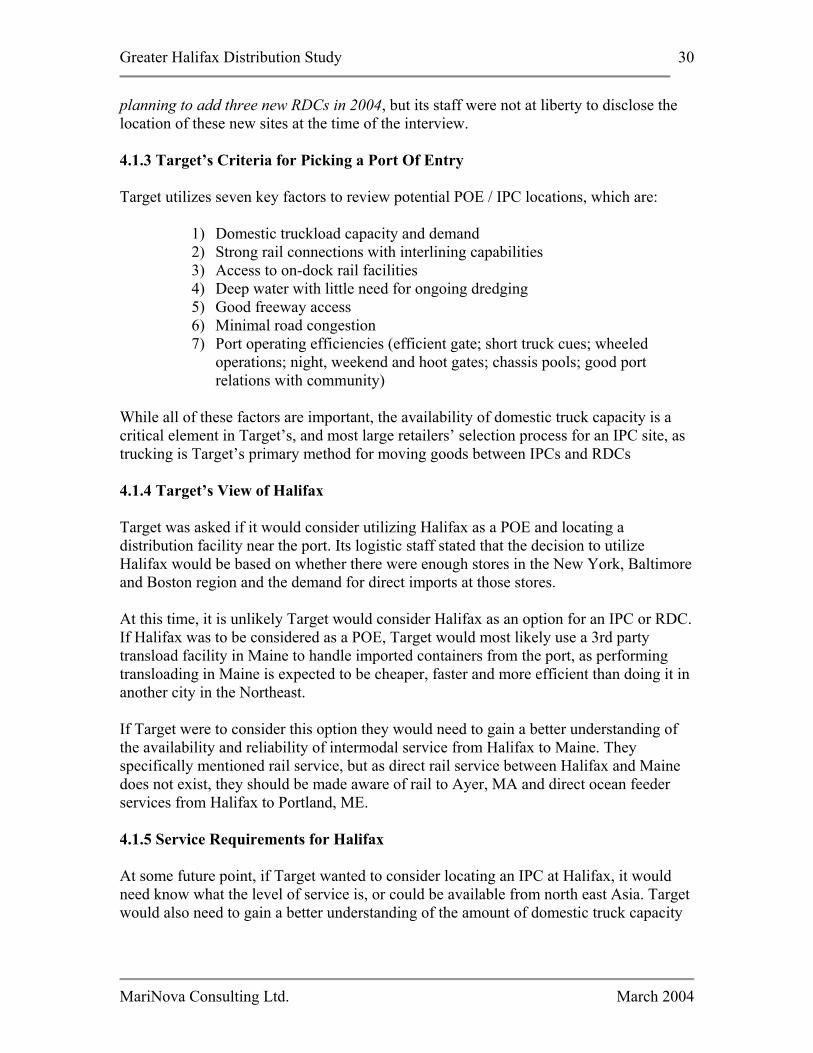
This table illustrates that Target’s largest sourcing area is Northeast Asia (NE Asia), with 78% of its import volume coming from this region. Currently, Target’s primary ocean carriers are APL, NYK, Evergreen and Hanjin, of which only NYK is a current Halifax customer. Its main US port areas are on the west coast with Seattle/Tacoma and Los Angeles/Long Beach handling 98% of the company’s volume. Almost all of Target’s remaining volume is handled through Norfolk, VA. 4.1.2 Overview of Target’s International Supply Arrangements Target’snternational supply chain is fairly typical of large retailers, in that it utilizes Import Processing Centers (IPC) located near the Port of Entry (POE) to link its international and domestic distribution systems. The diagram below provides an overview of the structure of Target’s current distribution arrangements.
Foreign Supplier
Foreign Supplier
Foreign Supplier
Foreign Supplier
Consolidator Foreign Port
US PortImport
Processing Center
Regional Distribution
Center
Regional Distribution
Center
Regional Distribution
Center
Stores
Stores
Stores
LCL Shipment Local DrayageFCL Shipment Domestic TruckingOcean Transport
MariNova Consulting Ltd. March 2004
Greater Halifax Distribution Study 29
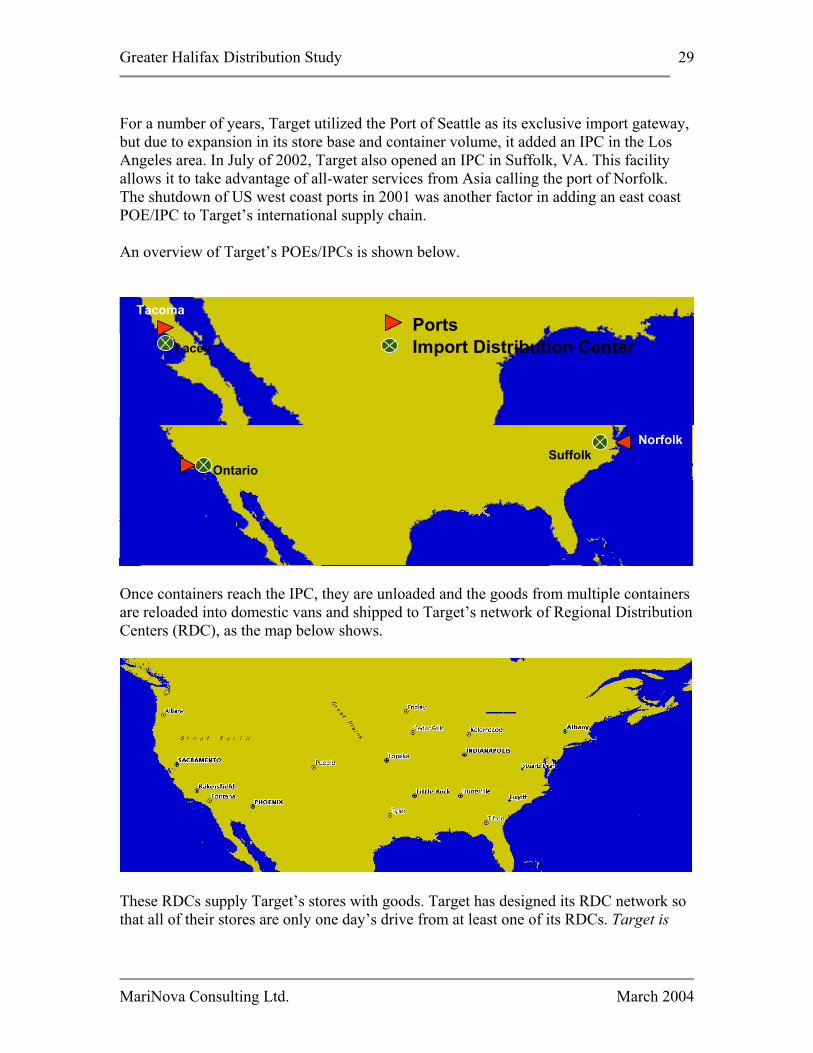
For a number of years, Target utilized the Port of Seattle as its exclusive import gateway, but due to expansion in its store base and container volume, it added an IPC in the Los Angeles area. In July of 2002, Target also opened an IPC in Suffolk, VA. This facility allows it to take advantage of all-water services from Asia calling the port of Norfolk. The shutdown of US west coast ports in 2001 was another factor in adding an east coast POE/IPC to Target’s international supply chain. An overview of Target’s POEs/IPCs is shown below.
Tacoma
Norfolk
Ontario
Lacey
Suffolk
PortsImport Distribution Center
Tacoma
Norfolk
Ontario
Lacey
Suffolk
PortsImport Distribution Center
Once containers reach the IPC, they are unloaded and the goods from multiple containers are reloaded into domestic vans and shipped to Target’s network of Regional Distribution Centers (RDC), as the map below shows.
These RDCs supply Target’s stores with goods. Target has designed its RDC network so that all of their stores are only one day’s drive from at least one of its RDCs. Target is
MariNova Consulting Ltd. March 2004
Greater Halifax Distribution Study 30
planning to add three new RDCs in 2004, but its staff were not at liberty to disclose the location of these new sites at the time of the interview. 4.1.3 Target’s Criteria for Picking a Port Of Entry Target utilizes seven key factors to review potential POE / IPC locations, which are:
1) Domestic truckload capacity and demand 2) Strong rail connections with interlining capabilities 3) Access to on-dock rail facilities 4) Deep water with little need for ongoing dredging 5) Good freeway access 6) Minimal road congestion 7) Port operating efficiencies (efficient gate; short truck cues; wheeled
operations; night, weekend and hoot gates; chassis pools; good port relations with community)
While all of these factors are important, the availability of domestic truck capacity is a critical element in Target’s, and most large retailers’ selection process for an IPC site, as trucking is Target’s primary method for moving goods between IPCs and RDCs 4.1.4 Target’s View of Halifax Target was asked if it would consider utilizing Halifax as a POE and locating a distribution facility near the port. Its logistic staff stated that the decision to utilize Halifax would be based on whether there were enough stores in the New York, Baltimore and Boston region and the demand for direct imports at those stores. At this time, it is unlikely Target would consider Halifax as an option for an IPC or RDC. If Halifax was to be considered as a POE, Target would most likely use a 3rd party transload facility in Maine to handle imported containers from the port, as performing transloading in Maine is expected to be cheaper, faster and more efficient than doing it in another city in the Northeast. If Target were to consider this option they would need to gain a better understanding of the availability and reliability of intermodal service from Halifax to Maine. They specifically mentioned rail service, but as direct rail service between Halifax and Maine does not exist, they should be made aware of rail to Ayer, MA and direct ocean feeder services from Halifax to Portland, ME. 4.1.5 Service Requirements for Halifax At some future point, if Target wanted to consider locating an IPC at Halifax, it would need know what the level of service is, or could be available from north east Asia. Target would also need to gain a better understanding of the amount of domestic truck capacity
MariNova Consulting Ltd. March 2004
Greater Halifax Distribution Study 31
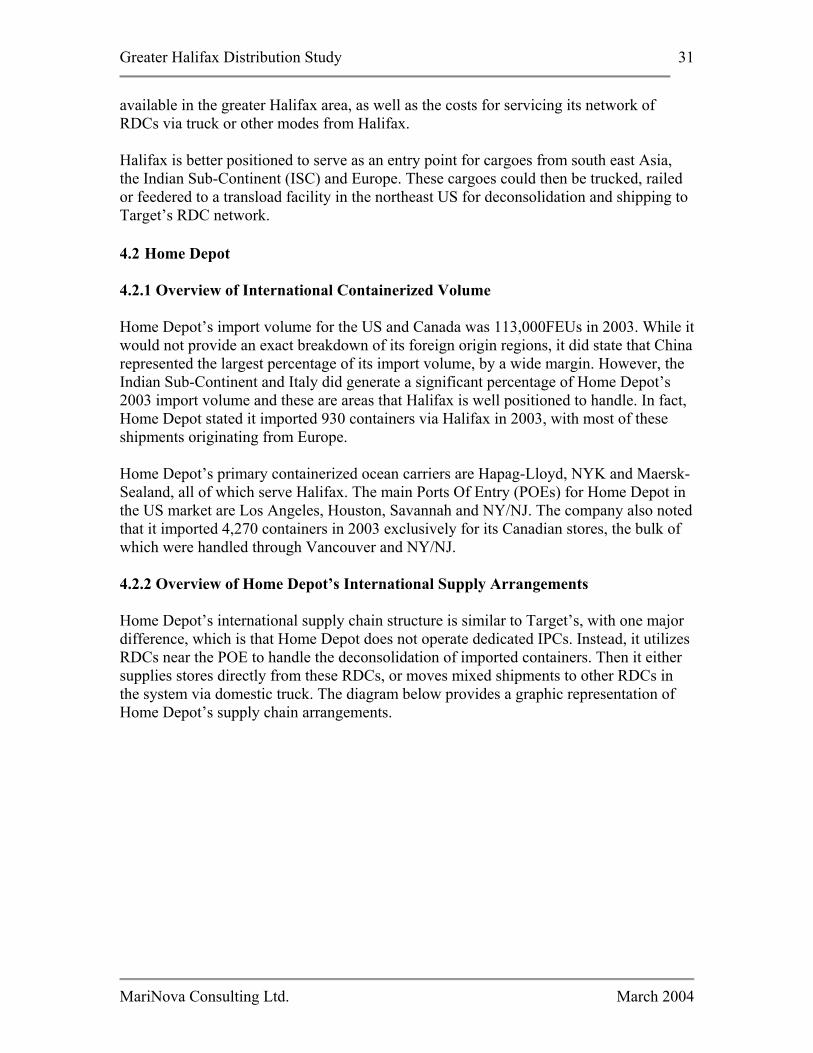
available in the greater Halifax area, as well as the costs for servicing its network of RDCs via truck or other modes from Halifax. Halifax is better positioned to serve as an entry point for cargoes from south east Asia, the Indian Sub-Continent (ISC) and Europe. These cargoes could then be trucked, railed or feedered to a transload facility in the northeast US for deconsolidation and shipping to Target’s RDC network. 4.2 Home Depot 4.2.1 Overview of International Containerized Volume Home Depot’s import volume for the US and Canada was 113,000FEUs in 2003. While it would not provide an exact breakdown of its foreign origin regions, it did state that China represented the largest percentage of its import volume, by a wide margin. However, the Indian Sub-Continent and Italy did generate a significant percentage of Home Depot’s 2003 import volume and these are areas that Halifax is well positioned to handle. In fact, Home Depot stated it imported 930 containers via Halifax in 2003, with most of these shipments originating from Europe. Home Depot’s primary containerized ocean carriers are Hapag-Lloyd, NYK and Maersk-Sealand, all of which serve Halifax. The main Ports Of Entry (POEs) for Home Depot in the US market are Los Angeles, Houston, Savannah and NY/NJ. The company also noted that it imported 4,270 containers in 2003 exclusively for its Canadian stores, the bulk of which were handled through Vancouver and NY/NJ. 4.2.2 Overview of Home Depot’s International Supply Arrangements Home Depot’s international supply chain structure is similar to Target’s, with one major difference, which is that Home Depot does not operate dedicated IPCs. Instead, it utilizes RDCs near the POE to handle the deconsolidation of imported containers. Then it either supplies stores directly from these RDCs, or moves mixed shipments to other RDCs in the system via domestic truck. The diagram below provides a graphic representation of Home Depot’s supply chain arrangements.
MariNova Consulting Ltd. March 2004
Greater Halifax Distribution Study 32
Foreign Supplier
Foreign Supplier
Foreign Supplier
Foreign Supplier
Consolidator Foreign Port
US Port
Regional Distribution
Center
Regional Distribution
Center
Regional Distribution
Center
Stores
Stores
Stores
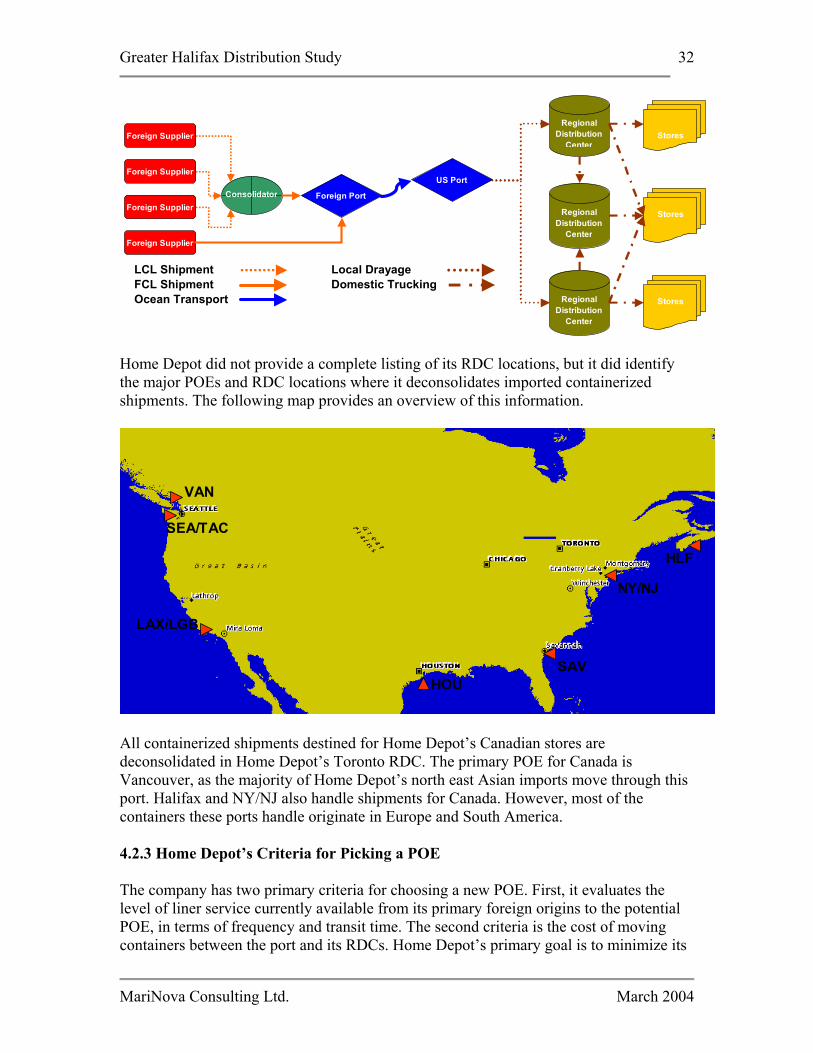
Home Depot did not provide a complete listing of its RDC locations, but it did identify the major POEs and RDC locations where it deconsolidates imported containerized shipments. The following map provides an overview of this information.
VAN
SEA/TAC
LAX/LGB
HOUSAV
NY/NJ
HLF
VAN
SEA/TAC
LAX/LGB
HOUSAV
NY/NJ
HLF
All containerized shipments destined for Home Depot’s Canadian stores are deconsolidated in Home Depot’s Toronto RDC. The primary POE for Canada is Vancouver, as the majority of Home Depot’s north east Asian imports move through this port. Halifax and NY/NJ also handle shipments for Canada. However, most of the containers these ports handle originate in Europe and South America. 4.2.3 Home Depot’s Criteria for Picking a POE The company has two primary criteria for choosing a new POE. First, it evaluates the level of liner service currently available from its primary foreign origins to the potential POE, in terms of frequency and transit time. The second criteria is the cost of moving containers between the port and its RDCs. Home Depot’s primary goal is to minimize its
LCL Shipment Local DrayageFCL Shipment Domestic TruckingOcean Transport
MariNova Consulting Ltd. March 2004
Greater Halifax Distribution Study 33
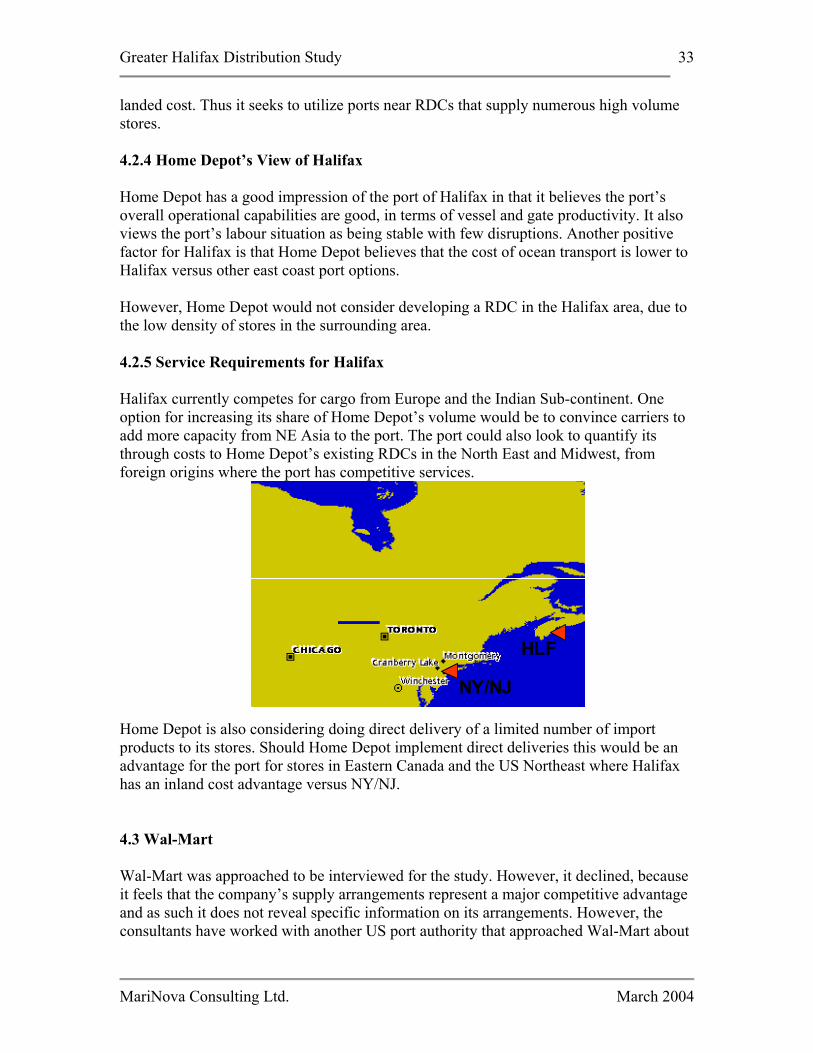
landed cost. Thus it seeks to utilize ports near RDCs that supply numerous high volume stores. 4.2.4 Home Depot’s View of Halifax Home Depot has a good impression of the port of Halifax in that it believes the port’s overall operational capabilities are good, in terms of vessel and gate productivity. It also views the port’s labour situation as being stable with few disruptions. Another positive factor for Halifax is that Home Depot believes that the cost of ocean transport is lower to Halifax versus other east coast port options. However, Home Depot would not consider developing a RDC in the Halifax area, due to the low density of stores in the surrounding area. 4.2.5 Service Requirements for Halifax Halifax currently competes for cargo from Europe and the Indian Sub-continent. One option for increasing its share of Home Depot’s volume would be to convince carriers to add more capacity from NE Asia to the port. The port could also look to quantify its through costs to Home Depot’s existing RDCs in the North East and Midwest, from foreign origins w
here the port has competitive services.
ome Depot is also considering doing direct delivery of a limited number of import roducts to its stores. Should Home Depot implement direct deliveries this would be an
ax
.3 Wal-Mart
pproached to be interviewed for the study. However, it declined, because feels that the company’s supply arrangements represent a major competitive advantage
NY/NJ
HLF
NY/NJ
HLF
Hpadvantage for the port for stores in Eastern Canada and the US Northeast where Halifhas an inland cost advantage versus NY/NJ. 4 Wal-Mart was aitand as such it does not reveal specific information on its arrangements. However, the consultants have worked with another US port authority that approached Wal-Mart about
MariNova Consulting Ltd. March 2004
Greater Halifax Distribution Study 34
locating a distribution facility near a greenfield container terminal. Based on this workand publicly available sources, a high level overview of Wal-Mart’s international supply chain has been completed below. 4.3.1 Wal-Mart’s Containerized
Volume
, in the US. Based on PIERS statistics Wal-art imported 291,900 TEUS in 2002 and like most large retailers, in excess of 70% of
ational Supply Arrangements
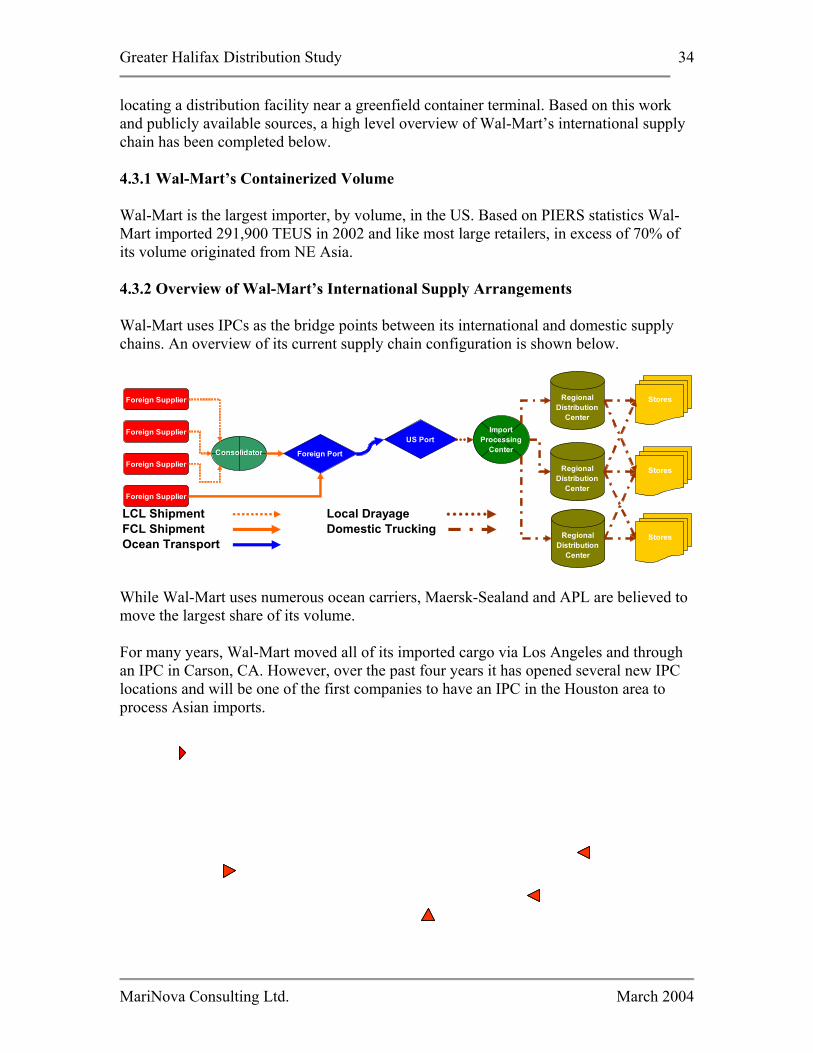
mestic supply hains. An overview of its current supply chain configuration is shown below.
Wal-Mart is the largest importer, by volumeMits volume originated from NE Asia. 4.3.2 Overview of Wal-Mart’s Intern Wal-Mart uses IPCs as the bridge points between its international and doc
Foreign Supplier
Foreign Supplier
Foreign Supplier
Foreign Supplier
Consolidator Foreign Port
US PortImport
Processing Center
Regional Distribution
Center
Regional Distribution
Center
Regional Distribution
Center
Stores
Stores
Stores
LCL Shipment Local Drayage
FCL Shipment Domestic TruckingOcean Transport
While Wal-Mart uses numerous ocean carriers, Maersk-Sealand and APL are believed to ove the largest share of its volume.
f its imported cargo via Los Angeles and through n IPC in Carson, CA. However, over the past four years it has opened several new IPC
m For many years, Wal-Mart moved all oalocations and will be one of the first companies to have an IPC in the Houston area to process Asian imports.
Los Angeles
Norfolk
Savannah
Houston Late 2004
Los Angeles
Norfolk
Savannah
Houston Late 2004
MariNova Consulting Ltd. March 2004
Greater Halifax Distribution Study 35
4.3.3 Wal-Mart’s Criteria for Picking a POE Wal-Mart’s focus on cost control is well known and this is a critical driver for choosing a location. However, its experience in California, in terms of labour disruptions and the under-supply of domestic trucking service has caused Wal-Mart to look at more than just cost in making site decisions. While working with Wal-Mart on evaluating our client’s greenfield site, the company made it clear that it could not proceed without quantifying the amount of domestic truck capacity available from the location. Another area of concern for Wal-Mart is the labour climate in an area. Wal-Mart has been faced with several drives to unionize its labour force and does not wish to enter an area
here unions have a strong presence.
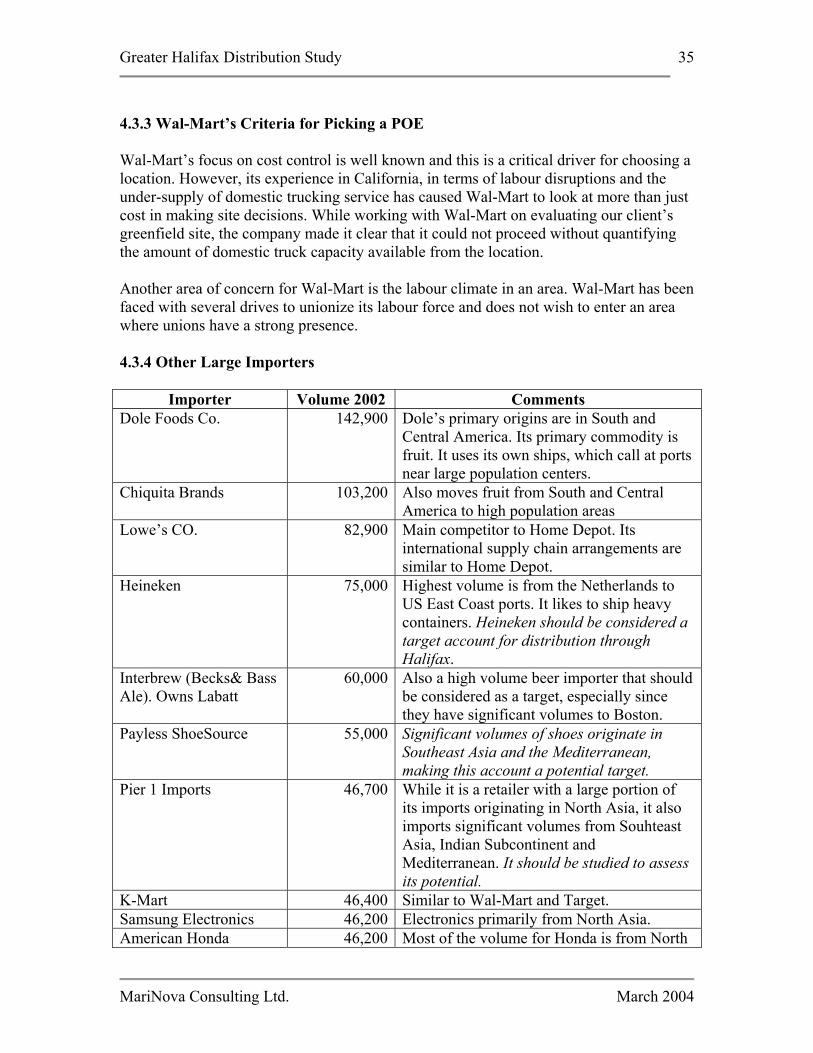
.3.4 Other Large Importers
w 4
Importer Volume 2002 Comments Dole Foods Co. 142,900 Dole’s primary origins are in South and
Central America. Its primary commodity is fruit. It uses its own ships, which call at portnear large population ce
s nters.
Chiquita Brands 103,200 Also moves fruit from South and Central America to high population areas
Lowe’s CO. 82,900 Main competitor to Home Depot. Its international supply chain arrangements are similar to Home Depot.
Heineken 75,000 Highest volume is from the Netherlands to US East Coast ports. It likes to ship heavy containers. Heineken should be considered a target account for distribution through Halifax. Also a high volume beer importer that should be considered as a target, especthey have significant volumes to Boston. Significant volumes of shoes originSoutheast Asia and the Mediterraneanmaking this account a potential target. While it is a retailer withits imports originating in North Asia, it alsoimports significant volumes from SouhteasAsia, Indian Subcontinent and Mediterranean. It should be studied to aits potent
K-Mart 46,400 Similar to Wal-Mart and Target. Samsung Electronics 46,200 Electronics primarily from North Asia.
Most of the volume for Honda is from No
Interbrew (Becks& Bass Ale). Owns Labatt
60,000ially since
Payless ShoeSource 55,000 ate in ,
Pier 1 Imports 46,700 a large portion of
t
ssess ial.
American Honda 46,200 rth
MariNova Consulting Ltd. March 2004

Greater Halifax Distribution Study 36
Asia and is handled via WC ports. Retailer whose primary origin area is NoAsia
Ashley Furniture 45,200 Furniture import mainly from North Asia. Italso tends to use SEA/TAC and transsload near the port to domestic vans.
Big Lots Inc 45,800 rth
MariNova Consulting Ltd. March 2004
Greater Halifax Distribution Study 37
5.0 HALIFAX TRADE PATTERNS 5.1 Introduction To get a better understanding of Halifax’s position in the international supply chain and to identify new opportunities for the port within this context, we conducted the following review:
• Current trade patterns into Halifax; • Locations of Canadian Custom Bonded warehouses and Terminals; • Growth of Containerization 1996 to 2000 by top 100 Ports • Halifax Service Corridors by Shipping Line
By comparing both the import and export movement of containers and bulk products to and from Halifax, we identified if products are being used by the retail or manufacturing sectors. Current trade data shows which product sectors by world region country of origin are being imported through Halifax. The locations of Custom Bonded Warehouses by company assisted in identifying the present locations of DCs and terminals that shippers and importers utilize. This list can also assist in identifying future contacts for the Partnership and HPA to approach. By assessing the growth of the Top 100 Ports in the World by TEUs handled from 1996 to 2000 illustrates which ports were growing at the fastest rates. Once we identified the top growth ports we compared which container lines provide service to and from Halifax. From this assessment we then identified the countries and whether there were large import-trade houses that represented shippers, manufacturers or wholesalers, which could be approached by the Partnership and HPA as candidates for the development of DCs or transload facilities, or indeed, shipping through the port.
5.2 Current Imports and Exports
Table 1 ranks the current imports of containers by product group and world region. The world regions are colour coded for ease of identifying which regions are dominant in world trade.
MariNova Consulting Ltd. March 2004

Greater Halifax Distribution Study 38
Table 1: Imports by Region, Product Group and TEUs
Region COMMODITY TONNAGE Est Teu
UK EU MACHINERY - Machinery, Mechanical Appliances, Parts 157,083 11,220Med BUILDING - Other Ceramic Products 70,943 5,067UK EU CHEMICALS - Other Inorganic 66,279 4,734Far East RUBBER - Natural 47,434 3,388Med BUILDING – Brick, Tile, Ceramic 36,558 2,611UK EU MISCELLANEOUS MANUFACTURED GOODS 35,398 2,528UK EU FRUIT - Fruit/Nuts: Other Edible 32,073 2,291Med BEVERAGES - Wine/Cider 31,545 2,253India Sub CLOTHING - Accessories 30,060 2,147UK EU PAPER - Other 21,904 1,565Med MACHINERY - Machinery, Mechanical Appliances, Parts 20,514 1,465UK EU PLASTICS - Other 20,416 1,458Med VEGETABLES - Prepared 19,854 1,418UK EU FURNITURE / LIGHTS / MATTRESSES 19,602 1,400Med FURNITURE / LIGHTS / MATTRESSES 19,216 1,373Scandinavia FURNITURE / LIGHTS / MATTRESSES 19,187 1,371UK EU MISCELLANEOUS - General, Mail, etc. 18,465 1,319UK EU BEVERAGES - Beer 17,675 1,263UK EU VEHICLES - Other Parts 17,669 1,262UK EU BUILDING - Other Ceramic Products 17,468 1,248UK EU METAL - Aluminum & Articles 17,370 1,241India Sub TEXTILES – Cotton 17,061 1,219Med STONE - Monument/Building 16,469 1,176Scandinavia MACHINERY - Machinery, Mechanical Appliances, Parts 15,061 1,076India Sub MISCELLANEOUS MANUFACTURED GOODS 14,711 1,051UK EU FOOD - Sugar Confectionery 14,489 1,035
The table clearly shows that the EU and UK region is the key trading bloc for Halifax imports, followed by the Mediterranean region and the India Sub continent.
Machinery products were the top product category. We do not know if this was for parts of machines or for new projects requiring new equipment.
The key product group from the Mediterranean is Building Products of ceramic or tile. These commodities would flow to the commercial hardware sector, to stores such as Home Depot, Home Hardware or to large wholesalers of ceramic materials.
5.3 Growth of Containerization 2000 to 2003
The consultants identified the 146 ports around the world and compared the growth in container traffic from 1996 to 2003 to the lines that service both Halifax and any of these ports.
Figures 10, 11 and 12 show the growth in container traffic from 2001 to 2003 to EU, India and Asia. We identified some of the key ports in each region.
MariNova Consulting Ltd. March 2004
Greater Halifax Distribution Study 39
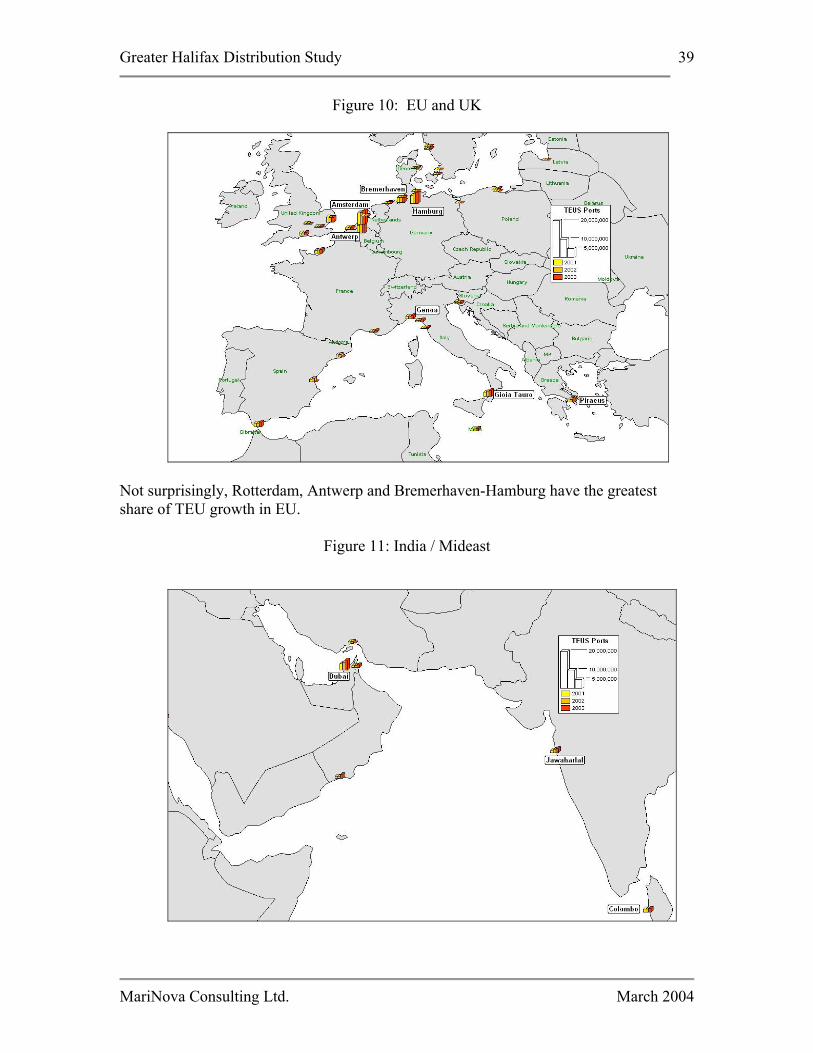
Figure 10: EU and UK
Not surprisingly, Rotterdam, Antwerp and Bremerhaven-Hamburg have the greatest share of TEU growth in EU.
Figure 11: India / Mideast
MariNova Consulting Ltd. March 2004
Greater Halifax Distribution Study 40
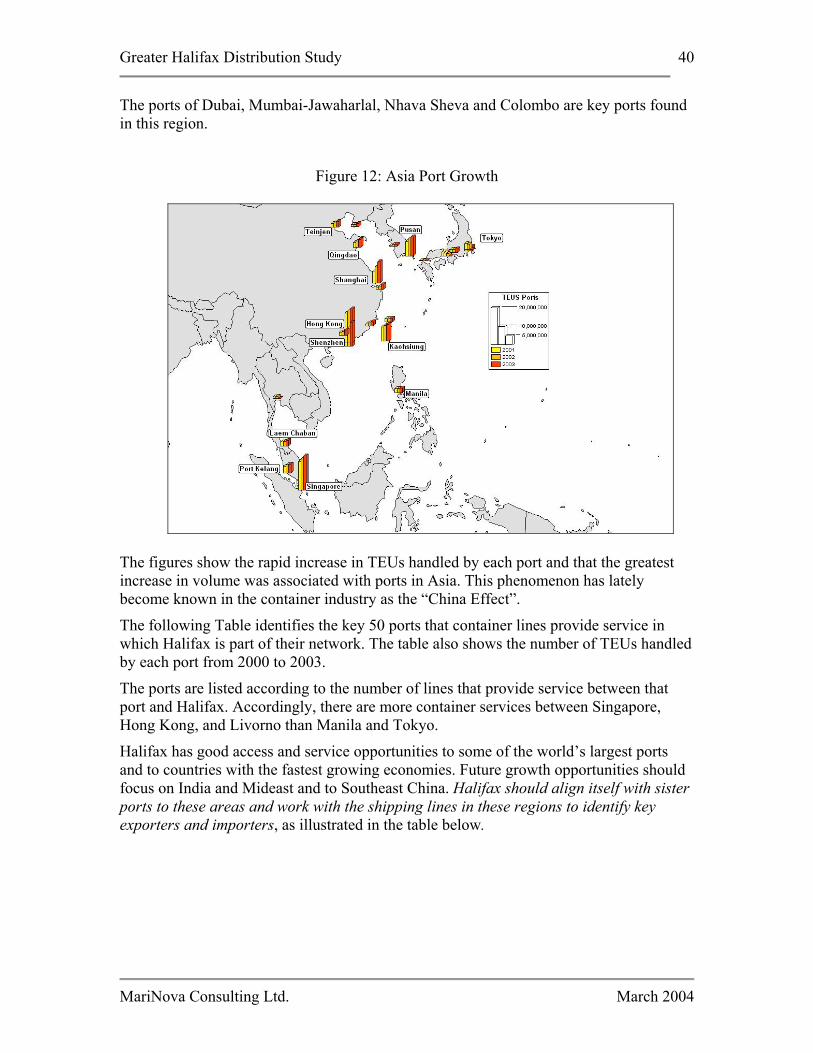
The ports of Dubai, Mumbai-Jawaharlal, Nhava Sheva and Colombo are key ports found in this region.
Figure 12: Asia Port Growth
The figures show the rapid increase in TEUs handled by each port and that the greatest increase in volume was associated with ports in Asia. This phenomenon has lately become known in the container industry as the “China Effect”.
The following Table identifies the key 50 ports that container lines provide service in which Halifax is part of their network. The table also shows the number of TEUs handled by each port from 2000 to 2003.
The ports are listed according to the number of lines that provide service between that port and Halifax. Accordingly, there are more container services between Singapore, Hong Kong, and Livorno than Manila and Tokyo.
Halifax has good access and service opportunities to some of the world’s largest ports and to countries with the fastest growing economies. Future growth opportunities should focus on India and Mideast and to Southeast China. Halifax should align itself with sister ports to these areas and work with the shipping lines in these regions to identify key exporters and importers, as illustrated in the table below.
MariNova Consulting Ltd. March 2004
Greater Halifax Distribution Study 41
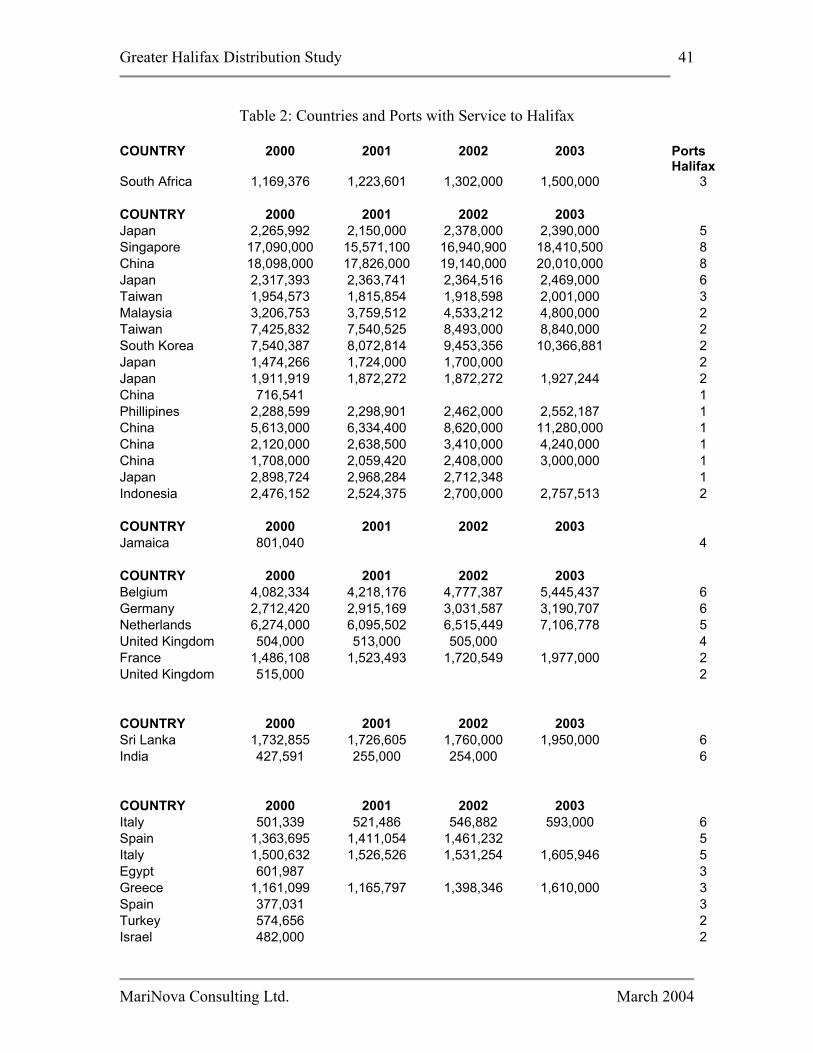
Table 2: Countries and Ports with Service to Halifax
COUNTRY 2000 2001 2002 2003 Ports Halifax
South Africa 1,169,376 1,223,601 1,302,000 1,500,000 3
COUNTRY 2000 2001 2002 2003 Japan 2,265,992 2,150,000 2,378,000 2,390,000 5 Singapore 17,090,000 15,571,100 16,940,900 18,410,500 8 China 18,098,000 17,826,000 19,140,000 20,010,000 8 Japan 2,317,393 2,363,741 2,364,516 2,469,000 6 Taiwan 1,954,573 1,815,854 1,918,598 2,001,000 3 Malaysia 3,206,753 3,759,512 4,533,212 4,800,000 2 Taiwan 7,425,832 7,540,525 8,493,000 8,840,000 2 South Korea 7,540,387 8,072,814 9,453,356 10,366,881 2 Japan 1,474,266 1,724,000 1,700,000 2 Japan 1,911,919 1,872,272 1,872,272 1,927,244 2 China 716,541 1 Phillipines 2,288,599 2,298,901 2,462,000 2,552,187 1 China 5,613,000 6,334,400 8,620,000 11,280,000 1 China 2,120,000 2,638,500 3,410,000 4,240,000 1 China 1,708,000 2,059,420 2,408,000 3,000,000 1 Japan 2,898,724 2,968,284 2,712,348 1 Indonesia 2,476,152 2,524,375 2,700,000 2,757,513 2
COUNTRY 2000 2001 2002 2003 Jamaica 801,040 4
COUNTRY 2000 2001 2002 2003 Belgium 4,082,334 4,218,176 4,777,387 5,445,437 6 Germany 2,712,420 2,915,169 3,031,587 3,190,707 6 Netherlands 6,274,000 6,095,502 6,515,449 7,106,778 5 United Kingdom 504,000 513,000 505,000 4 France 1,486,108 1,523,493 1,720,549 1,977,000 2 United Kingdom 515,000 2
COUNTRY 2000 2001 2002 2003 Sri Lanka 1,732,855 1,726,605 1,760,000 1,950,000 6 India 427,591 255,000 254,000 6
COUNTRY 2000 2001 2002 2003 Italy 501,339 521,486 546,882 593,000 6 Spain 1,363,695 1,411,054 1,461,232 5 Italy 1,500,632 1,526,526 1,531,254 1,605,946 5 Egypt 601,987 3 Greece 1,161,099 1,165,797 1,398,346 1,610,000 3 Spain 377,031 3 Turkey 574,656 2 Israel 482,000 2
MariNova Consulting Ltd. March 2004
Greater Halifax Distribution Study 42
Spain 2,009,122 2,151,770 2,234,248 2,515,908 2 Spain 1,308,010 1,506,805 1,816,526 2 France 722,445 742,020 808,915 832,986 1 Malta 1 Israel 870,432 901,000 906,000 990,000 1
COUNTRY 2000 2001 2002 2003 Saudi Arabia 1,054,731 1,186,351 1,366,902 1,700,000 6 Saudi Arabia 475,000 4 United Arab Emirate
3,058,866 3,501,820 4,194,264 5,151,955 3
Cote D'Ivoire 435,000 543,846 580,000 3 Oman 1,032,692 1,187,753 1,210,000 1,900,000 1
COUNTRY 2000 2001 2002 2003 Peru 392,967 3 Chile 256,386 2 Ecuador 2 Argentina 1,102,189 2
5.4 Exports and Imports via Halifax
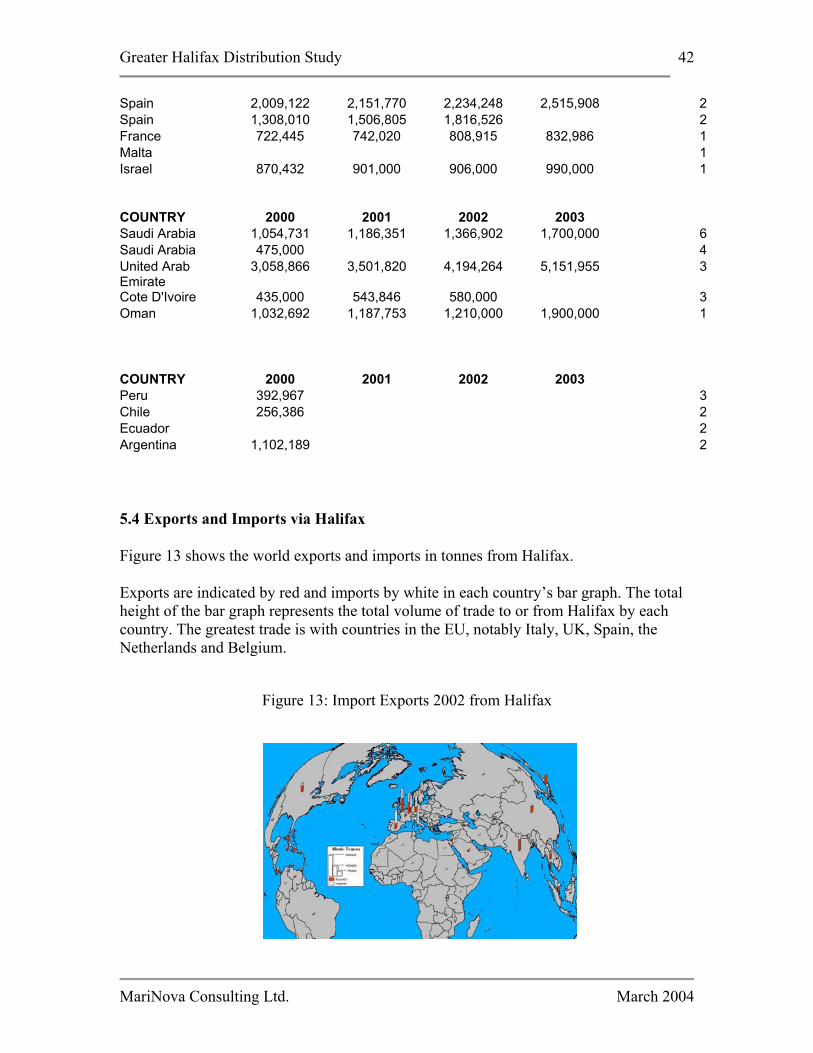
Figure 13 shows the world exports and imports in tonnes from Halifax.
Exports are indicated by red and imports by white in each country’s bar graph. The total height of the bar graph represents the total volume of trade to or from Halifax by each country. The greatest trade is with countries in the EU, notably Italy, UK, Spain, the Netherlands and Belgium.
Figure 13: Import Exports 2002 from Halifax
MariNova Consulting Ltd. March 2004
Greater Halifax Distribution Study 43
Other significant trade is with India, Japan and Thailand. Hong Kong also is similar to Japan in the amount of trade but is not shown on the map.
The portion of the red bar indicates exports through Halifax to various countries. Significant exports are to UK, India and China, Japan and Netherlands.
The white portion of the bar shows imports. Key countries exporting to Halifax are greatest in the EU, Mediterranean and Indian sub-continent.
5.5 Halifax Service Corridors by Line
The following table compares the lines servicing the key market regions of the EU, Mediterranean, Mideast-India and Southeast Asia, to the exports and imports to countries found in each of these regions.
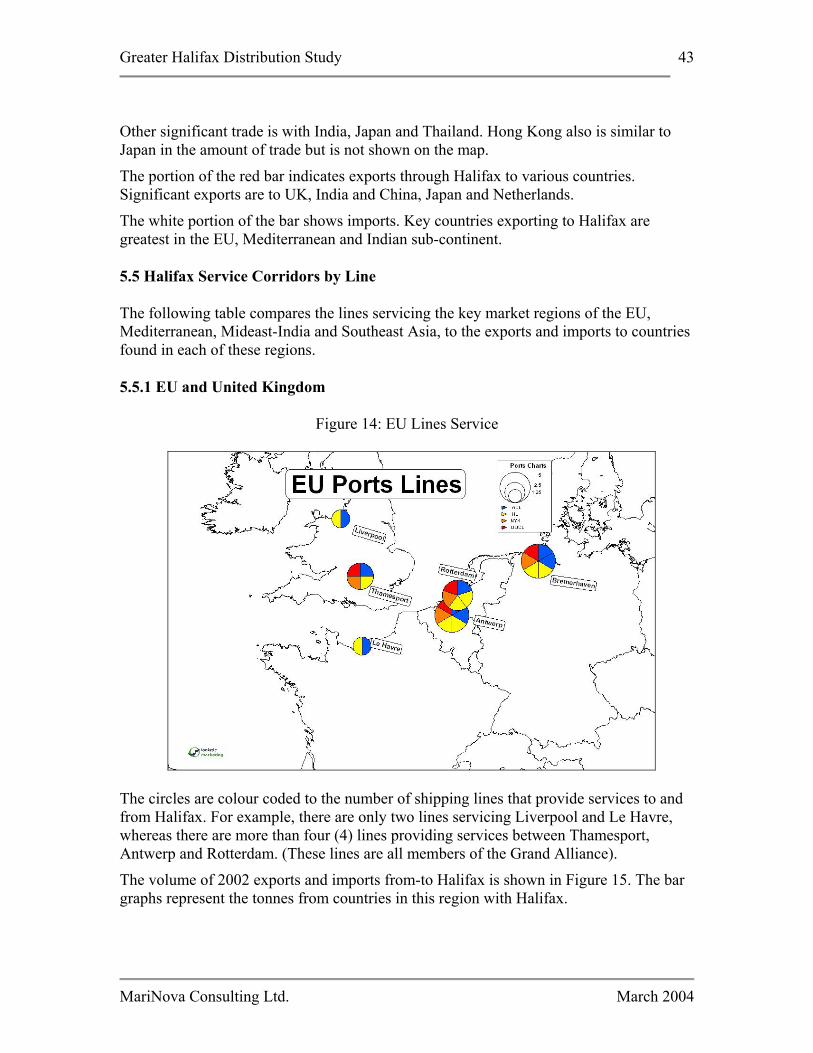
5.5.1 EU and United Kingdom
Figure 14: EU Lines Service
The circles are colour coded to the number of shipping lines that provide services to and from Halifax. For example, there are only two lines servicing Liverpool and Le Havre, whereas there are more than four (4) lines providing services between Thamesport, Antwerp and Rotterdam. (These lines are all members of the Grand Alliance).
The volume of 2002 exports and imports from-to Halifax is shown in Figure 15. The bar graphs represent the tonnes from countries in this region with Halifax.
MariNova Consulting Ltd. March 2004
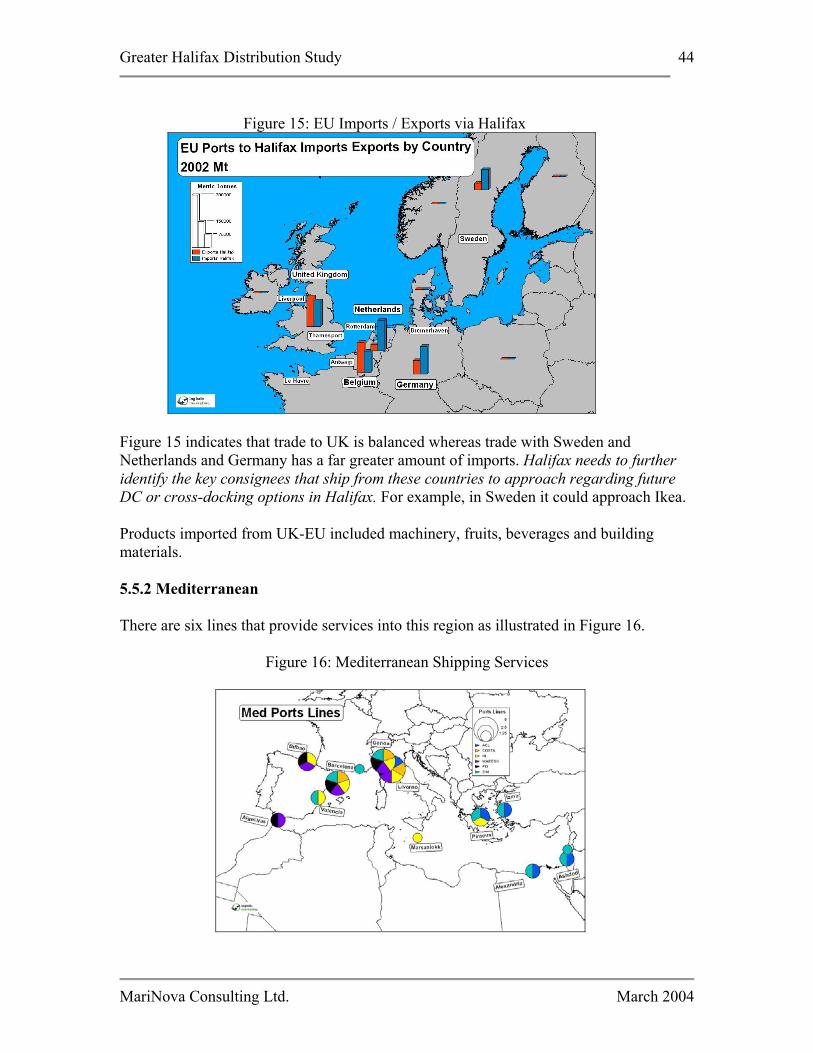
Greater Halifax Distribution Study 44
Figure 15: EU Imports / Exports via Halifax
Figure 15 indicates that trade to UK is balanced whereas trade with Sweden and Netherlands and Germany has a far greater amount of imports. Halifax needs to further identify the key consignees that ship from these countries to approach regarding future DC or cross-docking options in Halifax. For example, in Sweden it could approach Ikea. Products imported from UK-EU included machinery, fruits, beverages and building materials. 5.5.2 Mediterranean There are six lines that provide services into this region as illustrated in Figure 16.
Figure 16: Mediterranean Shipping Services
MariNova Consulting Ltd. March 2004
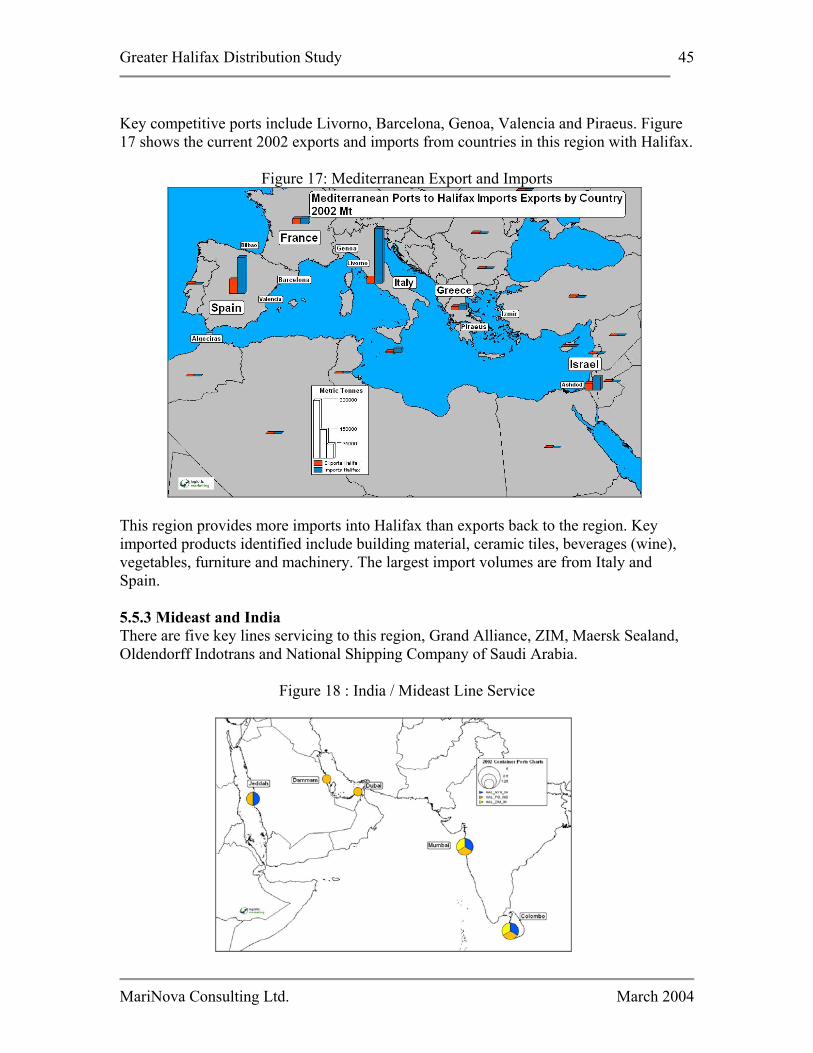
Greater Halifax Distribution Study 45
Key competitive ports include Livorno, Barcelona, Genoa, Valencia and Piraeus. Figure 17 shows the current 2002 exports and imports from countries in this region with Halifax.
Figure 17: Mediterranean Export and Imports
This region provides more imports into Halifax than exports back to the region. Key imported products identified include building material, ceramic tiles, beverages (wine), vegetables, furniture and machinery. The largest import volumes are from Italy and Spain. 5.5.3 Mideast and India There are five key lines servicing to this region, Grand Alliance, ZIM, Maersk Sealand, Oldendorff Indotrans and National Shipping Company of Saudi Arabia.
Figure 18 : India / Mideast Line Service
MariNova Consulting Ltd. March 2004
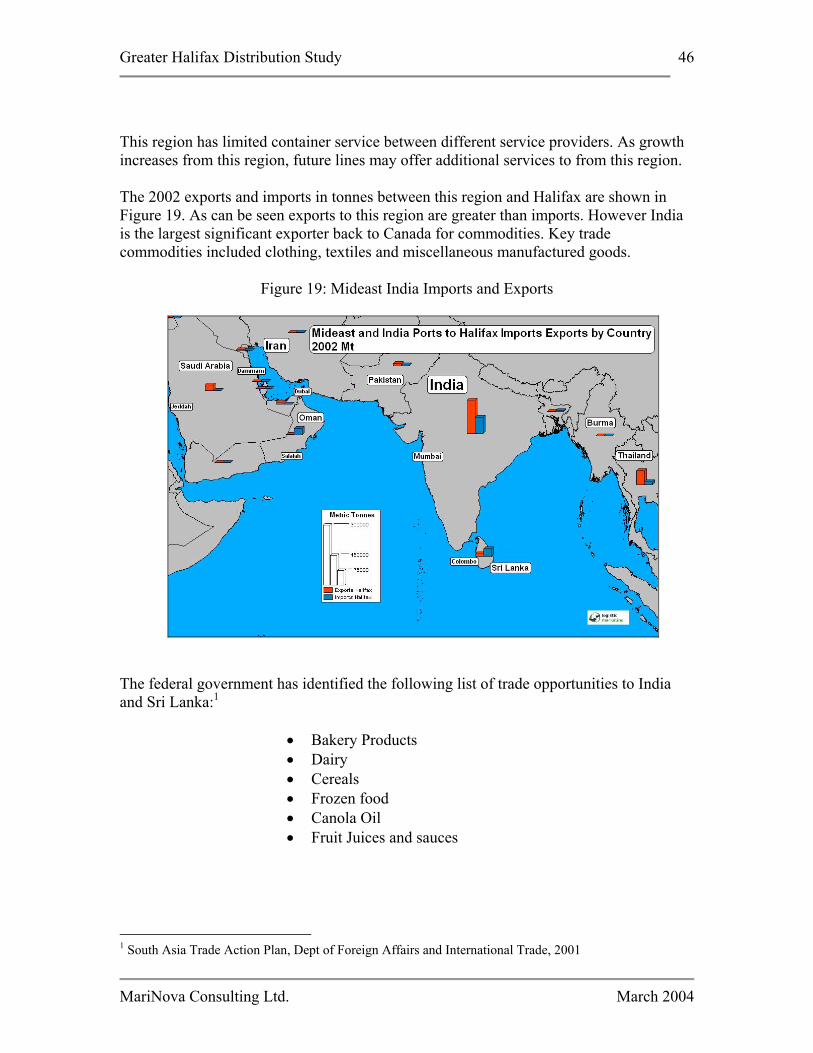
Greater Halifax Distribution Study 46
This region has limited container service between different service providers. As growth increases from this region, future lines may offer additional services to from this region. The 2002 exports and imports in tonnes between this region and Halifax are shown in Figure 19. As can be seen exports to this region are greater than imports. However India is the largest significant exporter back to Canada for commodities. Key trade commodities included clothing, textiles and miscellaneous manufactured goods.
Figure 19: Mideast India Imports and Exports
The federal government has identified the following list of trade opportunities to India and Sri Lanka:1
• Bakery Products • Dairy • Cereals • Frozen food • Canola Oil • Fruit Juices and sauces
1 South Asia Trade Action Plan, Dept of Foreign Affairs and International Trade, 2001
MariNova Consulting Ltd. March 2004
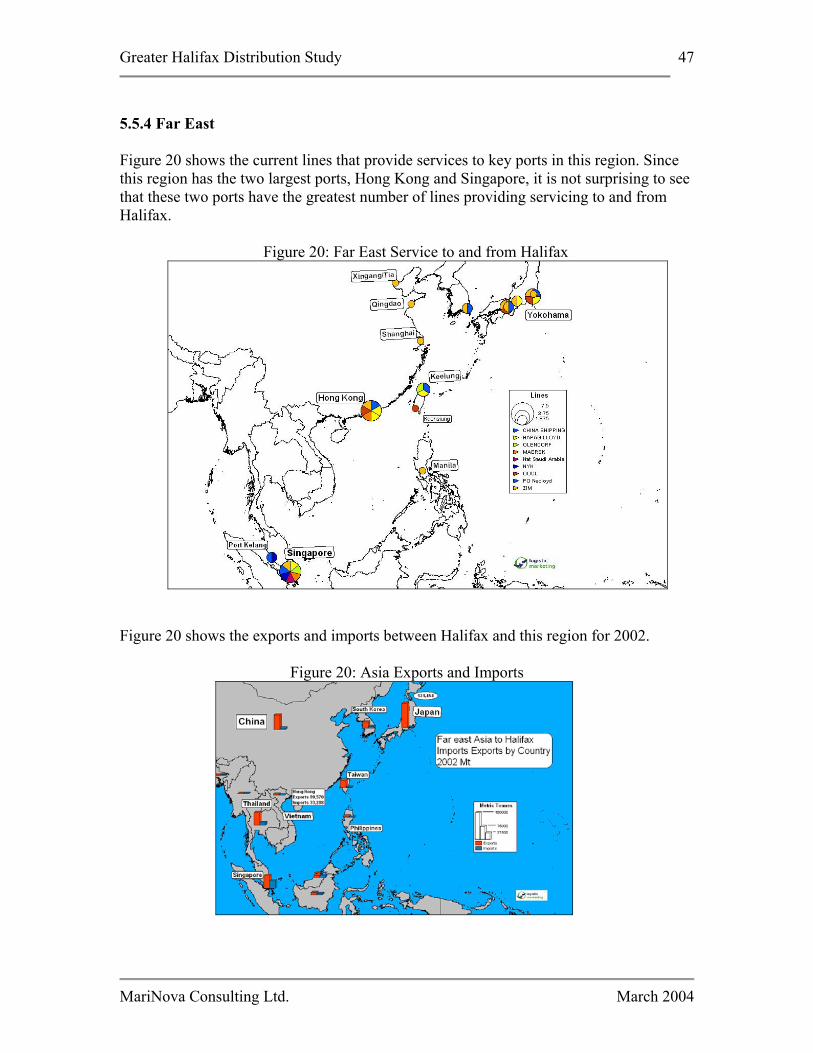
Greater Halifax Distribution Study 47
5.5.4 Far East Figure 20 shows the current lines that provide services to key ports in this region. Since this region has the two largest ports, Hong Kong and Singapore, it is not surprising to see that these two ports have the greatest number of lines providing servicing to and from Halifax. Figure 20: Far East Service to and from Halifax
Figure 20 shows the exports and imports between Halifax and this region for 2002.
Figure 20: Asia Exports and Imports
MariNova Consulting Ltd. March 2004
Greater Halifax Distribution Study 48
Exports to this region from Halifax are the dominant trade flows as compared to imports. This situation is probably unique to all North American ports and represents a significant opportunity for Halifax to attract more import cargo. Hong Kong export import bar graph not shown but is similar to Japan export and imports from Singapore. Imports from this region back to Halifax are significant from only Singapore and Hong Kong at over 30,000 mt each. Typical product imported include textiles and clothing and natural rubber from Malaysia using Singapore or Port Kelang.
MariNova Consulting Ltd. March 2004
Greater Halifax Distribution Study 49
6.0 PROSPECTS for 3PLs and LOGISTICS SERVICE PROVIDERS 6.1 Introduction Based on early interview results, and the impression that traditional DC activity was not likely to occur in the Halifax-Moncton Growth Corridor, the consultants and the client decided to focus on the potential for attracting so-called third party logistics providers (3PLs) to the corridor. Key suppliers and importers of consumer goods and logistic services for various commercial retail and wholesale sectors may offer some growth opportunities for Halifax. We evaluated some of the larger companies as well as smaller local 3PLs that provide these services and their views of growth opportunities that drive their business, which may provide Halifax with a window to see other opportunities
6.2 3PL Distribution Centres When the volumes for a particular geographic area are not sufficient to justify a distribution centre, some or all of the services normally provided by a distribution centre can be contracted out to warehouse operators. Some third party logistics providers simply act as forwarders while others offer the full range of services a company-owned distribution centre would provide; including inventory management, distribution planning, order processing etc. There are a number of service providers available both locally and nationally, some of the more prominent ones have been contacted and the issue of providing a distribution centre service discussed with them. 6.2.1 Clarke Transport Clarke Transport is the poolcar division of Clarke Inc. Their principal business is to consolidate freight into full (railcar, container or truck) loads and to distribute this freight throughout Canada. Of the national poolcar operators, they have the largest presence in Atlantic Canada and use all modes of transportation except air. Their operations in Atlantic Canada are all cross-dock with no warehousing. They provide consolidation / distribution service to a number of retailers throughout Canada.
6.2.2 Cantrax Cantrax, a subsidiary of Ucan Universal Transit provide warehousing in Halifax for pallet type freight. They operate a 45,000 square foot warehouse and distribute locally in the Halifax area. They do not offer live electronic inventory but reconcile quantities with
MariNova Consulting Ltd. March 2004
Greater Halifax Distribution Study 50
their customers every 3 months. They provide some distribution services for Willemet Industries (paper products) and have acted in the past as a DC for Canadian Tire for some 200 items of hazardous goods to Newfoundland.
6.2.3 Trebley Trebley Warehousing is a locally owned company that provides storage and distribution services. They operate a warehouse of approximately 30,000 square feet, one third of which is used for bulk (pallet) storage while the other two thirds is racked. They have computerized inventory control with EDI capability and offer first-in first-out warehousing. They provide certain DC services to undisclosed retailers. Trebley provide distribution services within the local market to a number of manufacturers such as Chester plastics and Bernardin(mason jars). One of the services they offer is palletizing cargoes that arrive as bulk in containers and transferring pallets into trucks or domestic containers. 6.2.4 Sable Sable warehousing and distribution is a division of Day and Ross. They distribute throughout Atlantic Canada using their own trucks and provide certain DC services to undisclosed retailers. They do not have live electronic inventory capability but can produce reports at whatever frequency the customer requests. Their pricing is generally fixed based on the customer’s profile and reviewed every 6 months or so. 6.2.5 Armour Logistics Services ALS is a division of Armour Transport. At the moment they are, of the group identified herein, the most capable of providing full distribution centre services in Atlantic Canada. Their flagship warehouse is situated in Moncton and offers 300,000 square feet of floor space, along with full EDI capability. They have provided full distribution services to Saans and Byway stores, including taking orders directly from the stores, min-max order points etc. They also provide 24/ 7days access for some of their customers in the high-tech sector. Their experience in the full service distribution centre business was that the volumes started out strong at 4-5 railcars per day but eventually dwindled to 1-2 per week. They believe that to work properly, a minimum volume needs to be guaranteed. They are presently nearly full and continue to grow to meet demand for their services. See Appendix 1 for more information on ALS. 6.2.6 Logisti-Solve Inc. LSI is a 3PL distribution centre service provider that has an interest in expanding their operations. They have not considered Halifax although they are quite familiar with the developments in Vancouver and see how the situations are somewhat similar. LSI
MariNova Consulting Ltd. March 2004
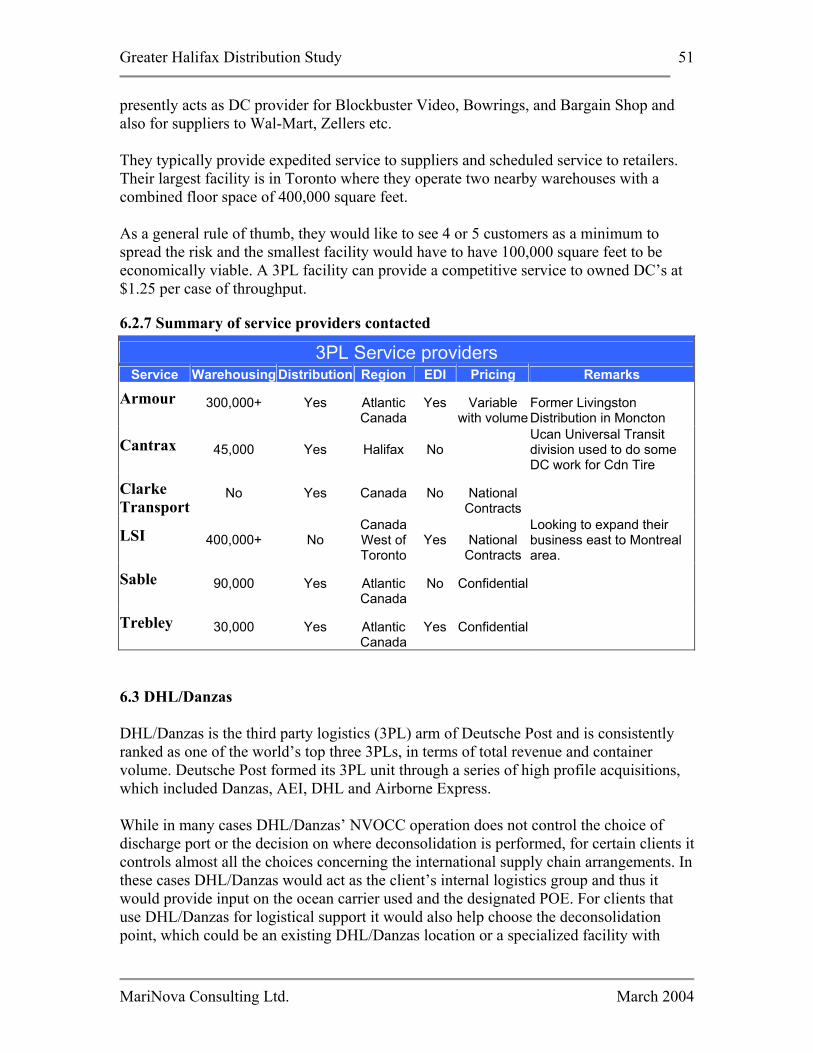
Greater Halifax Distribution Study 51
presently acts as DC provider for Blockbuster Video, Bowrings, and Bargain Shop and also for suppliers to Wal-Mart, Zellers etc. They typically provide expedited service to suppliers and scheduled service to retailers. Their largest facility is in Toronto where they operate two nearby warehouses with a combined floor space of 400,000 square feet. As a general rule of thumb, they would like to see 4 or 5 customers as a minimum to spread the risk and the smallest facility would have to have 100,000 square feet to be economically viable. A 3PL facility can provide a competitive service to owned DC’s at $1.25 per case of throughput.
6.2.7 Summary of service providers contacted
3PL Service providers Service Warehousing Distribution Region EDI Pricing Remarks
Armour
300,000+
Yes
Atlantic Canada
Yes
Variable with volume
Former Livingston Distribution in Moncton
Cantrax
45,000
Yes
Halifax
No
Ucan Universal Transit division used to do some DC work for Cdn Tire
Clarke Transport
No
Yes
Canada
No
National Contracts
LSI
400,000+
No
CanadaWest ofToronto
Yes
National Contracts
Looking to expand their business east to Montreal area.
Sable
90,000
Yes
Atlantic Canada
No
Confidential
Trebley
30,000
Yes
Atlantic Canada
Yes
Confidential
6.3 DHL/Danzas DHL/Danzas is the third party logistics (3PL) arm of Deutsche Post and is consistently ranked as one of the world’s top three 3PLs, in terms of total revenue and container volume. Deutsche Post formed its 3PL unit through a series of high profile acquisitions, which included Danzas, AEI, DHL and Airborne Express. While in many cases DHL/Danzas’ NVOCC operation does not control the choice of discharge port or the decision on where deconsolidation is performed, for certain clients it controls almost all the choices concerning the international supply chain arrangements. In these cases DHL/Danzas would act as the client’s internal logistics group and thus it would provide input on the ocean carrier used and the designated POE. For clients that use DHL/Danzas for logistical support it would also help choose the deconsolidation point, which could be an existing DHL/Danzas location or a specialized facility with
MariNova Consulting Ltd. March 2004
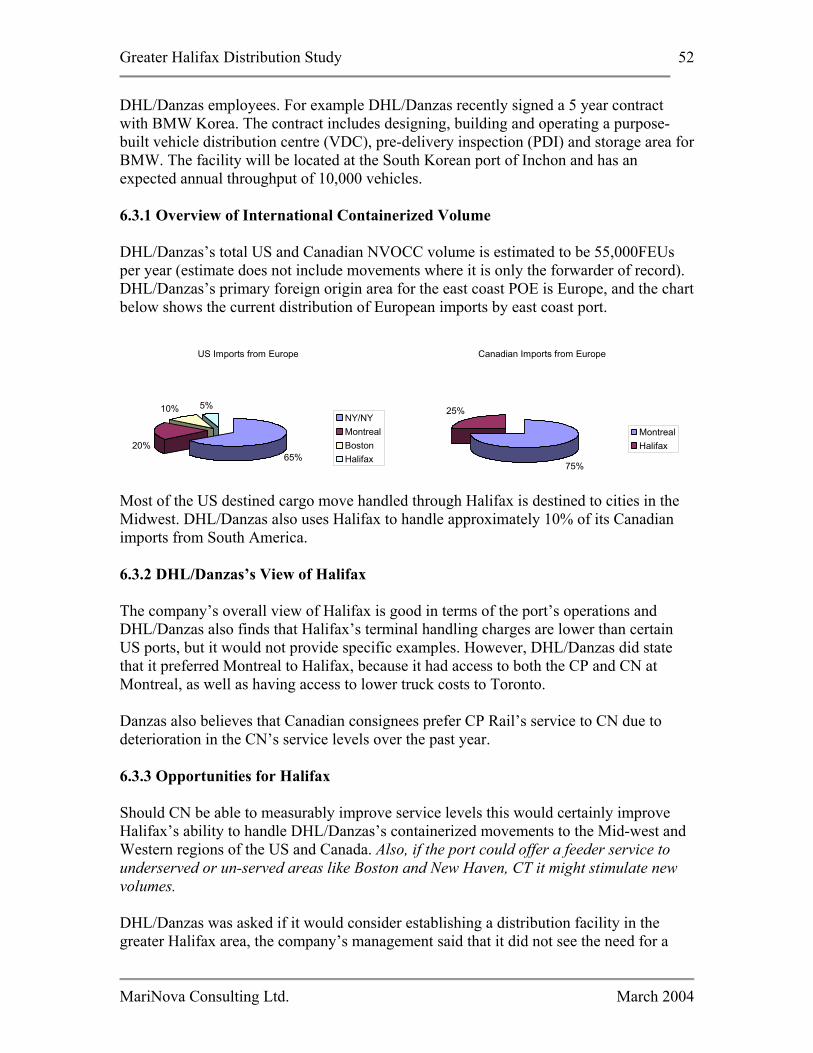
Greater Halifax Distribution Study 52
DHL/Danzas employees. For example DHL/Danzas recently signed a 5 year contract with BMW Korea. The contract includes designing, building and operating a purpose-built vehicle distribution centre (VDC), pre-delivery inspection (PDI) and storage area for BMW. The facility will be located at the South Korean port of Inchon and has an expected annual throughput of 10,000 vehicles. 6.3.1 Overview of International Containerized Volume DHL/Danzas’s total US and Canadian NVOCC volume is estimated to be 55,000FEUs per year (estimate does not include movements where it is only the forwarder of record). DHL/Danzas’s primary foreign origin area for the east coast POE is Europe, and the chart below shows the current distribution of European imports by east coast port.
US Imports from Europe
65%20%
10% 5%NY/NYMontrealBostonHalifax
Canadian Imports from Europe
75%
25%
MontrealHalifax
Most of the US destined cargo move handled through Halifax is destined to cities in the Midwest. DHL/Danzas also uses Halifax to handle approximately 10% of its Canadian imports from South America. 6.3.2 DHL/Danzas’s View of Halifax The company’s overall view of Halifax is good in terms of the port’s operations and DHL/Danzas also finds that Halifax’s terminal handling charges are lower than certain US ports, but it would not provide specific examples. However, DHL/Danzas did state that it preferred Montreal to Halifax, because it had access to both the CP and CN at Montreal, as well as having access to lower truck costs to Toronto. Danzas also believes that Canadian consignees prefer CP Rail’s service to CN due to deterioration in the CN’s service levels over the past year. 6.3.3 Opportunities for Halifax Should CN be able to measurably improve service levels this would certainly improve Halifax’s ability to handle DHL/Danzas’s containerized movements to the Mid-west and Western regions of the US and Canada. Also, if the port could offer a feeder service to underserved or un-served areas like Boston and New Haven, CT it might stimulate new volumes. DHL/Danzas was asked if it would consider establishing a distribution facility in the greater Halifax area, the company’s management said that it did not see the need for a
MariNova Consulting Ltd. March 2004
Greater Halifax Distribution Study 53
standard facility in the area, due to the area’s small population base, but they would consider some type of specialized facility like the work they are doing for BMW in Korea. However, no such opportunity currently exists. 6.4 CRSA Canadian Retail Shippers Association (CRSA) has operated since 1967, and provides logistic services to the following retail companies
• Sears • Sony • Reitmans • SAAN • Eddie Bauer • Bargain Shop • Club Monaco • Foot Locker
CRSA’s primary distribution centres are located in:
• Montreal (St. Laurent) • Belleville • Vaughn • Milton • Etiboke • Mississauga • Whitby • Delta • Coquitlam • Calgary • Edmonton • Regina • Winnipeg
CRSA’s business model is shown in the figure below:
MariNova Consulting Ltd. March 2004

Greater Halifax Distribution Study 54
CRSA provides consolidation of sourcing overseas from various suppliers through various ports and has third party warehouses in the following countries: Bangladesh, Pakistan, China, Hong Kong, India, Indonesia, Korea, Malaysia, Mauritius, Philippines, Singapore, Sri Lanka, Taiwan, Thailand, Vietnam, Brunei. Most of these countries have shipping connections to Halifax. CRSA currently uses the port of Halifax for imports, mainly ready-made garments from India, Bangladesh, Pakistan, and Sri Lanka. Total volume is about 1,000 containers per year. Virtually none of the cargo passing though the port is for the local market; 95% is destined for Montreal and the balance goes to Toronto (Brampton and Milton). The company does not have a warehouse in Atlantic Canada. They deal with their members’ distribution centres, who do their own distribution across Canada. When selecting a site for a new distribution centre, easy and quick rail and road access, as well as the cost of real estate and labour is very important. They use both CN and CP. They do not use 3PLs. and do not anticipate using them in the future. They do not anticipate opening a distribution centre in Halifax because they prefer to be closer to major population centres, located in central Canada and the West (this logic in relation to Winnipeg and Regina is somewhat suspect). Port selection is driven by the shortest transit time from the Indian sub-continent to eastern Canada, as well as available rail transportation. Their impressions of the Port of Halifax are not good. Based on their experience, there is frequent yard congestion that
MariNova Consulting Ltd. March 2004
Greater Halifax Distribution Study 55
jeopardizes on-time delivery to their members. And, they are “at the mercy of one rail service provider”. Also, they pointed out that the port should move containers on a first-come basis. This is not the case at present. “When the yard is too congested, cargo from vessels docking are put on rail first because they have no access to older containers.” These problems may be moot, as CSRA expects more imports to be sourced from China and their activity on the Indian sub-continent may actually diminish. Their members are impacted by WTO regulations and China is now a signatory to these rules. 6.5 Li & Fung This company is over 90 year sold and provides services for sourcing and processing textile and clothing products in Southeast Asia. They source from over 7,000 companies in China. It is based in Hong Kong and has over 40 offices worldwide. They have sales of $40 billion, in 20021 and are one of the world’s largest suppliers of finished clothing to retailers worldwide. They also expect to see North American retailers such as Target and Wal-Mart increase their apparel offerings. 6.5.1 Strategic Growth Li & Fung expect to increase revenues by sixfold to $250 billion by 2004, by providing more sourcing functions and increasing the margins from materials to logistics. They have divided the world into four low cost regions and two for proximity to customers for service.
Low Cost Regions:
o East Asia(Hong Kong, Taiwan, South Korea, China, Mongolia) o Southeast Asia(Vietnam, Saipan, Thailand, Brunei, Indonesia, Cambodia,
Laos, Malaysia, Myanmar, Philippines, Singapore) o South Asia (India, Pakistan, Bangladesh, Sri Lanka) o Southern Africa
Quick Response Areas
o Central America (Guatemala, Honduras to USA) o Turley, Portugal, Northern Africa, Eastern Europe for EU
They have also found that retailers are ordering in smaller lots. They source fabrics and product in different regions of the world, taking advantage of trade policies and duties. For instance, products made in Central America for the US may have Asian textile fabrics.
1 Textile and Trade Report 10/1/2002, High Beam Research
MariNova Consulting Ltd. March 2004
Greater Halifax Distribution Study 56
They have also discovered that Africa is competitive on knits but not on time, but Africa is the next growth area, due to expected future trade breaks China has also increased its market share of US apparel, but in the long term Vietnam and India may slow China down as new areas of sourcing for apparel goods. (Note: this seems to contradict CSRA).
6.5.2 Opportunity for Halifax The opportunity for Halifax is to evaluate the Li & Fung network of distribution services by port, in the countries that Li & Fung identified as low cost and marry them up with existing or prospective Halifax shipping lines. The port could also contact Li & Fung regarding the Port of Halifax and its connectivity to Li & Fung production and proximity to New York, the Midwest and Central Canada. The issue of distribution centres or transload facilities could also be explored with them. 6.6 Conclusions Third party provision of warehouse and other distribution centre services can be beneficial to retailers for the following reasons: from a retailer’s or shippers point of view, here are certain strengths associated with 3PLs:
• No Capital Investment The most attractive element of 3rd party warehousing for a retailer is the avoidance of capital investment.
• Costs The service provider needs to be able to make a profit and thus the cost to the retailer is higher than if the facility was owned. Economies of scale or improvements in efficiency must be sufficient to more than offset the profit necessary to justify the 3PL’s investment. As the individual retailers grow, the economies of scale are reduced and retailers inevitably move to their own DCs.
• Commitment still required Some form of commitment is required from the retailer, at least until a certain critical mass is achieved, for the 3 PL provider to remain profitable despite constant changes in the volumes of individual customers. This sets up somewhat of a chicken and egg situation.
• Avoids Ownership Issues While a co-op type of company can be set up to pool the volumes of certain retailers and justify a distribution centre, 3rd party investment avoids the conflicts that can arise when mergers and other changes in ownership occur.
• Choice
MariNova Consulting Ltd. March 2004
Greater Halifax Distribution Study 57
3PL warehouses compete for the business and the retailer generally has a choice of service providers.
There are also some inherent weaknesses:
• Costs The service provider needs to be able to make a profit and thus the cost to the retailer is higher than if the facility was owned. Economies of scale or improvements in efficiency must be sufficient to more than offset the profit necessary to justify the investment. As the individual retailers grow, the economies of scale are reduced and retailers inevitably move to their own DCs.
• Commitment still required
Some form of commitment is required from the retailer at least until a certain critical mass is achieved to still be profitable despite constant changes in the volumes of individual customers. This sets up somewhat of a chicken and egg situation.
• Integration Even the most sophisticated IT system will not be as well integrated as would be the retailer’s own system since it would be used for an owned-distribution centre.
• Control Retailers cannot exercise the same level of control over their warehousing and distribution functions without additional costs. This is often an irritant and many retailers have a strong preference for having their own distribution centres.
There are some significant opportunities within the sector:
• Micro DC’s Commercial retail parks such as Bayers Lake are creating a need for micro distribution within the park to the outlets that are all trying to optimize their footprint for the retail side of the business and have little room to store product. Product is delivered to the retail outlets in pallet loads at close to the time it could be retrieved from in-store storage. This has been a developing trend in Europe for some time now.
• Warehouse Rental Only (multi operators) There may be some advantages to offering space within a large warehousing complex to retailers so that they can operate their own mini distribution centre while achieving some of the economies of scale necessary to justify local distribution. Equipment and other components could be pooled among tenants without some of the negative aspects of a 3rd party service relationship.
• Hazardous
MariNova Consulting Ltd. March 2004
Greater Halifax Distribution Study 58
The Cantrax example is an interesting niche market. Presumably Canadian Tire avoided mixing hazardous cargoes with the other goods in their own trucks. This keeps the logistics of handling hazardous cargoes simple and reduces costs.
There are, however, also threats to their continued existence:
• Larger retail stores (box stores) The ever increasing size of the retail outlets along with the reliability of shipping and the development of just in time logistics allows freight to be routed directly from manufacturer to retail outlet in some cases. When this is possible, its economics are unbeatable.
• Conference pricing (equalization) The pricing structure of the conference rates results in the terminal rates being the same for transportation to Toronto, Montreal or Halifax. While this structure may be beneficial for carriers calling Halifax in competing for cargo to/from Montreal and Toronto, it does not allow the advantages of distributing out of Halifax to be passed on to the retailer.
There are several ways that the GHP and HPA and their partners can promote this concept.
First of all, however, it is not fully understood what impact if any losing the high(er) level of contribution on the local Halifax cargo would have on the attractiveness of the Port of Halifax. The “local” cargo still represents less than 10% of the international freight moving through Halifax. That being said, however, significantly higher volumes of freight to/from Halifax would likely result in a more competitive situation in Halifax that could see the rates reduce to somewhere near the rates to Montreal/Toronto less the additional inland costs to Central Canada. Value added logistics, increased transshipments, creating a free trade zone, distributing out of Halifax etc. are all methods of increasing the volume of cargo moving to and from the Halifax area. Today, much of the cost of calling Halifax is borne by the Halifax cargo as the cargo to/from Central Canada is competing with alternative routings that have a lower per unit cost base. Significantly increasing the volume of freight to/from Atlantic Canada could offset the loss of revenue a reduction in the rates to the local Halifax area may have and be necessary so as to retain the services that call Halifax today.
MariNova Consulting Ltd. March 2004
Greater Halifax Distribution Study 59
7.0 VALUE-ADDED SERVICE and NON-CONTAINERISED CARGO 7.1 Introduction With low population levels in Atlantic Canada, the Maritimes are not an obvious choice for a conventional distribution centre. Ultimately the issue boils down to cost (weighted cost of moving the goods to market) and time (the time it takes to replenish stocks following an order). Halifax is disadvantaged in both regards as the bulk of the goods to be distributed are going to the more populated areas in central Canada. Those distribution centres that do exist in Atlantic Canada generally need to be close to all retail outlets (such as Sobeys and Atlantic Superstore and/or serve a large number of outlets in the region (Home Hardware). Although there are cases where the particular needs to be met justify a distribution centre in the Atlantic Provinces, mainstream distribution centres are likely to continue to concentrate in Central Canada. There are however a number of niche markets that can be well served out of Atlantic Canada, the Halifax area in particular. One source of niche opportunities lies in Value Added Logistics, defined in this context by somehow increasing the value of the goods while in the transportation chain. 7.2 Types of Value Added Service Classical distribution centres are simply tools to improve the overall transportation system’s efficiency. Transportation itself rarely adds value other than ultimately changing the geographic position of the freight. In most cases, the best one can expect is minimum deterioration in the quality, functionality or marketability of the product. Value can, however, be added to products along the transportation chain in a variety of ways. Some examples of adding value are as follows: 7.2.1 Manufacturing This is the most common and often the highest value-added way of changing a product. Typically, a number of components or raw materials converge to the location of the manufacturing process where a product is created through a combination of assembly and processing. By definition a manufacturing plant is a distribution centre. Some local examples are Volvo, Michelin Tire, Helly Hansen, Stanfields, Moirs Chocolate and the Irving Shipyard etc. Many of these are located close to their roots, while others have chosen locations that best suit their overall needs.
MariNova Consulting Ltd. March 2004
Greater Halifax Distribution Study 60
7.2.2 Processing Processing is akin to manufacturing, with the difference that there is generally little or no assembly required and value is created by modifying the base material in some way. Some local examples are Dover Mills, Imperial Oil Refinery etc. Often these involve high volumes of raw materials and of product. Location is crucial; this type of activity is often located near the source of the raw material or along the transportation chain. 7.2.3 Screening This process involves some form of sorting or selecting either to concentrate product of similar quality (colour, size, shape) or to exclude certain undesirable elements. This second function has exploded in recent years with new and stricter measures implemented for reasons of security, control of interdicted products and protection against infection and infestation. Some recent examples are the measures imposed to prevent the spread of hoof and mouth disease and infestation by Asian long horn beetles. 7.2.4 Warehousing Despite all the “Just In Time” (JIT) supply chain systems, there is still a requirement to store goods or supplies for those instances when market conditions change suddenly and additional sales can only be concluded if the goods are in stock. Warehousing is common when the production of goods is continuous and the market has ups and downs. As an example, paper mills tend to use warehousing as a buffer to keep plant production stable. The traditional role of a distribution centre is warehousing for oneself, while warehousing implies providing storage facilities for others. 7.2.5 Accumulation Certain cargoes or commodities can only be transported economically in larger quantities than they are produced or generated, and need to be accumulated prior to shipment. Often the commodities that need to be accumulated are of relatively small value, such as scrap metal or paper waste for recycling. On a small scale, consolidators offer a service of accumulating a sufficient volume of cargo to have a reasonable cost of transportation. Even when this involves additional handling, storage and a lot more paperwork, it is often more economical than the alternative and an entire industry exists to support this type of activity. A local example of a consolidation service is Clarke Transport which provides transportation service for less than truck load (LTL) freight by picking up the freight at origin, bringing it to their nearest cross dock facility where it is combined with other freight, loaded and transported as a full load to the facility nearest the ultimate destination, then unloaded, sorted and finally delivered by truck to destination.
MariNova Consulting Ltd. March 2004
Greater Halifax Distribution Study 61
7.2.6 Treating Another form of adding value is treating certain commodities to enhance their longevity, transportability etc. Salting, freezing, pickling, drying, impregnating (wood preservatives), etc are all forms of treating a product that add value. Treating usually involves a process of some kind but is generally less metamorphic than processing in that the end product is usually still the same product with certain characteristics enhanced.
There are numerous ways to add value along the transportation chain; what they all have in common is that they require that a node be created in the transportation chain and as such create a distribution centre from which the goods are distributed. Elements or raw materials must converge to the point where the value is added and then distributed from there. Added value distribution centres can be equally set up for import or export products. They can often be set-up anywhere along the transportation chain and the criteria for selecting the best location is frequently very different from the criteria that would be used to select a location for a classical distribution centre. 7.3 Strengths of Halifax as a Value-added Service Centre If one looks beyond domestic transportation, and beyond retail distribution to international logistics, wholesale and exports, Halifax has many advantages to offer: 7.3.1 Geography (world) Halifax’s geographic position has always been at the heart of its success in transportation. Halifax is situated along some of the busiest trade lanes in the world. It is just hours off the great circle route for most ships crossing the Atlantic and in a nearly direct line between Europe and the East Coast of North America. 7.3.2 Proximity to large market (world scale) On an international scale, Halifax is close to one of the largest consuming markets in the world, the US East Coast.
It is closer to this market than Europe, Africa, South East Asia, and most of the East Coast of South America. It is closer to the main Canadian market than Europe, Africa, South America, South East Asia and the Caribbean. 7.3.3 Transportation systems Despite the lack of local population, Halifax has traditionally been a gateway to Central Canada and more recently to the US Midwest, and is served by a large number of shipping lines. At last count, 16 shipping lines offered sailings to/from Halifax on 11 separate services. Halifax also has a class 1 railway service and good highway infrastructure.
MariNova Consulting Ltd. March 2004
Greater Halifax Distribution Study 62
7.3.4 Frequency (time) The numerous services calling Halifax provide frequent sailings between Halifax and most major ports in the world. The transit time between two points is a function of both the distance and the frequency of service. 7.3.5 Space – Land A consequence of the low population is that land is plentiful in relative proximity to the main transportation arteries. 7.3.6 Technology Halifax promotes itself as Canada’s Smart City; it has a number of universities and research centres, a leading edge biomedical industry, numerous service providers for telecommunication and information systems, etc. 7.3.7 Reputation Internationally, Canada is considered a country that maintains high standards, where corruption is the exception rather than the norm and where the financial institutions can be trusted. 7.3.8 Exempt from Jones Act Not being subject to the provisions of the Jones act enables Halifax to ship to any part of the US without the requirement of using domestic carriers. This in fact makes Halifax economically closer to the West Coast of the US than say New York. 7.3.9 NAFTA Processed or manufactured goods that are produced locally can generally enter the North American market without duty or import taxes. This can constitute a major economic advantage when the competition is overseas and subject to import duties.
7.4 Weaknesses 7.4.1 No large population base If there is a single reason for not locating a distribution centre in the Halifax area it would have to be this one. The entire population of the area that can be served from a retail distribution centre in the Maritimes is only about 2.5 million. On a North American scale that is tiny (significantly less than 1%). Even on a national scale our population is small and not very concentrated.
MariNova Consulting Ltd. March 2004
Greater Halifax Distribution Study 63
Halifax tends to be at the end of the line in terms of domestic transportation, at best a node at the end of a long spoke; certainly not the hub. The low population levels in Atlantic Canada tend to make Halifax uncompetitive with other alternatives in terms of distance, time and costs. Typically the transportation for delivery on a per unit basis (cost per mile) is significantly higher than the cost to feed the distribution centre because of economies of scale.
7.5 Opportunities The business opportunities are endless. One can come up with any number of business cases that would make sense in Halifax by simply starting with a type of value added activity paring down the possibilities keeping only those where Halifax has a strength to build on compared to the existing competition in a particular commercial activity. For example if one starts with the fact that paper is produced locally, that Halifax has a greater advantage with heavy cargoes than lighter ones, that it is economically closer to Los Angeles than is New York, that the best and most efficient technology is available and that labour costs are generally less in Canada than in the US, then the conclusion may be that it would make more sense to print books in the Halifax region and distribute them throughout the US from here rather than from New York. However, it is often more complicated than that and it can be dangerous to look at such opportunities from a purely theoretical point of view. We are not suggesting that identifying opportunities using this type of reasoning is not a worthwhile activity but rather that the possibilities would be so vast that it would be difficult to choose and that the task of even identifying all the possibilities is way beyond the scope of this report. The examples chosen for further investigation were chosen in part for their relevance but mainly because they are real and contemporary. They were chosen to demonstrate that such non-traditional distribution as value added logistics could provide niche markets well suited to the realities of Halifax, its strengths and its weaknesses. The examples have little in common other than the fact that they are opportunities that have already been pursued to some degree in the Maritimes and that there is some local knowledge available. 7.6 Selected Examples of Value Added Service • Granite block cutting and polishing Epoch Rock is a company that was set-up to slab and polish granite blocks in Argentia Newfoundland. Unfortunately it is no longer in business. It had what many believe was a sound business case but lacked the financial resources to get through the initial growth period.
MariNova Consulting Ltd. March 2004
Greater Halifax Distribution Study 64
• Nyjer Seed Sterilization At least one major importer is presently looking for alternatives to the high cost of importing Nyjer seed to New York for treatment and then having to transport domestically, often to the West Coast where many of the bird food bagging plants are located. (Appendix #4) • Forklift Refurbishing A local company specializes in buying forklifts, refurbishing them and selling them in local and overseas markets. A natural progression of this business would be to import forklifts, refurbish them and supply them to developing countries. 7.6.1 Epoch Rock Granite slabs Epoch Rock is a company that was set-up by Jim Radford, a Newfoundland businessman, to cut and polish granite blocks into slabs for the North American Market. (Appendix #1) The company cut and polished granite for just under 2 years before closing in September 2003. The granite was shipped into Argentia, Newfoundland in large blocks of up to 30 tonnes from all over the world. See figure 1.1 for product origin. Blocks were handled using a large forklift and the cutting and polishing processes were automated. Slabs were produced by large gang saws that could take from 48 to 90 hours for a cut depending on the hardness of the particular granite. The plant could slab and polish some 100 blocks per month. Polished granite slabs are used to make counter tops and furniture as well as for architectural applications. Slabs were produced and polished on demand (based on orders) and generally shipped to the customer immediately in full truck or container loads. Much of this type of product is produced in Italy where there is a long tradition of stone production and cutting. However, many of the Italian quarries are played out and the cost to quarry the stone blocks often exceeds the cost of importing blocks. 7.6.1.1 Strengths The original concept for the enterprise was based on a number of advantages the new venture could offer compared to the existing competition in this market. a) Quality The plant built in Argentia was state of the art and used modern equipment and control systems. The quality of the processing would be as good or better than what most established plants could produce. The quality of product is very much a function of the quality of the raw material and the buying of the granite blocks is critical.
MariNova Consulting Ltd. March 2004

Greater Halifax Distribution Study 65
Not only does the colour and grain need to be right, but fractures and inclusions cannot always be detected. In many instances a thorough knowledge of the past history of a quarry is the best indication of the actual quality of the stone. Additionally as the market is very fluid, the value of a particular block can vary significantly (block prices ranged from $400 to $3500 per cubic metre). Certainly the buying is more of an art than a science and requires a tremendous amount of experience. Epoch Rock contracted this function to experienced buyers/surveyors from Italy. Their strategy was to use only the best quality granite and occasionally had to buy from Italian block traders that could guarantee the stone quality. They originally felt that a stock of some 15 main colours/types would be sufficient to satisfy their market, however 29 colours/types were being kept on hand when the company ceased operations even though at any point in time 5 colours/types would represent 70 to 80 % of sales. b) Cost of transportation One of the main reasons for setting up the plant in the Argentia Industrial Park was the proximity of the Port of Argentia that allowed shipments to be brought to their doorstep either on a regular liner service provided by Eimskip every 2 weeks or by tramp vessel to the Port. The Eimskip service was also expected to carry a significant amount of the product to market on the Eastern Seaboard. Figure 1.1 is a summary of the countries of origin of the granite in inventory when the company ceased operations.
Figure 7.1
Country of origin Colours/types Percentage of colours/types
Brazil 11 38%
India 10 34%
Saudi Arabia 2 7%
Norway 2 7%
Zimbabwe 2 7%
South Africa 1 3%
South Dakota 1 3%
Total 29 100%
c) Timeliness of delivery The time to market was seen as a major advantage, particularly in such a high-end market as granite counter tops. Typically the requirement for a particular colour/type of stone
MariNova Consulting Ltd. March 2004
Greater Halifax Distribution Study 66
would be identified towards the end of the construction process as part of the overall decorating plan and a delay in obtaining the right type of slab could hold up the entire project. Even the Eimskip connection was not found to be fast enough in many cases and most of the product was trucked. e) NAFTA As part of the North American Free Trade Agreement, polished slabs produced in Canada would be allowed free access into the US markets, whereas the same product produced in Italy may be subject to import duties. f) 15% Surcharge re: fumigation of wood products At the time when the plant was starting, a surcharge of 15% of the shipping conference tariff was being charged to cover the cost of ensuring that the wood used for blocking and bracing was free from infestation. g) Future development of local quarries The Province of Newfoundland had identified some 25 granite quarry sites that could be suitable for commercial exploitation, although the volumes, colour and quality for block production were not fully known. Local production of high quality granite would be a bonus to Epoch Rock as local production is often an exclusive product that can yield better margins. 7.6.1.2 Problems The company was placed in receivership in September 2003 after just under 2 years of operation. Some of the reasons for the financial difficulties have been identified as follows: a) Insufficient working capital As is the case with many entrepreneurial companies, cash flow problems are often at the source of financial difficulties. The original investment was 90% funded by the private sector, the majority of this amount funded through an Italian Bank. During construction, there were some overruns on the cost of the building, however the overruns were within the limits of “normal” and the financing structure was not changed. The bank however decided to reduce the allowable working capital to maintain their exposure at the same level overall. The original financing package had a provision for a maximum of $5 million to be available to carry the inventory of blocks that have to be imported in relatively large quantities to benefit from good freight rates.
MariNova Consulting Ltd. March 2004
Greater Halifax Distribution Study 67
The entire $5million was apparently never made available and the bank demanded that the company reduce their inventory. If anything, the realities of the marketplace required more inventory than originally anticipated (29 vs. 15 colour/types in stock). Additionally, the covenants of the financing arrangement did not allow firm orders to be recognized until the product was produced and shipped. In some instances, this situation resulted in a disconnect between what the market wanted and what the plant had to sell as the company had difficulties obtaining the funds to acquire the right type of block. b) Knowledge of the business The management of the company had little knowledge of the stone cutting business when the business plan was put together. The only employee with direct experience in the business was the technical director who had been with Breton, one of the main equipment suppliers, and in the business for over 30 years. Nevertheless, the company operated successfully for 2 years and was building up market share. c) Marketing Stone cutting is an old trade still controlled in large part by Italian companies who have been in the business forever and have a well-established market. Epoch Rock was new to the market and had to establish itself as a credible, reliable and high quality producer in a market that is extremely competitive even for the established players. The market was not evenly covered to the same extent from the get-go and the lack of experience resulted in certain markets developing quickly while other larger markets were more difficult to penetrate. The timing of their arrival in the market was also unfortunate, coinciding with 9-1-1 and a crash in the stock market. Epoch Rock’s market penetration in Atlanta, Los Angeles and New Orleans before the larger market of New York is evidence of these difficulties. d) Equipment problems Some equipment problems were experienced but were on the way to being resolved and are not seen to have significantly contributed to the financial difficulties. e) No (little) local production Local quarries were not developed in time to help the competitive position of Epoch Rock. 7.6.1.3 Halifax Strengths Despite the fact that Epoch Rock did not ultimately succeed, few believe the concept cannot work. By learning from the mistakes made in the past and building on the expertise gained over the past 2 years, a solid business case can again be made and Halifax has some significant advantages in terms of both location and the transportation services available.
MariNova Consulting Ltd. March 2004

Greater Halifax Distribution Study 68
As the production of the finished product is moved closer to the customer, some of the onus of carrying inventory shifts from the customer to the processor (cutter) and this difference needs to be recognized in the business plan. The time between buying the block and getting paid for the product can be as long as 6 months, particularly when blocks need to be accumulated to constitute a break-bulk shipment (about 2000 cubic metres shipped at a time). A similar industry in Halifax could use the various container services to provide economical transportation in single block lots (about 12 to 15 cubic metres), thus eliminating the time required to accumulate blocks for a break bulk shipment and the risks associated with time chartering of vessels. There would be some significant advantages in partnering with an established supplier of granite slabs in terms of both know-how and market access. It would appear that the processing, in Halifax, of granite blocks from South America would be particularly advantageous for both the North American and the European markets. Italian labour costs are reputed to be very high in the granite processing industry and it would seem that an established producer looking to expand might consider a Maritime location with the right local partner. The following table summarizes the competitive position of granite processing for the North American Market (East Coast in particular).
Figure 7.2
Competitive position summary into North American Market Italy Argentia Halifax Partnership
Know-how Best Low Low Best Financing Best Limited Limited Better
Quality-processing Reputable Good Good Best Market Established Needs to be developed Needs to be developed Partly established
Transportation Economical More economical Most economical Most economical Time to Market Slow Good Best Best
NAFTA Duty No Duty No Duty No Duty Time zone +5H +1.5H +1H +1H
Local resources Best Good Better Better
MariNova Consulting Ltd. March 2004
Greater Halifax Distribution Study 69
Granite can be found in Nova Scotia, but as in the case of Epoch Rock, it is not known if the cost/quality is suitable for block production. (Appendix #2) 7.6.2 Nyjer Seed The next example selected is the sterilization of seeds that are not indigenous to North America. It is but one small example of a process put in place to prevent contamination of the continent’s agriculture. The whole field of “protection” against terrorism, infection, infestation, contamination etc… is enormous and there are a number of services that could be offered in a strategic location such as Halifax. Nyjer seed is one product, among many, that is required to be treated prior to entering into the US. The type of sterilization used in this process is dry heat. Other methods of sterilization may be appropriate depending on the application. Steam or wet heat, Ethylene Oxide Gas (EtO) and other chemical sterilizers, filter and radiation are the most common sterilization methods in use today, but new methods such as Ultrahigh Pressure (Uhp), Pulsed Electrical Field (Pef), microwave and Puva Psoralens and Uva are being developed. (Appendix #3). Many forms of sterilization are part of normal production processes and go unnoticed although the subject has recently received more press due to increased worldwide infection control procedures. The need to provide safe, effective and economical protection from all forms of potential threats will continue to affect international transportation systems for many years to come. Nyjer seed is cultivated in India primarily as a source of oil. It is also used as bird feed as its high fat and protein content makes it a favorite food of finches and smaller songbirds. The seed itself resembles small grains of wild rice and is generally used in special feeders. It is also a common additive to mixed birdseed as it attracts the more popular birds. Retailing between $1.50 and $2.00 US per pound, it is also one of the more expensive birdseeds. 7.6.2.1 Sterilization The sterilization process requires that the seed be subjected to dry heat of some 250 degrees Fahrenheit for a period of 15 minutes. This prevents any future germination of the seed and also any germination of potential weed seeds that could be mixed in with the product.
MariNova Consulting Ltd. March 2004
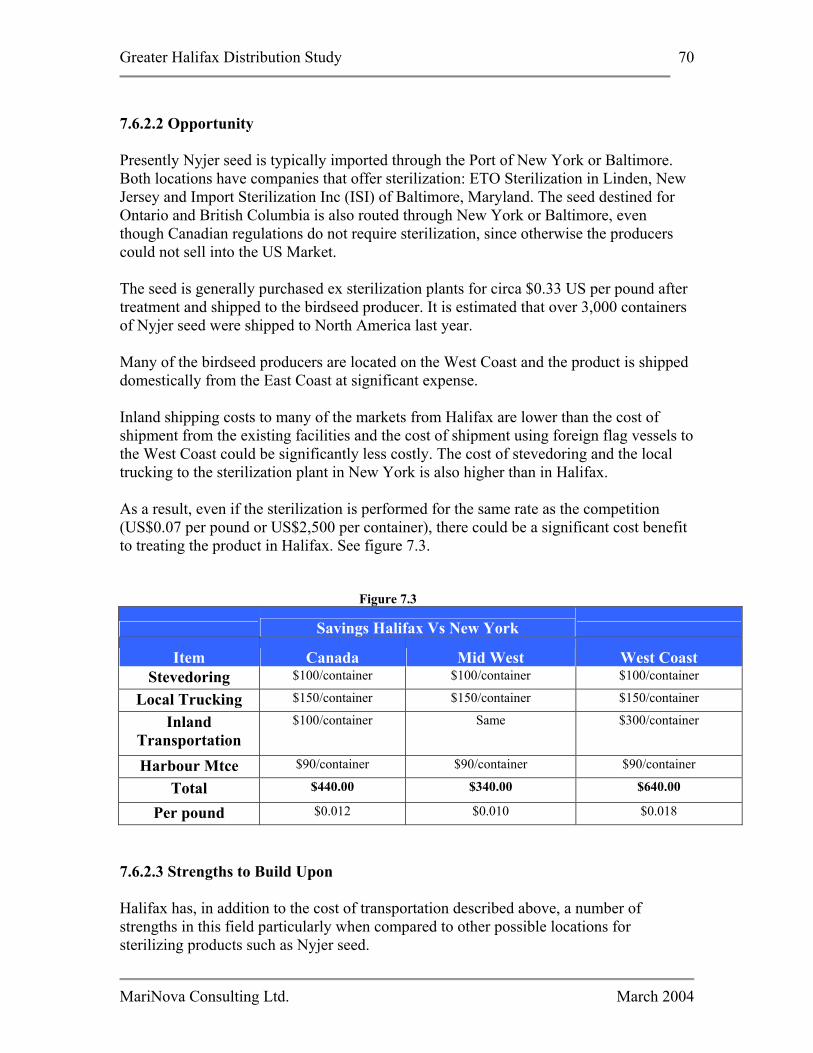
Greater Halifax Distribution Study 70
7.6.2.2 Opportunity Presently Nyjer seed is typically imported through the Port of New York or Baltimore. Both locations have companies that offer sterilization: ETO Sterilization in Linden, New Jersey and Import Sterilization Inc (ISI) of Baltimore, Maryland. The seed destined for Ontario and British Columbia is also routed through New York or Baltimore, even though Canadian regulations do not require sterilization, since otherwise the producers could not sell into the US Market. The seed is generally purchased ex sterilization plants for circa $0.33 US per pound after treatment and shipped to the birdseed producer. It is estimated that over 3,000 containers of Nyjer seed were shipped to North America last year. Many of the birdseed producers are located on the West Coast and the product is shipped domestically from the East Coast at significant expense. Inland shipping costs to many of the markets from Halifax are lower than the cost of shipment from the existing facilities and the cost of shipment using foreign flag vessels to the West Coast could be significantly less costly. The cost of stevedoring and the local trucking to the sterilization plant in New York is also higher than in Halifax. As a result, even if the sterilization is performed for the same rate as the competition (US$0.07 per pound or US$2,500 per container), there could be a significant cost benefit to treating the product in Halifax. See figure 7.3.
Figure 7.3
Savings Halifax Vs New York
Item Canada Mid West West Coast Stevedoring $100/container $100/container $100/container
Local Trucking $150/container $150/container $150/container
Inland Transportation
$100/container Same $300/container
Harbour Mtce $90/container $90/container $90/container
Total $440.00 $340.00 $640.00
Per pound $0.012 $0.010 $0.018
7.6.2.3 Strengths to Build Upon Halifax has, in addition to the cost of transportation described above, a number of strengths in this field particularly when compared to other possible locations for sterilizing products such as Nyjer seed.
MariNova Consulting Ltd. March 2004

Greater Halifax Distribution Study 71
The first alternative that comes to mind is to sterilize the seed at source. This has the potential of avoiding a certain amount of double handling and re-bagging. Labour costs are also generally very low in India. While treating at source is possible, Halifax has the following advantages to offer: a) Reputation Canada’s reputation for standards and relatively honest government would likely allow certification of the treatment to be universally accepted, whereas certain areas of the world are known for corruption and with the cost of sterilizing nearly $2,500 US per container, it could be very tempting to skip some lots. A treatment plant outside the US will have to obtain some sort of acceptance from the regulatory agencies in the USA. b) Technology Halifax has an established biotech industry and a number of universities; laboratories and experts would be readily available for independent verification etc… c) Geography In the short term, economics will favour local sterilization at source, however there is a significant risk that the product may at some point in time be sourced elsewhere and capital investment in any fixed assets would be at risk. The geographic advantage of Halifax remains unless the source moves to an area that is east of Singapore. 7.6.2.4 Distribution Centre A sterilization facility would de facto become a distribution centre for any product that would be processed in large quantities. In the case of Nyjer seed, bagging could be performed locally and the product distributed from Halifax. In addition to being able to ship containers to the West Coast economically, there is a real opportunity to take advantage of the domestic transportation backhaul, both with trucks and railcars.
Nyjer seed is produced over a 3-month period from December to February and a sterilization facility would need to target other products. The dry heat sterilization process could be used for many applications from treating other agricultural products to drying of free flowing bulk materials. 7.6.3 Forklifts The third example of value added distribution is based on a local company called Hurricane Industrial Equipment Inc., more specifically a division of this enterprise called
MariNova Consulting Ltd. March 2004
Greater Halifax Distribution Study 72
Steve Gilbert Forklift Company. The company deals in forklifts of all kinds and has operated in the Halifax area for over 14 years now. This example considers the opportunity of expanding what the company already does into a more international market. As the technical ability of the company is proven, the example is straightforward and uncomplicated by technical details. The largest part of this business consists of buying used forklifts, refurbishing them and reselling with or without warranty. This type of transaction accounts for some 60% of sales. Another part of the business representing about 20% of income involves buying used forklifts, refurbishing (or not if unnecessary), and renting into the local market. The remaining 20% of income is derived from buying used equipment and re-selling at a profit (brokering). 7.6.3.1 Refurbishing The activity of interest that promotes the concept of a distribution centre is that of refurbishing. It involves having the equipment moved to the refurbishing centre, overhauled and distributed back into the market. Refurbishing can be undertaken as a repair activity where the beneficial owner of the equipment wishes to prolong the life of the asset, or as a commercial activity of buying and selling after refurbishing.
7.6.3.2 Developing Countries Many developing countries lack the know-how, the contacts and the experience to rebuild used equipment. As a consequence, they are continuously acquiring new equipment and older equipment sits idle often for some relatively minor problem. The used equipment from these countries will generally have few operating hours and little wear. Any forklift should have a useful life of at least 10 years and 10,000 hours of operation. The larger the forklift, the longer it should last before having to be replaced. Contrary to automobiles that benefit from the advantages of mass production, design costs spread over millions of units and the enormous buying power of the manufacturers, forklifts (particularly the larger ones) are often more expensive than the sum of their components. A refurbished forklift with a rebuilt engine and transmission, new seat, new controls, rebuilt hydraulic pumps and cylinders, new tires and a paint job is, from a life expectancy point of view, not very different than a new forklift; yet the cost is significantly less. Areas such as the Caribbean, South America and Africa are where the best opportunities lie as they are all within economic range of Halifax. In fact, it may often cost more to ship a larger forklift from central Canada to Halifax than from Halifax to some of these areas.
MariNova Consulting Ltd. March 2004
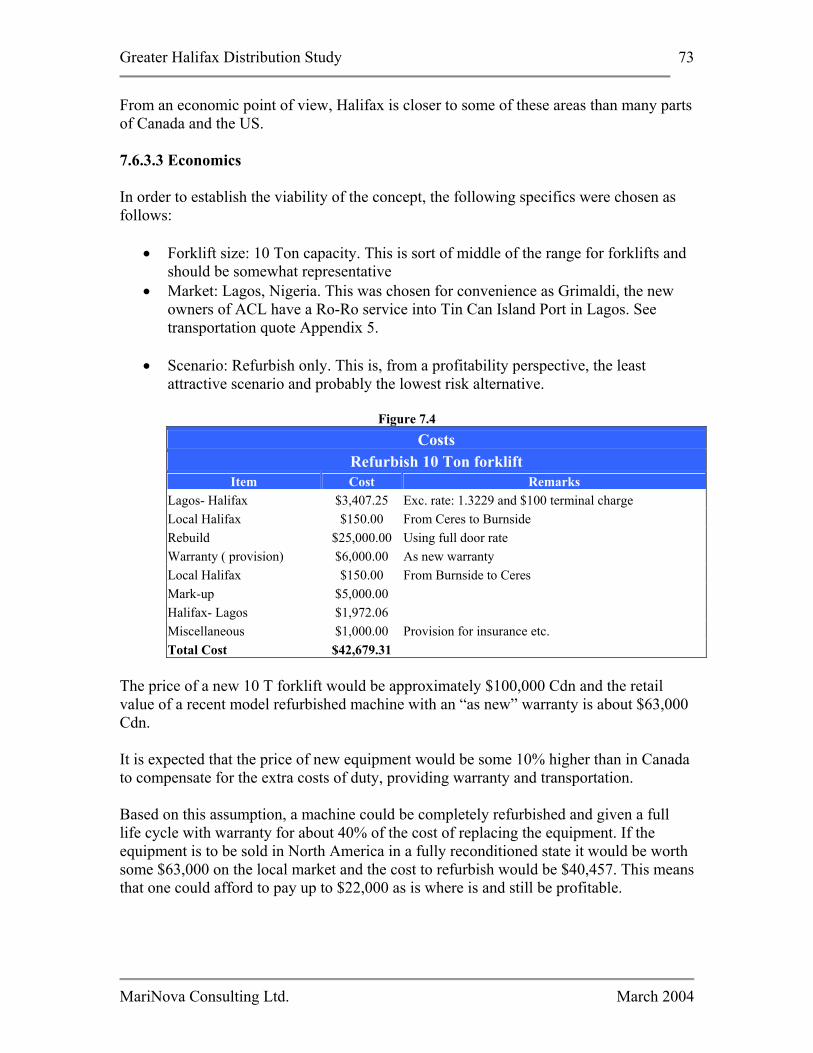
Greater Halifax Distribution Study 73
From an economic point of view, Halifax is closer to some of these areas than many parts of Canada and the US. 7.6.3.3 Economics In order to establish the viability of the concept, the following specifics were chosen as follows:
• Forklift size: 10 Ton capacity. This is sort of middle of the range for forklifts and should be somewhat representative
• Market: Lagos, Nigeria. This was chosen for convenience as Grimaldi, the new owners of ACL have a Ro-Ro service into Tin Can Island Port in Lagos. See transportation quote Appendix 5.
• Scenario: Refurbish only. This is, from a profitability perspective, the least
attractive scenario and probably the lowest risk alternative.
Figure 7.4 Costs
Refurbish 10 Ton forklift Item Cost Remarks
Lagos- Halifax $3,407.25 Exc. rate: 1.3229 and $100 terminal charge Local Halifax $150.00 From Ceres to Burnside Rebuild $25,000.00 Using full door rate Warranty ( provision) $6,000.00 As new warranty Local Halifax $150.00 From Burnside to Ceres Mark-up $5,000.00 Halifax- Lagos $1,972.06 Miscellaneous $1,000.00 Provision for insurance etc. Total Cost $42,679.31
The price of a new 10 T forklift would be approximately $100,000 Cdn and the retail value of a recent model refurbished machine with an “as new” warranty is about $63,000 Cdn. It is expected that the price of new equipment would be some 10% higher than in Canada to compensate for the extra costs of duty, providing warranty and transportation. Based on this assumption, a machine could be completely refurbished and given a full life cycle with warranty for about 40% of the cost of replacing the equipment. If the equipment is to be sold in North America in a fully reconditioned state it would be worth some $63,000 on the local market and the cost to refurbish would be $40,457. This means that one could afford to pay up to $22,000 as is where is and still be profitable.
MariNova Consulting Ltd. March 2004

Greater Halifax Distribution Study 74
7.6.3.4 Aid Programs Canada has numerous programs to assist developing countries to improve their infrastructure. Many of these programs involve providing equipment generally sourced in Canada and sometimes manufactured in Canada. In many cases the equipment can be found neglected and non-operational after the warranty runs out. There could be an opportunity to provide refurbishing services and/or refurbished equipment to these countries instead of new. In the final analysis, what the developing countries need is operational equipment, parts and training; and refurbishing frequently will have a higher Canadian content than manufacturing, particularly when equipment is simply assembled in Canada. It may be possible to introduce this concept by providing extended warranties and including a refurbishing cycle in the aid package.
7.6.3.5 Ways to Promote There are obviously numerous business opportunities that could benefit from the strengths Halifax has to offer. Many of these opportunities require some level of investment and carry some risk. Typically there is a barrier to entry into any new business and often a critical mass is required to achieve profitability. There are however ways of facilitating the development of the types of businesses considered in the preceding examples: a) Free trade zone Many ports have set up duty free zones to allow value added activities to take place without the requirement for duty/taxes to be paid on the raw materials. As the majority of the product is exported, the duty is paid only on the product destined for the domestic market as it exits the duty free zone. The zone is similar to a bonded warehouse with the exception that the cargo will generally have some value added while in the zone. This reduces the cost of raw materials in some cases and in other cases simply improves cash flow since the duty/taxes could be recovered anyway when the product is exported. By creating a free trade zone it would be significantly easier for entrepreneurs to take advantage of the strengths identified that Halifax has to offer in international trades. b) Accommodate activities on Port premises Certain activities could be performed on the premises of the Port of Halifax and kept within the transportation chain. As an example, sterilizing Nyjer seeds on Port premises would facilitate keeping the activities part of the transportation chain. There can be some benefits in keeping such activities part of the overall transportation chain.
MariNova Consulting Ltd. March 2004
Greater Halifax Distribution Study 75
Some activities of this nature already exist and the boundaries would simply be expanded. Today, inspections, sampling, surveys etc. are carried out without breaking the transportation chain.
c) Develop “domestic” shipping Despite the rhetoric about Halifax not being subject to the Jones Act and thus having an advantage over US ports, using international shipping lines to carry freight to the US has still not caught on. Most shipments to the US out of the Maritimes are trucked. Part of the reason for this is that trucking to the US is faster than shipping and the rates are good because of the backhaul situation. Part of the reason is also the fact that international shipping and domestic transportation are totally segregated and have little in common. Another important factor is the way shipping lines view (price) their business:
• A shipment is a shipment is a shipment. Shipping lines count TEUs as their principal measurement of product. Each TEU requires a certain amount of paperwork, needs a box to be positioned, represents a sale, uses space on the ship, etc.
• Pricing tends to be equalized to an expected ocean freight per TEU plus inland
costs. The ocean freight from Hamburg to Savannah (4.8K miles) is the same as from Liverpool to Halifax (2.5K miles).
• In their contribution models, each TEU gets an allocated ship cost.
It has been suggested that one way to solve the pricing dilemma is to create an NVOCC (Non Vessel Operating Common Carrier) and negotiate slot costs from Halifax to the US and back. This would involve managing and maintaining a fleet of containers but could be looked at differentially by the shipping lines.
d) Match up Partners Having established a strategic vision, business opportunities compatible with that vision could be promoted to both suitable local partners and established international businesses.
MariNova Consulting Ltd. March 2004

Greater Halifax Distribution Study 76
8.0 PORT CASE STUDY Several ports have seized upon the potential of attracting distribution activity close to port facilities, thus attracting shipping lines carrying cargo destined for those distribution facilities. If shipping lines want to serve these customers, they need to incorporate these ports of call. This phenomenon, plus congestion at west coast ports is leading to the re-establishment of all-water services from the Far East through the Panama Canal to east coast destinations, including Savannah, Charleston, Norfolk and New York. 8.1 Port of Savannah Created in 1945 by an act of the Georgia state legislature, the Georgia Ports Authority is an instrument of the State of Georgia and a public corporation existing for the express purpose of developing, maintaining and operating ocean and inland river ports within the state. The Georgia Ports Authority owns and operates the Port of Savannah, the Port of Brunswick, the Bainbridge Inland Barge Terminal and the Columbus Inland Barge Terminal. Policy guidance and fiscal oversight is provided by a thirteen member Board of Directors, each of whom is appointed by the Governor to serve a four year term. The Governor also appoints the GPA’s chief executive, who manages day-to-day operations. Containership stevedoring activities for the GPA are concentrated at the Garden City Terminal, just outside of the City of Savannah. The Port also owns and operates a break-bulk/general cargo facility in Savannah, known as Ocean Terminal, with several on-dock warehouses.
MariNova Consulting Ltd. March 2004
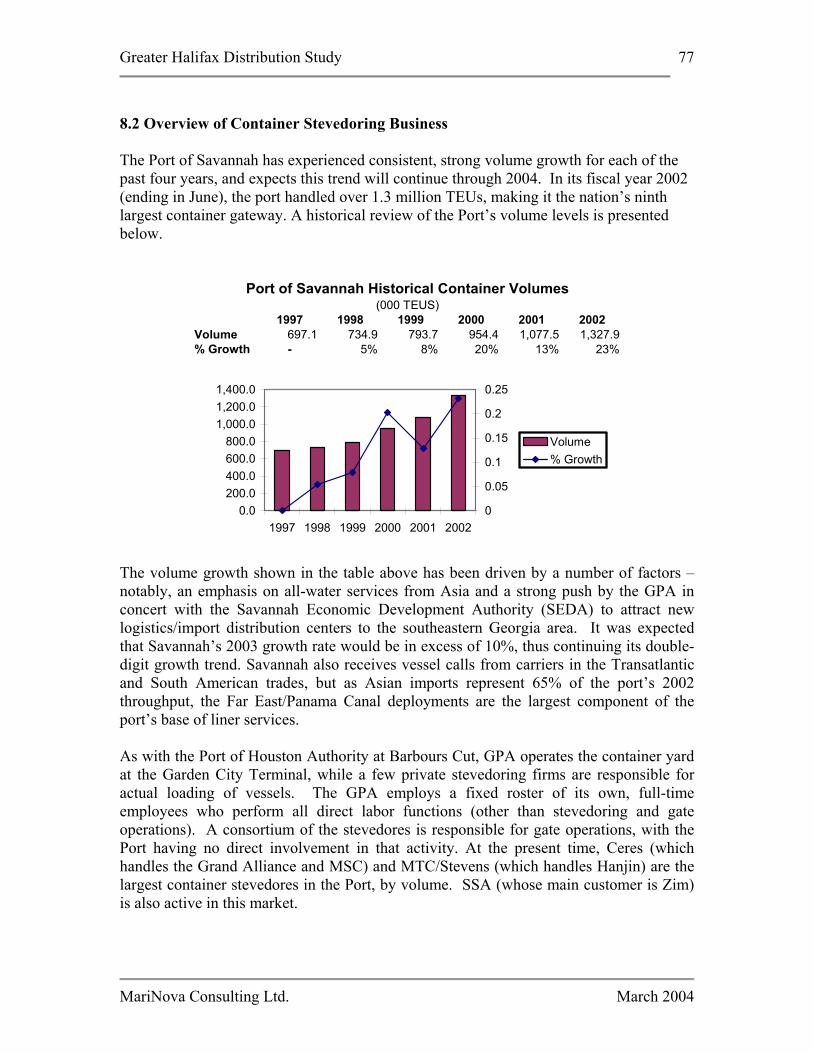
Greater Halifax Distribution Study 77
8.2 Overview of Container Stevedoring Business The Port of Savannah has experienced consistent, strong volume growth for each of the past four years, and expects this trend will continue through 2004. In its fiscal year 2002 (ending in June), the port handled over 1.3 million TEUs, making it the nation’s ninth largest container gateway. A historical review of the Port’s volume levels is presented below.
1997 1998 1999 2000 2001 2002Volume 697.1 734.9 793.7 954.4 1,077.5 1,327.9% Growth - 5% 8% 20% 13% 23%
Port of Savannah Historical Container Volumes(000 TEUS)
0.0200.0400.0600.0800.0
1,000.01,200.01,400.0
1997 1998 1999 2000 2001 20020
0.05
0.1
0.15
0.2
0.25
Volume% Growth
The volume growth shown in the table above has been driven by a number of factors – notably, an emphasis on all-water services from Asia and a strong push by the GPA in concert with the Savannah Economic Development Authority (SEDA) to attract new logistics/import distribution centers to the southeastern Georgia area. It was expected that Savannah’s 2003 growth rate would be in excess of 10%, thus continuing its double-digit growth trend. Savannah also receives vessel calls from carriers in the Transatlantic and South American trades, but as Asian imports represent 65% of the port’s 2002 throughput, the Far East/Panama Canal deployments are the largest component of the port’s base of liner services. As with the Port of Houston Authority at Barbours Cut, GPA operates the container yard at the Garden City Terminal, while a few private stevedoring firms are responsible for actual loading of vessels. The GPA employs a fixed roster of its own, full-time employees who perform all direct labor functions (other than stevedoring and gate operations). A consortium of the stevedores is responsible for gate operations, with the Port having no direct involvement in that activity. At the present time, Ceres (which handles the Grand Alliance and MSC) and MTC/Stevens (which handles Hanjin) are the largest container stevedores in the Port, by volume. SSA (whose main customer is Zim) is also active in this market.
MariNova Consulting Ltd. March 2004
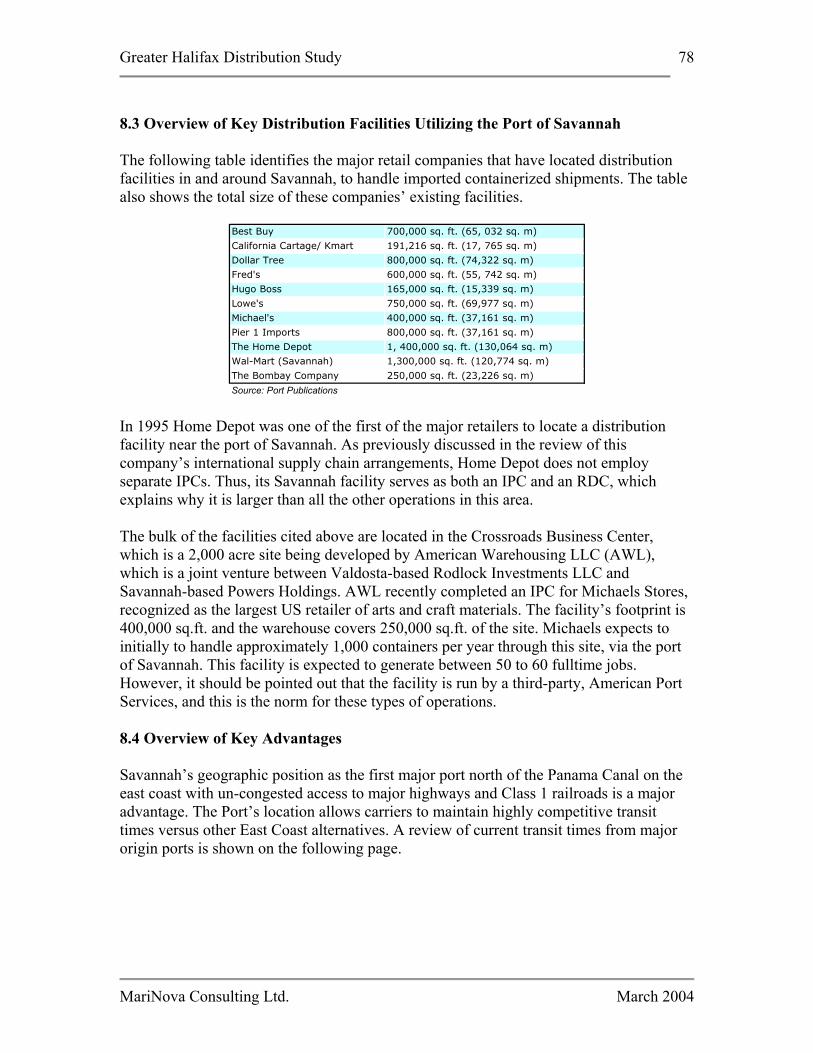
Greater Halifax Distribution Study 78
8.3 Overview of Key Distribution Facilities Utilizing the Port of Savannah The following table identifies the major retail companies that have located distribution facilities in and around Savannah, to handle imported containerized shipments. The table also shows the total size of these companies’ existing facilities.
Best Buy 700,000 sq. ft. (65, 032 sq. m)
California Cartage/ Kmart 191,216 sq. ft. (17, 765 sq. m)
Dollar Tree 800,000 sq. ft. (74,322 sq. m)
Fred's 600,000 sq. ft. (55, 742 sq. m)
Hugo Boss 165,000 sq. ft. (15,339 sq. m)
Lowe's 750,000 sq. ft. (69,977 sq. m)
Michael's 400,000 sq. ft. (37,161 sq. m)
Pier 1 Imports 800,000 sq. ft. (37,161 sq. m)
The Home Depot 1, 400,000 sq. ft. (130,064 sq. m)
Wal-Mart (Savannah) 1,300,000 sq. ft. (120,774 sq. m)
The Bombay Company 250,000 sq. ft. (23,226 sq. m)
Source: Port Publications In 1995 Home Depot was one of the first of the major retailers to locate a distribution facility near the port of Savannah. As previously discussed in the review of this company’s international supply chain arrangements, Home Depot does not employ separate IPCs. Thus, its Savannah facility serves as both an IPC and an RDC, which explains why it is larger than all the other operations in this area. The bulk of the facilities cited above are located in the Crossroads Business Center, which is a 2,000 acre site being developed by American Warehousing LLC (AWL), which is a joint venture between Valdosta-based Rodlock Investments LLC and Savannah-based Powers Holdings. AWL recently completed an IPC for Michaels Stores, recognized as the largest US retailer of arts and craft materials. The facility’s footprint is 400,000 sq.ft. and the warehouse covers 250,000 sq.ft. of the site. Michaels expects to initially to handle approximately 1,000 containers per year through this site, via the port of Savannah. This facility is expected to generate between 50 to 60 fulltime jobs. However, it should be pointed out that the facility is run by a third-party, American Port Services, and this is the norm for these types of operations. 8.4 Overview of Key Advantages Savannah’s geographic position as the first major port north of the Panama Canal on the east coast with un-congested access to major highways and Class 1 railroads is a major advantage. The Port’s location allows carriers to maintain highly competitive transit times versus other East Coast alternatives. A review of current transit times from major origin ports is shown on the following page.
MariNova Consulting Ltd. March 2004
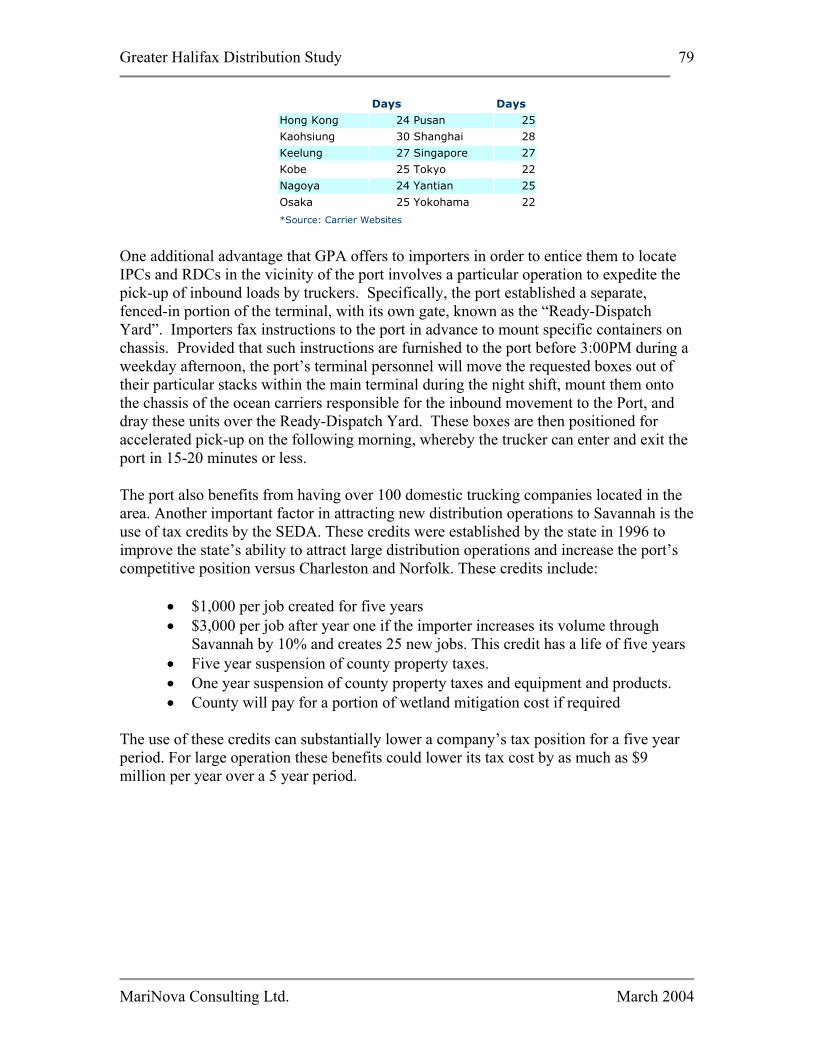
Greater Halifax Distribution Study 79
Days Days
Hong Kong 24 Pusan 25
Kaohsiung 30 Shanghai 28
Keelung 27 Singapore 27
Kobe 25 Tokyo 22
Nagoya 24 Yantian 25
Osaka 25 Yokohama 22
*Source: Carrier Websites
One additional advantage that GPA offers to importers in order to entice them to locate IPCs and RDCs in the vicinity of the port involves a particular operation to expedite the pick-up of inbound loads by truckers. Specifically, the port established a separate, fenced-in portion of the terminal, with its own gate, known as the “Ready-Dispatch Yard”. Importers fax instructions to the port in advance to mount specific containers on chassis. Provided that such instructions are furnished to the port before 3:00PM during a weekday afternoon, the port’s terminal personnel will move the requested boxes out of their particular stacks within the main terminal during the night shift, mount them onto the chassis of the ocean carriers responsible for the inbound movement to the Port, and dray these units over the Ready-Dispatch Yard. These boxes are then positioned for accelerated pick-up on the following morning, whereby the trucker can enter and exit the port in 15-20 minutes or less.
The port also benefits from having over 100 domestic trucking companies located in the area. Another important factor in attracting new distribution operations to Savannah is the use of tax credits by the SEDA. These credits were established by the state in 1996 to improve the state’s ability to attract large distribution operations and increase the port’s competitive position versus Charleston and Norfolk. These credits include:
• $1,000 per job created for five years • $3,000 per job after year one if the importer increases its volume through
Savannah by 10% and creates 25 new jobs. This credit has a life of five years • Five year suspension of county property taxes. • One year suspension of county property taxes and equipment and products. • County will pay for a portion of wetland mitigation cost if required
The use of these credits can substantially lower a company’s tax position for a five year period. For large operation these benefits could lower its tax cost by as much as $9 million per year over a 5 year period.
MariNova Consulting Ltd. March 2004
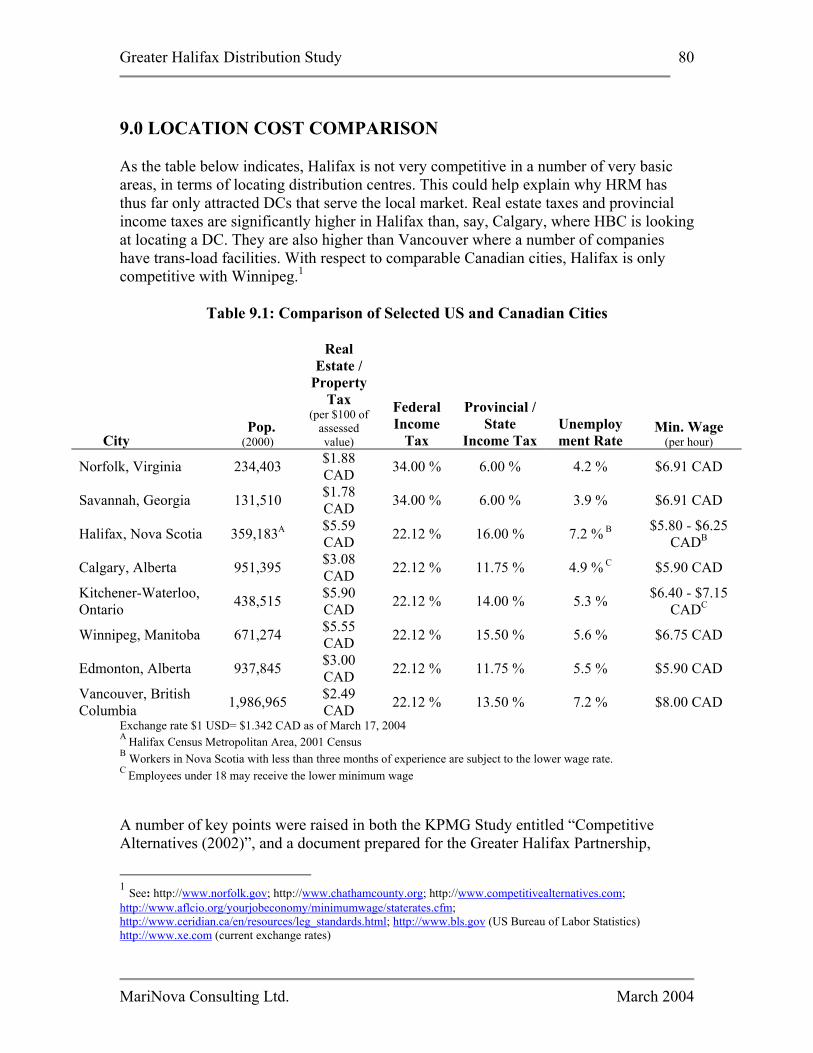
Greater Halifax Distribution Study
80
9.0 LOCATION COST COMPARISON As the table below indicates, Halifax is not very competitive in a number of very basic areas, in terms of locating distribution centres. This could help explain why HRM has thus far only attracted DCs that serve the local market. Real estate taxes and provincial income taxes are significantly higher in Halifax than, say, Calgary, where HBC is looking at locating a DC. They are also higher than Vancouver where a number of companies have trans-load facilities. With respect to comparable Canadian cities, Halifax is only competitive with Winnipeg.1
Table 9.1: Comparison of Selected US and Canadian Cities
City Pop.
(2000)
Real Estate /
Property Tax
(per $100 of assessed value)
Federal Income
Tax
Provincial / State
Income Tax Unemployment Rate
Min. Wage (per hour)
Norfolk, Virginia 234,403 $1.88 CAD 34.00 % 6.00 % 4.2 % $6.91 CAD
Savannah, Georgia 131,510 $1.78 CAD 34.00 % 6.00 % 3.9 % $6.91 CAD
Halifax, Nova Scotia 359,183A $5.59 CAD 22.12 % 16.00 % 7.2 % B $5.80 - $6.25
CADB
Calgary, Alberta 951,395 $3.08 CAD 22.12 % 11.75 % 4.9 % C $5.90 CAD
Kitchener-Waterloo, Ontario 438,515 $5.90
CAD 22.12 % 14.00 % 5.3 % $6.40 - $7.15 CADC
Winnipeg, Manitoba 671,274 $5.55 CAD 22.12 % 15.50 % 5.6 % $6.75 CAD
Edmonton, Alberta 937,845 $3.00 CAD 22.12 % 11.75 % 5.5 % $5.90 CAD
Vancouver, British Columbia 1,986,965 $2.49
CAD 22.12 % 13.50 % 7.2 % $8.00 CAD Exchange rate $1 USD= $1.342 CAD as of March 17, 2004 A Halifax Census Metropolitan Area, 2001 Census B Workers in Nova Scotia with less than three months of experience are subject to the lower wage rate. C Employees under 18 may receive the lower minimum wage
A number of key points were raised in both the KPMG Study entitled “Competitive Alternatives (2002)”, and a document prepared for the Greater Halifax Partnership,
1 See: http://www.norfolk.gov; http://www.chathamcounty.org; http://www.competitivealternatives.com; http://www.aflcio.org/yourjobeconomy/minimumwage/staterates.cfm; http://www.ceridian.ca/en/resources/leg_standards.html; http://www.bls.gov (US Bureau of Labor Statistics) http://www.xe.com (current exchange rates)
MariNova Consulting Ltd. March 2004
Greater Halifax Distribution Study
81
Enterprise Greater Moncton and the Atlantic Canada Opportunities Agency (ACOA) entitled “Halifax-Moncton Growth Corridor Asset Mapping”2 These key points and comments are presented herein to add depth to the table above and to provide alternate comparison on a selected-city basis.
• Cost of Land: It should be noted the cost of land is less than Calgary and Vancouver, but not less than Winnipeg, Hamilton, Moncton or Truro (in that order)
• Cost of Construction: The cost of construction is less than in Truro, Vancouver, Calgary, Winnipeg, Moncton, and many international cities.
• Property Taxes: Property taxes vary from $3-$4.50 per $100 of value (does not include occupancy taxes as KPMG did)
• Lease Rates: Office lease rates are less than Calgary, Toronto and Vancouver (but not less than Moncton)
• Hourly Wages by Occupation: Corridor average hourly wage rates for 12 selected occupations are lower than Calgary and Toronto, as well as Boston, Houston, Jacksonville, Minneapolis and Seattle. (Note: this study did not survey average wages, only reported as an indicator the minimum wage rate –some jobs would not be affected by minimum wages)
• Fringe Benefits: Fringe benefit costs in Halifax are lower than Calgary, Winnipeg, Vancouver, and Toronto, but not lower than Moncton or Truro (for Manufacturing Facilities) -- for Shared Services Facilities, Truro, Moncton and Halifax were the three lowest (Truro being the lowest) in terms of cost of Total Benefits.
• Corporate Taxation: As stated in the Growth Corridor report, one of the operating cost areas where the Corridor is not as competitive is in the area of corporate taxation. From the KPMG Competitive Alternatives report, the three Corridor communities were among the highest cost locations for corporate taxation. Table 9.1 summarizes the total income taxes paid for the average manufacturing facility. The figures include all national, provincial/regional and local corporate taxes.
In this study, total corporate income taxes paid in the Corridor were 20%-40% higher than other Canadian locations and as much as 3-4 times higher than the U.S. locations. A significant portion of this higher amount was due to the higher pre-tax profitability attributed to Corridor locations in the study. For virtually all scenarios, Corridor communities were among the most profitable in the study. Higher profitability leads to higher total taxes paid. The higher taxation differential did erode the overall cost competitiveness of the Corridor but it was still, by far, more cost competitive than most of the other locations. Shipping Costs: Shipping costs for Typical Manufacturing Facilities appear to be highly competitive in Halifax, Moncton and Truro, when compared with cities outside major population centres.
2 ShiftCentral, Julaux Consultants and Cossette Atlantic, January 2003
MariNova Consulting Ltd. March 2004

Greater Halifax Distribution Study
82
Utilities: Total utilities costs (electricity, gas, telecom) were lower in Halifax than Truro and Toronto, but not lower than Calgary, Moncton, Vancouver and Winnipeg (Winnipeg being the lowest combined cost), according to the KPMG report
MariNova Consulting Ltd. March 2004
Greater Halifax Distribution Study
83
10.0 Conclusions / Recommendations There are some immediate and longer term opportunities for the GHP, the HPA and their various study partners to follow up. In terms of overall findings, we can conclude:
• Large distribution centres that support the larger retail stores in Canada are located in close proximity to the stores that they service with a large cluster of locations in central Canada.
• 3 PLs provide a critical link in the overall supply chain strategy of retail
companies. There are strategic alliances between truck companies, rail and warehouse and transload operations.
• In Canada it would appear that CP Rail with Fastfrate Canada have strong market
shares in the provision of services to major retailers including Sears, Canadian Tire, and Hudson Bay-Zellers. A similar, but not as well developed relationship exists between CN and both Armour Transportation and Clarke Transport.
In the initial stages of the project, we saw few opportunities for the GHP and HPA in this sector. Indeed, some of the GIS data appeared to confirm this notion. However, with additional interviews and analysis, the study found that there are several immediate opportunities worth following up:
• Loblaws is apparently investigating the potential for a 300,000 sq.ft. transload facility in Halifax, which would handle import containers and domestic freight.
• Canadian Tire is always re-evaluating their supply chains and should
be contacted with respect to potential site opportunities for a transload. They need more data regarding lines and transit times of services.
• Hudson’s Bay Company is examining sites for new DCs in Calgary and Halifax.
• Target Stores is examining the potential for a DC in Maine, to serve the north-
east. This DC could potentially be fed via the Port of Halifax on a cost competitive basis compared with Boston or New York.
MariNova Consulting Ltd. March 2004
Greater Halifax Distribution Study
84
• Wal-Mart, which is very secretive, is “reviewing” its network of DCs, including
those in Canada.
• DHL/Danzas sees potential for feeding Boston and Connecticut from Halifax. (They are obviously not aware of the existing Halifax-Boston feeder, as was the case with Target). There are ports in Connecticut that could be served by feeder too.
• There are numerous smaller 3PLs that could be approached about either
expanding operations or investing in new ones. In terms of port development, it is unlikely we will see the kind of DC activity spring up around the Port of Halifax as has happened around Savannah and Norfolk. However, based on an analysis of trade data and shipping patterns, as well as future growth expectations, there are some very real opportunities at hand. These include:
• Emerging markets on the Indian sub-continent, for both imports and exports. In terms of transit times, Halifax has a distinct advantage over competing ports on the west coast and US east coast.
• The existence of numerous shipping services between Halifax and the
Mediterranean There are also some opportunities in terms of the large importers we contacted, such as HBC, Canadian Tire and CRSA. At the present time, their image of Halifax is not very positive. Perhaps in conjunction with CN, the port could work with them to improve the level of service provided to them.
• We also recommend that the port examine its shipper data to determine the existing top 10 importers and exporters on at least three trade routes: UK/ Continent; Mediterranean and Indian sub-continent. It should apply some of the same GIS analysis we have provided in this report to determine where this cargo is destined and where it originates. There may be some cross-dock or transload opportunities that emerge in doing so. Moreover, the port can then work with these shippers to increase their volume of business through the port.
• We also believe there is considerable value in the Port of Halifax and GHP
developing relationships with Indian exporters and consolidators as this market is not yet as well developed as China. There may be some “first mover advantage” for the port in this market.
MariNova Consulting Ltd. March 2004

Greater Halifax Distribution Study
85
In terms of value-added opportunities, we have provided a number of case studies that require additional follow up, including granite, Nyjer seed and refurbishment of transportation equipment. The issue of security and biological protection for import cargoes such as Nyjer seed are worthy of follow up. There exist a number of financial incentives in other jurisdictions that have clearly contributed to DC location, and that the GHP and perhaps the province or the HRM should investigate the available options should they find a prospective company to locate in the Halifax-Moncton Growth Corridor.
MariNova Consulting Ltd. March 2004
Greater Halifax Distribution Study
86
List of Contacts
1. Canadian Retailers Sobeys Atlantic John MacDonald 902-752-8371 Larry Romain (importing): ext 8105 Charlie Steele (Director of Warehousing): ext 8342 Kent Building Supplies Eric Lloyd 506-632-4100 HBC/Zellers Mike Thomas VP Logistics 416-861-6334 Home Hardware Harvey Gullon 902-662-2800 Loblaws (offshore freight) Rob Wiebe 403-291-7866 Canadian Tire Corporation Pat Sinnon VP Logistics 416-480-3489 Wal-Mart Doug Doust VP Supply Chain 605-821-2111 ext. 4170 Kent Building Supplies (Moncton) Eric Lloyd 506-632-4100 Nova Scotia Liquor Corporation Craig Sutherland Director of Distribution 2. U.S. Retailers
MariNova Consulting Ltd. March 2004
Greater Halifax Distribution Study
87
Home Depot John Demarin Director of Divisional Logistics for Canada 416-412-6842 Lee Bandlow Vice President of Distribution 770-384-3002 Target Stores Rick Gabrielson Senior Manager, Import Operations 612-696-1746 3. 3PLs and DCs DHL/Danzas Philippe C. Rathgeb Vice President, Ocean freight, North America 800-225-5345 CSRA Li&Fung Armour Transportation Brian Killen 1-800-561-0984 Logistic-Solve Inc Peter Reaume 416-247-4257 4. Value-added Commodities Hurricane Industrial Equipment Inc. Steve Gilbert 902-468-8518 Epoch Rock Gerry Hines 709-227-1700 N.S. Natural Resources
MariNova Consulting Ltd. March 2004

Greater Halifax Distribution Study
88
Philip Fink 902-424-2521 Ref. Nyjer seed Stephen Aron 941-358-7927
MariNova Consulting Ltd. March 2004
NLIS 5 August 1, 2000 (Development and Rural Renewal)
Official start of granite processing plant in Argentia
Federal, provincial, municipal and private sector officials were on hand today to take part in a sod-turning ceremony to officially start construction of a new multi-million dollar modern granite processing plant in Argentia. The project is expected to employ approximately 80 people.
The company - Epoch Rock Incorporated - will import 15 to 30 ton granite blocks from various countries in the world, cut and polish them into two and three centimetre slabs for export into the United States. The focus will be on the 15 top selling types and colours of stone.
The facility will stimulate the development of Newfoundland granite quarries and provide a market for locally quarried raw material. The project costs include construction of the processing facility and equipment and start-up working capital.
While approximately 90 per cent of the financing for the $20 million project will come from the private sector, the federal and provincial governments are also participating in the venture. The Department of Development and Rural Renewal is providing a $500,000 loan; ACOA is providing a $500,000 repayable loan; the Argentia Management Authority is contributing a $450,000 loan; the Department of Mines and Energy is providing a $300,000 contribution and the Department of Industry, Trade and Technology is providing Economic Diversification and Growth Enterprises (EDGE) status. The Town of Placentia is providing a five-year tax exemption to the company. Also, HRDC is contributing $500,000 towards the initiative. This project has been approved to ensure that HRDC’s funding is in compliance with the department’s improved administration of its grants and contributions programs.
George Baker, Minister of Veterans Affairs and Minister of State for the Atlantic Canada Opportunities Agency (ACOA), welcomed the announcement. "This facility will support the province’s expanding dimension stone industry by working closely with local businesses to establish quarries and process domestic sources of granite and marble."
Beaton Tulk, Minister of Development and Rural Renewal, said the provincial government is delighted to partner with the federal government and the private sector to make this project a reality. "This facility is a good example of how our dimension stone industry represents an opportunity for significant investment in rural areas. This will not only strengthen and diversify the economy of the Argentia area, but will have longer term benefits for the development of the dimension stone industry in other areas of the province."
"Epoch Rock is a great example of the innovative and dynamic companies in rural Newfoundland and Labrador that are helping to diversify and strengthen the economy," said Sandra Kelly, Minister of Industry, Trade and Technology. "As the province’s latest EDGE company, Epoch Rock is proving the EDGE program is working to attract investment in regions across Newfoundland and Labrador."
James Radford, President and CEO of Epoch Rock Incorporated, said the sod turning ceremony is just the start of a project that will benefit the economy of the Argentia area and the province as a whole. "This industry has tremendous potential and I’m fully confident that this initiative will be a major
success."
Harvey Mercer, chairperson of the Argentia Management Authority, said the new facility will be one of the largest and most modern in eastern North America. "The construction and operation of this facility here at Argentia sends another clear signal to the business community, not only here in Newfoundland and Labrador, but around the world that Argentia is an excellent place to establish business operations."
Construction of the new facility is expected to start immediately.
Media contact:
James Radford President/CEO Epoch Rock Inc (709) 781-6443
Doug Burgess ACOA (709) 772-2935
Bonnie Pope HRDC (709) 772-5346
Josephine Cheeseman Department of Development and Rural Renewal (709) 729-4570
Jackie Simon Department of Industry, Trade and Technology (709) 729-6573
Harvey Mercer AMA (709) 227-5502
2000 08 01 4:05 p.m.
All material copyright the Government of Newfoundland and Labrador. No unauthorized copying or redeployment permitted. The Government assumes no responsibility for the accuracy of any material deployed on an unauthorized server.
Granite Granites are the most universally used monumental and building stones and are widely used as cladding panels, pavers, thresholds, steps and risers, and for monument black and press rollers. A large portion of Nova Scotia is underlain by granitic rocks. Past granite production has exploited the South Mountain Batholith and its related satellite plutons in areas such as Shelburne, Nictaux, Halifax and Terence Bay. The eastern shore region of the Province boasts a number of plutons of "black granite". The old black granite quarry at West Erinville produced thin slabs of a good quality black granite (gabbro) for the monument industry. Recent studies have outlined significant reserves of granite at the following locations.
1. Terence Bay
Two types of granite are available in the Terence Bay area. A white monzogranite containing less than 10% mafic minerals is present on the shoreline directly across the Terence Bay River from the village of Terence Bay. Farther inland the monzogranite is more grey in colour and typically has more mafic minerals.
Recent drilling has outlined 220,000 m3 of granite to a depth of 14 m. There is no over-burden cover and the resource is considered to be open in all directions.
2. Nictaux
Near the village of West Nictaux, which is located a short distance from the town of Middleton, Annapolis County, a medium- to fine-grained, blue-grey granite is presently being quarried. Heritage Memorials Ltd. quarries about 1,500 tonnes of blue granite per year for use as monument bases, blanks and other specialty products.
3. Quarry Lake (Halifax Area)
Past granite production from the Halifax area occurred along the margin of the granite pluton which covers a very large area west of the city. The rock is a grey, medium- to coarse-grained porphyritic granodiorite which contains abundant xenoliths or "knots" of slate. Large quantities of the stone have been used in building construction, and for curbstone and paving blocks. Although the Quarry Lake area has not been drilled, it appears to contain a large reserve of granite suitable for building stone.
4. Shelburne
Past production of granite for monuments and building construction took place near the Shelburne Harbour area. The rock is a fine- to medium-grained, grey muscovite- biotite granodiorite to monzogranite. Although there is no production from the area at the present time, the stone has proven very suitable for architectural work in the past.

5. Erinville
Past production of "black granite" (gabbro) for monuments took place at Erinville, Guysborough County, in the early 1930s and again in the early 1960s. The gabbro consists of a fine- to medium-grained dark grey to black rock composed of labradorite, pyroxene and amphibole with minor amounts of ilmenite and apatite. Recent drilling has outlined a small gabbroic plug about 300 m in diameter which may be suitable for the production of quarry blocks
Building Stone Producers • Heritage Memorials Ltd.
P. O. Box 308 Windsor, Nova Scotia B0N 2T0 902-798-4780
• Wallace Quarries Ltd. P. O. Box 208 Wallace, Nova Scotia B0K 1YO 902-257-2014
Secondary Manufacturers • Arsenault Monumental Works Ltd.
P. O. Box 1475 Antigonish, Nova Scotia B2G 2L7
• Canstone Inc. Suite 510, World Trade & Convention Centre 1800 Argyle Street Halifax, Nova Scotia B3J 3N8 902-420-0692
• Dauphinee Memorial Art (1984) Ltd. P. O. Box 68 Shelburne, Nova Scotia B0T 1W0 902-875-3179
• Demone's Monuments Ltd. P. O. Box 447 Lunenburg, Nova Scotia
B0J 2C0 902-634-4621
• Heritage Memorials Ltd. P. O. Box 308 Windsor, Nova Scotia B0N 2T0 902-798-4780
• John D. Steele's &Sons Ltd. P. O. Box 173 North Sydney, Nova Scotia B2A 3M3 902-794-2713
• Tingley Monuments Ltd. P. O. Box 432 Amherst, Nova Scotia B4H 3Z5 902-667-2861
Sterilization Technologies Advancing into the 21st Century
Published by Business Communications Co. September 2000 R2-427
Description
INTRODUCTION
STUDY GOALS AND OBJECTIVES The objective of this report is to describe and discuss changes in the sterilization industry since BCC last looked at it in July 1993. The products and services provided by this industry have greatly increased in demand as a result of worldwide growth in commercial applications of infection control. BCC's major objective is to estimate U.S. sales of sterilization products and revenues from sterilization services. In addition, we will forecast product sales and service revenues through 2004. The overall goal is to provide the reader with insights and data of a professional nature for a complete understanding of this industry. REASONS FOR DOING THIS STUDY Sterilization is an unrecognized element in a vast number of industries and manufacturing processes and there is an ongoing need for effective, safe, rapid and economic methods. Many products are regulated and monitored by the government for microbe control procedures and contamination levels and they cannot be sold unless they are sterilized. Other products benefit from sterilization, even if not mandated by law. Sterilization methods are more than a century old. Processes for performing sterilization basically have remained unchanged, but the efficiency and performance of devices is changing and evolving, as are the materials that are being sterilized. Therefore, it is important to understand the various sterilization methods and their uses and to know the changes and directions sterilization technology is taking. CONTRIBUTIONS OF THE STUDY AND FOR WHOM This report should prove of particular value to both sterilization market participants, suppliers and observers, as well as to investors and venture capitalists, since it provides details on the United States sterilization industry market, including:
• market size, structure and dynamics, both current and through 2004 • changes in traditional practices • new marketing concepts and trends • changes in technology • impact of outside influences such as government regulators with particular emphasis on
the identification of potential market barriers

• identification and analysis of new distribution systems with particular emphasis on their cost-saving benefits to drug consumers
• corporate strategies • international aspects of the market.
SCOPE AND FORMAT In preparing this report, the entire sterilization industry was examined, with particular emphasis on those companies developing innovative technologies and those employing innovative marketing strategies to become the market leaders of the 21st century. The study focuses on sterilization processes, including:
• heating methods: autoclaving, retorting, pasteurization and others. • gas sterilization: ethylene oxide and other gases • radiation sterilization: gamma, electron-beam, x-ray and ultraviolet sterilization • filter sterilization.
This report attempts to discuss all areas of the market and to identify significant suppliers, end market size and government and regulatory factors. Participating companies will be discussed with regard to relative market share, marketing strengths, participation in new segments and innovative marketing practices. METHODOLOGY Data for this study were collected using both primary and secondary data research techniques. A literature search of BCC's extensive library was conducted, as well as searches of medical and business libraries. BCC also conducted extensive interviews with industry personnel, professional and trade organizations, government agency personnel, observers, scientists and industry professionals. All data collected refer to the U.S. or sales by U.S. companies, unless otherwise indicated. These data were analyzed by BCC personnel for specific findings and forecasts (in constant dollars through 2004.) Once these forecasts were obtained, they were validated by industry experts. Consequently, all estimates provided in this report represent a consensus opinion of BCC personnel, industry participants and industry observers. INFORMATION SOURCES Information contained in this report includes data obtained from government agencies, corporate publications and findings from industry trade associations. Other information sources include interviews with industry leaders, universities, dentists, dental centers, government and professional agencies and trade associations. Further information was obtained through an extensive literature search.
Table of Contents
TABLE OF CONTENTS
Title
INTRODUCTION
STUDY GOAL AND OBJECTIVES REASONS FOR DOING THIS STUDY
CONTRIBUTIONS OF THE STUDY AND FOR WHOM SCOPE AND FORMAT METHODOLOGY INFORMATION SOURCES RELATED BCC WORK CREDENTIALS BCC ON -LINE SERVICES
SUMMARY
OVERVIEW
IMPORTANCE OF STERILIZATION DEFINITIONS OF STERILITY CONCEPTUAL STERILIZATION OPERATIONAL DEFINITION OF STERILITY DEFINITION OF COMMERCIAL STERILITY STERILIZATION HALLMARKS HISTORY OF STERILIZATION TECHNOLOGY MICROBES AND THEIR RELATIONSHIP TO STERILIZATION PROBLEMS CAUSED BY MICROBES Spoilage Pathogenicity Physical Interference Chemical Impurity MICROBIAL CONTAMINATION SOURCES MICROBES TYPES AND THEIR SUSCEPTIBILITY TO STERILIZATION Bacteria Salmonella Campylobacter Escherichia coli Fungi (Molds and Yeasts) Protozoa Toxoplasma gondii Cryptosporidium parvum Viruses Norwalk Virus Hepatitis A Spores Algae HOW STERILIZATION METHODS ARE JUDGED FACTORS IMPACTING ON CHOICE OF STERILIZATION METHOD Relationship of Physical State of Matter To Sterilization Method Importance of Microbe Death Characteristics STERILIZATION TREATMENT MODALITIES TERMINAL STERILIZATION ASEPTIC PROCESSING CLEANING AND DISINFECTION IMPACT OF NEW TESTING TECHNOLOGIES ON STERILIZATION TYPES OF STERILIZATION METHODS HOW A STERILIZATION METHOD IS SELECTED STERILIZATION METHOD MARKET SHARE MATERIAL COMPATIBILITIES WITH STERILIZATION METHODS
THE STERILIZATION INDUSTRY
INDUSTRY CHARACTERISTICS STERILIZATION INDUSTRY STRUCTURE INDUSTRY SIZE INDUSTRY PARTICIPANTS Core Products and Original Equipment Manufacturers (OEMs) Refurbishers, Reconditioners, Resellers and Maintenance Suppliers Distributors Consumables and Auxiliary/Supplemental Suppliers Sterilization Service Firms: Contract Sterilizers FACTORS INFLUENCING STERILIZATION INDUSTRY DYNAMICS INFECTIOUS WASTE REUSE OF SINGLE -USE MEDICAL DEVICES HORIZONTAL AND VERTICAL INTEGRATION WITHIN THE INDUSTRY GOVERNMENT AND REGULATORY ENVIRONMENT NATIONAL EMISSIONS STANDARD FOR HAZARDOUS AIR POLLUTANTS (NESHAP) INTERNATIONAL STANDARDS ISO 9000 SERIES THE U.S. CLEAN AIR ACT AND THE MONTREAL PROTOCOL OF THE VIENNA CONVENTION FDA APPROVAL OF MEAT IRRADIATION USDA FINAL RULE ON MEAT AND POULTRY IRRADIATION HAZARD ANALYSIS AND CRITICAL CONTROL POINT PLAN (HACCP) COMPANY PROFILES CONSOLIDATED STILLS & STERILIZERS CYCLOPPS CORP. DIXIE CANNER CO. MDS NORDION MILLIPORE PALL CORP. STERIGENICS INTERNATIONAL INC. STERIS CORP. 3M U.S. FILTER
HEATING STERILIZATION METHODS
APPLICATIONS OF HEAT (HIGH TEMPERATURE) STERILIZATION SUPPLIERS OF HEAT STERILIZATION EQUIPMENT VOLUMES TREATED BY VARIOUS HEATING METHODS STEAM STERILIZATION AUTOCLAVES The U.S. Autoclave Market Value and Composition of the U.S. Autoclave Market Volume of Materials Processed Through Autoclaves RETORTS The U.S. Retort Market Value and Composition of the U.S. Retort Market Estimated Annual Sales PASTEURIZERS The U.S. Pasteurizer Market Value and Composition of the U.S. Pasteurizer Market STILLS What Are Stills? Market Size Uses For Water From Stills DRY HEAT STERILIZATION
HOW DRY HEAT STERILIZATION WORKS VARIABLES IN DRY HEAT STERILIZATION PREPARING ITEMS THE NEED TO MONITOR DRY HEAT STERILIZATION ADVANTAGES AND DISADVANTAGES OF DRY HEAT STERILIZATION STERILIZING OVENS Types of Sterilizing Ovens Uses For Sterilizing Ovens Market Size: Sterilizing Ovens Volume of Material Processed In Sterilizing Ovens MISCELLANEOUS HEATING EQUIPMENT HOT -FILL EQUIPMENT STEAM INJECTORS INCINERATORS LOW -TEMPERATURE STEAM AND FORMALDEHYDE
CHEMICAL STERILIZATION
FUNDAMENTALS OF GAS, PLASMA AND LIQUID STERILIZATION TYPES OF CHEMICAL STERILIZATION METHODS ETHYLENE OXIDE Health and Safety Issues Associated With EtO PERACETIC ACID OZONE Use In the Medical Device Industry Beverage Industry Use HYDROGEN PEROXIDE CHLORINE DIOXIDE CUMULATIVE VALUE OFCHEMICAL STERILIZATION EQUIPMENT VALUE OF STERILANT GASES MARKET VOLUME CHEMICAL STERILIZATION EQUIPMENT AND SUPPLIES VENDORS
FILTER STERILIZATION
PRINCIPLES OF FILTER STERILIZATION FILTER STERILIZATION VS. OTHER FILTRATION TYPES VARYING DEFINITIONS OF STERILE FILTRATION MARKET SIZE AND STERILIZING FILTER SALES GAS FILTER STERILIZATION TYPES OF GAS FILTER PRODUCTS High -efficiency Particulate Air (HEPA) Filters Compressed Gas Filters Medical Gas Filters Vent Filters MARKET FOR GAS FILTERS MARKET FOR GAS FILTERS LIQUID FILTER STERILIZATION TYPES OF LIQUID FILTER STERILIZATION PRODUCTS Batch Processing Filters In line Filters IV Filters Syringe Filters Water Purification Filtration LIQUID FILTER STERILIZATION BENEFITS

MARKETS FOR LIQUID STERILIZATION FILTERS Water Filtration Industrial Manufacturing Research Applications Point -of-Use Medical Applications MARKET FOR LIQUID STERILIZING FILTERS MARKET FOR LIQUID STERILIZATION FILTERS MARKET PARTICIPANTS
RADIATION STERILIZATION
HOW RADIATION STERILIZATION WORKS TYPES OF RADIATION STERILIZATION GAMMA RADIATION Gamma Radiation Facilities ELECTRON -BEAM (E BEAM) X -RAYS ULTRAVIOLET LIGHT (UV) Limitations of UV Sterilization UV Food Process Applications UV and Water Sterilization Air/Surface UV Products UV Sterilization Product Sales REGULATIONS IMPACTING ON GAMMA STERILIZATION REVISED AAMI GUIDELINES FOR RADIATION STERILIZATION MARKET SEGMENTS FOR IRRADIATION STERILIZATION FOOD IRRADIATION Foodborne Illness Radiation Pasteurization vs. Radiation Sterilization of Food Approved Methods for Processing Food With Ionizing Radiation Negative Effects of Radiation on Foods Potential Market Size for Food Irradiation MEDICAL DEVICE STERILIZATION Gamma Radiation and Medical Device Sterilization E -beam Sterilization of Medical Devices CONSUMER PRODUCTS MARKET FOR RADIATION STERILIZATION EQUIPMENT VOLUME OF PRODUCT PROCESSED BY RADIATION STERILIZATION
CONTRACT STERILIZATION
VERTICAL INTEGRATION CONTRACT STERILIZATION SERVICE USERS SIZE AND RELATIVE SHARE OF THE CONTRACT STERILIZATION INDUSTRY CONTRACT VS. IN -HOUSE STERILIZATION FACTORS IMPACTING ON USE OF CONTRACT STERILIZERS EQUIPMENT COST SAFETY ISSUES IN -HOUSE CAPACITY TYPES OF PROCESSING PROVIDED BY CONTRACT PROCESSORS
EMERGING TYPES OF STERILIZATION
ULTRAHIGH PRESSURE (UHP) CURRENT FOOD INDUSTRY APPLICATIONS

UHP LIMITATIONS ESTIMATED MARKET SIZE PULSED ELECTRICAL FIELD (PEF) MICROWAVE PSORALENS AND UVA (PUVA) STEAM AND VACUUM COOLING
APPENDIX 1 CDC -- STERILIZATION OR DISINFECTION OF MEDICAL DEVICES: GENERAL PRINCIPLES
APPENDIX 2 INFECTIOUS WASTE STERILIZATION TREATMENT
MEDICAL WASTE ISSUES EMERGING TREATMENT METHODS ELECTRON BEAM SYSTEMS HYBRID MICROWAVE TECHNOLGY LOW -FREQUENCY RADIO WAVES HIGH STRENGTH ELECTRICAL FIELDS
LIST OF TABLES SUMMARY TABLES: U.S. MARKET FOR STERILIZATION PRODUCTS AND SERVICES, THROUGH 2004 TREATMENT TYPE USAGE IN THE U.S., THROUGH 2004
1. PROBLEMS CAUSED BY MICROBES IN SELECTED INDUSTRIES 2. APPLICABILITY OF STERILIATION METHODS TO PHYSICAL STATES 3. MAJOR USERS OF MAIN STERILIZATION METHODS 4. DECISION MAKING CRITERIA FOR SYSTEM USE 5. MATERIAL COMPATIBILITES WITH STERILIZATION METHODS 6. CUMULATIVE SALES OF STERILIZATION EQUIPMENT, THROUGH 2004 7. ANTIMICROBIAL TEMPERATURE RANGES 8. PLASTIC COMPATIBILITY WITH MOIST AND DRY HEAT STERILIZATION 9. SELECTED LISTING OF HEAT STERILIZATION EQUIPMENT SUPPLIERS 10. VOLUMES TREATED BY VARIOUS HEATING METHODS IN THE U.S.,
THROUGH 2004 11. U.S. AUTOCLAVE MARKET: CUMULATIVE PLACEMENTS, THROUGH 2004 12. U.S. VOLUMES OF MATERIAL PROCESSED THROUGH AUTOCLAVES,
THROUGH 2004 13. VOLUME OF MATERIALS PROCESSED BY RETORTING IN THE U.S.,
THROUGH 2004 14. U.S. RETORT MARKET: CUMULATIVE PLACEMENTS, THROUGH 2004 15. CUMULATIVE PLACEMENTS OF PASTEURIZERS IN THE U.S., THROUGH
2004 16. VOLUME OF MATERIALS TREATED BY PASTEURIZATION IN THE U.S.,
THROUGH 2004 17. MARKET VALUE OF STILLS IN THE U.S.: CUMULATIVE PLACEMENTS*,
THROUGH 2004 18. DISTILLED WATER VOLUME PRO DUCED FROM STILLS IN THE U.S.,
THROUGH 2004 19. MARKET VALUE OF STERILIZING OVENS IN THE U.S.: CUMULATIVE
PLACEMENTS, THROUGH 2004 20. U.S. VOLUME OF MATERIALS PROCESSED IN STERILIZING OVENS,
THROUGH 2004 21. CUMULATIVE VALUE: U.S. CHEMICAL* STERILIZATION EQUIPMENT,
THROUGH 2004 22. VOLUME OF U.S. CHEMICAL STERILIZATION BY MARKET SEGMENT,
THROUGH 2004 23. CHEMICAL STERILIZATION EQUIPMENT AND SUPPLIES VENDORS BY
SYSTEM TYPE AND SUPPLIES 24. TYPICAL SIZE AND PURPOSE OF FILTERS US ED BY SPECIFIC INDUSTRY 25. STERILIZING FILTER SALES: THROUGH 2004 26. RELATIVE SHARE GAS STERILIZING FILTERS BY END MARKET TYPE*,
THROUGH 2004 27. MARKET SIZE: LIQUID STERILIZATION FILTERS, THROUGH 2004 28. LIQUID AND GAS STERILIZATION FILTER SUPPLIERS 29. ANNUAL SALES OF UV STERILIZATION PRODUCTS BY END MARKET,
THROUGH 2004 30. COMMON FOODBORNE PATHOGENS AND RELATED DISEASES 31. FDA/USDA APPROVED IRRADIATION PROCESSES BY FOOD TYPE 32. SELECTED LISTING OF CONSUMER P RODUCTS STERILIZED BY
RADIATION 33. CUMULATIVE VALUE OF RADIATION STERILIZATION EQUIPMENT IN THE
U.S. AND CANADA*, 34. ROUGH 2004 35. U.S. VOLUME OF RADIATION STERILIZATION, THROUGH 2004 36. COMPANIES PROVIDING IRRADIATION SERVICES/PRODUCTS 37. SIZE AND RELATIVE SHARE OF CONTRACT STERILIZATION VS. IN -
HOUSE STERILIZATION ETO, 38. MMA AND E -BEAM FOR 1999 AND 2004 39. GROWTH OF CONTRACT AND IN -HOUSE STERILIZATION, THROUGH 2004 40. SELECTED LISTING OF U.S. CONTRACT STERILIZATION PROVIDERS 41. MARKET FOR ULTRAHIGH PRESSURE EQUIPMENT, THROUGH 2004
LIST OF FIGURES
1. RELATIVE USE OF STERILIZATION METHODS, 1999 AND 2004 2. MARKET SHARE BY STERILIZATION METHOD, 1999 AND 2004 3. BASIC STERILIZATION INDUSTRY STRUCTURE 4. DISTRIBUTION CHANNELS FOR STERILIZATION PRODUCTS 5. VOLUMES TREATED BY VARIOUS HEATING METHODS IN THE U.S., 1999
AND 2004 6. RELATIVE AUTOCLAVE USE IN THE U.S BY SEGMENT, 1999 AND 2004 7. VOLUME OF U.S. CHEMICAL STERILIZATION BY MARKET SEGMENT, 1999
AND 2004 8. RELATIVE SHARE GAS STERILIZING FILTERS BY END MARKET TYPE*,
1999 AND 2004 9. RELATIVE SHARE OF LIQUID STERILIZING FILTERS BY END MARKET
TYPE, 1999 AND 2004
MindBranch, Inc., 160 Water St., Williamstown, MA 01267 tel: 1.800.774.4410 fax: 413.458.1706 www.mindbranch.com
Seedsfromindia.com is a US Company based in Florida. We represent Irene Marketing Services Inc. of Bangalore India that entered the USA bird feed market last season (2002-2003). We import quality Nyjer (Niger), Safflower and Sesame Seeds in 20ft sea containers from India directly to our customers. Our plant and facilities are based in the center of the growing areas in the tribal belts of India. We have our own personnel in the region to procure the pick of the crop from the moment it is harvested ensuring sufficient quantities to meet all orders at very competitive prices. We have a tight quality control and customized packaging to the buyer’s specifications. Nyjer Seeds are generally supplied in 50kg (110.6 lb) polypropylene bags with 350 Bags to a 20' Container, totaling 17500 kg. These bags are reloaded into fifty pound three ply paper bags after arrival in the United States. Fifty bags are then stacked on a 48 X 40 four-way pallet ready for domestic transportation. All pallets are lined with a slip-sheet to protect the bottom bags from damage. Safflower Seeds are generally supplied in 22.6 kg (50lb) polypropylene bags, with 708 bags to a 20' Container, totaling 16000 kg. If another type of packing this can usually be arranged at no extra charge. For a small additional fee we can also offer custom packaging and printing of text, labels and logo that we are confident will be cheaper than can currently be obtained in the USA. These bags can also be discharged from the container onto four way pallets if required. We are now taking 20foot sea container orders for the upcoming season to supply of Nyjer Seeds and Safflower Seeds from December 2003 until April 2004. We handle all the US Customs and USDA import requirements then we deliver the loads right to you. We would be delighted to give you a firm quotation or answer any questions you might have. Please email or fax us your requirements. Contact Information SeedsfromIndia.com 8006 Collingwood Court, Bradenton, Florida 34201-2350 Telephone (941) 358 7816 Fax (941) 358 7927 Email: [email protected]
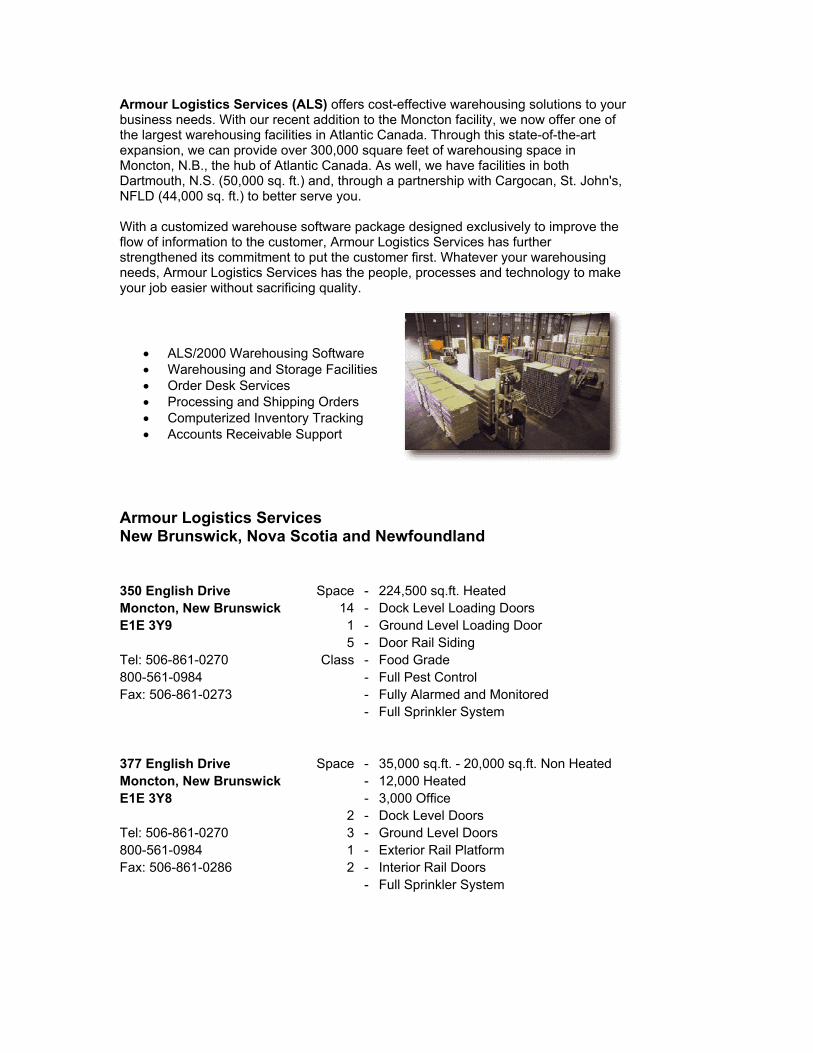
Armour Logistics Services (ALS) offers cost-effective warehousing solutions to your business needs. With our recent addition to the Moncton facility, we now offer one of the largest warehousing facilities in Atlantic Canada. Through this state-of-the-art expansion, we can provide over 300,000 square feet of warehousing space in Moncton, N.B., the hub of Atlantic Canada. As well, we have facilities in both Dartmouth, N.S. (50,000 sq. ft.) and, through a partnership with Cargocan, St. John's, NFLD (44,000 sq. ft.) to better serve you. With a customized warehouse software package designed exclusively to improve the flow of information to the customer, Armour Logistics Services has further strengthened its commitment to put the customer first. Whatever your warehousing needs, Armour Logistics Services has the people, processes and technology to make your job easier without sacrificing quality.
• ALS/2000 Warehousing Software • Warehousing and Storage Facilities • Order Desk Services • Processing and Shipping Orders • Computerized Inventory Tracking • Accounts Receivable Support
Armour Logistics Services New Brunswick, Nova Scotia and Newfoundland
350 English Drive Space - 224,500 sq.ft. Heated Moncton, New Brunswick 14 - Dock Level Loading Doors E1E 3Y9 1 - Ground Level Loading Door 5 - Door Rail Siding Tel: 506-861-0270 Class - Food Grade 800-561-0984 - Full Pest Control Fax: 506-861-0273 - Fully Alarmed and Monitored
- Full Sprinkler System
377 English Drive Space - 35,000 sq.ft. - 20,000 sq.ft. Non Heated Moncton, New Brunswick - 12,000 Heated E1E 3Y8 - 3,000 Office 2 - Dock Level Doors Tel: 506-861-0270 3 - Ground Level Doors 800-561-0984 1 - Exterior Rail Platform Fax: 506-861-0286 2 - Interior Rail Doors
- Full Sprinkler System
20-30 Gurholt Drive Space - 50,000 sq.ft. Heated Dartmouth, Nova Scotia 7 - Loading Doors B3B 1J9 1 - Ground Level Door
- No Rail Siding Tel: 902-468-8857 Class - Food Grade Fax: 902-468-8859 Full Pest Control
Fully Alarmed and Monitored Full Sprinkler System
21 Glencoe Drive Space - 44,000 sq.ft. Heated Donovans Industrial Park 5 - Loading Doors Mount Pearl, Newfoundland 1 - Ground Level Door A1N 4S5 - No Rail Siding
Class - Food Grade Tel: 709-368-8341 Full Pest Control Fax: 709-368-2107 Fully Alarmed and Monitored
Full Sprinkler System The above facilities are all connected to our two computer support systems. ALS2000, which is a Warehousing System and LTL400 which is a Transportation, Accounting System.
Armour Logistics Services Contacts
General Manager: Angus Armour mailto:%[email protected] Manager of Warehouse Operations: Brian Killen mailto:%[email protected]