greater manchester employment land position statement · pdf fileassociation of greater...
TRANSCRIPT

Greater Manchester Employment Land Position Statement
Final Report14 August 2009
Clients:
Association of Greater Manchester AuthoritiesBolton CouncilBury Metropolitan Borough CouncilManchester City CouncilOldham Metropolitan Borough CouncilRochdale Metropolitan Borough Council
Salford City CouncilStockport Metropolitan Borough CouncilTameside Metropolitan Borough CouncilTrafford CouncilWigan Council.

Greater Manchester Employment Land Position Statement
40658/700918v1
Contents1
1.0 Introduction 1
2.0 Economic and Policy Overview 2
3.0 Consultation 6
Introduction 6
Local Authority Officer Consultation 6
POG and SPIGLET Consultation 6
Key Stakeholder Consultation 7
4.0 Landless Growth 11
Increasing Density of Development 11
Increasing Densities of Employment 14
Implications for Districts 21
Prospects for increasing development densities 25
5.0 Future Requirements for Employment Land 26
Understanding the ELR Approach across the GM Authorities 26
Summary of ELR ‘Demand’ Projections 29
Future Employment Land Requirements – A Comparison 31
6.0 Current Supply of Employment Sites 39
Potential Forward Supply of Employment Land 39
Summary 43
7.0 A Response to RSS Policy W3 45
Introduction 45
Approach 45
Factors Relevant in Assessing the Requirements 46
Making an Estimate of Future Requirements 48
Key Issues for Further Consideration 59
8.0 Deriving a Consistent ELR Methodology for Greater Manchester 61
Consistency and Flexibility – Striking a balance 61
Broad Methodology for Undertaking ELRs in Greater Manchester 63
Monitoring 68
Supplementing the Evidence Base 70

Greater Manchester Employment Land Position Statement
40658/700918v1
Figures2
Fig 1 High Rise Developments 13
Fig 2 Indicative Estimate of Landless Growth 16
Fig 3 Manufacturing Job Growth 20
Fig 4 ELR Demand Projections - upper and lower margin, 2007-26 30
Fig 5 Application of RSS Policy W3, utilising 2003-2008 employment land take up rates 35
Fig 6 Potential Total Supply of Employment Land in Greater Manchester (ha) 44
Fig 7 Employment Structure (Source: ABI) 86
Figure 8 Job Density (Source: ONS / NLP Analysis) 88
Figure 9 Travel to Work Patterns (Source: Census / NLP Analysis) 89
Figure 10 Claimant Unemployment (Source: NOMIS) 91
Figure 11 GMFM Forecast Employment Growth by Sector 93
Figure 12 2008 GMFM Forecast Employment Growth (Source: GMFM / NLP Analysis) 94
Tables
Table 1 Case Study: Spinningfields 12
Table 2 Employment Density by Location 14
Table 3 Floorspace Ratios 19
Table 4 Potential for ‘Landless Growth’ in GM, by District 25
Table 5 Comparison of ELR approach and data sources across the ten GM districts. 28
Table 6 Summary of ELR demand projections 29
Table 7 Take up of Employment Land 2005-2007, 31
Table 8 Review of Past Take Up Rates 33
Table 9 Summary of GMFM 2008 Quantitative Demand Projections 37
Table 10 Summary of Total Forward Supply of Committed Employment Sites in GM 40
Table 11 Conclusions on Employment Land Provision 51
Table 12 Reconciliation with RSS W3 58
Table 13 Estimating Future Requirements 65
Table 14 Defining Land Requirements 66
Table 15 Size Profile of Business Base (Source: UK Business: Activity, Size and Location) 90
Table 16 Proportion of Knowledge Based Businesses (Source: UK Competitiveness Index) 96

Greater Manchester Employment Land Position Statement
40658/700918v140658 FINAL ISSUE Report 140809 after CJR
Appendices
Appendix 1 Growth Sector Opportunity Areas 71
Appendix 2 ELR Update by District 81
Appendix 3 Economic and Planning Policy Context 83
Appendix 4 Consultation 100
Appendix 5 District Summary Tables 101
Greater Manchester Employment Land Position Statement
P1/70 40658/700918v1
1.0 Introduction
1.1 In May 2009, Nathaniel Lichfield and Partners (NLP) was commissioned by the
Association of Greater Manchester Authorities (AGMA) to produce a Position
Statement on employment land provision across the ten Greater Manchester
districts.
1.2 The Regional Spatial Strategy (RSS) for the North West published in September
2008, sets out a series of spatial priorities for development within the region.
Policy W3 relates to the supply of employment land and provides sub-regional
requirements for the quantitative provision of employment land to 2021. The
sub-regional requirements are not disaggregated to the district level.
1.3 Table 6.1 of Policy W3 quantifies the amount of the employment land needed in
each sub region and identifies a requirement for an extra 536ha of employment
land in Greater Manchester on top of the existing supply. However, the RSS
acknowledges that there is a degree of uncertainty in establishing employment
land requirements. Accordingly, an allowance for flexibility is factored in which
has the effect of adding 20% to the employment land requirement for the sub-
region, resulting in an extra allocation totalling 917ha.
1.4 As advocated by the RSS, the provision of employment land figures by sub-
region has required the ten districts and other partners to work together to
agree the distribution of land within the sub-region.
1.5 The Position Statement is the outcome of joint-working between Local Planning
Authorities within Greater Manchester, and is intended to form an integral part
of the evidence base and support for employment policies in district’s Local
Development Frameworks, as well as making recommendations for a future
approach to Employment Land Reviews and subsequent monitoring.
1.6 In accordance with the brief, the work was undertaken in three parts, which
were:
• Part 1 – a land use interpretation of the strategic economic vision for
Greater Manchester
• Part 2 – Districts’ current work on the amount and distribution of
employment land within Greater Manchester
• Part 3 – the output – a narrative, including District figures, alongside a
framework for future employment land review work in the city region.

Greater Manchester Employment Land Position Statement
P2/70 40658/700918v1
2.0 Economic and Policy Overview
2.1 This section provides a summary of the key economic and policy issues
considered in preparation of the Position Statement. Appendix 3 contains a
more detailed overview.
Policy Direction
2.2 The spatial strategy for development of the Regional Spatial Strategy (RSS) is
clear in prioritising the Regional Centre for growth, followed by the inner areas
around the Regional Centre then towns and cities within the Manchester City
Region (policy RDF1). Policy W3 on supply of employment land is based, in
part1, on past take-up rates of 112 ha per annum for Greater Manchester and
concludes that an extra 917 ha of employment land is required in the sub-
region, resulting in a total requirement of 2,285 ha between 2005 and 2021.
This requirement incorporates the 20% flexibility factor, designed to provide
additional land to take account of special circumstances; without this flexibility
factor required, the RSS states that the additional requirement would be
536ha.
2.3 The RSS identifies specific strategies for the Manchester City Region (policies
MCR1, 2, 3 & 5), to try and achieve a significant improvement in economic
performance overall, as well as enabling the inner areas and northern part of
the City Region to capture growing levels of investment by securing
improvements to public transport. The Regional Centre is recognised as the
primary economic driver in the City Region.
2.4 A review of the Regional Economic Strategy, the Manchester City Region
Development Programme and the Manchester Independent Economic Review
(MIER) found that the priority sectors identified for Greater Manchester
comprise biomedical, energy & environment technologies, advanced
engineering, food and drink, digital and creative industries and business and
professional services.
Economic Trends
2.5 A review of employment trends in Greater Manchester has revealed that whilst
the sub-region has experienced significant growth in employment during the
past decade, representing an increase of 10.6%; this remains below national
(12%) and regional (12.4%) averages. Within the sub-region, the rates of
growth have varied markedly.
2.6 On employment structure, there has been strong job growth in financial and
business services, (with particularly high proportions in the Regional Centre),
public administration and health. There has been a decline, matched
nationally, in the number of manufacturing jobs, although this decline has not
occurred evenly across Greater Manchester, with Tameside, Oldham, Wigan,
1 Policy W3 also takes into account economic forecasts and these are reflected in the take up rates used.

Greater Manchester Employment Land Position Statement
P3/70 40658/700918v1
Rochdale and Bolton retaining proportions of such jobs higher than the regional
averages. An overall reduction in the manufacturing sector’s economic output
has not been observed in the City Region, with an increase occurring between
1998 and 2006, assumed to be due in part to increased automation, a
process known as capital substitution for labour. Representation of knowledge-
based businesses varies significantly across Greater Manchester, particularly
high in Trafford, Manchester and Stockport.
2.7 As would be expected in a sub-region, the different areas of Greater
Manchester perform different economic roles. The Regional Centre is
underpinned by strong concentrations of high value industries such as financial
and professional, media and creative, health and life sciences. MIER
acknowledges that outside of the Regional Centre, in southern areas, parts of
Trafford retain strengths in a diverse range of manufacturing subsectors, whilst
logistics is focussed around the airport and in Stockport. MIER also highlights
that Districts in the north of the sub-region retain manufacturing strengths, as
well as a growing satellite of financial and business services in Bolton and
ICT/communications in Bury.
2.8 An analysis of travel to work data found that Greater Manchester as a sub-
region is a relatively self-contained employment market, with very few major
leakages to authorities beyond the sub-region. The Regional Centre authorities
(Manchester, Trafford, Salford) provide a major source of employment for the
sub-region, experiencing a net inflow of commuters from adjacent authorities.
2.9 Research into the business base of Greater Manchester found that it is
dominated by small firms, with 89.4% in the sub-region employing fewer than
20 people and just 0.6% of businesses employing 250 people or more, with
highest proportions of these in Manchester and Salford. This will have
implications for the employment space needs of the area.
2.10 In recent years, Greater Manchester has performed well in attracting inward
investment. Data collected by MIDAS shows that over the period April 2004 to
February 2008, 1,352 new investments were attracted to the sub-region, with a
total value in excess of £490m. This level of investment is estimated to have
created more than 19,000 new jobs over the period. A significant proportion of
investment (25%) was made by SMEs.
2.11 The data recorded by MIDAS indicates that 45% of investors in Greater
Manchester were seeking industrial premises and 34% offices. A further 10%
were seeking managed workspace premises.
2.12 Additional data provided by MIDAS disaggregated to the local authority level
demonstrates the strong economic role played by the authorities covering the
Regional Centre. Indeed, more than 75% of inward investment projects in the
last 5 years are estimated to have located within Manchester City, Salford and
Trafford.
2.13 The UK is currently in recession and potential impact of this in relation to future
demand for employment land and premises must be taken account of. Since
Greater Manchester Employment Land Position Statement
P4/70 40658/700918v1
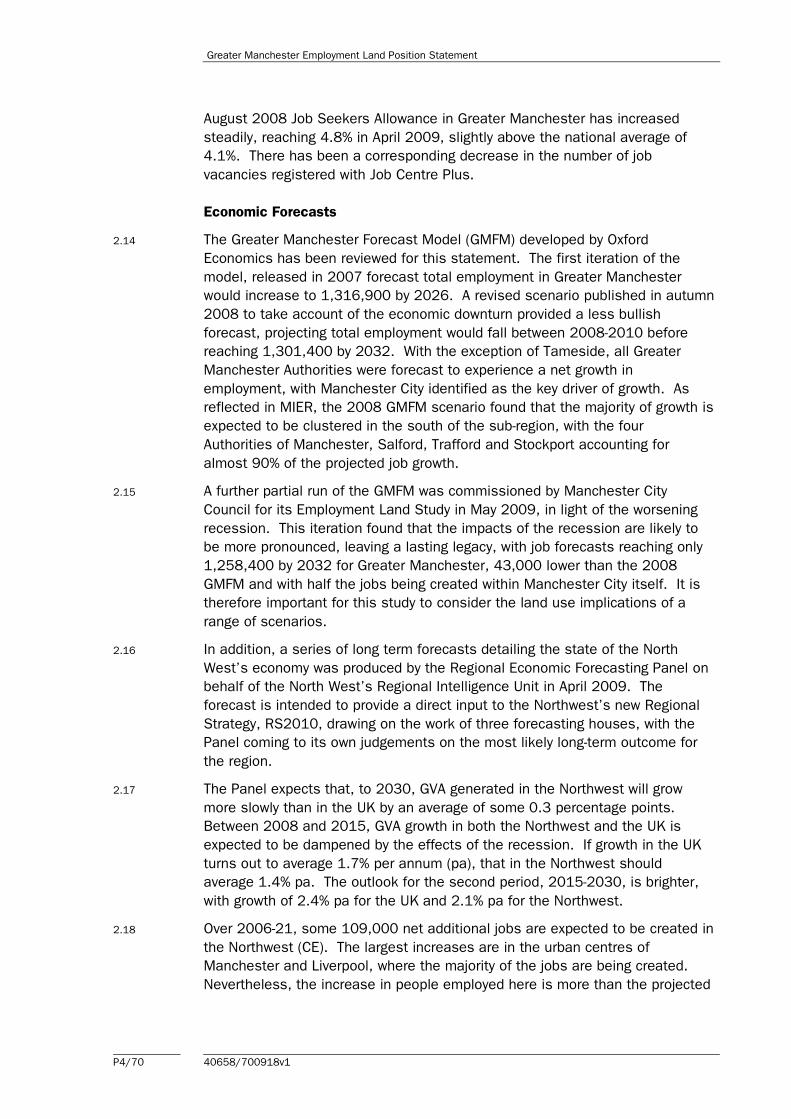
August 2008 Job Seekers Allowance in Greater Manchester has increased
steadily, reaching 4.8% in April 2009, slightly above the national average of
4.1%. There has been a corresponding decrease in the number of job
vacancies registered with Job Centre Plus.
Economic Forecasts
2.14 The Greater Manchester Forecast Model (GMFM) developed by Oxford
Economics has been reviewed for this statement. The first iteration of the
model, released in 2007 forecast total employment in Greater Manchester
would increase to 1,316,900 by 2026. A revised scenario published in autumn
2008 to take account of the economic downturn provided a less bullish
forecast, projecting total employment would fall between 2008-2010 before
reaching 1,301,400 by 2032. With the exception of Tameside, all Greater
Manchester Authorities were forecast to experience a net growth in
employment, with Manchester City identified as the key driver of growth. As
reflected in MIER, the 2008 GMFM scenario found that the majority of growth is
expected to be clustered in the south of the sub-region, with the four
Authorities of Manchester, Salford, Trafford and Stockport accounting for
almost 90% of the projected job growth.
2.15 A further partial run of the GMFM was commissioned by Manchester City
Council for its Employment Land Study in May 2009, in light of the worsening
recession. This iteration found that the impacts of the recession are likely to
be more pronounced, leaving a lasting legacy, with job forecasts reaching only
1,258,400 by 2032 for Greater Manchester, 43,000 lower than the 2008
GMFM and with half the jobs being created within Manchester City itself. It is
therefore important for this study to consider the land use implications of a
range of scenarios.
2.16 In addition, a series of long term forecasts detailing the state of the North
West’s economy was produced by the Regional Economic Forecasting Panel on
behalf of the North West’s Regional Intelligence Unit in April 2009. The
forecast is intended to provide a direct input to the Northwest’s new Regional
Strategy, RS2010, drawing on the work of three forecasting houses, with the
Panel coming to its own judgements on the most likely long-term outcome for
the region.
2.17 The Panel expects that, to 2030, GVA generated in the Northwest will grow
more slowly than in the UK by an average of some 0.3 percentage points.
Between 2008 and 2015, GVA growth in both the Northwest and the UK is
expected to be dampened by the effects of the recession. If growth in the UK
turns out to average 1.7% per annum (pa), that in the Northwest should
average 1.4% pa. The outlook for the second period, 2015-2030, is brighter,
with growth of 2.4% pa for the UK and 2.1% pa for the Northwest.
2.18 Over 2006-21, some 109,000 net additional jobs are expected to be created in
the Northwest (CE). The largest increases are in the urban centres of
Manchester and Liverpool, where the majority of the jobs are being created.
Nevertheless, the increase in people employed here is more than the projected

Greater Manchester Employment Land Position Statement
P5/70 40658/700918v1
increase in employed residents. Elsewhere, there would be an increase in
employed residents in excess of the increase in employment opportunities, with
the largest differential in Tameside, Stockport, Macclesfield, Knowsley, Sefton
and Wirral2.
Transport Investment
2.19 In May 2009, a new £1.5bn transport strategy was announced for Manchester
following the demise of the Transport Innovation Fund bid. The Association of
Greater Manchester Authorities submitted a new £1.5bn transport strategy to
Secretary of State for Transport for approval. The transport secretary
subsequently agreed to plans to fast-track £244m of projects included on this
list - including Metrolink extensions to East Didsbury and Ashton-under-Lyne.
There are a number of accelerated schemes with provisional funding identified
in Greater Manchester, details of which are provided in Appendix 3.
2 Regional Economic Forecasting Panel (April 2009): ‘State of the Northwest Economy – Long Term Forecasts’

Greater Manchester Employment Land Position Statement
P6/70 40658/700918v1
3.0 Consultation
Introduction
3.1 In line with the agreed brief, NLP met with policy officers from each of the 10
districts principally to discuss assumptions behind their Employment Land
Reviews and the status of potential sites being considered suitable for
employment development.
3.2 In addition NLP met with stakeholder groups such as the Planning Officers
Group (POG) and the Employment SPIGlet, 4NW, NWDA and MIDAS. NLP
interviewed a further eight bodies comprising agents and developers, as well as
economic organisations, as listed in Appendix 4.
Local Authority Officer Consultation
3.3 During the weeks commencing 1 June and 8 June 2009, representatives of the
study team met with officers of each of the ten Districts (Manchester City
excepted, which was addressed through NLP’s ongoing ELR work for the
Council) to discuss the Greater Manchester Position Statement. The
discussions focused primarily upon understanding each district’s aspirations
for economic growth; the current supply of committed employment land; the
demand projections underpinning their ELRs (if available); key potential
employment sites to be considered as part of the LDF process; the occurrence
and likely contribution of landless growth to employment supply in future; and
other issues relevant to the study.
3.4 The output from these meetings is not summarised in this section but has
informed a number of sections of this report, specifically Section 4.0
concerning landless growth; Section 5.0, regarding the future requirements for
employment space; and Section 6.0 detailing the current supply of sites.
Appendix 2 also summarises the individual ELR methodologies and outputs.
Following these meetings, a series of summary tables detailing current supply
figures and demand forecasts, based on the study team’s interpretation of the
ELRs, AMRs and stakeholder discussion, were circulated to officers for
comment. These tables were subsequently agreed and amended where
appropriate during the week commencing 22 June 2009.
POG and SPIGLET Consultation
3.5 The principle issues which came out of this consultation included:
1 Whether landless growth relates to B2 as well as B1 land use. As a result
NLP explored whether landless growth occurs in B2 developments
2 Whether landless growth should be renamed high density growth;
3 Whether job growth in non-B1 sectors was being considered

Greater Manchester Employment Land Position Statement
P7/70 40658/700918v1
4 It is an aspiration of outlying Districts to have more office jobs, not just the
Regional Centre
5 Doubt expressed about the validity of the RSS employment land sub-
regional figure, now we are in recession
6 Whether windfalls need to be factored into the supply, although it was
acknowledged that they will be included within the take-up
7 DPDs need to be flexible to cater for economic boom or recession, therefore
they probably need to provide a figure with a modest range of employment
land supply
8 It is crucial that employment sites are provided in the key locations where
employment development is going to grow
9 Queries over how the landless growth research is going to be translated as
potential
10 Potential for landless growth will of course depend on policies in core
strategies
Key Stakeholder Consultation
3.6 Discussions with 4NW in relation to the 20% flexibility factor allowed for by the
RSS identified that whilst it was written in a different economic climate to that
currently being experienced, its underlying objectives were considered to remain
valid. In relation to the future for manufacturing, the NWDA emphasised that
the manufacturing base will retain its market share but will look for automated
floorspace and fewer employees, in turn driving GVA growth.
3.7 In addition, Ask Developments, MIDAS, Peel Holdings, CB Richard Ellis and EC
Harris were interviewed as part of this study and their comments are recorded
below. It should be noted that the views expressed by the interviewees are
their own opinions and do not necessarily reflect NLP’s own view or the
corporate positions of the local authority in question. Nor are they necessarily a
collective view of the stakeholders consulted.
Bolton
• The success of Middlebrook Retail Park and associated employment
developments was perceived to have occurred at the expense of the town
centre. The focus is now believed to be on offices in the town centre and is
receiving public sector support. There is considered to be potential along
the motorway corridor for B2 and B8 development but it was hoped that the
Local Planning Authority would not succumb to allowing much more
employment development out of town.
Bury
• Developers were considered to own some good quality B1 stock in Bury and
this is being brought forward. The consolidation of the Pilsworth
retail/leisure development could free up some employment land. There was
considered to be little current supply of large B2 and B8 sites left in key
locations.

Greater Manchester Employment Land Position Statement
P8/70 40658/700918v1
Manchester
• Industrial estates such as Sharston are believed to be expensive and
contain restrictions on title which constrain occupiers’ operations, given
their proximity to residential property. Conversely others considered that the
estates were not expensive but were in need of investment and their
expansion is hindered by land ownership issues. There was believed to be a
lack of readily available industrial land generally in Manchester , with priority
given to office development. There was believed to be a need to go outside
MCC’s boundary to find larger industrial sites. Employment land rents
immediately around the airport were regarded as too expensive together
with service charges and occupiers locate further away as a result. There
was a perceived over supply of office floorspace.
Oldham
• Hollinwood Business Park is due to come forward, with Langtree appointed,
although an anchor tenant is still sought. Long term ownership of some
employment sites was believed to make their availability difficult, with some
owners trying to redevelop sites for residential uses.
• Oldham was considered to have scope to link to the regional centre with an
Arc of Opportunity, linking the proposals for Hollinwood Business District,
through to the established and successful Broadway & Greengate Business
Parks, extending up to Foxdenton Strategic Site, across to the hi tech
proposals for Chadderton Technology Park and through to the Town Centre
where there are educational, cultural, retail and leisure opportunities.
Rochdale
• The vast majority of Rochdale’s employment land supply is out of centre at
Kingsway, although the Metrolink extension aspires to link Kingsway with
the town centre. Lack of availability of freeholds at Kingsway is causing
some of the delay to its progression. Sites are considered to be expensive
at Kingsway. The availability of large sites (such as Kingsway), which is
slow to progress is believed to be stymieing other large sites coming
forward in the NW. Heywood Business Park is considered popular with only
1 plot remaining (although several redevelopment opportunities and smaller
sites are available). It was believed that there is no land allocated in the
town centre for B1 in Rochdale (although a 3ha site has been identified in
the Rochdale Town Centre East SPD for speculative B1 development).
Some agents were of the view that it is difficult to meet enquiries for large
sites e.g. 30 acres, although it is recognised that there are two sites on
Kingsway that remain available. The view was expressed that Investment
opportunities are being presented to Rochdale but the deals are not
secured, although this is a common problem not unique to Rochdale.

Greater Manchester Employment Land Position Statement
P9/70 40658/700918v1
Salford
• Salford has a significant B1 supply as part of the regional centre, and Media
City with its spin-off can only add to this. The Media City to Eccles stretch
provides a lot of potential for employment land and is witnessing
investment. The expansion of Spinningfields is proposed and public sector
resources have been secured to fund the footbridge. There is considered to
be considerable recycling of land/sites. In terms of potential shortage of
B2 and B8, the very good take up of such land within Salford may
exacerbate its problems of supply for these sectors.
Stockport
• There is a delay to town centre redevelopment caused by Lend Lease pulling
out and now the recession has compounded this. There are transport
communication links (rail) are regarded as good and this enhances
suitability for public sector relocations. It is regarded as being difficult to
navigate way round town centre by car. Bredbury is a key employment site
for B2/B8 uses, whilst the town centre will be an area of focus for B1
developments in the future. A view was expressed that there has been
limited speculative office development, and that much of this has not been
of the required standard. There was a general view that there was a lack of
employment land in the District due to land constraints.
Tameside
• Tameside is considered to provide ample office space currently including
serviced office space, but there is believed to be a lack of quality
accommodation with much of it being old. Ashton Moss provides for B2 and
B8. The employment market is more public sector driven than private.
Manufacturing is important to the Borough, and it should seek to retain this
different characteristic (e.g. to Manchester).
Trafford
• The general market perception is that the Trafford and Stockport
commercial markets are relatively indistinguishable. It was generally
perceived that Trafford lacks a focused destination for offices and would
benefit from a stronger independent identity. Some thought it is not a
genuine office location. Good links to the motorways enhance its location
for employment purposes, albeit it suffers from Green Belt constraints.
There is strong demand in the Trafford area for B1, B2 and B8 and queries
were raised as to whether this demand is being translated by the Council.
Trafford Park is generally well let and the masterplan seeks to provide
further land. There were suspicions that Trafford suffers from rivalry with
adjoining Manchester City. There is considered to be capacity at Carrington
and Partington; Saica – the Spanish paper recycling company – was
planning to relocate to Partington and obtained planning permission for the
development; however, it has not begun construction of the plant and has

Greater Manchester Employment Land Position Statement
P10/70 40658/700918v1
recently announced that in the current economic climate the development is
not to proceed.
Wigan
• Congestion remains a problem in Wigan for traffic circulation. There is some
significant investment occurring currently, for example ASDA, in terms of B2
and B8 development. A Chinese textile business is currently exploring
opportunities in Wigan. There are potential Strategic Sites adjacent to the
M6, but occupiers would potentially favour Warrington over Wigan which is
also close to the M6. It is difficult to meet enquiries for large sites e.g. 30
acres.

Greater Manchester Employment Land Position Statement
P11/70 40658/700918v1
4.0 Landless Growth
4.1 The concept of ‘landless growth’ refers to the creation of significant levels of
B1/B2/B8 jobs on land without a significant reduction in an authorities’ ‘stock’
of allocated and committed employment sites. In general, it is understood that
such growth is driven by one or both of the following factors:
a Increasing densities of development (i.e. an increase in the amount of
floorspace provided on a given (often unallocated) site); and
b Increasing densities of employment (i.e. an increase in the amount of
workers that can be accommodated on a given floorplate).
4.2 This section of the report considers each factor in turn. However, it should be
noted that there is no single, definitive statistical measure of ‘landless growth’
or its drivers. As a consequence, NLP has drawn together a range of proxy
measures from the limited primary and secondary data sources available. All of
the data sources have their limitations and in a number of cases, trends and
issues highlighted may not be driven solely by landless growth but a range of
other issues also at play in the commercial property market.
4.3 It is beyond the scope of this study to investigate landless growth in full. The
brief required the NLP to consider the implications of landless growth for the 10
Districts. Whilst the proxy measures examined in this document highlight that
there may be some evidence of landless growth occurring in some locations, it
is evident that a further research focussed exclusively on landless growth in
each district may be required to provide more definitive conclusions.
Increasing Density of Development
4.4 As outlined above, landless growth is understood to be driven in part by
increasing densities of development. This can be achieved through ‘building
up’ with the development of taller buildings facilitating landless growth through
the provision of a greater level of floorspace on a development site than
previously existed, or can occur through development of vacant sites which
results in more floorspace than would be expected for the size of the site,
based on historic plot ratios.
4.5 A masterplan led approach has enabled Manchester City to make the most
efficient use of land, buildings and sites and has enabled it to achieve higher
density developments in key locations. Spinningfields and Piccadilly Place are
examples of where effective masterplanning has resulted in higher densities
than might otherwise have been achieved but within a high quality
environmental context and setting.
4.6 The findings of the stakeholder consultations by NLP for the MCC employment
land study confirmed this trend both within Manchester City and in particular,
the Regional Centre. In this way the area has been able to meet the
accommodation requirements of growth sectors in recent years such as
financial and business services.

Greater Manchester Employment Land Position Statement
P12/70 40658/700918v1
4.7 A similar approach has also been observed in parts of Salford in recent years,
particularly in locations such as Salford Quays and in the Regional Centre.
Salford Quays, which originally functioned as the docks for the Manchester Ship
Canal has been successfully redeveloped as a mixed use scheme which
includes a number of high density commercial office developments.
4.8 In contrast, the consultations and research undertaken as part of this
commission have indicated that higher development densities have been less
apparent in locations such as Stockport, which have traditionally experienced
high levels of take-up in low density B2 and B8 uses.
Case Study: Spinningfields
The development covers a 30 acre site and will create when complete, 4.5m sq ft of office
space. It is expected that it will sustain 25,000 jobs once complete. The City Council and
Allied London decided in the mid 1990s that there was an underprovsion of large (in excess
of 15,000sq ft) modern office buildings. They decided to address this by developing
Spinningfields.
According to the developer, the size and quality of the office premises provided have assisted
Manchester in competing both nationally and internationally for inward investment and the
development has created a new financial and business district for the city, which has
attracted a large number of blue chip companies. It was felt by the developer that it would
only be viable (even in the pre-recession market) to bring forward such a scheme in locations
inside the inner ring road of Manchester, although it was noted that the proposed Co-op
headquarters are situated just outside the ring road.
Critical success factors of the development: the provision of large floorplates that enable
major businesses to locate all of their staff in one flagship building; the high quality
architecture and specification of offices; the provision of retail and restaurant facilities in the
scheme, providing workers with access to amenities; the quality of the environment and public
realm; and generous car parking provision
Table 1 Case Study: Spinningfields
4.9 A shift towards higher density development in the Regional Centre has been
observed over the past decade. The Demand for Employment Land in Greater
Manchester (2006) study states that the scale of a typical office development
in the area has increased in recent years and now comprises of 8-12 storeys,
compared to a previous position of 4-6. Research of planning applications
undertaken by NLP highlights a number of instances whereby office schemes
have been redeveloped at a higher density in recent years to provide more
employment space, including:
• 1 New York Street: redevelopment of a vacant 8-storey 1960s building to
deliver a new 13-storey Grade A office building with retail/bar uses on the
ground floor. The scheme has created 9,026sqm of B1 floorspace on a
0.1ha site;
• Chancery Place: redevelopment of the 6-storey Scottish Provident House to
create a new 15-storey Grade A office building with potential for retail uses
on the ground floor. The scheme has resulted in the provision of
11,989sqm of B1 floorspace on a 0.075ha site; and
• Forty Spring Gardens: redevelopment of the 5-storey Amethyst House to
deliver a new 9-storey Grade A office building with ground floor retail space.
The scheme has created 9,220sqm of B1 floorspace on a 0.1ha site.

Greater Manchester Employment Land Position Statement
P13/70 40658/700918v1
4.10 Research commissioned by the British Property Federation (BPF)3 in 2008
revealed that Manchester contains a higher proportion of high rise development
than the majority of UK cities, as illustrated in Figure 1 below. This shows that
in 2008, there were 119 buildings (both commercial and residential uses) of
12-storeys or more in Manchester and a further 36 under construction or with
approval. Across England, these are only exceeded by Birmingham and London
(which has been excluded from the graph).
0
50
100
150
200
250
Manchester Birmingham Bristol Leeds Liverpool Newcastle Nottingham Sheffield
Completed Under Construction Approved
Fig 1 High Rise Developments
Source: BPF / NLP Analysis
4.11 Although the data does not relate exclusively to the development of commercial
office premises, it does provide an indication of the extent to which the number
of high rise developments in Manchester outstrips that of many of the major
English cities. This data is not available for the other authorities of Greater
Manchester and as a consequence it is not possible to compare performance
across the study area.
4.12 The number of high rise developments in Manchester, in part reflects the
specific economic role of the City and, more particularly, the Regional Centre.
For example, Manchester contains a high proportion of knowledge-based
businesses and is the UK’s second largest financial centre behind London.
The 2008 BPF research indicates that such sectors typically seek to locate in
key urban areas and therefore often require tall buildings, for:
• Practical reasons – housing large numbers of staff in one building in order
to maximise efficiency (although this does not mean that schemes are
necessarily occupied by a single user); and
• Image reasons – providing high profile space in a ‘landmark address’.
3 The economic impact of high density development and tall buildings in central business districts, Colin Buchanan
(2008)
N
o.
of
devel
op
men
ts

Greater Manchester Employment Land Position Statement
P14/70 40658/700918v1
4.13 It should however, be acknowledged that not all knowledge-based businesses
will seek to locate in tall buildings within Manchester. Indeed, consultation has
highlighted that such businesses are also attracted to large floorplates.
4.14 The UK Cities Monitor 2008 identifies Manchester as the best UK city in which
to locate a new headquarters building and this is also likely to generate
demand for tall buildings for those reasons outlined in the above bullets.
4.15 Increasing densities have also been driven by financial factors. Competition
with residential developers for sites, particularly in the Regional Centre, has
increased in recent years (although this has subsided in the last 18 months)
and has exerted an upward pressure on land values in the area. As a
consequence, with sites becoming more expensive, developers of commercial
property have sought to significantly increase the amount of floorspace in order
to maintain their returns.
Increasing Densities of Employment
4.16 Additionally, it is understood that increasing densities of employment can also
contribute towards landless growth, by increasing the number of employees
that can be accommodated on a given floorplate.
4.17 In part, the prevailing employment density observed in a location is influenced
by the nature of the area. For instance, research commissioned in 2004 by the
Regional Development Agency for the South East (SEEDA)4 found that
employment densities tend to be highest in town and city centres. The work,
which was based upon survey returns from approximately 1,000 businesses
indicated that employment densities of 22.6sq m per worker were typically
observed in town and city centre locations, compared to an average across the
South East region of 36.2sq m per worker. The study suggested that land
values are a key driver of the higher densities observed in town and city
centres, as they provide the stimulus for firms to maximise the utilisation of
their floorspace.
Location Sq m/Worker
Town/City Centre 22.6
Inner Urban 29.6
Suburban 45.7
Out of Town 44.1
Total South East 36.2
Table 2 Employment Density by Location
Source: DTZ (2004) Use of Business Space and Changing Working Practices in the South East
4.18 Additionally, increasing densities of employment are thought to be driven in part
by changing working practices, which facilitate the implementation of more
flexible methods of working. This has in turn allowed new jobs to be created
without generating a corresponding need for additional employment floorspace
4 DTZ (2004) Use of Business Space and Changing Working Practices in the South East

Greater Manchester Employment Land Position Statement
P15/70 40658/700918v1
or land. The research commissioned by SEEDA suggests that in broad terms,
these changes have been underpinned by a number of factors including:
• Technological advances, which have reduced the need for workers to be
physically co-located. In this way technology has been a key driver of
changing working practices, facilitating initiatives such as home working and
hot desking;
• Changing management and organisational structures and a move towards
new working practices such as homeworking, hot-desking and flexible
working;
• Changes in demographics, social attitudes and lifestyles, including the
feminisation of the workforce and the emergence of the concept of the work-
life balance have resulted in the adoption of more flexible working practices.
4.19 Notwithstanding the above, there are a number of factors that have constrained
the adoption of flexible working practices, namely:
• The time and resources required to adopt new working practices;
• The cost of implementing such changes, including the re-design of office
space and procurement of new technologies; and
• Organisational, cultural and managerial opposition/inertia with respect to
changing working practices.
Office Developments
4.20 In order to understand the whether employment densities have potentially
played a role in delivering landless growth in Greater Manchester, NLP has
prepared Figure 2. The analysis provides a proxy for employment densities by
considering for each authority whether or not job growth has occurred without a
corresponding need to bring forward employment floorspace.

Greater Manchester Employment Land Position Statement
P16/70 40658/700918v1
-5,000
0
5,000
10,000
15,000
20,000
25,000
30,000
Bo
lton
Bu
ry
Ma
nch
este
r
Old
ha
m
Ro
ch
da
le
Sa
lford
Sto
ckp
ort
Ta
me
sid
e
Tra
fford
Wig
an
Absolute Job Growth Landless Job Growth
Fig 2 Indicative Estimate of Landless Growth
Source: NLP Analysis
4.21 The blue column denotes absolute job growth in financial and business
services over the period 1998-2007. This was adopted as a proxy for the
demand for (B1) office premises, although it should be included that this does
not take account of self-employment. The yellow column illustrates the
absolute level of landless employment growth in each local authority. This
latter figure was calculated by:
• Taking VOA data showing the absolute growth in (B1) office floorspace over
the period and applying an employment density of 19sqm per office worker
to the figure. This was used to determine the level of job growth implied by
the change in office floorspace. (It is acknowledged that there are some
anomalies in VOA data as a result of the revaluation exercise that took
place by VOA and came into effect in 2005);
• Applying a 10% reduction to the level of implied job growth to take account
of the fact that a proportion of the office floorspace will be vacant and
therefore could not create any jobs. 10% is widely acknowledged to
represent a standard vacancy rate in a healthy property market; and
• Subtracting the absolute change in employment from the implied change to
calculate the difference. A positive value is considered to represent
landless growth as the level of actual employment created exceeds that
which would be expected by applying standard densities to the change in
floorspace.
4.22 A worked example for Manchester is set out below:
F
loors
pac
e

Greater Manchester Employment Land Position Statement
P17/70 40658/700918v1
4.23 It should be noted that whilst this methodology enables a negative value for
employment densities to be attributed to a local authority, this does not
represent negative growth or a contraction in jobs. Rather, it simply
demonstrates that zero landless growth of this type has been recorded, i.e.
less actual jobs have been created than would be expected by applying a
standard employment density to the absolute floorspace change.
4.24 Clearly, this approach can only provide a broad and basic indication of whether
increasing employment densities have occurred in the authorities of Greater
Manchester and is not without its limitations. For instance, it is acknowledged
that not all employment growth necessarily locates within new employment
space and therefore some of the job increases observed may be as a result of
the re-occupation of existing, previously vacant employment space.
Unfortunately very little research has previously been undertaken on the subject
of landless growth and hence data sources are limited. Districts’ Employment
Land Reviews have not to date explicitly considered the implications of landless
growth, with the exception of Manchester which is still under preparation by
NLP. Whilst NLP has endeavoured to draw together the key factors in this
analysis, it is beyond the scope of this commission to undertake a full
assessment of landless growth in order to accurately quantify the extent to
which it is observed in each of the local authorities. It is recommended AGMA
give consideration further research, with a particular focus on undertaking
primary research concerning solely the implications of landless growth for
employment land supply.
ABI data shows that employment in financial and business services in Manchester grew by
25,890 over the period 1998-2007:
1998 = 66,830 jobs
2007 = 92,720 jobs
Absolute change 1998-2007 = 92,720 – 66,830 = 25,890 jobs.
VOA data shows that commercial office floorspace in Manchester grew by 261,000 sq m
over the period 1998-2007:
1998 = 1,521,000 sq m
2007 = 1,782,000 sq m
Absolute change 1998-2007 = 1,782,000 – 1,521,000 = 261,000 sq m.
If a standard office employment density of 19sq m per worker is assumed, then an increase
in floorspace of 261,000 sq m might be expected to generate an increase of 13,737 jobs.
(261,000 / 19 = 13,737)
Applying a 10% reduction to take account of vacant floorspace reduces the level of implied
job growth to 12,363.
13,737 * 0.9 = 12,363.
Subtracting the actual employment growth from that implied by the growth in floorspace
provides an indication of landless growth:
25,890 – 12,363 = 13,527.
This indicates that Manchester created an additional 13,527 jobs in financial and business
services compared to the job growth implied by the increase in commercial office
floorspace.

Greater Manchester Employment Land Position Statement
P18/70 40658/700918v1
4.25 Notwithstanding the limitations of the research acknowledged above, Figure 2
does show that a number of authorities in Greater Manchester have generated
more jobs in financial and business services over the period 1998-2007 than
would be expected given the level of commercial office floorspace developed.
This would perhaps indicate that employment densities in these areas are
higher than elsewhere and this has in turn helped to deliver landless growth by
accommodating more workers within a given floorspace.
4.26 In absolute terms, the greatest levels of this type of landless growth were
observed in those authorities that comprise the Regional Centre:
• In Manchester, absolute employment growth of almost 25,900 was
observed over the period. Based upon the methodology set out above, it is
estimated that 52% of this growth (13,500) was landless. The figures for
Manchester may have been affected by Spinningfields, which begun to
attract its first occupiers in early-mid 2007;
• In Trafford, absolute employment growth equated to almost 9,700. It is
estimated that 74% of this growth (7,200) was landless; and
• In Salford, absolute employment growth of more than 9,500 was recorded.
It is estimated that 60% of this growth (5,700) was landless.
4.27 However, in proportionate terms, landless growth of this type was also recorded
in Rochdale (78% or 4,500 jobs), Stockport (47% or 3,800 jobs) and Wigan
(52% or 3,200 jobs).
4.28 Based upon this initial research undertaken by NLP, Bolton, Bury and Tameside
appear to be the only authorities in Greater Manchester that did not experience
some degree of landless growth of this nature.
4.29 It is beyond the scope of this study to undertake a detailed quantitative
research exercise to assess how employment densities in Greater Manchester
have changed over time. However, research commissioned specifically to
consider this issue elsewhere in England has been published. It is considered
useful to draw upon the broad findings of these studies because their remit
enabled them to focus upon the issue of changing employment densities in far
more detail.
4.30 The research suggests that in general terms, employment densities have
changed very little in recent years. This would need to be reconciled with the
findings of Figure 2 set out above. Over the past twelve years, a number of
research projects have been commissioned to examine employment densities
by use class, including:
• Research commissioned by SERPLAN in 19975 – undertaken to establish
standard employment densities for the South East of England. The
evidence base underpinning the study included a business survey, which
generated 1,200 returns;
5 Roger Tym and Partners/SERPLAN (1997) The Use of Business Space: Employment Densities and Working
Practices in South East England

Greater Manchester Employment Land Position Statement
P19/70 40658/700918v1
• Research commissioned by English Partnerships (EP) in 20016 – national
research undertaken to determine standard employment densities for the
whole of England. The study did not include a business survey and drew
upon a review of data provided by provided by EP and the RDAs relating to
approximately 100 completed developments; and
• Research commissioned by SEEDA in 20047 – undertaken to determine how
changing working practices have impacted upon employment densities in
the South East. The evidence base underpinning the research included an
analysis of 1,000 business survey responses.
4.31 The results of the three studies are summarised in Table 3 below. By
comparing the results generated by successive studies, it is possible to
observe any general trends in office employment densities over the period
1997 to 2004. It should be noted that the table only includes those sectors of
the office market where the research enables inter-temporal comparisons to be
made, and it is also of note that the studies do not cover major urban centres
with the critical mass and dynamics of the Regional Centre. However, it can
clearly be seen from the table that employment densities with respect to office
development have not changed significantly over the period 1997 to 2004.
Sector Type SERPLAN 1997
EP 2001 SEEDA 2004
Business (general) 17.9sqm (net) 19.0sqm (gross internal)
18.3sqm (net)
Head Offices 22.0sqm (gross internal)
20.7sqm (net) Offices
High Tech/R&D 29.0sqm (gross internal)
27.2sqm (net)
Table 3 Floorspace Ratios
Source: Various / NLP Analysis
4.32 This concurs with the stakeholder consultation exercise for the Manchester CC
ELS where a number of developers and other organisations including University
and the Chamber of Commerce were interviewed. When asked whether
changing working practices were resulting in less space per worker being
required, the answer was generally negative, or with little difference having
been observed. It was generally felt that there was no replacement for being in
the office/workplace for at least some or most of the week.
Industrial Developments
4.33 In considering landless growth, it is also important to take account of the
potential impact with respect to demand for B2 premises. This is considered in
Figure 3 below. It should be noted that a slightly different methodology has
been adopted. This is because manufacturing jobs and the level of B2
floorspace have declined across Greater Manchester over the period.
6 Arup Economics and Planning (2001) Employment Densities Report for English Partnerships and the Regional
Development Agencies 7 DTZ (2004) Use of Business Space and Changing Working Practices in the South East

Greater Manchester Employment Land Position Statement
P20/70 40658/700918v1
Consequently, rather than consider the extent to which historic growth has been
landless, the graph examines whether decreases in employment and floorspace
have been in alignment. It is of course recognised that there can be landless
growth in employment in B2/B8 due to using existing spare capacity in existing
industrial and warehouse premises, although it is suggested that this spare
capacity would even out over the 19 year plan period.
4.34 The amber column illustrates the level of absolute employment change in
manufacturing observed over the period 1998-2007 for each local authority.
The yellow column denotes the implied job change for the same period. The
latter shows the change in manufacturing employment that might be expected
given the change in B2 floorspace observed. It is calculated by taking the
absolute change in B2 floorspace for the period (sourced from VOA data) and
applying a standard employment density of 34sq m per worker.
-18,000
-16,000
-14,000
-12,000
-10,000
-8,000
-6,000
-4,000
-2,000
0
Bo
lton
Bu
ry
Man
ch
este
r
Old
ham
Ro
ch
dale
Salfo
rd
Sto
ckp
ort
Tam
esid
e
Tra
fford
Wig
an
Absolute Job Change Implied Job Change
Fig 3 Manufacturing Job Growth
Source: VoA / NLP Analysis
4.35 It is interesting to note that both Salford and Wigan lost more jobs than might
have been expected given the decline in B2 floorspace observed. This would
suggest that job losses in these authorities were driven by rationalisation of the
workforce rather than business closures, with firms continuing to operate from
the same premises but with a smaller workforce. Businesses that have
adopted such measures could have surplus floorspace as a result (if space
was not occupied by alternative models of production or other uses). If
businesses with such capacity experience growth in future (particularly as the
economy moves out of recession) then it will be possible for them to increase
the size of their workforce without the need for additional employment space.
In this way, it may be possible to deliver an element of landless growth.
F
loors
pac
e

Greater Manchester Employment Land Position Statement
P21/70 40658/700918v1
4.36 Alternatively, in a number of instances, specifically Manchester, Rochdale and
Tameside, implied job change was considerably higher than actual job change.
In such instances, this suggests that there may have been an excess of
underutilised/redundant premises that were not required and could be lost
without the concurrent loss in employment, although increased mechanisation
could have resulted in increased job densities in these areas. Retaining the
vacant units could have an adverse impact upon more viable employment sites
elsewhere, contributing to sustained low land values in future. However, it is
important to note that there are many external factors at work (i.e. the
distorting impact of certain large industrial developments constructed toward
the end of the study period which were still awaiting an occupier) and it would
therefore be difficult to draw generalised conclusions.
4.37 It should also be recognised that manufacturing employment has been in
decline for a number of years. If this were to continue, then clearly large scale
employment growth would not be anticipated to occur, although some small,
high value niche sectors may experience modest growth in future.
4.38 One further point to consider with respect to the manufacturing industry is the
distinction between employment growth and productivity growth. Section 2.0
and Appendix 3 of this report highlighted that the level of GVA generated within
Greater Manchester has increased over the period to 1998-2006 and
consultations with 4NW and NWDA highlighted that this trend is anticipated to
continue in the medium to long term.
Implications for Districts
4.39 Whilst increased density has been taken account of in ELRs, ‘landless growth’
as a concept and its implications for spatial planning has not been researched
in detail before. To NLP’s knowledge, it was not considered in the employment
land calculations that informed the North West RSS’s Policy W3. Anecdotal
evidence concerning the extent of landless growth accruing in the Regional
Centre in particular has been supported by primary research outlined above
which suggests a significant proportion of job growth in industrial sectors
commonly associated with B1 office requirements did not translate to a
commensurate demand for office floorspace on allocated sites or indeed at all.
4.40 In planning terms, this job growth may not, therefore, be coming forward in
areas allocated for employment use in the relevant UDP/DPD. Insofar as this
trend may not be reflected in past rates or an assumed uplift in those rates as
envisaged in the RSS, the RSS approach has a risk of ‘over-provision’ in terms
of employment land requirements in Greater Manchester, and the Regional
Centre in particular. This final part of section 4.0 therefore seeks to assess
the contribution of land supply to accommodating the forecast growth in
employment in the period to 2026, analysing the extent to which ‘building
up/building out’ of sites is likely to occur in each District.

Greater Manchester Employment Land Position Statement
P22/70 40658/700918v1
4.41 In addition, future changes in plot ratios and employment densities, and also
the move away from industrial uses to office, could have significant impacts on
likely land take. This changing emphasis is already occurring to a certain
extent in places such as Stockport, whereby past levels of take up, formerly
dominated by low density B2/B8 uses, are increasingly being replaced by
higher density B1 uses. The issue here, therefore, is identifying the extent to
which the nature of employment development is likely to change going forward
to 2026, in both composition and scale, in a way that would not be picked up
based on past trends.
4.42 A key issue identified at the outset of this study is the extent to which the
existing supply of sites in the sub-region would fall within town centre locations
(where the favoured approach may be characterised as ‘building up’ at relatively
high densities) and how much could be identified for lower density development
(characterised as ‘building out’). The role of ‘building up’ sites has important
parallels with the assessment of ‘landless growth’; any scope to maximise the
contribution of existing sites to meet future needs through intensification,
redevelopment to provide modern premises, sub-division to smaller units or
expansion on site all has implications for districts seeking to plan for a realistic
yet flexible portfolio of employment sites to 2026.
Summary by Local Authority
4.43 Following reviews of the various ELRs, assessment of the GMFM demand
projections and an appraisal of the economic growth aspirations of individual
districts, the following sets out a judgement as to whether better use could be
made of the existing land supply without making further employment
allocations. The extent to which windfall allocations and recycling of existing
employment sites have a role in defining each District’s employment land
portfolio is also discussed below.
a Bolton: Bolton Town Centre is the largest in Greater Manchester outside the
Regional Centre, and eleven sites were identified in the town as having
potential for employment-led mixed use (totalling 31.8ha), which could
result in higher density development on these brownfield sites. However, in
general, other landless growth opportunities are expected to be relatively
limited, with strong demand for B2 and B8 uses expected to continue for
the foreseeable future. Aside from the eleven small town centre sites, the
main opportunity for higher density, hi-tech B1 use relates to the Horwich
loco works, which, at 16.3ha, is relatively small given the size of Bolton’s
current portfolio of employment land.
b Bury: the district has a modest portfolio of employment sites at present.
Landless growth has not been observed in the District in recent years,
although that may change in the future. As noted in Section 7, the district’s
ELR has identified a range of site sizes and types that have the potential to
be taken forward in the district’s emerging LDF, including a number of sites
suitable for higher density growth industries including the creative industries
and media; financial and professional services; healthcare/biotechnology

Greater Manchester Employment Land Position Statement
P23/70 40658/700918v1
and ICT/Digital. The consultation draft Bury but Better study identifies
seven potential sites in Bury Town Centre which could accommodate higher
density office uses, whilst an additional 50,000sqm of unspecified B1
floorspace has also been identified to come forward during the period 2023-
28. It is envisaged that this unforeseen ‘windfall’ allowance would be
accommodated on sites within the Borough’s key centres and would
constitute high density development that would not require a significant land
take.
c Manchester: In recent years, it has been apparent that although the
number of jobs based in the Regional Centre has increased dramatically,
this has not led to a commensurate take up of employment land. The
implication of this is that a high proportion of employment growth has been
accommodated by higher density office development on smaller parcels of
land (including the redevelopment of schemes such as 1 New York St and
Chancery Place). It is clear that a masterplan-led approach involving
partnership working between the City Council and developer has enabled the
City to make the most efficient use of land, buildings and sites and enabled
the City to achieve higher density developments in key locations.
Spinningfields and Piccadilly are examples of where effective
masterplanning has resulted in higher densities than might otherwise have
been achieved, but within a high quality environmental context and setting.
The recent GMFM 2008 and 2009 Interim projections both indicate that the
Business Services sector is likely to be the prime driver for economic growth
in the period to 2026 even allowing for the long term repercussions of the
ongoing recession; the majority of jobs resulting from this are likely to be
office-based, and it seems realistic to assume that job densities and
‘landless growth’ will remain high.
d Oldham: it is recognised that land within Oldham is a particularly scarce
resource, with Green Belt restrictions severely constraining the amount of
greenfield land that could be released for employment development in
future. Consequently, whilst landless growth has not been witnessed to a
significant extent in the recent past, the redevelopment of brownfield sites
at higher densities is likely to be a pre-requisite if the borough is to achieve
its goal of encouraging new hi-tech industries to locate in the district. A
series of strategic sites are proposed in the district’s Core Strategy
Preferred Options report, including Hollinwood Business District, Chadderton
Technology Park, Foxdenton and a number of sites in and around Oldham
Town Centre (including Mumps and New West End masterplan areas), which
could result in higher employment densities and more efficient use of
existing sites.
e Rochdale: stakeholder engagement indicated the district has seen little
evidence of landless growth occurring in recent years, with strong demand
in the recent past for lower density B2/B8 use, although NLP’s landless
growth analysis in Section 4.0 suggests significant landless growth has
occurred. Consultation with the Local Authority concluded this is probably
due to recent B1a office development at Sandbrook Park, Waterfold Farm.

Greater Manchester Employment Land Position Statement
P24/70 40658/700918v1
There are also opportunities for higher density office development in
Rochdale and Middleton Town Centres. Officers are of the view that windfall
sites have been (and will continue to be) an important source of supply that
is not reflected either in their current ELR or AMR. Assuming 4ha per
annum of windfall development could therefore have a substantial impact
on the district’s total land supply.
f Salford: A low overall supply of employment land has been identified when
compared with forecast land requirements, however major new sites are
proposed in the Council’s emerging Core Strategy. As with Manchester, high
density office development in the Regional Centre in recent years is likely to
have resulted in higher employment and development densities. The
proposals for the Regional Centre including MediaCityUK, Exchange
Greengate and Salford Central Station are likely to continue this trend. The
recycling of existing employment sites is recognised as a contributory factor
in the supply, with existing employment sites cleared and redeveloped,
creating more employment opportunities. This recycling of land is difficult to
quantify, however the city’s Unitary Development Plan identified a windfall
allowance to 2016 which is reflected in the supply identified in the AMR,
this element of supply has not been included in Table 4.
g Stockport: the district has traditionally seen high levels of B2/B8 industrial
development coming forward, at relatively low densities; however, B1 office
take up has recently been increasing and employment densities are rising
as a result. NLP analysis in Section 4.0 does indicate that significant
landless growth has occurred. Due to the limited opportunities for ‘building
out’ greenfield sites in the district, officers are of the view that opportunities
exist to enhance the office market in Stockport Town Centre, which is under
performing. If this is taken forward in the emerging Core Strategy, it is likely
that the recycling of existing sites and higher density office development will
take place on an increasing scale.
h Tameside: the district has historically been heavily reliant on manufacturing
sectors with a legacy of industrial mill buildings often in residential areas.
Landless growth has not been observed as a consequence, although
considerable recycling of land does occur. In terms of future opportunities,
there are likely to be few new greenfield allocations, with existing
employment sites to be strongly protected in planning policy terms. The
main opportunity for high quality office development is likely to comprise
Area 3000 on Ashton Moss Strategic Site and the St Petersfield site
(approximately 20,000 sq m).
i Trafford: the district has traditionally had a strong role in providing B2/B8
land for development, with the key sites at Trafford Park and Carrington
driving economic growth in the district. These two areas still contain the
vast majority of committed employment land sites for the district, although
it is likely that Trafford Park in particular may accommodate more higher
density office uses. Altrincham has an established office market albeit on a
relatively small scale, and its compact nature is likely to ensure that future
office developments in the area will be relatively limited. However, this

Greater Manchester Employment Land Position Statement
P25/70 40658/700918v1
needs to be squared with the fact that NLP’s analysis in section 4.0
indicates that significant landless growth has occurred.
j Wigan: in common with many of the surrounding districts in GM, the district
has a strong heavy industrial heritage which has set the context for the land
used for employment. The town centre office market has been relatively
limited in recent years, although following sustained public sector
investment, larger, lower density, edge-of-centre schemes have begun to
come forward. It is considered likely that, given the size and likely uses of
the available employment land sites and the ongoing industrial legacy of the
area, landless growth will not be a strong determinant of Wigan’s
employment land requirements for the foreseeable future. However, this
needs to be squared with the fact that NLP’s analysis earlier in this section
indicates that some landless growth may have occurred in recent years.
Prospects for increasing development densities
4.44 Based on the above analysis, the table below seeks to ‘traffic light’ the
prospects for ‘landless growth’, in the context of high density employment land
development, in each authority.
Past evidence of ‘landless growth’ Future prospects for ‘landless
growth’
Bolton Lower Lower
Bury Lower Moderate
Manchester High Very High
Oldham Lower Lower
Rochdale Moderate Moderate
Salford High High
Stockport Moderate Moderate
Tameside Lower Lower
Trafford Moderate Moderate
Wigan Lower Lower
Table 4 Potential for ‘Landless Growth’ in GM, by District
*NOTE: due to acknowledged limitations of the research presented in Figure 2, judgements on past evidence
of landless growth also included views expressed in stakeholder discussions and local knowledge
4.45 In light of the data limitations described above, this represents the most robust
approach to identifying future potential in terms of interpreting the current
position for employment space provision and the approach to RSS Policy W3.

Greater Manchester Employment Land Position Statement
P26/70 40658/700918v1
5.0 Future Requirements for Employment Land
5.1 A key element of this Position Statement is the derivation of each of the ten
Districts’ employment land aspirations and projections as identified in their
respective ELRs. This section presents the key findings and methodological
approaches used, before summarising the current ‘position’ regarding
employment land requirements for the sub-region.
Understanding the ELR Approach across the GM Authorities
5.2 ELRs have been undertaken by eight of the ten districts and have largely
followed Government guidance on the subject8. The ELRs focus on employment
space needs for the group of B Use Classes (i.e. B1, B2 and B8) and generally
do not assess the future land requirements of other employment generating
uses such as retail, tourism, healthcare and education, although in certain
instances the potential employment growth and labour requirements of such
uses have been qualitatively considered.
5.3 Stockport Council currently does not have an ELR, although forecasting work
will be used to inform their LDF and will incorporate GMFM forecasting and
Evolutive information on recent demand. Tameside Council began work on an
Employment Land SPD in 2007 in an attempt to address the pressure for
housing and other non-employment redevelopment on existing employment land
and sites. This focused upon an analysis of the current supply of sites and it is
anticipated that the remainder of the ELR work will be completed during 2009.
A review of the approaches used across the remaining authorities is
summarised in Appendix 2.
Consistencies and Inconsistencies across the Methodologies
5.4 The GM districts have employed a broadly similar methodology in appraising the
sites and forecasting demand requirements. The methodologies have generally
used the 2004 Government guidance note as a base, and have then adapted it
to suit the individual circumstances of that particular district. In general, the
quantitative modelling work has used the most recently available run of the
GMFM employment projections, whilst the fact that the ELRs were either
undertaken in-house or by a small group of consultants has resulted in a
broadly comparable approach.
5.5 Nevertheless, there are some important differences in the approach used to
derive the final demand projections across the ten authorities. A summary of
the key differences is presented in Table 5 and explained below:
1 Flexibility Factor: five of the districts have factored in a 20% ‘margin of
choice’/flexibility factor into the projections, whilst Bury, Oldham, Salford
8 ODPM (December 2004): Employment Land Reviews Guidance Note

Greater Manchester Employment Land Position Statement
P27/70 40658/700918v1
and Trafford have not. The ELRs reveal a number of reasons why the
Districts chose not to apply the 20% flexibility factor, with constraints due to
Green Belt development restrictions being the pre-eminent factor.
2 Base date: Although most of the districts use 2007 as the base date,
Rochdale, Tameside and Wigan use 2005 as a starting point, whilst the
most recent ELR for Manchester City uses 2008.
3 Time horizons: most of the districts have used a 19-year time horizon, from
2007-26; however, both Rochdale and Tameside’s projections finish at
2021, whilst Wigan’s projections cover a 21-year time horizon from 2005-26
– this potentially causes problems when trying to derive an overall sub-
regional employment land ‘need’ projection to 2026;
4 GMFM: As 18 months separates the preparation of the various ELRs,
different model runs of the GMFM have been used by each District,
underpinned by contrasting views on the future strength of the local
economy. Hence those ELRs relying on GMFM model runs from 2005 to
2007 (particularly Bolton, Oldham, Rochdale and Wigan) are likely to be
founded on more optimistic growth forecasts than more recently completed
ELRs (particularly Manchester City and Bury);
5 Employment Densities: Whilst most districts use the standard densities for
B1, B2 and B8 as set out in English Partnership’s guidance note 9,
Rochdale has varied the density for different types of office use (i.e. call
centre, science park etc) whilst Salford has used a slightly lower density for
B1c/B2;
6 Definition of B1/B2/B8 employment: There is considerable variation
amongst the districts when it comes to considering the relationship
between the B1/B2/B8 use classes and the Standard Industrial
Classification sectors for the quantitative modelling. This is primarily in the
definition of B8 uses, which ranges from taking all employment in the
‘Transport’ and ‘Communications’ SIC2 sectors (Trafford) to a detailed
analysis at ABI sector 4 level of ‘Distribution’, ‘Transportation’,
‘Communications’ and ‘Other Business Services’ (Salford).
7 Plot Ratios: All the districts used a standard plot ratio of 40% to convert
floorspace into land, with the exception of Manchester and Salford, which
applied a higher plot ratio of 200% and even 400% to B1a/b uses to reflect
the proliferation of high density office blocks in the Regional Centre, and
Rochdale, which used a mix of 40/80% for different types of B1a office
uses; and
8 Conversion of net to gross: Several of the authorities, specifically Bolton,
Manchester and Trafford, factored in the anticipated ‘loss’ of employment
land into the net GMFM projections to derive a gross requirement; others
derived a gross figure by applying (net) GMFM GVA growth to (gross) past
take up figures.
9 English Partnerships (2001): Employment Densities: A Full Guide

Greater Manchester Employment Land Position Statement
P28/70 40658/700918v1
Bolton Bury Manchester Oldham Rochdale Salford Stockport Tameside Trafford Wigan
AMR Recording of committed
employment supply
Allocations plus sites with
planning permission
Allocations
+ sites with
planning
permission + other
sites suitable for
employment
Allocations
+ sites with planning
permission
Allocations
+ mixed use sites
SITES OVER 0.4HA
ONLY
Allocations
+ sites with and without pp
but in broad zones allocated
for employment development
Allocations
+ sites with planning
permission
+ sites under construction
+ windfall assumption
Allocations
+ sites with planning
permission
+ sites under
construction
Allocations
+ sites with planning
permission
Allocations
+ sites with planning
permission
+ sites under
construction
Allocations
+ sites with planning
permission
ELR demand projections – includes
Flexibility Factor of 20% YES NO YES NO YES NO NO YES NO YES
Time frame for ELR demand
projections 2007-26 2007-26 2008-26 2007-26 2005-21 2007-26 n/a 2005-21 2007-26 2005-26
Gross or net projection? Gross Gross Gross Gross Gross Gross Gross Gross Gross Gross
GMFM model used for quantitative
demand projections
GMFM 2007 Update and
GMFM 2007 Accelerated
Growth models
GMFM Reference
Nov 08
GMFM AGS 2008
GMFM Reference Nov
08
GMFM 2009 Interim
update
GMFM Reference
Scenario 2007
GMFM Accelerated
growth 2007
GMFM Reference 05
Optimistic 05
Reference 06
GMFM LGS 2008
GMFM Base 2007
GMFM AGS 2008
GMFM Aspirational 2008
Scenario (Salford Specific)
GMFM Reference 08
AGS 09- -
GMFM 2007 Update
AGS 2006
Low Growth (LGS) 2008
GMFM
Reference 05
Optimistic 05
Reference 06
Employment Densities used for
quantitative modelling
General office buildings:
19sqm per employee.
General industrial
buildings: 34sqm
General warehousing
buildings: 50sqm
B1: 19sqm per
employee.
B2: 34sqm
B8: 50sqm
B1: 19sqm per
employee.
B2: 34sqm
B8: 50sqm
B1: 19sqm per
employee.
B1c/B2: 34sqm
General B8: 50sqm
B1: 12.8-32sqm per
employee.
B2: 34sqm
B8: 50sqm
B1a/b: 19sqm per
employee.
B1c/B2: 32sqm
B8: 50sqm
- B1a/b: 19sqm per
employee.
B1c/B2: 32sqm
B8: 50sqm
-
B1: 19sqm per
employee.
B2: 34sqm
B8: 50sqm
B1: 19sqm per employee.
B2: 34sqm
B8: 50sqm
Relationship between B1/B2/B8 and
SIC sectors for quantitative modelling
B1 = Financial and
Business Services
B1c/B2/B8= 13
Industrial sectors, plus
mix of others
B1 = FBS
B2 = 13 Industrial
sectors, constr. %,
distrib. %, other
services%
B8 = distrib %,
Trans%
B1 = FBS
B2 = 13 Industrial
sectors
B8 = distrib %, Trans%
B1 = FBS
B1c/B2 = 13 Industrial
sectors
B8 = Distribution %, Tr
& Coms %
B1 = Financial and Business
Services
B2 = 13 Industrial sectors
B8 = Distribution %, Tr &
Coms %
B1ab = mix of FBS, public
admin%
B1c/B2 = 13 Industrial
sectors, constr.%, distrib
%, industrial cleaning%
B8 = distrib%, trans%,
com%, other bus services%
B1 = FBS
B1c/B2 = 13
Industrial sectors
B8 = Warehousing
-
B1 = FBS
B2 = 13 Industrial
sectors
B8 = all transport and
communications
B1 = FBS
B2 = 13 Industrial sectors
B8 = Distribution %, Tr &
Coms %
Plot Ratios for quantitative modelling
40% for B1/B2/B8 40% for B1/B2/B8 400% B1a in the City
Centre;
40% B1a beyond and
B2/B8
40% for B1/B2/B8 Mix of 40%/80% for B1
40% B2/B8/
200% B1a/b
40% B1c/B2
30% B8 TBC -
40% for B1/B2/B8 40% for B1/B2/B8
Conversion of net to gross?
Factored in loss of 8ha of
employment land per
annum
No Yes Applied % to take up No No
- -
Factored in losses of
4.42ha p.a.
No
Overall demand to 2026
Factored in qualitative
considerations to
quantitative demand
projections (take up and
GMFM forecasts).
VOA data was also
provided. Capital
substitution of labour was
also taken into account.
Adjusted past take
up rates on the
basis of
proportional
change in B-use
class employment.
186.7ha (GMFM 2008)
to 236.2ha (past take
up plus 20%).
Adjusted past take up
with GMFM GVA growth.
GMFM:
B1 = 11ha
B2 = -41ha
B8 = 3
Total = -27ha net
Alternatively:
Historic take up = 176ha
RSS = 71ha
Took an average = 26.4ha
above current supply
Overall conclusion is a need
for 25-30ha additional land
Wide variation in methods
– applied market
judgement to past take up,
GMFM and enquiries to
derive need.
-
10.31ha take up x
RSS 6%, x 20%
flexibility: 209.86ha
NOTE: this is a slight
deviation from the
figure used in the SPD
at the LA’s request
due to an error in the
evidence base.
The overall demand to
2026 set out in the ELS
was the result of the
moderation of the GMFM
data by the views
expressed at a
stakeholder workshop
and consideration of
past take up rates.
There was an estimated
need for between 100-
170ha
Adjusted past take up rates
on basis of B class
employment growth
projections.
Table 5 Comparison of ELR approach and data sources across the ten GM districts.

Greater Manchester Employment Land Position Statement
P29/70 40658/700918v1
Summary of ELR ‘Demand’ Projections
5.6 Table 6 presents a summary of the resultant employment land demand
projections for each of the ten GM districts. In the case of Manchester,
Tameside and Wigan, the ELR figures have been increased/decreased pro-rata
to ensure a consistent timeframe across the sub-region.
Districts’ ELR demand
projections, to 2026
POTENTIAL TOTAL DEMAND
(figures increased pro-rata to
2007/26 where necessary)
Includes
20%
Flexibility
factor?
Bolton 175ha – 195ha (2007-26) 175-195ha YES
Bury 76.9ha (2007-2026) 76.9ha NO
Manchester 187-236ha (2008-26) 197-249ha YES
Oldham 132.8ha-137.6ha (2007-26) 133ha-138ha NO
Rochdale 210-215ha (2005-21) 210-215ha** YES
Salford 124-243.5ha (2007-26) 124-243.5ha NO
Stockport No ELR available 138ha (7.27ha take up x 19 years) NO
Tameside 209.86ha (2005-21)* 249.2ha YES
Trafford 100-170ha (2007-26) 100-170ha NO
Wigan 293ha-336ha (2005-26) 265ha-304ha YES
Table 6 Summary of ELR demand projections
* To be updated from ELR work summer/autumn 2009’
** Rochdale Council officers consider that the figure for 2007/26 should remain as 210-215ha.
5.7 The table and the accompanying Fig 4 (below) indicate that the highest forecast
demand is likely to be in the districts of Bolton, Manchester, Rochdale, Salford
and Wigan, with a considerable range between the high and low end projections
for some of these districts. Demand for employment land is forecast to be
significantly lower in Bury (77ha) and Stockport (138ha).
5.8 In total, and based upon the conclusions of the ELRs recently undertaken, the
demand for employment land in the Greater Manchester sub-region could range
from 1,668 to 1,979 between 2007 and 2026. However, as some districts
have included a flexibility allowance whilst others have not, it is difficult to
compare this figure with the RSS Policy W3 requirement.

Greater Manchester Employment Land Position Statement
P30/70 40658/700918v1
0
50
100
150
200
250
300
350
Bolton Bury Manchester Oldham Rochdale Salford Stockport Tameside Trafford Wigan
He
cta
res
Upper margin
Lower margin
Fig 4 ELR Demand Projections - upper and lower margin, 2007-26
5.9 Since the base year of the RSS, 2005, there has clearly been a considerable
amount of employment land development in the ten districts. Table 7 presents
a summary of the level of take up of employment land in 2005/06 and
2006/07. The table indicates that, overall, there has been around 198.6ha
developed, at a rate of 99ha per annum. This is 12% lower than the
112ha/119ha10 per annum Policy W3 of the RSS used to inform future
requirements.
10The latter figure allowing for a 6% increase over the plan period.

Greater Manchester Employment Land Position Statement
P31/70 40658/700918v1
Take Up 2005/06
(ha)
Take Up 2006/07
(ha) TOTAL (ha)
Bolton 10.1 18.56 28.66
Bury 2.48 2.79 5.27
Manchester 18.21 9.98 28.19
Oldham 7.1 7.9 15
Rochdale 7.7 7.1 14.8
Salford 3.09 11.67 14.76
Stockport 7.11 8.71 15.82
Tameside 4.03 5.65 9.68
Trafford 4.91 25.37 30.28
Wigan 16.38 19.76 36.14
GM TOTAL 81.11 117.49 198.6
Table 7 Take up of Employment Land 2005-2007,
(Based on take up rates as sent to Urban Vision by GM authorities)
Future Employment Land Requirements – A Comparison
5.10 As noted in Table 5, each district has derived its individual ELR employment
land requirements based on a combination of methods including projecting
forward past take up rates; utilising the econometric GMFM projections; the use
of VOA floorspace figures; and using a variety of qualitative techniques
including engagement with agents to derive a commercially realistic figure. It is
not the purpose of this report to question the accuracy or reliability of the
methods used; rather it uses recent data regarding take up rates and the
GMFM model to provide some further objective context to the RSS Policy W3
requirements.
Past Take Up Rates
5.11 At this stage it is important to contrast the ELR demand projections discussed
above, with the requirements that could be derived if the RSS approach was
revisited.
5.12 As set out in Section 2.0, Policy W3 of the North West RSS deals with the
supply of land that is expected to be available between 2005 and 2021. Table
6.1 that features in the policy, provides supply and take up information based

Greater Manchester Employment Land Position Statement
P32/70 40658/700918v1
on the evidence collated for the NWRA’s 2005 Regional Employment Land
Study and GVA economic growth data modelled by Experian. Table 8 below
presents a summary of the approach used by the RSS and revisits the data to
derive a new figure based on updated take up rates for each GM district (using
five years of figures which is the maximum period available for all ten districts –
to allow comparison and consistency - although some LPAs are able to provide
more).
5.13 In essence, the methodology used by the RSS involves taking recent take up
rates for each district and totalling these by sub-region (row 1 in Table 8 below).
An assumption was then made regarding the relationship between the recent
success scenario GVA growth projections for the sub-region as forecast by
Experian and employment land take up, with forecast growth to 2021 equal to
6% increase in past take up rates. The resultant sub-regional figure of 119ha
was then projected forward 16 years to arrive at a total sub-regional ‘need’
figure of 1,904ha (row 3 in Table 8). A flexibility factor of 20% was then
applied, with the subtraction of the resultant figure from the existing supply of
sites resulting in the potential allocation that may be required in each sub-
region to 2021.
5.14 Supporting text to policy W3 explains that it requires the individual local
authorities in each sub-region to work together with 4NW to develop a logical,
evidence based approach to distributing this employment land requirement.
4NW has subsequently written to all authorities indicating that the starting
point for the debate/working together on distributing the land requirement
should be the base requirement figure of 536 hectares.

Greater Manchester Employment Land Position Statement
P33/70 40658/700918v1
GM
TOTAL Bolton Bury
Man-
chester Oldham Rochdale Salford
Stock-
port
Tame-
side Trafford Wigan
1) RSS take up 2005a 112.2
2) RSS take up per
annum (6% growth)b 119
3) Need 2005-21 (no
flexibility)c
1,904
4) Need 2007-2026 (no
flexibility)d 2,257
5) Need 2007-2026
(20% flexibility)e 2,709
6) NEW take up per
annum (last 5 years)f 99.6 12.2 5.3 10.9 8.7 9.7 8.3 8.0 6.5 17.7 12.3
7) NEW 19 year needg 1,893 233 101 207 165 184 157 152 123 337 234
8) NEW need (incorp
6% growth)h 2,006 247 108 220 175 195 166 161 130 357 248
9) NEW need (incorp
20% flexibility)i 2,408 296 129 263 210 234 199 194 156 429 297
Table 8 Review of Past Take Up Rates
1) Based on take up data collected by NWRA as part of the 2005 Regional Employment Land Study 2) 6% growth in take up rates 3) 'b' multiplied by 16 (years) 4) 'b' multiplied by 19 (years) 5) 'd' +20% growth 6) 5 yr annual average take up rate as sent to Urban Vision by GM authorities 7) 'f' multiplied by 19 (years) 8) 'g' +6% growth 9) 'h' +20% growth

Greater Manchester Employment Land Position Statement
P34/70 40658/700918v1
5.15 As recognised by 4NW in their Employment Land Implementation note (April
2009), it is vital that that the evidence base produced is robust and credible
and (as stipulated in PPS12) ‘proportionate to the job being undertaken by the
plan, relevant to the place in question and as up to date as practical having
regard to what may have changed since the evidence was collected’. In addition,
draft PPS4 highlights the critical role in compiling the evidence base to ‘plan
positively’ for sustainable economic development.
5.16 Consequently, in this regard there are a number of issues regarding the original
methodological approach underpinning Policy W3:
1 The take up figures used in the RSS covered the period up to 2005; three
years additional data is now available for the local authorities and it is
apparent from Row 6 of Table 8 that more up to date take up rates over the
last five years (totalling 99.6ha) are lower than the 112.2ha used in the
RSS (see also Table 7 above). Consequently, revisiting the RSS approach
with updated (and significantly lower) take up rates11 could result in a 16-
year ‘need’ (excluding the flexibility factor) of 1,594ha across the sub-
region, 310ha lower than the comparable RSS figure (row 3) (note: the 5
year take up has been assumed for consistency purposes, although it
covers a period of economic growth).
2 The time frame used is no longer consistent with the period districts are
planning for in their LDFs. In general, 2007-2026 is the time horizon
employed by Greater Manchester districts when planning for employment
land, a period of 19 years. However, the RSS provides guidance for the
period 2005-21, a 16 year period. In an attempt to reconcile this approach,
the original RSS projected annual take up figure (119ha) has been projected
forward 19 years to derive a total sub-regional requirement between 2007
and 2026 of 2,257 (excluding 20% flexibility factor). It should be noted that
an assumption has been made that the original Experian modelling would
have continued the growth rate at a level of 6% beyond 2021.
3 The Experian GVA growth projections used to increase the trajectory of
employment land requirements are necessarily crude in the context of the
north west region as a whole and reflected the general optimism in the
economy back in 2005; however, the severe economic downturn has
resulted in drastically revised models being produced, with successive
GMFM model runs generating increasingly pessimistic short-to-medium term
projections. There is a therefore a need to test whether the 6% growth rate
applied to past take up is sufficiently robust, given the ongoing recession.
4 The RSS appears to acknowledge that given the degree of uncertainty in
establishing employment land requirements, as well as the need to provide
additional land to take account of special circumstances, the need to apply
a 20% flexibility factor will require a judgement from LPAs (working with
4NW) based on what their evidence base reveals, and set within the policy
11 It should be noted that there are some minor differences between the ten districts in terms of how employment
land take up is recorded; for example, Bury, Rochdale, Stockport, Salford, Trafford and Wigan have size thresholds
below which employment land take up is not recorded.

Greater Manchester Employment Land Position Statement
P35/70 40658/700918v1
context of the RSS and the relevant emerging DPDs. Several of the districts
did not apply the 20% flexibility factor to their demand projections in their
recent ELRs; however, Bolton, Manchester, Rochdale and Wigan did apply
this figure. Consequently the sub-regional figure, with or without the
flexibility factor, needs to reflect this differing approach (relevant to the
place in question) to providing additional land by the individual districts.
0
50
100
150
200
250
300
350
400
450
500
BOLT
ON
BURY
MAN
CHES
TER
OLD
HAM
ROCHDALE
SALFORD
STO
CKPO
RT
TAMESID
E
TRAFFO
RD
WIG
AN
he
cta
res
NEW Projected need (incorp 6% growth) NEW Projected need (incorp 20% flexibility)
Fig 5 Application of RSS Policy W3, utilising 2003-2008 employment land take up rates
5.17 Fig 5 demonstrates the results of applying the RSS Policy W3 approach to each
of the GM Districts, using 2003/08 employment land take up rates. It
indicates that utilising more up-to-date information could result in an overall
reduction in the total amount of employment land required for the sub-region,
with substantially lower take up rates reported in Bolton, Salford, Tameside and
Wigan in particular.
5.18 Whilst such an approach is relatively crude, it demonstrates that the RSS
‘need’ figure as it currently stands in Policy W3 could be judged excessive.
Comparison with GMFM
5.19 The North West RSS was informed by a series of model runs undertaken by
Experian for the NWDA in 2005. Three employee-based forecasts were
produced, based on long term trends; recent successes; and a
transformational change in productivity. For Greater Manchester, the resultant
GVA growth trends relating to the recent success scenario were adopted by the
NWRA. Consequently, 6% growth forecasts were applied to the past take up

Greater Manchester Employment Land Position Statement
P36/70 40658/700918v1
rates in an attempt to reconcile the reality of past take up rates with the
aspirational changes envisaged.
5.20 To inform this Position Statement, NLP has reviewed more recent modelling
work undertaken by Oxford Economics. As noted in Section 2.0, the Greater
Manchester Forecasting Model (GMFM) provides a set of integrated economic,
population and household forecasts for each of the Greater Manchester
authorities. NLP has appraised the 2008 model run in detail, which was
designed to take account of the impact of the economic slowdown driven by the
credit crunch.
5.21 In order to determine the projected employment land requirement by type
generated by each scenario, it was necessary to categorise the level of forecast
employment change by B use class. For the purposes of this exercise it was
assumed that:
• The B1 office floorspace requirement would be related to job growth/
decline in the financial and business services sector;
• The B2 floorspace requirement would be related to job growth/ decline in
the manufacturing industrial sectors; and
• The B8 floorspace requirement would be related to job growth/ decline in
the sectors of distribution and transport and communications12.
5.22 Following the calculation of the employee breakdown for B1, B2 and B8,
employment densities and plot ratios as recommended in the Government
guidance were then applied to the job change figures. The resultant
employment land projections for each District are presented in Table 9 below.
12 Note: an analysis of SIC Level ABI data for 2007 indicated that just 16% of jobs in the transport and
communications sector can be considered to contribute to the need for employment land in Greater Manchester.
In response, the GMFM job figures for the sector were reduced by 84% to remove any non-B8 uses (such as taxi
operations) from the forecasts.

Greater Manchester Employment Land Position Statement
P37/70 40658/700918v1
Employment Land Requirements
2007-27 (net)
Employment Land Requirements
2007-27 (net), including 20%
flexibility factor*
B1 B2 B8 Total B1 B2 B8 Total
Bolton 24.0 -60.35 1.8 -34.5 28.8 -48.3 2.2 -17.3
Bury 4.7 -34 2.0 -27.3 5.6 -27.2 2.4 -19.2
Manchester 192.3 -52.7 15.7 155.4 230.8 -42.2 18.9 207.5
Oldham 8.2 -46.75 4.0 -34.6 9.8 -37.4 4.8 -22.8
Rochdale 25.7 -48.45 3.5 -19.2 30.9 -38.8 4.2 -3.7
Salford 41.5 -37.4 4.4 8.5 49.8 -29.9 5.3 25.2
Stockport 25.7 -50.15 6.2 -18.3 30.9 -40.1 7.4 -1.9
Tameside 5.8 -56.1 3.8 -46.4 7.0 -44.9 4.6 -33.3
Trafford 42.1 -41.65 8.8 9.2 50.5 -33.3 10.5 27.7
Wigan 25.7 -51 2.2 -23.1 30.9 -40.8 2.6 -7.3
GM TOTAL 395.8 -478.6 52.4 -30.4 474.9 -382.8 62.9 155.0
Table 9 Summary of GMFM 2008 Quantitative Demand Projections
*Note: where land requirement figure is negative, the final figure has been reduced by 20%.
5.23 The model run indicates that, approached in this way, the net total requirement
for employment land in the Greater Manchester between 2007 and 2027 could
range from -30.4ha to 155ha, with the vast majority of growth attributable to
the continued strong office market in the Regional Centre.
5.24 In addition, it is apparent that since the GMFM 2008 model run was completed,
the economic position has worsened significantly, with the UK economy moving
into recession. In recognition of this, a bespoke ‘Interim’ run of the GMFM was
undertaken for Manchester City to inform their ELR. Whilst no figures are
available at District level (other than for Manchester City itself), a sub-regional
figure was generated (see Section 2.0). The 2009 GMFM indicates that the
adverse impacts of the recession are likely to be even more pronounced, with
the level of employment across Greater Manchester projected to increase to
1,258,400 by 2032; a figure that is 43,000 lower than the 2008 GMFM.
5.25 These demand projections, modelled during a time of economic pessimism,
may be judged to be more realistic than the Experian ‘recent success’ GVA
forecasts which informed the North West RSS, and hence may cast some doubt
as to the continued validity of Policy W3’s results.

Greater Manchester Employment Land Position Statement
P38/70 40658/700918v1
5.26 It is apparent that there is little agreement amongst economic forecasters
about the length and severity of the current recession and hence local
authorities will need to take a flexible approach to planning for the up-turn,
particularly when it comes to forecasting the demand for employment land. The
wide variety in the results of the demand forecasting approaches described
above point to a need for a range of demand forecasts.
5.27 However, it is clear that the ‘net’ GMFM forecasts cannot be directly compared
with ‘gross’ past take up rates; the resultant wide disparity between the two
modelling approaches indicates the considerable amount of uncertainty
surrounding both sets of figures and the need to adopt a realistic, robust and
flexible approach to indicating how much land is required. The implications of
the various modelling techniques used for each District are discussed in further
detail in Section 7.0.

Greater Manchester Employment Land Position Statement
P39/70 40658/700918v1
6.0 Current Supply of Employment Sites
6.1 To maintain its distinct role and help deliver economic growth, the Manchester
City Region must plan for the land and premises requirements of specific
growth sectors. The Arup Demand Study identifies the growth industries for the
City Region and summarises the key locational factors that shape their
investment decisions. This Section of the Position Statement presents a
detailed understanding of the spatial distribution of the overall Greater
Manchester portfolio of employment land and how this corresponds with the
RSS spatial framework described in Section 2.0.
6.2 The section begins with an appreciation of the current quantitative situation
regarding employment land availability, based on recent Annual Monitoring
Reports; the Employment Land Reviews undertaken to date; discussions with
Council Officers and the emerging recommendations of their respective Local
Development Frameworks.
Potential Forward Supply of Employment Land
6.3 Table 10 presents a summary of the current situation regarding the
‘committed’, or existing, employment land supply for each district in the Sub-
Region. For the avoidance of doubt, ‘committed’ employment land is generally
taken to mean land with either an allocation for employment use in an adopted
UDP/Local Plan/LDF document, or which has an extant planning permission for
employment use. Whilst this definition is generally adhered to by the GM
districts, there is some variation reflected in the AMR figures, with certain
districts excluding sites with extant planning permission, whilst others include
sites under construction and mixed use sites. These are discussed in further
detail overleaf.
6.4 The ‘Potential Total Supply’ figure in Table 10 represents an aspirational figure
that could be achieved if the ELR recommendations are followed through for
each District. It also factors in officers’ aspirations for their districts based on
the stakeholder discussions undertaken as part of this study, and hence the
figures in this final column should be treated with a degree of caution.
6.5 It is important to note that much of this potential supply is actually located in
the green belt. This includes: 97ha of land at Cutacre in Bolton; a 13.51ha
site in Bury; a 5.4ha site in Oldham (already designated as a Major Developed
Site in the green belt); a 36.8ha site in Rochdale; potentially 40ha of additional
land at Barton to the west of City Airport Manchester in Salford; a 20ha site at
Mottram in Tameside; approximately 40 ha of land in Stockport, a major
existing developed site in the green belt; and approximately 40ha of land in
Wigan. Clearly, this comprises a considerable cumulative amount in total for
the sub-region, equal to around 253ha to be released.

Greater Manchester Employment Land Position Statement
P40/70 40658/700918v1
RSS Policy W3 2005
Supply*
2007/08 AMR
Committed
Employment Land
Supply**
Potential Total Supply of
Employment Land
Bolton 123 103.41 220.71
Bury 63 48.12 92
Manchester 168 164.2 551.38
Oldham 59 79.58 68.75
Rochdale 174 175.2 205.20
Salford 200 123.25 198.25
Stockport 80 60.62 100.62
Tameside 28 74.19 94.19
Trafford 245 131.9 283.76
Wigan 229 212.22 275.00
GM Total 1,368 1,173 2,089.86
Table 10 Summary of Total Forward Supply of Committed Employment Sites in GM
* Source: Land Supply data provided by each District to inform the NWRA Regional Employment Land Study,
2005.
**Generally includes allocated land and unallocated land with extant planning permission for employment
use. See Row 1 of Table 5 above for District variations.
6.6 The following paragraphs summarise the position for each authority.
6.7 Bolton: the district’s AMR figure records allocated land (85.35ha, including
31.8ha of town centre sites identified in the ELR as having potential for
employment led mixed use), plus 18.06ha on sites with extant planning
permission, the majority of which are small sites which the Council would not
be identifying as allocations. The allocated sites also include the Horwich loco
works (currently 16.3ha but will increase in size), which has the potential to
play a key role in providing knowledge based, mixed use employment in the
future.
6.8 The potential total supply figure includes the remaining area at Cutacre. This
large site comprises 138ha, of which 20.74ha is already allocated for
employment use. The remaining area of 117.3ha is recommended for inclusion
as an allocation in the district’s emerging LDF documents, which would
increase the potential total supply of sites to 220.71ha.
6.9 Bury: the district’s AMR records a relatively modest amount of employment
land at 48.12ha, including allocations, sites with extant planning permission for
employment use and other sites suitable for employment. No distinction is
made between sites that are immediately available, or those which are

Greater Manchester Employment Land Position Statement
P41/70 40658/700918v1
constrained. The district has traditionally had a limited supply of available
employment land, with few large sites.
6.10 Bury’s ELR identified 33 employment sites covering 84.34ha. This includes
31.56ha of existing employment land that is considered suitable for carrying
forward and an additional 52.78ha on 14 new sites that is required to meet
Bury’s projected needs. The ELR concluded that the portfolio offered a diverse
range of deliverable sites covering a range of site sizes and with a more
balanced spatial distribution than that which currently exists.
6.11 In 2009, work commenced on the review of the ‘Bury but Better’ Town Centre
Vision and Development Strategy which will set out the long-term strategy for
future development in and around Bury town centre. The consultation draft of
the review has identified the potential for a further 7.25 ha of B1 land on seven
sites and these have been included in the ‘potential supply’ figure as a
consequence.
6.12 Manchester: the Annual Monitoring Report for 2007/08 indicates that the
City’s current employment land portfolio totals 164.2ha. This comprises
existing employment land allocations, plus sites with extant planning
permission for employment use. No split is provided regarding the amount of
land available by type (i.e. B1, B2 or B8). Manchester City’s 2007/08 AMR
states that most sites are created by clearance/redevelopment. It is
understood that in addition to the 164.2ha of available employment land
quoted in the AMR, a further 18ha of employment sites were under
construction as of April 2008. However, the emerging ELR indicates that the
actual supply figure is nearer to 260ha (due to the inclusion of a much larger
area at Central Park), whilst there is potential capacity for employment land
totalling some 551.38ha, although not all of this is necessarily part of the
current supply and its quality is variable.
6.13 Oldham: the district’s AMR records a committed employment land supply
(based on existing allocations only) of 79.58ha. It is generally considered that
the Borough has a very limited supply of employment land due to environmental
and physical restrictions. In particular, topographical issues and the fact that
over half the district is allocated as Green Belt land severely restricts the ability
of the council to release new sites for employment use. It is noted, however,
that Strategic Regional Sites located in neighbouring Boroughs such as
Kingsway in Rochdale, Ashton Moss in Tameside and Central Park in
Manchester may offer opportunities for Oldham’s workforce to gain
employment.
6.14 The district’s draft ELR identified an available portfolio of 40.75ha, and it is
apparent that, following discussions with officers, a further 28ha of land is
available on ‘Land Reserved for Future Development’ to be taken forward in the
Core Strategy at Foxdenton. This results in a potential forward supply of
68.75ha.

Greater Manchester Employment Land Position Statement
P42/70 40658/700918v1
6.15 Rochdale: the district’s AMR indicates that a total of 175.2ha of land is
‘committed’ for employment use, including allocations, sites with extant
planning permission for employment use, and some mixed use sites. This
figure does not include windfalls that may become available up to 2026. As
with many of the other districts in the sub-region, Rochdale is restricted in the
amount of greenfield land that could come forward on top of the existing land
supply which comprises a large proportion of Greenfield land.
6.16 Rochdale has currently a good supply of high quality sites comprising around
115 ha on Greenfield sites with good motorway access. Rochdale’s largest
outstanding allocation lies at the Kingsway Strategic employment site, with a
job target of 7,000 employees on this site. There remains a strong demand for
B8 distribution due to the Borough’s excellent links to the motorway network.
The potential supply includes a 30ha site to the south of Heywood, which would
require the release of Green Belt land and new road infrastructure to unlock the
site. This additional site would help meet the strong demand for B8 if all B8
sites on Kingsway are developed.
6.17 Salford: the district committed employment supply currently stands at
123.25ha, comprising of allocations plus sites with extant planning permission.
The supply figure of 147.65ha in the AMR includes an allowance for windfalls
(24.4ha). The potential total supply figure of 198.25ha includes an additional
10ha greenfield site at Cutacre, plus a 40ha site within the Green Belt to the
west of City Airport Manchester. It also includes a 25ha allowance for office
floorspace coming forward in the Regional Centre as identified in Salford’s
emerging Core Strategy, primarily as part of wider mixed-use schemes. The
council will also seek an additional allowance for development on existing
employment land, i.e. ‘recycling’ of sites that would not necessarily appear in
the AMR ‘committed sites’ figure, but which nevertheless are recorded as
employment land take up.
6.18 Stockport: the district’s 2007/08 AMR identifies a forward supply of 60.62ha,
comprising allocations, plus sites with planning permission as well as mixed
use sites. Of this figure, 25.93ha relates to B1 office uses. Despite this
relatively modest allocation, it is unlikely that there will be many opportunities
to release new greenfield sites for employment use in the future due to the
Green Belt restrictions. This is despite the growth opportunities identified for
the borough in professional services, with a highly skilled workforce commuting
into the Regional Centre for work. The main opportunities for large new
employment sites comprise two unallocated sites (totalling 40ha) currently
operated by British Aerospace. It is understood that this site may come
forward for employment use by 2012/13, although not all of the site may be
wholly available for employment use. This figure has been included within the
‘potential supply’ figure in Table 10 above. Officers also see a clear
opportunity to enhance the current stock of employment land through the
development of the office market in Stockport Town Centre, which is currently
under-performing as a B1 destination.

Greater Manchester Employment Land Position Statement
P43/70 40658/700918v1
6.19 Tameside: the district’s AMR identifies a committed employment land supply of
74.19ha, comprising allocations plus sites with extant planning permission.
The Borough has come under sustained pressure in recent years for the
release of employment sites for ‘higher value’ uses, and the Council produced
an Employment land SPD to address this. The borough also experiences a
significant amount of churn, with existing employment sites being redeveloped.
Sites remain limited, however, resulting in a very high proportion of residents
commuting out to adjoining Boroughs for work. Along with a severe shortfall of
available employment land, there is also an imbalance in where these sites are
located; residents living in isolated areas such as Hattersley suffer from a lack
of employment opportunities. To resolve this issue a site adjacent to the
proposed Mottram bypass can be identified but this has policy constraints and
would need to secure release.
6.20 Trafford: the district’s AMR identifies a total committed employment land
supply of 131.9ha, including allocations, sites with extant planning permission
and land under construction. Recent office investment activity in town centres
has been limited to one redevelopment scheme in Altrincham, whilst the supply
of land identified in the AMR is concentrated in Carrington and Trafford Park,
with modest amounts in Old Trafford and Altrincham Town Centre. The
district’s recent ELR identified a potential portfolio of 184.67ha on 31 sites, all
of which are located on previously developed land, with a further supply of
99.09ha on sites that were not currently available at the time of the ELR, but
which were to be retained for development in whole or in part for employment
use. The inclusion of these sites could potentially boost the total forward
supply of employment land in Trafford to 283.76ha. There are potential
additions to this supply that are being considered as part of Trafford’s emerging
Core Strategy.
6.21 Wigan: the district’s AMR identifies a committed employment land supply of
212.22ha, comprising allocations plus sites with extant planning permission for
employment use. The Core Strategy is seeking to provide around 275ha of
employment land, comprising 150ha of existing allocations; over 100ha on
proposed key ‘strategic’ sites (most of which comprise existing Safeguarded
Land), plus windfall town centre sites.
Summary
6.22 The ten Districts have an existing committed forward supply of employment
land equal to 1,173ha, potentially rising to 2,090ha if other suitable sites likely
to come forward as part of the LDF process are included. This latter figure is in
excess of the RSS Policy W3 supply figure for Greater Manchester, which
equated to 1,368ha as at 2005. Fig 6 indicates that Manchester has
potentially the highest amount of employment land in the sub-region, at 551ha,
followed by Trafford (284ha) and Wigan (275ha).

Greater Manchester Employment Land Position Statement
P44/70 40658/700918v1
221
92
551
69
205
198
101
94
284
275
BOLTON
BURY
MANCHESTER
OLDHAM
ROCHDALE
SALFORD
STOCKPORT
TAMESIDE
TRAFFORD
WIGAN
Fig 6 Potential Total Supply of Employment Land in Greater Manchester (ha)

Greater Manchester Employment Land Position Statement
P45/70 40658/700918v1
7.0 A Response to RSS Policy W3
Introduction
7.1 The preceding sections of this report have summarised the current situation
regarding the demand and supply of employment land for each of the ten
districts in the sub-region; and the extent to which landless growth has
contributed to employment growth and influenced take up rates in the recent
past, and how this is anticipated to become an increasing factor in spatial
planning.
7.2 This section of the Position Statement seeks to draw together the emerging
conclusions to provide a reasoned response to the RSS sub-regional
employment land figures for Greater Manchester as outlined in Policy W3,
providing a detailed breakdown of its distribution across the ten districts.
Approach
7.3 In arriving at a response to RSS Policy W3, NLP has drawn together the
analysis flowing from a variety of data sources including:
a Considering the strengths/weaknesses, aims and economic aspirations of
each District (including information contained within the emerging Core
Strategies and MIER);
b Reviewing the conclusions of each District’s ELR and setting the demand
projections therein against the current forward supply of sites in the
respective 2007/08 AMRs;
c Discussions with officers from the individual authorities alongside other
stakeholders;
d Analysis of recent GMFM employment projections, factoring in the
implications of the ongoing economic downturn;
e Consideration of any specific transport infrastructure constraints and likely
improvements emerging from the stakeholder discussions;
f Analysing the current representation and recent job growth trends of key
sectors for each district;
g Assessing the prospect of potential growth sectors against key locational
factors for each sector;
h Likely implications and opportunities of building up/building out for each
District;
i Considering factors that could lead to a step change in the sub-regional
economy.

Greater Manchester Employment Land Position Statement
P46/70 40658/700918v1
Factors Relevant in Assessing the Requirements
7.4 In considering these factors, and in seeking to consider the implications of RSS
Policy W3, it is clear that:
a There are inherent methodological difficulties in setting district-level
requirements for employment land based on a single consistent ‘top down’
approach using past take-up rates (adjusted to reflect uplifts in GVA) as was
adopted in forming the RSS Policy W3. Although they can be a useful
starting point for planning within Greater Manchester, there are risks in
taking forward these by rote, as the fact that the figures change markedly by
adopting a more recent set of take-up rates demonstrates. The issues were
considered earlier in this Report, but in summary, the risks are because,
inter alia:
i time frames are inconsistent: the RSS projects need for employment
land between 2005-2021; the GM districts are generally working
towards a timeframe of 2007-26 for their Core Strategies;
ii take up rates fluctuate – some districts were comfortable that the RSS
W3 estimates reflected a reasonable perspective of future requirements;
others considered the period that was projected forward to be
unrepresentative of the long term economic picture for their district(s).
More recent take up data is now available which indicate a downturn in
the amount of employment land coming forward in recent years. It is
almost certain that this will have been accentuated by the current
recession. A re-run of the RSS Policy W3 methodology using these
updated figures indicated a significant drop in the amount of
employment land required over the time period;
iii the degree of uplift (6%) to past rates (taken from what was already a
relatively benign macro economic environment) now looks to be
optimistic given the current downturn and the widely expected prognosis
of growth at trend or below in the medium to long term. It is not
consistent with the outputs of the GMFM. Applying these rates could
result in ‘over-provision’ which can damage market certainty and leave a
legacy of redundant and undeveloped land sometimes in unsustainable
locations;
iv there are challenges around the reconciling gross and net take up rates,
and there is some uncertainty over the consistency of definition between
districts that NLP has not been in a position to validate
v it takes no account of future local land use patterns and the future
availability of land other than insofar as they are reflected by past take-
up rates;
Greater Manchester Employment Land Position Statement
P47/70 40658/700918v1
vi the issues of ‘landless growth’ were not able to be considered, and
although data limitations prevent a definitive conclusion on how
significant this could be across Greater Manchester, this has the
potential to contribute towards meeting future employment needs.
Evidence suggests ‘landless growth’ has been a feature of the Regional
Centre and that there is also potential in Trafford, Salford and Stockport
in particular. Further work is needed to validate these conclusions
however;
vii it does not reflect the potential impact of changes in the economy over
the coming years, including the way in which the sectoral mix (with
different space requirements) may evolve, impacting on the type of
premises required and the extent to which B1, B2 and B8 land is
actually needed; and
viii the application of the 20% flexibility allowance is inconsistently applied
across the districts, and not evidenced.
b The use of GMFM employment forecasts as an approach to looking at
Greater Manchester-wide requirements on a consistent basis is a helpful
reference point for considering employment land take-up, but is not in itself
a direct proxy for employment land requirements – although it does highlight
that some districts in GM are projected to see significant reductions in
employment in sectors that traditionally required significant land allocations.
c Equally, because the ODPM guidance on local Employment Land Reviews is
not prescriptive (and in the absence of a GM-wide framework for undertaking
ELRs), the local assessments prepared by Districts are not, at the current
time, prepared on a sufficiently consistent basis to enable them to be
‘grossed up’ to present a Greater Manchester-wide estimate of the
requirement. Nor do they necessarily provide the basis for reconciling any
cross-boundary issues within Greater Manchester that might influence the
quantum of land required. This is not an observation that invalidates any of
the current ELR work (NLP was not appointed to critique or test each ELR),
but does point to the difficulties in collectively using the ELR evidence base
as a single interpretation of the RSS W3 figure.
d There are few currently available robust alternatives to the approaches
outlined above (i.e. projecting forward adjusted past take up rates and
econometric forecasting) in determining the employment land requirements
of Greater Manchester.
e There are mixed views among stakeholders as to the approach that should
be adopted, and how individual districts should plan for the future needs of
the economy in terms of employment land, including on matters such as the
flexibility allowance.
7.5 The above are important drivers of the ability of the study to arrive at definitive
conclusions on employment land provision in Greater Manchester.

Greater Manchester Employment Land Position Statement
P48/70 40658/700918v1
Making an Estimate of Future Requirements
7.6 In this context, there is no single point of evidence that leads to either a simple
validation of the RSS W3 figures or to a consistently derived alternative to it.
Within the ambit of NLP’s work, there is no benefit in seeking to ‘distribute’ a
fixed requirement based on the RSS W3 figures between authorities within
Greater Manchester – such an approach would lead to perverse outcomes.
However, it is possible to review the various components of evidence and draw
conclusions, based on high level judgements on the potential implications and
appropriateness of different quantums of provision, which are effectively a
range ‘book-ended’ by:
• the outputs of the RSS methodology (as updated);
• the ‘need’ defined by the local ELR; and/or
• the potential supply.
7.7 In doing so, NLP has arrived at an indicative conclusion on where within (or
conceivably above or below) this range future provision should be pitched in
interpreting the RSS W3 policy in Greater Manchester. In doing so, it is
cognisant of the factors (and data limitations) highlighted earlier in this section,
and should be interpreted accordingly.
7.8 It is recognised that Policy W3 of the RSS requires individual districts to derive
an extra allocation of 536ha/917ha based upon the difference between the
total supply of employment land in 2005 as set against the total projected
demand for the sub-region (including both the 6% growth and the application of
the 20% flexibility factor). However, it is suggested that such an approach
would be inappropriate given that:
• the total supply figure quoted in the RSS for 2005 is outdated;
• an inconsistent approach has been taken as to what constitutes ‘total
supply’ in the GM authorities’ AMRs;
• the ten districts have not applied the 20% flexibility factor on a consistent
basis; and
• different approaches have been followed when calculating and justifying an
appropriate level of ‘need’ for each individual authority; this has not always
involved a strict re-interpretation of the RSS approach, for reasons
discussed in Table 11 and Table 12 below.
7.9 The schedule below, populated on the basis of a district-by-district analysis set
out in Appendix 5 (which draws together a number of outputs from the
preceding analysis in the report) provides a summary of the key factors used by
NLP in its analysis, and outlines the NLP conclusions for each District. The
analysis is grouped under:
• Employment Land Indicators
• Economic Drivers
• Implications and Conclusions.
7.10 Reflecting the availability of evidence, and the absence of local level appraisal
of individual ELRs or the sites identified within them or the basis for their

Greater Manchester Employment Land Position Statement
P49/70 40658/700918v1
estimates of need, the conclusions drawn by NLP are expressed as a range or
are subject to +/– 10%.

Greater Manchester Employment Land Position Statement
P50/70 40658/700918v1
BOLTON BURY MANCHESTER OLDHAM ROCHDALE SALFORD STOCKPORT TAMESIDE TRAFFORD WIGAN GM TOTAL
Current RSS Policy
W3 Requirement (with
20%)A
2,257 (2,709)
Future RSS Policy W3
Requirement (with
20%)B 247 (296) 108 (129) 220 (263) 175 (210) 195 (234) 166 (199) 161 (194) 130 (156) 357 (429) 248 (297)
2,006 (2,408)
ELR ‘Need’ (adjusted
to 2007-2026)c 175-195 77 197-249 133-138 210-215 124-244 138 249 100-170 265-304 1,668 – 1,979
Use of 20% Flexibility
Margin in ELRD YES NO YES NO YES NO NO YES NO YES -
Employment Land in
AMRs E 103 48 164 80 175 123 61 74 132 212 1,172
Potential Supply F 221 92 551 69 205 198 101 94 284 275 2,090
Potential Supply of
land as a % of GM
Total G
11% 4% 26% 3% 10% 9% 5% 5% 14% 13% 100%
Potential Supply in
Green Belt (% total) H 97 (44%) 13.51 (15%) 0 (0%) 5.4 (7%) 36.8 (18%) 40 (23%) 0 (0%) 20 (21%) 0 (0%) 40 (15%) 252.71 (14%)
Em
plo
ym
ent
Land I
ndic
ato
rs
Over/under provision
(Potential Supply v.
mid-range ELR ‘Need’)I
<20% Over Supply <20% Over Supply >20% Over Supply >20% Under Supply <20% Under Supply <20% Over Supply >20% Under Supply >20% Under Supply >20% Over Supply <20% Under Supply -
% of current GMFM
B1/B2/B8 Jobs
(2007) J
9% 4% 26% 6% 6% 10% 11% 6% 13% 8% 100%
Future B1/B2/B8 Job
Growth 2007-26
(GMFM Nov 2008) K
-2,800 -3,000 28,300 -3,700 -1,000 3,100 -900 -5,200 3,200 -1,400 16,600
Future Job Growth
Rank (GMFM Nov
2008) L
7 8 1 (highest) 9 5 3 4 10 (lowest) 2 6 -
Inward Investment
Potential M Moderate Moderate Higher Lower Moderate Higher Higher Lower Higher Moderate -
Landless Growth
Potential N Lower Moderate Very High Lower Moderate Higher Moderate Lower Moderate Lower -
Econom
ic D
rivers
Economic Growth
Potential O
Lower, mainly in
industrial sectors;
potential for further
B2/B8 growth
along motorway
network
Lower; GMFM
growth projections
suggest weak
prospects for key
sectors in the GM
context, although it
is recognised that
the district does
have significant
industrial clusters
in the food and
drink, healthcare
and bio-technology
and ICT/digital
sectors.
Very high, with
strong growth
projected in high
value professional
services driving the
sub-regional
economy.
Investment in
Manchester
Universities and
Hospitals along the
Oxford Road
Corridor.
Lower; strong
representation in
declining industries
Moderate; potential
for growth in
logistics and
employment at
Kingsway.
Higher; major
concentration of
media-related and
other knowledge-
based industries.
As with
Manchester, strong
growth projected in
high value
professional
services driving the
sub-regional
economy.
Development of the
Inter-modal freight
terminal may also
significantly impact
future demand.
Higher; suitable for
ICT/digital cluster
development and
financial and
professional
services, with
positive growth
forecasts in key
sectors.
Lower; weak growth
forecasts and over-
reliance on existing
declining industries
Moderate/High:
strong prospects
for growth in
established
industrial areas.
Moderate;
potentially well
suited for logistics
if accessibility
issues can be
resolved, alongside
traditional
engineering and
manufacturing
industries
-

Greater Manchester Employment Land Position Statement
P51/70 40658/700918v1
BOLTON BURY MANCHESTER OLDHAM ROCHDALE SALFORD STOCKPORT TAMESIDE TRAFFORD WIGAN GM TOTAL
Barriers to
Employment Land
Take Up P
Substantial
proportion of
forward supply
reliant on Green
Belt site (Cutacre)
coming forward
Currently a limited
supply of large
B2/B8 sites in key
locations, although
this reflects
district’s drive for
future B1
development.
Industrial estates
in need of
investment and
restrictions on title
constrains
occupiers; lack of
available industrial
units in prime
locations
Long term
ownership of
certain sites makes
availability difficult.
Pressure for higher
value uses.
Significant under
supply of
unconstrained
sites.
Slight majority of
B1/B2/B8 supply
located at
Kingsway– lack of
available freeholds
and expense of
sites is delaying
progression.
High
Demand/Limited
supply of good
quality B2/B8 land
– reliant on
recycling of existing
sites
Delays to STC’s
development
following withdrawal
of Lend Lease.
Undersupply of
large 5ha+ sites.
Lack of quality,
modern,
accommodation.
Severe pressure on
many former
employment sites
for redevelopment
Lacks a focus
destination for
offices and a
distinct offer from
Manchester /
Salford. Green Belt
constraints.
Severe east/west
congestion.
Struggles to meet
enquiries for large
12ha+ sites. Many
existing sites
constrained.
-
Effects of providing
less/more land than
may be required (i.e.
the possible harm of
under and over
provision) R
Relatively modest
growth projections
indicate a need to
avoid oversupply to
prevent a situation
whereby market
confidence and
certainty in the
priorities for growth
is undermined.
Nevertheless, the
prospect of
substantial Green
Belt sites coming
forward in their
entirety over the
plan period is
uncertain and could
justify the provision
of a broader range
of sites.
Weaker growth
projections and
lower past take-up
rates suggests that
an oversupply of
sites could be
counter-productive
to the district’s
growth aspirations;
focus would be
more appropriately
centred on
provision of good
quality sites for B1
uses, given
constrained volume
of sites.
Very strong
economic growth
prospects in key
sectors and strong
demand for a
variety of
employment types
in the Regional
Centre suggests
that restricting the
supply of sites
below that
suggested by job
growth/past take-
up rates could have
a detrimental effect
on the sub-regional
economy. Evidence
of landless growth
may, however,
temper the need for
excessive
allocations.
Weaker growth
projections, low
past take up and
severely
constrained volume
of sites suggests
that an over-
provision of land
would dent market
confidence, leading
to increased
vacancy levels and
could require less
sustainable
greenfield releases.
Despite slightly
negative GMFM
growth projections,
the district retains
market confidence
in a number of
growth sectors
such as logistics,
which a good
supply of greenfield
sites with prime
motorway access
should address.
Providing less
supply than the
forecast ‘need’
would put
increased pressure
on Kingsway to
come forward in its
entirety over the
plan period.
Stronger economic
growth potential
and developments
such as Media City
demonstrate
investor confidence
in the Regional
Centre. Restricting
the supply of sites
could force inward
investors
elsewhere,
although issues
such as landless
growth and the
‘recycling’ of
existing
employment land
guard against
excessively
optimistic levels of
provision.
Reasonably strong
growth projections,
particularly for B1
and B8 industries,
suggest a need to
avoid an overly
constrained
portfolio. However,
green belt
restrictions,
combined with the
fact that past take
up rates are
unlikely to be
reliable due to shift
from B2/B8 to
office, would
temper ‘need’
projections. Town
centre proposals
are also likely to
increase landless
growth in future,
providing a further
argument against
over provision.
Very Poor GMFM
growth forecasts
for the future
suggests against
providing too much
B2/B8 land overall
in future as this
could undermine
market certainty on
which locations
have genuine
potential.
However, there is a
general imbalance
of land across the
Borough, which
could justify a need
for new greenfield
releases in areas
such as Hattersley.
Reasonably strong
growth forecasts
and strong
established
industrial areas
indicate a need to
avoid under-supply.
However, the very
high past take up
rates in recent
years have been
skewed upwards by
a few large
developments and
may not reflect
longer term trends,
hence demand
estimations based
on recent trends
should be
approached
cautiously.
Moderate
prospects for
growth, large tracts
of existing
constrained sites
and negative
perceptions of the
district following on
from its industrial
past initially
militate against
future over
provision as this
could undermine
market certainty on
the genuine
priorities.
However, measures
seeking to restore
market confidence,
such as investment
in new, good quality
sites and transport
investment to
reduce congestion
are likely to justify
a significant supply
of employment
sites.
-
Conclu
sio
ns
Summary
Recommendations on
employment land
‘need’, by District,
2007-2026 S
195ha (+/- 10%) 77-92ha 197-249ha 69-133ha 210-215ha 199-244ha 101-138ha 94-130ha 170ha (+/- 10%) 297ha (+/- 10%) 1,609 – 1,863
Table 11 Conclusions on Employment Land Provision

Greater Manchester Employment Land Position Statement
P52/70 40658/700918v1
Key to Table 10:
A Based on take up data collected by NWRA as part of the 2005 Regional Employment
Land Study, incorporating 6% growth in take up, taken forward 19 years (20% flexibility
factor in brackets).
B Based on 5 yr annual average take up rate as sent to Urban Vision by GM authorities
in 2009, incorporating 6% growth in take up, taken forward 19 years (20% flexibility
factor in brackets).
C Summary of the employment land demand projections as summarised in the
respective ELRs for each of the ten GM districts. In the case of Manchester, Rochdale,
Tameside and Wigan, the ELR figures have been increased / decreased pro-rata to
ensure a consistent timeframe across the sub-region.
D Clarifies whether or not the ‘need projections calculated in the respective ELRs
incorporated a 20% flexibility margin as recommended in the RSS. Note: as regards
Salford, whilst the consultants undertaking the ELR did acknowledge the need for it in
their analysis of GMFM forecasts, the 20% figure was not included in the ultimate
demand conclusions.
E Summary of the current situation regarding the ‘committed’ employment land supply
as taken from the 2007/08 AMR for each district. For the avoidance of doubt,
‘committed’ employment land is generally taken to mean land with either an allocation
for employment use in an adopted UDP/Local Plan/LDF document, or which has an
extant planning permission for employment use. There is some variation reflected in
the AMR figures, discussed in further detail in Section 6.0.
F The ‘Potential Total Supply’ figure represents an aspirational figure that could be
achieved if the ELR recommendations are followed through for each District. It also
factors in officer’s aspirations for their districts based on the stakeholder discussions
undertaken as part of this study.
G Potential supply of land as a % of sub-regional total.
h Amount of potential land identified in Row ‘F’ that is currently allocated Green Belt
land (and % of total).
I Over/under provision of employment land based on the ‘Potential Supply’ in row F, set
against the identified ELR ‘Need’ in row C (using the mid point if a broad range was
identified).
J Based on the November 2008 run of the Greater Manchester Forecasting Model, the
number of B1/B2/B8 jobs in each district for 2007 was calculated. Para. 5.18 details
the assumptions made regarding the relationship of the various industrial sectors to
the land use classes. Figures in red denote below 5%; figures in green relate to
percentages over 10% of the sub-regional total.

Greater Manchester Employment Land Position Statement
P53/70 40658/700918v1
K Presents a calculation of the job growth forecast in the B1/B2/B8 sectors following
the November 2008 run of the GMFM, between 2007 and 26. Figures in red denote
over 1,000 decline; figures in green denote job growth over 1,000.
L District sub-regional ranking, based on results of row K.
M Inward investment based on a qualitative judgement incorporating stakeholder
discussions and baseline review of Economic Strategies and Policy documents,
including MIER. Judgement includes the availability of sites likely to be suitable for
inward investment opportunities.
N Potential based on landless growth discussion presented in Section 4.0, with ‘lower’,
‘moderate’ and ‘high’ judgements made in the Manchester sub-regional context.
O Economic Growth potential reflects a variety of factors including stakeholder
discussions and the report by Arup & Donaldsons on behalf of Manchester Enterprises:
Demand for Employment Land in Greater Manchester (2006)
P Identification of potential barriers to employment land take up, informed by
discussions with key stakeholders and planning policy officers and resulting from a
review of each District’s ELR.
Q Minimum / maximum employment land needs based on the Future RSS Policy W3
requirement (with or without the flexibility factor) and the ELR ‘Need’ adjusted to 2007-
2026.
R Summary of the implications and/or risks from over or under providing employment
land in each district.
S Summary recommendations on employment land ‘need’, providing a reasoned
response to the employment land requirements for each District based on the
information presented in rows A-R

Greater Manchester Employment Land Position Statement
P54/70 40658/700918v1
7.11 The outputs and reasoning for each local authority area from the exercise
above are summarised in Table 12:
LP
A
Conclusion Reasoning
Bolto
n
195ha
(+/- 10%)
Bolton has retained its strength in a variety of manufacturing sub-
sectors, although the GMFM projections forecast continued losses in
B2 employment which may dampen future demand. Whilst there has
been considerable out-of-centre development at relatively low densities
in recent years, the future focus is likely to be on higher density office
development in central locations, which is receiving substantial public
sector support. There also remains potential for further B2/B8
development alongside the motorway network.
Consequently, whilst past take up rates may not reflect the future
direction of economic growth in the district, it is suggested that a
supply of employment land commensurate with the top end of the ELR
need forecasts, i.e. 195ha (including the 20% flexibility factor), be
provided. This represents a reasonably close match with potential
supply, albeit with the caveat that 97ha of this supply comprises a
Green Belt allocation that has consequent uncertainty as to whether it
will come forward for employment use in its entirety over the plan
period.
Bury
77-92ha
Whilst Bury has one of the lower growth projections in the sub-region
based upon the GMFM forecasts, particularly in Business Services and
other B1-class sectors, it has been successful in attracting a number
of ICT/communications businesses in recent years and research has
suggested that there are further opportunities to develop food and
drink, healthcare and biotechnology clusters in the district.
Past take up rates in the district have traditionally been the lowest in
Greater Manchester, with few very large sites coming forward for
employment uses in recent years; the Borough also has the smallest
portfolio of committed employment sites in GM. However, as identified
in the ELR, whilst there may be limits to the quantity of land likely to
be available in Bury, a new portfolio of good quality sites has been
identified to meet forecast demand, particularly in the B1 growth
sectors.
Consequently, on balance, a narrow range of demand projections are
suggested, from the 77ha recommended in the ELR, to the 92ha which
would comprise the potential land portfolio identified through the
ERLR, together with the additional sites identified through the ‘Bury but
Better’ study. This is slightly lower than past take up rates would
suggest; however, this takes into account the continued restructuring
of the local economy towards higher density B-class uses. It is
considered difficult to justify significantly higher levels over and above
the +/-10% margin, given forecast demand.

Greater Manchester Employment Land Position Statement
P55/70 40658/700918v1
LP
A
Conclusion Reasoning
Mancheste
r
197-249ha
Manchester City is underpinned by strong concentrations of higher
value economic sectors. Financial and Business Services are currently
well represented in the City, whilst media and creative industries are
focused in City Centre fringe locations such as the Northern Quarter.
Health and life sciences are also well represented, particularly along
the Oxford Road Corridor. The 2008 GMFM model run forecasts
continued strong growth in the Business Services sector in Manchester
City, with the area accounting for 58% of net job growth in the sub-
region.
However, it is apparent that although the number of jobs based in the
Regional Centre has increased dramatically, this has not led to a
commensurate take up of employment land at traditional densities.
The Business Services sector is likely to be the prime driver for
economic growth in the period to 2026 and it seems realistic to
assume that job densities will remain high or even increase further.
In summary, whilst the GMFM growth forecasts are by some margin the
strongest in the sub-region, the very high prospects for higher density
and landless growth are likely to ensure that much of the job growth is
unlikely to translate into land requirements using ‘traditional’ job
densities and plot ratios. Consequently, even though the ELR
projections of 197-249ha (increased pro-rata to accommodate a
common time period and including the 20% flexibility factor) are
somewhat lower than past take up might suggest, they are considered
a realistic proxy for future need.
Old
ham
69-133ha
Oldham retains its strength in a range of manufacturing subsectors,
particularly mechanical and electrical engineering, with future target
sectors including ICT, digital engineering and cultural industries,
although it has the second lowest growth projections overall in the sub-
region, particularly in the B1-use classes. Considerable transport
investment may improve the attractiveness of the district to new
industrial users, although sites within the town are limited due to the
preponderance of constrained existing industrial areas/mill buildings
whose re-use/intensification is constrained by viability factors.
Oldham also has an opportunity to link to the regional centre with an
arc of opportunity which links established employment areas in the
district to Foxdenton strategic site and the hi-tech proposals for
Chadderton Technology Park.
However, it is recognised that land within Oldham is a particularly
scarce resource, with Green Belt restrictions and topographical issues
severely constraining the amount of greenfield land that could be
released for employment development in future.
In summary, due to very limited available land supply and GMFM
forecasting c.3,700 net job losses, it is considered inappropriate to
plan for excessive need based on past take up; a range of demand
projections are therefore suggested, between the current supply of
sites (69ha) to the lower end of the ELR demand projections (133ha).

Greater Manchester Employment Land Position Statement
P56/70 40658/700918v1
LP
A
Conclusion Reasoning
Rochdale
210-215ha
Rochdale is forecast to retain its strength in a range of manufacturing
sub-sectors, including mechanical and engineering. Despite the
slightly negative net GMFM job forecasts, It is suggested that there
remains considerable potential for growth in the logistics sector, whilst
Kingsway also represents an excellent opportunity to develop customer
contact and shared service centres as a business function.
Whilst it is recognised that the district has one of the largest
employment land portfolios in the sub-region, it remains restricted in
the amount of additional greenfield land that could come forward on
top of the existing land supply, a large proportion of which is greenfield
(with 18% in the Green Belt).
Although the ELR projections of 210-215 relate to the time period
2005-21, it is considered that they retain their relevancy over the
longer 2007-26 time period, as the severe recession has resulted in a
marked reduction in new B1/B2/B8 development in the past year.
The 210-215ha range (including the 20% flexibility factor) achieves an
appropriate balance between ensuring that Rochdale avoids a situation
of oversupply that could detract from the delivery of Kingsway, whilst
ensuring the need to allow a sufficient supply of additional land if
Kingsway (in particular its provision for B8) is taken up over the course
of the plan period.
Salfo
rd
199-244ha
The district has highly positive job growth forecasts and stronger
economic prospects and is progressing a number of significant
proposals that could have major implications for the demand for
employment land within the city, including those throughout the
Regional Centre and Port Salford to the west.
It is of further note that Salford’s ELR highlights qualitative constraints
with the existing supply of employment land which may have acted to
dampen past take up rates, which proposals in the city’s emerging
Core Strategy are seeking to address.
Whilst the Regional Centre initiatives are likely to include significant
development densities, the impact these could have over what has
happened in the past, together with the potential for logistics growth,
leads NLP to the conclusion that a requirement derived from the RSS
method should be considered to be a minimum, given that it is
primarily based on past trends. Given the City’s strategic role as part
of the Regional Centre, together with the key infrastructure to support
logistics uses in particular, the city should be providing a supply of
land in the range between 199ha and the top end of their ELR, giving a
range of 199 to 244 hectares.

Greater Manchester Employment Land Position Statement
P57/70 40658/700918v1
LP
A
Conclusion Reasoning
Sto
ckport
101-138ha
There will be a major drive for office accommodation in Stockport Town
Centre, targeting education and science sectors. MIER projects that
Stockport will experience a growth in creative and digital industries in
future, to complement the existing concentrations of financial and
professional services satellite operations and ICT/communications
businesses operating from out-of-town locations in the district.
GMFM projections indicate continued B2 decline balanced by moderate
forecast growth in B1 and one of the higher growth forecasts for B8-
related industries. Stockport has traditionally experienced high levels
of B2/B8 industrial development coming forward, at relatively low
densities; however, given the restrictions on greenfield land release in
future and the drive for town centre development, it is likely that the
recycling of existing sites and higher density office development will
take place on an increasing scale.
Consequently, although Stockport has reasonably strong growth
prospects, the district’s limited supply of land, the ongoing recession
and the changing composition of developments (i.e. B1 rather than B2)
caution against the use of overly optimistic land projections and the
simple projection forward of past rates; hence a broad range is
recommended, from the existing potential supply (101ha) to the 138ha
recommended in the ELR.
Tam
esid
e
94-130ha
Potential growth sectors seek to build on established clusters,
including engineering and food sectors, although these are currently
contracting rapidly. The main opportunity for high quality office
development is likely to comprise Ashton Moss Strategic Site and
specifically the St Petersfield area, although landless growth
opportunities as a whole are likely to remain limited. Tameside is the
only GM district with negative net overall employment growth forecasts
in the 2008 GMFM.
The District also has a limited supply of sites due to constraints, whilst
a high number of employment sites have been lost to alternative uses
in recent years.
Consequently, the implications of contracting established industrial
sectors, limited supply of sites and the considerable pressure on
existing employment sites for alternative higher value uses guard
against an over provision of land, although the district may still require
limited new allocations in selected locations to ensure a balanced
portfolio across the district. In the absence of a detailed ELR forecast,
it is therefore recommended that a range of projections be used for
Tameside, ranging from the potential supply of 94ha to the lower end
of the NWRA RSS ‘need’. It is suggested that the application of an
additional flexibility factor of 20% would not be suitable in this instance
for the reasons highlighted above.

Greater Manchester Employment Land Position Statement
P58/70 40658/700918v1
LP
A
Conclusion Reasoning
Tra
fford
170ha
(+/- 10%)
MIER acknowledges that parts of Trafford outside of the Regional
Centre retain strengths in a diverse range of manufacturing subsectors
including food and drink and high value niche specialisms.
Additionally, there are concentrations of logistics activity focussed
around the M60. There are further opportunities to develop the
capacity of the Trafford Park Core Industrial area as a sub-regional
resource providing sustainable long-term employment growth
opportunities to support economic regeneration, improved skills levels
and development within and beyond the Borough. Other than
Manchester City, Trafford has the highest job growth forecasts in the
GMFM in the sub-region.
Consequently, it is suggested that the top end of the ELR projections
be used to estimate ‘need’ for the period 2007-26. The figure of
170ha reflects the highly positive growth forecasts in key industrial
sectors, whilst the non-application of the 20% flexibility factor can be
justified on the grounds that the availability of alternative greenfield
sites is limited, whilst most criteria used for location by sector are the
same. Whilst this figure is well below what recent past take up rates
might suggest, it is noted that a ‘blip’ in recent development rates has
distorted the short term picture; hence allocations above 170ha in
response to perceived demand should be treated with caution.
Wig
an
297ha
(+/- 10%)
Wigan has one of the larger portfolios of employment land sites in
Greater Manchester, although many sites suffer from an insufficiently
broad offer and there is a clear requirement for a higher quality
portfolio to attract under represented sectors such as knowledge-
based industries. The GMFM growth projections indicate ongoing
declines in B2 manufacturing offset, to an extent, by relatively strong
growth in B1.
Poor internal road infrastructure has resulted in high levels of
congestion, particularly on the east/west axis, with the result that a
high proportion of existing employment sites have poor accessibility
and low market attractiveness. However, the substantial transport
investment programmed for the district seeks to ameliorate this
congestion and this, aligned with the emerging Core Strategy’s
proposed allocations of new strategic sites, is likely to significantly
enhance the attractiveness of the district as a business destination.
Given positive growth prospects, significant ongoing private sector
investment in B2/B8 development, improved transport links and the
substantial potential supply of better quality land, it is reasonable to
assume the continuation of recent take up rates, incorporating the
20% flexibility factor, as a proxy for future demand (equal to 297ha).
This figure also represents a reasonably close correlation with the Core
Strategy’s target land supply and the top end of the ELR projections.
GM
Tota
l
1,609-1,863
Table 12 Reconciliation with RSS W3
7.12 In general terms, recognising the limitations of the evidence available to NLP,
the following conclusions can be drawn:
1 The evidence within this Position Statement point to Greater Manchester
making indicative provision for 1,609 – 1,863 ha of land for the period

Greater Manchester Employment Land Position Statement
P59/70 40658/700918v1
2007-26 rather than the 2,285 proposed for the period 2005-21 in the RSS
Policy W3;
2 There appears to be limited correlation between the RSS figure (both
original and if updated) and some of the local ELR outputs to some of the
core economic drivers (e.g. as illustrated by GMFM outputs);
3 Indicative estimates of employment land provision for each district are
based on a judgement as to the balance of available evidence at a GM
level supporting the different approaches to estimating land requirements.
In some cases this is the RSS-based estimate; in some cases the outputs
of the ELR; and in other examples, it is the potential current supply that NLP
has judged to be a best fit with future requirements.
4 Notwithstanding the limited evidence available to arrive at precise
alternative estimates of employment land provision in each district, NLP’s
judgement is that there is merit in a number of locations providing for less
land than the RSS estimated, and this need not have any material impact
on the ability of that location to deliver economic growth provided that the
range and choice and quality of sites is a good fit to the future shape of the
economy and that the potential for landless growth is properly realised.
Indeed, there will be advantages in some locations of reducing land supply
and providing a credible and attractive portfolio to the market.
5 Districts’ take up rates are likely to include windfall developments and this
will have influenced the RSS requirement. However, by its very definition,
planning for windfall developments in district LDFs is problematic and
difficult to include in overall supply figures;
6 In some cases, NLP’s view is that the local ELR estimate appears to be
putting forward a requirement that is disproportionate to the scale of
economic opportunity and forecast employment growth, and that a further
consideration of need estimates may be appropriate. In those
circumstances, the NLP conclusion is that a requirement range set between
the existing supply and the ‘need’ defined by the ELR might be appropriate.
7 It will be open to individual local authorities to consider their requirements
further and it may be that their conclusions differ from those of NLP,
drawing on local evidence that was not available to NLP in considering the
issue at a GM level.
Key Issues for Further Consideration
7.13 The above represents a statement of the position, based on the drawing
together (for the first time) of the available evidence on employment land
provision across Greater Manchester. The findings, particularly the indicative
estimates of how RSS Policy W3 should be interpreted, should be regarded as
a starting point for further analysis and consideration, based on the evidence
available to this study at a GM-wide level. Future work will need to be
considered, at least part of which should be within the framework for
conducting Employment Land Reviews set out in Section 7.0 of this report.
7.14 The key issues for further consideration in taking forward these outputs are:
a The need to increase consistency in the approach to local ELRs;

Greater Manchester Employment Land Position Statement
P60/70 40658/700918v1
b The opportunity to achieve integration of MIER outputs to planning for
employment space;
c The need to make an allowance for windfall employment land developments;
d Further evidence on the impacts of recession and the legacy in terms of
structural economic changes and provision for employment space;
e Further considering the Impacts of economic change on land use
requirements and change (including the impact on occupancy, use, and
recycling of existing employment land and premises);
f Clarifying better the evidence around gross and net take-up and what that
means for future provision;
g Increasing the availability and quality of evidence to support the potential
scope and role of ‘Landless growth’ in meeting future space requirements
h Integration and reconciliation of cross-boundary issues within Greater
Manchester
i The extent to which past rates and blanket GVA multipliers should be used
in isolation by RSS to underpin future provision in light of a – h above

Greater Manchester Employment Land Position Statement
P61/70 40658/700918v1
8.0 Deriving a Consistent ELR Methodology for
Greater Manchester
8.1 A key output of this study involves the development of a set of
recommendations for a co-ordinated and consistent future approach to
Employment Land Reviews and monitoring across Greater Manchester. Clearly
the two are inter-related; a method for appraising future demand can only be
consistently realised if data collection records similar information across all ten
districts. Consequently, on the basis of the work undertaken to date;
discussions with Council Officers and reviews of the available ELRs, this
section provides a broad methodology capable of being put into practice by
each individual district in Greater Manchester. It is not, however, intended to
form a rigid structure, and clearly individual studies will need to be tailored to
meet local needs and circumstances where appropriate.
Consistency and Flexibility – Striking a balance
8.2 This section puts forward a broad methodology for future ELR work and
monitoring best practice for all ten Districts in the sub-region. This has involved
the consideration of the following:
• The 2004 ODPM guidance on undertaking ELRs, specifically the three stage
assessment process and broad stages therein;
• The emerging findings of the Roger Tym & Partners Report for CLG (January
2009): ‘Delivering Land for Economic Development’;
• The methodologies of the ELRs undertaken for each of the ten authorities in
the sub-region to highlight commonalities and innovative approaches that
could coalesce into a definitive approach;
• Current government guidance on Business Development Monitoring as
established through the RSS and LDF Core Indicator update – this identifies
three relevant indicators, concerning the total amount and type of
completed employment floorspace (gross and net); the amount coming
forward on previously developed land; and the total amount and type of land
currently available;
• The Districts’ current and potential use of employment floorspace outputs
from the GMFM.
8.3 The starting point for deriving a common ELR methodology is the 2004 ODPM
ELR guidance, known as the ‘Brown Book’. This provides step-by-step
instructions on how to produce an ELR set within three main stages: taking
stock of the existing situation; creating a picture of future requirements; and
identifying a ‘new’ portfolio of sites. However, the guidance does provide
flexibility and is not prescriptive, particularly in terms of precise methods of
data collection and particularly demand forecasting, with no one method
preferred over alternatives. Indeed, the guidance advocates the use of a
variety of approaches, noting that ‘the assessment of requirements and the
means of meeting these depends on professional judgement and local
Greater Manchester Employment Land Position Statement
P62/70 40658/700918v1
interpretation’. The actual mechanics of translating employment and output
forecasts into land requirements are also given little detailed consideration,
with the guide referencing a number of ‘good practice’ examples for further
detail.
8.4 The recent Roger Tym & Partners Report for CLG noted that the 14 tasks
outlined in the Brown Book were poorly understood and not followed in detail by
Local Authorities, with a wide variety of approaches and techniques leading to a
confused overall response. However, in Greater Manchester it is apparent that
the districts have employed broadly similar methodologies in appraising the
sites and forecasting demand requirements.
8.5 Nevertheless, Section 5.0 of this Report identifies a number of important
differences in the approaches used to derive the final demand projections
across the ten authorities which make it difficult to provide a consistent GM
picture or to understand the reason for differences between districts. These
include:
1 the often unsubstantiated use (or exclusion) of the 20% flexibility factor;
2 inconsistent time horizons;
3 different approaches to application of past take-up rates, GMFM model runs
and approaches to scenario testing;
4 differences in employment densities and plot ratios;
5 inconsistency or absence of ‘landless growth’ considerations;
6 varied approaches in converting ‘net’ to ‘gross’ requirements; and
7 inconsistency in mapping sites and storing/presenting site assessment
information.
8.6 Different regions/sub-regions have adopted consistent approaches to
Employment Land Review work. Some of these approaches/methodologies,
whilst providing comprehensive guidance, can risk the application by rote of
approaches that do not reflect specific circumstances within individual
localities. The challenge for Greater Manchester is in striking a balance
between, on the one hand:
• Maintaining consistency to a) take advantage of the investment made in
GM-wide economic intelligence and b) so that there is confidence in being
able to aggregate and synthesise and interpret the results at a GM-wide
level without needing to interrogate or re-run local assumptions; and on the
other
• Providing sufficient flexibility for localities to respond to their own economic
and land use circumstances.
8.7 This section proceeds to identify a common general structure and approach
that could be successfully combined across all ten local authorities. This is not
rigid; in particular, there is a high degree of flexibility in the fine detail of the
demand calculations which could remain specific to each individual district.

Greater Manchester Employment Land Position Statement
P63/70 40658/700918v1
8.8 There is a separate issue, outwith the scope of this Study (which focuses on
the issue of interpreting a GM response to RSS Policy W3) around the
methodological issues associated with:
• Alignment with the new Local Economic Assessment duty
• Flowing from Consultation Draft PPS4, the growing recognition of the need
to understanding and plan for a wider range of economic development uses
(including non-B-Class uses)
8.9 The above may be an issue for AGMA to consider further.
Broad Methodology for Undertaking ELRs in Greater Manchester
Stage 1: Taking Stock of the Existing Situation
Collate data on land stock and revealed demand
8.10 The LPA should undertake an initial quantitative assessment of employment
land (i.e. undeveloped land available for employment use, in hectares) and
employment premises (i.e. existing employment site floorspace, in sqm) in
each District and how this relates to the rest of the sub-region, identifying
changes in supply, vacancy rates, age of premises and amounts of losses and
emerging land/floorspace in the pipeline.
8.11 The assessment should include the following:
• Total employment land/floorspace by ‘B’ type;
• Change in employment land/floorspace by type (5 years+);
• Age of premises by type compared with regional average;
• Completion rate for new land/floorspace by type over last 10 years (if
available);
• Losses of employment land/premises by type over last 5 years+;
• Total employment land allocated, available, committed; and
• Amounts of employment land/premises and major developments in
adjoining districts.
Devise and Apply Site Appraisal Criteria
8.12 A degree of flexibility should be taken with regards to the derivation of a set of
criteria for appraisal of sites, tailored to the individual needs and aspirations of
each District. However, the appraisal form should seek to balance
sustainability and deliverability attributes and include criteria relating to:
• Strategic and local road access;
• Proximity to labour/services;
• Adjoining incompatible uses;
• Site characteristics/development constraints;
• Market attractiveness and deliverability.
8.13 Further criteria are provided in Annex E of the 2004 ELR Guidance Note.
Greater Manchester Employment Land Position Statement
P64/70 40658/700918v1
8.14 For transparency the assessment should be supplemented by guidance on
those factors that make up each of these criteria.
Undertake and Record Site Appraisal
8.15 All sites should be appraised via a combination of site visits and desk based
analysis incorporating GIS. Site visits should be undertaken by trained staff
using agreed criteria, supplemented by notes justifying each rating, alongside
photographs and GIS, to be stored on a spreadsheet/database. This should be
supplemented by a set of quantitative information concerning relevant factors
including planning status, land ownership, landscape designations, flood risk
etc. Where urban design/massing issues are relevant, a capacity analysis of
development potential may be appropriate.
8.16 The assessment should include the amount of land available (gross and net),
developable land remaining on each site and the likelihood/timescale for it
coming forward. Sites should be ranked on the basis of good, average, lower
quality ratings, with the bandings justified and supported by a ‘common sense’
check that sites are in correct category based on LPA knowledge of each site.
The rating of each site should support, rather than determine, the decision for
each site (e.g. there is a need for ‘lower quality’ sites as well as ‘good’ to cater
for different parts of the local economy).
Stage 2: Creating a Picture of future Requirement
Understand Market Areas and Segments
8.17 The study should establish local economic conditions and trends to provide
context for considering current deficiencies and future employment land and
premises needs, include brief analysis of following:
• Main employment centres within and adjoining the district;
• Main employers and types of sectors in the district;
• Knowledge based industries;
• Economic indicators (i.e. Employment growth (ABI); Self-employment levels
(Nomis); Breakdown of firms by size (no. of employees) (Nomis);
Unemployment rates (Nomis); wage and skill levels (Nomis); Commuting –
commuting flows and main sources/destinations (Nomis) etc).
8.18 The study should provide an assessment of the Commercial Property Market:
defining the extent of the property market within which the district lies and a
review of the demand/supply picture within that area. Property agency input
with relevant local knowledge as well as key economic stakeholders should be
encouraged.
8.19 Analysis should seek to identify key factors underling attractiveness / lack of
attractiveness of the district in economic terms; alongside a supply and
demand picture associated with employment land and premises.

Greater Manchester Employment Land Position Statement
P65/70 40658/700918v1
Select and Apply Suitable Forecast Model/Demand Analysis
8.20 ODPM Guidance recommends the use of a variety of methods to identify ‘need’,
but specifically past take-up rates, employment growth forecasts and labour
supply projections. This should be for a defined period consistent across GM.
There should be flexibility across Districts regarding the modelling used, whilst
the derivation of a requirement is a matter of judgement based on knowledge of
underlying economic circumstances of the locality, taking a realistic view of the
impact/benefits of interventions.
Estimating Future Requirements
Past-take-up
• Obtain net annual completion rates for different uses – B1 offices, B1c/B2
manufacturing, B8 distribution, ideally for 10 years;
• If only gross completions available, obtain annual losses of employment and deduct
to get approximation for net completions;
• Consider whether past rates need adjusting to reflect future growth needs;
• Project adjusted annual completion rate forward, by type of B use, to obtain future
needs.
Econometric Modelling
The Greater Manchester Forecast Model (GMFM) developed by Oxford Economics
should be used to provide employment forecasts by SIC sectors. The outputs are
readily available to all GM authorities and provide detailed employment forecasts to
2026.
A variety of model runs are available; clearly the most recent update should represent
the ‘baseline’ scenario; at time of writing, this would comprise the November 2008
model run, although a new update should be available in Summer 2009 which will
reflect the changing economic situation.
Labour Supply (more appropriate for areas with strong land constraints e.g. Green Belt)
• Estimate future resident population using housing targets or ONS forecasts;
• Apply % to obtain working age population;
• Apply economically active % to obtain working population;
• Apply % from ABI to get proportion likely to seek B Class jobs;
• Apply % for out-commuters;
Compare likely available labour supply with forecast increase in jobs.
Table 13 Estimating Future Requirements
Source: NLP
Quantify Employment Land Supply
8.21 This stage should refine the current ‘stock’ of committed employment land,
reconciling the AMR forward supply figures with the realities on the ground
following the detailed site appraisals. Existing supply of employment
land/premises should comprise existing developed or partly developed
premises, allocated land and undeveloped land with planning permission. The

Greater Manchester Employment Land Position Statement
P66/70 40658/700918v1
analysis should result in a set of figures indicating ‘unconstrained’ and
‘constrained’ employment land supply.
Translate Employment Forecasts to Land Requirements
Employment Forecasts to Land Requirements
Employment forecasts:
Based on the 23 SIC sector baseline forecasts from the most recent GMFM model run,
calculate job change in 3 main B sectors over the study period. Figures should be
adjusted to include / exclude from each sector as follows:
• B1(a/b) (Offices): Financial Intermediation and Business Services sectors;
• B1c/B2 (Manufacturing): 13 Industrial Sectors;
• B8 (Distribution): Proportion of ‘Distribution’ and ‘Transport & Communications’.
Derived from most recent ABI SIC4 level information obtained from NOMIS. Add to
Wholesaling (SIC 50-51) the following: SIC 60-64.
Conversion of Jobs to Floorspace
• Convert job change to B class floorspace using ODPM guidance ratios as follows:
B1 offices: 1: 19sqm; B1c/B2): 1: 34sqm; B8: 50sqm.
Plot Ratios
Plot ratios to assess land requirement from floorspace should be: B1c/B2 industrial:
0.4; B8 distribution: 0.4
For offices, a view should be formed on what % of new office development will be town
centre/infill and what % out-of-centre/business park, with bookend
• B1 offices (town centre): 2.0 (depending on nature of centre – more appropriate for
the Regional Centre)
• B1 offices (business park/out of centre) 0.4
Flexibility Factor
This involves the application of a percentage on top of the estimated amounts of land.
The RSS recognises that, exceptionally, there may be a need to provide additional land
to take account of special circumstances, such as the expansion requirements of a
particular business or the realisation of significant inward investment potential. If,
following a review of the land portfolio and demand requirements, this proves to be the
case for a GM District, an allowance for flexibility would need to be applied.
This should be factored into the ‘need’ projections through the incorporation of a
flexibility factor, which would have the effect of adding 20% to the employment land
requirement. Departing from this approach, either by not applying the 20% flexibility
factor or by applying a lower/higher figure, would need robust justification and evidence
to be demonstrated for each individual District.
Gross Land Requirements
The methodology outlined above will derive a ‘net’ employment land forecast, and in
many cases (particularly for B2), this may result in a negative net projection. For
planning purposes, it is therefore necessary to translate these into ‘gross’
requirements. This could simply involve applying the average amount of employment
land losses over the last 5-10 years, adjusting for likely changes envisaged (i.e. if a
case could be made that former mill buildings are unlikely to be lost at past rates due to
plateauing demand in the apartment market).
Table 14 Defining Land Requirements
Source: NLP

Greater Manchester Employment Land Position Statement
P67/70 40658/700918v1
8.22 There should be flexibility in the application of employment densities and
particularly plot ratios to suit the individual circumstances of the GM districts.
For example, it may be more appropriate for Manchester and Salford to use
200% plot ratios. The application of rates of past losses may need to be
adjusted according to individual circumstances.
8.23 The Issue of ‘landless growth’ needs to be addressed, particularly in the
Regional Centre – this may take the form of higher B1 office densities and a
sample approach to estimating development potential.
Scenario Testing
8.24 This is important for exploring the implications of different economic futures. It
is recommended that up to 3 scenarios are developed, based on the GMFM
baseline projections, which could be made up of different approaches set out
below or different assumptions of economic growth (potentially using earlier,
more optimistic, GMFM model runs). Other potential scenarios could include
those relating to changing patterns of commuting etc but do need to have a
rationale to them that is consistent with the evidence base.
8.25 The evidence supporting each scenario (and its implications) should be used to
arrive at a conclusion as to which growth scenario is the most appropriate for
the district.
8.26 A series of ‘reality checks’ should be applied to test the robustness of the land
projections. This could involve varying plot ratios to reflect higher
concentrations of high density office development; factoring in a greater degree
of ‘landless growth’ by increasing employment densities; applying higher (or
lower) flexibility factors; and considering the future growth of local labour supply
to test the amount of jobs and employment space that the demand projections
can support.
8.27 Flexibility in the approach to scenario testing and reality checks according to
the individual circumstances of each GM district.
Stage 3: Identifying a ‘New’ Portfolio of Land
Demand/Supply Balance
8.28 This stage would involve a comparison of the estimated future requirement for
employment land with current supply in order to identify whether more or less
employment land is needed in future, what type, and in what locations. It
should also consider the scope to release any surplus employment land
unsuitable for future needs.

Greater Manchester Employment Land Position Statement
P68/70 40658/700918v1
Identify additional land to be brought forward
8.29 Relevant only if a district has identified a shortfall of employment land over the
plan period, this penultimate stage would seek to identify potential new land if
a need for these has been identified.
8.30 Potential new land would be identified through (a) an earlier Council call for
sites; and (b) sites identified in the consultation/survey process through criteria
such as extension of existing employment areas, within or adjoining main
settlements, good access to main roads etc.
8.31 The potential of new land should be assessed using the same criteria as
existing sites. New land should be compared with potential candidates for
release among existing allocations to derive a new land portfolio to be taken
forward as part of the LDF.
Monitoring
Background
8.32 The ODPM document Local Development Framework Monitoring: A Good
Practice Guide states that “survey, monitoring and review are crucial to the
successful delivery of Local Development Frameworks.” Employment Land
Reviews have been prepared (or are currently being prepared) for nine of the
ten Districts within the study area.
8.33 It is essential that monitoring of the employment land situation is undertaken
by each District to establish what happens and to determine how each area
performs against the preferred scenario and whether any revisions are required
to LDF allocations as a consequence. This reality checking is important,
particularly in the later stages of the LDF, as econometric projections become
less reliable over longer time periods, and at a time of economic uncertainty.
8.34 The importance of effective monitoring even in the short-medium term has been
high-lighted by the current recession and the associated uncertainty over future
employment land requirements.
Core Requirements
8.35 An effective monitoring system should collect only information for which a clear
and necessary purpose has been identified. The monitoring approach should be
designed or adapted to meet the intended purpose. The amount of effort and
resources needed to obtain, update and analyse the information also need to
be balanced against its potential usefulness. This emphasises the need to
make full use of data which is readily available and practical to monitor,
particularly data already captured by the authorities.
8.36 In this context, the CLG Employment Land Review Guidance Note sets out the
minimum recommended employment monitoring to be undertaken by LDF

Greater Manchester Employment Land Position Statement
P69/70 40658/700918v1
Authorities, focused primarily upon information relating to the local supply and
demand. Some of these are already monitored by the authorities, but there is a
need to ensure greater consistency of monitoring outputs. Without a detailed
assessment of individual authorities’ current monitoring regimes, it is not
possible to make specific recommendations on an authority by authority basis.
However, drawing on the CLG Guidance, the core requirements are: -
• Employment permissions granted by type (recording B1a, B1b, B1c, B2, B8
if possible) including both floorspace and site areas. These can be obtained
from planning application forms and building control records;
• Employment permissions implemented by type and matched to allocated
land;
• The amounts of employment floorspace/land lost to other uses, based on
planning permissions for land and premises previously in employment use
for non-employment uses;
• Monitoring land available13 for development on allocated employment land
and other land with extant planning permission for employment uses.
8.37 As a minimum, each of the ten Local Authorities in the study area will need
systems to ensure they monitor the above. For consistency, there should be an
agreed approach to how the data is collected, analysed and presented.
Other Indicators
8.38 In addition to these core requirements, other potential monitoring indicators
would help provide a wider picture on the changing nature of the stock of
employment land, and also qualitative information about the nature of demand.
The need for these additional indicators should be considered on an authority
by authority basis, but include:
• Monitoring of net floorspace change within new employment developments
by comparison of existing and new floorspace, to help provide contextual
information on the extent of landless growth and the types of employment
premises/locations where it is occurring. This is likely to be a relatively
simple extension of the core monitoring requirements;
• Levels of vacancy within employment premises based on surveys,
commercial property websites and/or published market information where
available; and
• Enquiry levels for employment land and premises, by type and size band.
This can be obtained through regional inward investment data; and
• Employer requirements and aspirations, to be gauged via periodic business
surveys or an annual workshop/forum attended by occupiers, developers
and property agents.
13 Definition of ‘available’ employment land: All available land allocated for industrial uses excluding (a) expansion
land, (b) land with empty industrial buildings already in-situ, unless those buildings are time expired, and (c) special
sites allocated for specific employment uses, i.e. chemical works. This should also include land with extant planning
permission for employment use.

Greater Manchester Employment Land Position Statement
P70/70 40658/700918v1
Supplementing the Evidence Base
8.39 This study has identified a number of areas in which the current evidence base
on employment land is less well developed, for example on the issue of
landless growth. It would be impractical for these types of issues to be
considered on a regular basis through annual monitoring reports, but instead
they could be subject to stand-alone research/evidence forming projects
covering the AGMA area that would help supplement the existing evidence base
on employment land. These include:
• Landless growth – more detailed investigation on the scale of landless
growth, which locations are most conducive to landless growth occurring,
and which sectors or types of development are most likely to deliver
landless growth;
• Changing employment densities – investigate the extent to which
employment densities are changing within Greater Manchester, which
locations are experiencing greatest change, and the key driving factors;
• Rebalancing of employment areas – consider the extent to which there is a
need to ‘rebalance’ existing employment areas by introducing non B-class
employment generating uses; this may help support the upgrading and
renewal of existing employment premises, or complement their existing role;
• The impact of recession and future economic restructuring – investigating
the impacts of the current recession and future changes in the economy,
particularly in terms of shifts within the structure of the manufacturing and
financial/business services sector within Greater Manchester, and how this
will affect future demand for land/premises, the use/extent of occupation
of current sites/premises, the types of sites required, and the extent to
which Greater Manchester will compete with other locations. This would
relate to wider changes in the pattern of land use.

Greater Manchester Employment Land Position Statement
40658/700918v1
Appendix 1 Growth Sector Opportunity
Areas
Mapping referenced from report by Arup & Donaldsons on behalf of Manchester
Enterprises: Demand for Employment Land in Greater Manchester (2006)

Greater Manchester Employment Land Position Statement
40658/700918v1

Greater Manchester Employment Land Position Statement
40658/700918v1

Greater Manchester Employment Land Position Statement
40658/700918v1

Greater Manchester Employment Land Position Statement
40658/700918v1

Greater Manchester Employment Land Position Statement
40658/700918v1

Greater Manchester Employment Land Position Statement
40658/700918v1

Greater Manchester Employment Land Position Statement
40658/700918v1

Greater Manchester Employment Land Position Statement
40658/700918v1

Greater Manchester Employment Land Position Statement
40658/700918v1

Greater Manchester Employment Land Position Statement
40658/700918v1
Appendix 2 ELR Update by District
Bolton Council’s ELR (issued September 2008) appraised 44 sites (including
17 existing) and 11 town centre sites for mixed use. The quantitative demand
projections involved using a variety of modelling techniques including projecting
forward past take up rates; VOA statistics on Commercial and Industrial
Floorspace trends; and econometric modelling utilising the GMFM 2007 update
and Accelerated Growth Scenario (AGS). The demand projections factored in
past losses of employment land to other uses; planning application details;
business aspirations; a 20% margin of choice and capital substitution for
labour in manufacturing.
Bury Council’s ELR (published in March 2009) reviewed Bury’s entire
employment land portfolio of 315 sites and premises, a significant majority of
which were located in Bury and Radcliffe with deficiencies elsewhere. The
quantitative demand projections were based upon past take up rates, GMFM
econometric modelling and VOA floorspace trends.
Manchester City Council’s ELR is currently being undertaken by Nathaniel
Lichfield and Partners and is due for completion in September 2009. It is
anticipated that the final ELR will involve a review of existing sites and
allocations, with demand modelling focusing upon past take up rates, GMFM
econometric modelling and VOA floorspace trends. A particular focus of the
ELR will be the issue of landless growth and how this impacts upon standard
assumptions regarding the relationship between employment growth and
associated land requirements.
Oldham Council’s ELR is currently in draft, with Stage 1 and 2 completed.
Oldham MBC is now starting work on Stage 3 (Review of Additional Sites). The
ELR appraised 23 sites over 0.4ha, with demand modelling focusing upon past
take up rates, GMFM econometric modelling and VOA floorspace trends.
Rochdale Council’s ELR (completed July 2008) reviewed all allocated
employment sites and areas. The demand analysis used 2006 GMFM
forecasts to arrive at employment land requirements, alongside utilising past
take up rates plus the RSS methodology (6% GVA growth plus 20% flexibility
factor).
Salford Council’s ELR (issued May 2009) involved a qualitative appraisal of 65
employment areas using a locally derived methodology. The demand
requirements do not result from one specific method, but have been derived by
taking a balanced view based on the available evidence. Along with more
standard methods, this included rolling forward transactions and enquiries by
use class using results from the Focus and Midas databases respectively.

Greater Manchester Employment Land Position Statement
40658/700918v1
Stockport Council are currently carrying out employment land forecasting work
and have appointed consultants to undertake a study into office supply, which
is expected to be published in May 2009. Whilst no ELR is currently available,
the forecasting work will be used to inform the LDF and will incorporate GMFM
forecasting and Evolutive information on recent demand, combined with
consultation with the private sector over land requirements along with other
studies such as MIER.
Tameside Council began work on an Employment Land SPD in 2007 in an
attempt to address the pressure for housing and other non-employment
redevelopment on existing employment land and sites. This focused upon an
analysis of the current supply of sites (i.e. steps 1-4 of Stage 1 of the ODPM
2004 Guidance). The SPD was adopted in January 2009, and it is anticipated
that the remainder of the ELR work will be completed during 2009. The
methodology has been finalised and consultants have been appointed to
complete the office and industrial market assessment in addition to the
sectoral analysis outlined in the ODPM guidance. Demand modelling will be
similar to many of the other Authorities. The quantity and quality review carried
out for the evidence base of the Employment Land SPD looked at 217 sites.
Trafford Council’s ELR (completed in May 2009) appraised 49 sites, including
15 from the call for sites process. Demand modelling focused upon past take
up rates, GMFM econometric modelling and VOA floorspace trends. Whilst
losses were factored into the demand projections, no flexibility allowance was
included. Demand projections were also adjusted to take into account
qualitative considerations emerging from a stakeholder workshop.
Wigan Council’s ELR (December 2007) appraised 65 areas comprising 637
sites and undertook a range of demand forecasting techniques including past
take up rates, VOA floorspace trends and GMFM econometric modelling (using
data from 2005/06). Safeguarded Land sites were also included in the
appraisal process to increase the forward supply of land.

Greater Manchester Employment Land Position Statement
40658/700918v1
Appendix 3 Economic and Planning Policy
Context
Introduction
This chapter establishes the economic and planning policy context for the study
by reviewing planning policy alongside current economic conditions and recent
trends. This is important to help identify existing economic strengths and
weaknesses, as well as those factors likely to influence the nature and level of
future demand for employment space. The analysis focuses primarily upon the
performance of Greater Manchester as a whole and this is benchmarked, where
appropriate, against national and regional averages.
Policy Review
Planning Policy
The Regional Spatial Strategy, the adopted Unitary Development Plans and
emerging Core Strategies for Greater Manchester have been reviewed, and can
be summarised as follows:
a RSS Policy RDF1 specifies that the Regional Centre (incorporating part of
Manchester, Salford and Trafford) should be the first priority for growth,
followed by the inner areas surrounding the Regional Centre, then towns
and cities within the Manchester City Region such as Bolton, Burnley,
Oldham, Rochdale, Stockport and Wigan;
b In promoting opportunities for economic development, RSS Policy W1
specifies that in the Manchester City Region there should be an emphasis
on growth sector opportunities comprising advanced manufacturing and
engineering, financial and professional services, media, creative and
cultural industries, biomedical and ICT and digital communications;
c RSS Policy W2 specifies that regionally significant economic development
should be located close to sustainable transport nodes within the urban
areas;
d The 2005 existing supply of employment land within Greater Manchester for
the period to 2021 was 1,368 ha (RSS Policy W3). With a projected take-up
rate of 112 ha per annum, an extra 917 ha of employment land is identified
as being required, resulting in a total requirement of 2,285 ha;
e The justification to RSS Policy W3 states that as the North West economy
continues to restructure there will be a likely reduction in demand for B2
uses and a significant increase in demand for B1;
f Manchester Airport is likely to act as key driver of economic growth,
particularly in those local authority areas located close to the airport; and
Greater Manchester Employment Land Position Statement
40658/700918v1
g RSS Policy MCR 1 seeks to achieve a significant improvement in the sub-
region’s economic performance by encouraging investment and sustainable
development in the Regional Centre, surrounding inner areas and accessible
suburban centres;
h RSS Policy MCR2 relates to the Regional Centre and inner areas of the
Manchester City Region and seeks to ensure that it continues to develop as
the primary economic driver, providing the main focus for business, retail,
leisure, cultural and tourism development in the City Region.
i RSS Policy MCR3 relates to plans and strategies for the southern part of
the City Region, which should sustain and promote economic prosperity,
consistent with the environmental character of the area, by, for example
focussing employment development in towns and on brownfield land; and
j RSS Policy MCR5, which relates to the northern part of the City Region
requires plans and strategies to support the transformation of the local
economy, regenerate communities and enhance the environment; and
k Detail relating to the specific amount of employment land allocated, and
required, is not defined in a uniform manner across the 10 UDP’s and
emerging Core Strategies.
Policy W3 of the RSS explains in its supporting text that there exists a degree
of uncertainty in establishing employment land requirements and there may be
a need to provide additional land to take account of special circumstances
such as the expansion requirements of a particular business. It is for that
reason that policy W3 incorporates a flexibility factor of 20%, potentially adding
to the sub-region’s requirement.
Further accompanying text to policy W3 (para 6.12 of the RSS) suggests that
employment land figures for each sub-region should be distributed in
accordance with local labour market areas, broadly indicated by travel to work
areas from the 2001 census. The steering group for this study all agreed that
it was preferable to use district boundaries instead of travel to work areas
(TTWAs) for the basis of disaggregating employment land requirements, not
least due to the outdated data on which TTWAs are based (2001 census) and
the fact that TTWAs cross administrative boundaries of the ten Districts.
Table 3.16 of the technical appendix published alongside the draft RSS in
January 2006 explains that the policy response to the then existing
employment land picture for Greater Manchester was to increase the amount of
committed employment land. The supply for Greater Manchester was then 12
years and economic growth was anticipated and hence a need to identify
additional employment land. There was concern that particularly strong growth
in B1 uses may not be met by the allocations and together with the strength of
the economy of Greater Manchester a 20% flexibility factor was considered
sufficient to support future economic growth.

Greater Manchester Employment Land Position Statement
40658/700918v1
4 NW’s employment land implementation note (April 2009) further expands on
the flexibility factor and advises that the flexibility factor is not a given but
needs to be considered by the Districts, based on what the evidence base
reveals and set within the policy context of the RSS and emerging DPDs.
Economic Policy
A review of the Regional Economic Strategy, the Manchester City Region
Development Programme and the Manchester Independent Economic Review
(MIER) can be summarised thus:
a Five key themes to achieve the vision for the region: business, skills &
education, people & jobs, infrastructure and quality of life.
b Priority sectors identified include biomedical, energy & environment
technologies, advanced engineering, food & drink, digital & creative
industries and business & professional services;
c A need to encourage business start-ups, which in turn is likely to lead to an
increased demand for incubator and managed workspace units;
d Invest in the provision of quality business accommodation in HMR and URC
areas in order to stimulate demand and enable growth;
e Manchester Airport identified as critical to the development of an
internationally competitive economy;
f Up to 100,000 new jobs could be created in key growth sectors; and
g MIER recommends that a unified regime for planning, regeneration and
neighbourhood renewal be created in Greater Manchester.
Background Research
A review of the Demand for Employment Land in Greater Manchester by Arup
and Donaldson’s Assessment of Employment Land in Greater Manchester, was
also undertaken. These documents concluded:
a An additional 866,850 sqm of office space is required in Greater
Manchester over the period 2006 to 2021, with particular demand for small
spaces under 464 sqm (5,000sqft);
b Development densities have increased in recent years, currently reaching8-
12 storeys, compared to 4-6 storeys previously, with associated
implications for landless growth;
c A move from high volume-low value to high value-low volume
manufacturing has resulted in smaller B2 units being required;
d Over the ten years to 2001, whilst there was a net loss of just 2ha of
employment land (excluding retail), this masked a decline in B2 land (net
16 ha loss) but a strong growth in B1 office space (net increase of 10 ha),
and a net gain of 4ha of B8 land;

Greater Manchester Employment Land Position Statement
40658/700918v1
e Between 2005 and 2021 the economic growth of 7% is forecast but with a
substantial decline in manufacturing sectors and uneven growth across the
area; and
f A qualitative assessment by Donaldson’s of 109 key employment sites;
27% were found to have poor or very poor prospects of being relevant to
the identified growth sectors, but the rest were either potentially or ideally
suited to accommodating the growth sectors.
Employment Trends
Greater Manchester has experienced significant growth in employment during
the past decade, with the total employee jobs in the sub-region rising from
1,061,500 in 1997 to 1,174,600 in 2007. This represents an increase of
10.6% which, although significant, is marginally lower than national (12.0%) and
regional (12.4%) averages. Within the sub-region, the rates of growth observed
across individual authorities during this period vary markedly. The number of
jobs in Tameside remained almost static over the period (0.04%), whilst
Manchester (16.5%) and Trafford (15.8%) recorded high increases.
Employment Structure
Figure 7 demonstrates how the structure of employment in Greater Manchester
has altered during the period 1998 to 2007. This illustrates that the proportion
of jobs accounted for by financial and business services increased from 17.6%
to 22.5% over the period, whilst strong growth was also observed in public
administration and health where the job share rose from 23.8% to 26.6%. In
common with national trends, manufacturing jobs declined markedly, with the
proportion of employment contracting from 18.2% to 10.9%. The relative
representation of all other sectors remained reasonably stable.
0.0
5.0
10.0
15.0
20.0
25.0
30.0
Greater Manchester
1998
Greater Manchester
2007
North West 2007 Great Britain 2007
Manufacturing Construction
Wholesale/retail distribution Transport storage and communications
Financial and business services Public admin. and health
Other
Fig 7 Employment Structure (Source: ABI)
T
ota
l Jo
bs
(‘0
00
s)

Greater Manchester Employment Land Position Statement
40658/700918v1
Notwithstanding the significant decline in manufacturing jobs over the period, a
corresponding reduction in the sector’s economic output has not been
observed. Indeed, ONS statistics show that manufacturing in Greater
Manchester accounted for £6,089m in Gross Value Added (GVA) in 1998,
increasing to £6,154m in 2006 in real terms.
This indicates that the loss of employment in manufacturing observed in
Greater Manchester over the past decade tells only part of the story. Indeed, it
would appear that many manufacturing businesses are continuing to operate
successfully, albeit with fewer staff. It is likely that this is due in part to an
increased automation of manufacturing, a process known as capital
substitution for labour. Clearly, this has important implications for employment
land requirements as although employment in the sector may fall in future,
manufacturing businesses may remain and occupy the same land and
buildings. This issue was highlighted by the Bolton Employment Land Review.
Figure 7 also illustrates how the current employment structure of Greater
Manchester compares with the regional and national average. This shows that
whilst it is broadly in alignment, there are some local differences. In particular,
Greater Manchester includes a higher proportion of financial and business
services (22.5%) than the North West (19.4%) or Great Britain (21.6%). This is
underpinned by particularly high levels in Trafford (31.7%), Manchester (30.0%)
and Salford (26.8%), reflecting the strength of the Regional Centre with respect
to the sector.
Greater Manchester also contains a lower share of manufacturing jobs (10.9%)
than the North West average (12.4%). There are still, however, a number of
authorities with a high representation of manufacturing including Tameside
(20.8%), Oldham (16.7%), Rochdale (16.6%) and Bolton (15.1%).
When considered alongside the over-representation of financial and business
services outlined above, this indicates that the economy of Greater Manchester
is more advanced than the North West as a whole with respect to the transition
from an industrial to a service-based economy.
Job Density and Commuting Patterns
Job density is the ratio of total jobs to resident working-age population of an
area and can be used to examine the relative strength of local jobs markets.
Figure 8 illustrates that the job density of Greater Manchester (0.88) is the
same as the national average, providing 88 jobs for every 100 residents of
working age. Additionally, the graph clearly highlights the importance of
Manchester and Trafford as key regional employment locations. In both
authorities, there are more jobs than there are working age residents and as a
consequence, these areas help to meet the employment needs of the
surrounding authorities.

Greater Manchester Employment Land Position Statement
40658/700918v1
0
0.2
0.4
0.6
0.8
1
1.2
1.4
Bolto
nBur
y
Man
ches
ter
Oldha
m
Roc
hdale
Salfo
rd
Stock
port
Tames
ide
Traffo
rd
Wig
an
Gre
ater M
anch
este
r
Nor
th W
est
Gre
at Brit
ain
Job D
ensity
Figure 8 Job Density (Source: ONS / NLP Analysis)
An analysis of travel to work data, as set out in Figure 9, illustrates that Greater
Manchester as a sub-region is a relatively self-contained employment market.
It can be seen that there are very few major leakages of workers to jobs in
authorities beyond the sub-region, whilst half of the Greater Manchester
authorities have a containment rate14 of 60% or more.
The data again highlights the importance of those authorities comprising the
Regional Centre as a major source of employment for the wider sub-region, with
Manchester, Trafford and Salford experiencing a net inflow of commuters from
the majority of adjacent authorities. Indeed, it is estimated that the three
authorities experience a net inflow of more than 150,000 commuters, driven
primarily by Manchester (with a net inflow of 125,000). This also reflects the
job density data discussed above, which highlighted the important role played
by Manchester and Trafford in providing a surplus of jobs relative to their
working age populations.
14 NB – containment rate refers to the proportion of a local authority’s resident population that are in employment
and commute to jobs within the local authority area.

Greater Manchester Employment Land Position Statement
40658/700918v1
Figure 9 Travel to Work Patterns (Source: Census / NLP Analysis)
Business Base
Between 1997 and 2007, the number of VAT registered businesses in Greater
Manchester increased from 60,100 to 70,800. This equates to an increase of
17.7%, below the levels of growth observed nationally (21.3%) and regionally
(19.7%). The greatest increases were in Salford (28.5%), Trafford (25.5%) and
Wigan (24.3%), with all three authorities experiencing levels of growth above
the national average.
The size profile of the Greater Manchester’s business base is broadly in line
with the national and regional average, as shown in Table 15. The stock of
businesses is dominated by small firms, with 89.4% in the sub-region
employing fewer than 20 people. At the other end of the size spectrum, just
0.6% of businesses in Greater Manchester employ 250 people or more. Clearly
this has implications for the employment space needs of the area.

Greater Manchester Employment Land Position Statement
40658/700918v1
Employees
0-19 20-249 250+
Greater Manchester 89.40% 10.00% 0.60%
North West 90.40% 9.10% 0.50%
Great Britain 91.20% 8.30% 0.50%
Table 15 Size Profile of Business Base (Source: UK Business: Activity, Size and Location)
Whilst the broad trend towards the dominance of small businesses is
consistent throughout the sub-region, there are some fluctuations in the
structure of the business base at the local authority level. The proportion of
large businesses (250+ employees) is highest in Manchester (1.0%) and
Salford (0.8%), reflecting the economic primacy of these locations, as well as
the Regional Centre. Indeed, the UK Cities Index 2008 identified Manchester
as the number one location for new business headquarters in the UK and
clearly this places different demands on the area’s property market, with a
greater need for large headquarter premises.
Inward Investment
In recent years, Greater Manchester has performed well with respect to
attracting inward investment. Data collected by MIDAS15 shows that over the
period April 2004 to February 2008, 1,352 new investments were attracted to
the sub-region, with a total value in excess of £490m. This level of investment
is estimated to have created more than 19,000 new jobs over the period. A
significant proportion of investment (25%) was made by SMEs.
The data recorded by MIDAS indicates that 45% of investors in Greater
Manchester were seeking industrial premises and 34% offices. A further 10%
were seeking managed workspace premises.
Additional data provided by MIDAS disaggregated to the local authority level
demonstrates the strong economic role played by the authorities covering the
Regional Centre. Indeed, more than 75% of inward investment projects in the
last 5 years are estimated to have located within Manchester City, Salford and
Trafford.
Impact of Recession
At present, the UK is in recession and it is important that this study takes
account of the potential impact of the economic downturn upon the future
demand for employment land and premises. One of the key impacts of the
recession so far has been an increase in unemployment. This is highlighted in
Figure 10.
15 Manchester Investment and Development Agency Service

Greater Manchester Employment Land Position Statement
40658/700918v1
0
0.5
1
1.5
2
2.5
3
3.5
4
4.5
5
Apr-0
7
Jun-0
7
Aug-0
7
Oct-0
7
Dec-0
7
Feb-0
8
Apr-0
8
Jun-0
8
Aug-0
8
Oct-0
8
Dec-0
8
Feb-0
9
Apr-0
9
JS
A C
laim
an
ts (
%)
Greater Manchester North West Great Britain
Figure 10 Claimant Unemployment (Source: NOMIS)
The graph indicates that the proportion of working age residents claiming Job
Seekers Allowance (JSA) in Greater Manchester remained fairly stable over the
period April 2007 to August 2008, fluctuating between 2.4% and 2.8%. Since
then, however, the JSA claimant count has increased steadily, reaching 4.8% in
April 2009. Throughout this period, levels of unemployment have remained
broadly in line with the regional average (4.6% in April 2009) but slightly above
the national average (4.1% in April 2009).
In addition to an increase in levels of unemployment, the number of job
vacancies registered with Job Centre Plus has decreased significantly over the
same period. In April 2007, there were 21,230 job vacancies registered across
Greater Manchester, which had fallen to just 8,484 by April 2009. This
represents a significant contraction of the local jobs market, meaning that it is
currently far more difficult for those people out of work to find a new job.
The recession has resulted in economic growth forecasts for Greater
Manchester being dampened down considerably, as discussed below.
It should also be noted that the Regional Economic Forecasting Panel recently
produced a long-term baseline forecast for the North West on behalf of the
Regional Intelligence Unit. The forecast is intended to provide a key input to
the new Regional Strategy, RS2010, and draws upon projections developed by
the three forecasting houses of Cambridge Econometrics, Experian and Oxford
Economic Forecasting.
The Panel have used these inputs and other analysis to form a judgement on
future growth, with the forecasts divided into two time periods:

Greater Manchester Employment Land Position Statement
40658/700918v1
• 2008-2015, to reflect the recession and the likely recovery period
thereafter; and
• 2015-2030, by which time the UK and regional economies are expected
to return to longer term growth trends.
Employment is projected to experience year-on-year decline between 2008 and
2011, before recovering and as a consequence, annual average growth to
2015 is forecast to be in the order of -0.1%. In the longer term, the underlying
rate of employment growth is forecast to equate to 0.3% per annum. Overall,
the forecast predicts that employment will increase by 150,000 over the period
2008-2030. It is understood that this work will be used as the platform to
develop a set of sub-regional base forecasts. However, the sub-regional work
will not be available until later in the year.
GMFM Projections
The Greater Manchester Forecast Model (GMFM) was developed by Oxford
Economics to provide integrated economic, population and household forecasts
for each of the Greater Manchester authorities. The GMFM provides robust and
consistent information regarding current and projected future performance with
respect to all three strands outlined above and is critical in underpinning the
development of strategies and plans for Greater Manchester.
The first iteration of GMFM was published in 2007 and forecast that total
employment in Greater Manchester would increase to 1,316,900 by 2026. In
response to the economic downturn, a revised set of projections were
commissioned and published in Autumn 2008 to take account of the potential
impact of the recession. The 2008 GMFM forecast was less bullish; projecting
that total employment in Greater Manchester would fall in over the period 2008-
10 before increasing from 2011 onward, reaching 1,301,400 by 2032.
Figure 11 considers how the projections generated by the two runs of the
GMFM differ on a sector-by-sector basis. Projected employment growth over a
period of 19 years from the base date has been considered in both instances,
to ensure a comparable time frame for analysis.
This illustrates that the most dramatic change in the projections relates to the
Financial Intermediation sector. Whilst the 2007 GMFM forecast employment
growth of approximately 6,000, the 2008 run projected that the sector would
contract, suffering a loss of 3,400 jobs. This is understandable given the
impact of the recession upon the financial sector both nationally and globally.
However, this sector share of jobs is quite small.

Greater Manchester Employment Land Position Statement
40658/700918v1
-80
-60
-40
-20
0
20
40
60
80
100
Manufa
ctu
ring
Constru
ctio
n
Dis
tributio
n &
Reta
il
Hote
ls &
Resta
ura
nts
Tra
nsport &
Com
munic
atio
ns
Fin
ancia
l
Inte
rmedia
tion
Busin
ess
Serv
ices
Educatio
n
Health
Change (
000's
)
2007 Change 2008 Change
Figure 11 GMFM Forecast Employment Growth by Sector
The graph also shows that the growth forecasts for Education and Hotels &
Restaurants were scaled back significantly by the 2008 GMFM; with the level of
job growth reduced by approximately 50%. It can also be seen that both runs of
the model forecast a significant decline in the level of employment in the
manufacturing sector.
Additionally, Figure 12 considers the spatial distribution of the employment
growth projected by the 2008 GMFM. This illustrates that, with the exception of
Tameside, all of the authorities are expected to experience a net growth in
employment. It can also be seen from the map that despite the economic
downturn and the potential impact upon the financial services industry,
Manchester City is still anticipated to be the key driver of growth in Greater
Manchester. Indeed, the level of employment growth forecast for the city is
more than four times higher than that projected for any other authority.

Greater Manchester Employment Land Position Statement
40658/700918v1
Figure 12 2008 GMFM Forecast Employment Growth (Source: GMFM / NLP Analysis)
Additionally, the map highlights that the majority of growth is expected to be
clustered in the south of Greater Manchester, with the four authorities of
Manchester City, Salford, Trafford and Stockport accounting for almost 90% of
the projected job growth. This is reflected in the Manchester Independent
Economic Review (MIER) which highlights that demand for employment sites is
strongest in the south of Greater Manchester.
It should also be acknowledged that a partial run of the GMFM was
commissioned in May 2009 to help inform the Manchester City Council
Employment Land Review in light of the worsening recession. Whilst this does
not provide a breakdown of employment change for each of the Greater
Manchester authorities, it does provide some steer on how the position has
shifted since the production of the 2008 GMFM discussed above.
In line with the 2008 GMFM, the 2009 work also projects that employment will
decline over the period 2008-11, with the number of jobs beginning to increase
thereafter. The 2009 GMFM does, however, indicate that the adverse impacts
of the recession are likely to be more pronounced, with the level of employment
across Greater Manchester projected to increase to 1,258,400 by 2032; a
figure 43,000 lower than the 2008 GMFM.
Additionally, the 2009 GMFM provides employment projections for Manchester
City, anticipating it to be the key driver of growth in Greater Manchester.
Indeed. Over the period 2008-32, it is anticipated that Greater Manchester will

Greater Manchester Employment Land Position Statement
40658/700918v1
experience a net increase of 95,000 jobs, of which 55,800 will be in
Manchester City. It can, therefore, be concluded that the remaining 9
authorities will see growth of 39,200 between them over the same period.
Clearly the extent to which the growth projections for Greater Manchester have
been revised downward has major implications regarding the future demand for
employment land. The forecasts produced in 2007 are likely to represent the
top end of the market, whilst the 2008/9 work is likely to be close to the
bottom and it is likely that actual future growth will lie somewhere between the
two. It is therefore important for this study to consider the land use
implications of a range of scenarios.
Economic Growth Opportunities
This sub-section assesses the future economic role of each District, the key
drivers for each, and the types of sectors for which the sub-region would appear
to have a competitive advantage.
All ten local authorities exhibit a number of common economic development
aspirations as outlined in their respective Sustainable Community Strategies,
emerging LDF documents and other Economic Strategy documents. These
include the need to increase economic prosperity generally; to improve skill
levels; to restructure the local economy so that it is better positioned to meet
future challenges; and to target higher value growth industries, particularly
knowledge-based businesses.
As regards the latter point, Table 16 shows that the relative representation of
knowledge-based businesses varies significantly across Greater Manchester. It
is particularly high in Trafford (27.0%), Manchester (24.9%) and Stockport
(23.5%), all of which exceed the national average. The high concentrations in
Manchester and Trafford are likely to reflect the Regional Centre’s strengths in
sectors such as financial and professional services, life science industries and
a range of other knowledge intensive sectors. In Stockport, the high
representation of knowledge-based businesses is likely to be a result of
availability of a skilled labour force and proximity to Manchester International
Airport.
It is important to understand the relative representation of knowledge-based
businesses; that is, businesses operating in those sectors of the economy
where added value is derived from the intensity and accumulation of
knowledge. Firms operating within such sectors tend to grow faster than other
firms and have greater future potential. Consequently, knowledge-based
businesses represent an important indicator of an economy’s competitiveness
and future growth prospects.

Greater Manchester Employment Land Position Statement
40658/700918v1
Proportion of Knowledge-Based Businesses16
1997 2005 Change 1997-2005
Bolton 14.4% 17.0% 18.1%
Bury 15.4% 17.7% 14.9%
Manchester 19.3% 24.9% 29.0%
Oldham 13.3% 14.1% 6.0%
Rochdale 11.0% 13.4% 21.8%
Salford 15.0% 18.6% 24.0%
Stockport 20.8% 23.5% 13.0%
Tameside 13.1% 14.9% 13.7%
Trafford 24.2% 27.0% 11.6%
Wigan 13.7% 15.4% 12.4%
Great Britain 18.6% 20.5% 10.2%
Table 16 Proportion of Knowledge Based Businesses (Source: UK Competitiveness Index)
In addition, the likely suitable locations for new economic development, in the
context of the existing portfolio of employment land, have been reviewed.
Maps taken from Arup’s Demand for Employment Land in Greater Manchester
report are reproduced in Appendix 1. These indicate that, in general,
Manchester City is suitable for most forms of industrial development, with the
exception of food and drink, followed by Trafford and Salford. The greatest
number of available sites are located within Wigan (which is identified as being
suitable for construction, engineering and manufacturing, food and drink and
logistics) followed by Bolton and Trafford. In summary, the Arup/Donaldsons
reports indicate that:
• Bury is particularly well suited to healthcare and ICT/ digital industries and
food and has sites available for such development;
• Bolton is well suited for engineering & manufacturing and financial &
professional services;
• As noted above, Manchester, at the heart of the Regional Centre, is
suitable for most forms of industrial cluster development, with an emphasis
on the financial and professional services sector and education,
healthcare/biotechnology (focussed in particular on the Oxford Road
corridor).
• Oldham has sites available for industrial development, although the Arup
report considered that the sectors for which Oldham is most suited (i.e.
engineering and manufacturing) could not be accommodated on these sites;
• Rochdale has considerable potential for growth in the logistics sector with
sites identified as being suitable for this form of development; Kingsway is
also highlighted as an excellent opportunity to develop customer contact
and shared service centres as a business function;
16 NB – The UK Competitiveness Index categorises the following as knowledge-based businesses: high-technology
manufacturing and knowledge-based services such as telecommunications, IT services, and research and
development activities.

Greater Manchester Employment Land Position Statement
40658/700918v1
• Along with the creative industries and media sector arising from the Media
City development at Salford Quays, Salford is also appropriate for the
logistics sector, having sites available and suitable for this.
• Stockport is identified as being particularly suitable for ICT / digital cluster
development and financial and professional services, particularly within the
town centre, and has sites suitable for this use. Stockport is also an
advantageous location for shared service centres (back office and HQ
facilities) due to the local skills base and relatively cheaper office
accommodation in highly accessible locations. Stockport also has the
potential to attract the emerging/growing Data Centre sector on former
manufacturing sites.
• Tameside has several industrial sites suitable for engineering and
manufacturing. Food and drink are established clusters in the district and
are likely to remain so;
• Trafford is particularly suited to financial and professional services and ICT
/ digital and has sites available and suitable for these uses; and
• Wigan is particularly well suited for logistics, engineering & manufacturing
and food and drink
It is also important to understand the relative roles, strengths and weaknesses
of different areas within Greater Manchester. A brief overview is provided
below:
• The Regional Centre: underpinned by strong concentrations of high value
industries. Financial and professional services are currently well
represented within the Regional Centre, with particular concentrations in
Manchester City Centre, Salford Quays and Trafford Park. Media and
creative industries are currently focused in regional centre fringe locations
such as the Northern Quarter. The development of MediaCity UK in Salford
is expected to serve as a further catalyst to growth in the sector. Health
and life sciences are well represented in this area, particularly focussed
along the Oxford Road Corridor, in close proximity to the teaching
specialisms of the universities, as well as Manchester Science Park.
• Southern Areas: MIER acknowledges that parts of Trafford outside of the
Regional Centre retain strengths in a diverse range of manufacturing
subsectors. This includes food and drink, and high value niche specialisms
linked to the automotive supply chain. Additionally, there are
concentrations of logistics activity focussed around Manchester Airport, as
well as in Trafford around the M6 and in Stockport close to the M60 and
M62. MIER also projects that Stockport will experience a growth in creative
and digital industries in future, to complement the existing concentrations
of financial and professional services satellite operations and
ICT/communications businesses operating from out of town locations in the
Borough.

Greater Manchester Employment Land Position Statement
40658/700918v1
• Northern Areas: as highlighted by MIER, the authorities in the north of
Greater Manchester also retain a strength in a range of manufacturing
subsectors, including: mechanical and electrical engineering in Oldham,
Rochdale and Wigan; electronics/communications in Bolton and high value
niche specialisms such as those linked to the automotive supply chain in
Bolton. In addition it is understood that there is a growing satellite of
financial and business services located in and around Bolton, whilst Bury
has been successful in attracting a number of ICT/communications
businesses. There is also a concentration of logistics activity focused
around Wigan, capitalising upon the accessibility of the area.
Transport Infrastructure
In May 2009, a new £1.5bn transport strategy was announced for Manchester
following the demise of the Transport Innovation Fund bid. The Association of
Greater Manchester Authorities submitted a new £1.5bn transport strategy to
Secretary of State for Transport for approval. The transport secretary
subsequently agreed to plans to fast-track £244m of projects included on this
list - including Metrolink extensions to East Didsbury and Ashton-under-Lyne.
There are a number of accelerated schemes with provisional funding identified,
which include:
• Metrolink: work proceeding on new tram line to Chorlton. East Didsbury line
with stops at Withington, Burton Road, West Didsbury, Didsbury Village and
East Didsbury
• Metrolink: Construction is continuing on a tram line to Droylsden. A new
Metrolink line will run between Droylsden and Ashton under Lyne, calling at
Audenshaw, Ashton Moss, Ashton West and Ashton-under-Lyne.
• Elements of Cross City bus package include introducing more bus priority
measures to make journeys to the universities and hospitals on Oxford
Road quicker and more reliable. This will include new links from north and
west Greater Manchester and improve the quality of buses serving the area.
• Park and ride sites throughout Greater Manchester serving a mix of rail and
Metrolink routes
8.40 There are also a number of priority schemes with funding identified, including:
• Metrolink: new line to Manchester Airport, calling at Barlow Moor Road,
Hardy Farm, Sale Water Park, Northern Moor, Wythenshawe Park, Moor
Road, Baguley, Roundthorn, Martinscroft, Haveley, Benchill, Crossacres,
Wythenshawe town centre, Robinswood Road, Peel Hall, Shadowmoss,
Woodhouse Park and the airport.
• Second City tram crossing
• Metrolink: Metrolink is already being constructed through Oldham town
centre and funding has now been earmarked to build a new loop line to
Oldham town centre, from Werneth to Oldham Mumps
• Metrolink: to extend the line serving Rochdale railway station, down Drake
Street to a new transport interchange in Rochdale town centre

Greater Manchester Employment Land Position Statement
40658/700918v1
• SEMMMS relief road - new dual carriageway linking the airport roundabout at
the end of the M56 spur to the A555 at Bramhall, and from the A555 at
Bramhall to the A6 at Hazel Grove
• Mottram Bypass and Glossop Spur
• Ashton Northern Bypass stage 2 - which will complete the ring of relief roads
around Tameside town centre by extending the Ashton northern bypass
(stage 1) through to the Arlington Street link in the north of the town.
• Wigan inner relief road - new route between the A49 Saddle junction and
Frog Lane and would complete the inner relief road.
• Leigh-Salford-Manchester rapid transit busway, with buses guided on a 7km
path along a former rail route between Leigh and Ellenbrook
• Contributions to station upgrades
• Altrincham new transport interchange
• Bolton new transport interchange, adjacent to rail station, involving
relocation of bus station
Other priority schemes with funding awaited include:
• Metrolink: new line connecting Pomona with Trafford Park
• Manchester Rail Hub
• Metrolink Wythenshawe Loop
• Stockport new transport interchange
• Stockport town centre access scheme – various highways and public
transport improvements to reduce congestion, improve bus journey times
and reliability, and improve walking and cycling opportunities around the
town centre.
• Options for reducing congestion between Ramsbottom, Bury and Heywood
including the development of the East Lancashire Railway
The new transport strategy involves securing £1 billion through contributions
from local transport programmes, future GMITA levies and regional allocations
which have been earmarked for Greater Manchester. The schemes in the
£1.5bn transport plan are in addition to the £600m investment currently
underway to expand the Metrolink network with new lines to Oldham and
Rochdale, Droylsden in Tameside, Chorlton in South Manchester and MediaCity
in Salford.

Greater Manchester Employment Land Position Statement
40658/700918v1
Appendix 4 Consultation
NLP met with the following bodies during the preparation of the Statement:
1 Employment SPIGlet - 17th June 2009
2 Planning officers Group – 19th June 2009
3 MIDAS – 29th June 2009
4 4NW and NWDA – 2nd July 2009
5 Manchester City Council
6 Bolton MBC
7 Wigan MBC
8 Salford City Council
9 Rochdale MBC
10 Bury MBC
11 Stockport MBC
12 Tameside MBC
13 Trafford MBC
14 Oldham MBC
In addition NLP undertook telephone interviews with the following organisations:
15 Ask Developments
16 Peel Holdings
17 EC Harris
18 CB Richard Ellis

Greater Manchester Employment Land Position Statement
40658/700918v1
Appendix 5 District Summary Tables
BOLTON Comment
Strengths/weaknesses/
aims/potential
Retains strength in a range of manufacturing subsectors, including
electronics/communications and high value niche specialisms such as those linked
to the automotive supply chain. Also a growing satellite of financial and business
services located in and around the district.
Stated aim to increase economic prosperity generally across the Borough and to
narrow the gap between the haves and the have nots. Previously allowed
considerable out-of-centre development, although future focus is likely to be on
offices in the town centre, which is receiving public sector body support. There is
potential for further B2/B8 development along the motorway network.
Key Implication: Potential for growth in key sectors supported by public sector
funding.
Potential growth sector
impacts
Bolton is well suited for engineering & manufacturing and financial & professional
services.
Summary conclusions of
ELR
Identified a shortfall of between 126 to 179 hectares of allocated employment land
over the period to 2026.
The study recommended that Bolton should consider retaining the majority of its
existing allocated employment sites (with 2 exceptions), and allocating 11 suggested
town centre sites for employment-led mixed use.
Summary of ELR Demand
Projections (2007-26)
175-195ha
Key implication: Qualitative considerations resulted in consultants using the lower
end of the demand range projected.
Use of the Flexibility
Factor?
YES – 20% to ensure consistency with the regional levels and other ELRs produced
by Arup in the North West region.
Summary of District’s
existing/potential supply
of sites
103.41/220.71ha
Key implication: Potentially a sufficient supply of good quality sites to meet forecast
ELR demand.
Revised RSS Policy W3
Demand projections
(take-up in past 5 years,
excluding 20% flexibility)
233ha rising to 247ha incorporating 6% growth factor.
Key implication: High rate of past take up in excess of ELR demand projections.
Job growth (GMFM)
2007-27
-35ha / -17ha (net)
Key implication: One of the lower demand projections due to considerable forecast
losses in B2 industries.
Implications of landless
growth for District
Aside from high density office growth in Bolton town centre, other landless growth
opportunities are expected to be limited with continued strong demand for B2/B8.
Key implication: Lower future prospects for landless growth, in the GM context.
Conclusions re: demand
v. supply
• Bolton has reasonable prospects for growth in higher value engineering /
manufacturing specialisms and to a lesser extent FBS.
• The 175-195ha ELR demand projections incorporated the 20% flexibility factor,
but were toward the bottom end of the forecasts used.
• The district has 103ha of employment land, potentially rising to 221ha.

Greater Manchester Employment Land Position Statement
40658/700918v1
BURY Comment
Strengths/weaknesses/aim
s/potential
Bury retains its strength in a range of manufacturing subsectors, and has been
successful in attracting a number of ICT/communications businesses. The
Borough is taking an optimistic view on growth, aspiring to move away from
traditional manufacturing toward more office-based research and development
employment opportunities to introduce better quality and higher paid employment
opportunities for residents.
Key Implication: Growth in Business Service sectors to compensate for continued
restructuring in the traditional manufacturing industries.
Potential growth sector
impacts
Bury is particularly well suited to healthcare and ICT/ digital industries and food
sectors.
Summary conclusions of
ELR
ELR identified a requirement for 76.9ha and an initial deficit of 45.34ha. 14
potential new sites were identified (equal to 52.78ha), resulting in a total portfolio
of 84.34ha, although as a result of the consultation draft ‘Bury but Better’ Study,
an additional 7 B1 office sites (7.25ha) have been identified which would take the
overall portfolio to 92ha. These additional sites will be considered as part of a
review of Bury’s ELR.
Summary of ELR Demand
Projections (2007-26)
76.9ha
Key implication: Figure in excess of committed supply – this resulted in a
requirement for an additional 52.78ha.
Use of the 20% Flexibility
Factor?
NO – the ELR identifies an additional 7.44ha on top of the demand requirement
of 76.9ha. However, the potential addition of 7.25ha that have been identified in
the consultation draft ‘Bury but Better’ study would effectively represent an
allowance for an additional 20%.
Summary of District’s
existing/potential supply of
sites
48.12 / 92ha
Key implication: Potentially a sufficient supply of good quality sites to meet
forecast demand if 14 potential new sites are allocated as recommended in the
ELR together with the additional sites that have been identified in the
consultation draft ‘Bury but Better’ study.
Revised RSS Policy W3
Demand projections (take-
up in past 5 years,
excluding 20% flexibility)
101ha rising to 108ha incorporating 6% growth factor.
Key implication: Past take up slightly in excess of ELR demand projections.
Job growth (GMFM) 2007-
27
-27.3ha / -19.2ha (net)
Key implication: One of the lowest growth projections in the sub-region, with
particularly low rates forecast for Business Services and other B1-type uses
despite Council aspirations.
Implications of landless
growth for District
Landless growth has not been observed in the District in recent years, although
that may change in the future as there are 7 potential sites in Bury Town Centre
which could accommodate higher density office uses, whilst an additional
50,000sqm of unspecified B1 floorspace has also been identified to come
forward.
Key implication: Moderate future prospects for landless growth.
Conclusions re: demand v.
supply
• Bury has reasonable prospects for growth in health care, food and
ICT/digital clusters. Council aspirations for growth in Business Services
sectors not reflected in GMFM growth projections.
• The 76.9HA ELR demand projections did not incorporate the 20% flexibility
factor.
• Factoring in the allocation of 14 new sites and the 7 sites identified in the
consultation draft ‘Bury but Better’ study, the district potentially has 92ha of
employment land.

Greater Manchester Employment Land Position Statement
40658/700918v1
MANCHESTER Comment
Strengths/weaknesses/
aims/potential
The Regional Centre is underpinned by strong concentrations of high value
industries. FBS is currently well represented in the City, whilst media and creative
industries are currently focused in fringe locations such as the Northern Quarter.
Health and life sciences are well represented, particularly along the Oxford Road
Corridor.
The City Centre has high concentrations of knowledge based businesses, reflecting
the Regional Centre’s strengths in FBS, life science industries and other knowledge
intensive industries. The 2008 GMFM model run forecasts continued strong growth
in the Business Services sector in Manchester City, with the area accounting for 58%
of net job growth in the sub-region.
Key Implication: strong growth in high value professional services sectors driving the
sub-regional economy for the foreseeable future.
Potential growth sector
impacts
Manchester is suitable for most forms of industrial cluster development, with an
emphasis on the financial and professional services sector and education,
healthcare/biotechnology.
Summary conclusions of
ELR
Demand requirements likely to be in the range of 187-236ha 2008-26. Considerable
potential supply of sites, although Central Park dominates the current portfolio.
Summary of ELR Demand
Projections (2007-26)
197-249ha
Key implication: likely to be higher than actual land requirement, given high density
office development.
Use of the Flexibility
Factor?
YES – given strong growth projections, although considerable evidence of landless
growth in recent years, a trend expected to continue.
Summary of District’s
existing/potential supply
of sites
164.2ha in AMR, although this does not allow for the inclusion of a much larger area
at Central Park which they now consider to be designated for employment land -
(163.20ha now compared to around 25.98ha previously that informed the AMR.
Key implication: potential under-supply of land in absolute quantitative terms,
although evidence of landless growth may justify lower levels of provision.
Substantial potential supply of 551.4ha.
Revised RSS Policy W3
Demand projections
(take-up in past 5 years,
excluding 20% flexibility)
207ha rising to 220ha incorporating 6% growth factor.
Key implication: Rate of past take up in broad compliance with ELR demand
projections.
Job growth (GMFM)
2007-27
155.3ha / 207.5ha (net)
Key implication: By far the strongest growth forecasts of all the districts in the sub-
region, with a particularly strong growth forecast for B1-type industries (192-231ha
net), although even here growth forecasts in traditional B2 manufacturing are
projected to decline markedly to 2027.
Implications of landless
growth for District
Apparent that although the number of jobs based in the Regional Centre has
increased dramatically, this has not led to a commensurate take up of employment
land. The Business Services sector is likely to be the prime driver for economic
growth in the period to 2026 and it seems realistic to assume that job densities and
‘landless growth’ will remain high.
Key implication: Very High future prospects for landless growth.
Conclusions re: demand
v. supply
• Manchester City has very strong future growth prospects for all forms of
industrial cluster development, particularly in high value professional services
and knowledge based industries.
• The 197-249ha ELR demand projections incorporated the 20% flexibility factor.
• The district has 164.2ha of employment land, rising to 260ha including a larger
area of Central Park.

Greater Manchester Employment Land Position Statement
40658/700918v1
OLDHAM Comment
Strengths/weaknesses/aim
s/potential
The district is seeking economic transformation through diversification of the
economy and improving its skills base. Oldham retains its strength in a range of
manufacturing subsectors, particularly mechanical and electrical engineering. It
is understood that future target sectors include ICT, digital engineering and
cultural industries. Considerable investment is underway constructing Metrolink
through Oldham town centre, with further funding earmarked.
Key Implication: strong representation in declining industries, although
substantial transport investment may improve attractiveness of the district to new
industrial users.
Potential growth sector
impacts Engineering and manufacturing
Summary conclusions of
ELR
Identified a shortfall of between 92.05ha and 96.85ha. ELR concluded that
providing new sites to cover this ‘gap’ in the portfolio was unachievable, given the
topographical constraints and the Green Belt restrictions. Concluded that
opportunities should be taken to increase the development of offices in the
district and hence employment densities. Alternative recommendations included
the allocation of new sites from Land Reserved for Future Development, as well
as identifying new allocations from within masterplan areas.
Summary of ELR Demand
Projections (2007-26)
132.8-137.6ha
Key implication: unachievable level of demand, given restrictions.
Use of the Flexibility
Factor?
NO – not for the Preferred Methodology, which is based on past take up rates that
have then been moderated by factoring in the proportional change in B-use
employment from the GMFM.
Summary of District’s
existing/potential supply of
sites
79.58/69ha
Key implication: significant under supply of land with few viable opportunities for
new allocations.
Revised RSS Policy W3
Demand projections (take-
up in past 5 years,
excluding 20% flexibility)
165ha rising to 175ha incorporating 6% growth factor.
Key implication: High rate of past take up well above ELR demand projections.
Job growth (GMFM) 2007-
27
-34.6ha / -22.8ha (net)
Key implication: Similar overall growth forecasts as for Bolton, although growth in
B1 employment forecast to be weaker, whilst B2 decline likely to be less
precipitous.
Implications of landless
growth for District
Whilst landless growth has not been witnessed to a significant extent in the
recent past, the redevelopment of brownfield sites at higher densities is likely to
be a pre-requisite given the district’s development restrictions and aspirations.
Key implication: Lower future prospects for landless growth.
Conclusions re: demand v.
supply
• Oldham has reasonable prospects for growth in engineering and
manufacturing, although it is recognised that these are declining industries
as a whole.
• The 133-138ha ELR demand projections incorporated the 20% flexibility
factor, despite the restricted availability of sites.
• The district potentially has 69ha of employment land.

Greater Manchester Employment Land Position Statement
40658/700918v1
ROCHDALE Comment
Strengths/weaknesses/aim
s/potential
Retains its strength in a range of manufacturing subsectors, including mechanical
and electrical engineering. Considerable investment in a new Metrolink link to
extend the line serving Rochdale railway station, down Drake Street to a new
transport interchange in Rochdale Town Centre. The district’s aspirations include
a desire to retain a balanced economy with higher quality jobs contributing to an
increase in GVA.
Key Implication: development of Kingsway should make a major contribution to
providing higher skilled jobs in the district.
Potential growth sector
impacts
Considerable potential for growth in the logistics sector; Kingsway also represents
an excellent opportunity to develop customer contact and shared service centres
as a business function.
Summary conclusions of
ELR
Rochdale has one of the largest employment land portfolios in the sub-region. A
smaller, more focussed, and higher quality portfolio of employment sites would
give developers greater certainty and therefore confidence to develop
speculatively. The average of the five demand variations used in the ELR equates
to an additional requirement of 26.4ha, which ties in closely to RSS figure using
the mid-range Kingsway allowance of 29.2ha. On this basis, the ELR concluded
that the provision of a further 25-30ha, over and above the proposed new supply
of 185ha identified, would seem appropriate.
Summary of ELR Demand
Projections (2007-26)
ELR stipulated 210-215ha 2005-21 – Council officers consider that this should
remain the figure for 2007-26 given the ongoing recession.
Key implication: additional allocation required of 25-30ha; over half of the total
demand likely to be taken up by the Kingsway site.
Use of the Flexibility
Factor?
YES – 20% has been used, based on previous studies and DTZ’s market
knowledge.
Summary of District’s
existing/potential supply of
sites
175.2/205.2ha
Key implication: moderate additional allocations required – windfalls not
included, but expected to form a significant part of forward supply in future.
Revised RSS Policy W3
Demand projections (take-
up in past 5 years,
excluding 20% flexibility)
184ha rising to 195ha incorporating 6% growth factor.
Key implication: Past take up broadly in accordance with ELR demand
projections.
Job growth (GMFM) 2007-
27
-19.2ha / -3.7ha (net)
Key implication: Slight negative net requirements (with flexibility factor) primarily
due to reasonably strong growth forecasts for B1 employment, one of the highest
of the northern districts.
Implications of landless
growth for District
Little evidence of landless growth occurring in recent years, with strong demand in
the recent past for lower density B2/B8 use. Kingsway will provide office
opportunities but there are opportunities for higher density office development in
Rochdale and Middleton Town Centres also.
Key implication: Moderate future prospects for landless growth.
Conclusions re: demand v.
supply
• Rochdale has considerable potential for growth in the logistics sector
• Kingsway provides the largest allocation
• The 210-215ha ELR demand projections incorporated the 20% flexibility
factor.
• The district has 175ha of employment land, potentially rising to 205ha.

Greater Manchester Employment Land Position Statement
40658/700918v1
SALFORD Comment
Strengths/weaknesses/aim
s/potential
The Regional Centre is underpinned by strong concentrations of high value
industries. Financial and professional services are currently well represented
within Salford Quays whilst the development of MediaCity UK is expected to serve
as a further catalyst to growth in the sector.
Key Implication: High growth potential – major concentration of media-related and
other knowledge-based industries, with the Council keen to maximise the benefits
of the BBC and other investment in key creative/digital/new media growth
sectors.
Potential growth sector
impacts
Along with the creative industries and media sector arising from the MediaCity
development at Salford Quays, Salford is also appropriate for the logistics sector.
Summary conclusions of
ELR
The ELR noted that the decline in traditional manufacturing and the growth in the
service sector indicated a need for a reduction in the overall stock of industrial
floorspace and an increase in office accommodation. There is currently an under
supply of good quality sites. Attention should be focused on identifying new sites
for logistics users on the M60 corridor. The ELR also recognised the need to
realise the potential of Salford Quays and locations on the edge of the Regional
Core.
Summary of ELR Demand
Projections (2007-26)
124-243.5ha
Key implication: Substantial range in figures. Potential requirement biased
towards B2 – maximum of 152ha compared to 28.5ha for B1 and 63ha for B8.
As this is considerably higher than the current supply, much of this demand will
need to take place on windfall sites if no new allocations are forthcoming.
Use of the Flexibility
Factor?
NO –although the consultants undertaking the ELR did acknowledge the need for
it in their analysis of GMFM forecasts.
Summary of District’s
existing/potential supply of
sites
123.25/198.25ha
Key implication: figures include 50ha Barton site, a modal freight allocation.
Generally an under-supply of land, although recycling of existing sites anticipated
to be a major source of land in the future.
Revised RSS Policy W3
Demand projections (take-
up in past 5 years,
excluding 20% flexibility)
157ha rising to 166ha incorporating 6% growth factor.
Key implication: Past take up rates considerably below top end of ELR demand
projections.
Job growth (GMFM) 2007-
27
8.5ha / 25.2ha (net)
Key implication: strongest growth forecasts in the sub-region behind Manchester
City and Trafford. Has the second lowest forecast decline in B2 employment in
the sub-region.
Implications of landless
growth for District
High density office development in recent years has resulted in higher
employment densities and landless growth. This trend is likely to continue in
future with developments at Media City in Salford Quays and the recycling of land.
Key implication: Higher future prospects for landless growth.
Conclusions re: demand v.
supply • Salford has high growth potential particularly in media-related and other
knowledge-based industries.
• The 124-243.5ha ELR demand projections incorporated the 20% flexibility
factor.
• The district has 123ha of employment land, potentially rising to 198ha.

Greater Manchester Employment Land Position Statement
40658/700918v1
STOCKPORT Comment
Strengths/weaknesses/
aims/potential
Council has aspirations to boost professional services, in order to reduce the outflow
of highly skilled commuters into the Regional Centre. Major drive for office
accommodation in Stockport Town Centre, targeting education and science sectors.
Concentrations of logistics activity focussed in Stockport around the M60 and A6
and/or town centre. MIER projects that Stockport will experience a growth in creative
and digital industries in future, to complement the existing concentrations of
financial and professional services satellite operations and ICT/communications
businesses operating from out-of-town locations in the district.
Key Implication: Aspirations to retain highly skilled residents from commuting
elsewhere supported by positive growth forecasts in key sectors and push for high
density, in-centre, office development.
Potential growth sector
impacts
Stockport is identified as being particularly suitable for ICT/digital cluster
development and financial and professional services, particularly within the town
centre. Stockport is also an advantageous location for shared service centres (back
office and HQ facilities) due to the local skills base and relatively cheaper office
accommodation in highly accessible locations. Stockport also has the potential to
attract the emerging/growing Data Centre sector on former manufacturing sites.
Summary conclusions of
ELR No ELR available at present.
Summary of ELR Demand
Projections (2007-26)
138.13ha
Key implication: Demand forecasts are considerably in excess of potential supply
even without applying the 20% flexibility factor – may require landless growth/high
density office use in the future.
Use of the Flexibility
Factor?
NO – Given the limited supply of available sites; drive for office development in
Stockport Town Centre and the Green Belt land use restrictions.
Summary of District’s
existing/potential supply
of sites
60.62/100.62ha
Key implication: Under supply of land. Officers keen to develop high density offices
in Stockport Town Centre in future, which may reduce overall land requirements. Few
greenfield opportunities for new allocations.
Revised RSS Policy W3
Demand projections
(take-up in past 5 years,
excluding 20% flexibility)
152ha rising to 161ha incorporating 6% growth factor.
Key implication: past take up rate considerably in excess of future projections and
available supply – however, nature of take up changing with increasing amounts of
B1 at higher densities than before, hence past take up not necessarily a reliable
guide for future requirements.
Job growth (GMFM)
2007-27
-18.3ha / -1.9ha (net)
Key implication: Continued B2 decline balanced somewhat by moderate forecast
growth in B1 and one of the higher growth forecasts for B8-related industries.
Implications of landless
growth for District
Traditionally experienced high levels of B2/B8 industrial development coming
forward, at relatively low densities; however, given restrictions on greenfield land
release in future and the drive for town centre development, it is likely that the
recycling of existing sites and higher density office development will take place on an
increasing scale.
Key implication: Moderate future prospects for landless growth.
Conclusions re: demand
v. supply
• Stockport has strong growth potential in creative and digital industries and is
seeking to stimulate the office market in Stockport Town Centre.
• The 138ha demand projections did not incorporate the 20% flexibility factor.
• The district has 60.6ha of employment land, potentially rising to 100.6ha.

Greater Manchester Employment Land Position Statement
40658/700918v1
TAMESIDE Comment
Strengths/weaknesses/aim
s/potential
Potential growth sectors seek to build on established clusters, including major
engineering and food sectors, although these are currently contracting rapidly.
The council is seeking to balance growth evenly throughout the District.
Tameside is the only GM district with negative net overall employment growth
forecasts in the 2008 GMFM.
Key Implication: Contracting established sectors and considerable pressure on
existing employment sites for alternative higher value uses.
Potential growth sector
impacts
Food and drink are established clusters in the district and are likely to remain so
in the future.
Summary conclusions of
ELR
SPD focussed predominantly upon the supply implications – the second and third
stages of the ELR have yet to be undertaken. Limited supply of sites due to
constraints; a high number of employment sites have been lost to alternative
uses in recent years. Initial forecasting based on the RSS methodology indicated
a potential shortfall of 91.6ha.
Summary of ELR Demand
Projections (2007-26)
249.2ha (209.9ha 2005-21)
Key implication: Considerable potential shortfall of employment sites given
demand projections. NOTE – this is not the official ELR demand projection, as
work is still underway, but represents a calculation made using the RSS W3
methodology.
Use of the Flexibility
Factor? YES – in accordance with North West RSS methodology.
Summary of District’s
existing/potential supply of
sites
74.19/94.19ha
Key implication: Sites remain limited and under pressure for alternative uses.
Potential supply figure incorporates an additional 20ha site at Mottram.
Generally an under supply of sites and an imbalance across the Borough, with a
need for new greenfield releases in places such as Hattersley.
Revised RSS Policy W3
Demand projections (take-
up in past 5 years,
excluding 20% flexibility)
123ha rising to 130ha incorporating 6% growth factor.
Key implication: past take up lower than ELR demand projections but still
considerably in excess of supply.
Job growth (GMFM) 2007-
27
-46.4ha / -33.3ha (net)
Key implication: highest projected net decline overall of all the GM districts, with
steep decline in B2-related industries and only a very minor growth in B1
employment.
Implications of landless
growth for District
Little evidence of landless growth at present. The main opportunity for high
quality office development is likely to comprise Ashton Moss Strategic Site, with
an opportunity for high quality office development in the St Petersfield area
(approx 20,000sqm of outstanding pp), although landless growth opportunities as
a whole are likely to remain limited.
Key implication: Lower future prospects for landless growth.
Conclusions re: demand v.
supply
• Tameside has limited prospects for future growth, with reliance on
established but vulnerable clusters such as engineering and manufacturing.
• The 249ha ELR demand projections incorporated the 20% flexibility factor.
This figure is considered to be excessively ambitious as the calculation was
made before the full ELR has been completed and bears no relation to the
current availability of land in the district.
• The district has 74ha of employment land, potentially rising to 94ha.

Greater Manchester Employment Land Position Statement
40658/700918v1
TRAFFORD Comment
Strengths/weaknes
ses/aims/potential
MIER acknowledges that parts of Trafford outside of the Regional Centre retain strengths
in a diverse range of manufacturing subsectors. This includes food and drink, and high
value niche specialisms linked to the automotive supply chain. Additionally, there are
concentrations of logistics activity focussed around the M60.
There are further opportunities to develop the capacity of the Trafford Park Core Industrial
area as a sub-regional resource providing sustainable long-term employment growth
opportunities to support economic regeneration, improved skills levels and development
within and beyond the Borough. The Metrolink extension through Trafford Park will further
boost growth in this established area.
Key Implication: Strong prospects for continued growth in established industrial areas.
Potential growth
sector impacts Trafford is particularly suited to financial and professional services and ICT / digital.
Summary
conclusions of ELR
Based on the scenarios modelled the ELR concluded that Trafford had sufficient land
supply to meet its project employment land demand requirements up to 2026.
The ELR also recognised that there would be additional employment land that is currently
in use that could contribute to the future supply of land and could help meet the Council’s
objectives to focus new employment development on sites that are in previous or current
employment use.
Summary of ELR
Demand Projections
(2007-26)
100-170ha
Key implication: slight oversupply of land, based on ELR conclusions; range does not
include a margin of choice and therefore the ELR recognises the need for the Council to
monitor its land throughout the plan period to ensure that supply meets demand.
Use of the
Flexibility Factor?
NO –a ‘margin of choice’ was not applied in the ELR based on discussions and agreement
with Trafford Council. It was viewed that a 20% margin of choice was too high as most
criteria for location by sector are the same. In addition, it was considered that at 20%
other uses such as leisure development (which is an aspiration for the Council) could
potentially be restricted from developing.
Summary of
District’s
existing/potential
supply of sites
131.9/283.76ha
Key implication: Supply concentrated in Trafford Park and Carrington, with modest
amounts of office space in Old Trafford and Altrincham Town Centre.
Revised RSS Policy
W3 Demand
projections (take-up
in past 5 years,
excluding 20%
flexibility)
337ha rising to 357ha incorporating 6% growth factor.
Key implication: very high recent levels of past take up rates (17.7ha) distort the Trafford
picture, as the highest 3 years of supply occurred within the last 5 years of this data. The
10 year average supply works out at 13.2 hectares per year.
Job growth (GMFM)
2007-27
9.2ha / 27.7ha (net)
Key implication: highest growth forecasts behind Manchester City. Particularly strong
growth forecast in the B8 industries.
Implications of
landless growth for
District
Strong role in providing B2/B8 land for development, although it is likely that Trafford Park
may accommodate more high density office uses in future along with Altrincham Town
Centre.
Key implication: Moderate future prospects for landless growth.
Conclusions re:
demand v. supply
• Trafford has strong prospects for growth in financial and professional services, in IT
and a diverse range of manufacturing sub-sectors.
• The 100-170ha ELR demand projections did not incorporate the 20% flexibility factor.
• The district has 132ha of employment land, potentially rising to 284ha.

Greater Manchester Employment Land Position Statement
40658/700918v1
WIGAN Comment
Strengths/weaknesses/
aims/potential
The council are keen to turn around the Borough’s negative image through improving
the infrastructure and opening up the Borough east/west. Wigan retains a range of
manufacturing subsectors, particularly mechanical and electrical engineering. Also a
concentration of logistics activity, capitalising upon the north/south accessibility of
the area. Considerable areas of brownfield land suitable for economic development,
although many sites remain constrained due to a variety of historical factors.
Key Implication: Considerable transport infrastructure investment (such as the
completion of Wigan’s inner relief road) likely to improve already established demand
for logistics.
Potential growth sector
impacts
Wigan is particularly well suited for logistics, engineering & manufacturing and food
and drink.
Summary conclusions of
ELR
The ELR identified a potential shortfall of 168.04ha of employment land if the top
end of the demand projections (335.59ha) were targeted. The ELR recommended
including the top-rated Safeguarded Land sites to add a further 84.76ha to the
forward supply.
Summary of ELR Demand
Projections (2007-26)
265-304ha (ELR recommended 293-336ha 2005-26)
Key implication: Potential shortfall of land even if Safeguarded Land sites are
included.
Use of the Flexibility
Factor?
YES – 20% ‘margin of choice’ applied in accordance with North West Employment
Land Study recommendations.
Summary of District’s
existing/potential supply
of sites
212.22/275ha
Key implication: The Core Strategy is seeking to provide around 275ha of
employment land, comprising 150ha of existing allocations; over 100ha on proposed
key ‘strategic’ sites (most of which comprise existing Safeguarded Land), plus
windfall town centre sites. This figure is below the ELR forecast demand projections.
Revised RSS Policy W3
Demand projections
(take-up in past 5 years,
excluding 20% flexibility)
234ha rising to 248ha incorporating 6% growth factor.
Key implication: past take up rates have lowered in recent years although still
relatively high in the sub-regional context.
Job growth (GMFM)
2007-27
-23.1ha / -7.3ha (net)
Key implication: Similar growth forecasts to Rochdale, with ongoing declines in B2
manufacturing offset to an extent by relatively strong growth in B1.
Implications of landless
growth for District
Limited evidence of landless growth in the recent past; it is considered likely that,
given the size and likely uses of the available employment land sites and the ongoing
industrial legacy of the area, landless growth will not be a strong determinant for the
foreseeable future.
Key implication: Lower future prospects for landless growth.
Conclusions re: demand
v. supply
• Wigan has reasonable prospects for growth in logistics, engineering,
manufacturing and food and drink.
• The 265-304ha ELR demand projections incorporated the 20% flexibility factor.
• The district has 212.2ha of employment land, potentially rising to 275ha.
• Wigan is weak on readily available quality sites suitable for under-represented
sectors such as knowledge base industry to take advantage of its strategic
location.

Nathaniel Lichfield and Partners
3rd Floor
One St James’s Square
Manchester
M2 6DN
www.nlpplanning.com