green economies around the world? implications of resource use for development and the environment
DESCRIPTION
This new report reveals, for the first time, data on resource use and resource efficiencyfor all countries of the world over three decades, from 1980 – 2008.TRANSCRIPT
This new report reveals, for the fi rst time, data on resource use and resource effi ciency for all countries of the world over three decades, from 1980 – 2008. The data covers the global, continental and country level, featuring illustrative case studies.
The report addresses three main issues:1. Patterns of material extraction, trade, consumption and resource productivity in
different world regions and countries;2. Connections between material use and indicators of economic and social development;3. Links between material use and selected major environmental problems, such as
carbon emissions, land use change and water use.
The report evaluates the performances of different countries, highlighting the critical issues of current trends in resource use. It thus provides innovative input for the current discussion on green economies and poverty reduction in the context of the upcoming Rio+20 Earth Summit in 2012 and beyond.
Implications of resource use for development and the environment
Monika Dittrich, Stefan Giljum, Stephan Lutter, Christine Polzin
Green economies around the world?
2
Implications of resource use for development and the environment
Monika Dittrich Stefan Giljum Stephan Lutter Christine Polzin
Green economies around the world ?
This study was supported by
10Factor T en Ins titute
3 4
1
5
Material flows and green economies
Conclusions and outlook
Annex
4 Material use and the environment
3 Material use and development
2 Global material use: patterns and trends
This report should be referenced as follows:Monika Dittrich, Stefan Giljum, Stephan Lutter, Christine Polzin: Green economies around the world ? Implications of resource use for development and the environment. Vienna. 2012.
ISBN978-3-200-02640-7
Copyright © Monika Dittrich and Stefan Giljum, 2012.
Text and figures from this publication may be reproduced in whole or in part and in any form for educational or nonprofit purposes without special permission from the copyright holder, provided acknowledgement of the source is made.The authors would appreciate receiving a copy of any publication that uses this publication as a source.
Contributions and Acknowledgements
We thank Friedrich Schmidt-Bleek, Fritz Hinterberger, Barbara Lugschitz and Sigrid Grünberger for their inputs to this publication. Boris Braun ( University of Cologne ) and Helmut Schütz ( Wuppertal Institute ) for their detailed and helpful reviews throughout the report.Jaakko Kooroshy ( Chatham House ), Charles Gore ( UNCTAD ), Jens Günther ( UBA ), Ariadna Rodrigo and Michael Warhurst ( Friends of the Earth ) for helpful comments, Jaya Mohan for english proof reading as well as Thomas Patz, Sebastian Lobo, Antonio Jose Escobar Rodriguez and Christian Kerschner for various support work.
We furthermore thank all supporting Institutions named on the previous page as well as UNCTAD for their contribution in particu-lar with regard to the research on African countries. The contribution of GIZ was part of the project “Enhancing low-carbon development by greening the economy” with the support of the Federatl Ministry for the Environment ( BMU ) through the International Climate Initiative ( IC ) . The contribution of HBS was on behalf of European Union. This Document has been produced within the EU Project EcoFair Trade Dialogue. The Document is produced with the financial assistance of the European Union. The contents of this publication are the sole responsibility of M. Dittrich, S. Giljum, S. Lutter and C. Polzin and can in no way be taken to reflect the views of the European Union.
First published in Vienna, Austria, 2012 by
Monika Dittrich Stefan Giljum, Stephan Lutter and Christine PolzinIndependent Scientist Sustainable Europe Research Institute ( SERI )
Contact: Contact:Burgstrasse 24 Garnisongasse 7/1769121 Heidelberg 1090 ViennaGermany [email protected] [email protected]
Contents
72
64
52
34
16
8
5 6
Forewords
Kandeh K. YumkellaDirector-General United Nations Industrial Development Organization ( UNIDO )
UNIDO coined the concept “Green Industry” to place industrial development in the context of new global sustainable development challenges. Simply defined, Green Industry refers to sustainable industrial production that does not damage the planet or human health. It is a strategy to create an industrial system that does not produce pollution and does not require an ever-growing use of natural resources.Economies must strive for a more sustainable growth path by undertaking green public investments and implementing public policy initiatives that encourage environmentally responsible private investments and business. As material resources become scarcer, securing resource-efficient, low-carbon growth is more vital than ever to sustain the planet ’s ecosystems and the services they provide.Business as usual is not an option. At UNIDO, we are working to encourage the decoupling of economic growth from the use of natural resources and its negative environmental impacts. By greening existing industrial activities and creating new sustainable productive activities, we create new jobs while protecting the envi-ronment, which in turn reduces poverty and raises living standards in developing countries.UNIDO has been engaged in a longstanding and successful cooperation with the Sustainable Europe Research Institute ( SERI ). UNIDO recognizes the value of SERI’s research in exploring issues of resource dependency and efficiency more broadly and deeply, and in helping to find alternative approaches to economic growth and development that are less dependent on resource usage than current models.This report is the first to analyse the worldwide trends and dynamics of material extraction, trade, consumption and productivity between 1980 and 2008. Despite a growing acknowledgement of the interconnectedness between society and nature, this aspect of development is only now getting the attention that it deserves as we forge ahead with the creation of green economies and more sustainable development.I am pleased by the innovative nature of this report, and proud that UNIDO is part of it. Now, more than ever, we must secure resource-efficient, low-carbon growth to ensure a healthy planet for future generations.
Jochen FlasbarthPresident German Federal Environment Agency
The consequences of the growing extraction and use of natural resources and the associated environmental impacts, such as climate change, are increasing. More and more, global resource use exceeds the regeneration rates of our ecosystems. Therefore, the sustainable use of natural res ources has been a key issue for the German Federal Environment Agency ( UBA ) for years. Important goals are to reduce global resource consumption in absolute terms and to minimize the interlinked ecological and social impacts of our resource consumption. That is to dematerialise our societies in industrialised countries by a factor of 10 or more to meet the needs of all people in the future. To achieve these goals, we need a sound understanding of the different aspects of flows of materials like fossil fuels, biomass, metals and minerals, including all the relevant life cycle stages.By providing a global picture of past and current distribution, trends and basic patterns of resource use between 1980 and 2008 around the world and illustrating their links to development and environmental issues in industrialised, emerging and developing countries, this study provides valuable support in developing and better designing effective resource policies. It clearly shows that the global resource extraction is increasing at an unprecedented rate and with it, the consumption of raw materials, land, water and energy soars ever higher. This study underlines the need for action.
Ernst U. von WeizsäckerCo-chair of International Resource Panel United Nations Environment Programme ( UNEP )
The world faces major environmental and economic challenges caused by the growing overall scale of human’s resource consumption. Resources are indispensable for human life, but the highly energy- and material-intensive development model of recent decades has clearly proven to be unsustainable, given geological and spatial limits and heavy environmental impacts. Twenty years ago, in Rio de Janeiro, nations agreed on the new paradigm of sustainable development. Although this agreement triggered remarkable efforts at the global level and in the majority of countries, decoupling of human well-being from resource consumption is still a major challenge for policy makers and societies around the world.This Report provides an impressive global overview of empirical trends and levels of material use over the past three decades. Furthermore, it provides essential information about links between resource use and development as well as between resource use and environmental problems. It illustrates the dramatic changes which took place over the past decades and emphasizes that reducing the overall scale of resource consumption is a major challenge not only in highly developed countries but also in many emerging and developing economies. The report points to the urgency for policy makers and society to develop and implement strategies to enhance human well-being while significantly lowering inputs of natural resources. I, for one, remain optimistic about technological and societal decoupling opportunities waiting to be developed and harvested.
Michael WarhurstResources and Consumption Campaign Friends of the Earth Europe
This useful and intriguing study demonstrates the scale of – and the inequalities in – humanity’s resource consumption, and challenges everyone to come up with solutions for a more sustainable and equitable society.Some will criticise the focus on tonnes of material used – but the reality is, this is the category of resource use where we currently have the most data available, and this report demonstrates that you can learn a huge amount from this approach.Friends of the Earth Europe has been working with SERI since 2008 to develop and promote a more holistic approach to resource consumption, focussing on land footprint, water footprint, carbon footprint and material use, with each of these metrics including the “virtual” resource use used to make imported products.We believe that using these metrics – at the level of the economy, in policy analysis, in organisations or for products, will facilitate increased resource efficiency and increased resource equity, around the world. Already, there are studies looking at the way in which carbon footprint, water footprint and land footprint are traded around the world, which expose the massive inequalities in resource use. At the same time, humanity’s constant increase in resource consumption is destroying ecosystems, for example through our ever-increasing land demand – and severely damaging our climate.We must become more resource efficient, distribute resources more equitably, and reduce the resource consumption of richer countries – focussing on quality of life, not quantity of consumption.
7
XXX
8
XXX
Material flows and green economies1
Green economies: why material flows matter ................................ 8
Friedrich Schmidt-Bleek: Measuring resource use ........................... 10
Measuring material flows .......................................................... 11
Glossary and methodological choices ......................................... 12
Objectives and structure of this report .......................................... 13
9 10
In its current working definition, the UN Environment Programme ( UNEP ) defines the green economy not only as an economy-environment nexus but as an economy that results in improved human well-being and social equity, while significantly reducing environmental risks4. Green economies can thus be a vital component enabling the overarching goal of sustainable development.
The Rio+20 summit aims at promoting the goal of creating such low carbon, resource efficient and socially inclusive economies around the world. This may be achieved by fostering investment that reduces carbon emissions and pollution, enhances energy and resource efficiency, and prevents the loss of biodiversity and ecosystem services around the world.
This report sheds light on the physical or material basis ofdevelopment over the past three decades, including the distribution of resources and resource use, and asks to what extent it is possible to establish green economies around the world.
Primary resources form the material basis of all human activities, including production and consumption of goods and services. An assessment of material flows indicates how societies extract primary resources from ecosystems and the earth’s crust, transform them into commodities, which are then used for different purposes, such as food, furniture, machines, buildings and roads, and products, which are part of our daily life. The amounts and types of materials used as inputs to our production systems also determine the flows of waste and emissions back to nature. Whatever materials humans extract for their socio-economic system, sooner or later become waste.
Twenty years ago, political leaders gathered in Rio de Janeiro to dis cuss issues of poverty, growing disparities between the industrialised and developing world and the impact of industrial development on the environment. Together, they aimed to set the course for sustainable development worldwide.
Despite 20 years of remarkable economic development, especially in some of the most populous and dynamic emerging economies, the gap between industrialised and developing countries is still large, and problems associated with the environment have increased significantly. Resource prices are surging and competition for scarce resources has intensified. This is a serious challenge for countries around the world, but especially so for low-income countries. These social, environmental and economic dimensions are reflected in the concept of the green economy.
“ Green ” has become a buzzword in debates about sustainable development. A number of Green terms abound, such as “ green economy ”, which is one of the two main themes at the Rio+20 United Nations ( UN ) Conference on Sustainable Development1; “ green growth2 ”, suggested as an alternative, more environmentally benign concept, to standard economic growth; or “ green industry3 ”, which is defined as a pattern of industrial development that is economically, environmentally and socially sustainable.
Green economies: why material flows matter
So far, the physical dimension of development has yet to receive adequate attention in the debate about green economies and sustainable development. However, the interconnectedness between society and nature has been increasingly analysed and acknowledged.
A large number of studies have investigated the implications of increasing globalisation and deeper integration of countries in world markets for the environment and develop-ment. However, only a few studies explicitly addressed the issue of material use. An analysis of material flows between different regions therefore provides an important additional perspective on development trends, which can complement prevailing economic explanations and monetary indicators.
Analysing resource flows also becomes important from the perspective of increasing resource scarcities, which lead to a growing number of environmental conflicts. Those conflicts range from local conflicts to international tensions over access to resources.
Apart from various studies by the authors of this report – many of them commissioned by UNIDO5, 6, 7 and UNCTAD8 – important studies with international or global scope have been published by the UNEP Resource Panel, in particular the report Decoupling natural resource use and environmental impacts from economic growth9. Other studies include the unep report on resource efficiency in the Asia and Pacific region10. Factor Five11 is an example of a pub lication explaining the fundamental concept of resource productivity. Current scientific issues on material flow analysis are discussed predominantly in academic journals such as the Journal of Industrial Ecology12 or Ecological Economics13.
Global material use has reached a level that is jeopardsing the sustainable functioning of the planet ’s ecosystems and the services they provide. Policy debates in recent years have thus focused on ways of decoupling economic growth from the use of natural resources and its negative environmental impacts. Following the example of labour productivity improvements over the past decades, resource productivity has received increasing attention in the 1990s, as reflected in concepts such as Factor 5, introduced by Ernst Ulrich von Weizsäcker or Factor 10, developed by Friedrich Schmidt-Bleek14.
While improvements in technologies have resulted in great progress in resource efficiency, the overall dynamics of economic growth have outstripped these achievements in efficiency. Thus, although we are getting relatively better at utilising scarce resources, the overall environmental burden has only increased over the past few decades. Improved resource efficiency may actually have served as a driver to the net increase in ecological impacts through the so-called “ rebound effect ” – a situation, where the financial savings resulting from reduced material and pollution costs are reinvested to expand operations and increase consumption, thus stimulating economic growth.
Therefore, a truly green economy at the global level will only be realised if an absolute dematerialisation of production and consumption can be achieved. This implies a radical reduction in the scale, volume and rate of human resource use. At the same time, it is essential that green economies satisfy the material needs of the population and achieve a high level of well-being worldwide.
11 12
A large number of existing statistics can be drawn upon to calculate indicators on material use. Information on quantities of different materials being extracted, traded and consumed by different countries can be referenced from existing material, which includes:
agricultural, forestry and fishery statistics for the different •categories of biomass, energy statistics for the different fossil energy carriers, industrial production statistics as well as geological •surveys, from which information on the extraction of minerals and metal ores can be retrieved, andexternal trade statistics, reporting on the physical •quantities being imported and exported across the borders.
In some cases, estimations need to be applied in order to fill statistical data gaps, to complete indicators with figures not covered by statistics ( for example, the uptake of biomass through grazing animals ) or to standardise data ( e.g. by water content ). Estimates have been applied conservatively throughout this study. The methodological description in the Annex provides more details on data quality issues.
With material flow analysis, the flow of materials from extraction to consumption to final disposal can be illustrated. All production processes start with the extraction of materials from nature, where they cross the border to the socio- economic system. Recycling is an exception to this general rule, but it still plays a minor role for most materials. Products made from those raw materials can either be consumed domestically or exported to other countries. Due to intensified globalisation and international trade, the amounts of materials being imported and exported become increasingly important while studying the overall material flows of a country. At the end of the life-cycle, materials are discarded, and go back to nature. However, this aspect is not the focus of this report.
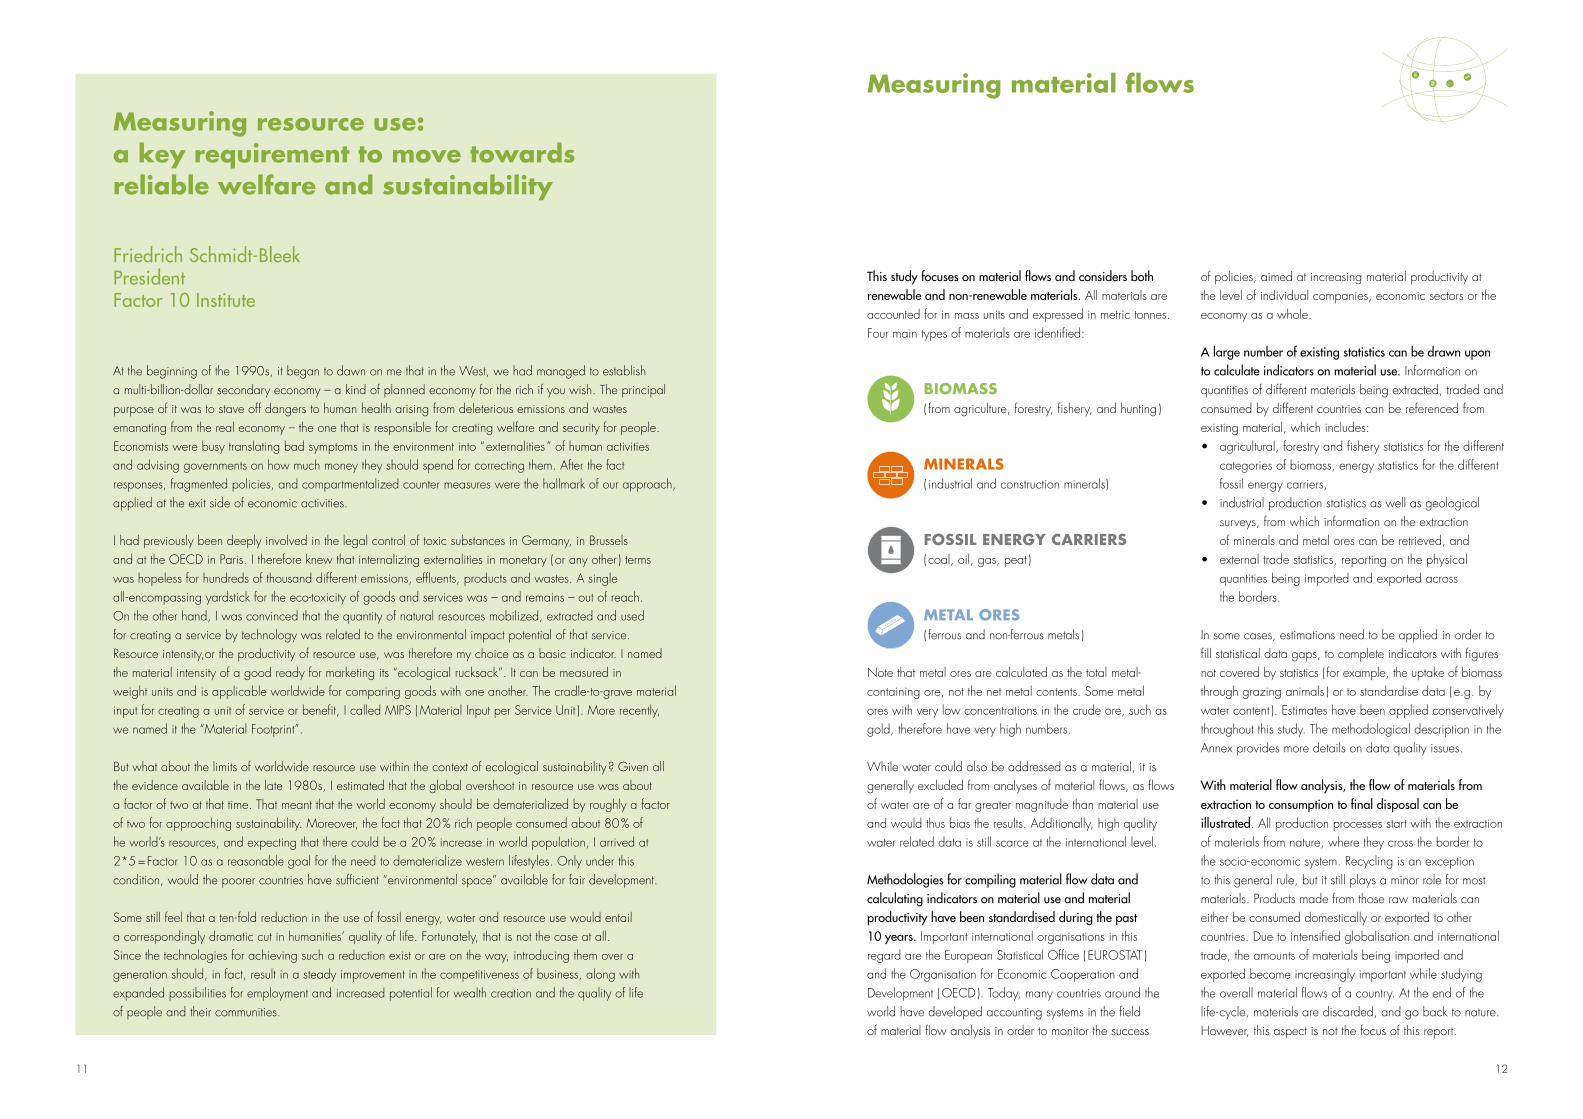
This study focuses on material flows and considers both renewable and non-renewable materials. All materials are accounted for in mass units and expressed in metric tonnes. Four main types of materials are identified:
Biomass( from agriculture, forestry, fishery, and hunting )
minerals ( industrial and construction minerals )
Fossil enerGy Carriers( coal, oil, gas, peat )
metal ores( ferrous and non-ferrous metals )
Note that metal ores are calculated as the total metal- containing ore, not the net metal contents. Some metal ores with very low concentrations in the crude ore, such as gold, therefore have very high numbers.
While water could also be addressed as a material, it is generally excluded from analyses of material flows, as flows of water are of a far greater magnitude than material use and would thus bias the results. Additionally, high quality water related data is still scarce at the international level.
Methodologies for compiling material flow data and calculating indicators on material use and material productivity have been standardised during the past 10 years. Important international organisations in this regard are the European Statistical Office ( EUROSTAT ) and the Organisation for Economic Cooperation and Development ( OECD ). Today, many countries around the world have developed accounting systems in the field of material flow analysis in order to monitor the success
At the beginning of the 1990s, it began to dawn on me that in the West, we had managed to establish a multi-billion-dollar secondary economy – a kind of planned economy for the rich if you wish. The principal purpose of it was to stave off dangers to human health arising from deleterious emissions and wastes emanating from the real economy – the one that is responsible for creating welfare and security for people. Economists were busy translating bad symptoms in the environment into “ externalities ” of human activities and advising governments on how much money they should spend for correcting them. After the fact responses, fragmented policies, and compartmentalized counter measures were the hallmark of our approach, applied at the exit side of economic activities.
I had previously been deeply involved in the legal control of toxic substances in Germany, in Brussels and at the OECD in Paris. I therefore knew that internalizing externalities in monetary ( or any other ) terms was hopeless for hundreds of thousand different emissions, effluents, products and wastes. A single all-encompassing yardstick for the eco-toxicity of goods and services was – and remains – out of reach. On the other hand, I was convinced that the quantity of natural resources mobilized, extracted and used for creating a service by technology was related to the environmental impact potential of that service. Resource intensity,or the productivity of resource use, was therefore my choice as a basic indicator. I named the material intensity of a good ready for marketing its “ecological rucksack”. It can be measured in weight units and is applicable worldwide for comparing goods with one another. The cradle-to-grave material input for creating a unit of service or benefit, I called MIPS ( Material Input per Service Unit ). More recently, we named it the “Material Footprint”.
But what about the limits of worldwide resource use within the context of ecological sustainability ? Given all the evidence available in the late 1980s, I estimated that the global overshoot in resource use was about a factor of two at that time. That meant that the world economy should be dematerialized by roughly a factor of two for approaching sustainability. Moreover, the fact that 20 % rich people consumed about 80 % of he world’s resources, and expecting that there could be a 20 % increase in world population, I arrived at 2*5 = Factor 10 as a reasonable goal for the need to dematerialize western lifestyles. Only under this condition, would the poorer countries have sufficient “environmental space” available for fair development.
Some still feel that a ten-fold reduction in the use of fossil energy, water and resource use would entail a correspondingly dramatic cut in humanities’ quality of life. Fortunately, that is not the case at all. Since the technologies for achieving such a reduction exist or are on the way, introducing them over a generation should, in fact, result in a steady improvement in the competitiveness of business, along with expanded possibilities for employment and increased potential for wealth creation and the quality of life of people and their communities.
measuring resource use: a key requirement to move towards reliable welfare and sustainability
Friedrich Schmidt-BleekPresident Factor 10 Institute
measuring material flows
of policies, aimed at increasing material productivity at the level of individual companies, economic sectors or the economy as a whole.
13 14
Key methodological choices
A focus on direct material flowsThis study focuses on direct flows. Indirect ( or embodied, hidden ) material flows associated with imports and exports are not considered, neither is so-called “unused extraction ”, such as overburden from mining or harvest losses. However, these flows are very important and some selected examples are included in order to demonstrate their importance. Future work should focus on the improvement of data quality regarding unused extraction and indirect flows of trade at the global level, in order to calculate more comprehensive indicators on material use.15
Measuring material productivityThere are different ways to measure material productivity, for example by using consumption or input indicators or by using different concepts of measuring income. In this study, material productivity is calculated as GDP ( in purchasing power parity in constant terms, 200516 ) per unit of DMC which is also the current approach for the European Sustainable Development Indicators.
Data qualityData of comparatively weak quality ( amount of estimated flows exceed amount of known flows, e.g. in various African countries during selected years ) has been only integrated in the regional and global aggregates. The respective countries are not used as examples in figures.
Central terms used in this study
Resources versus materials: Often, both terms are used inter changeably, but “ resources ” refers to a broader range of categories ( including energy, water and land ) than “ materials ”. In this study, the term materials is used for all physically present materials except water. The term resource is applied as in common usage, such as “ resource scarcity ” or “ resource-rich ”.
Extraction in this study refers to the indicator “ Domestic Extraction Used ”, which measures the flows of materials that originate from the environment and physically enter the economic system for further processing or direct consumption.
The Physical Trade Balance ( PTB ) is defined as imports minus exports measured in physical terms ( mass ).
Domestic Material Consumption ( DMC ) is defined as the total amount of materials directly used in an economy and calculated as extraction plus imports minus exports.
The term material use is used as a generic term, including extraction, trade and consumption.
Material productivity illustrates the amount of economic value generated per tonne of materials used. The inverse measure is termed material intensity, which shows how much material is necessary to produce one unit of GDP.
Decoupling refers to the amount of materials in relation to economic output or in relation to environmental impact. Relative decoupling means that resource use or environ-mental impact is growing slower than economic output. Absolute decoupling refers to a decrease in resource use or environmental impact in absolute terms.
Glossary and methodological choices
Objectives
This report is the first to analyse the development of material flows for all countries worldwide between 1980 and 2008.
With the help of indicators based on material flow data, questions such as the following are addressed:
How has global material extraction and trade in materi-•als developed over the past 30 years ? Which countries have consumed most materials in abso-•lute and in per capita terms ? What are the differences between high consuming and low consuming countries ?How has material productivity developed since 1980, •and how does it differ across the world ? How do different development paths differ in their use •of renewable and non-renewable materials ? How is material use linked to income, human development and well-being ? How is material use linked to various environmental •impacts ?
Addressing these and other questions related to material use is essential if the potential of different countries to create green economies is to be assessed. The question whether current specialisation trends allow all countries to achieve a highly resource efficient and green development path is also addressed.
Looking at the trends in material use since 1980 thus helps to assess whether or not we are on the right track, if there are any “ good practice ” examples of countries that are already on their way to becoming green economies.
Structure of the report
Following the introductory Chapter 1, Chapter 2 ( Global material use: patterns and trends ) provides an overview of the general trends and dynamics of material extraction, trade, consumption and productivity and changes therein between 1980 and 2008. Trends are illustrated at the global level in different regions of the world and for the main material categories. This chapter also covers basic information on dependencies and differences in absolute and per capita consumption.
Chapter 3 ( Material use and development ) analyses the links between material consumption and income, two important indicators of development.
Chapter 4 ( Material use and the environment ) takes a more detailed look at environmental impacts of material flows. Using examples of each material category, the chapter aims to explain how all flows of materials, even of supposedly neutral ones, have different environmental impacts and how most material flows and their environümental impacts are closely related.
Chapter 5 ( Conclusions and outlook ) takes a look at the future and discusses “ business as usual ” scenarios as well as elements required for a global change towards more sustainable patterns of material use.
The Annex provides a methodological description and presents selected data and key indicators.
Further data on material extraction, trade, consumption and productivity are published online at www.materialflows.net, the online portal for global material flow data.
objectives and structure of this report
15
XXX
16
XXX
2 Global material use: patterns and trends
Global trends of resource use at a glance .................................... 16
Regional trends of resource use at a glance .................................. 18
The material basis of the world economy ..................................... 20
The physical dimension of global trade ........................................ 22
Global allocation of materials via trade ....................................... 24
From export to import dependencies ? ......................................... 26
„Large“ and „small“ consuming countries .................................... 28
Consumption: from survival to affluence ....................................... 30
Material productivity: sufficient progress ? ..................................... 32
17 18
Global trends of material use at a glance
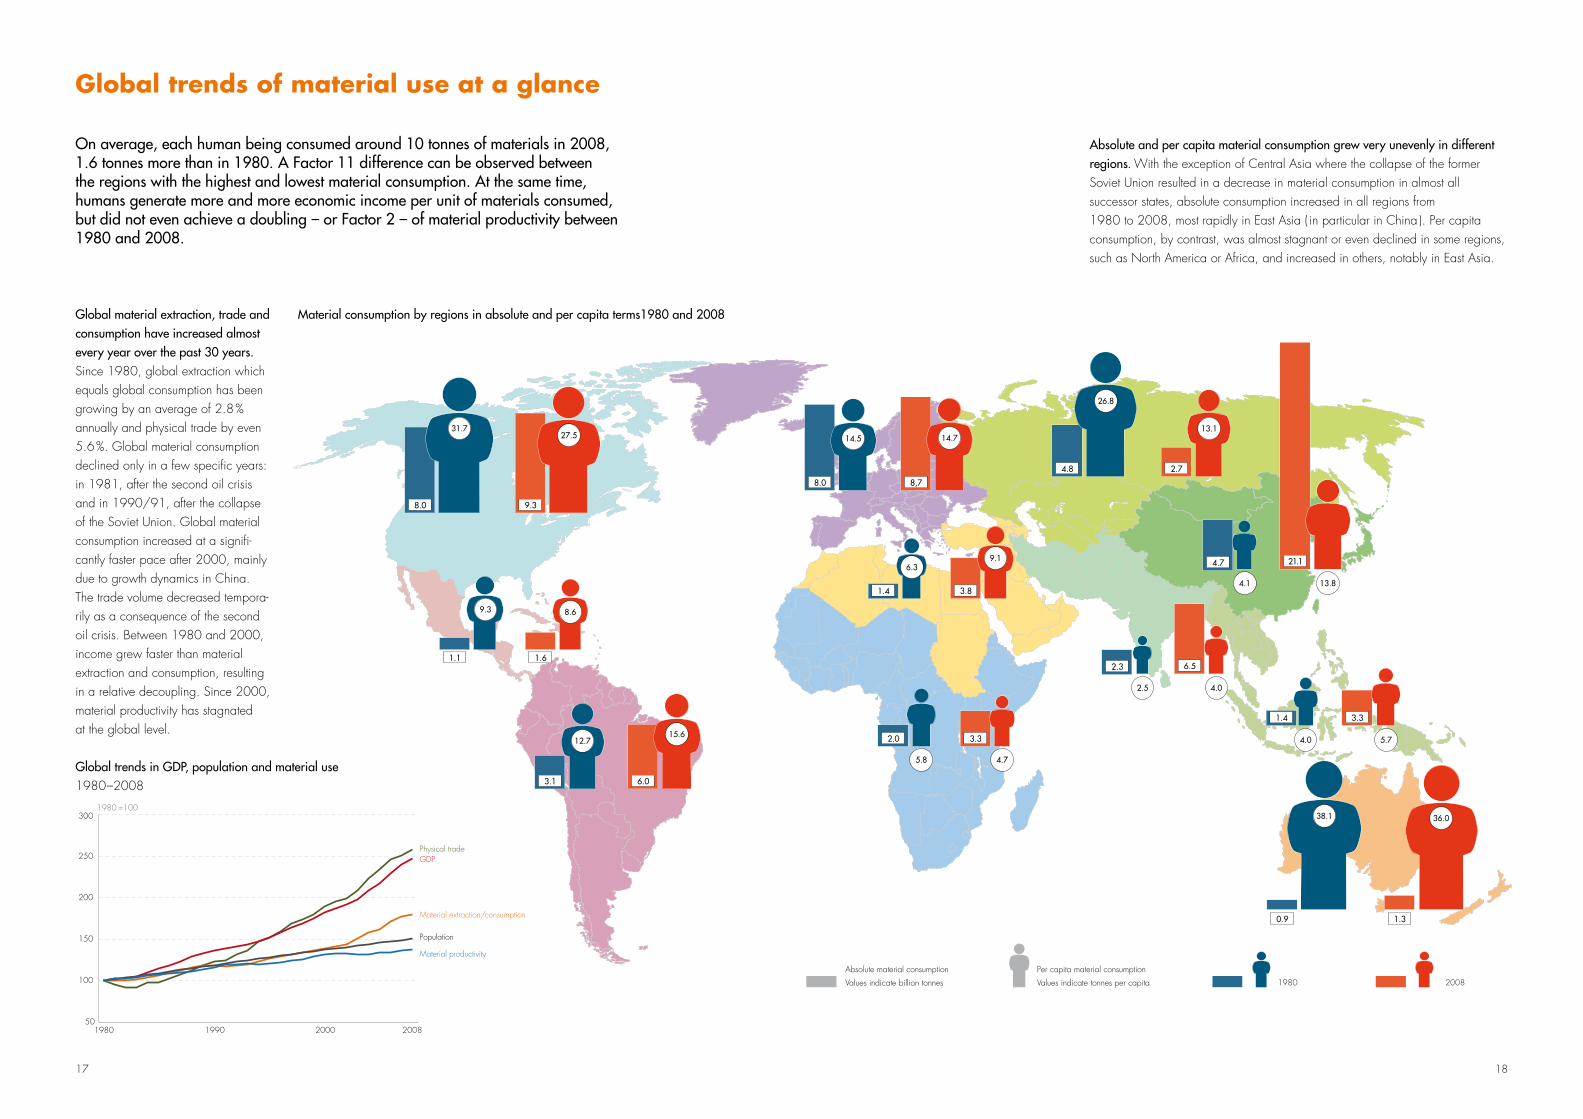
On average, each human being consumed around 10 tonnes of materials in 2008, 1.6 tonnes more than in 1980. A Factor 11 difference can be observed between the regions with the highest and lowest material consumption. At the same time, humans generate more and more economic income per unit of materials consumed, but did not even achieve a doubling – or Factor 2 – of material productivity between 1980 and 2008.
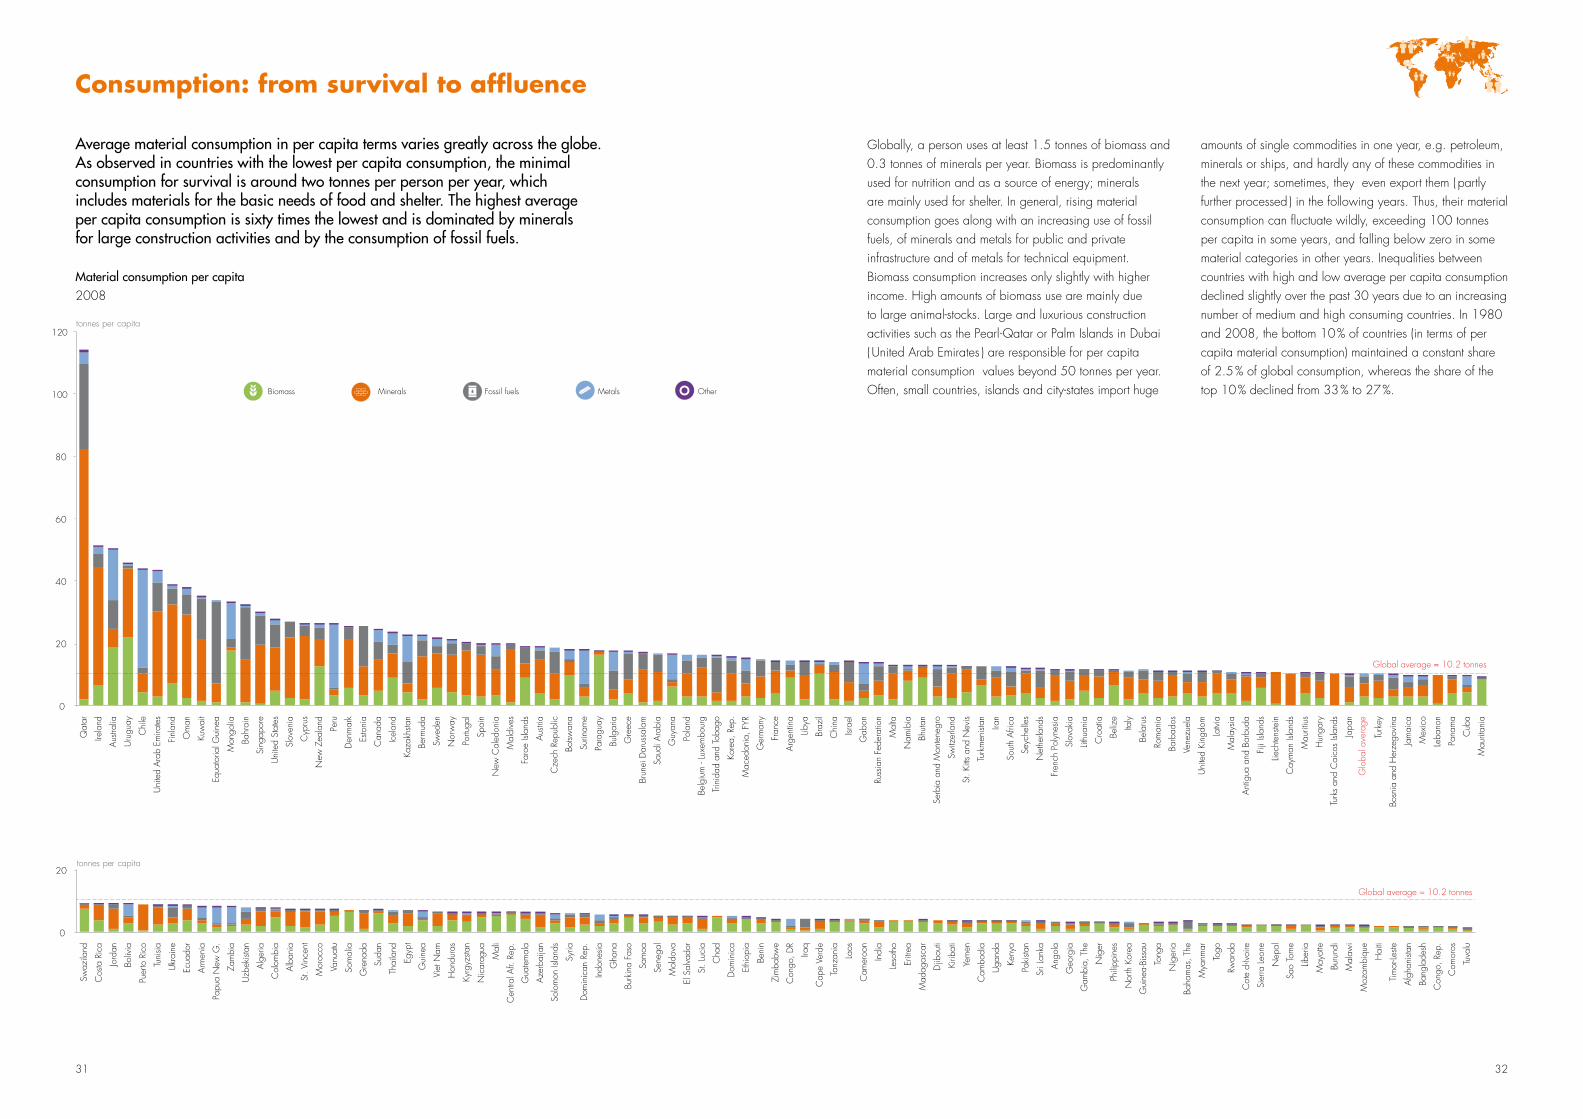
Global material extraction, trade and consumption have increased almost every year over the past 30 years. Since 1980, global extraction which equals global consumption has been growing by an average of 2.8 % annually and physical trade by even 5.6 %. Global material consumption declined only in a few specific years: in 1981, after the second oil crisis and in 1990/91, after the collapse of the Soviet Union. Global material consumption increased at a signifi-cantly faster pace after 2000, mainly due to growth dynamics in China. The trade volume decreased tempora-rily as a consequence of the second oil crisis. Between 1980 and 2000, income grew faster than material extraction and consumption, resulting in a relative decoupling. Since 2000, material productivity has stagnated at the global level.
Absolute and per capita material consumption grew very unevenly in different regions. With the exception of Central Asia where the collapse of the former Soviet Union resulted in a decrease in material consumption in almost all successor states, absolute consumption increased in all regions from 1980 to 2008, most rapidly in East Asia ( in particular in China ). Per capita consumption, by contrast, was almost stagnant or even declined in some regions, such as North America or Africa, and increased in others, notably in East Asia.
21.14.7
2.7
6.52.3
1.4 3.3
0.9 1.3
3.32.0
1.4 3.8
8,7
4.8
8.0
8.0 9.3
1.61.1
6.03.1
20081980
Absolute material consumption
Values indicate billion tonnes
Per capita material consumption
Values indicate tonnes per capita
13.84.1
13.1
26.8
14.5 14.7
6.39.1
31.727.5
9.3 8.6
12.715.6
5.8 4.7
2.5 4.0
4.0 5.7
38.1 36.0
Material consumption by regions in absolute and per capita terms1980 and 2008
50
100
150
200
250
300
1980 1990 2000 2008
1980 =100
Physical trade
Material productivity
Population
Material extraction/consumption
GDP
Global trends in GDP, population and material use 1980–2008
19 20
Regional trends in material productivity
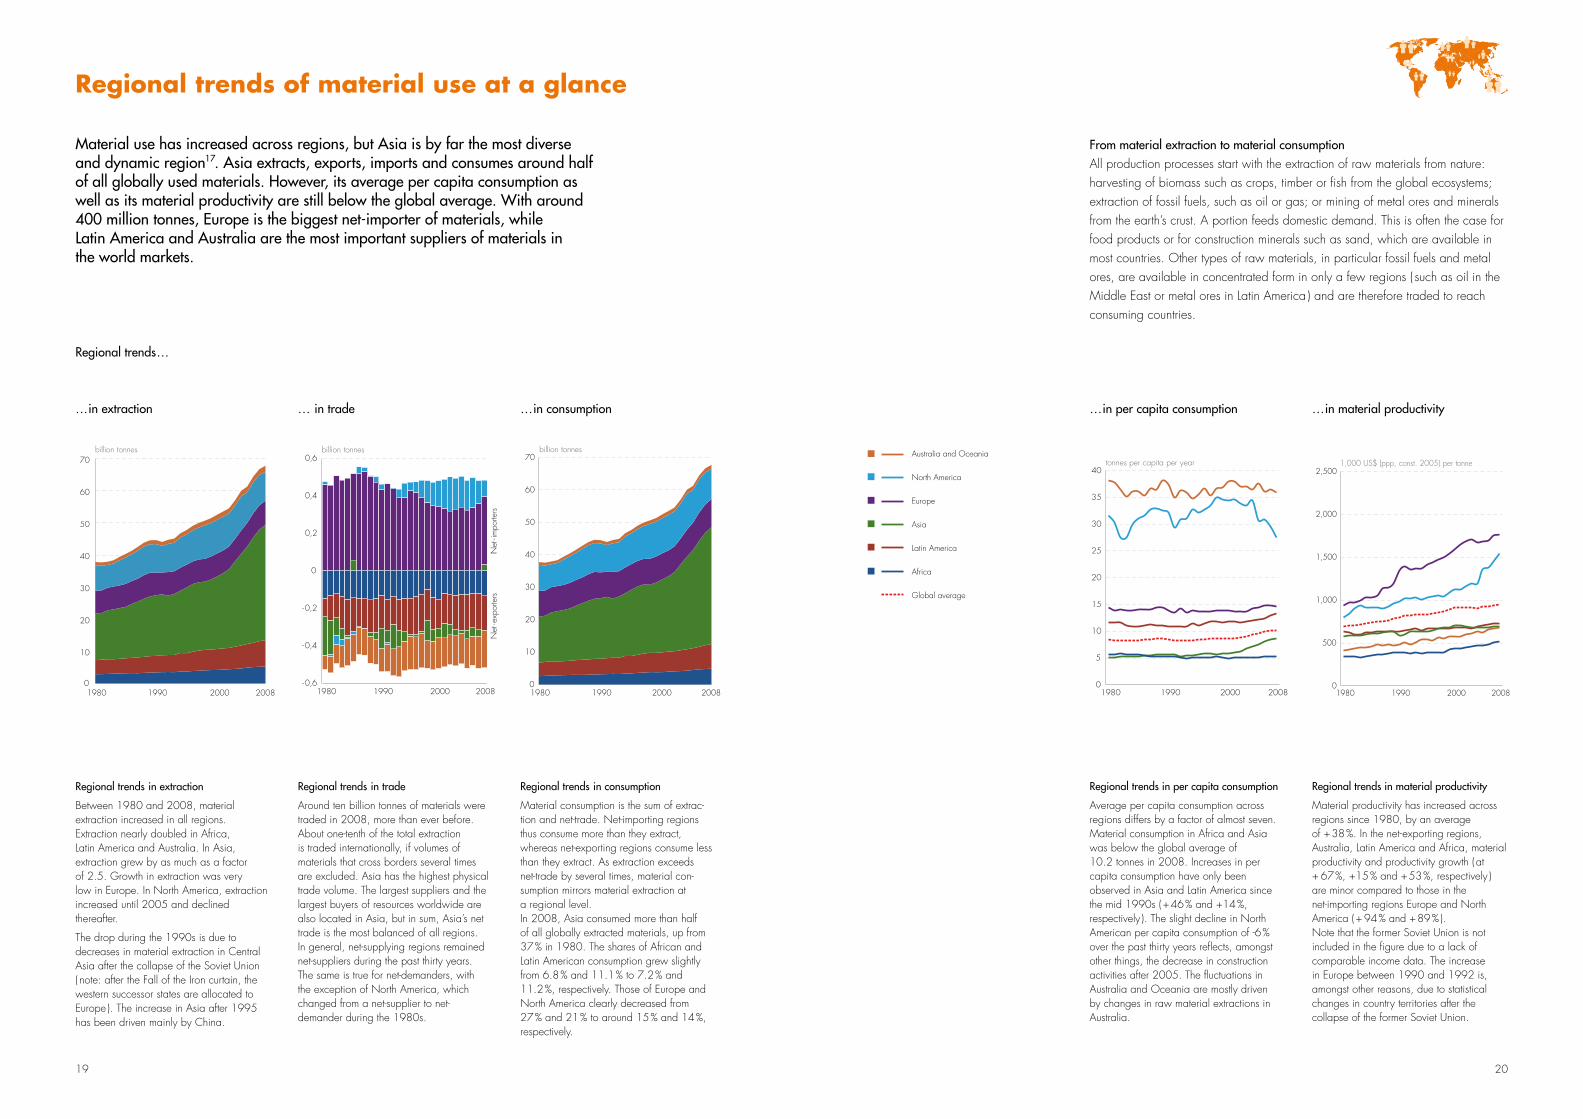
Material productivity has increased across regions since 1980, by an average of + 38 %. In the net-exporting regions, Australia, Latin America and Africa, material productivity and productivity growth ( at + 67 %, +15 % and + 53 %, respectively ) are minor compared to those in the net-importing regions Europe and North America ( + 94 % and + 89 % ). Note that the former Soviet Union is not included in the figure due to a lack of comparable income data. The increase in Europe between 1990 and 1992 is, amongst other reasons, due to statistical changes in country territories after the collapse of the former Soviet Union.
Regional trends in per capita consumption
Average per capita consumption across regions differs by a factor of almost seven. Material consumption in Africa and Asia was below the global average of 10.2 tonnes in 2008. Increases in per capita consumption have only been observed in Asia and Latin America since the mid 1990s ( + 46 % and +14 %, respectively ). The slight decline in North American per capita consumption of -6 % over the past thirty years reflects, amongst other things, the decrease in construction activities after 2005. The fluctuations in Australia and Oceania are mostly driven by changes in raw material extractions in Australia.
Regional trends in consumption
Material consumption is the sum of extrac-tion and net-trade. Net-importing regions thus consume more than they extract, whereas net-exporting regions consume less than they extract. As extraction exceeds net-trade by several times, material con-sumption mirrors material extraction at a regional level.In 2008, Asia consumed more than half of all globally extracted materials, up from 37 % in 1980. The shares of African and Latin American consumption grew slightly from 6.8 % and 11.1 % to 7.2 % and 11.2 %, respectively. Those of Europe and North America clearly decreased from 27 % and 21 % to around 15 % and 14 %, respectively.
Regional trends in trade
Around ten billion tonnes of materials were traded in 2008, more than ever before. About one-tenth of the total extraction is traded internationally, if volumes of materials that cross borders several times are excluded. Asia has the highest physical trade volume. The largest suppliers and the largest buyers of resources worldwide are also located in Asia, but in sum, Asia’s net trade is the most balanced of all regions. In general, net-supplying regions remained net-suppliers during the past thirty years. The same is true for net-demanders, with the exception of North America, which changed from a net-supplier to net-demander during the 1980s.
Regional trends in extraction
Between 1980 and 2008, material extraction increased in all regions. Extraction nearly doubled in Africa, Latin America and Australia. In Asia, extraction grew by as much as a factor of 2.5. Growth in extraction was very low in Europe. In North America, extraction increased until 2005 and declined thereafter.
The drop during the 1990s is due to decreases in material extraction in Central Asia after the collapse of the Soviet Union ( note: after the Fall of the Iron curtain, the western successor states are allocated to Europe ). The increase in Asia after 1995 has been driven mainly by China.
Material use has increased across regions, but Asia is by far the most diverse and dynamic region17. Asia extracts, exports, imports and consumes around half of all globally used materials. However, its average per capita consumption as well as its material productivity are still below the global average. With around 400 million tonnes, Europe is the biggest net-importer of materials, while Latin America and Australia are the most important suppliers of materials in the world markets.
regional trends of material use at a glance
From material extraction to material consumptionAll production processes start with the extraction of raw materials from nature: harvesting of biomass such as crops, timber or fish from the global ecosystems; extraction of fossil fuels, such as oil or gas; or mining of metal ores and minerals from the earth’s crust. A portion feeds domestic demand. This is often the case for food products or for construction minerals such as sand, which are available in most countries. Other types of raw materials, in particular fossil fuels and metal ores, are available in concentrated form in only a few regions ( such as oil in the Middle East or metal ores in Latin America ) and are therefore traded to reach consuming countries.
0
10
20
30
40
50
60
70
1990 2000 2008
billion tonnes
1980
tonnes per capita per year
1980 1990 2000 2008
5
10
15
20
25
30
35
40
0
Australia and Oceania
North America
Europe
Asia
Latin America
Africa
Global average
billion tonnes
0
10
20
30
40
50
60
70
1980 1990 2000 2008 0
500
1,000
1,500
2,000
2,500
1980 1990 2000 2008
1,000 US$ (ppp, const. 2005) per tonne
- 0,6
-0,4
-0,2
0
0,2
0,4
0,6
1980 1990 2000 2008
Net
- exp
orte
rs
billion tonnes
Net
- im
porte
rs
tonnes per capita per year
1980 1990 2000 2008
5
10
15
20
25
30
35
40
0
Australia and Oceania
North America
Europe
Asia
Latin America
Africa
Global average
Regional trends…
…in per capita consumption …in material productivity…in consumption… in trade…in extraction
21 22
0
10
20
30
40
50
60
70
1980 1985 1990 1995 2000 2005 2008
billion tonnes
+89%
+60%
+133%
+35%
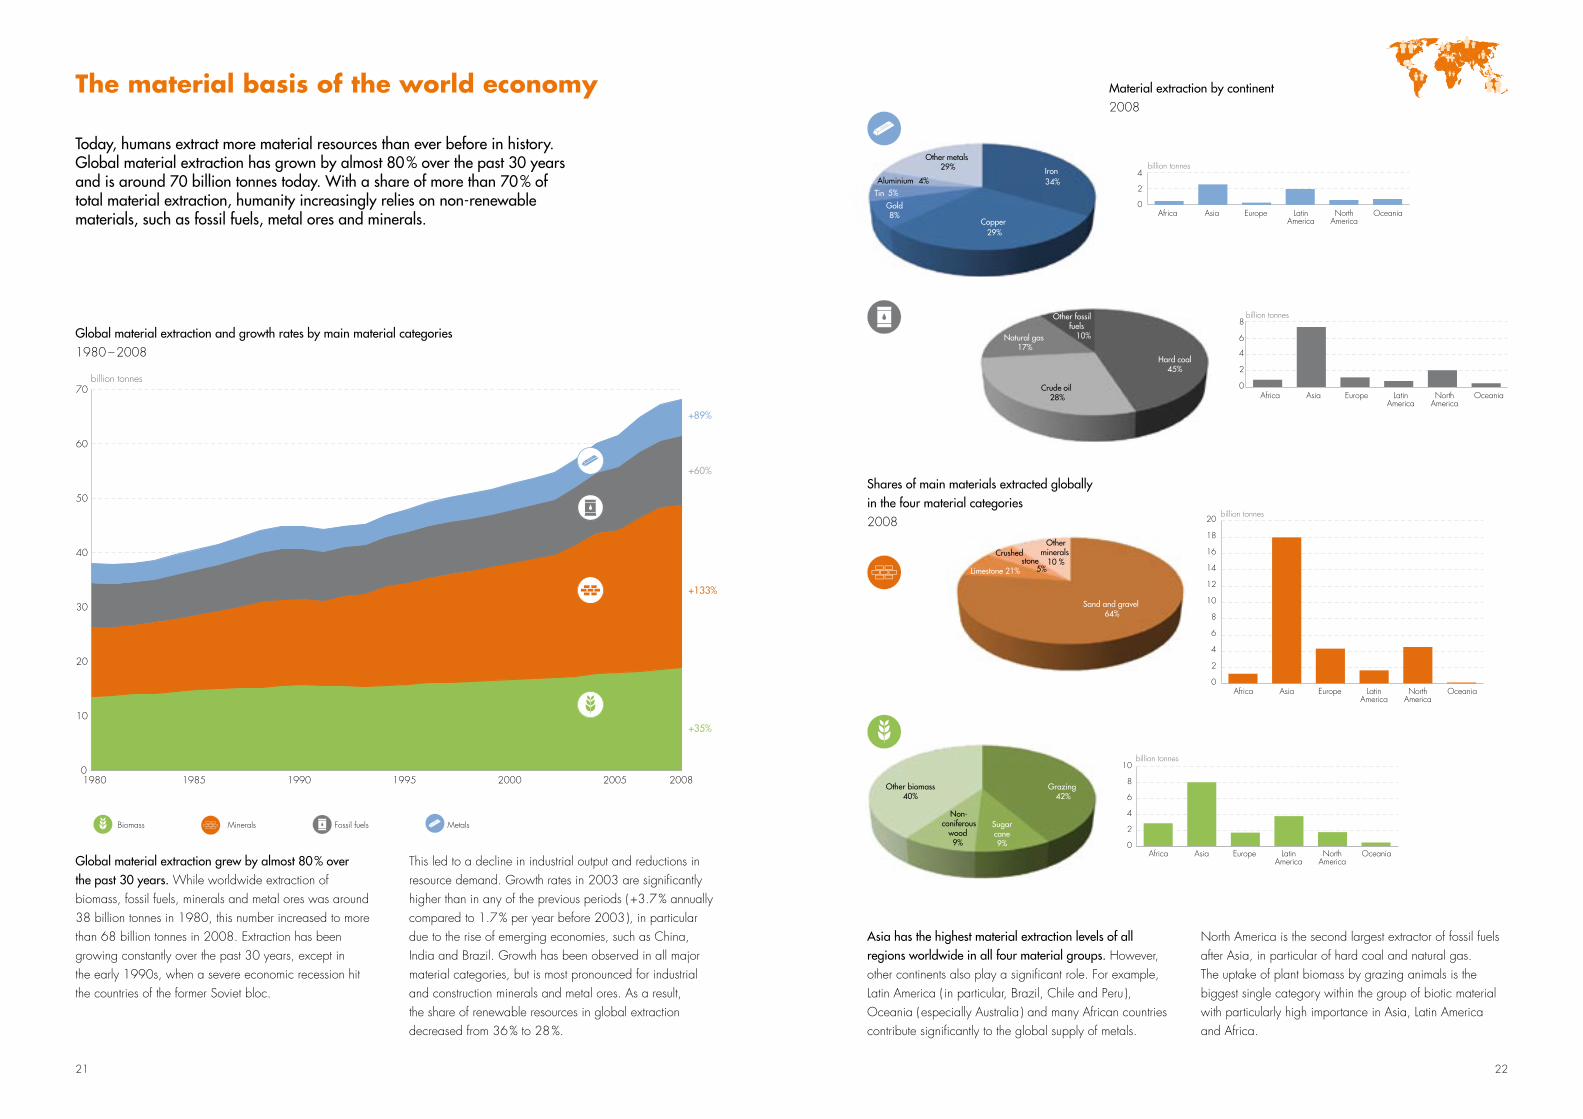
Asia has the highest material extraction levels of all regions worldwide in all four material groups. However, other continents also play a signifi cant role. For example, Latin America ( in particular, Brazil, Chile and Peru ), Oceania ( especially Australia ) and many African countries contribute signifi cantly to the global supply of metals.
North America is the second largest extractor of fossil fuels after Asia, in particular of hard coal and natural gas. The uptake of plant biomass by grazing animals is the biggest single category within the group of biotic material with particularly high importance in Asia, Latin America and Africa.
the material basis of the world economy
Today, humans extract more material resources than ever before in history. Global material extraction has grown by almost 80 % over the past 30 years and is around 70 billion tonnes today. With a share of more than 70 % of total material extraction, humanity increasingly relies on non-renewable materials, such as fossil fuels, metal ores and minerals.
Global material extraction grew by almost 80 % over the past 30 years. While worldwide extraction of biomass, fossil fuels, minerals and metal ores was around 38 billion tonnes in 1980, this number increased to more than 68 billion tonnes in 2008. Extraction has been growing constantly over the past 30 years, except in the early 1990s, when a severe economic recession hit the countries of the former Soviet bloc.
Global material extraction and growth rates by main material categories1980 – 2008
Shares of main materials extracted globally in the four material categories2008
Material extraction by continent2008
Grazing 42%
Sugar cane
9%
Non-coniferous
wood 9%
Other biomass40%
Other fossil fuels
10%
Hard coal 45%
Crude oil 28%
Natural gas 17%
Iron 34%
Gold8%
Other metals 29%
Copper 29%
Aluminium 4%Tin 5%
Limestone 21%
Sand and gravel 64%
Otherminerals
10 %
Crushed stone 5%
0
2
4
6
8
10billion tonnes
Africa Asia Europe LatinAmerica
NorthAmerica
Oceania
0
2
4
6
8billion tonnes
Africa Asia Europe LatinAmerica
NorthAmerica
Oceania
0
2
4
Africa Asia Europe LatinAmerica
NorthAmerica
Oceania
billion tonnes
0
2
4
6
8
10
12
14
16
18
20
Africa Asia Europe LatinAmerica
NorthAmerica
Oceania
billion tonnes
This led to a decline in industrial output and reductions in resource demand. Growth rates in 2003 are signifi cantly higher than in any of the previous periods ( +3.7 % annually compared to 1.7 % per year before 2003 ), in particular due to the rise of emerging economies, such as China, India and Brazil. Growth has been observed in all major material categories, but is most pronounced for industrial and construction minerals and metal ores. As a result, the share of renewable resources in global extraction decreased from 36 % to 28 %.
Biomass Minerals Fossil fuels Metals
23 24
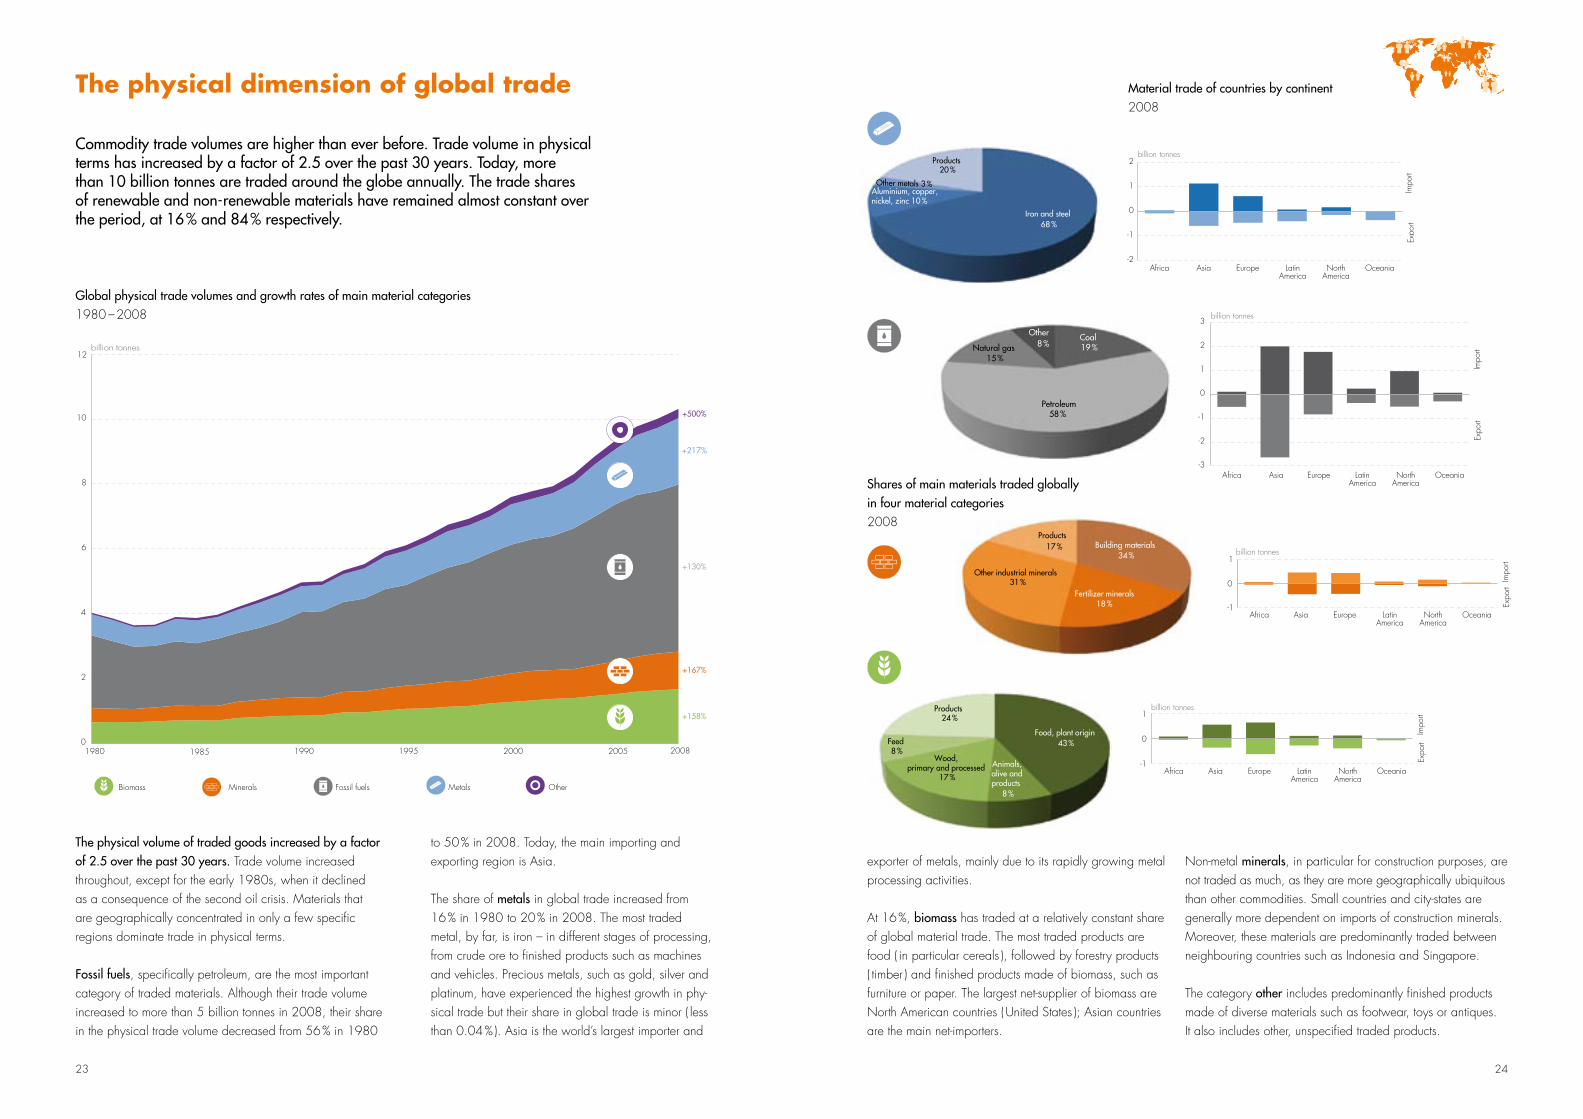
The physical volume of traded goods increased by a factor of 2.5 over the past 30 years. Trade volume increased throughout, except for the early 1980s, when it declined as a consequence of the second oil crisis. Materials that are geographically concentrated in only a few specifi c regions dominate trade in physical terms.
Fossil fuels, specifi cally petroleum, are the most important category of traded materials. Although their trade volume increased to more than 5 billion tonnes in 2008, their share in the physical trade volume decreased from 56 % in 1980
Commodity trade volumes are higher than ever before. Trade volume in physical terms has increased by a factor of 2.5 over the past 30 years. Today, more than 10 billion tonnes are traded around the globe annually. The trade shares of renewable and non-renewable materials have remained almost constant over the period, at 16 % and 84 % respectively.
the physical dimension of global trade
to 50 % in 2008. Today, the main importing and exporting region is Asia.
The share of metals in global trade increased from 16 % in 1980 to 20 % in 2008. The most traded metal, by far, is iron – in different stages of processing, from crude ore to fi nished products such as machines and vehicles. Precious metals, such as gold, silver and platinum, have experienced the highest growth in phy-sical trade but their share in global trade is minor ( less than 0.04 % ). Asia is the world’s largest importer and
Global physical trade volumes and growth rates of main material categories1980 – 2008
Feed 8 %
Wood, primary and processed
17 %
Animals, alive and products
8 %
Products 24 %
Food, plant origin
43 %
Petroleum58 %
Coal 19 % Natural gas
15 %
Other 8 %
Iron and steel
68 %
Other metals 3 % Aluminium, copper,nickel, zinc 10 %
Products 20 %
Building materials 34 %
Fertilizer minerals 18 %
Other industrial minerals 31 %
Products 17 %
-1
0
1 billion tonnes
Impo
rt Ex
port
Africa Asia Europe LatinAmerica
NorthAmerica
Oceania
-3
-2
-1
0
1
2
3 billion tonnes
Impo
rt Ex
port
Africa Asia Europe LatinAmerica
NorthAmerica
Oceania
-2
-1
0
1
2 billion tonnes
Impo
rt Ex
port
Africa Asia Europe LatinAmerica
NorthAmerica
Oceania
-1
0
1billion tonnes
Impo
rtEx
port
Africa Asia Europe LatinAmerica
NorthAmerica
Oceania
exporter of metals, mainly due to its rapidly growing metal processing activities.
At 16 %, biomass has traded at a relatively constant share of global material trade. The most traded products are food ( in particular cereals ), followed by forestry products ( timber ) and fi nished products made of biomass, such as furniture or paper. The largest net-supplier of biomass are North American countries ( United States ); Asian countries are the main net-importers.
Non-metal minerals, in particular for construction purposes, are not traded as much, as they are more geographically ubiquitous than other commodities. Small countries and city-states are generally more dependent on imports of construction minerals. Moreover, these materials are predominantly traded between neighbouring countries such as Indonesia and Singapore.
The category other includes predominantly fi nished products made of diverse materials such as footwear, toys or antiques. It also includes other, unspecifi ed traded products.
billion tonnes
+217%
+130%
+167%
+158%
+500%
0
2
4
6
8
10
12
1985 1990 1995 2000 2005 20081980
Biomass Minerals Fossil fuels Metals Other
Material trade of countries by continent2008
Shares of main materials traded globally in four material categories2008
25 26
Japan
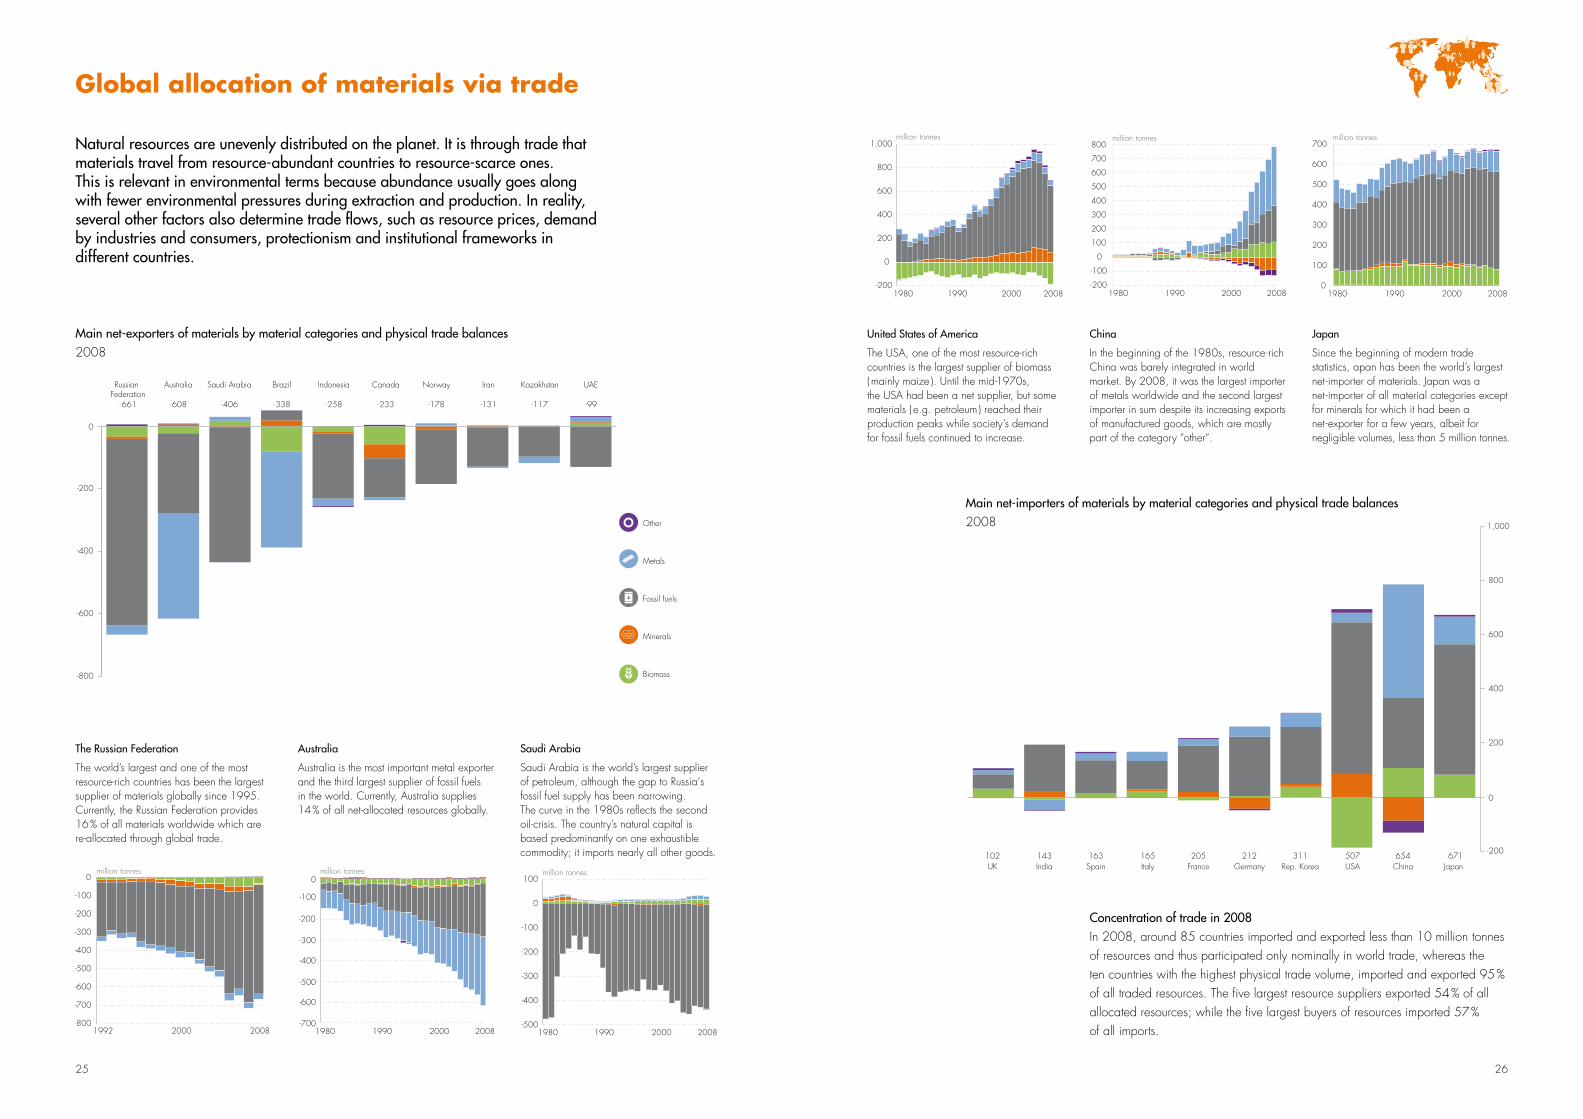
Since the beginning of modern trade statistics, apan has been the world’s largest net-importer of materials. Japan was a net-importer of all material categories except for minerals for which it had been a net-exporter for a few years, albeit for negligible volumes, less than 5 million tonnes.
China
In the beginning of the 1980s, resource-rich China was barely integrated in world market. By 2008, it was the largest importer of metals worldwide and the second largest importer in sum despite its increasing exports of manufactured goods, which are mostly part of the category “other“.
United States of America
The USA, one of the most resource-rich countries is the largest supplier of biomass ( mainly maize ). Until the mid-1970s, the USA had been a net supplier, but some materials ( e.g. petroleum ) reached their production peaks while society’s demand for fossil fuels continued to increase.
Australia
Australia is the most important metal exporter and the third largest supplier of fossil fuels in the world. Currently, Australia supplies 14 % of all net-allocated resources globally.
The Russian Federation
The world’s largest and one of the most resource-rich countries has been the largest supplier of materials globally since 1995. Currently, the Russian Federation provides 16 % of all materials worldwide which are re-allocated through global trade.
Natural resources are unevenly distributed on the planet. It is through trade that materials travel from resource-abundant countries to resource-scarce ones. This is relevant in environmental terms because abundance usually goes along with fewer environmental pressures during extraction and production. In reality, several other factors also determine trade flows, such as resource prices, demand by industries and consumers, protectionism and institutional frameworks in different countries.
Global allocation of materials via trade
Concentration of trade in 2008In 2008, around 85 countries imported and exported less than 10 million tonnes of resources and thus participated only nominally in world trade, whereas the ten countries with the highest physical trade volume, imported and exported 95 % of all traded resources. The five largest resource suppliers exported 54 % of all allocated resources; while the five largest buyers of resources imported 57 % of all imports.
-700
-600
-500
-400
-300
-200
-100
0
1980 1990 2000 2008
million tonnes
0
100
200
300
400
500
600
700
1980 1990 2000 2008
million tonnes
-200
-100
0
100
200
300
400
500
600
700
800
1980 1990 2000 2008
million tonnes
-200
0
200
400
600
800
1,000
India143
Spain163
Italy165
France205
Germany212
Rep. Korea311
China654
USA507
Japan671
UK102
-500
-400
-300
-200
-100
0
100
1980 1990 2000 2008
million tonnes
-200
0
200
400
600
800
1,000
1980 1990 2000 2008
million tonnes
-800
-600
-400
-200
0
UAE
- 99
Kazakhstan
-117
Iran
-131
Canada
- 233
Norway
-178
Indonesia
- 258
Australia
- 608
Brazil
- 338
Saudi Arabia
- 406
Russian Federation
- 661
-800
-700
-600
-500
-400
-300
-200
-100
0
1992 2000 2008
million tonnes
Biomass
Minerals
Fossil fuels
Metals
Other
Main net-exporters of materials by material categories and physical trade balances 2008
Saudi Arabia
Saudi Arabia is the world’s largest supplier of petroleum, although the gap to Russia‘s fossil fuel supply has been narrowing. The curve in the 1980s reflects the second oil-crisis. The country’s natural capital is based predominantly on one exhaustible commodity; it imports nearly all other goods.
Main net-importers of materials by material categories and physical trade balances 2008
27 28
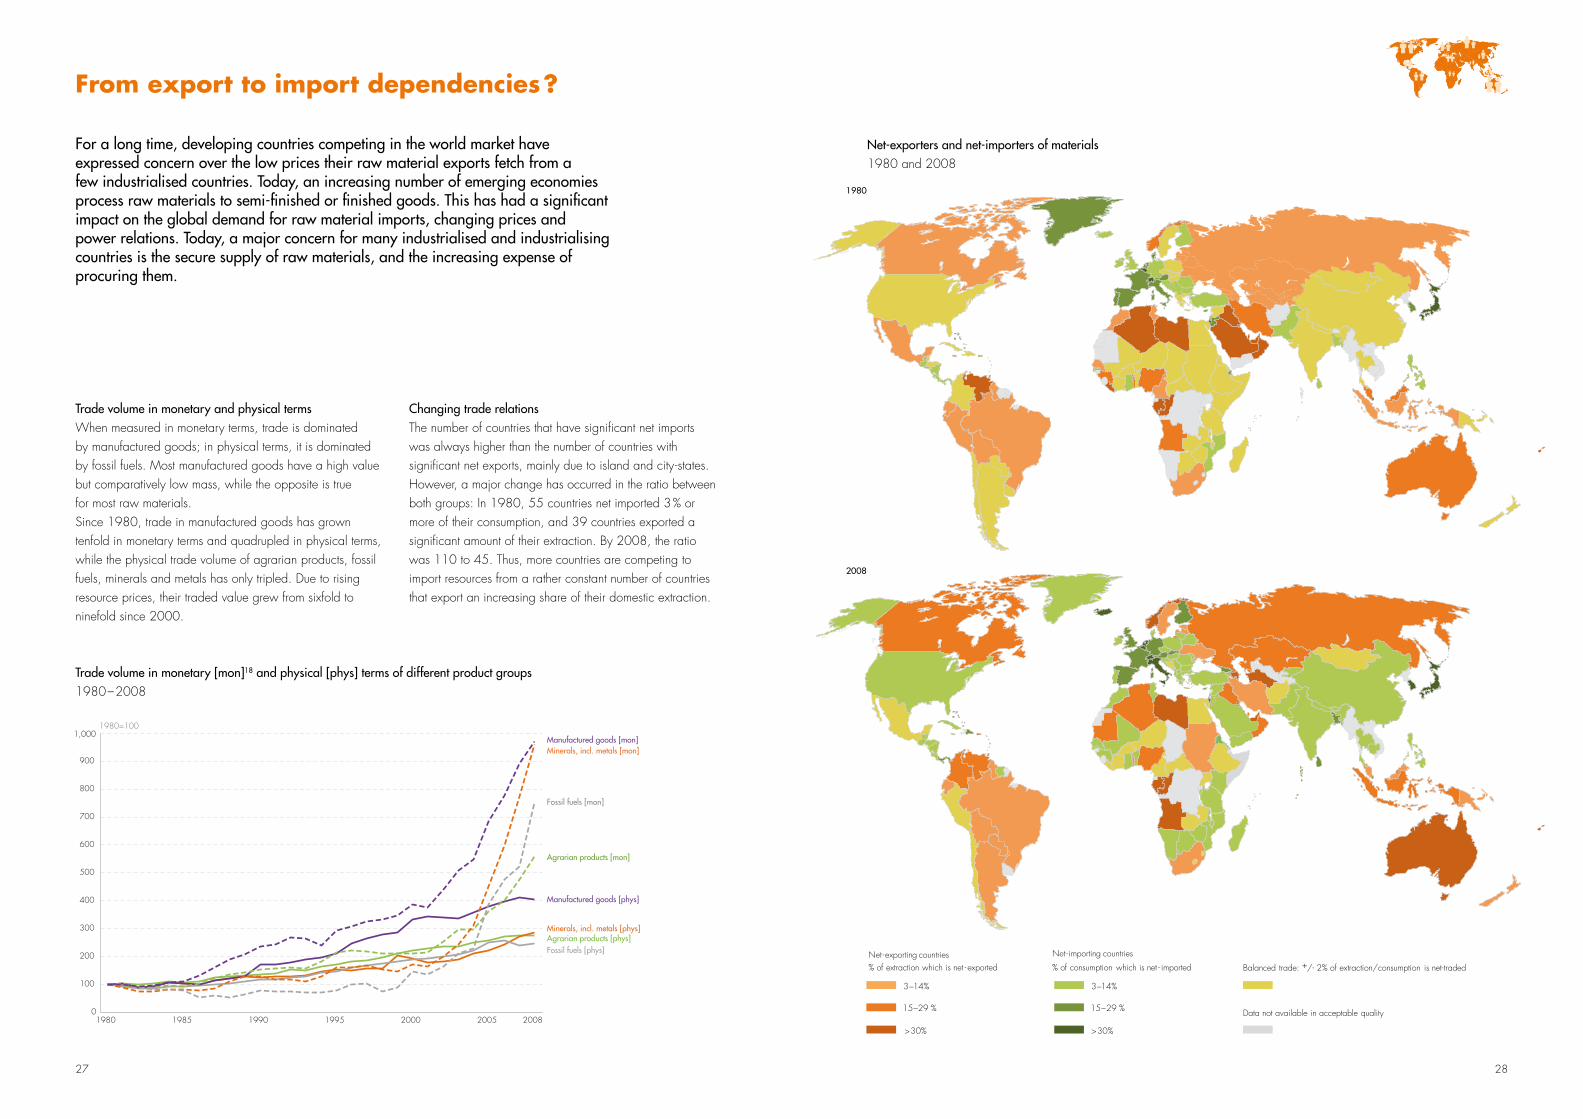
Changing trade relationsThe number of countries that have significant net imports was always higher than the number of countries with significant net exports, mainly due to island and city-states. However, a major change has occurred in the ratio between both groups: In 1980, 55 countries net imported 3 % or more of their consumption, and 39 countries exported a significant amount of their extraction. By 2008, the ratio was 110 to 45. Thus, more countries are competing to import resources from a rather constant number of countries that export an increasing share of their domestic extraction.
Trade volume in monetary and physical termsWhen measured in monetary terms, trade is dominated by manufactured goods; in physical terms, it is dominated by fossil fuels. Most manufactured goods have a high value but comparatively low mass, while the opposite is true for most raw materials. Since 1980, trade in manufactured goods has grown tenfold in monetary terms and quadrupled in physical terms, while the physical trade volume of agrarian products, fossil fuels, minerals and metals has only tripled. Due to rising resource prices, their traded value grew from sixfold to ninefold since 2000.
For a long time, developing countries competing in the world market have expressed concern over the low prices their raw material exports fetch from a few industrialised countries. Today, an increasing number of emerging economies process raw materials to semi-finished or finished goods. This has had a significant impact on the global demand for raw material imports, changing prices and power relations. Today, a major concern for many industrialised and industrialising countries is the secure supply of raw materials, and the increasing expense of procuring them.
From export to import dependencies ?
Trade volume in monetary [mon]18 and physical [phys] terms of different product groups 1980 – 2008
Net-exporters and net-importers of materials1980 and 2008
0
100
200
300
400
500
600
700
800
900
1980 1985 1990 1995 2000 2005 2008
1980=100
Manufactured goods [mon]
Agrarian products [phys]Minerals, incl. metals [phys]
Manufactured goods [phys]
Agrarian products [mon]
Fossil fuels [mon]
Minerals, incl. metals [mon]
Fossil fuels [phys]
1,000
Net - exporting countries% of extraction which is net - exported
> 30%
15−29 %
3−14%
Net - importing countries
% of consumption which is net - imported
Balanced trade: +/- 2% of extraction/consumption is net-traded
Data not available in acceptable quality
2008
1980
> 30%
15−29 %
3−14%
Net - exporting countries% of extraction which is net - exported
> 30%
15−29 %
3−14%
Net - importing countries
% of consumption which is net - imported
Balanced trade: +/- 2% of extraction/consumption is net-traded
Data not available in acceptable quality
2008
1980
> 30%
15−29 %
3−14%
Net - exporting countries% of extraction which is net - exported
> 30%
15−29 %
3−14%
Net - importing countries
% of consumption which is net - imported
Balanced trade: +/- 2% of extraction/consumption is net-traded
Data not available in acceptable quality
2008
1980
> 30%
15−29 %
3−14%
29 30
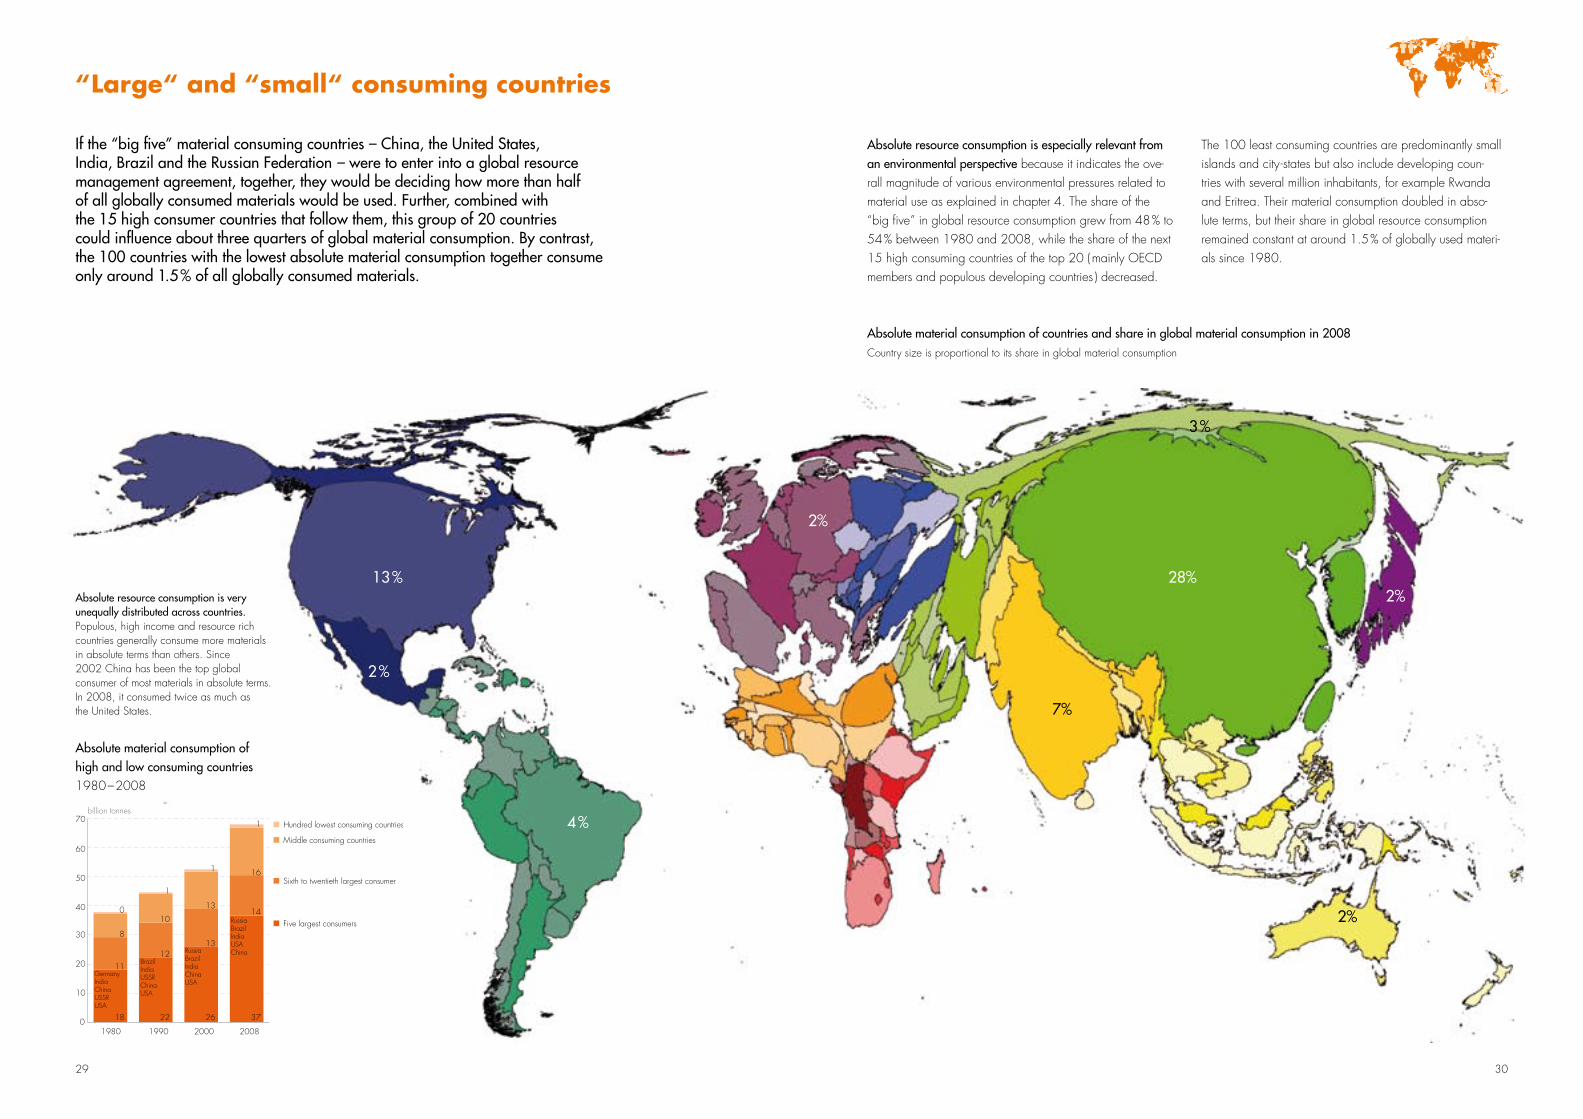
Absolute resource consumption is especially relevant from an environmental perspective because it indicates the ove-rall magnitude of various environmental pressures related to material use as explained in chapter 4. The share of the “big five” in global resource consumption grew from 48 % to 54 % between 1980 and 2008, while the share of the next 15 high consuming countries of the top 20 ( mainly OECD members and populous developing countries ) decreased.
If the “big five” material consuming countries – China, the United States, India, Brazil and the Russian Federation – were to enter into a global resource management agreement, together, they would be deciding how more than half of all globally consumed materials would be used. Further, combined with the 15 high consumer countries that follow them, this group of 20 countries could influence about three quarters of global material consumption. By contrast, the 100 countries with the lowest absolute material consumption together consume only around 1.5 % of all globally consumed materials.
“large“ and “small“ consuming countries
The 100 least consuming countries are predominantly small islands and city-states but also include developing coun-tries with several million inhabitants, for example Rwanda and Eritrea. Their material consumption doubled in abso-lute terms, but their share in global resource consumption remained constant at around 1.5 % of globally used materi-als since 1980.
Absolute material consumption of high and low consuming countries 1980 – 2008
Absolute resource consumption is very unequally distributed across countries. Populous, high income and resource rich countries generally consume more materials in absolute terms than others. Since 2002 China has been the top global consumer of most materials in absolute terms. In 2008, it consumed twice as much as the United States.
Absolute material consumption of countries and share in global material consumption in 2008 Country size is proportional to its share in global material consumption
13 %
2 %
4 %
28%
7%
2%
2%
3 %
2%
0
10
20
30
40
50
60
70
1980 1990 2000 2008
Hundred lowest consuming countries
Middle consuming countries
Sixth to twentieth largest consumer
Five largest consumers
billion tonnes
37
14
16
1
26
13
13
1
22
12
10
1
18
11
8
0RussiaBrazilIndiaUSAChinaRussia
BrazilIndiaChinaUSA
BrazilIndiaUSSRChinaUSA
Germany IndiaChinaUSSRUSA
31 32
Average material consumption in per capita terms varies greatly across the globe. As observed in countries with the lowest per capita consumption, the minimal consumption for survival is around two tonnes per person per year, which includes materials for the basic needs of food and shelter. The highest average per capita consumption is sixty times the lowest and is dominated by minerals for large construction activities and by the consumption of fossil fuels.
Consumption: from survival to affluence
Material consumption per capita 2008
0
20
40
60
80
100
120
tonnes per capita
Glo
bal a
vera
ge
Turk
ey
Bosn
ia a
nd H
erze
govi
na
Jam
aica
Mex
ico
Leba
non
Pana
ma
Cub
a
Mau
ritan
ia
Swaz
iland
Cos
ta R
ica
Jord
an
Boliv
ia
Puer
to R
ico
Tuni
sia
Ukr
aine
Ecua
dor
Arm
enia
Papu
a N
ew G
.
Zam
bia
Uzb
ekist
an
Alg
eria
Col
ombi
a
Alb
ania
St. V
ince
nt
Mor
occo
Vanu
atu
Som
alia
Gre
nada
Suda
n
Thai
land
Egyp
t
Gui
nea
Viet
Nam
Hon
dura
s
Kyrg
yzsta
n
Nic
arag
ua
Mal
i
Cen
tral A
fr. R
ep.
Gua
tem
ala
Aze
rbai
jan
Solo
mon
Isla
nds
Syria
Dom
inic
an R
ep.
Indo
nesia
Gha
na
Burk
ina
Faso
Sam
oa
Sene
gal
Mol
dova
El S
alva
dor
St. L
ucia
Cha
d
Dom
inic
a
Ethi
opia
Beni
n
Zim
babw
e
Con
go, D
R
Iraq
Cap
e Ve
rde
Tanz
ania
Laos
Cam
eroo
n
Indi
a
Leso
tho
Eritr
ea
Mad
agas
car
Djib
outi
Kirib
ati
Yem
en
Cam
bodi
a
Uga
nda
Keny
a
Paki
stan
Sri L
anka
Ang
ola
Geo
rgia
Gam
bia,
The
Nig
er
Phili
ppin
es
Nor
th K
orea
Gui
nea-
Biss
au
Tong
a
Nig
eria
Baha
mas
, The
Mya
nmar
Togo
Rwan
da
Cot
e d›
Ivoi
re
Sier
ra L
eone
Nep
al
Sao
Tom
e
Liber
ia
May
otte
Buru
ndi
Mal
awi
Moz
ambi
que
Hai
ti
Tim
or-Le
ste
Afg
hani
stan
Bang
lade
sh
Con
go, R
ep.
Com
oros
Tuva
lu
Qat
ar
Irela
nd
Aus
tralia
Uru
guay
Chi
le
Uni
ted
Ara
b Em
irate
s
Finl
and
Om
an
Kuw
ait
Equa
toria
l Gui
nea
Mon
golia
Bahr
ain
Sing
apor
e
Uni
ted
Stat
es
Slov
enia
Cyp
rus
New
Zea
land
Peru
Den
mar
k
Esto
nia
Can
ada
Icel
and
Kaza
khsta
n
Berm
uda
Swed
en
Nor
way
Portu
gal
Spai
n
New
Cal
edon
ia
Mal
dive
s
Faro
e Isl
ands
Aus
tria
Cze
ch R
epub
lic
Botsw
ana
Surin
ame
Para
guay
Bulg
aria
Gre
ece
Brun
ei D
arus
sala
m
Saud
i Ara
bia
Guy
ana
Pola
nd
Belg
ium
- Lu
xem
bour
g
Trin
idad
and
Tob
ago
Kore
a, R
ep.
Mac
edon
ia, F
YR
Ger
man
y
Fran
ce
Arg
entin
a
Libya
Braz
il
Chi
na
Israe
l
Gab
on
Russ
ian
Fede
ratio
n
Mal
ta
Nam
ibia
Bhut
an
Serb
ia a
nd M
onte
negr
o
Switz
erla
nd
St. K
itts
and
Nev
is
Turk
men
istan Iran
Sout
h A
frica
Seyc
helle
s
Net
herla
nds
Fren
ch P
olyn
esia
Slov
akia
Lithu
ania
Cro
atia
Beliz
e
Italy
Bela
rus
Rom
ania
Barb
ados
Vene
zuel
a
Uni
ted
King
dom
Latv
ia
Mal
aysia
Ant
igua
and
Bar
buda
Fiji
Islan
ds
Liech
tens
tein
Cay
man
Isla
nds
Mau
ritiu
s
Hun
gary
Turk
s an
d C
aico
s Isl
ands
Japa
n
Global average = 10.2 tonnesGlobal average = 10.2 tonnes
Biomass Minerals Fossil fuels Metals Other
Globally, a person uses at least 1.5 tonnes of biomass and 0.3 tonnes of minerals per year. Biomass is predominantly used for nutrition and as a source of energy; minerals are mainly used for shelter. In general, rising material consumption goes along with an increasing use of fossil fuels, of minerals and metals for public and private infrastructure and of metals for technical equipment. Biomass consumption increases only slightly with higher income. High amounts of biomass use are mainly due to large animal-stocks. Large and luxurious construction activities such as the Pearl-Qatar or Palm Islands in Dubai ( United Arab Emirates ) are responsible for per capita material consumption values beyond 50 tonnes per year. Often, small countries, islands and city-states import huge
amounts of single commodities in one year, e.g. petroleum, minerals or ships, and hardly any of these commodities in the next year; sometimes, they even export them ( partly further processed ) in the following years. Thus, their material consumption can fluctuate wildly, exceeding 100 tonnes per capita in some years, and falling below zero in some material categories in other years. Inequalities between countries with high and low average per capita consumption declined slightly over the past 30 years due to an increasing number of medium and high consuming countries. In 1980 and 2008, the bottom 10 % of countries (in terms of per capita material consumption) maintained a constant share of 2.5 % of global consumption, whereas the share of the top 10 % declined from 33 % to 27 %.
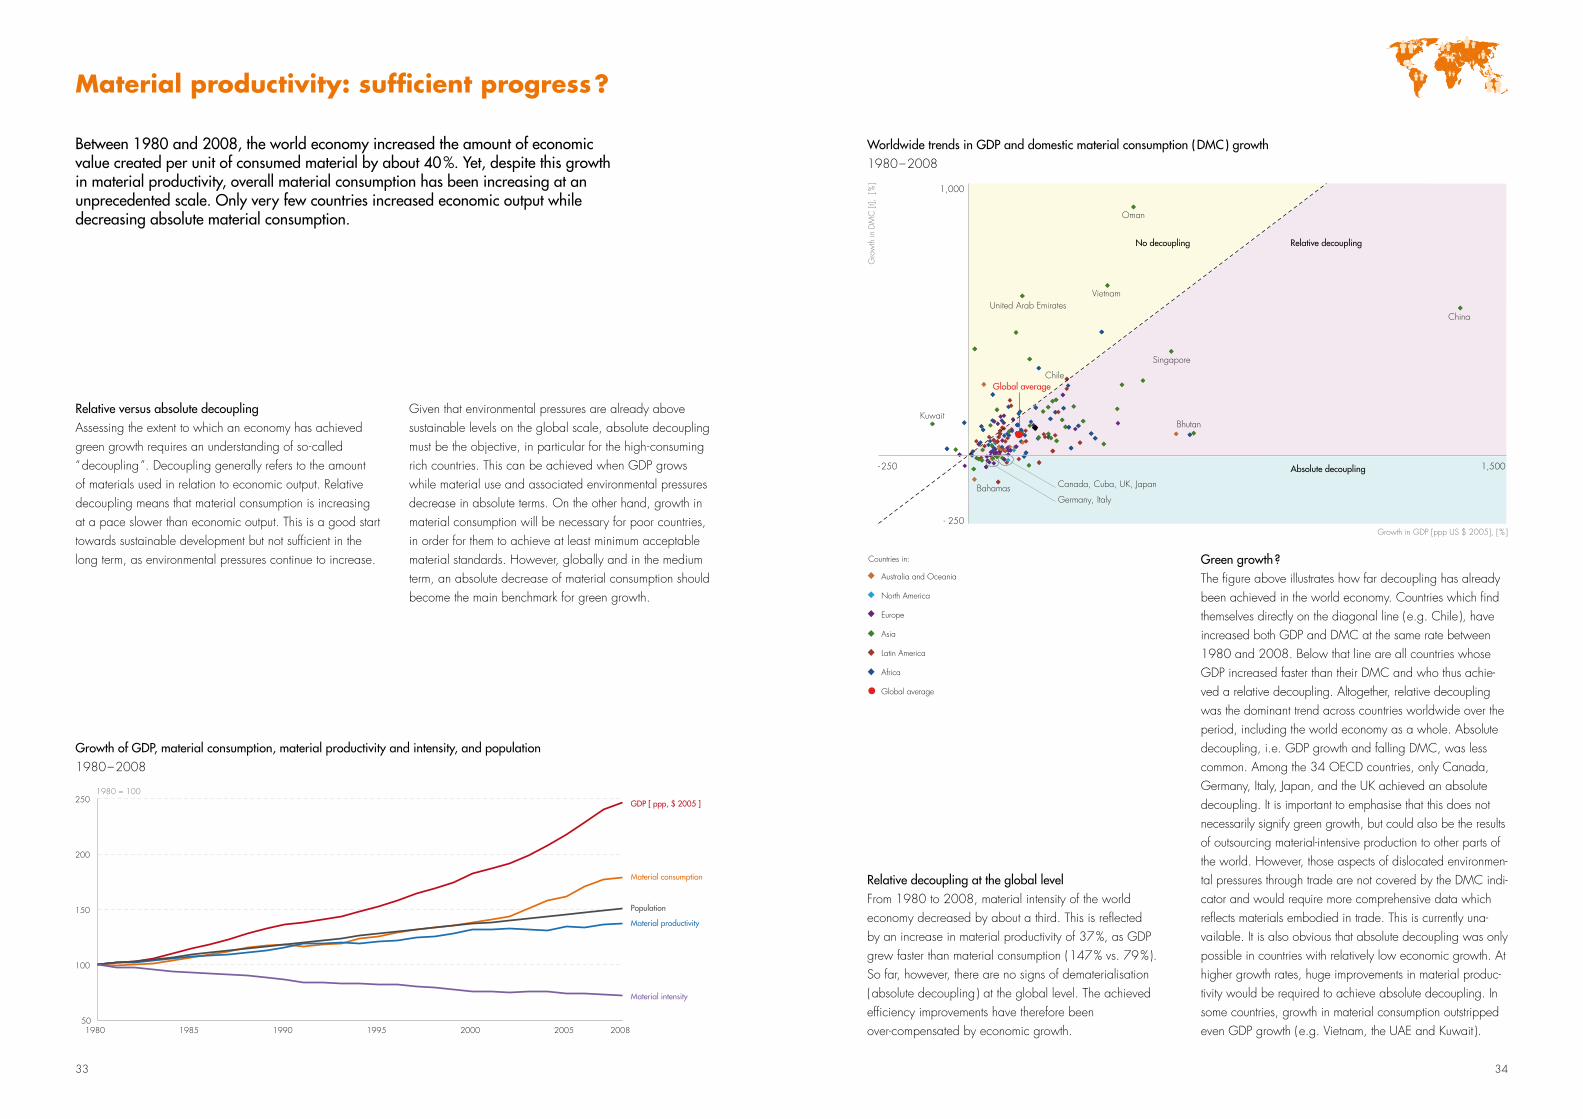
33 34
Relative decoupling at the global levelFrom 1980 to 2008, material intensity of the world economy decreased by about a third. This is refl ected by an increase in material productivity of 37 %, as GDP grew faster than material consumption ( 147 % vs. 79 % ). So far, however, there are no signs of dematerialisation ( absolute decoupling ) at the global level. The achieved effi ciency improvements have therefore been over -compensated by economic growth.
Given that environmental pressures are already above sustainable levels on the global scale, absolute decoupling must be the objective, in particular for the high-consuming rich countries. This can be achieved when GDP grows while material use and associated environmental pressures decrease in absolute terms. On the other hand, growth in material consumption will be necessary for poor countries, in order for them to achieve at least minimum acceptable material standards. However, globally and in the medium term, an absolute decrease of material consumption should become the main benchmark for green growth.
Relative versus absolute decouplingAssessing the extent to which an economy has achieved green growth requires an understanding of so-called “ decoupling ”. Decoupling generally refers to the amount of materials used in relation to economic output. Relative decoupling means that material consumption is increasing at a pace slower than economic output. This is a good start towards sustainable development but not suffi cient in the long term, as environmental pressures continue to increase.
Between 1980 and 2008, the world economy increased the amount of economic value created per unit of consumed material by about 40 %. Yet, despite this growth in material productivity, overall material consumption has been increasing at an unprecedented scale. Only very few countries increased economic output while decreasing absolute material consumption.
material productivity: suffi cient progress ?
Growth of GDP, material consumption, material productivity and intensity, and population1980 – 2008
Worldwide trends in GDP and domestic material consumption ( DMC ) growth1980 – 2008
50
100
150
200
250
1980 1985 1990 1995 2000 2005 2008
GDP [ ppp, $ 2005 ]
Material consumption
Material productivity
Population
Material intensity
1980 = 100
Australia and Oceania
North America
Europe
Asia
Latin America
Africa
Global average
Countries in:
Gro
wth
in D
MC
[t],
[ %
]
Growth in GDP [ppp US $ 2005], [ % ]
- 250
1,000
- 250 1,500
No decoupling Relative decoupling
Absolute decoupling
China
Bahamas
Singapore
Oman
Kuwait
United Arab Emirates
Vietnam
Chile
Bhutan
Canada, Cuba, UK, Japan
Germany, Italy
Global average
Green growth ? The fi gure above illustrates how far decoupling has already been achieved in the world economy. Countries which fi nd themselves directly on the diagonal line ( e.g. Chile ), have increased both GDP and DMC at the same rate between 1980 and 2008. Below that line are all countries whose GDP increased faster than their DMC and who thus achie-ved a relative decoupling. Altogether, relative decoupling was the dominant trend across countries worldwide over the period, including the world economy as a whole. Absolute decoupling, i.e. GDP growth and falling DMC, was less common. Among the 34 OECD countries, only Canada, Germany, Italy, Japan, and the UK achieved an absolute decoupling. It is important to emphasise that this does not necessarily signify green growth, but could also be the results of outsourcing material-intensive production to other parts of the world. However, those aspects of dislocated environmen-tal pressures through trade are not covered by the DMC indi-cator and would require more comprehensive data which refl ects materials embodied in trade. This is currently una-vailable. It is also obvious that absolute decoupling was only possible in countries with relatively low economic growth. At higher growth rates, huge improvements in material produc-tivity would be required to achieve absolute decoupling. In some countries, growth in material consumption outstripped even GDP growth ( e.g. Vietnam, the UAE and Kuwait ).
Australia and Oceania
North America
Europe
Asia
Latin America
Africa
Global average
Countries in:
Gro
wth
in D
MC
[t],
[ %
]
Growth in GDP [ppp US $ 2005], [ % ]
- 250
1,000
- 250 1,500
No decoupling Relative decoupling
Absolute decoupling
China
Bahamas
Singapore
Oman
Kuwait
United Arab Emirates
Vietnam
Chile
Bhutan
Canada, Cuba, UK, Japan
Germany, Italy
Global average
35
XXX
36
Material use and development at a glance _____________________ 36
Low income countries ______________________________________ 38
Industrialising and service-oriented economies __________________ 40
Resource-based emerging economies _________________________ 42
Material use during transition processes _______________________ 44
High income countries _____________________________________ 46
Development and material productivity ________________________ 48
Material use and well-being _________________________________ 50
Material use and development3
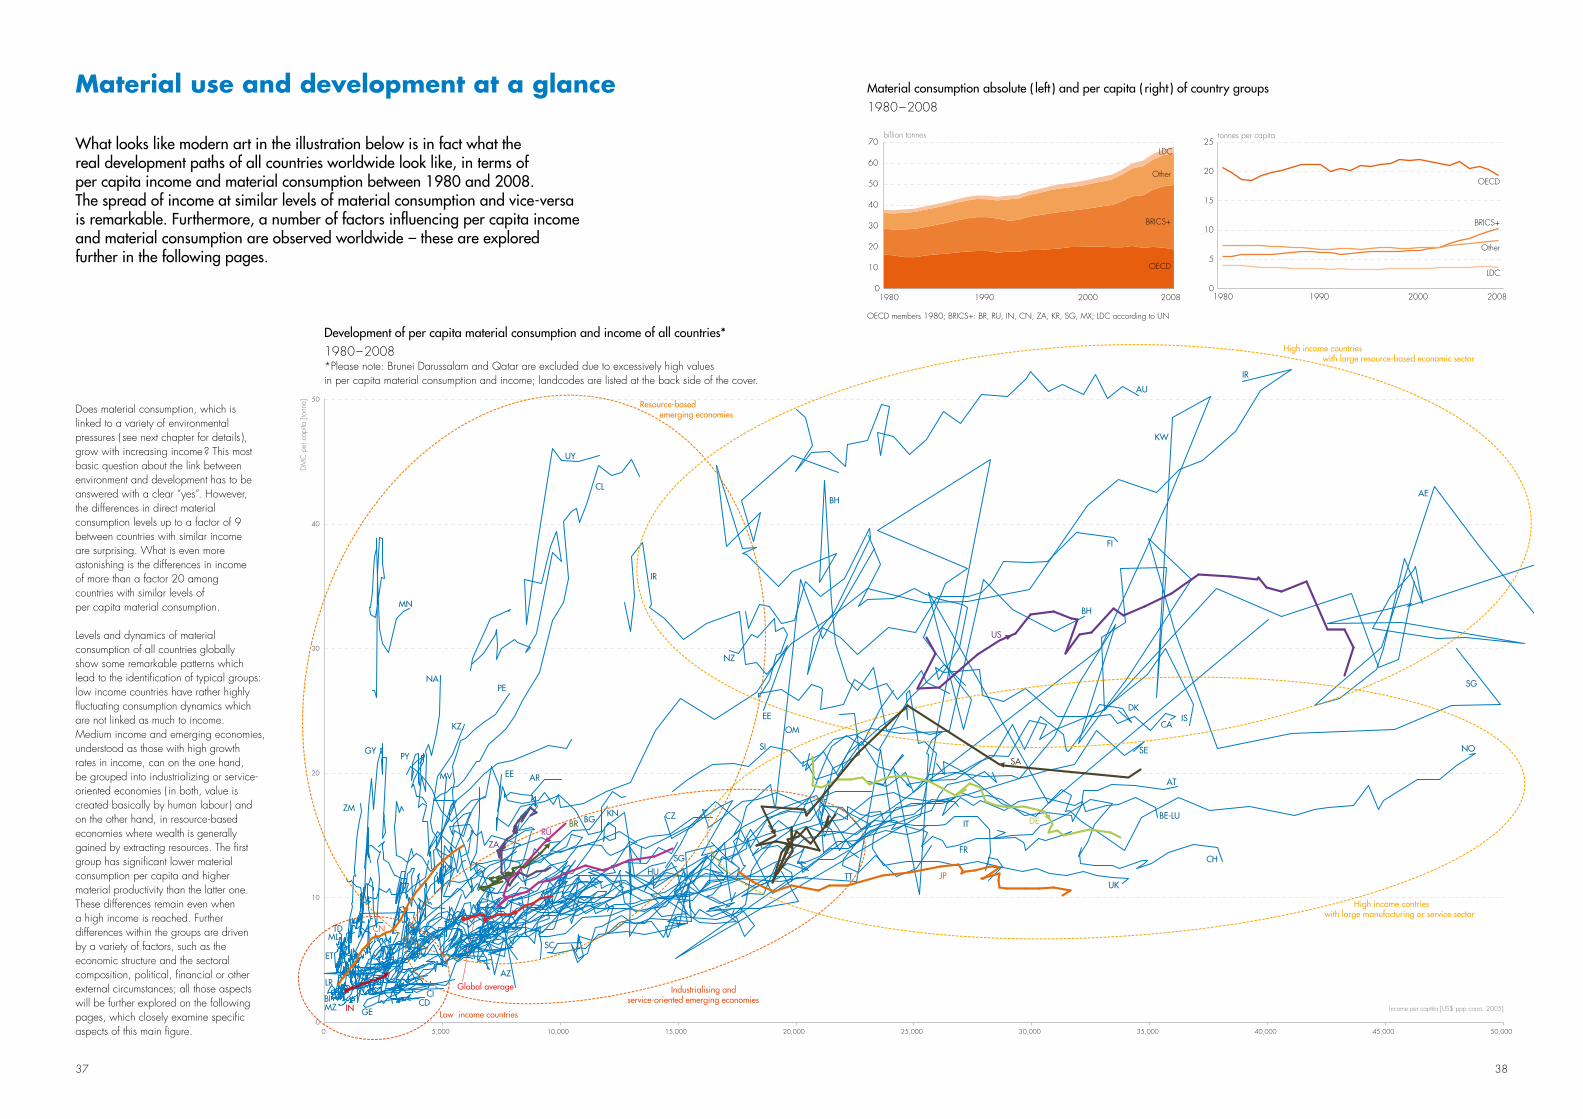
37 38
Does material consumption, which is linked to a variety of environmental pressures ( see next chapter for details ), grow with increasing income ? This most basic question about the link between environment and development has to be answered with a clear “yes”. However, the differences in direct material consumption levels up to a factor of 9 between countries with similar income are surprising. What is even more astonishing is the differences in income of more than a factor 20 among countries with similar levels of per capita material consumption.
Levels and dynamics of material consumption of all countries globally show some remarkable patterns which lead to the identification of typical groups: low income countries have rather highly fluctuating consumption dynamics which are not linked as much to income. Medium income and emerging economies, understood as those with high growth rates in income, can on the one hand, be grouped into industrializing or service-oriented economies ( in both, value is created basically by human labour ) and on the other hand, in resource-based economies where wealth is generally gained by extracting resources. The first group has significant lower material consumption per capita and higher material productivity than the latter one. These differences remain even when a high income is reached. Further differences within the groups are driven by a variety of factors, such as the economic structure and the sectoral composition, political, financial or other external circumstances; all those aspects will be further explored on the following pages, which closely examine specific aspects of this main figure.
What looks like modern art in the illustration below is in fact what the real development paths of all countries worldwide look like, in terms of per capita income and material consumption between 1980 and 2008. The spread of income at similar levels of material consumption and vice-versa is remarkable. Furthermore, a number of factors influencing per capita income and material consumption are observed worldwide – these are explored further in the following pages.
material use and development at a glance
0
10
20
30
40
50
60
0 5,000 10,000 15,000 20,000 25,000 30,000 35,000 40,000 45,000 50,000
DM
C p
er c
apita
[ton
ne]
Income per captita [US$ ppp const. 2005]
Resource-based emerging economies
High income contries with large manufacturing or service sector
High income countries with large resource-based economic sector
Low income countries
Industrialising and service-oriented emerging economies
Global average
RU
JP
US
CN
IN
DE
SA
BR
ZA
AE
AU
IR
FI
KW
SG
NO
ISCA
SE
AT
BE-LU
CH
UK
FR
IT
DK
BH
BH
IR
NZ
UY
CL
PE
PYGY
ZM
AR
EE
SI
BG CZ
AZ
MZBI
LR
ET
MLTD
CICD
SC
HU
MV
KZ
NA
MN
EE
KN
OM
TT
SG
GE
Industrializing and
service-oriented economies
0
10
20
30
40
50
60
70
1980 1990 2000 2008
billion tonnes
LDC
Other
BRICS+
OECD
0
5
10
15
20
25
1980 1990 2000 2008
tonnes per capita
OECD
BRICS+
Other
LDC
OECD members 1980; BRICS+: BR, RU, IN, CN, ZA, KR, SG, MX; LDC according to UN
Development of per capita material consumption and income of all countries* 1980 – 2008*Please note: Brunei Darussalam and Qatar are excluded due to excessively high values in per capita material consumption and income; landcodes are listed at the back side of the cover.
Material consumption absolute ( left ) and per capita ( right ) of country groups1980 – 2008
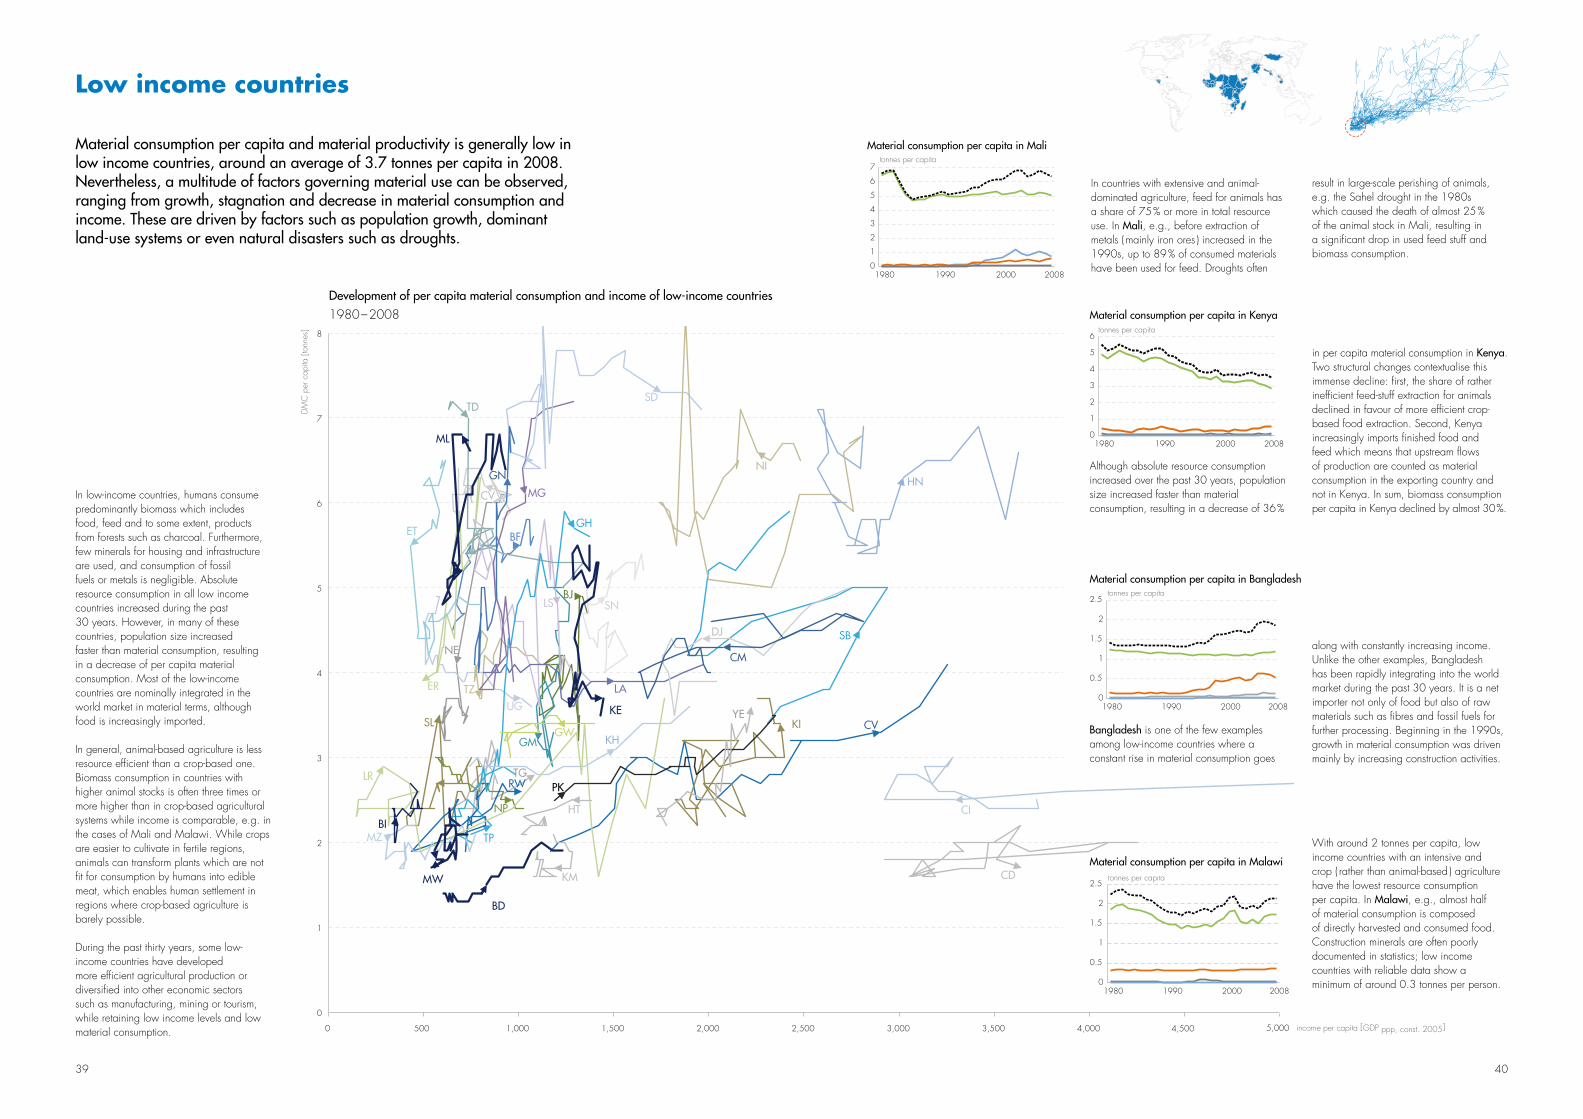
39 40
low income countries
Material consumption per capita and material productivity is generally low in low income countries, around an average of 3.7 tonnes per capita in 2008. Nevertheless, a multitude of factors governing material use can be observed, ranging from growth, stagnation and decrease in material consumption and income. These are driven by factors such as population growth, dominant land-use systems or even natural disasters such as droughts.
In low-income countries, humans consume predominantly biomass which includes food, feed and to some extent, products from forests such as charcoal. Furthermore, few minerals for housing and infrastructure are used, and consumption of fossil fuels or metals is negligible. Absolute resource consumption in all low income countries increased during the past 30 years. However, in many of these countries, population size increased faster than material consumption, resulting in a decrease of per capita material consumption. Most of the low-income countries are nominally integrated in the world market in material terms, although food is increasingly imported.
In general, animal-based agriculture is less resource efficient than a crop-based one. Biomass consumption in countries with higher animal stocks is often three times or more higher than in crop-based agricultural systems while income is comparable, e.g. in the cases of Mali and Malawi. While crops are easier to cultivate in fertile regions, animals can transform plants which are not fit for consumption by humans into edible meat, which enables human settlement in regions where crop-based agriculture is barely possible.
During the past thirty years, some low-income countries have developed more efficient agricultural production or diversified into other economic sectors such as manufacturing, mining or tourism, while retaining low income levels and low material consumption. 3,000 3,500 4,000
Income per capita [US$ ppp, const 2005]
0
1
2
3
4
5
6
7
8
0
DM
C p
er c
apita
[ton
nes]
500 1,000 1,500 2,000 2,500 income per capita [GDP ppp, const. 2005] 4,500 5,000
NE
BJ
SB
UG
CV
BF
HT
ER
TZ
TG
NP
SL
TP
RW
GM
LS
TD
LA
SN
GH
MG
SD
DJ
CM
GN
MZ
CVKH
GW
KM
ET
LR
BI
KI
PK
YE
HNNI
CI
CD
ML
KE
BD
MW
0
1
2
3
4
5
6
7
1980 1990 2000 2008
tonnes per capita
0
0.5
1
1.5
2
2.5
1980 1990 2000 2008
tonnes per capita
Bangladesh is one of the few examples among low-income countries where a constant rise in material consumption goes
Although absolute resource consumption increased over the past 30 years, population size increased faster than material consumption, resulting in a decrease of 36 %
In countries with extensive and animal-dominated agriculture, feed for animals has a share of 75 % or more in total resource use. In Mali, e.g., before extraction of metals ( mainly iron ores ) increased in the 1990s, up to 89 % of consumed materials have been used for feed. Droughts often
Development of per capita material consumption and income of low-income countries 1980 – 2008
With around 2 tonnes per capita, low income countries with an intensive and crop ( rather than animal-based ) agriculture have the lowest resource consumption per capita. In Malawi, e.g., almost half of material consumption is composed of directly harvested and consumed food. Construction minerals are often poorly documented in statistics; low income countries with reliable data show a minimum of around 0.3 tonnes per person.
Material consumption per capita in Mali
Material consumption per capita in Kenya
Material consumption per capita in Bangladesh
0
0.5
1
1.5
2
2.5
1980 1990 2000 2008
tonnes per capita
0
1
2
3
4
5
6
1980 1990 2000 2008
tonnes per capita
Material consumption per capita in Malawi
result in large-scale perishing of animals, e.g. the Sahel drought in the 1980s which caused the death of almost 25 % of the animal stock in Mali, resulting in a significant drop in used feed stuff and biomass consumption.
in per capita material consumption in Kenya. Two structural changes contextualise this immense decline: first, the share of rather inefficient feed-stuff extraction for animals declined in favour of more efficient crop- based food extraction. Second, Kenya increasingly imports finished food and feed which means that upstream flows of production are counted as material consumption in the exporting country and not in Kenya. In sum, biomass consumption per capita in Kenya declined by almost 30 %.
along with constantly increasing income. Unlike the other examples, Bangladesh has been rapidly integrating into the world market during the past 30 years. It is a net importer not only of food but also of raw materials such as fibres and fossil fuels for further processing. Beginning in the 1990s, growth in material consumption was driven mainly by increasing construction activities.
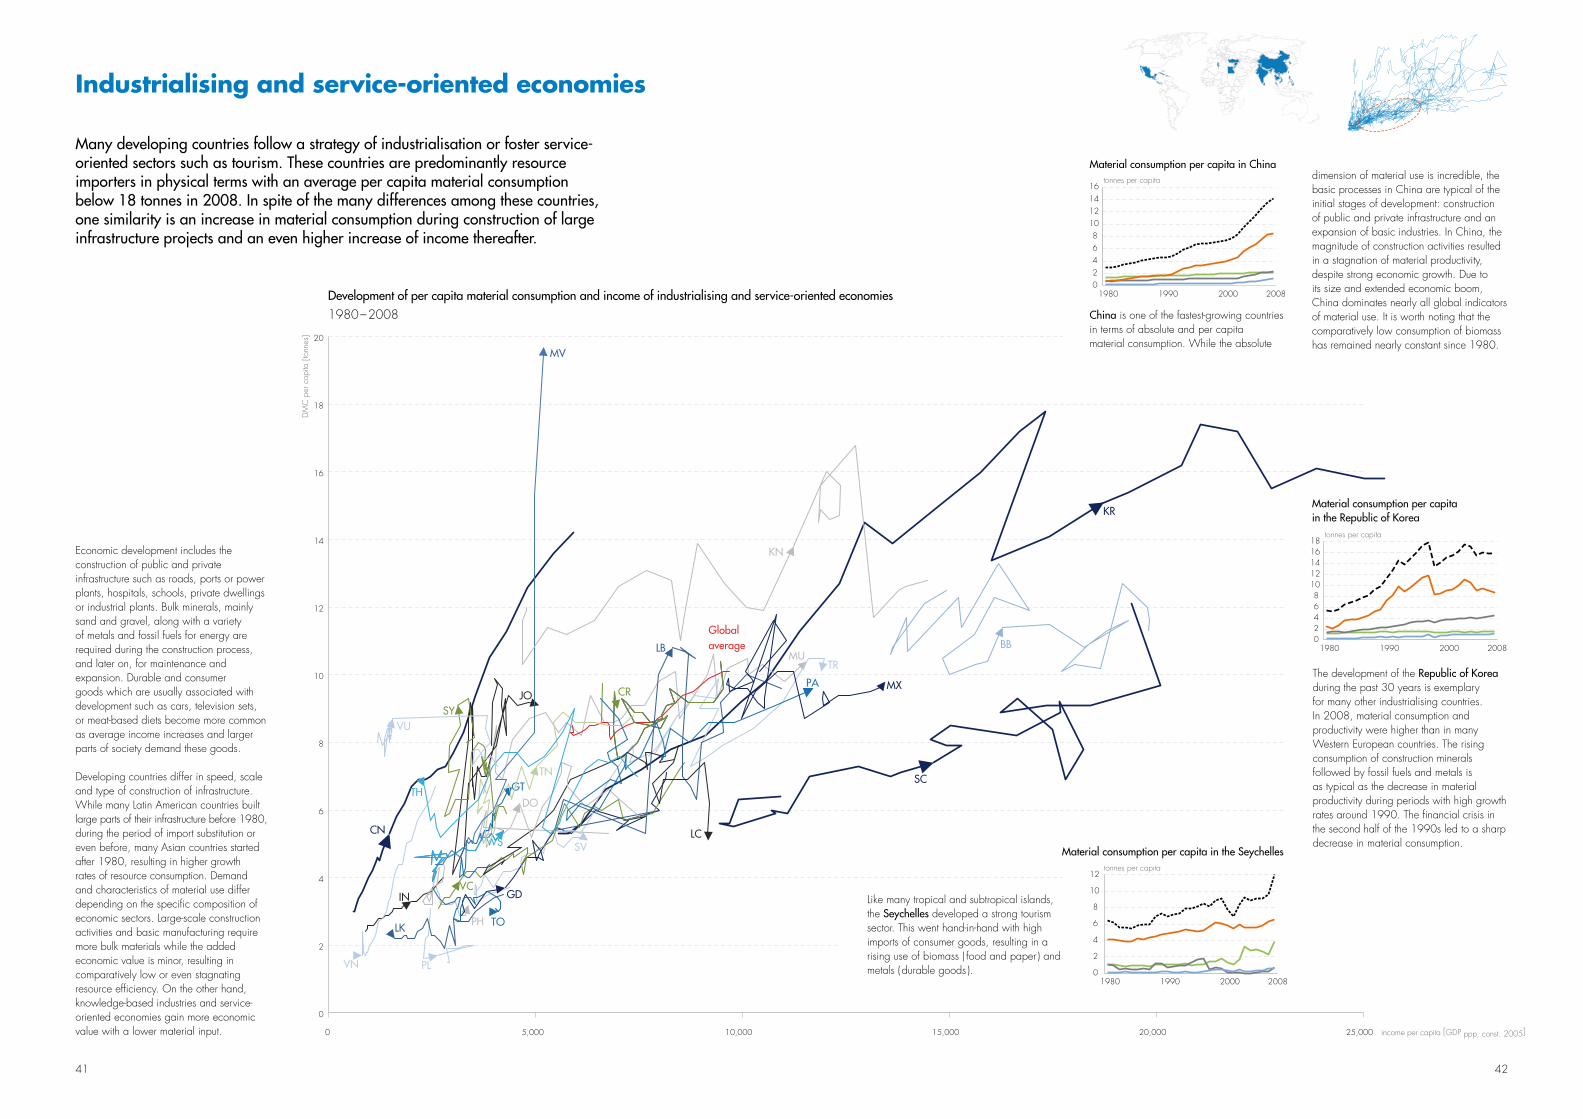
41 42
Economic development includes the construction of public and private infrastructure such as roads, ports or power plants, hospitals, schools, private dwellings or industrial plants. Bulk minerals, mainly sand and gravel, along with a variety of metals and fossil fuels for energy are required during the construction process, and later on, for maintenance and expansion. Durable and consumer goods which are usually associated with development such as cars, television sets, or meat-based diets become more common as average income increases and larger parts of society demand these goods.
Developing countries differ in speed, scale and type of construction of infrastructure. While many Latin American countries built large parts of their infrastructure before 1980, during the period of import substitution or even before, many Asian countries started after 1980, resulting in higher growth rates of resource consumption. Demand and characteristics of material use differ depending on the specific composition of economic sectors. Large-scale construction activities and basic manufacturing require more bulk materials while the added economic value is minor, resulting in comparatively low or even stagnating resource efficiency. On the other hand, knowledge-based industries and service- oriented economies gain more economic value with a lower material input.
Many developing countries follow a strategy of industrialisation or foster service-oriented sectors such as tourism. These countries are predominantly resource importers in physical terms with an average per capita material consumption below 18 tonnes in 2008. In spite of the many differences among these countries, one similarity is an increase in material consumption during construction of large infrastructure projects and an even higher increase of income thereafter.
industrialising and service-oriented economies
0
2
4
6
8
10
12
14
16
18
20
0 5,000 10,000 15,000 20,000 25,000
DM
C p
er c
apita
[ton
nes]
income per capita [GDP ppp, const. 2005]
SC
KR
CN
MU
Global average
IN
PH
SV
GD
PL
VC
TR
CR
LB
LC
LK
VN
DO GT
WS
TN
TO
PAJO MX
BB
MV
KN
TH
SY
VU
0 2 4 6 8
10 12 14 16
1980 1990 2000 2008
tonnes per capita
0 2 4 6 8
10 12 14 16 18
1980 1990 2000 2008
tonnes per capita
0
2
4
6
8
10
12
1980 1990 2000 2008
tonnes per capita
Like many tropical and subtropical islands, the Seychelles developed a strong tourism sector. This went hand-in-hand with high imports of consumer goods, resulting in a rising use of biomass ( food and paper ) and metals ( durable goods ).
The development of the Republic of Korea during the past 30 years is exemplary for many other industrialising countries. In 2008, material consumption and productivity were higher than in many Western European countries. The rising consumption of construction minerals followed by fossil fuels and metals is as typical as the decrease in material productivity during periods with high growth rates around 1990. The financial crisis in the second half of the 1990s led to a sharp decrease in material consumption.
Material consumption per capita in China
Material consumption per capita in the Seychelles
Development of per capita material consumption and income of industrialising and service-oriented economies1980 – 2008 China is one of the fastest-growing countries
in terms of absolute and per capita material consumption. While the absolute
Material consumption per capita in the Republic of Korea
dimension of material use is incredible, the basic processes in China are typical of the initial stages of development: construction of public and private infrastructure and an expansion of basic industries. In China, the magnitude of construction activities resulted in a stagnation of material productivity, despite strong economic growth. Due to its size and extended economic boom, China dominates nearly all global indicators of material use. It is worth noting that the comparatively low consumption of biomass has remained nearly constant since 1980.
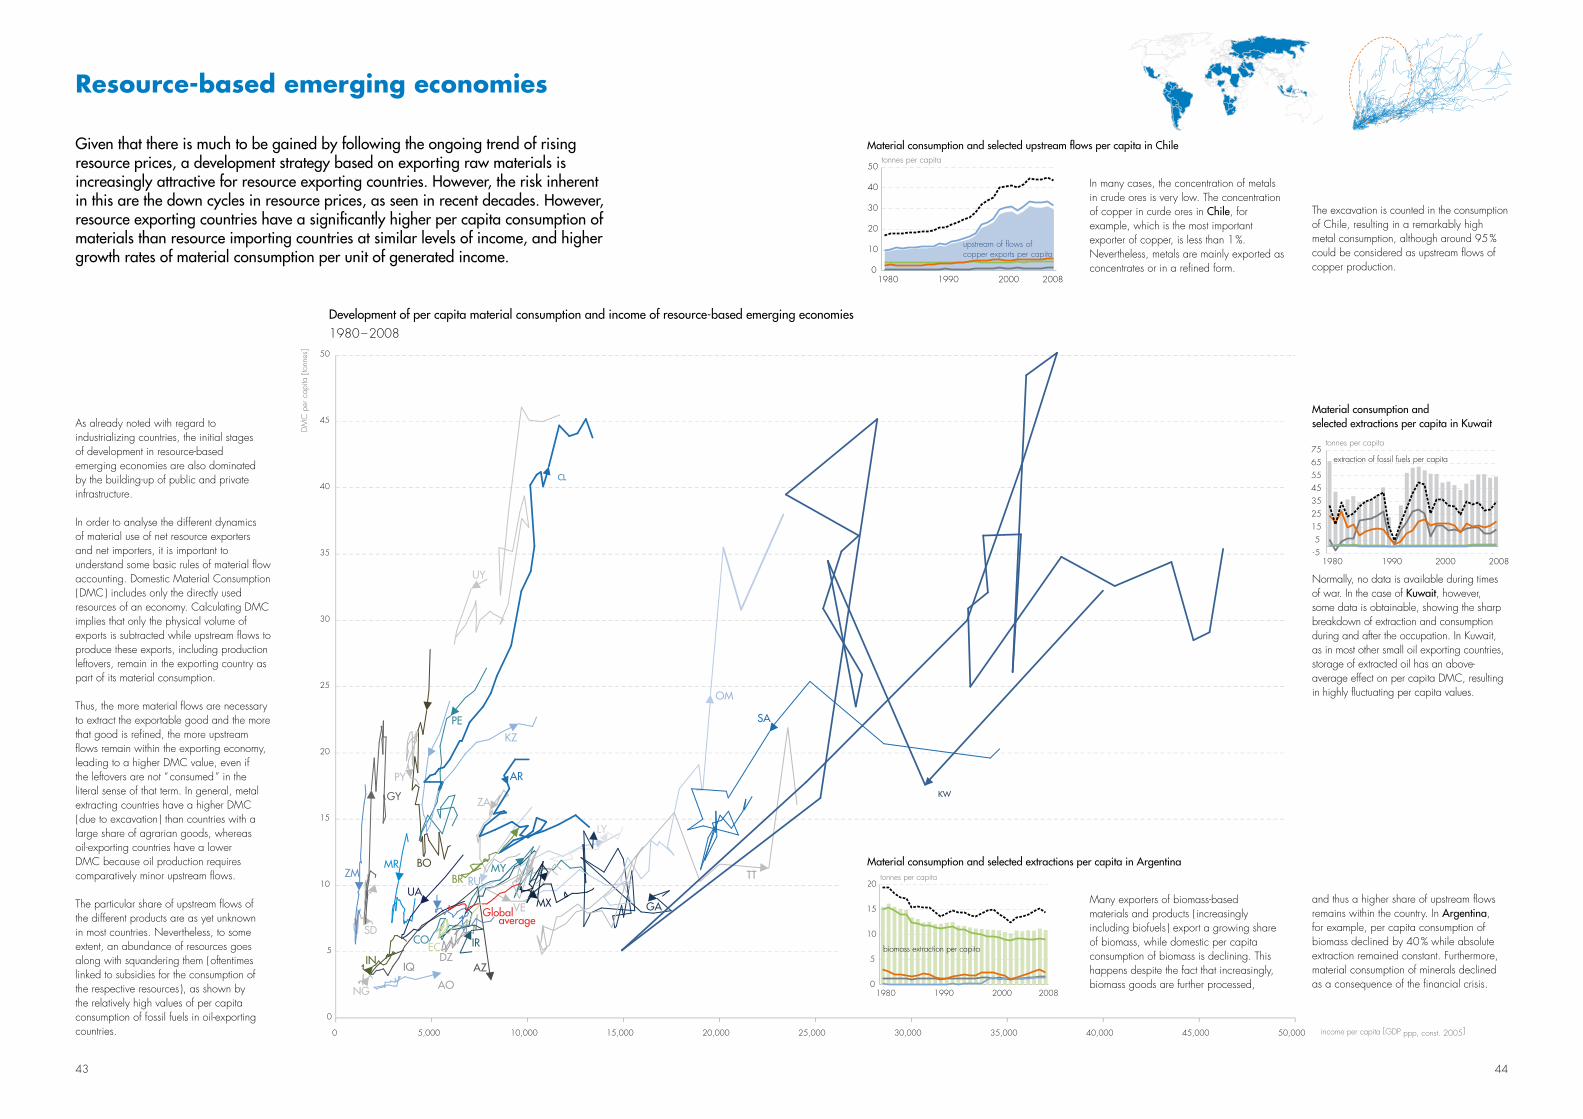
43 44
As already noted with regard to industrializing countries, the initial stages of development in resource-based emerging economies are also dominated by the building-up of public and private infrastructure.
In order to analyse the different dynamics of material use of net resource exporters and net importers, it is important to understand some basic rules of material fl ow accounting. Domestic Material Consumption ( DMC ) includes only the directly used resources of an economy. Calculating DMC implies that only the physical volume of exports is subtracted while upstream fl ows to produce these exports, including production leftovers, remain in the exporting country as part of its material consumption.
Thus, the more material fl ows are necessary to extract the exportable good and the more that good is refi ned, the more upstream fl ows remain within the exporting economy, leading to a higher DMC value, even if the leftovers are not “ consumed ” in the literal sense of that term. In general, metal extracting countries have a higher DMC ( due to excavation ) than countries with a large share of agrarian goods, whereas oil-exporting countries have a lower DMC because oil production requires comparatively minor upstream fl ows.
The particular share of upstream fl ows of the different products are as yet unknown in most countries. Nevertheless, to some extent, an abundance of resources goes along with squandering them ( oftentimes linked to subsidies for the consumption of the respective resources ), as shown by the relatively high values of per capita consumption of fossil fuels in oil-exporting countries.
Given that there is much to be gained by following the ongoing trend of rising resource prices, a development strategy based on exporting raw materials is increasingly attractive for resource exporting countries. However, the risk inherent in this are the down cycles in resource prices, as seen in recent decades. However, resource exporting countries have a signifi cantly higher per capita consumption of materials than resource importing countries at similar levels of income, and higher growth rates of material consumption per unit of generated income.
resource-based emerging economies
SD
35,000 40,000 45,000 50,000
5
10
15
20
25
30
35
40
45
50
0 5,000 10,000 15,000 20,000 25,000 30,000
0
DM
C p
er c
apita
[to
nnes
]
income per capita [GDP ppp, const. 2005]
RU
LY
AZ
BO
DZ
MY
IR
ZA
CO
AO
IQ
EC
VE
NG
averageGlobal GA
MRZM
GY
OM
PE
MX
KZ
PY
UY
SA
BR UA
TT
AR
CL
IN
KW
Many exporters of biomass-based materials and products ( increasingly including biofuels ) export a growing share of biomass, while domestic per capita consumption of biomass is declining. This happens despite the fact that increasingly, biomass goods are further processed,
Normally, no data is available during times of war. In the case of Kuwait, however, some data is obtainable, showing the sharp breakdown of extraction and consumption during and after the occupation. In Kuwait, as in most other small oil exporting countries, storage of extracted oil has an above-average effect on per capita DMC, resulting in highly fl uctuating per capita values.
In many cases, the concentration of metals in crude ores is very low. The concentration of copper in curde ores in Chile, for example, which is the most important exporter of copper, is less than 1 %. Nevertheless, metals are mainly exported as concentrates or in a refi ned form.
Material consumption and selected extractions per capita in Kuwait
Material consumption and selected extractions per capita in Argentina
Material consumption and selected upstream fl ows per capita in Chile
0
5
10
15
20
1980 1990 2000 2008
tonnes per capita
biomass extraction per capita
0
10
20
30
40
50
1980 1990 2000 2008
tonnes per capita
upstream of flows ofcopper exports per capita
-5 5
15 25 35 45 55 65 75
1980 1990 2000 2008
tonnes per capita
extraction of fossil fuels per capita
Development of per capita material consumption and income of resource-based emerging economies1980 – 2008
The excavation is counted in the consumption of Chile, resulting in a remarkably high metal consumption, although around 95 % could be considered as upstream fl ows of copper production.
and thus a higher share of upstream fl ows remains within the country. In Argentina, for example, per capita consumption of biomass declined by 40 % while absolute extraction remained constant. Furthermore, material consumption of minerals declined as a consequence of the fi nancial crisis.
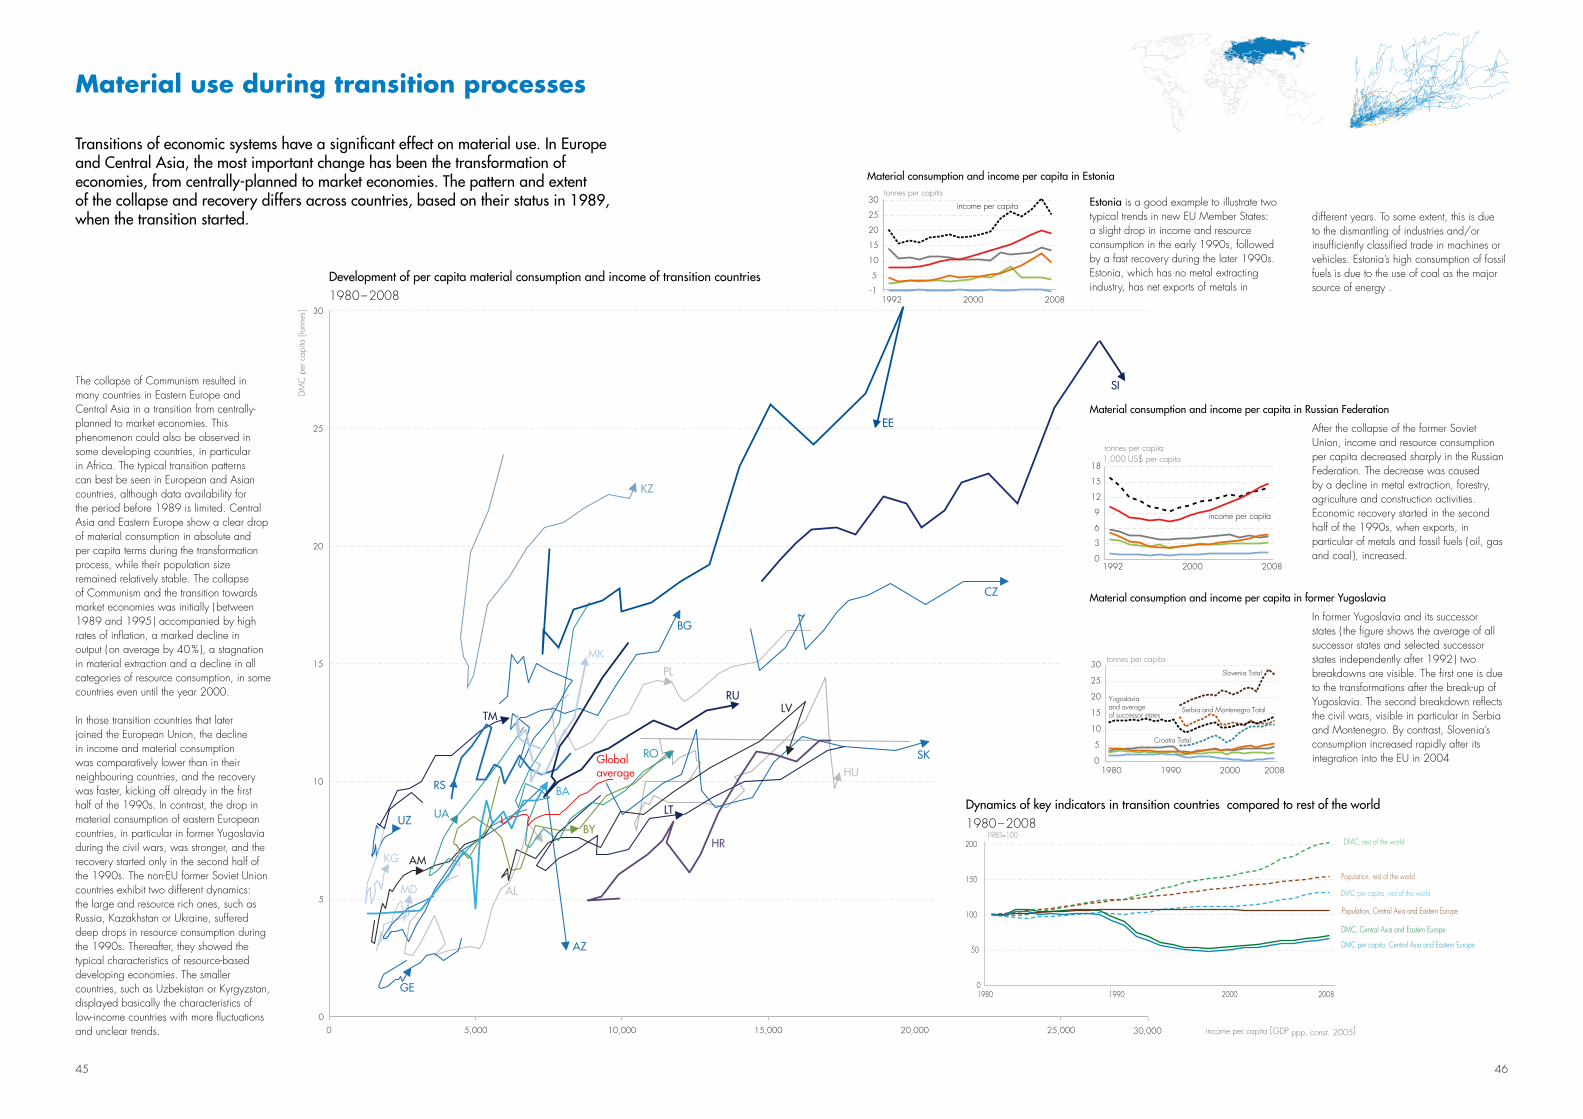
45 46
The collapse of Communism resulted in many countries in Eastern Europe and Central Asia in a transition from centrally- planned to market economies. This phenomenon could also be observed in some developing countries, in particular in Africa. The typical transition patterns can best be seen in European and Asian countries, although data availability for the period before 1989 is limited. Central Asia and Eastern Europe show a clear drop of material consumption in absolute and per capita terms during the transformation process, while their population size remained relatively stable. The collapse of Communism and the transition towards market economies was initially ( between 1989 and 1995 ) accompanied by high rates of inflation, a marked decline in output ( on average by 40 % ), a stagnation in material extraction and a decline in all categories of resource consumption, in some countries even until the year 2000.
In those transition countries that later joined the European Union, the decline in income and material consumption was comparatively lower than in their neighbouring countries, and the recovery was faster, kicking off already in the first half of the 1990s. In contrast, the drop in material consumption of eastern European countries, in particular in former Yugoslavia during the civil wars, was stronger, and the recovery started only in the second half of the 1990s. The non-EU former Soviet Union countries exhibit two different dynamics: the large and resource rich ones, such as Russia, Kazakhstan or Ukraine, suffered deep drops in resource consumption during the 1990s. Thereafter, they showed the typical characteristics of resource-based developing economies. The smaller countries, such as Uzbekistan or Kyrgyzstan, displayed basically the characteristics of low-income countries with more fluctuations and unclear trends.
material use during transition processes
20,000 25,000 0
5
10
15
20
25
30
0 5,000 10,000 15,000
DM
C p
er c
apita
[to
nnes
]
income per capita [GDP ppp, const. 2005] 30,000
UZ
KG
MD
AZ
AM
HU
SK
LV
AL
GE
BY
LT
HR
UA
TM
RO
PL
BG
RS
Global average
KZ
CZ
BA
MK
RU
SI
EE
-1
5
10
15
20
25
30
1992 2000 2008
tonnes per capita
income per capita
In former Yugoslavia and its successor states ( the figure shows the average of all successor states and selected successor states independently after 1992 ) two breakdowns are visible. The first one is due to the transformations after the break-up of Yugoslavia. The second breakdown reflects the civil wars, visible in particular in Serbia and Montenegro. By contrast, Slovenia’s consumption increased rapidly after its integration into the EU in 2004
After the collapse of the former Soviet Union, income and resource consumption per capita decreased sharply in the Russian Federation. The decrease was caused by a decline in metal extraction, forestry, agriculture and construction activities. Economic recovery started in the second half of the 1990s, when exports, in particular of metals and fossil fuels ( oil, gas and coal ), increased.
Estonia is a good example to illustrate two typical trends in new EU Member States: a slight drop in income and resource consumption in the early 1990s, followed by a fast recovery during the later 1990s. Estonia, which has no metal extracting industry, has net exports of metals in
Material consumption and income per capita in Estonia
Material consumption and income per capita in Russian Federation
Material consumption and income per capita in former Yugoslavia
0
3
6
9
12
15
18
1992 2000 2008
income per capita
tonnes per capita 1,000 US$ per capita
0
5
10
15
20
25
30
1980 1990 2000 2008
tonnes per capita
Serbia and Montenegro Total
Slovenia Total
Croatia Total
Yugoslavia and averageof successor states
Transitions of economic systems have a significant effect on material use. In Europe and Central Asia, the most important change has been the transformation of economies, from centrally-planned to market economies. The pattern and extent of the collapse and recovery differs across countries, based on their status in 1989, when the transition started.
0
50
100
150
200
1980 1990 2000 2008
DMC, rest of the world
Population, rest of the world DMC per capita, rest of the world Population, Central Asia and Eastern Europe DMC, Central Asia and Eastern Europe
DMC per capita, Central Asia and Eastern Europe
1980=100
Development of per capita material consumption and income of transition countries1980 – 2008
Dynamics of key indicators in transition countries compared to rest of the world 1980 – 2008
different years. To some extent, this is due to the dismantling of industries and/or insufficiently classified trade in machines or vehicles. Estonia’s high consumption of fossil fuels is due to the use of coal as the major source of energy .
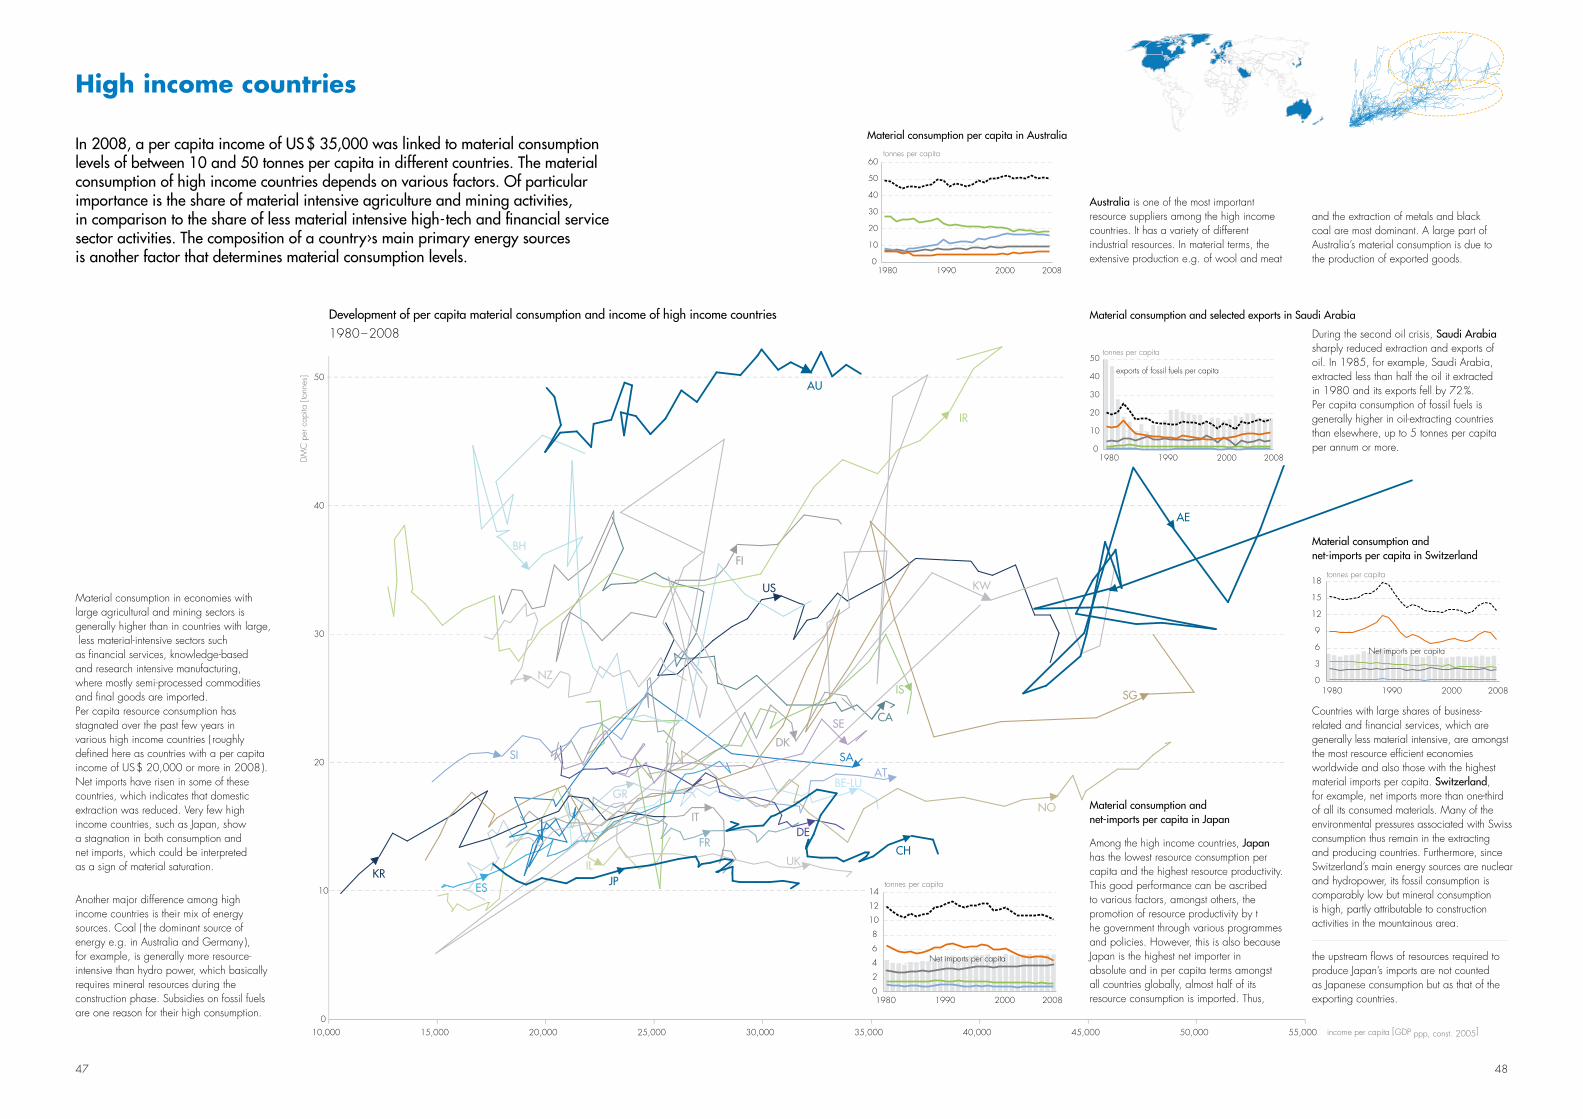
47 48
Material consumption in economies with large agricultural and mining sectors is generally higher than in countries with large, less material-intensive sectors such as fi nancial services, knowledge-based and research intensive manufacturing, where mostly semi-processed commodities and fi nal goods are imported. Per capita resource consumption has stagnated over the past few years in various high income countries ( roughly defi ned here as countries with a per capita income of US $ 20,000 or more in 2008 ). Net imports have risen in some of these countries, which indicates that domestic extraction was reduced. Very few high income countries, such as Japan, show a stagnation in both consumption and net imports, which could be interpreted as a sign of material saturation.
Another major difference among high income countries is their mix of energy sources. Coal ( the dominant source of energy e.g. in Australia and Germany ), for example, is generally more resource-intensive than hydro power, which basically requires mineral resources during the construction phase. Subsidies on fossil fuels are one reason for their high consumption.
High income countries
FR
IL
AT BE-LU
IS
0
10
20
30
40
50
10,000 15,000 20,000 25,000 30,000 35,000 40,000 45,000 50,000 55,000
DM
C p
er c
apita
[to
nnes
]
income per capita [GDP ppp, const. 2005]
DE
GR
CA
ES
IT
KR
SADK
FI
US KW
SI
UK
BH
NO
SE
SG
IR
NZ
JP
CH
AE
AU
0
10
20
30
40
50
60
1980 1990 2000 2008
tonnes per capita
Development of per capita material consumption and income of high income countries1980 – 2008
Material consumption per capita in Australia
Material consumption and net-imports per capita in Japan
Australia is one of the most important resource suppliers among the high income countries. It has a variety of different industrial resources. In material terms, the extensive production e.g. of wool and meat
During the second oil crisis, Saudi Arabia sharply reduced extraction and exports of oil. In 1985, for example, Saudi Arabia, extracted less than half the oil it extracted in 1980 and its exports fell by 72 %. Per capita consumption of fossil fuels is generally higher in oil-extracting countries than elsewhere, up to 5 tonnes per capita per annum or more.
Material consumption and selected exports in Saudi Arabia
Material consumption and net-imports per capita in Switzerland
In 2008, a per capita income of US $ 35,000 was linked to material consumption levels of between 10 and 50 tonnes per capita in different countries. The material consumption of high income countries depends on various factors. Of particular importance is the share of material intensive agriculture and mining activities, in comparison to the share of less material intensive high-tech and fi nancial service sector activities. The composition of a country›s main primary energy sources is another factor that determines material consumption levels.
0
2
4
6
8
10
12
14
1980 1990 2000 2008
Net imports per capita
tonnes per capita
0
3
6
9
12
15
18
1980 1990 2000 2008
tonnes per capita
Net imports per capita
0
10
20
30
40
50
1980 1990 2000 2008
tonnes per capita
exports of fossil fuels per capita
Net imports per capita
Among the high income countries, Japan has the lowest resource consumption per capita and the highest resource productivity. This good performance can be ascribed to various factors, amongst others, the promotion of resource productivity by the government through various programmes and policies. However, this is also because Japan is the highest net importer in absolute and in per capita terms amongst all countries globally, almost half of its resource consumption is imported. Thus,
the upstream fl ows of resources required to produce Japan’s imports are not counted as Japanese consumption but as that of the exporting countries.
Countries with large shares of business-related and fi nancial services, which are generally less material intensive, are amongst the most resource effi cient economies worldwide and also those with the highest material imports per capita. Switzerland, for example, net imports more than one-third of all its consumed materials. Many of the environmental pressures associated with Swiss consumption thus remain in the extracting and producing countries. Furthermore, since Switzerland’s main energy sources are nuclear and hydropower, its fossil consumption is comparably low but mineral consumption is high, partly attributable to construction activities in the mountainous area.
and the extraction of metals and black coal are most dominant. A large part of Australia’s material consumption is due to the production of exported goods.
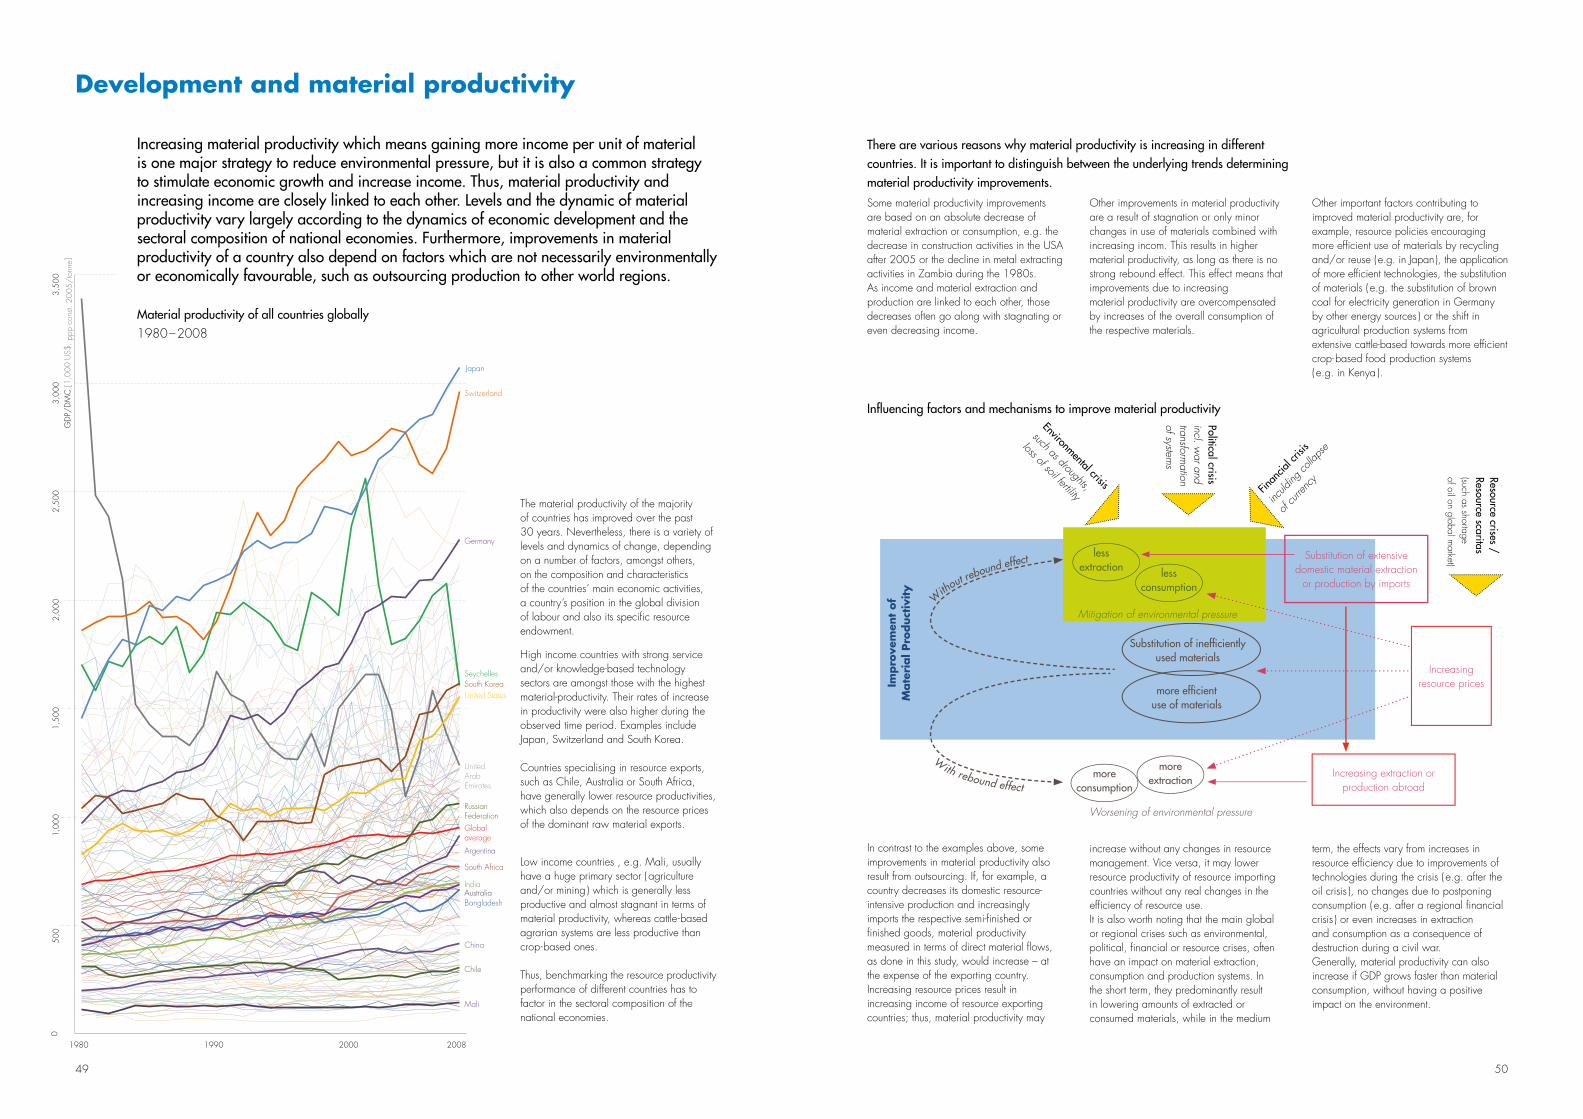
2,00
02,
500
3,00
03,
500
050
01,
000
1,50
0
1980 1990 2000 2008
GD
P/D
MC
[1,0
00 U
S$, p
pp c
onst.
200
5/to
nne]
Seychelles
United StatesSouth Korea
Germany
Switzerland
Japan
Russian FederationGlobal average
South Africa
India
Mali
Argentina
Australia
United Arab Emirates
China
Chile
Bangladesh
49 50
The material productivity of the majority of countries has improved over the past 30 years. Nevertheless, there is a variety of levels and dynamics of change, depending on a number of factors, amongst others, on the composition and characteristics of the countries’ main economic activities, a country’s position in the global division of labour and also its specifi c resource endowment.
High income countries with strong service and/or knowledge-based technology sectors are amongst those with the highest material-productivity. Their rates of increase in productivity were also higher during the observed time period. Examples include Japan, Switzerland and South Korea.
Countries specialising in resource exports, such as Chile, Australia or South Africa, have generally lower resource productivities, which also depends on the resource prices of the dominant raw material exports.
Low income countries , e.g. Mali, usually have a huge primary sector ( agriculture and/or mining ) which is generally less productive and almost stagnant in terms of material productivity, whereas cattle-based agrarian systems are less productive than crop-based ones.
Thus, benchmarking the resource productivity performance of different countries has to factor in the sectoral composition of the national economies.
Development and material productivity
In contrast to the examples above, some improvements in material productivity also result from outsourcing. If, for exam ple, a country decreases its domestic resource-intensive production and increasingly imports the respective semi-fi nished or fi nished goods, material productivity measured in terms of direct material fl ows, as done in this study, would increase – at the expense of the exporting country.Increasing resource prices result in increasing income of resource exporting countries; thus, material productivity may
increase without any changes in resource management. Vice versa, it may lower resource productivity of resource importing countries without any real changes in the effi ciency of resource use.It is also worth noting that the main global or regional crises such as environmental, political, fi nancial or resource crises, often have an impact on material extraction, consumption and production systems. In the short term, they predominantly result in lowering amounts of extracted or consumed materials, while in the medium
term, the effects vary from increases in resource effi ciency due to improvements of technologies during the crisis ( e.g. after the oil crisis ), no changes due to postponing consumption ( e.g. after a regional fi nancial crisis ) or even increases in extraction and consumption as a consequence of destruction during a civil war. Generally, material productivity can also increase if GDP grows faster than material consumption, without having a positive impact on the environment.
Increasing material productivity which means gaining more income per unit of material is one major strategy to reduce environmental pressure, but it is also a common strategy to stimulate economic growth and increase income. Thus, material productivity and increasing income are closely linked to each other. Levels and the dynamic of material productivity vary largely according to the dynamics of economic development and the sectoral composition of national economies. Furthermore, improvements in material productivity of a country also depend on factors which are not necessarily environmentally or economically favourable, such as outsourcing production to other world regions.
Material productivity of all countries globally1980 – 2008
Infl uencing factors and mechanisms to improve material productivity
impro
vem
ent
of
mate
rial P
roduct
ivity
Substitution of ineffi cientlyused materials
more effi cientuse of materials
Substitution of extensive domestic material extraction
or production by imports
Increasingresource prices
Increasing extraction or production abroad
Resource crises /Resource scaritas (such as shortage of oil on global m
arket)
Environmental crisis
such as droughts,
loss of soil fertility
Political crisisincl. w
ar andtransform
ationof system
s
Finan
cial c
risis
inculd
ing co
llaps
e
of cu
rrenc
y
W
ithout rebound effect
W ith rebound effect
lessconsumption
lessextraction
Mitigation of environmental pressure
moreconsumption
moreextraction
Worsening of environmental pressure
Some material productivity improvements are based on an absolute decrease of material extraction or consumption, e.g. the decrease in construction activities in the USA after 2005 or the decline in metal extracting activities in Zambia during the 1980s. As income and material extraction and production are linked to each other, those decreases often go along with stagnating or even decreasing income.
There are various reasons why material productivity is in creas ing in different countries. It is important to distinguish between the underlying trends determining material productivity improvements.
Other improvements in material productivity are a result of stagnation or only minor changes in use of materials combined with increasing incom. This results in higher material productivity, as long as there is no strong rebound effect. This effect means that improvements due to increasing material productivity are overcompensated by increases of the overall consumption of the respective materials.
Other important factors contributing to improved material productivity are, for example, resource policies encouraging more effi cient use of materials by recycling and/or reuse ( e.g. in Japan ), the application of more effi cient technologies, the substitution of materials ( e.g. the substitution of brown coal for electricity generation in Germany by other energy sources ) or the shift in agricultural production systems from extensive cattle-based towards more effi cient crop- based food production systems ( e.g. in Kenya ).
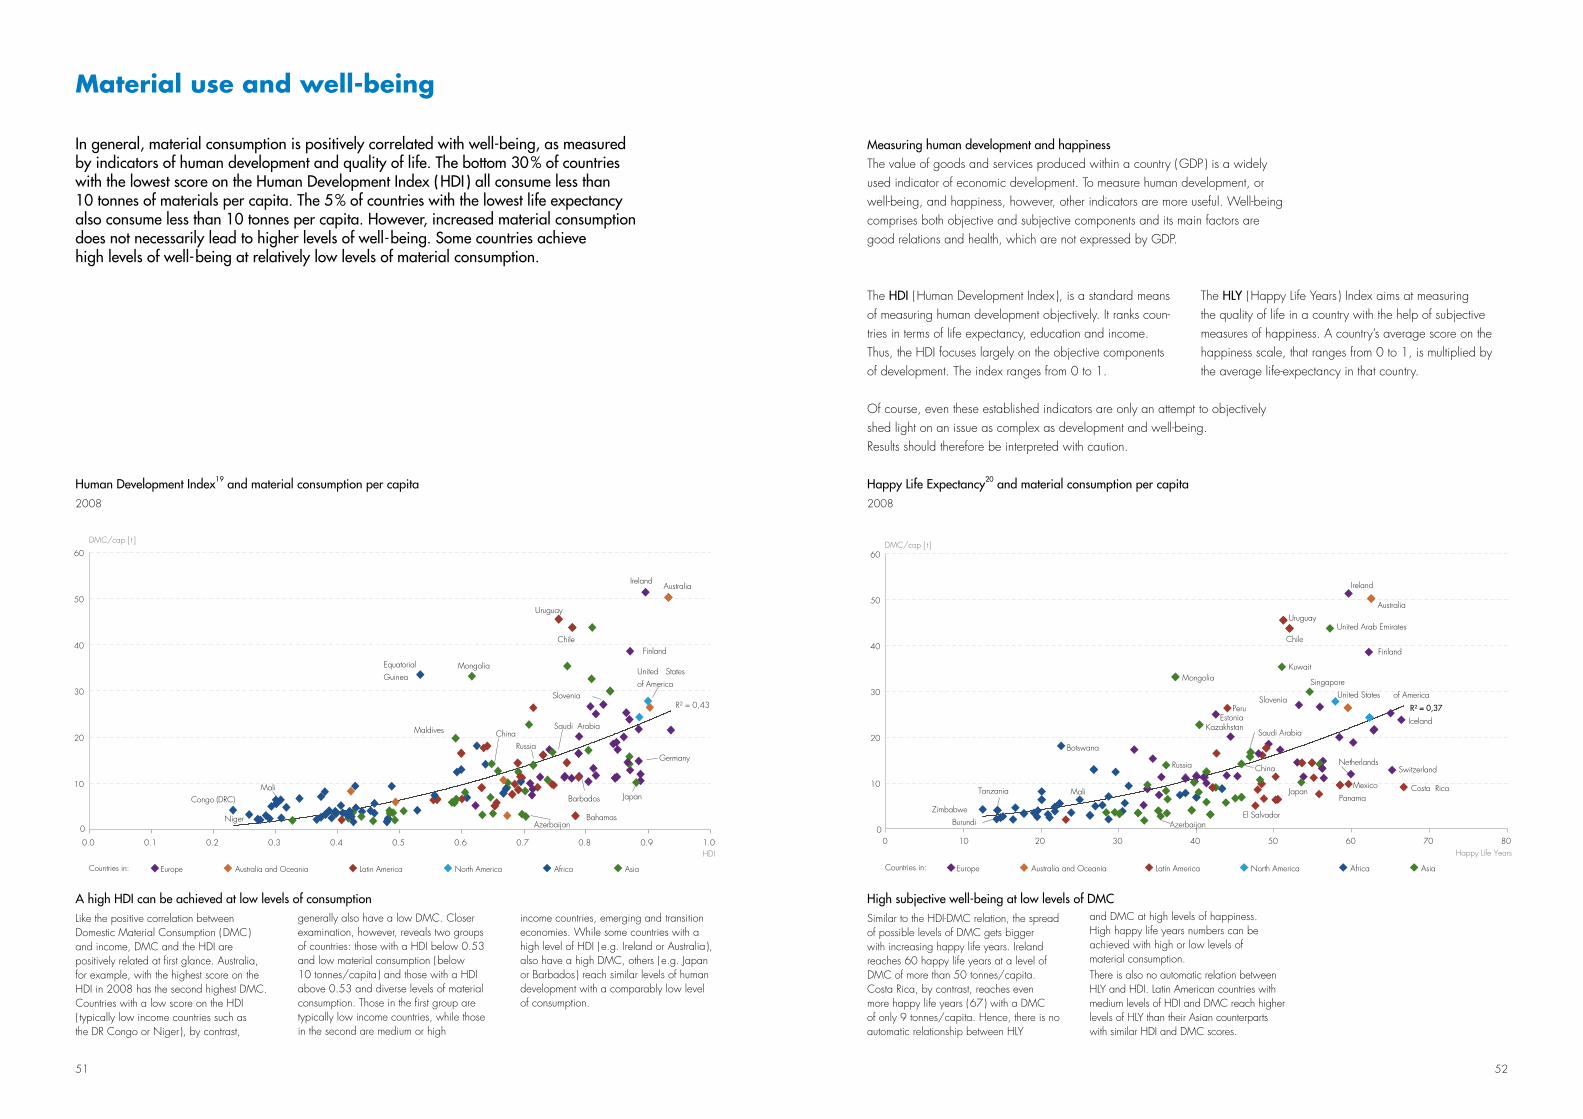
51 52
Human Development Index19 and material consumption per capita2008
Like the positive correlation between Domestic Material Consumption ( DMC ) and income, DMC and the HDI are positively related at first glance. Australia, for example, with the highest score on the HDI in 2008 has the second highest DMC. Countries with a low score on the HDI ( typically low income countries such as the DR Congo or Niger ), by contrast,
In general, material consumption is positively correlated with well-being, as measured by indicators of human development and quality of life. The bottom 30 % of countries with the lowest score on the Human Development Index ( HDI ) all consume less than 10 tonnes of materials per capita. The 5 % of countries with the lowest life expectancy also consume less than 10 tonnes per capita. However, increased material consumption does not necessarily lead to higher levels of well-being. Some countries achieve high levels of well-being at relatively low levels of material consumption.
material use and well-being
Similar to the HDI-DMC relation, the spread of possible levels of DMC gets bigger with increasing happy life years. Ireland reaches 60 happy life years at a level of DMC of more than 50 tonnes/capita. Costa Rica, by contrast, reaches even more happy life years ( 67 ) with a DMC of only 9 tonnes/capita. Hence, there is no automatic relationship between HLY
The HLY ( Happy Life Years ) Index aims at measuring the quality of life in a country with the help of subjective measures of happiness. A country’s average score on the happiness scale, that ranges from 0 to 1, is multiplied by the average life-expectancy in that country.
and DMC at high levels of happiness. High happy life years numbers can be achieved with high or low levels of material consumption. There is also no automatic relation between HLY and HDI. Latin American countries with medium levels of HDI and DMC reach higher levels of HLY than their Asian counterparts with similar HDI and DMC scores.
Happy Life Expectancy20 and material consumption per capita2008
generally also have a low DMC. Closer examination, however, reveals two groups of countries: those with a HDI below 0.53 and low material consumption ( below 10 tonnes/capita ) and those with a HDI above 0.53 and diverse levels of material consumption. Those in the first group are typically low income countries, while those in the second are medium or high
income countries, emerging and transition economies. While some countries with a high level of HDI ( e.g. Ireland or Australia ), also have a high DMC, others ( e.g. Japan or Barbados ) reach similar levels of human development with a comparably low level of consumption.
A high HDI can be achieved at low levels of consumption High subjective well-being at low levels of DMC
Measuring human development and happinessThe value of goods and services produced within a country ( GDP ) is a widely used indicator of economic development. To measure human development, or well-being, and happiness, however, other indicators are more useful. Well-being comprises both objective and subjective components and its main factors are good relations and health, which are not expressed by GDP.
The HDI ( Human Development Index ), is a standard means of measuring human development objectively. It ranks coun-tries in terms of life expectancy, education and income. Thus, the HDI focuses largely on the objective components of development. The index ranges from 0 to 1.
R² = 0,43
0
10
20
30
40
50
60
0.0 0.1 0.2 0.3 0.4 0.5 0.6 0.7 0.8 0.9 1.0 HDI
DMC/cap [ t ]
Bahamas
Barbados Japan
Australia
Azerbaijan
China Russia
Chile
Mali
Saudi Arabia
Slovenia
Congo (DRC)
Niger
Equatorial Guinea
Mongolia
Uruguay
Ireland
United States of America
Maldives
Germany
Finland
Australia and OceaniaEurope Latin America North America Africa AsiaCountries in:
R² = 0,37
0
10
20
30
40
50
60
0 10 20 30 40 50 60 70 80Happy Life Years
DMC/cap [ t ]
Mexico
Switzerland
Costa Rica
Netherlands
Panama
Azerbaijan
Chile
China
JapanMali
Russia
Saudi Arabia
Slovenia
United Arab Emirates
ZimbabweBurundi
Tanzania
Botswana
Mongolia
Uruguay
Ireland
Australia
Finland
El Salvador
Kuwait
IcelandPeru
EstoniaKazakhstan
SingaporeUnited States of America
Australia and OceaniaEurope Latin America North America Africa Asia
Australia and OceaniaEurope Latin America North America Africa AsiaCountries in:
Of course, even these established indicators are only an attempt to objectively shed light on an issue as complex as development and well-being. Results should therefore be interpreted with caution.
53
XXX
54
XXX
Material use and the environment at a glance __________________ 54
Agriculture and water scarcity _______________________________ 56
Minerals, sealed land and CO2 emissions _____________________ 58
Fossil fuels use and climate change ___________________________ 60
Metal ores and unused material extraction _____________________ 62
Material use and the environment4
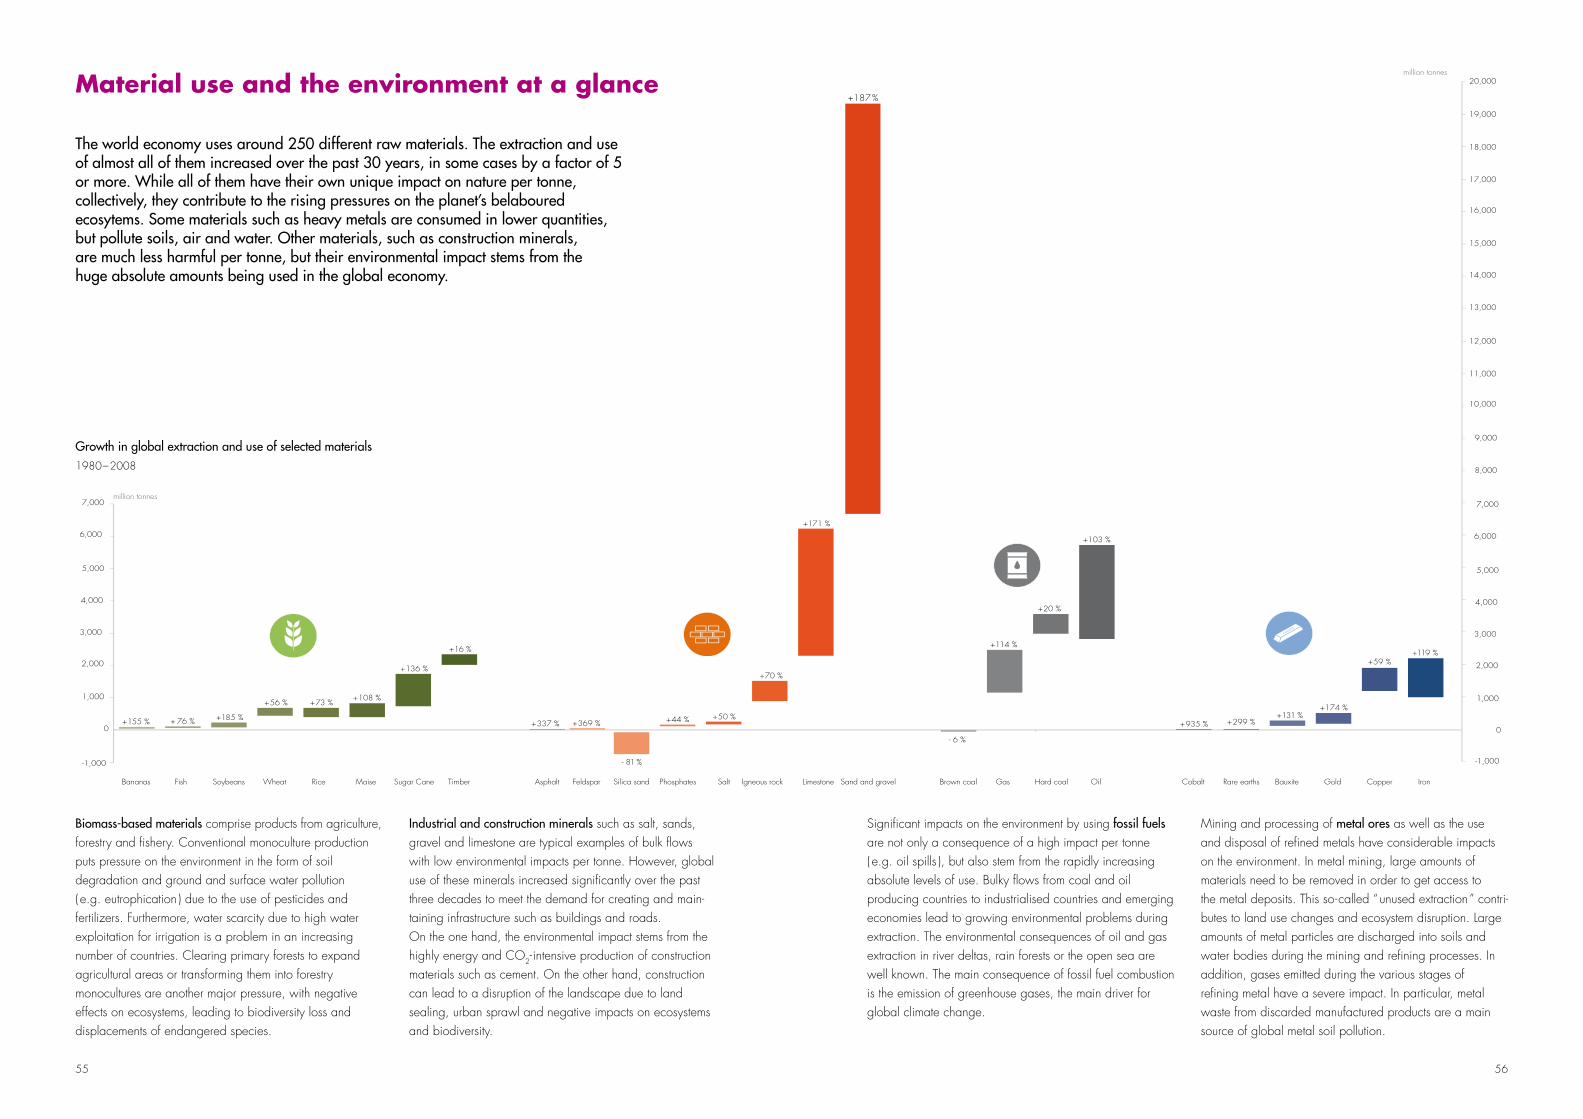
+108 %
+136 %
+155 % + 76 %
+56 %
+16 %
+73 %
17,000
18,000
19,000
20,000
8,000
9,000
10,000
11,000
12,000
13,000
14,000
15,000
16,000
+185 %0
1,000
2,000
3,000
4,000
5,000
6,000
7,000million tonnes
-1,000
1,000
2,000
3,000
4,000
5,000
6,000
7,000
-1,000
0
million tonnes
Asphalt Feldspar Silica sand Phosphates Salt Igneous rock Limestone Sand and gravel
+44 %
+171 %
+70 %
- 81 %
+187 %
+50 %+369 %+337 %
+103 %
+114 %
+20 %
- 6 %
Brown coal Gas OilHard coal
+119 %
+131 %+174 %
+299 %+935 %
+59 %
Cobalt Rare earths Bauxite Gold Copper IronBananas Fish Soybeans Wheat Rice Maise Sugar Cane Timber
55 56
Industrial and construction minerals such as salt, sands, gravel and limestone are typical examples of bulk fl ows with low environmental impacts per tonne. However, global use of these minerals increased signifi cantly over the past three decades to meet the demand for creating and main-taining infrastructure such as buildings and roads.On the one hand, the environmental impact stems from the highly energy and CO2-intensive production of construction materials such as cement. On the other hand, construction can lead to a disruption of the landscape due to land sealing, urban sprawl and negative impacts on ecosystems and biodiversity.
Biomass-based materials comprise products from agriculture, forestry and fi shery. Conventional monoculture production puts pressure on the environment in the form of soil degradation and ground and surface water pollution ( e.g. eutrophication ) due to the use of pesticides and fertilizers. Furthermore, water scarcity due to high water exploitation for irrigation is a problem in an increasing number of countries. Clearing primary forests to expand agricultural areas or transforming them into forestry monocultures are another major pressure, with negative effects on ecosystems, leading to biodiversity loss and displacements of endangered species.
The world economy uses around 250 different raw materials. The extraction and use of almost all of them increased over the past 30 years, in some cases by a factor of 5 or more. While all of them have their own unique impact on nature per tonne, collectively, they contribute to the rising pressures on the planet’s belaboured ecosytems. Some materials such as heavy metals are consumed in lower quantities, but pollute soils, air and water. Other materials, such as construction minerals, are much less harmful per tonne, but their environmental impact stems from the huge absolute amounts being used in the global economy.
material use and the environment at a glance
Mining and processing of metal ores as well as the use and disposal of refi ned metals have considerable impacts on the environment. In metal mining, large amounts of materials need to be removed in order to get access to the metal deposits. This so-called “ unused extraction ” contri-butes to land use changes and ecosystem disruption. Large amounts of metal particles are discharged into soils and water bodies during the mining and refi ning processes. In addition, gases emitted during the various stages of refi ning metal have a severe impact. In particular, metal waste from discarded manufactured products are a main source of global metal soil pollution.
Signifi cant impacts on the environment by using fossil fuels are not only a consequence of a high impact per tonne ( e.g. oil spills ), but also stem from the rapidly increasing absolute levels of use. Bulky fl ows from coal and oil producing countries to industrialised countries and emerging economies lead to growing environmental problems during extraction. The environmental consequences of oil and gas extraction in river deltas, rain forests or the open sea are well known. The main consequence of fossil fuel combustion is the emission of greenhouse gases, the main driver for global climate change.
Growth in global extraction and use of selected materials1980 – 2008
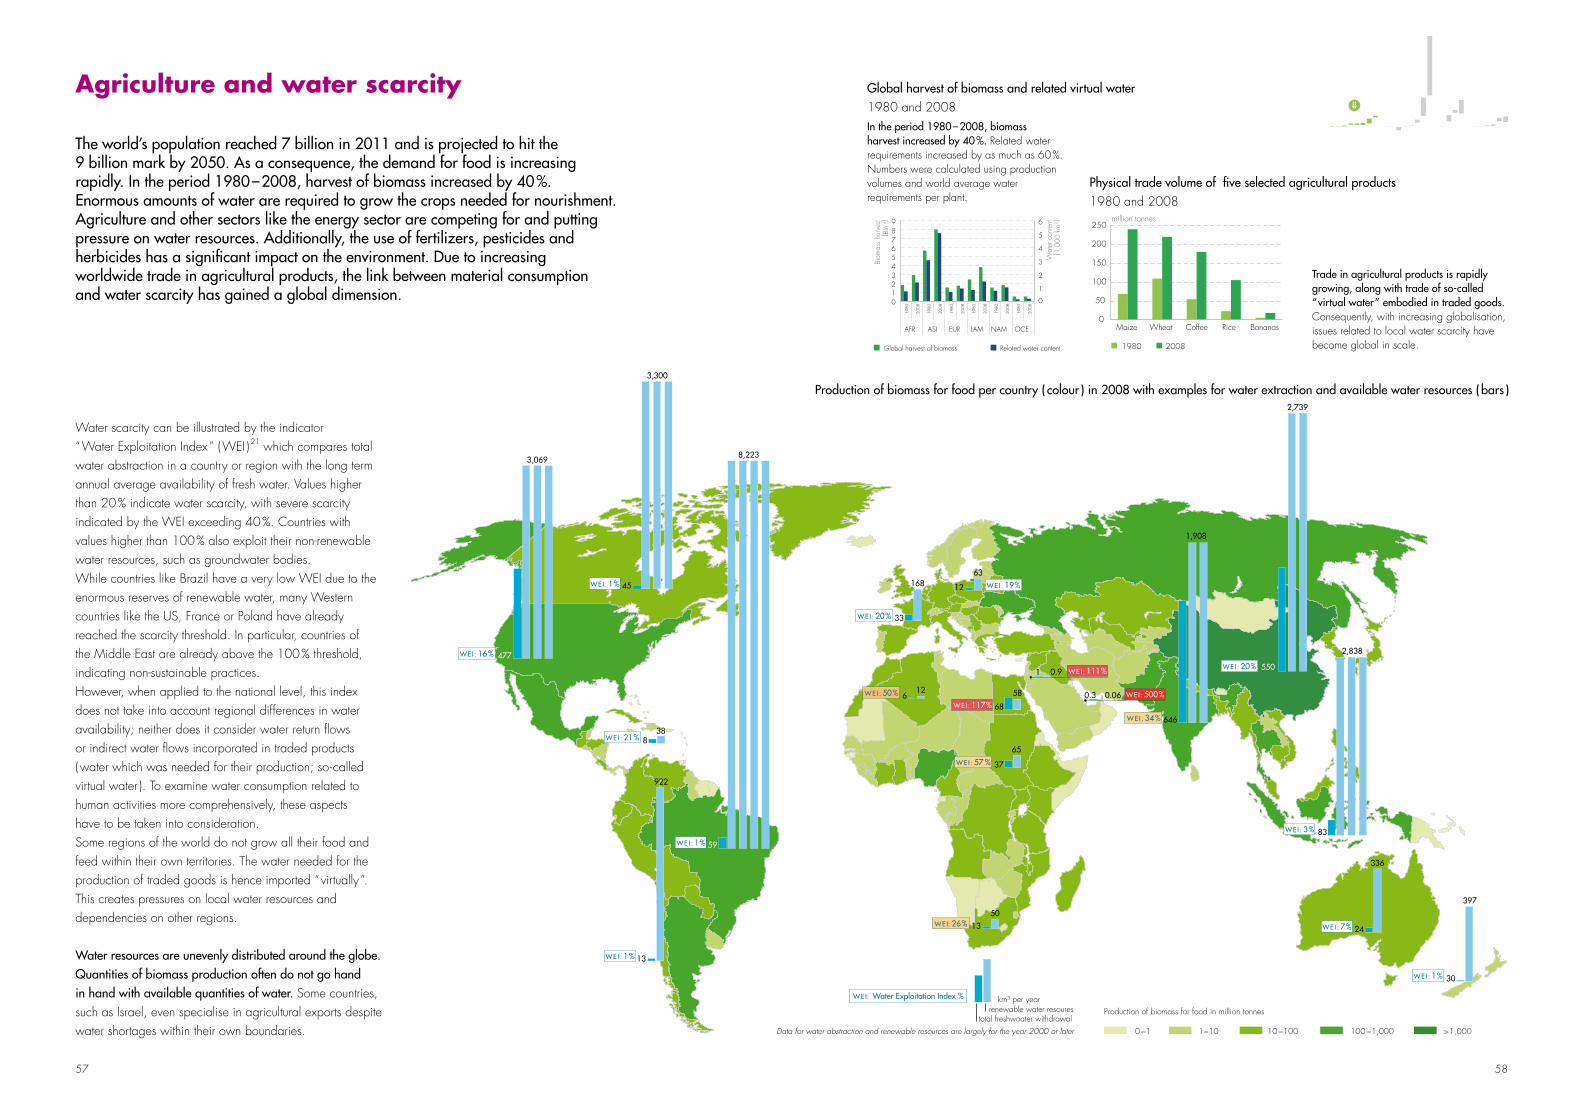
Production of biomass for food in million tonnes
10 −100 1−10 0 −1 100 −1,000 > 1,000
total freshwoater withdrawal Data for water abstraction and renewable resources are largely for the year 2000 or later
renewable water resoureskm³ per yearW E I: Water Exploitation Index %
W E I : 1 %
W E I : 7 %
W E I : 3 %
W E I : 20 %
W E I : 34 %
W E I : 1 %
W E I : 1 %
W E I : 16 %
W E I : 21 %
W E I: 26 %
W E I : 19 %
W E I : 20 %
W E I : 50 %W E I : 117 %
W E I : 57 %
W E I : 500 %
W E I : 111 %
8,223
1,908
2,739
3,069
63
2,838
397
3,300
168
58
65
50
12
336
12
646
550
83
24
30
13
37
668
33
38
45
477
13
59
8
922
W E I : 1 %
0.060.3
1 0.9
57 58
Trade in agricultural products is rapidly growing, along with trade of so-called “ virtual water ” embodied in traded goods. Consequently, with increasing globalisation, issues related to local water scarcity have become global in scale.
In the period 1980 – 2008, biomass harvest increased by 40 %. Related water requirements increased by as much as 60 %. Numbers were calculated using production volumes and world average water requirements per plant.
Water scarcity can be illustrated by the indicator “ Water Exploitation Index ” ( WEI ) 21 which compares total water abstraction in a country or region with the long term annual average availability of fresh water. Values higher than 20 % indicate water scarcity, with severe scarcity indicated by the WEI exceeding 40 %. Countries with values higher than 100 % also exploit their non-renewable water resources, such as groundwater bodies.While countries like Brazil have a very low WEI due to the enormous reserves of renewable water, many Western countries like the US, France or Poland have already reached the scarcity threshold. In particular, countries of the Middle East are already above the 100 % threshold, indicating non-sustainable practices.However, when applied to the national level, this index does not take into account regional differences in water availability; neither does it consider water return flows or indirect water flows incorporated in traded products ( water which was needed for their production; so-called virtual water ). To examine water consumption related to human activities more comprehensively, these aspects have to be taken into consideration.Some regions of the world do not grow all their food and feed within their own territories. The water needed for the production of traded goods is hence imported “ virtually ”. This creates pressures on local water resources and dependencies on other regions.
The world’s population reached 7 billion in 2011 and is projected to hit the 9 billion mark by 2050. As a consequence, the demand for food is increasing rapidly. In the period 1980 – 2008, harvest of biomass increased by 40 %. Enor mous amounts of water are required to grow the crops needed for nourishment. Agriculture and other sectors like the energy sector are competing for and putting pressure on water resources. Additionally, the use of fertilizers, pesticides and herbicides has a significant impact on the environment. Due to increasing worldwide trade in agricultural products, the link between material consumption and water scarcity has gained a global dimension.
agriculture and water scarcity
1980
2008
1980
2008
1980
2008
1980
2008
1980
2008
1980
2008
Global harvest of biomass Related water content
0
1
2
3
4
5
6
Wat
er c
onte
nt[ 1
,000
km
³]
0123456789
Biom
ass
harv
est
[ Bln
t]
AFR ASI EUR LAM NAM OCE
Production of biomass for food per country ( colour ) in 2008 with examples for water extraction and available water resources ( bars )
Global harvest of biomass and related virtual water 1980 and 2008
Physical trade volume of five selected agricultural products 1980 and 2008
Water resources are unevenly distributed around the globe. Quantities of biomass production often do not go hand in hand with available quantities of water. Some countries, such as Israel, even specialise in agricultural exports despite water shortages within their own boundaries.
0
50
100
150
200
250
Maize Wheat Coffee Rice
1980 2008
million tonnes
Bananas
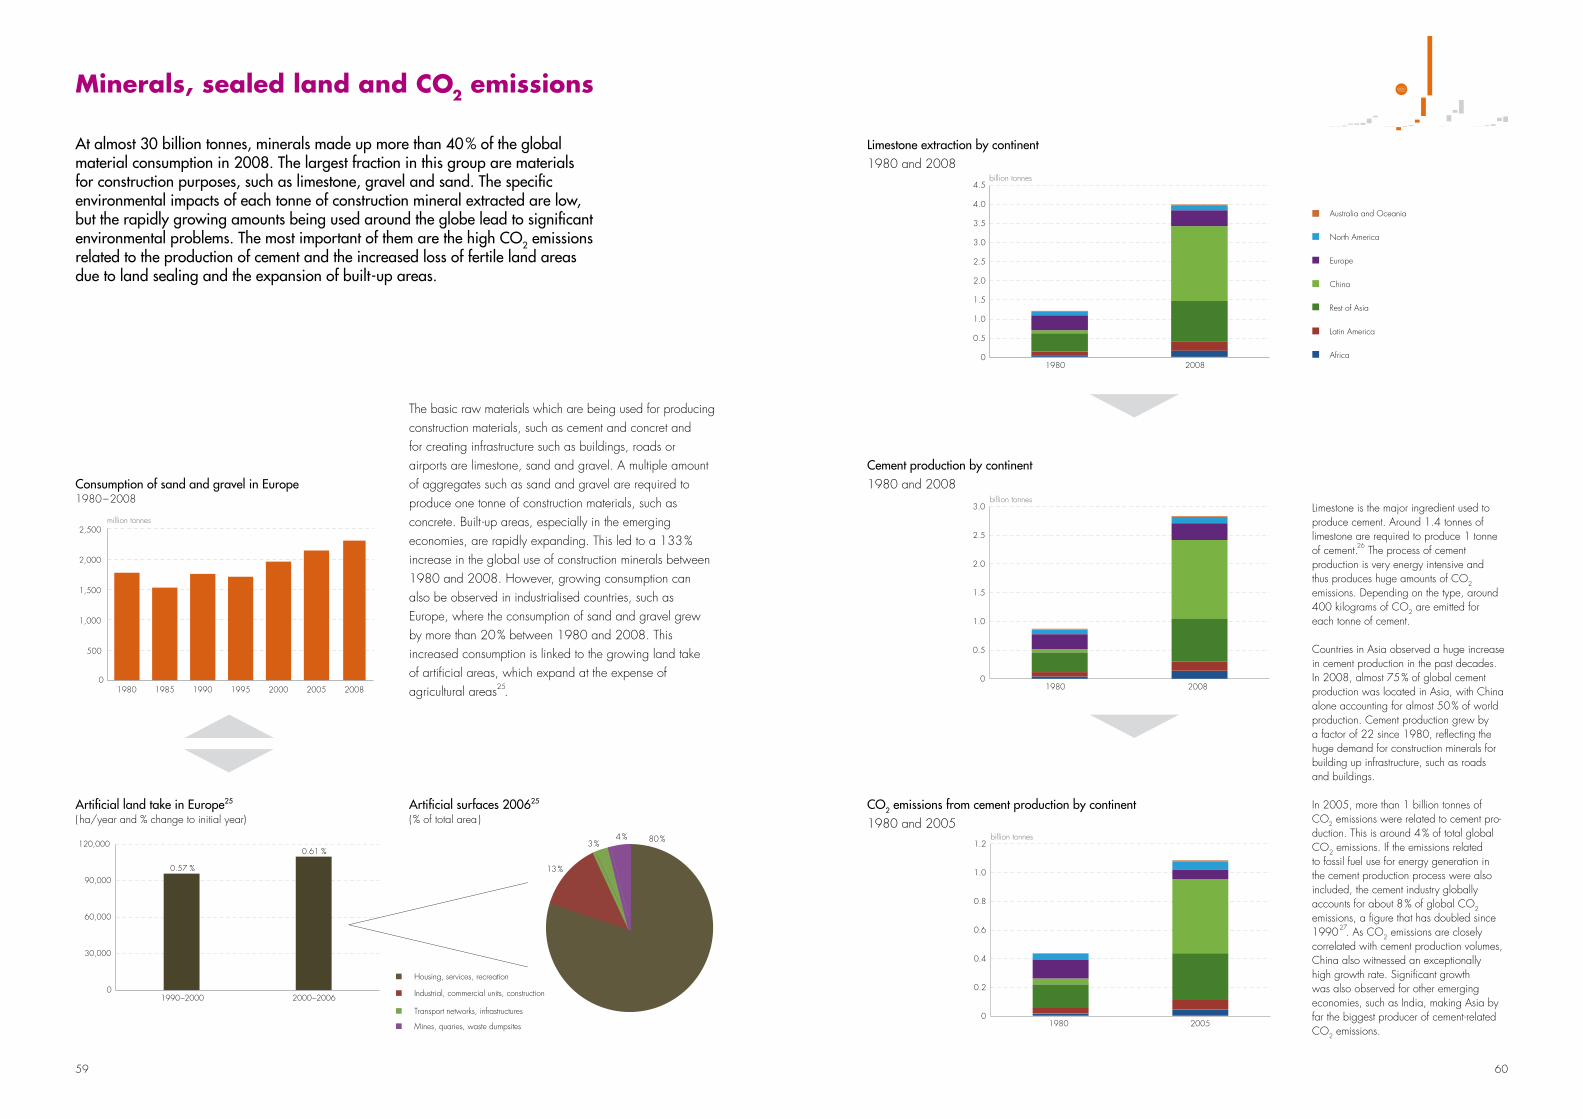
59 60
The basic raw materials which are being used for producing construction materials, such as cement and concret and for creating infrastructure such as buildings, roads or airports are limestone, sand and gravel. A multiple amount of aggregates such as sand and gravel are required to produce one tonne of construction materials, such as concrete. Built -up areas, especially in the emerging economies, are rapidly expanding. This led to a 133 % increase in the global use of construction minerals between 1980 and 2008. However, growing consumption can also be observed in industrialised countries, such as Europe, where the consumption of sand and gravel grew by more than 20 % between 1980 and 2008. This increased consumption is linked to the growing land take of artifi cial areas, which expand at the expense of agricultural areas25.
At almost 30 billion tonnes, minerals made up more than 40 % of the global material consumption in 2008. The largest fraction in this group are materials for construction purposes, such as limestone, gravel and sand. The specifi c environmental impacts of each tonne of construction mineral extracted are low, but the rapidly growing amounts being used around the globe lead to signifi cant environmental problems. The most important of them are the high CO2 emissions related to the production of cement and the increased loss of fertile land areas due to land sealing and the expansion of built-up areas.
minerals, sealed land and Co2 emissions
0
30,000
60,000
90,000
120,000
0.57 %
0.61 %
1990–2000 2000–2006
Housing, services, recreation
Industrial, commercial units, construction
Transport networks, infrastructures
Mines, quaries, waste dumpsites
80 %
13 %
3 %4 %
0
0.5
1.0
1.5
2.0
2.5
3.0
3.5
4.0
4.5billion tonnes
1980 2008
Australia and OceaniaEuropeLatin America North AmericaAfrica ChinaRest of Asia
Australia and Oceania
North America
Europe
China
Rest of Asia
Latin America
Africa
billion tonnes
0
0.5
1.0
1.5
2.0
2.5
3.0
1980 2008
0
0.2
0.4
0.6
0.8
1.0
1.2billion tonnes
1980 2005
million tonnes
1980 1985 1990 1995 2000 2005 2008 0
500
1,000
1,500
2,000
2,500
Housing, services, recreation
Industrial, commercial units, construction
Transport networks, infrastructures
Mines, quaries, waste dumpsites
80 %
13 %
3 %4 %
0
0.5
1.0
1.5
2.0
2.5
3.0
3.5
4.0
4.5billion tonnes
1980 2008
Australia and OceaniaEuropeLatin America North AmericaAfrica ChinaRest of Asia
Australia and Oceania
North America
Europe
China
Rest of Asia
Latin America
Africa
Consumption of sand and gravel in Europe1980 – 2008
Artifi cial land take in Europe25
( ha/year and % change to initial year)Artifi cial surfaces 200625
( % of total area )
Cement production by continent1980 and 2008
CO2 emissions from cement production by continent1980 and 2005
Limestone extraction by continent1980 and 2008
Limestone is the major ingredient used to produce cement. Around 1.4 tonnes of limestone are required to produce 1 tonne of cement.26 The process of cement production is very energy intensive and thus produces huge amounts of CO2 emissions. Depending on the type, around 400 kilograms of CO2 are emitted for each tonne of cement.
Countries in Asia observed a huge increase in cement production in the past decades. In 2008, almost 75 % of global cement production was located in Asia, with China alone accounting for almost 50 % of world production. Cement production grew by a factor of 22 since 1980, refl ecting the huge demand for construction minerals for building up infrastructure, such as roads and buildings.
In 2005, more than 1 billion tonnes of CO2 emissions were related to cement pro-duction. This is around 4 % of total global CO2 emissions. If the emissions related to fossil fuel use for energy gene ration in the cement production process were also included, the cement industry globally accounts for about 8 % of global CO2 emissions, a fi gure that has doubled since 199027. As CO2 emiss ions are closely correlated with cement pro duction volumes, China also witnessed an exceptionally high growth rate. Signifi cant growth was also observed for other emerging economies, such as India, making Asia by far the biggest producer of cement-related CO2 emissions.
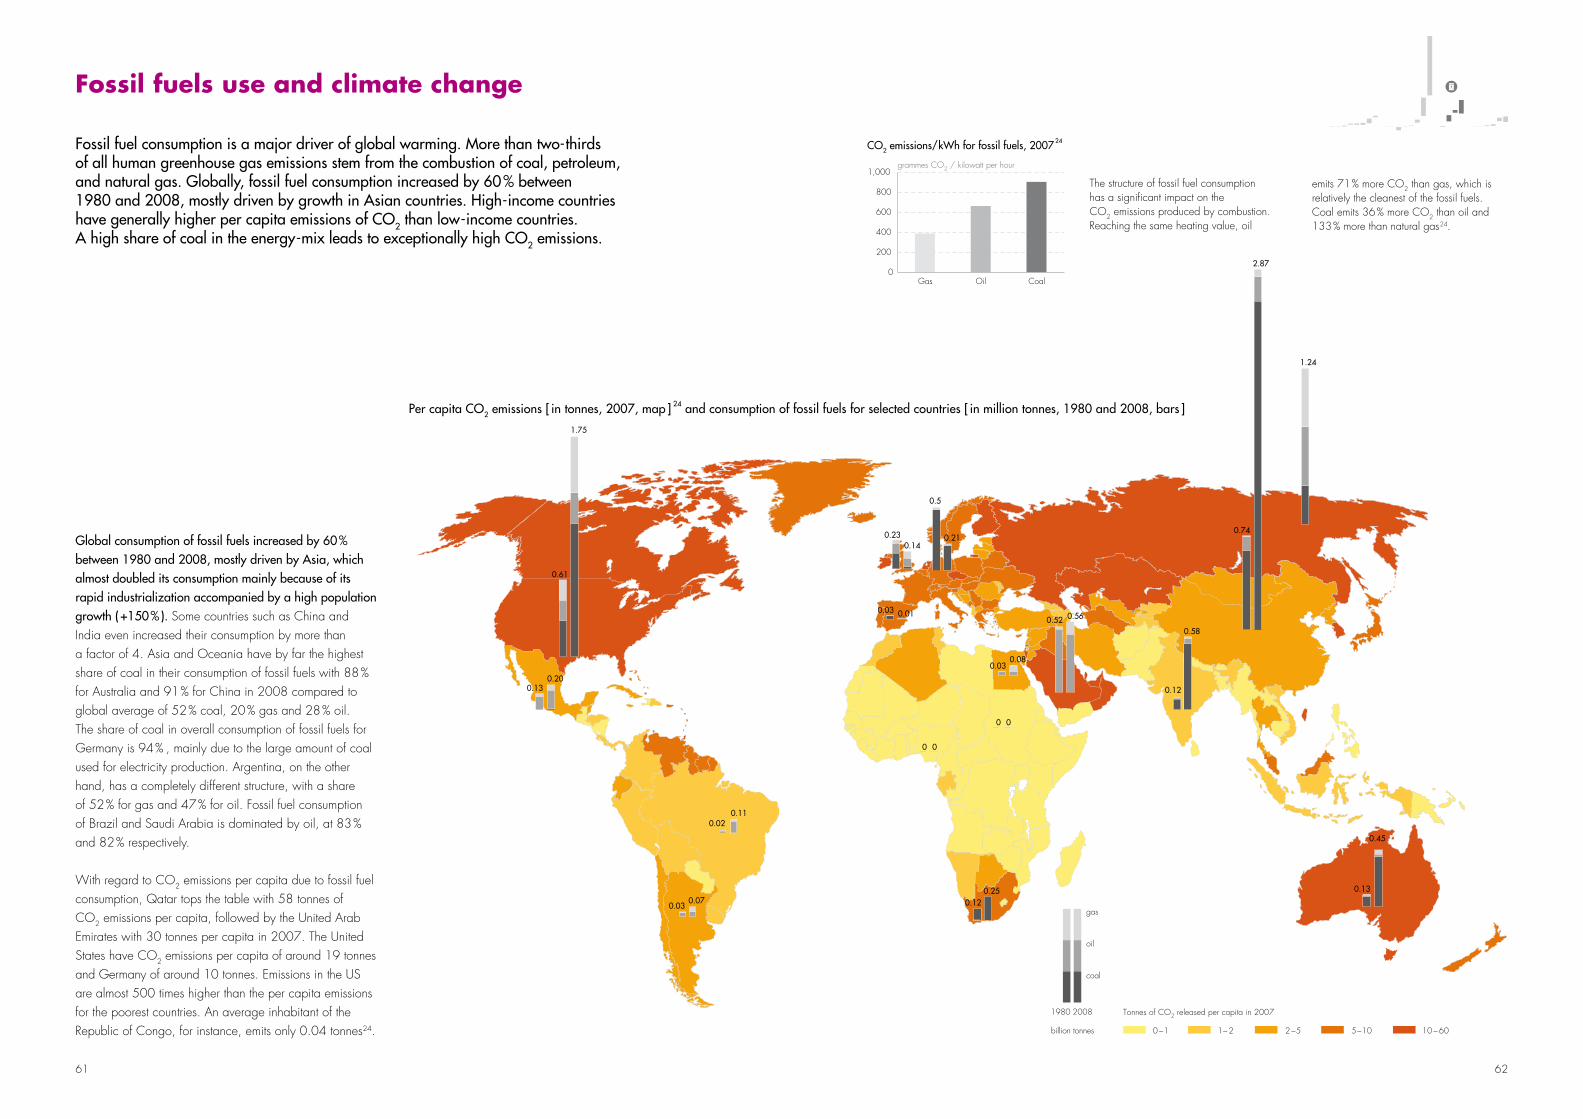
61 62
Fossil fuel consumption is a major driver of global warming. More than two-thirds of all human greenhouse gas emissions stem from the combustion of coal, petroleum, and natural gas. Globally, fossil fuel consumption increased by 60 % between 1980 and 2008, mostly driven by growth in Asian countries. High-income countries have generally higher per capita emissions of CO2 than low-income countries. A high share of coal in the energy-mix leads to exceptionally high CO2 emissions.
Fossil fuels use and climate change
CO2 emissions/kWh for fossil fuels, 200724
The structure of fossil fuel consumption has a significant impact on the CO2 emissions produced by combustion. Reaching the same heating value, oil
emits 71 % more CO2 than gas, which is relatively the cleanest of the fossil fuels. Coal emits 36 % more CO2 than oil and 133 % more than natural gas24.
0.120.25
0 0
0 0
0.13
0.45
0.030.08
0.03 0.01
0.230.14
0.5
0.21
1.24
0.52 0.56
0.12
0.58
0.74
2.87
0.130.20
0.030.07
0.020.11
0.61
1.75
Tonnes of CO2 released per capita in 2007
2 −5 1− 2 0 −1 5−10 10 − 60
1980
billion tonnes
2008
coal
oil
gas
0
200
400
600
800
1,000
Gas Oil Coal
grammes CO2 / kilowatt per hour
Per capita CO2 emissions [ in tonnes, 2007, map ] 24 and consumption of fossil fuels for selected countries [ in million tonnes, 1980 and 2008, bars ]
Global consumption of fossil fuels increased by 60 % between 1980 and 2008, mostly driven by Asia, which almost doubled its consumption mainly because of its rapid industrialization accompanied by a high population growth ( +150 % ). Some countries such as China and India even increased their consumption by more than a factor of 4. Asia and Oceania have by far the highest share of coal in their consumption of fossil fuels with 88 % for Australia and 91 % for China in 2008 compared to global average of 52 % coal, 20 % gas and 28 % oil. The share of coal in overall consumption of fossil fuels for Germany is 94 % , mainly due to the large amount of coal used for electricity production. Argentina, on the other hand, has a completely different structure, with a share of 52 % for gas and 47 % for oil. Fossil fuel consumption of Brazil and Saudi Arabia is dominated by oil, at 83 % and 82 % respectively.
With regard to CO2 emissions per capita due to fossil fuel consumption, Qatar tops the table with 58 tonnes of CO2 emissions per capita, followed by the United Arab Emirates with 30 tonnes per capita in 2007. The United States have CO2 emissions per capita of around 19 tonnes and Germany of around 10 tonnes. Emissions in the US are almost 500 times higher than the per capita emissions for the poorest countries. An average inhabitant of the Republic of Congo, for instance, emits only 0.04 tonnes24.
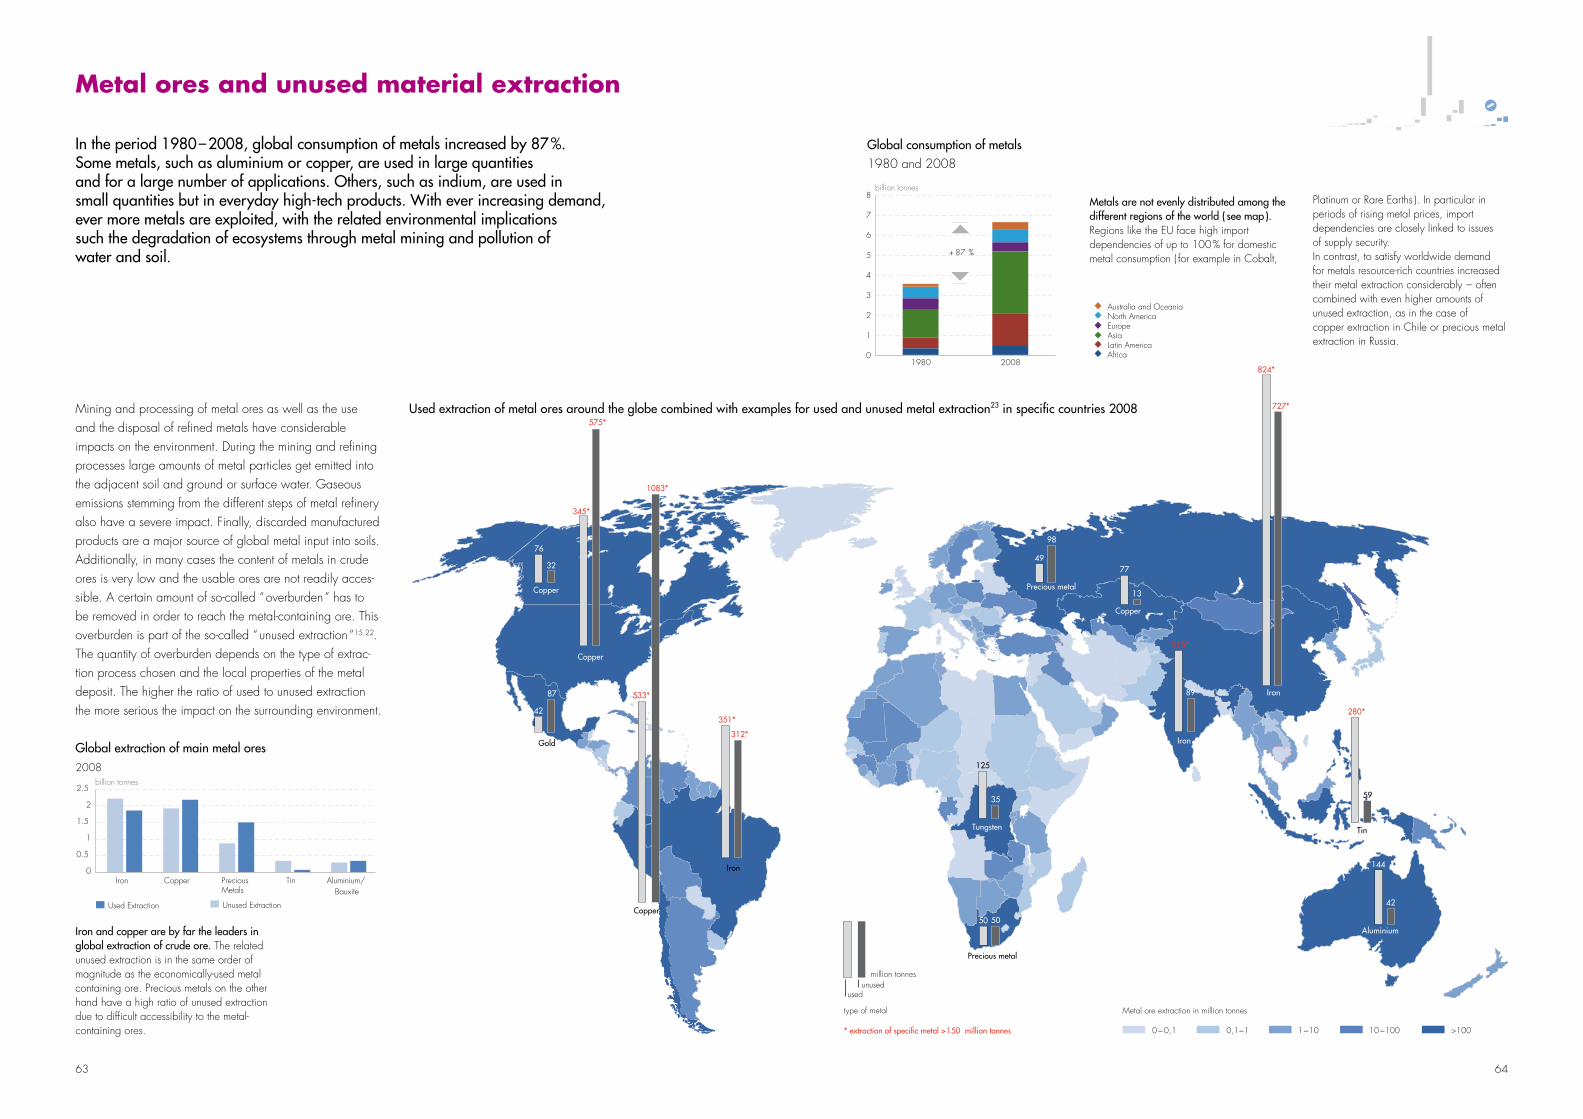
Metal ore extraction in million tonnes
1 −10 0,1−1 0 − 0,1 10 −100 >100
used
* extraction of specific metal > 150 million tonnes
unused
Copper
Gold
Copper
Copper
Iron
Aluminium
Precious metal
Iron
Iron
Tungsten
Precious metal
Copper
Tin
type of metal
million tonnes
50 50
98
49
13
77
89
215*
727*
824*
42
144
59
280*
35
125
32
76
87
42
345*
575*
312*
351*
1083*
533*
63 64
Iron and copper are by far the leaders in global extraction of crude ore. The related unused extraction is in the same order of magnitude as the economically-used metal containing ore. Precious metals on the other hand have a high ratio of unused extrac tion due to difficult accessibility to the metal- containing ores.
Mining and processing of metal ores as well as the use and the disposal of refined metals have considerable impacts on the environment. During the mining and refining processes large amounts of metal particles get emitted into the adjacent soil and ground or surface water. Gaseous emissions stemming from the different steps of metal refinery also have a severe impact. Finally, discarded manufactured products are a major source of global metal input into soils. Additionally, in many cases the content of metals in crude ores is very low and the usable ores are not readily acces-sible. A certain amount of so-called “ overburden ” has to be removed in order to reach the metal-containing ore. This overburden is part of the so-called “ unused extraction ”15,22. The quantity of overburden depends on the type of extrac-tion process chosen and the local properties of the metal deposit. The higher the ratio of used to unused extraction the more serious the impact on the surrounding environment.
In the period 1980 – 2008, global consumption of metals increased by 87 %. Some metals, such as aluminium or copper, are used in large quantities and for a large number of applications. Others, such as indium, are used in small quantities but in everyday high-tech products. With ever increasing demand, ever more metals are exploited, with the related environmental implications such the degradation of ecosystems through metal mining and pollution of water and soil.
metal ores and unused material extraction
Metals are not evenly distributed among the different regions of the world ( see map ). Regions like the EU face high import dependencies of up to 100 % for domestic metal consumption ( for example in Cobalt,
Platinum or Rare Earths ). In particular in periods of rising metal prices, import de pendencies are closely linked to issues of supply security. In contrast, to satisfy worldwide demand for metals resource-rich countries increased their metal extraction considerably – often combined with even higher amounts of un used extraction, as in the case of copper extraction in Chile or precious metal extraction in Russia.
1980 2008
+ 87 %
0
1
2
3
4
5
6
7
8 billion tonnes
Australia and OceaniaNorth AmericaEuropeAsiaLatin AmericaAfrica
1980 2008
+ 87 %
0
1
2
3
4
5
6
7
8 billion tonnes
Australia and OceaniaNorth AmericaEuropeAsiaLatin AmericaAfrica
Global extraction of main metal ores 2008
Global consumption of metals 1980 and 2008
Used extraction of metal ores around the globe combined with examples for used and unused metal extraction23 in specific countries 2008
0
0.5
1
1.5
2
2.5
Iron Copper Precious Metals
Tin Aluminium/ Bauxite
billion tonnes
Used Extraction Unused Extraction
65
XXX
66
XXX
Conclusions and outlook
Business as usual: not an option for the future ___________________ 66
Setting a target ___________________________________________ 68
Green economies for sustainable resource use __________________ 70
5
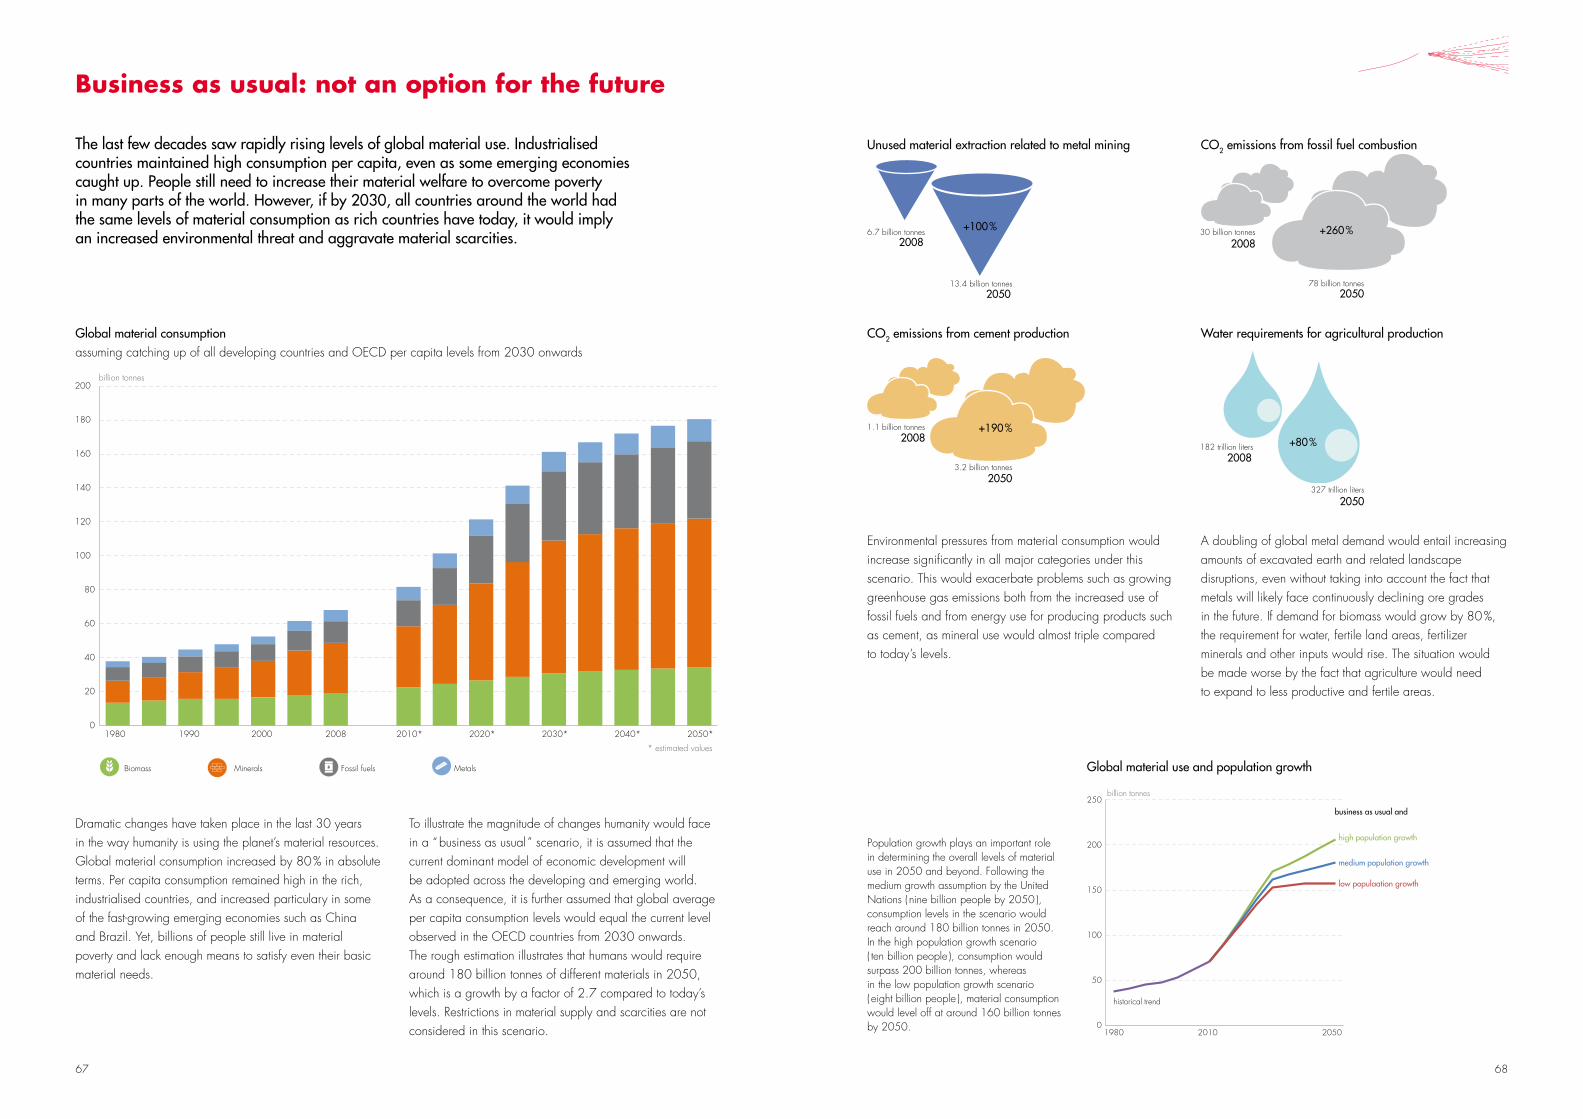
67 68
To illustrate the magnitude of changes humanity would face in a “ business as usual ” scenario, it is assumed that the current dominant model of economic development will be adopted across the developing and emerging world. As a consequence, it is further assumed that global average per capita consumption levels would equal the current level observed in the OECD countries from 2030 onwards. The rough estimation illustrates that humans would require around 180 billion tonnes of different materials in 2050, which is a growth by a factor of 2.7 compared to today’s levels. Restrictions in material supply and scarcities are not considered in this scenario.
Dramatic changes have taken place in the last 30 years in the way humanity is using the planet’s material resources. Global material consumption increased by 80 % in absolute terms. Per capita consumption remained high in the rich, industrialised countries, and increased particulary in some of the fast-growing emerging economies such as China and Brazil. Yet, billions of people still live in material poverty and lack enough means to satisfy even their basic material needs.
The last few decades saw rapidly rising levels of global material use. Industrialised countries maintained high consumption per capita, even as some emerging economies caught up. People still need to increase their material welfare to overcome poverty in many parts of the world. However, if by 2030, all countries around the world had the same levels of material consumption as rich countries have today, it would imply an increased environmental threat and aggravate material scarcities.
Business as usual: not an option for the future
A doubling of global metal demand would entail increasing amounts of excavated earth and related landscape disruptions, even without taking into account the fact that metals will likely face continuously declining ore grades in the future. If demand for biomass would grow by 80 %, the requirement for water, fertile land areas, fertilizer minerals and other inputs would rise. The situation would be made worse by the fact that agriculture would need to expand to less productive and fertile areas.
Environmental pressures from material consumption would increase significantly in all major categories under this scenario. This would exacerbate problems such as growing greenhouse gas emissions both from the increased use of fossil fuels and from energy use for producing products such as cement, as mineral use would almost triple compared to today’s levels.
Population growth plays an important role in determining the overall levels of material use in 2050 and beyond. Following the medium growth assumption by the United Nations ( nine billion people by 2050 ), consumption levels in the scenario would reach around 180 billion tonnes in 2050. In the high population growth scenario ( ten billion people ), consumption would surpass 200 billion tonnes, whereas in the low population growth scenario ( eight billion people ), material consumption would level off at around 160 billion tonnes by 2050.
0
20
40
60
80
100
120
140
160
180
200
1980 1990 2000 2008 2010* 2020* 2030* 2040* 2050*
* estimated values
billion tonnes
1980 2010 2050
billion tonnes
0
50
100
150
200
250
high population growth
medium population growth
low populaation growth
historical trend
business as usual and
Biomass Minerals Fossil fuels Metals Global material use and population growth
Global material consumption assuming catching up of all developing countries and OECD per capita levels from 2030 onwards
2008
2050
Unused material extraction related to metal mining CO2 emissions from fossil fuel combustion
CO2 emissions from cement production Water requirements for agricultural production
1.1 billion tonnes
3.2 billion tonnes
182 trillion liters
327 trillion liters
30 billion tonnes
78 billion tonnes
6.7 billion tonnes
13.4 billion tonnes
+100 % +260 %
+80 %+190 %
2008
2050
2008
2050
2008
2050
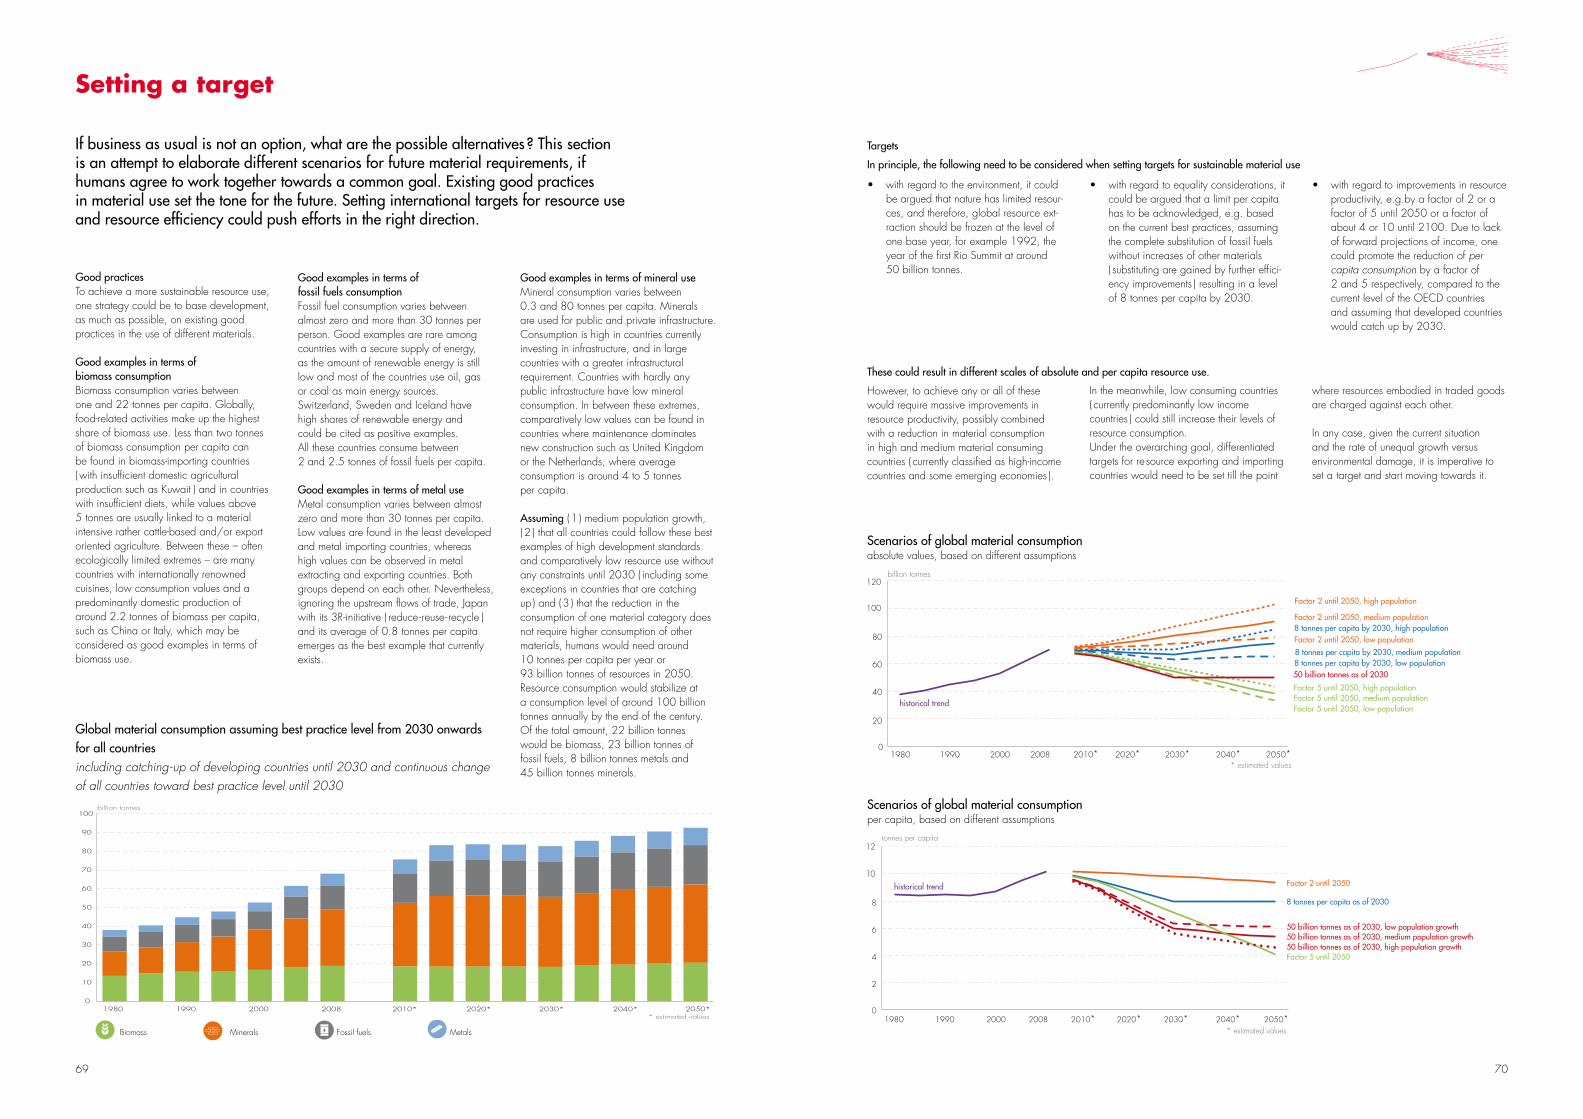
69 70
If business as usual is not an option, what are the possible alternatives ? This section is an attempt to elaborate different scenarios for future material requirements, if humans agree to work together towards a common goal. Existing good practices in material use set the tone for the future. Setting inter national targets for resource use and resource efficiency could push efforts in the right direction.
setting a target
Good practicesTo achieve a more sustainable resource use, one strategy could be to base development, as much as possible, on existing good practices in the use of different materials.
Good examples in terms of biomass consumption Biomass consumption varies between one and 22 tonnes per capita. Globally, food-related activities make up the highest share of biomass use. Less than two tonnes of bio mass consumption per capita can be found in biomass-importing countries ( with insufficient domestic agricultural production such as Kuwait ) and in countries with insufficient diets, while values above 5 tonnes are usually linked to a material intensive rather cattle-based and/or export oriented agriculture. Between these – often ecologically limited extremes – are many countries with internationally renowned cuisines, low consumption values and a predominantly domestic production of around 2.2 tonnes of biomass per capita, such as China or Italy, which may be considered as good examples in terms of biomass use.
with regard to the environment, it could •be argued that nature has limited resour-ces, and therefore, global resource ext-raction should be frozen at the level of one base year, for example 1992, the year of the first Rio Summit at around 50 billion tonnes.
Good examples in terms of fossil fuels consumption Fossil fuel consumption varies between almost zero and more than 30 tonnes per person. Good examples are rare among countries with a secure supply of energy, as the amount of renewable energy is still low and most of the countries use oil, gas or coal as main energy sources. Switzerland, Sweden and Iceland have high shares of renewable energy and could be cited as positive examples. All these countries consume between 2 and 2.5 tonnes of fossil fuels per capita.
Good examples in terms of metal use Metal consumption varies between almost zero and more than 30 tonnes per capita. Low values are found in the least developed and metal importing countries, whereas high values can be observed in metal extracting and exporting countries. Both groups depend on each other. Nevertheless, ignoring the upstream flows of trade, Japan with its 3R-initiative ( reduce-reuse-recycle ) and its average of 0.8 tonnes per capita emerges as the best example that currently exists.
Good examples in terms of mineral useMineral consumption varies between 0.3 and 80 tonnes per capita. Minerals are used for public and private infrastructure. Consumption is high in countries currently investing in infrastructure, and in large countries with a greater infrastructural requirement. Countries with hardly any public infrastructure have low mineral consumption. In between these extremes, comparatively low values can be found in countries where maintenance dominates new construction such as United Kingdom or the Netherlands, where average consumption is around 4 to 5 tonnes per capita.
Assuming ( 1 ) medium population growth, ( 2 ) that all countries could follow these best examples of high development standards and comparatively low resource use without any constraints until 2030 ( including some exceptions in coun tries that are catching up ) and ( 3 ) that the reduction in the consumption of one material category does not require higher consumption of other materials, humans would need around 10 tonnes per capita per year or 93 billion tonnes of resources in 2050. Resource consumption would stabilize at a consumption level of around 100 billion tonnes annually by the end of the century. Of the total amount, 22 billion tonnes would be biomass, 23 billion tonnes of fossil fuels, 8 billion tonnes metals and 45 billion tonnes minerals.
However, to achieve any or all of these would require massive improvements in resource productivity, possibly com bined with a reduction in material consumption in high and medium material consuming countries ( currently classified as high-income countries and some emerging economies ).
with regard to equality considerations, it •could be argued that a limit per capita has to be acknowledged, e.g. based on the current best practices, assuming the complete substitution of fossil fuels without increases of other materials ( substituting are gained by further effici-ency improvements ) resulting in a level of 8 tonnes per capita by 2030.
with regard to improvements in resource •productivity, e.g.by a factor of 2 or a factor of 5 until 2050 or a factor of about 4 or 10 until 2100. Due to lack of forward projections of income, one could promote the reduction of per capita consumption by a factor of 2 and 5 respectively, compared to the current level of the OECD countries and assuming that developed countries would catch up by 2030.
In the meanwhile, low consuming countries ( currently predominantly low income countries ) could still increase their levels of resource consumption. Under the overarching goal, differentiated targets for re source exporting and importing countries would need to be set till the point
where resources embodied in traded goods are charged against each other.
In any case, given the current situation and the rate of unequal growth versus environmental damage, it is imperative to set a target and start moving towards it.
Targets
In principle, the following need to be considered when setting targets for sustainable material use
These could result in different scales of absolute and per capita resource use.
Biomass Minerals Fossil fuels Metals
Factor 2 until 2050, high population
Factor 2 until 2050, medium population8 tonnes per capita by 2030, high population
0
20
40
60
80
100
120
1980 1990 2000 2008 2010* 2020* 2030* 2040* 2050** estimated values
Factor 2 until 2050, low population8 tonnes per capita by 2030, medium population8 tonnes per capita by 2030, low population50 billion tonnes as of 2030
Factor 5 until 2050, high populationFactor 5 until 2050, medium populationFactor 5 until 2050, low population
billion tonnes
historical trend
0
10
20
30
40
50
60
70
80
90
100
1980 1990 2000 2008 2010* 2020* 2030* 2040* 2050*
billion tonnes
* estimated values
0
2
4
6
8
10
12
1980 1990 2000 2008 2010* 2020* 2030*
2040*
2050*
tonnes per capita
* estimated values
Factor 2 until 2050
8 tonnes per capita as of 2030
50 billion tonnes as of 2030, low population growth50 billion tonnes as of 2030, medium population growth
Factor 5 until 205050 billion tonnes as of 2030, high population growth
historical trend
Global material consumption assuming best practice level from 2030 onwards for all countries including catching-up of developing countries until 2030 and continuous change of all countries toward best practice level until 2030
Scenarios of global material consumption absolute values, based on different assumptions
Scenarios of global material consumption per capita, based on different assumptions
71 72
The potential of green economies
A key component of green economic strategies is improved resource management. Green economies thus have to improve resource productivity and reduce absolute levels of resource use. Such a transition could be achieved through concerted action by policy makers, setting the framework for increased resource efficiency, by companies exploiting the economic and environmental potentials of increased resource efficiency and by consumers making informed and active choices for resource efficient products and services. A few examples for such effective measures include:
a transition towards more sustainable • energy production by substantially increasing investments in renewable energy sources for power generation, while considering limits e.g. related to increased biomass use and environmental impacts;a transition in • manufacturing industries towards closed material cycles and improvements in resource efficiency and productivity;a transition towards eco-friendly housing by constructing •new green buildings and retrofitting the existing energy and material intensive buildings stock, anda transformation of the • transport sector by promoting access instead of mobility, shifting to less harmful modes of transportation, and lowering carbon emissions by improving vehicles.
Key findings from this study
In general global dynamics during the past thirty years have shown that economic growth entailed increased material extraction and consumption. Although most countries made improvements in material productivity, the current amount of used materials and the continued unequal distribution of consumption between different world regions is far from being sustainable.
Some current trends are extremely alarming. The development process itself and the perpetuation of highly material-intensive life-styles in rich countries and in an increasing number of emerging economies require large amounts of resources. The quantities are so huge that this model of development cannot realistically be provided for all humans.
Many countries with a relatively higher performance of material use and resource productivity achieved this by outsourcing their material-intensive economic activities. Those countries which increased their activities in material-intensive economic sectors had a worse performance. Nevertheless, both developments are two sides of the same coin in the interlinked system of international specialisation. From those findings arises the question “ What are the options that the green economy concept can provide ? ”
Green economies for sustainable resource use
Reducing our resource use, improving our quality of life
Independently of how those important questions are being addressed, two basic facts need to be taken into account when global strategies towards sustainable resource use are being discussed.
First, the current level of global resource use is not sustain able. The significant growth of resource extraction, trade and consumption is the main driver for most global environ mental problems. At least with regard to some environmental impacts, humanity already exceeds the ecological capacity of the Earth’s ecosystems. Climate change is the most prominent example, but biodiversity loss, desertifi cation and soil erosion are also clearly linked to our use of natural resources. A sustainable system of global resource use must therefore operate on a level significantly below the current one; we need to reduce our resource consumption in absolute terms.
At the same time, billions of people on the planet are still living in material poverty and rightly demand a substantial increase of their consumption and material welfare. A stra tegy of reducing global resource use therefore needs to fully address distributional aspects, both between different countries and regions and – to a growing extent – also with in countries. Ultimately, the objective is to ensure a high quality of life for all people while keeping resource use within the ecological limits of our planet.
Some fundamental questions
Based on the information presented in this study on green economies and its potential to increase resource efficiency and decrease the amounts of materials required for produc-tion for production and consumption processes around the world, the fundamental questions humanity will face in the future are:
Is the current model of material intensive lifestyles •desirable as a future vision ? And if not, what is an attractive and sustainable alternative ?
Are we willing to implement a limited and equal •distri bu tion of material consumption globally ? If yes, at what level ? The current OECD-level, which would mean accepting a doub ling of environmental pressures ? The current global average, accepting global distribu-tion and current levels of ecological pressure ? A level oriented on current best practices or maybe less ? If one of these options seems to be favourable, what kind of incentives and sanctions would humanity accept to enforce them ?
If an equal distribution is not worthwhile, what would •be an alternative approach to reach a globally sustain able level of resource use ? Should inequalities of more than a factor of 50, as we observe currently, be maintained or would a minimum or maximum level of material consumption for each person be more attractive ? What level of inequality could be acceptable in terms of global social justice ?

73
XXX
74
XXX
Methodology and main data sources _________________________ 74
Key indicators ____________________________________________ 76
References _______________________________________________ 80
Annex
75 76
The global database on material extraction is based on international statistics including the International Energy Agency ( for fossil fuels ), the UN FAO ( for biomass ) and the US and British Geological Surveys ( for metals and industrial minerals ). This database is accessible in an aggregated form on the webpage www.materialflows.net, where a detailed technical report can be downloaded ( see below ). Data quality varies for the different types of materials. It is generally good for the extraction of fossil fuels and metal ores. However, in the case of a number of metals, estimations have to be applied regarding the concentration of metals in crude ore extraction. It can be assumed that parts of the biomass extraction for subsistence purposes are not covered in official statistics, so biomass values might be underestimated, particularly for poor countries. It is important to note that statistics about mineral use are poor in nearly all investigated countries. Thus, for the estimation of the extraction of construction minerals an estimation method was used, where the physical production of cement and bitumen was used to estimate overall levels of extracted construction minerals, in particular limestone, sand and gravel. Where no reliable data on cement and bitumen production was available the estimations were carried out using per capita income as proxy, assuming that demand for construction minerals per capita increases when countries become richer. The exact amounts of mineral extraction may therefore be over- or underestimated in some of the countries.
This study is based on the methodological framework of material flow accounting and analysis ( MFA ). MFA builds on earlier concepts of material and energy balancing, as introduced in the 1970s. The MFA concept was developed as a reaction to the fact that many environmental problems result from a high material and energy consumption and related negative environmental consequences are determi-ned by the overall scale of industrial metabolism rather than toxicities of specific substances. Today, the MFA methodology is internationally standardised, and methodological handbooks are available, for example from the European Statistical Office ( EUROSTAT, 2011 ) and the OECD ( 2007 ). For MFA on the national level, two main boundaries for resource flows can be defined. The first is the boundary between the economy and the domestic natural environment from which raw materials are extracted. The second is the frontier with other economies with imports and exports as accounted flows.
The data and indicators presented in this study build on the integration of two existing data bases: ( 1 ) the global database on resource extraction developed and maintained by SERI, and ( 2 ) the global database on resource trade developed and maintained by M. Dittrich.
methodology and main data sources
For this study, both databases have been combined. In the first step the combination has been used to detect further outliers and unreliable data for all countries and years on different levels of aggregation. Main criteria applied were net exports of materials being higher than extraction for several years and consumption per capita being extraordinary higher or lower than the average range during that years or compared to other years. In a second step both databases were fully integrated in order to calculate the various material flow indicators.
Global data on material extraction, trade, consumption and productivity used in this study can be downloaded at an aggregated level from www.materialflows.net.Material productivity was calculated using GDP in purchasing power parities and constant terms derived from the World Bank ( 2011 ). Population data are also used as provided by the World Bank ( 2011 ).
The global database on resource trade was developed by Monika Dittrich at the University of Cologne and the Wuppertal Institute in Germany. It is based on UN Comtrade data and includes global accounts of imports and exports in physical ( mass ) units. All missing mass values in UN Comtrade were filled using the global annual price for each commodity group, starting at the most differentiated level, then summed up according to the classification structure and repeated at the next higher differentiation level up to the total sum. Values of direct trade flows of major outliers were corrected by adjusting the concerned values with regard to global prices, amount of global imports and exports and – as far as available – bilateral trade data as well as with regard to national and international sector statistics such as FAO or IEA. A detailed methodological description is given by Dittrich ( 2010 ) and Dittrich and Bringezu ( 2010 ). In order to calculate aggregates on regional and global level, lacking original trade data reports of countries were estimated using as far as possible and available extrapolation, bilateral data of trade partners and/or further sectoral, national and international trade statistics.In general, UN Comtrade trade statistics for the majority of OECD and Latin American countries are good with respect to differentiation and reliability while the others are of mixed quality. In general, trade statistics after 1995 are more differentiated and complete than before.
EUROSTAT. 2001. Economy-wide material flow accounts and derived indicators. A methodological guide. Luxembourg: Statistical Office of the European Union.
EUROSTAT. 2011. Economy-wide Material Flow Accounts ( EW-MFA ) – Compilation Guidelines for EUROSTAT´s 2011 EW-MFA questionnaire. ENV/MFA/06 ( 2007 ). Luxembourg: EUROSTAT.
OECD. 2007. Measuring material flows and resource productivity. The OECD guide ENV/EPOC/SE ( 2006 )1/REV3. Paris: ( OECD ) Organisation for Economic Cooperation and Development.
SERI. 2011. Technical Report on the compilation of the material flow database for www.materialflows.net. Vienna: (SERI) Sustainable Europe Research Institute
Dittrich, M. 2010. Physische Handelsbilanzen. Verlagert der Norden Umweltbelastungen in den Süden ? Kölner Geographische Arbeiten, 91. Köln.
Dittrich, M. and S. Bringezu. 2010. The physical dimension of international trade. Part I: Direct global flows between 1962 and 2005. Ecological Economics 69: 1838 –1847.
Sustainable Europe Research Institute ( SERI ) in cooperation with Wuppertal Institute and Monika Dittrich: Global Material Flows Database, 1980 – 2008. Available at http://www.materialflows.net/
Worldbank. http://databank.worldbank.org/
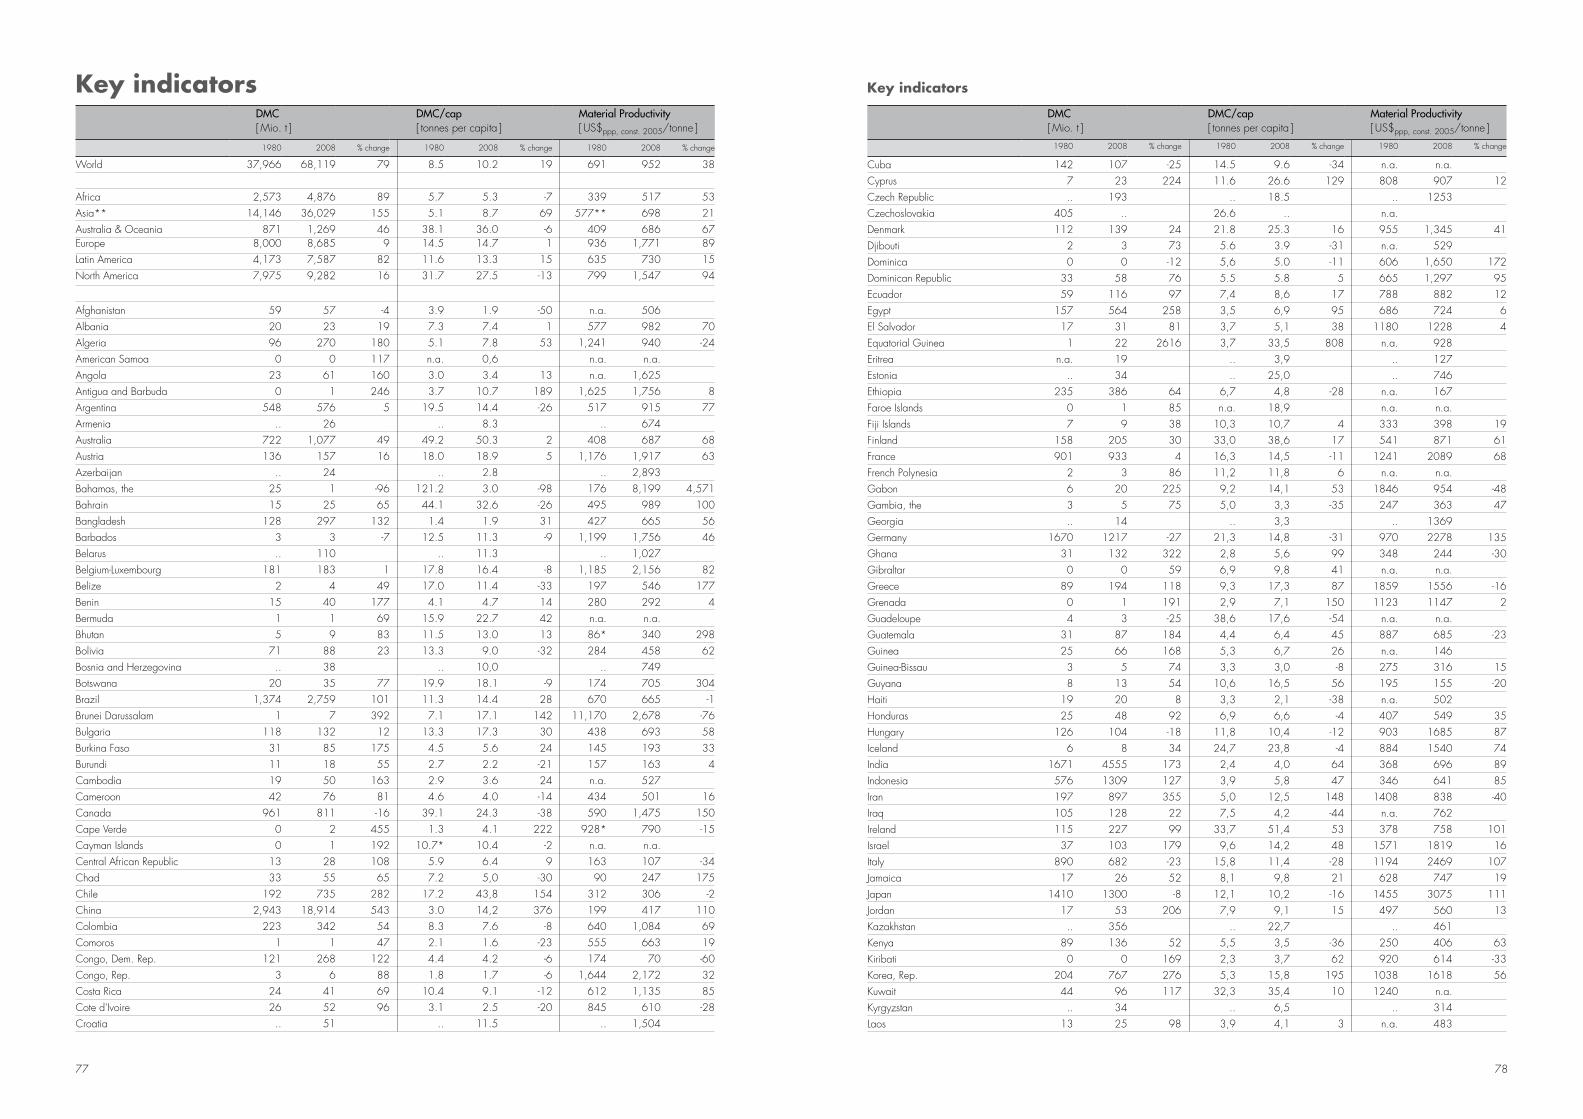
77 78
Key indicatorsDMC[ Mio. t ]
DMC/cap[ tonnes per capita ]
Material Productivity[ US$ppp, const. 2005/tonne ]
1980 2008 % change 1980 2008 % change 1980 2008 % change
World 37,966 68,119 79 8.5 10.2 19 691 952 38
Africa 2,573 4,876 89 5.7 5.3 -7 339 517 53Asia** 14,146 36,029 155 5.1 8.7 69 577** 698 21Australia & Oceania 871 1,269 46 38.1 36.0 -6 409 686 67Europe 8,000 8,685 9 14.5 14.7 1 936 1,771 89Latin America 4,173 7,587 82 11.6 13.3 15 635 730 15North America 7,975 9,282 16 31.7 27.5 -13 799 1,547 94
Afghanistan 59 57 -4 3.9 1.9 -50 n.a. 506Albania 20 23 19 7.3 7.4 1 577 982 70Algeria 96 270 180 5.1 7.8 53 1,241 940 -24American Samoa 0 0 117 n.a. 0,6 n.a. n.a.Angola 23 61 160 3.0 3.4 13 n.a. 1,625Antigua and Barbuda 0 1 246 3.7 10.7 189 1,625 1,756 8Argentina 548 576 5 19.5 14.4 -26 517 915 77Armenia .. 26 .. 8.3 .. 674Australia 722 1,077 49 49.2 50.3 2 408 687 68Austria 136 157 16 18.0 18.9 5 1,176 1,917 63Azerbaijan .. 24 .. 2.8 .. 2,893Bahamas, the 25 1 -96 121.2 3.0 -98 176 8,199 4,571Bahrain 15 25 65 44.1 32.6 -26 495 989 100Bangladesh 128 297 132 1.4 1.9 31 427 665 56Barbados 3 3 -7 12.5 11.3 -9 1,199 1,756 46Belarus .. 110 .. 11.3 .. 1,027Belgium-Luxembourg 181 183 1 17.8 16.4 -8 1,185 2,156 82Belize 2 4 49 17.0 11.4 -33 197 546 177Benin 15 40 177 4.1 4.7 14 280 292 4Bermuda 1 1 69 15.9 22.7 42 n.a. n.a.Bhutan 5 9 83 11.5 13.0 13 86* 340 298Bolivia 71 88 23 13.3 9.0 -32 284 458 62Bosnia and Herzegovina .. 38 .. 10,0 .. 749Botswana 20 35 77 19.9 18.1 -9 174 705 304Brazil 1,374 2,759 101 11.3 14.4 28 670 665 -1Brunei Darussalam 1 7 392 7.1 17.1 142 11,170 2,678 -76Bulgaria 118 132 12 13.3 17.3 30 438 693 58Burkina Faso 31 85 175 4.5 5.6 24 145 193 33Burundi 11 18 55 2.7 2.2 -21 157 163 4Cambodia 19 50 163 2.9 3.6 24 n.a. 527Cameroon 42 76 81 4.6 4.0 -14 434 501 16Canada 961 811 -16 39.1 24.3 -38 590 1,475 150Cape Verde 0 2 455 1.3 4.1 222 928* 790 -15Cayman Islands 0 1 192 10.7* 10.4 -2 n.a. n.a.Central African Republic 13 28 108 5.9 6.4 9 163 107 -34Chad 33 55 65 7.2 5,0 -30 90 247 175Chile 192 735 282 17.2 43,8 154 312 306 -2China 2,943 18,914 543 3.0 14,2 376 199 417 110Colombia 223 342 54 8.3 7.6 -8 640 1,084 69Comoros 1 1 47 2.1 1.6 -23 555 663 19Congo, Dem. Rep. 121 268 122 4.4 4.2 -6 174 70 -60Congo, Rep. 3 6 88 1.8 1.7 -6 1,644 2,172 32Costa Rica 24 41 69 10.4 9.1 -12 612 1,135 85Cote d'Ivoire 26 52 96 3.1 2.5 -20 845 610 -28Croatia .. 51 .. 11.5 .. 1,504
DMC[ Mio. t ]
DMC/cap[ tonnes per capita ]
Material Productivity[ US$ppp, const. 2005/tonne ]
1980 2008 % change 1980 2008 % change 1980 2008 % change
Cuba 142 107 -25 14.5 9.6 -34 n.a. n.a.Cyprus 7 23 224 11.6 26.6 129 808 907 12Czech Republic .. 193 .. 18.5 .. 1253Czechoslovakia 405 .. 26.6 .. n.a.Denmark 112 139 24 21.8 25.3 16 955 1,345 41Djibouti 2 3 73 5.6 3.9 -31 n.a. 529Dominica 0 0 -12 5,6 5.0 -11 606 1,650 172Dominican Republic 33 58 76 5.5 5.8 5 665 1,297 95Ecuador 59 116 97 7,4 8,6 17 788 882 12Egypt 157 564 258 3,5 6,9 95 686 724 6El Salvador 17 31 81 3,7 5,1 38 1180 1228 4Equatorial Guinea 1 22 2616 3,7 33,5 808 n.a. 928Eritrea n.a. 19 .. 3,9 .. 127Estonia .. 34 .. 25,0 .. 746Ethiopia 235 386 64 6,7 4,8 -28 n.a. 167Faroe Islands 0 1 85 n.a. 18,9 n.a. n.a.Fiji Islands 7 9 38 10,3 10,7 4 333 398 19Finland 158 205 30 33,0 38,6 17 541 871 61France 901 933 4 16,3 14,5 -11 1241 2089 68French Polynesia 2 3 86 11,2 11,8 6 n.a. n.a.Gabon 6 20 225 9,2 14,1 53 1846 954 -48Gambia, the 3 5 75 5,0 3,3 -35 247 363 47Georgia .. 14 .. 3,3 .. 1369Germany 1670 1217 -27 21,3 14,8 -31 970 2278 135Ghana 31 132 322 2,8 5,6 99 348 244 -30Gibraltar 0 0 59 6,9 9,8 41 n.a. n.a.Greece 89 194 118 9,3 17,3 87 1859 1556 -16Grenada 0 1 191 2,9 7,1 150 1123 1147 2Guadeloupe 4 3 -25 38,6 17,6 -54 n.a. n.a.Guatemala 31 87 184 4,4 6,4 45 887 685 -23Guinea 25 66 168 5,3 6,7 26 n.a. 146Guinea-Bissau 3 5 74 3,3 3,0 -8 275 316 15Guyana 8 13 54 10,6 16,5 56 195 155 -20Haiti 19 20 8 3,3 2,1 -38 n.a. 502Honduras 25 48 92 6,9 6,6 -4 407 549 35Hungary 126 104 -18 11,8 10,4 -12 903 1685 87Iceland 6 8 34 24,7 23,8 -4 884 1540 74India 1671 4555 173 2,4 4,0 64 368 696 89Indonesia 576 1309 127 3,9 5,8 47 346 641 85Iran 197 897 355 5,0 12,5 148 1408 838 -40Iraq 105 128 22 7,5 4,2 -44 n.a. 762Ireland 115 227 99 33,7 51,4 53 378 758 101Israel 37 103 179 9,6 14,2 48 1571 1819 16Italy 890 682 -23 15,8 11,4 -28 1194 2469 107Jamaica 17 26 52 8,1 9,8 21 628 747 19Japan 1410 1300 -8 12,1 10,2 -16 1455 3075 111Jordan 17 53 206 7,9 9,1 15 497 560 13Kazakhstan .. 356 .. 22,7 .. 461Kenya 89 136 52 5,5 3,5 -36 250 406 63Kiribati 0 0 169 2,3 3,7 62 920 614 -33Korea, Rep. 204 767 276 5,3 15,8 195 1038 1618 56Kuwait 44 96 117 32,3 35,4 10 1240 n.a.Kyrgyzstan .. 34 .. 6,5 .. 314Laos 13 25 98 3,9 4,1 3 n.a. 483
Key indicators
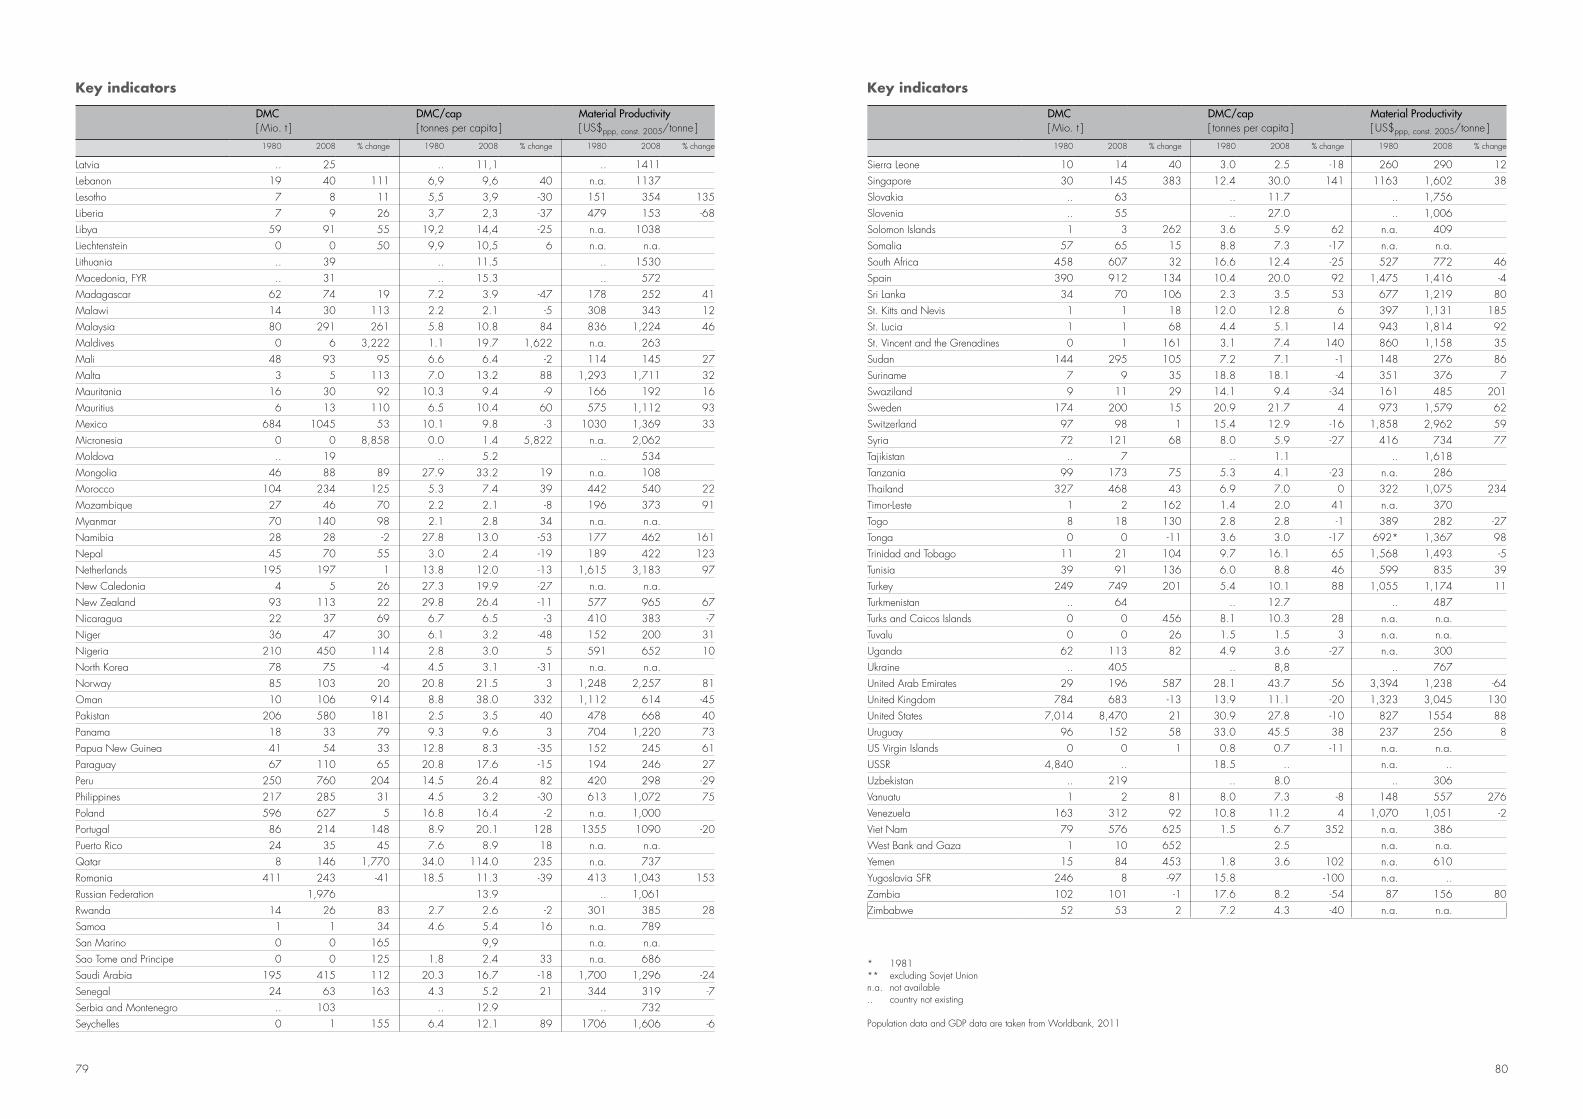
79 80
DMC[ Mio. t ]
DMC/cap[ tonnes per capita ]
Material Productivity[ US$ppp, const. 2005/tonne ]
1980 2008 % change 1980 2008 % change 1980 2008 % change
Latvia .. 25 .. 11,1 .. 1411Lebanon 19 40 111 6,9 9,6 40 n.a. 1137Lesotho 7 8 11 5,5 3,9 -30 151 354 135Liberia 7 9 26 3,7 2,3 -37 479 153 -68Libya 59 91 55 19,2 14,4 -25 n.a. 1038Liechtenstein 0 0 50 9,9 10,5 6 n.a. n.a.Lithuania .. 39 .. 11.5 .. 1530Macedonia, FYR .. 31 .. 15.3 .. 572Madagascar 62 74 19 7.2 3.9 -47 178 252 41Malawi 14 30 113 2.2 2.1 -5 308 343 12Malaysia 80 291 261 5.8 10.8 84 836 1,224 46Maldives 0 6 3,222 1.1 19.7 1,622 n.a. 263Mali 48 93 95 6.6 6.4 -2 114 145 27Malta 3 5 113 7.0 13.2 88 1,293 1,711 32Mauritania 16 30 92 10.3 9.4 -9 166 192 16Mauritius 6 13 110 6.5 10.4 60 575 1,112 93Mexico 684 1045 53 10.1 9.8 -3 1030 1,369 33Micronesia 0 0 8,858 0.0 1.4 5,822 n.a. 2,062Moldova .. 19 .. 5.2 .. 534Mongolia 46 88 89 27.9 33.2 19 n.a. 108Morocco 104 234 125 5.3 7.4 39 442 540 22Mozambique 27 46 70 2.2 2.1 -8 196 373 91Myanmar 70 140 98 2.1 2.8 34 n.a. n.a.Namibia 28 28 -2 27.8 13.0 -53 177 462 161Nepal 45 70 55 3.0 2.4 -19 189 422 123Netherlands 195 197 1 13.8 12.0 -13 1,615 3,183 97New Caledonia 4 5 26 27.3 19.9 -27 n.a. n.a.New Zealand 93 113 22 29.8 26.4 -11 577 965 67Nicaragua 22 37 69 6.7 6.5 -3 410 383 -7Niger 36 47 30 6.1 3.2 -48 152 200 31Nigeria 210 450 114 2.8 3.0 5 591 652 10North Korea 78 75 -4 4.5 3.1 -31 n.a. n.a.Norway 85 103 20 20.8 21.5 3 1,248 2,257 81Oman 10 106 914 8.8 38.0 332 1,112 614 -45Pakistan 206 580 181 2.5 3.5 40 478 668 40Panama 18 33 79 9.3 9.6 3 704 1,220 73Papua New Guinea 41 54 33 12.8 8.3 -35 152 245 61Paraguay 67 110 65 20.8 17.6 -15 194 246 27Peru 250 760 204 14.5 26.4 82 420 298 -29Philippines 217 285 31 4.5 3.2 -30 613 1,072 75Poland 596 627 5 16.8 16.4 -2 n.a. 1,000Portugal 86 214 148 8.9 20.1 128 1355 1090 -20Puerto Rico 24 35 45 7.6 8.9 18 n.a. n.a.Qatar 8 146 1,770 34.0 114.0 235 n.a. 737Romania 411 243 -41 18.5 11.3 -39 413 1,043 153Russian Federation 1,976 13.9 .. 1,061Rwanda 14 26 83 2.7 2.6 -2 301 385 28Samoa 1 1 34 4.6 5.4 16 n.a. 789San Marino 0 0 165 9,9 n.a. n.a.Sao Tome and Principe 0 0 125 1.8 2.4 33 n.a. 686Saudi Arabia 195 415 112 20.3 16.7 -18 1,700 1,296 -24Senegal 24 63 163 4.3 5.2 21 344 319 -7Serbia and Montenegro .. 103 .. 12.9 .. 732Seychelles 0 1 155 6.4 12.1 89 1706 1,606 -6
DMC[ Mio. t ]
DMC/cap[ tonnes per capita ]
Material Productivity[ US$ppp, const. 2005/tonne ]
1980 2008 % change 1980 2008 % change 1980 2008 % change
Sierra Leone 10 14 40 3.0 2.5 -18 260 290 12Singapore 30 145 383 12.4 30.0 141 1163 1,602 38Slovakia .. 63 .. 11.7 .. 1,756Slovenia .. 55 .. 27.0 .. 1,006Solomon Islands 1 3 262 3.6 5.9 62 n.a. 409Somalia 57 65 15 8.8 7.3 -17 n.a. n.a.South Africa 458 607 32 16.6 12.4 -25 527 772 46Spain 390 912 134 10.4 20.0 92 1,475 1,416 -4Sri Lanka 34 70 106 2.3 3.5 53 677 1,219 80St. Kitts and Nevis 1 1 18 12.0 12.8 6 397 1,131 185St. Lucia 1 1 68 4.4 5.1 14 943 1,814 92St. Vincent and the Grenadines 0 1 161 3.1 7.4 140 860 1,158 35Sudan 144 295 105 7.2 7.1 -1 148 276 86Suriname 7 9 35 18.8 18.1 -4 351 376 7Swaziland 9 11 29 14.1 9.4 -34 161 485 201Sweden 174 200 15 20.9 21.7 4 973 1,579 62Switzerland 97 98 1 15.4 12.9 -16 1,858 2,962 59Syria 72 121 68 8.0 5.9 -27 416 734 77Tajikistan .. 7 .. 1.1 .. 1,618Tanzania 99 173 75 5.3 4.1 -23 n.a. 286Thailand 327 468 43 6.9 7.0 0 322 1,075 234Timor-Leste 1 2 162 1.4 2.0 41 n.a. 370Togo 8 18 130 2.8 2.8 -1 389 282 -27Tonga 0 0 -11 3.6 3.0 -17 692* 1,367 98Trinidad and Tobago 11 21 104 9.7 16.1 65 1,568 1,493 -5Tunisia 39 91 136 6.0 8.8 46 599 835 39Turkey 249 749 201 5.4 10.1 88 1,055 1,174 11Turkmenistan .. 64 .. 12.7 .. 487Turks and Caicos Islands 0 0 456 8.1 10.3 28 n.a. n.a.Tuvalu 0 0 26 1.5 1.5 3 n.a. n.a.Uganda 62 113 82 4.9 3.6 -27 n.a. 300Ukraine .. 405 .. 8,8 .. 767United Arab Emirates 29 196 587 28.1 43.7 56 3,394 1,238 -64United Kingdom 784 683 -13 13.9 11.1 -20 1,323 3,045 130United States 7,014 8,470 21 30.9 27.8 -10 827 1554 88Uruguay 96 152 58 33.0 45.5 38 237 256 8US Virgin Islands 0 0 1 0.8 0.7 -11 n.a. n.a.USSR 4,840 .. 18.5 .. n.a. ..Uzbekistan .. 219 .. 8.0 .. 306Vanuatu 1 2 81 8.0 7.3 -8 148 557 276Venezuela 163 312 92 10.8 11.2 4 1,070 1,051 -2Viet Nam 79 576 625 1.5 6.7 352 n.a. 386West Bank and Gaza 1 10 652 2.5 n.a. n.a.Yemen 15 84 453 1.8 3.6 102 n.a. 610Yugoslavia SFR 246 8 -97 15.8 -100 n.a. ..Zambia 102 101 -1 17.6 8.2 -54 87 156 80Zimbabwe 52 53 2 7.2 4.3 -40 n.a. n.a.
* 1981** excluding Sovjet Unionn.a. not available.. country not existing
Population data and GDP data are taken from Worldbank, 2011
Key indicators Key indicators
81
references
1. United Nations Environment Management Group. 2012. Working towards a balances and Inclusive Green Economy: A United Nations System-wide Perspective. Geneva. http://www.unemg.org/Portals/27/Documents/IMG/GreenEconomy/report/GreenEconomy-Full.pdf
2. OECD ( Organisation for Economic Cooperation and Development ). 2011. Towards Green Growth. Paris. http://www.oecd.org/dataoecd/ 37/34/48224539.pdf
3. UNIDO ( United Nations Industrial Develoment Organization ). 2011. UNIDO Green Industry. Policies for Supporting Green Industry. http://www.unido.org/fileadmin/user_media/Services/Green_Industry/web_policies_green_industry.pdf
4. UNEP. 2011. Towards a green economy. Pathways to sustainable development and poverty eradication. Nairobi. http://www.unep.org/greeneconomy/Portals/88/documents/ger/ger_final_dec_2011/Green %20EconomyReport_Final_Dec2011.pdf
5. Giljum, S., M. Dittrich, S. Bringezu, C. Polzin and S. Lutter. 2010. Resource use and resource productivity in Asia: Trends over the past 25 years. Study for the UN Industrial Development Organisation ( UNIDO ). Vienna. http://seri.at/wp-content/uploads/2010/05/
SERI-Working-Paper-11.pdf6. Dittrich, M., S. Giljum, S. Bringezu, C. Polzin and S. Lutter. 2011. Resource use and resource productivity in emerging economies: Trends
over the past 20 years. Study for the UN Industrial Development Organisation ( UNIDO ). Vienna. http://www.unido.org/fileadmin/ user_media/Services/Green_Industry/1256_11_Onscreen_Green %20Industry.pdf
7. Polzin, C., S. Giljum, M. Dittrich, B. Lugschitz and S. Lutter. 2011. Resource use and resource efficiency in Central and Eastern Europe and the Newly Independent States. A pilot study on trends over 13 years. Study for the UN Industrial Development Organisation ( UNIDO ). Vienna.
8. Dittrich, M., S. Giljum, C. Polzin and S. Lobo. 2012: Resource use and resource efficiency in Africa. Trends over the past 30 years. Study for UNCTAD. Heidelberg / Vienna.
9. UNEP ( United Nations Environment Programme ). 2011. Decoupling natural resource use and environmental impacts from economic growth, A Report of the Working Group on Decoupling to the International Resource Panel. Edited by M. Fischer-Kowalski and M. Swilling. http://www.unep.org/resourcepanel/decoupling/files/pdf/Decoupling_Report_English.pdf
10. UNEP ( United Nations Environment Programme ). 2011. Resource Efficiency: Economics and Outlook for Asia and the Pacific. Bangkok. 11. von Weizsäcker, E. U.; Hargroves, K. C., Smith, M. H., Desha, C. and P. Stasinopoulos. 2009: Factor five: transforming the global
economy through 80 % improvements in resource productivity. London. 12. Journal of Industrial Ecology. http://eu.wiley.com/WileyCDA/WileyTitle/productCd-JIEC.html13. Ecological Economics. http://www.journals.elsevier.com/ecological-economics/14. Schmidt-Bleek, F. 2009. The Earth: Natural Resources and Human Intervention. London. 15. OECD ( Organisation for Economic Cooperation and Development ). 2007. Measuring material flows and resource productivity.
The accounting framework ENV/EPOC/SE( 2006 )4/REV1. Paris. 16. Worldbank. http://databank.worldbank.org/17. Regions according UN, except Russian Federation which is assigned to Asia: United Nations Statistics Division. 2011. Composition of macro
geographical ( continental ) regions, geographical sub-regions, and selected economic and other groupings. http://unstats.un.org/unsd/methods/m49/m49regin.htm
18. Monetary values: UN Comtrade. 2011. http://comtrade.un.org/db/19. Human Development Index ( HDI ): UNDP. 2011. http://hdr.undp.org/20. Happy Life Years ( HLY ): new economics foundation. 2011. http://www.happyplanetindex.org/21. Water Exploitation Index ( WEI ): European Environment Agency. http://www.eea.europa.eu/data-and-maps/indicators/
water-exploitation-index22. EUROSTAT. 2001. Economy-wide material flow accounts and derived indicators. A methodological guide. Luxembourg: Statistical Office of
the European Union. 23. Data for unused extraction taken from SERI ( Sustainable Europe Research Institute ) 2011.http://www.materialflows.net/24. IEA ( International Energy Agency ). 2009. CO2 Emissions from Fuel Combustion ( 2009 Edition ). Paris.25. EEA. 2010. The European Environment. State and outlook 2010. Land use. Copenhagen. 26. Krausmann, F., S. Gingrich, N. Eisenmenger, K.-H. Erb, H. Haberl, and M. Fischer-Kowalski. 2009. Growth in global materials use,
GDP and population during the 20 th century. Ecological Economics 68 ( 10 ): 2696 – 2705.27. PBL and JRC. 2011. Long-term trend in global CO2 emissions. The Hague. http://edgar.jrc.ec.europa.eu/news_docs/
C02 %20Mondiaal_ %20webdef_19sept.pdf
Imprint
Published by: Monika Dittrich – Independent Scientist, Burgstrasse 24, 69121 Heidelberg, Germany and Stefan Giljum, Stephan Lutter and Christine Polzin – Sustainable Europe Research Institute ( SERI ), Garnisongasse 7/17, 1090 Vienna, Austria
Authors: Monika Dittrich, Stefan Giljum, Stephan Lutter and Christine PolzinConception and design: Monika Dittrich, Stefan Giljum, Stephan Lutter and Christine PolzinProofreading: Jaya Mohan
Map: © Dittrich, master map is a modifi ed version of map bought from presentationload Images: Cover ©123rf.com, p. 28 © worldmapper.orgGraphic Design and Illustrations: Gerda PalmetshoferPrint: gugler*crossmedia
Circulation: 2,000
Year of publication: 2012
ISBN978-3-200-02640-7
Copyright © Monika Dittrich and Stefan Giljum, 2012. All rights reserved.
Quotations from this publication are permitted provided the source is given.
Suggestion for quote: Monika Dittrich, Stefan Giljum, Stephan Lutter, Christine Polzin: Green economies around the world? Implications of resource use for development and the environment.
Cradle-to-Cradle®-Druckprodukte innovated by gugler*. Sämtliche Druckkomponenten sind für den biologischen Kreislauf optimiert.
Highest standard for eco-effectiveness. Unique worldwide: Cradle to Cradle® printing products innovated by gugler* All of the constituent materials are optimized for the biological cycle. Except binding. www.gugler.at
AE United Arab EmiratesAF AfghanistanAG Antigua and BarbudaAI AnguillaAL AlbaniaAM ArmeniaAN Netherland Antilles and ArubaAO AngolaAR ArgentinaAS American SamoaAT AustriaAU AustraliaAZ AzerbaijanBA Bosnia and HerzegovinaBB BarbadosBD BangladeshBEL Belgium and LuxembourgBF Burkina FasoBG BulgariaBH BahrainBI BurundiBJ BeninBM BermudaBN Brunei DarussalamBO BoliviaBR BrazilBS Bahamas, TheBT BhutanBW BotswanaBY BelarusBZ BelizeCA CanadaCD Congo, Dem. Rep.CF Central African RepublicCG Congo, Rep.CH SwitzerlandCI Cote d’Ivoire CK Cook IslandsCL ChileCM CameroonCN China, incl. Hong Kong and MacaoCO ColombiaCR Costa RicaCU CubaCV Cape VerdeCY CyprusCZ Czech RepublicDE GermanyDJ DjiboutiDK DenmarkDM DominicaDO Dominican RepublicDZ AlgeriaEC EcuadorEE EstoniaEG EgyptER EritreaES SpainET EthiopiaFI FinlandFJ Fiji IslandsFM MicronesiaFO Faroe IslandsFR FranceGA GabonGB United KingdomGD Grenada
GE GeorgiaGF French GuianaGH GhanaGI GibraltarGM Gambia, TheGN GuineaGP GuadeloupeGQ Equatorial GuineaGR GreeceGT GuatemalaGU GuamGW Guinea-BissauGY GuyanaHN HondurasHR CroatiaHT HaitiHU HungaryID IndonesiaIE IrelandIL IsraelIN IndiaIQ IraqIR IranIS IcelandIT ItalyJM JamaicaJo JordanJP JapanKE KenyaKG KyrgyzstanKH CambodiaKI KiribatiKM ComorosKN St. Kitts and NevisKR Korea, Rep.KW KuwaitKZ KazakhstanLA LaosLB LebanonLC St. LuciaLK Sri LankaLR LiberiaLS LesothoLT LithuaniaLV LatviaLY LibyaMA MoroccoMD MoldovaMG MadagascarMK Macedonia, FYRML MaliMM MyanmarMN MongoliaMQ MartiniqueMR MauritaniaMS MontserratMT MaltaMU MauritiusMV MaldivesMW MalawiMX MexicoMY MalaysiaMZ MozambiqueNA NamibiaNC New CaledoniaNE NigerNG NigeriaNI Nicaragua
NL NetherlandsNO NorwayNP NepalNZ New ZealandOM OmanPA PanamaPE PeruPG Papua New GuineaPH PhilippinesPK PakistanPL PolandPM St. Pierre and MiquelonPS West Bank and GazaPT PortugalPW PalauPY ParaguayQA QatarRE ReunionRO RomaniaRS Serbia and MontenegroRU Russian FederationRW RwandaSA Saudi ArabiaSB Solomon IslandsSC SeychellesSD SudanSE SwedenSG SingaporeSH Saint HelenaSI SloveniaSK SlovakiaSL Sierra LeoneSM San MarinoSN SenegalSO SomaliaSR SurinameST Sao Tome and PrincipeSV El SalvadorSY SyriaSZ SwazilandTD ChadTG TogoTH ThailandTJ TajikistanTK TokelauTL Timor-LesteTM TurkmenistanTN TunisiaTO TongaTR TurkeyTT Trinidad and TobagoTV TuvaluTZ TanzaniaUA UkraineUG UgandaUS United StatesUY UruguayUZ UzbekistanVC St. Vincent and the GrenadinesVE VenezuelaVG British Virgin IslandsVN Viet NamVU VanuatuYE YemenYT MayotteZA South AfricaZM ZambiaZW Zimbabwe
Key
Biomass Minerals Fossil fuels Metals