green electronics survey - greenpeace
TRANSCRIPT
Cre
ati
ng
a t
oxi
c-f
ree
fu
ture
GREEN ELECTRONICS SURVEYDECEMBER 2008
greenpeace.org

� l Greenpeace International l Green Electronics: the search continues l Results, Green Electronics Survey l December 2008
Green ElectronicsThe search continues...
For more information, contact: [email protected]
Authors: Mario Rautner and Casey Harrell
Edited by: Steve Erwood
With thanks to Iza Kruszewska, Dr. Kevin Brigden, Yannick Vicaire and Martin Hojsik
Printed on 100% recycled post-consumer waste with vegetable-based inks.
JN 214
Published in December 2008 by Greenpeace International Ottho Heldringstraat 5, 1066 AZ Amsterdam, The Netherlands Tel: +31 20 718 2000 Fax: +31 20 718 2002 greenpeace.org
Contents
Green Electronics - The Search Continues… .......................... 3
Introduction ............................................................................. 3
The Green Electronics Survey .................................................. 4
Main findings ........................................................................... 4
Summary of results .................................................................. 6
Observations and the ways forward ......................................... 8
Designing out toxic chemicals .................................................. 9
Energy efficient products ........................................................ 10
Product lifestyle approach ...................................................... 10
Innovations and marketing ..................................................... 11
Annex 1: Methodology of scoring ........................................... 1�
Use of hazardous chemical substances ................................. 12
Energy use and power-saving ................................................ 13
Product lifecycle ..................................................................... 14
Innovation and marketing ....................................................... 15
Annex �: Detailed product line-up .......................................... 16
Desktops ............................................................................... 16
Notebook computers ............................................................. 18
Mobile phones ....................................................................... 20
Smart phones/PDAs .............................................................. 22
Televisions ............................................................................. 24
Computer monitors ................................................................ 26
Front cover: design - Toby Cotton; original image - RafeB
Images © Robert Knoth / GreenpeaceToxics E-Waste Documentation in PakistanIn the Karachi district of Lyari, hundreds of workers, including teenage children, earn their livelihoods by dismantling electronic scrap and extracting valuable components such as copper to sell. This is an insight into the personal cost of e-waste. Thousands of tonnes of e-waste such as discarded PCs, mobile phones and TVs, are dumped in Africa and Asia every year. Greenpeace research shows that some of this waste is exported from Europe to Pakistan.
Images © Greenpeace / Kate DavisonToxics E-Waste Documentation in GhanaThe majority of second-hand electrical goods that are exported to Ghana from developed countries are beyond repair and are either dumped or recycled in a crude fashion. In the yards, unprotected workers, many of them children, dismantle computers and TVs with little more then stones in search of metals that can be sold. The remaining plastic, cables and casing is either burnt or simply dumped. ©
Rob
ert K
noth
/ G
reen
peac
e

Greenpeace International l Green Electronics: the search continues l Results, Green Electronics Survey l December 2008 l 3
Green Electronics - The Search Continues…Introduction
Since August 2006 Greenpeace has assessed the environmental
policies of consumer electronics companies through its “Guide to
Greener Electronics”. Initially this quarterly publication focused on
leading computer and mobile phone producers and their policies
with regards to hazardous chemicals used in their products
and the waste generated by their branded products. Since then
the Guide has evolved to include the 18 top manufacturers of
personal computers, mobile phones, televisions, and games
consoles. It now assesses their policies on toxic chemicals,
recycling, energy efficiency and climate change mitigation. These
reports have contributed towards motivating producers to take
responsibility for the environmental impacts caused by modern
consumer electronics. They have helped shape policies of many
electronics companies that now far exceed policies that were in
place in 2006 as well as legislative requirements.
As companies have made increasingly stronger commitments
to eliminate toxic chemicals, increase their products’ energy
efficiency and improve their recycling efforts by embracing
financial responsibility for their electronic waste, Greenpeace has
sought to comprehensively assess the state of green products
coming into the global marketplace, looking even beyond its initial
criteria in the Guide to Greener Electronics. Using information
submitted by companies in late 2007, Greenpeace published the
first edition of its Green Products Survey in early 2008. Unlike
the electronics Guide described above, which focuses on overall
corporate policies and practice, this survey evaluates the products
that the manufacturers themselves consider to be their greenest.
The first edition revealed no products that could claim the title of a
truly green product, with only a few scores barely reaching a total
score of 5 out of 10. In 2008, we invited the companies to submit
their greenest models again, to find out if new product line-ups
showed improved environmental performances, and to once again
try to find the greenest electronic products on the market.
Companies choosing to participate in the 2008 survey are:
Acer, Dell, Fujitsu Siemens, Hewlett Packard, Lenovo, LG
Electronics, Motorola, Nokia, Panasonic, RIM/Blackberry,
Sharp, Samsung, Sony, Sony Ericsson and Toshiba
© G
reen
peac
e /
Kat
e D
avis
on

� l Greenpeace International l Green Electronics: the search continues l Results, Green Electronics Survey l December 2008
Protection Agency. Points were also given for a number of
other areas such as providing detailed power consumption data
to consumers.
• Product lifecycle, including criteria such as recyclability rate and
use of recycled plastic in the product. Long warranty periods and
good take-back programmes were also rewarded.
• Availability of data that enables assessment of the energy taken
to manufacture the products as well as special innovations that
help to reduce the total burden on the environment.
A maximum of 100 points could be reached. The total points for each
product were adjusted to a possible top score of ten. Because the
assessment criteria are often specific to a product category i.e. laptops
are not compared with mobile phones, etc, comparisons are only
possible within a product category. In addition one product category
scoring higher than another is not an indication of an overall better
environmental performance of that product category.
The criteria are by-and-large the same as those used in 2007. However,
small changes have been made due to new criteria being added to
reflect the rapidly changing nature of consumer electronics design. In
addition, there have been changes in international standards such as
those for energy efficiency, and these have been reflected in the survey.
Therefore, this year’s results cannot be directly compared with the
results from 2007.
Main findings
The electronics industry continues to make progress in putting
products on the market with reduced environmental impacts, and this
is confirmed by the results of Greenpeace’s 2008 Green Electronics
Survey. In addition to the overall improvement in the year since the
first Greenpeace survey, the product scores are increasingly closer
together, suggesting a more competitive environment in a ‘race to the
top’ to produce truly green products. There are a number of findings
that underline this trend, but also significant shortcomings in certain
practices.
• Progress continues with regards to phasing out the use of
hazardous chemicals. More products are PVC-free than in the
previous year’s survey and fewer RoHS (Restriction of Hazardous
Substances) exemptions are being used by the manufacturers.
Unfortunately not all companies invited took the opportunity to
showcase the environmental performance of their products.
The companies that refused to take part in the survey were:
Apple, Asus, Microsoft, Nintendo, Palm and Philips
Because Microsoft and Nintendo opted not to take part in the
survey, and only Sony submitted game consoles for review, it
has not been possible to rank game consoles.
In addition to desktop and notebook computers, mobile
phones and smart phones, which were also assessed in 2007,
the categories of LCD and plasma screen televisions and LCD
computer monitors have been included in this edition. In total
we received 50 products from 15 companies.
The Green Electronics Survey
The principles behind this year’s survey were the same as last year’s:
leading manufacturers were directly invited to submit their greenest
products via an assessment form that was sent to them. In addition,
the forms were published on the Greenpeace website and other forums
to enable smaller manufacturers to participate as well. Each company
was allowed to submit three products per product category, which
we then assessed and scored against our criteria. To make certain
that the survey was as up-to-date as possible upon its publication, we
also offered companies the opportunity to submit products that, while
unreleased at the time we contacted them, would be on the market by
1 January 2009. If a company submitted more than one product in a
category we chose the highest-scoring device for inclusion in the report.
Once assessments were completed, companies were invited to review
them to ensure accurate product information.
The products submitted were assessed against four broad groups
of criteria:
• Use of hazardous chemical substances, including polyvinyl
chloride (PVC), brominated flame retardants (BFRs), antimony,
phthalates, beryllium and a number of other chemicals.
• Power consumption of the products, assessed by comparing
them with the Energy Star standards of the US Environmental

For notebooks, LED displays that save energy and avoid the use of
mercury in backlights are becoming more widespread. (See Annex
1 for a fuller explanation of RoHS exemptions).
• For larger products such as TVs and monitors, significant amounts
of post-consumer recycled plastic are being used, while mobile
phones and - with some exceptions - desktop and notebook
computers are lagging behind in this respect. As producers
establish more comprehensive voluntary take-back and recycling
programmes, increasingly detoxified end-of-life products should be
feeding the increased demand for recycled plastics.
• Companies have adapted quickly to new Energy Star requirements,
however a small number of products submitted for the survey did
not yet meet the latest of these requirements.
• While more companies now track the energy used to produce their
products, there is no international standard that allows for a good
comparison of energy embodied in the product to be made.
• Even though computer manufacturers are generally good at
providing in-use energy data and comparisons for their products,
monitor and television producers need to make this a higher priority.
• While some companies now have sections on their website that
list green products, these are still usually not prominent enough
to promote green products as a major purchasing decision.
More work needs to be done by companies to integrate the
environmental attributes of their products into their marketing efforts.
Despite the fact that there are major differences between the
various product categories and although the survey does not make
comparisons between the product categories, one product performed
exceptionally well - the Lenovo L���0x wide monitor. It is far ahead
of the competition by being PVC and BFR-free (albeit allowing an
unacceptably high limit of 900 ppm bromine and chlorine) and also free
of phthalates, antimony and beryllium. Furthermore, it uses post-
consumer recycled plastic for nearly 30% of its plastic parts and
has a LED backlit display, which negates the use of mercury and
improves energy efficiency.
Greenpeace International l Green Electronics: the search continues l Results, Green Electronics Survey l December 2008 l �
© G
reen
peac
e /
Kat
e D
avis
on

6 l Greenpeace International l Green Electronics: the search continues l Results, Green Electronics Survey l December 2008
Summary of results
Desktop computers
Lenovo takes first place with its ThinkCentre 58/58p model; last
year, Lenovo’s product had the lowest score of all submitted
desktop computers. The Fujitsu Siemens Esprimo E7935 E-Star 4
is only one-tenth of a point behind in second place. The products
submitted by Dell and Hewlett Packard did not reach the 5 points
half-way mark, and Acer, who did not take part in the survey
last year, scored well below 4 points and finds itself in last place.
Unfortunately, no desktop (or notebook) computer submitted is
entirely PVC or BFR-free, which means that computers still lag
behind other product categories when it comes to the use of
hazardous chemicals.
Rank Model Points
1 Lenovo ThinkCentre 58/M58p 5.88
2 Fujitsu Siemens Esprimo E7935 E-Star 4 5.73
3 Dell Studio Hybrid 4.86
4 Hewlett Packard dc7900e USDT 4.73
5 Acer Veriton M678G 3.31
Notebook computers
Toshiba takes the top spot with its Portege R600, beating
Hewlett Packard’s Elitebook 2530p by a narrow margin. While
the Hewlett Packard product scores much higher in the lifecycle
category, Toshiba is ahead of everyone else when it comes to the
elimination of toxic chemicals. These are the only products that score
above 5 points out of a maximum possible 10. The Lenovo X300 is
in third place, followed by the Dell Latitude E-4200. Sony, which last
year had the highest-scoring product in this category, is ranked fifth.
Neither Panasonic’s or Acer’s reached the 4 points mark.
Rank Model Points
1 Toshiba Portege R600 5.57
2 Hewlett Packard Elitebook 2530p 5.48
3 Lenovo X300 4.68
4 Dell Latitude E-4200 4.41
5 Sony VGN-Z11WN/B 4.20
6 Panasonic CF-W7 3.80
7 Acer TravelMate 6293 3.44
Mobile phones
All the mobile phones submitted to the survey score within one
point of each other, but the lead goes to the Samsung SGH-F268.
The Motorola V9 and Nokia 3110 Evolve are ranked second and
third respectively, with only one-tenth of a point separating them,
while the Sony Ericsson C905 and LG KT520 stay just short of
the half-way 5 points mark – this is still less than one point behind
the leader. A major step has been made in the use of chemicals,
with all but the LG phone claiming to be PVC-free and Samsung’s
phone being free of BFRs, well below the commonly used so-
called ‘halogen-free’ industry limit of 900ppm bromine.
Rank Model Points
1 Samsung SGH-F268 5.45
2 Motorola MOTORAZR V9 5.20
3 Nokia 3110 Evolve 5.00
4 Sony Ericsson C905 4.88
5 LG KT520 4.61

Greenpeace International l Green Electronics: the search continues l Results, Green Electronics Survey l December 2008 l �
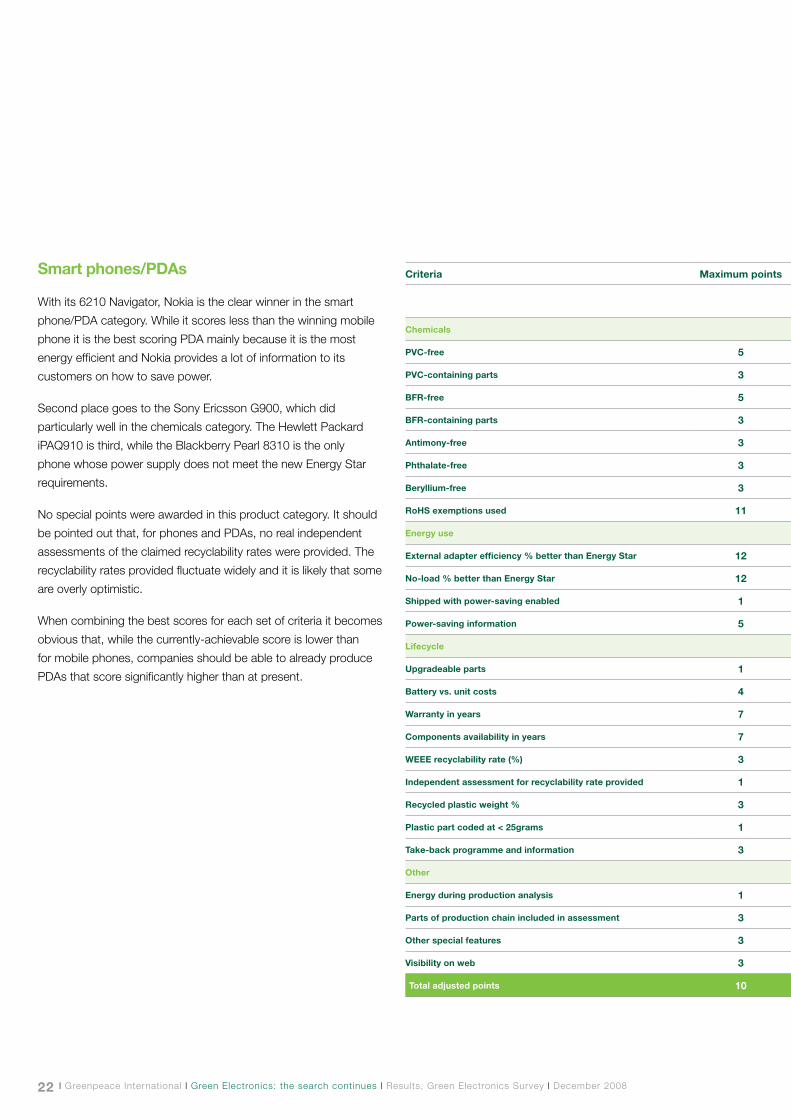
Smart phones/PDAs
Nokia’s 6210 Navigator secures first place in this category, ahead
of the Sony Ericsson G900. Both models are PVC-free, but Nokia
gets more points due to better energy efficiency and the product’s
lifecycle. Hewlett Packard’s iPAQ is third, ahead of the Blackberry
Pearl, which lost a lot of points in the lifecycle criteria and for
poor energy efficiency, and did not even meet the Energy Star
standard. Hewlett Packard’s PDA lagged in the area of hazardous
chemicals phase out.
Rank Model Points
1 Nokia 6210 Navigator 5.20
2 Sony Ericsson G900 4.80
3 Hewlett Packard iPAQ 910 4.20
4 RIM Blackberry Pearl 8130 3.50
Televisions
There was a tight race for the top spot for televisions that was
ultimately won by the Sharp LC-52GX5. This model scores best
overall even though it does not lead in any of the four sets of
scoring criteria. The Sony KDL-32JEI takes second place and
leads in the lifecycle criteria. These two televisions are sold only in
Japan. The Panasonic television is ranked last among the three
but has the best performance when it comes to the reduction of
hazardous chemicals used. Unfortunately, LG Electronics had to
pull its submission, when its LCD model television’s release was
delayed past the publication date of this report.
Rank Model Points
1 Sharp LC-52GX5 5.92
2 Sony KDL-32JE1 5.84
3 Panasonic TH-42PZ800U 4.96
�
Computer monitors
The clear winner and the highest-scoring overall product is the
Lenovo L2440x widescreen monitor, being free of PVC and BFRs
as well as other chemicals such as beryllium and antimony. No
other monitor submitted has eliminated the use of PVC and
BFRs, although Lenovo’s definition of ‘free’ allows use of BFRs
and PVC up to a limit of 900ppm bromine or chlorine. The Fujitsu
Siemens SCENICVIEW P22W-5 ECO gets second place and has
eliminated the use of beryllium and also uses zero watts of energy
in sleep and stand-by modes. Third and fourth places are taken
by Samsung’s and LG Electronics’ products, which scored highly
in energy efficiency. The products submitted by Hewlett Packard
and Dell also scored more than 5 points, but Acer’s fell short,
particularly in the lifecycle criteria.
Rank Model Points
1 Lenovo L2440x wide 6.90
2 Fujitsu Siemens SCENICVIEW P22W-5 ECO 6.33
3 Samsung 2443BW 5.89
4 LG Electronics W2252TE 5.74
5 Hewlett Packard L1950g 5.48
6 Dell E2009W 5.13
7 Acer V194HQ 4.29
© G
reen
peac
e /
Kat
e D
avis
on

8 l Greenpeace International l Green Electronics: the search continues l Results, Green Electronics Survey l December 2008
Observations and the ways forward
© Greenpeace / Kate Davison

Greenpeace International l Green Electronics: the search continues l Results, Green Electronics Survey l December 2008 l �
It is disappointing that Apple has, for a second year running,
decided not to take part in this survey, especially since its new
line-up of MacBooks, with drastic PVC and BFR reduction and
high energy efficiency, could have scored well.
Phase out use of PVC and BFRs in consumer electronic
products. In our 2008 survey, we see more products reducing
their uses of hazardous PVC and BFRs and a number moving
towards becoming PVC and BFR-free. It’s imperative that
designing out these toxic chemicals continues; it will have a
positive environmental impact and create financial incentives for
companies to take responsibility for their waste.
Go beyond RoHS exemptions. The use of RoHS exemptions
was seen to decrease in the 2008 survey. Companies are proving,
with increasing frequency, that they no longer need RoHS
exemptions to make successful, highly-functional and profitable
consumer electronics. Greenpeace has compiled a long list of
products offering alternatives for each of the RoHS exemptions
(see http://www.greenpeace.org/raw/content/international/assets/
binaries/ngo-rohs-submission.pdf)
Strengthen the RoHS list. RoHS currently only regulates a
limited list of hazardous chemicals while the list of products or
components that avoid the use of additional hazardous chemicals
(PVC, BFRs, antimony, phthalates and beryllium), as seen in the
2008 survey, continues to grow. More and more often producers
and their component and material suppliers are designing new
models in anticipation of these chemicals being included in an
revised RoHS Directive; it is high time to strengthen the list so that
it reflects the market’s readiness to comply and levels the playing
field for the industry leaders.
Make ‘free’ mean ‘free’. Industry standards for ‘halogen-free’
commonly allow use of bromine (in BFRs) and chlorine (in PVC),
creating an unnecessary loophole that allows for the formation
of toxic chemicals including halogenated dioxins under some
recycling and disposal operations, especially open burning. For
Greenpeace, this level is unacceptable: ‘free’ should mean as
close to zero as possible. For more information, see page 5 of the
document “New Improved Ranking Criteria Explained”, available
at: www.greenpeace.org/international/press/reports/
improved-criteria-explained.pdf
Our second survey showed companies making significant
improvements over the last year while also leaving significant
scope for further gains. Taking the top scores within each
criteria and product category, a pathway to the design of truly
green electronics products becomes clear. Companies are still
achieving piecemeal improvements but this need not be the case
– for example, using the technologies employed by the current
market leaders and thus combining the best characteristics of
the submitted desktop products, a significantly greener product
could already be on the market, and a score of well over 7 points
in this survey could be achievable. On top of this, since several
companies now have clear phase-out dates for PVC and BFRs for
their entire product range their potential score could be pushed
above 8 points. Now is the time for manufacturers to combine
their best green practices and put them forth in complete and
integrated fashion into the marketplace.
Designing out toxic chemicals
Significant gains have been made on the reduction of hazardous
chemicals since the first survey commissioned in 2007. The
number of RoHS exemptions used by companies decreased; it
has become commonplace to see products, especially mobile
phones, use only two or three RoHS exemptions (see Annex 1
for a fuller explanation of RoHS exemptions). A total of six mobile
phones and smartphone/PDAs were PVC ‘free’, although most
used an unacceptably high threshold of 900ppm for chlorine and
bromine. Key mobile products (the Motorola Razr V9 and the
Samsung F268) showed that it is possible to eliminate levels of
hazardous PVC and BFRs, respectively, to much lower threshold
levels. The survey also witnessed the first product introduced
to the marketplace that is PVC, BFR, antimony, beryllium and
phthalate free – the Lenovo L2440x widescreen monitor.
Sadly, there is still no notebook manufacturer that manages to
produce PVC and BFR-free products at the time of the survey. A
number of companies have announced they will phase out use of
PVC and BFRs in 2009, which would mean that under the current
criteria it should be possible to manufacture products scoring well
over 8 points in this survey.
�

10 l Greenpeace International l Green Electronics: the search continues l Results, Green Electronics Survey l December 2008
Product lifestyle approach
Recyclability. As found in the 2007 survey, there appears to be
no common industry practice when calculating recyclability rates.
Recyclability claims made by companies in all product categories
ranged as high as 85 to 90% recyclability, and they most likely do not
match the reality of common recycling practices. For example, CRT
monitors quoting recyclability levels this high must take into account
CRT glass, often over 50% of product weight, which can at best be
downcycled and not truly recycled.
To make “recyclability” improvements fit with recycling practices,
manufacturers need better communication with recyclers to also
improve separation and recycling technologies and build capacity
among the organisations and companies in charge of collection
and recycling.
Lifecycle analysis. There is an urgent need to work towards an
industry-wide standard of lifecycle analysis that encompasses
the use of energy and natural resources across the entire chain
of production – from mining, manufacture and distribution
to consumption and end-of-life treatment. In the meantime,
companies should develop their own analysis that covers the
entire product lifecycle. Without knowing and tracking what
resources and how much energy it takes to make a product, it
is hard to determine how significant, systematic changes can
be made. All stakeholders need to be able to understand where
action needs to be taken as a priority, to design out toxics, and to
assess whether actions taken downstream are efficient or merely
shift toxic burdens from one environmental medium to another (for
example, from the soil to the air). With respect to tackling climate
change, it is also essential to have a fair disclosure of total energy
used during the manufacture of products – by fair, meaning that
every company can be judged on the same stages of production
and not according to where it sets its own boundaries for
responsibility; once the carbon footprint of the manufacturing
process has been established, it is also important to consider the
carbon footprint incurred by the mining of raw resources,
for example.
10
Energy efficient products
Beyond Energy Star. Climate change is now a global priority
- it is likely that we are currently seeing a fast technological jump
in energy efficiency because this field of innovation has been
otherwise ignored for decades. Energy Star (see Annex 1 for more
details) provides a well-recognised benchmark for energy efficiency.
Our survey shows that these current standards can already be
surpassed for the devices that we assessed, and should therefore
be considered to provide a minimum baseline below which a
company should not even considering marketing a product.
On the other hand, it would seem that there is scope for a
significant strengthening of future standards of energy efficiency
– new products, marketed after this survey was undertaken,
demonstrate that they are able to comfortably beat the records
already identified in our survey. The US Environmental Protection
Agency has already adopted a ‘new approach’, where the much
tighter Energy Star 5.0 standards, which will launch for computers
in July 2009, will be introduced once 25% of products are in
compliance with Energy Star 4.0. This approach should also be
considered by legislators drafting future mandatory requirements,
to get the worst, least energy efficient products off the market as
soon as possible. Certain products, such as desktops, use more
energy and materials in production and are less energy efficienct
during consumer use.
Information for consumers. Making products energy efficient
is not enough. Consumers need information as to how to make
the best use of their devices with regard to energy use. There
are no initiatives reaching very far in providing this information to
consumers, and one could reasonably expect much more from
companies who publicly express their concerns and communicate
their efforts about tackling climate change. Guidelines or even a
standard for the electronics industry to follow should be in place.

Greenpeace International l Green Electronics: the search continues l Results, Green Electronics Survey l December 2008 l 11
Extend the lifecycle of products. To design truly ecologically
sound products, companies need to shift away from products
designed with a limited lifespan (planned obsolescence) and
towards long-living upgradeable goods, with warranty periods
significantly above minimum legal standards and with long
availability of components. Many other initiatives could contribute
towards this objective, from the standardisation of peripherals
and chargers to allowing or offering repair services, easing and
organising safe reuse of second-hand products. Refurbishment
initiatives should also be promoted in developed countries, where
recycling is too focused on metal recovery after shredding the
whole device and condemning most of it to combustion.
Reconsider business models. Move from products to services.
The products evaluated in this survey are physically sold to
customers in a traditional manner. However, as already seen
long ago in the photocopier business, leasing of products (big-size
peripherals or others) instead of selling them is another valid way to
amend business models in the direction of dematerialisation. Moving
to new, service-based business models might enable manufacturers
to design ultra-slim devices backed up by shared and efficiently
used central infrastructure, reducing today’s huge redundancies in
computing and storage capacity in private ICT devices.
Innovations and marketing
It should be noted that the desktops included in this survey are
standard desktop computers and that there are new technologies
available that in some cases allow the use of products with
significantly fewer environmental impacts. For example, offices
with powerful servers and even homes with one standard
desktop can run thin clients on their networks. Thin clients draw
processing power from the server or another desktop and thereby
reducing the need for many stand-alone desktops. Often, thin
clients do not need to have their own motherboard or memory
and use less power and materials than ordinary desktops.
11
© Robert Knoth / Greenpeace

1� l Greenpeace International l Green Electronics: the search continues l Results, Green Electronics Survey l December 2008
Annexes
Annex 1: Methodology of scoring
Products were assessed against four sets of criteria that
include some of the most important issues when it comes
to manufacturing green consumer electronics products.
A maximum of 100 points was available, which was then
adjusted to a score on a ten-point scale for comparison
purposes. In other words, a product’s “score” equals the
total points achieved, divided by 10. Analysis of each
product category included criteria specific to consumer use
and main environmental issues of that product category,
in addition to a number of criteria applicable across all
product categories.
A composite score, per product category, was created
using the top scoring answers from each criteria question.
These best practice scores, ranging as high as 8.6 points,
demonstrate that there is environmental innovation available
now to produce significantly greener products today
While very similar, the scoring for this survey cannot be
compared exactly to the previous scoring that took place
in the survey published in March 2008. This is due to using
updated international standards in areas such as energy
efficiency, and also due to small changes in the scoring to
allow for innovations in product development.
Use of hazardous chemical substances(30 out of the total of 100 points a product can achieve)
RoHS exemptions
The European Union Directive on the Restriction of the Use of Certain
Hazardous Substances in Electrical and Electronic Equipment (RoHS)
regulates the use in electronic products of certain critical chemicals
namely lead, mercury, cadmium, hexavalent chromium and the
brominated flame retardants PBBs and PBDEs (though not other
BFRs). Since all products are expected to follow current legislation,
they were not awarded points for merely being RoHS compliant.
However, RoHS allows products to still be in compliance if they use the
restricted chemicals in specific listed applications, though only where
substitution is deemed not currently possible, or the substitute would
be more harmful. Companies were asked to provide the exemptions
© Robert Knoth / Greenpeace

Greenpeace International l Green Electronics: the search continues l Results, Green Electronics Survey l December 2008 l 13
being used in each product. The fewer exemptions reported for a
product, the more points awarded.
PVC and BFRs
Points were awarded if a product was declared free of all PVC
plastics and/or free of all BFRs. One point was deducted for
using a 900 ppm or greater limit for chlorine/bromine. While many
companies now have timelines to phase out these two chemical
groups, there are still very few products on the market that avoid
them altogether. To recognise this, points were awarded where
major components of the product did not use these chemicals:
For PVC:
• External cabling and wire
• Internal cabling and wires (including ribbon cables)
• Housing
• Packaging
• Plastic coated/encased electrical connectors
For BFRs:
• Laminates of printed wiring boards,
including flexible circuit boards.
• Battery, including casing and components
• Housing (including for periphery equipment, e.g. transformer)
• Fan and fan housing
• Ribbon cables
• Electrical insulation sheet
• Plastic coated/encased electrical connectors
Antimony, phthalates and beryllium
These hazardous chemicals are not currently restricted under the
RoHS Directive. Additional points were awarded for each of these
chemical groups not used in the product.
For details of the environmental and human health impacts of the
chemicals mentioned here, see the Greenpeace report “Toxic Tech
– The dangerous chemicals in electronic products”, available at:
www.greenpeace.org/international/press/reports/toxic-
tech-chemicals-in-elec
or also see ‘‘Chemical contamination at e-waste recycling and
disposal sites in Accra and Korforidua, Ghana’’, available at:
www.greenpeace.org/raw/content/international/press/
reports/chemical-contamination-at-e-wa.pdf
Energy use and power saving(30 out of the total of 100 points a product can achieve)
Consumer electronics play a significant and growing part in an
individual’s carbon footprint. Using energy efficient products
reduces CO2 emissions - and thereby the impact on the climate
- and results in lower household energy bills.
Energy Star assessment
Energy Star is the energy efficiency rating of the US Environmental
Protection Agency and the US Department of Energy. This
certification has become a globally-accepted standard and sets
benchmarks for a number of products. If these benchmarks
are met or exceeded, products can be labelled as Energy Star
compliant. For the Greenpeace survey, points were awarded
according to the percentage by which devices exceeded Energy
Star minimum requirements. For example, a desktop computer
using 1 Watt in stand-by mode instead of the 2 Watts required by
Energy Star would be 50% better than Energy Star. For desktop
and notebook computers, the stand-by, idle and sleep modes
were taken into account. For mobile phones and PDAs, the
energy efficiency and no-load energy use of the external power
adapters was analysed. Monitors were assessed against off
mode, sleep mode and on mode energy use, while televisions
were compared with the Energy Star requirement for the stand-by
and on modes.
An additional point could be earned for notebooks and desktops
if the products enter sleep mode in a shorter time period than
required by Energy Star during user inactivity. This means power
is saved, since the product spends more time in a lower power
state. Mobile phone and PDA producers could also earn an
additional point by shipping the products with power saving
settings enabled, for example by powering down of the screen
after a shorter period of time. A point was also available for
television and computer monitors that have hard-off switches,
which result in a zero watt power consumption.
The detailed requirement for Energy Star qualifying products can
be found on the Energy Star website at www.energystar.gov

1� l Greenpeace International l Green Electronics: the search continues l Results, Green Electronics Survey l December 2008
Power-saving information
Points were awarded to companies providing the consumer with
information on how best to reduce the energy consumption of a
device. The more comprehensive the information is, the more points
awarded to the product. The areas in which points could be scored
included provision of an online energy calculator to compare products,
public access to environmental data sheets where actual power
consumption is listed, the manual explicitly encouraging power-saving,
additional power-saving tips on company or product websites and
making consumers aware of the connection between climate change
and power consumption. Additional software and hardware energy-
saving functions and solutions were also rewarded. It is possible that
results for these criteria, particularly relating to information to be found
on websites, may have changed since the survey was undertaken.
Product lifecycle(30 out of the total of 100 points a product can achieve)
Consumer electronics are known for their short and continuously
diminishing lifecycles that are increasing the burden on the
environment. A longer warranty period, designing products that can be
upgraded rather than replaced and making spare parts available long
after the production of the device has been discontinued all help to
encourage consumers to keep using the products longer.
Upgradeability
Products were given points for the extent to which they are
upgradeable by the user, with clear directions on how to upgrade parts
being given in the user manual. For computers, upgradeable parts
included the system memory, the hard drive, the graphics card (GPU),
the processor (CPU) and the optical drive (CD/DVD). Parts that are
usually replaced rather than upgraded (such as fans in computers, for
example) were not included.
For mobile phones and PDAs, upgradeable parts included the battery
and memory cards. In addition, points have been allocated according
to the price of the battery compared with the price of the actual device.
Since the battery usually needs earlier replacement and expensive
batteries are an incentive for the consumer to discard the product
rather than to simply replace the battery. The smaller the percentage
the battery price is of the total price of the device, the more
points awarded.
Monitors are usually not upgradeable. Instead, the manufacturer’s
replacement policy for monitors showing pixel defects have been
analysed and points have been awarded by comparing the company
policy with the ISO standard.
Televisions are not upgradeable, so no points could be awarded.
Instead the overall score for a television’s product lifecycle criterion
was adjusted by a factor of 1.2 to remain consistent with a total of 30
points for this set of criteria.
Warranty
Points were awarded according to the number of years for which
products are under manufacturer warranty on the global market. The
longer the warranty time given by the manufacturer, the less likely it is
that the consumer will have to replace a device before it is outdated.
Availability of spare parts
Similarly to the scoring for warranty, products were awarded points for
every year that a consumer is able to obtain spare parts for a product
after production has ceased. The longer these spare parts are available
the less likely it is that the consumer will dispose of a product rather
than repair it.
Recyclability
Because the recyclability rate is difficult to define and compare
between products, the definition of the European Union Waste
Electrical and Electronic Equipment Directive (WEEE Directive) was
applied. This directive gives a definition of recycling that excludes
energy recovery. Energy recovery is a means of generating energy by
directly incinerating combustible waste, with or without other waste,
and recovering the heat. Indeed, energy recovery from combustion
eliminates the possibility to effectively reuse waste through material
recycling and therefore cannot be considered true recycling. The
directive also demands a legal minimum percentage of recyclability per
weight of the device. Computers, for example, need to be at least 65%
recyclable. Points were awarded according to how much a device
exceeds the legal minimum recyclability rate of the WEEE directive.

Greenpeace International l Green Electronics: the search continues l Results, Green Electronics Survey l December 2008 l 1�
In the 2008 survey, when reviewing the companies’ submissions, we
were confronted by figures claiming recyclability rates that were unlikely
to be matched in practice. Such figures presumably do not take into
account the destruction of certain materials during recovery processes,
for example, discounting some plastics or resins that will be destroyed
during the recovery of metal parts in a smelter. Although smelting of
e-waste is considered a state-of-the-art recycling process for recovering
metals in electronic scrap, the plastics in the scrap (for example, whole
mobile phones or printed circuit boards) are not materially recovered.
Therefore the maximum points that could be obtained from this
criterion were reduced, and additional points were awarded instead if
companies could provide an independent assessment backing up their
recyclability claims.
Use of recycled plastic
Points were awarded for products using significant amounts of recycled
plastics, and additional innovation points were awarded for products
that use mostly post-consumer recycled plastic rather than just post-
industrial recycled plastic. The increased demand for post-consumer
plastic drives the waste collection of these plastics via take-back
practices and encourages toxic elimination in design, in turn making
plastics more easily recyclable. Additionally, recycling saves the energy
embodied in materials, reducing the impacts on greenhouse gas
emissions and climate change.
Coding of plastic parts
Coding plastic parts of electronic products is important to ensure that
they are treated and recycled properly at the end of life of the product.
In many instances only the larger plastic components in a product are
coded. Points were awarded for products that also code plastic parts
weighing less than 25g, the limit usually applied under an ISO standard.
Take-back
The companies’ take-back programmes were analysed to see whether
they focused on individual financial responsibility for the recycling and
disposal of the submitted products in the geographic locations where
they were sold. The better the take-back programme, which must be
cost-free to the consumer or last owner, and the better the information
provided to the consumer about where the products can be returned to
at their end-of-life, the more points were awarded.
Innovation and marketing(10 out of the total of 100 points a product can achieve)
Energy during production
The energy used to manufacture a product is as important to
investigate as the energy it takes to power a device during consumer
use. Reducing energy during production plays an important role in
reducing the impact on natural resources and the climate. Unfortunately,
there is no existing global standard that allows for comparing products
under this category. Therefore, points were awarded to products for
which companies have an energy lifecycle analysis that takes into
account a significant part of the production chain of that particular
product model. Activities that should be included when calculating
the energy taken to make a product include the extraction and
refining of natural resources, production of materials (e.g. plastics), the
manufacturing of parts provided by suppliers, the manufacturing of
parts by the brand owner, the shipping of parts to the assembly facility,
the assembly itself and the distribution of the products to importers and
wholesalers. Points were awarded for each of the major stages included
in the assessment. However, companies that only calculate the energy
of the final assembly stage of production were not awarded any points.
Visibility and promotion
Electronics companies spend huge amounts of money advertising and
promoting their products. The more visible green products are, the
more likely they are going to be purchased by consumers. To determine
this visibility, the amount of website navigation (such as the number of
clicks or drop-down menus) required to reach the specifications of a
product was assessed. The less website navigation needed, the more
points awarded. The average of a number of major websites visited was
used and it is possible that the sites accessed for this assessment have
since changed.
Other innovations
Green innovations going beyond common practices were awarded with
additional points. These include mercury-free and more energy-efficient
LED lights in screens, a significant weight percentage of post-consumer
recycled plastic, zero watt stand-by power use, or manufacturing
extremely light or durable products.
© G
reen
peac
e /
Kat
e D
avis
on

16 l Greenpeace International l Green Electronics: the search continues l Results, Green Electronics Survey l December 2008
The desktop category was dominated by the products from
Fujitsu Siemens and Lenovo, with the Lenovo ThinkCentre
M58/M58p taking first place. The scoring of these products was,
by and large, close throughout all sets of criteria. The special
points awarded to Lenovo for using recycled plastic that is entirely
from post-consumer sources rather than post-industrial made a
significant difference in the final score.
The Esprimo E7935 by Fujitsu Siemens is the leading product when
it comes to use of hazardous chemicals, being the only submitted
product free of beryllium and beryllium compounds (one of the toxic
chemicals groups not currently regulated under RoHS). The Dell
Studio Hybrid and the Hewlett Packard dc7900e USDT make up
the second group of products. The reason why they lag behind the
front runners is due to their much weaker performance under the
chemicals criteria.
The Dell model scores best out of all models when it comes to
energy efficiency and providing the consumers with power-saving
information. The Dell is also awarded with special points for the
very small and light design of the product and the recycling kit that
comes with it. The Acer Veriton M678G falls far behind because of
weak scoring on energy efficiency.
Like last year the recyclability rates reported by the companies
for their products are likely to be significantly overstated and
none provided us with an independent assessment of their
recycling rates.
It is disappointing to note that none of the desktop manufacturers
has yet introduced a product that is PVC or BFR-free.
Annex �: Detailed product line-up
Desktops
CriteriaMaximum
pointsLenovo ThinkCentre
M�8/M�8pFujitsu Siemens ESPRIMO
E��3� E-Star �Dell Studio Hybrid HP dc��00e USDT Acer Veriton M6�8G
Combining greenest parts from products
submittedResults Points Results Points Results Points Results Points Results Points
Chemicals
PVC-free � NO 0 NO 0 NO 0 NO 0 NO 0 0
PVC-containing parts 3 3 1.8 3 1.8 3 1.8 3 1.8 3 1.8 1.8
BFR-free � NO 0 NO 0 NO 0 NO 0 NO 0 0
BFR-containing parts 3 6 0.� 3 � � 1 � 1.� � 1 �
Antimony-free 3 NO 0 NO 0 NO 0 NO 0 NO 0 0
Phthalate-free 3 NO 0 NO 0 NO 0 NO 0 NO 0 0
Beryllium-free 3 NO 0 YES 3 NO 0 NO 0 NO 0 3
RoHS exemptions used 11 3 8 6 � 8 3 8 3 3 8 8
Energy use
Stand-by % better than Energy Star 8 6�.�% 8 3�.0% 6 ��.6% � 3�.8% 6 1�.�% � 8
Sleep % better than Energy Star 8 68.1% 8 ��.6% 8 �6.6% � 3�.0% 6 13.8% � 8
Idle % better than Energy Star 8 1�.1% 3 ��.6% � 61.�% 8 38.3% 6 1�.0% � 8
Inactivity-to-sleep (minutes) 1 �0 1 60 0 1� 1 30 0 30 0 1
Power-saving information � YES 3 YES 3.� YES � YES � YES � �
Lifecycle
Upgradeable parts � � � � � � � � � � � �
Warranty in years � 3 � 3 � 1 1 3 � 1 1 �
Component availability in years � � � � � 3 3 � � 3 3 �
WEEE recyclability rate (%) 3 ��% 3 ��% 3 8�% � �0% 3 ��% 3 3
Independent assessment for recyclability rate provided 1 NO 0 NO 0 NO 0 NO 0 partly 0.� 0.�
Recycled plastic weight % 3 ��% 3 0 0 1�% � 0 0 0 0 3
Plastic part coded at < ��grams 1 NO 0 NO 0 NO 0 NO 0 NO 0 0
Take-back programme and information 3 YES 1 YES 1.� YES � YES 1 YES 1 �
Other
Energy during production analysis 1 NO 0 NO 0 NO 0 NO 0 NO 0 0
Parts of production chain included in assessment 3 0 0 0 0 0 0 0 0 0 0 0
Other special features 3 YES � NO 0 YES � NO 0 NO 0 3
Visibility on web 3 3 1.� 3 1.� �.� 1.�� � 1 �.� 1.�� 1.��
Total adjusted points 10 �.88 �.�3 �.86 �.�3 3.31 �.�1

Greenpeace International l Green Electronics: the search continues l Results, Green Electronics Survey l December 2008 l 1�1�
CriteriaMaximum
pointsLenovo ThinkCentre
M�8/M�8pFujitsu Siemens ESPRIMO
E��3� E-Star �Dell Studio Hybrid HP dc��00e USDT Acer Veriton M6�8G
Combining greenest parts from products
submittedResults Points Results Points Results Points Results Points Results Points
Chemicals
PVC-free � NO 0 NO 0 NO 0 NO 0 NO 0 0
PVC-containing parts 3 3 1.8 3 1.8 3 1.8 3 1.8 3 1.8 1.8
BFR-free � NO 0 NO 0 NO 0 NO 0 NO 0 0
BFR-containing parts 3 6 0.� 3 � � 1 � 1.� � 1 �
Antimony-free 3 NO 0 NO 0 NO 0 NO 0 NO 0 0
Phthalate-free 3 NO 0 NO 0 NO 0 NO 0 NO 0 0
Beryllium-free 3 NO 0 YES 3 NO 0 NO 0 NO 0 3
RoHS exemptions used 11 3 8 6 � 8 3 8 3 3 8 8
Energy use
Stand-by % better than Energy Star 8 6�.�% 8 3�.0% 6 ��.6% � 3�.8% 6 1�.�% � 8
Sleep % better than Energy Star 8 68.1% 8 ��.6% 8 �6.6% � 3�.0% 6 13.8% � 8
Idle % better than Energy Star 8 1�.1% 3 ��.6% � 61.�% 8 38.3% 6 1�.0% � 8
Inactivity-to-sleep (minutes) 1 �0 1 60 0 1� 1 30 0 30 0 1
Power-saving information � YES 3 YES 3.� YES � YES � YES � �
Lifecycle
Upgradeable parts � � � � � � � � � � � �
Warranty in years � 3 � 3 � 1 1 3 � 1 1 �
Component availability in years � � � � � 3 3 � � 3 3 �
WEEE recyclability rate (%) 3 ��% 3 ��% 3 8�% � �0% 3 ��% 3 3
Independent assessment for recyclability rate provided 1 NO 0 NO 0 NO 0 NO 0 partly 0.� 0.�
Recycled plastic weight % 3 ��% 3 0 0 1�% � 0 0 0 0 3
Plastic part coded at < ��grams 1 NO 0 NO 0 NO 0 NO 0 NO 0 0
Take-back programme and information 3 YES 1 YES 1.� YES � YES 1 YES 1 �
Other
Energy during production analysis 1 NO 0 NO 0 NO 0 NO 0 NO 0 0
Parts of production chain included in assessment 3 0 0 0 0 0 0 0 0 0 0 0
Other special features 3 YES � NO 0 YES � NO 0 NO 0 3
Visibility on web 3 3 1.� 3 1.� �.� 1.�� � 1 �.� 1.�� 1.��
Total adjusted points 10 �.88 �.�3 �.86 �.�3 3.31 �.�1
© G
reen
peac
e /
Kat
e D
avis
on

18 l Greenpeace International l Green Electronics: the search continues l Results, Green Electronics Survey l December 2008
Notebook computers
As with desktops, there are two products
in the notebook category that vie for
the top spot, with the Toshiba Portege
R600 winning narrowly over the Hewlett
Packard Elitebook 2530p. While the
Toshiba notebook earns the highest
scores when it comes to avoiding
hazardous chemicals, the Elitebook is
more energy efficient.
Three other products, namely the Lenovo
X300, Dell Latitude E-4200, and the Sony
Vaio Sony VGN-Z11WN/B make it over
the 4 points mark. At the bottom end of
the scale, the Panasonic CF-W7 and Acer
TravelMate 6293 score the lowest points
overall and specifically in the lifecycle set
of criteria.
All but one product earn special
innovation points for using LED displays
that reduce energy consumption and the
use of mercury. While Panasonic’s display
is a conventional LCD, the company
earns innovation points because its
notebook is a “toughbook” that is
extremely durable and can withstand
drops, pressure and spills. Toshiba
gets an additional point for using post–
consumer recycled plastic parts.
CriteriaMaximum
pointsToshiba Portege R600 HP Elitebook ��30p Lenovo X300 Dell Latitude E-��00 Sony VGN-Z11WN/B Panasonic CF-W� Acer TravelMate 6��3
Combining greenest parts from products
submittedResults Points Results Points Results Points Results Points Results Points Results Points Results Points
Chemicals
PVC-free � NO 0 NO 0 NO 0 NO 0 NO 0 NO 0 NO 0 0
PVC-containing parts 3 � �.� 1 3 3 1.8 3 1.8 1 3 1 3 � �.� 3
BFR-free � NO 0 NO 0 NO 0 NO 0 NO 0 NO 0 NO 0 0
BFR-containing parts 3 � 1 6 0.� � 1.� � 1 3 � � 0 � 1 �
Antimony-free 3 NO 0 NO 0 NO 0 NO 0 NO 0 NO 0 NO 0 0
Phthalate-free 3 NO 0 NO 0 NO 0 NO 0 NO 0 NO 0 NO 0 0
Beryllium-free 3 YES 3 NO 0 NO 0 NO 0 YES 3 NO 0 NO 0 3
RoHS exemptions used 11 3 8 � � 6 � � � � 6 � 6 � � 8
Energy use
Stand-by % better than Energy Star 8 �8.�% � �0.0% � �3.�% � ��.�% � 10% � 10% � 3�.3% � �
Sleep % better than Energy Star 8 38.3% 6 31.3% � ��.�% � �0.0% 3 0% 0 �0.8% 3 10.0% � 6
Idle % better than Energy Star 8 3�.1% 6 ��.1% � �1.�% 8 1�.�% � 16.�% 3 �8.6% � 1�.�% � 8
Inactivity-to-sleep (minutes) 1 1� 1 30 0 �� 1 1� 1 �� 1 �0 1 30 0 1
Power-saving information � YES 3 YES � YES � YES 3 YES 3 YES � YES � �
Lifecycle
Upgradeable parts � 1 1 � � 3 3 � � 1 1 1 1 � � �
Warranty in years � 1 1 3 � 1 1 3 � 1 1 1 1 1 1 �
Component availability in years � � � � � � � � � 6 6 � � 3 3 �
WEEE recyclability rate (%) 3 �0% 3 �1% 3 �0% 3 8�% � �0% 3 ��% 1 8�% � 3
Independent assessment for recyclability rate provided 1 NO 0 NO 0 NO 0 NO 0 NO 0 NO 0 partly 0.� 0.�
Recycled plastic weight % 3 8.8% 1 0 0 1% 1 1�% � 0 0 0 0 0 0 �
Plastic part coded at < ��grams 1 NO 0 NO 0 NO 0 NO 0 NO 0 NO 0 NO 0 0
Take-back programme and information 3 YES � YES 1 YES 1 YES � YES � YES 1 YES 1 �
Other
Energy during production analysis 1 YES 1 NO 0 NO 0 NO 0 YES 1 YES 1 NO 0 1
Parts of production chain included in assessment 3 6 3 0 0 0 0 0 0 � �.� � � 0 0 3
Other special features 3 YES 3 YES � YES � YES � YES � YES � YES � 3
Visibility on web 3 3.� 1.�� 3.� 1.�� 3 1.� 3.� 1.�� � 0.� � 1 3 1.� 1.�
Total adjusted points 10 �.�� �.�8 �.68 �.�1 �.�0 3.80 3.�� �.�0

Greenpeace International l Green Electronics: the search continues l Results, Green Electronics Survey l December 2008 l 1�
CriteriaMaximum
pointsToshiba Portege R600 HP Elitebook ��30p Lenovo X300 Dell Latitude E-��00 Sony VGN-Z11WN/B Panasonic CF-W� Acer TravelMate 6��3
Combining greenest parts from products
submittedResults Points Results Points Results Points Results Points Results Points Results Points Results Points
Chemicals
PVC-free � NO 0 NO 0 NO 0 NO 0 NO 0 NO 0 NO 0 0
PVC-containing parts 3 � �.� 1 3 3 1.8 3 1.8 1 3 1 3 � �.� 3
BFR-free � NO 0 NO 0 NO 0 NO 0 NO 0 NO 0 NO 0 0
BFR-containing parts 3 � 1 6 0.� � 1.� � 1 3 � � 0 � 1 �
Antimony-free 3 NO 0 NO 0 NO 0 NO 0 NO 0 NO 0 NO 0 0
Phthalate-free 3 NO 0 NO 0 NO 0 NO 0 NO 0 NO 0 NO 0 0
Beryllium-free 3 YES 3 NO 0 NO 0 NO 0 YES 3 NO 0 NO 0 3
RoHS exemptions used 11 3 8 � � 6 � � � � 6 � 6 � � 8
Energy use
Stand-by % better than Energy Star 8 �8.�% � �0.0% � �3.�% � ��.�% � 10% � 10% � 3�.3% � �
Sleep % better than Energy Star 8 38.3% 6 31.3% � ��.�% � �0.0% 3 0% 0 �0.8% 3 10.0% � 6
Idle % better than Energy Star 8 3�.1% 6 ��.1% � �1.�% 8 1�.�% � 16.�% 3 �8.6% � 1�.�% � 8
Inactivity-to-sleep (minutes) 1 1� 1 30 0 �� 1 1� 1 �� 1 �0 1 30 0 1
Power-saving information � YES 3 YES � YES � YES 3 YES 3 YES � YES � �
Lifecycle
Upgradeable parts � 1 1 � � 3 3 � � 1 1 1 1 � � �
Warranty in years � 1 1 3 � 1 1 3 � 1 1 1 1 1 1 �
Component availability in years � � � � � � � � � 6 6 � � 3 3 �
WEEE recyclability rate (%) 3 �0% 3 �1% 3 �0% 3 8�% � �0% 3 ��% 1 8�% � 3
Independent assessment for recyclability rate provided 1 NO 0 NO 0 NO 0 NO 0 NO 0 NO 0 partly 0.� 0.�
Recycled plastic weight % 3 8.8% 1 0 0 1% 1 1�% � 0 0 0 0 0 0 �
Plastic part coded at < ��grams 1 NO 0 NO 0 NO 0 NO 0 NO 0 NO 0 NO 0 0
Take-back programme and information 3 YES � YES 1 YES 1 YES � YES � YES 1 YES 1 �
Other
Energy during production analysis 1 YES 1 NO 0 NO 0 NO 0 YES 1 YES 1 NO 0 1
Parts of production chain included in assessment 3 6 3 0 0 0 0 0 0 � �.� � � 0 0 3
Other special features 3 YES 3 YES � YES � YES � YES � YES � YES � 3
Visibility on web 3 3.� 1.�� 3.� 1.�� 3 1.� 3.� 1.�� � 0.� � 1 3 1.� 1.�
Total adjusted points 10 �.�� �.�8 �.68 �.�1 �.�0 3.80 3.�� �.�0
© R
ober
t Kno
th /
Gre
enpe
ace

�0 l Greenpeace International l Green Electronics: the search continues l Results, Green Electronics Survey l December 2008
Mobile phones
While only one product scored over 5 points in the 2007
survey, this year three out of the five submitted products reach
the halfway mark. The winner is the Samsung SGH-F268, a
remarkable achievement since last year’s survey when the
Samsung phone was in the last place. It is also the only product
to be free of BFRs, at levels well below the industry standard of
900ppm. The Motorola MOTORAZR V9 scores particularly well in
avoiding hazardous chemicals and is the only product to be free
of beryllium and its compounds. The Nokia 3310 Evolve obtains
the third place; Nokia also submitted the recently released 7200
Supernova, which is the first mobile phone to be free of BFRs
(albeit using a 900ppm limit) but unfortunately scores less than the
Nokia 3110 Evolve overall despite its strong performance under
the hazardous chemicals criteria.
Fourth place goes to the Sony Ericsson, which falls just short of
the 5 points mark. Only the LGE KT520 was declared not to be
PVC-free and it is this performance in chemicals that is likely to
have resulted in its obtaining fifth place, even though there has
been an improvement by LG Electronics in its scoring over the
previous survey. Overall, there has been a significant improvement
with regards to the reduction in RoHS exemptions still being
used by the companies, with only Nokia relying on more than two
exemptions in its products (six in total).
Innovation points were awarded to Motorola, for its very low
threshold for declaring its product to be PVC-free, and to Nokia
for using bio-plastic in the cover of its phone. However, Nokia did
not provide additional information on what type of bio-plastic it
is using or how it is grown and therefore the possible maximum
environmental benefit (and innovation points for this survey) in
using this bio-plastic could not be assessed.
CriteriaMaximum
pointsSamsung SGH-F�68 Motorola MOTORAZR V� Nokia 3110 Evolve Sony Ericsson C�0� LG KT��0
Combining greenest parts from products
submittedResults Points Results Points Results Points Results Points Results Points
Chemicals
PVC-free � YES � YES � YES � YES � NO 0 �
PVC-containing parts 3 n/a n/a n/a n/a n/a n/a n/a n/a 3 1.8 n/a
BFR-free � YES � NO 0 NO 0 NO 0 NO 0 �
BFR-containing parts 3 n/a n/a � �.� 1 3 1 3 � �.� n/a
Antimony-free 3 NO 0 NO 0 NO 0 NO 0 NO 0 0
Phthalate-free 3 NO 0 YES 3 NO 0 NO 0 NO 0 3
Beryllium-free 3 NO 0 YES 3 NO 0 NO 0 NO 0 3
RoHS exemptions used 11 � � � � 6 � � � � � �
Energy use
External adapter efficiency % better than Energy Star 1� �.�3% � �.8�% 1 �.��% � 0% 0 0.��% 0 �
No-load % better than Energy Star 1� 66.�% 1� 86.�% 1� �0% 1� 66.�% 1� 66.�% 1� 1�
Shipped with power-saving enabled 1 YES 1 YES 1 YES 1 YES 1 YES 1 1
Power-saving information � YES 3 YES �.� YES � YES 3 YES 3 �
Lifecycle
Upgradeable parts 1 � 1 � 1 � 1 � 1 � 1 1
Battery vs. unit costs � 6% � 10% 3 ��% 0 8% 3 10% 3 �
Warranty in years � 1 1 1 1 � 3 1 1 1 1 3
Components availability in years � 3 3 � � � � 3 3 3 3 �
WEEE recyclability rate (%) 3 8�% � 6�% 0 6�% 0 ��% 1 8�.1% � �
Independent assessment for recyclability rate provided 1 NO 0 NO 0 NO 0 NO 0 No 0 0
Recycled plastic weight % 3 0 0 0 0 0 0 0 0 0 0 0
Plastic part coded at < ��grams 1 YES 1 YES 1 YES 1 YES 1 YES 1 1
Take-back programme and information 3 YES � YES � YES � YES 1 YES � �
Other
Energy during production analysis 1 YES 1 NO 0 YES 1 YES 1 YES 1 1
Parts of production chain included in assessment 3 � �.� 0 0 6 3 6 3 3 1.� 3
Other special features 3 NO 0 YES � YES 1 NO 0 NO 0 3
Visibility on web 3 � 1 � 1 � 1 �.� 1.�� 3.� 1.�� 1.��
Total adjusted points 10 �.�� �.�0 �.00 �.88 �.61 �.18

Greenpeace International l Green Electronics: the search continues l Results, Green Electronics Survey l December 2008 l �1
CriteriaMaximum
pointsSamsung SGH-F�68 Motorola MOTORAZR V� Nokia 3110 Evolve Sony Ericsson C�0� LG KT��0
Combining greenest parts from products
submittedResults Points Results Points Results Points Results Points Results Points
Chemicals
PVC-free � YES � YES � YES � YES � NO 0 �
PVC-containing parts 3 n/a n/a n/a n/a n/a n/a n/a n/a 3 1.8 n/a
BFR-free � YES � NO 0 NO 0 NO 0 NO 0 �
BFR-containing parts 3 n/a n/a � �.� 1 3 1 3 � �.� n/a
Antimony-free 3 NO 0 NO 0 NO 0 NO 0 NO 0 0
Phthalate-free 3 NO 0 YES 3 NO 0 NO 0 NO 0 3
Beryllium-free 3 NO 0 YES 3 NO 0 NO 0 NO 0 3
RoHS exemptions used 11 � � � � 6 � � � � � �
Energy use
External adapter efficiency % better than Energy Star 1� �.�3% � �.8�% 1 �.��% � 0% 0 0.��% 0 �
No-load % better than Energy Star 1� 66.�% 1� 86.�% 1� �0% 1� 66.�% 1� 66.�% 1� 1�
Shipped with power-saving enabled 1 YES 1 YES 1 YES 1 YES 1 YES 1 1
Power-saving information � YES 3 YES �.� YES � YES 3 YES 3 �
Lifecycle
Upgradeable parts 1 � 1 � 1 � 1 � 1 � 1 1
Battery vs. unit costs � 6% � 10% 3 ��% 0 8% 3 10% 3 �
Warranty in years � 1 1 1 1 � 3 1 1 1 1 3
Components availability in years � 3 3 � � � � 3 3 3 3 �
WEEE recyclability rate (%) 3 8�% � 6�% 0 6�% 0 ��% 1 8�.1% � �
Independent assessment for recyclability rate provided 1 NO 0 NO 0 NO 0 NO 0 No 0 0
Recycled plastic weight % 3 0 0 0 0 0 0 0 0 0 0 0
Plastic part coded at < ��grams 1 YES 1 YES 1 YES 1 YES 1 YES 1 1
Take-back programme and information 3 YES � YES � YES � YES 1 YES � �
Other
Energy during production analysis 1 YES 1 NO 0 YES 1 YES 1 YES 1 1
Parts of production chain included in assessment 3 � �.� 0 0 6 3 6 3 3 1.� 3
Other special features 3 NO 0 YES � YES 1 NO 0 NO 0 3
Visibility on web 3 � 1 � 1 � 1 �.� 1.�� 3.� 1.�� 1.��
Total adjusted points 10 �.�� �.�0 �.00 �.88 �.61 �.18
© G
reen
peac
e /
Kat
e D
avis
on
�� l Greenpeace International l Green Electronics: the search continues l Results, Green Electronics Survey l December 2008
Smart phones/PDAs
With its 6210 Navigator, Nokia is the clear winner in the smart
phone/PDA category. While it scores less than the winning mobile
phone it is the best scoring PDA mainly because it is the most
energy efficient and Nokia provides a lot of information to its
customers on how to save power.
Second place goes to the Sony Ericsson G900, which did
particularly well in the chemicals category. The Hewlett Packard
iPAQ910 is third, while the Blackberry Pearl 8310 is the only
phone whose power supply does not meet the new Energy Star
requirements.
No special points were awarded in this product category. It should
be pointed out that, for phones and PDAs, no real independent
assessments of the claimed recyclability rates were provided. The
recyclability rates provided fluctuate widely and it is likely that some
are overly optimistic.
When combining the best scores for each set of criteria it becomes
obvious that, while the currently-achievable score is lower than
for mobile phones, companies should be able to already produce
PDAs that score significantly higher than at present.
Criteria Maximum points Nokia 6�10 Navigator Sony Ericsson G�00 HP iPAQ �10 RIM Blackberry Pearl 8130 Combining greenest parts from products
submittedResults Points Results Points Results Points Results Points
Chemicals
PVC-free � YES � YES � NO 0 NO 0 �
PVC-containing parts 3 n/a n/a n/a n/a � 1.� 1 3 n/a
BFR-free � NO 0 NO 0 NO 0 NO 0 0
BFR-containing parts 3 1 3 � �.� � 1.� 1 3 3
Antimony-free 3 NO 0 NO 0 NO 0 YES 3 3
Phthalate-free 3 YES 3 NO 0 NO 0 NO 0 3
Beryllium-free 3 NO 0 NO 0 NO 0 NO 0 0
RoHS exemptions used 11 6 � � � � � 6 � �
Energy use
External adapter efficiency % better than Energy Star 1� �.��% � 0% 0 3.�6% 1 -�.�% 0 �
No-load % better than Energy Star 1� �0% 1� 66.�% 1� �6.�% 1� �0% 8 1�
Shipped with power-saving enabled 1 YES 1 YES 1 YES 1 YES 1 1
Power-saving information � YES � YES 3 YES 1 YES 1.� �
Lifecycle
Upgradeable parts 1 � 1 � 1 � 1 � 1 1
Battery vs. unit costs � 13% � �% 3 10% 3 10% 3 3
Warranty in years � � 3 1 1 1 1 1 1 3
Components availability in years � � � 3 3 � � 3 3 �
WEEE recyclability rate (%) 3 80% � ��% 1 �1.�% 3 6�% 0 3
Independent assessment for recyclability rate provided 1 NO 0 NO 0 NO 0 NO 0 0
Recycled plastic weight % 3 0 0 0 0 0 0 0 0 0
Plastic part coded at < ��grams 1 YES 1 YES 1 NO 0 YES 1 1
Take-back programme and information 3 YES � YES 1 YES 1 NO 0 �
Other
Energy during production analysis 1 NO 0 YES 1 NO 0 NO 0 1
Parts of production chain included in assessment 3 0 0 6 3 0 0 0 0 3
Other special features 3 NO 0 NO 0 NO 0 NO 0 0
Visibility on web 3 � 1 3 1.� 3.� 1.�� 3 1.� 1.�
Total adjusted points 10 �.�0 �.80 �.�0 3.�0 6.��

Greenpeace International l Green Electronics: the search continues l Results, Green Electronics Survey l December 2008 l �3
Criteria Maximum points Nokia 6�10 Navigator Sony Ericsson G�00 HP iPAQ �10 RIM Blackberry Pearl 8130 Combining greenest parts from products
submittedResults Points Results Points Results Points Results Points
Chemicals
PVC-free � YES � YES � NO 0 NO 0 �
PVC-containing parts 3 n/a n/a n/a n/a � 1.� 1 3 n/a
BFR-free � NO 0 NO 0 NO 0 NO 0 0
BFR-containing parts 3 1 3 � �.� � 1.� 1 3 3
Antimony-free 3 NO 0 NO 0 NO 0 YES 3 3
Phthalate-free 3 YES 3 NO 0 NO 0 NO 0 3
Beryllium-free 3 NO 0 NO 0 NO 0 NO 0 0
RoHS exemptions used 11 6 � � � � � 6 � �
Energy use
External adapter efficiency % better than Energy Star 1� �.��% � 0% 0 3.�6% 1 -�.�% 0 �
No-load % better than Energy Star 1� �0% 1� 66.�% 1� �6.�% 1� �0% 8 1�
Shipped with power-saving enabled 1 YES 1 YES 1 YES 1 YES 1 1
Power-saving information � YES � YES 3 YES 1 YES 1.� �
Lifecycle
Upgradeable parts 1 � 1 � 1 � 1 � 1 1
Battery vs. unit costs � 13% � �% 3 10% 3 10% 3 3
Warranty in years � � 3 1 1 1 1 1 1 3
Components availability in years � � � 3 3 � � 3 3 �
WEEE recyclability rate (%) 3 80% � ��% 1 �1.�% 3 6�% 0 3
Independent assessment for recyclability rate provided 1 NO 0 NO 0 NO 0 NO 0 0
Recycled plastic weight % 3 0 0 0 0 0 0 0 0 0
Plastic part coded at < ��grams 1 YES 1 YES 1 NO 0 YES 1 1
Take-back programme and information 3 YES � YES 1 YES 1 NO 0 �
Other
Energy during production analysis 1 NO 0 YES 1 NO 0 NO 0 1
Parts of production chain included in assessment 3 0 0 6 3 0 0 0 0 3
Other special features 3 NO 0 NO 0 NO 0 NO 0 0
Visibility on web 3 � 1 3 1.� 3.� 1.�� 3 1.� 1.�
Total adjusted points 10 �.�0 �.80 �.�0 3.�0 6.��
© R
ober
t Kno
th /
Gre
enpe
ace

�� l Greenpeace International l Green Electronics: the search continues l Results, Green Electronics Survey l December 2008
Televisions
This is the first time that televisions, both plasma and LCD
screens, are included in this survey, and all major manufacturers
with the exception of Samsung decided to submit products. LG
Electronics pulled the submission of its soon-to-be-released LCD
model when the product release timeline was delayed past the
publication and release timeline of this survey.
The Sharp LC-52GX5 is the highest scoring product due to its
superior performance under the hazardous chemicals criteria.
It is the only product that avoids all uses of beryllium and its
compounds and only uses BFRs and PVC in one major product
component (printed wiring board laminates and antenna cable,
respectively). It also receives an innovation half point for plant-
based paint. The Sony KDL-32JE1 earns second place, gaining
innovation points for using recycled plastic in 50% of plastic parts
by weight. The Sharp and the Sony TVs only are available on the
Japanese market. Even though it does not break the 5-points
barrier, the Panasonic TH-42PZ800U plasma is not far behind and
gains innovation points for having a mercury and lead-free display.
While it is realistic that large products such as televisions have a
higher recyclability rate than smaller mobile phones, the recyclability
rates claimed by companies seem to be higher than what is
achievable. Sharp has a very high recycling rate and claims to have
worked with an independent organisation to verify this rate. This is
a step in the right direction but the recyclability rate reported still
seems to be higher than what might actually be achievable.
Because televisions are usually not consumer upgradeable, only
25 points were available in the lifecycle set of criteria instead
of the 30 available in other product categories. Therefore, the
calculation of points was adjusted to a total of 30, in order to keep
with the 10-point scale ranking.
Criteria Maximum points Sharp LC-��GX� SONY KDL-3�JE1 Panasonic TH-��PZ800U PlasmaCombining
greenest parts from products
submittedResults Points Results Points Results Points
Chemicals
PVC-free � NO 0 NO 0 NO 0 0
PVC-containing parts 3 1 3 1 3 � �.� 3
BFR-free � NO 0 NO 0 NO 0 0
BFR-containing parts 3 1 3 � �.� � 1.� 3
Antimony-free 3 NO 0 NO 0 NO 0 0
Phthalate-free 3 NO 0 NO 0 NO 0 0
Beryllium-free 3 YES 3 NO 0 NO 0 3
RoHS exemptions used 11 � � 6 � � � �
Energy use
On-mode % better than Energy Star 1� 3�.3% 8 �3.8% � 10.�% � 8
Stand-by % better than Energy Star 1� �0.0% 1� 8�.0% 1� 80.0% 1� 1�
Hard-off switch 1 NO 0 NO 0 YES 1 1
Power-saving information � YES � YES 3 YES � 3
Lifecycle*
Warranty in years � 1 1 1 1 1 1 1
Components availability in years � 8 � 8 � 8 � �
WEEE recyclability rate (%) 3 ��% 3 �0% 3 �6% 3 3
Independent assessment for recyclability rate provided 1 Partly 0.� NO 0 NO 0 0.�
Recycled plastic weight % 3 3.�% 1 �0% 3 <1% 0 3
Plastic part coded at < ��grams 1 NO 0 YES 1 NO 0 1
Take-back programme and information 3 YES 1 YES � YES 1 �
Other
Energy during production analysis 1 YES 1 YES 1 Yes 1 1
Parts of production chain included in assessment 3 6 3 � �.� � � 3
Other special features 3 YES 0.� YES � YES 1.� 3
Visibility on web 3 � 0.� � � �.� 0.�� �
Total adjusted points 10 �.�� �.8� �.�6 �.�0

Greenpeace International l Green Electronics: the search continues l Results, Green Electronics Survey l December 2008 l ��
Criteria Maximum points Sharp LC-��GX� SONY KDL-3�JE1 Panasonic TH-��PZ800U PlasmaCombining
greenest parts from products
submittedResults Points Results Points Results Points
Chemicals
PVC-free � NO 0 NO 0 NO 0 0
PVC-containing parts 3 1 3 1 3 � �.� 3
BFR-free � NO 0 NO 0 NO 0 0
BFR-containing parts 3 1 3 � �.� � 1.� 3
Antimony-free 3 NO 0 NO 0 NO 0 0
Phthalate-free 3 NO 0 NO 0 NO 0 0
Beryllium-free 3 YES 3 NO 0 NO 0 3
RoHS exemptions used 11 � � 6 � � � �
Energy use
On-mode % better than Energy Star 1� 3�.3% 8 �3.8% � 10.�% � 8
Stand-by % better than Energy Star 1� �0.0% 1� 8�.0% 1� 80.0% 1� 1�
Hard-off switch 1 NO 0 NO 0 YES 1 1
Power-saving information � YES � YES 3 YES � 3
Lifecycle*
Warranty in years � 1 1 1 1 1 1 1
Components availability in years � 8 � 8 � 8 � �
WEEE recyclability rate (%) 3 ��% 3 �0% 3 �6% 3 3
Independent assessment for recyclability rate provided 1 Partly 0.� NO 0 NO 0 0.�
Recycled plastic weight % 3 3.�% 1 �0% 3 <1% 0 3
Plastic part coded at < ��grams 1 NO 0 YES 1 NO 0 1
Take-back programme and information 3 YES 1 YES � YES 1 �
Other
Energy during production analysis 1 YES 1 YES 1 Yes 1 1
Parts of production chain included in assessment 3 6 3 � �.� � � 3
Other special features 3 YES 0.� YES � YES 1.� 3
Visibility on web 3 � 0.� � � �.� 0.�� �
Total adjusted points 10 �.�� �.8� �.�6 �.�0
© G
reen
peac
e /
Kat
e D
avis
on

�6 l Greenpeace International l Green Electronics: the search continues l Results, Green Electronics Survey l December 2008
Computer monitors
The highest-scoring product across all product categories is a
monitor. The Lenovo L2440x wide is the first computer monitor to
be free of PVC and BFRs, albeit using a limit of 900ppm chlorine
and bromine. It is also free of beryllium, phthalates and antimony.
Its weakest link in a very strong chemicals score is the five RoHS
exemptions it still uses. It almost reaches the 7-points mark and is
far ahead if its competitors.
The Fujitsu Siemens SCENICVIEW P22W-5 Eco is the runner-up
and scores special points for zero watt power use in sleep and off
modes. It is also the only model equipped with a hard-off switch.
The Samsung 2443BW reaches third place and together with
the LG Electronics W2252TE exceeds the Energy Star minimum
qualification criteria by 50% in most power modes. Three models,
the winning Lenovo, the HP L1950 in fifth place and the Dell
E2009W in sixth, get innovation points for using significant (at
least 20%) post-consumer plastic sources. The Lenovo also uses
LED backlights.
CriteriaMaximum
pointsLenovo L���0x wide
Fujitsu Siemens SCENICVIEW P��W-� ECO
Samsung ���3BW LG W����TE HP L1��0g Dell E�00�W Acer V1��HQCombining greenest
parts from products submittedResults Points Results Points Results Points Results Points Results Points Results Points Results Points
Chemicals
PVC-free � YES � NO 0 NO 0 NO 0 NO 0 NO 0 NO 0 �
PVC-containing parts 3 n/a n/a 3 1.8 � �.� � �.� 3 1.8 3 1.8 � �.� n/a
BFR-free � YES � NO 0 NO 0 NO 0 NO 0 NO 0 NO 0 �
BFR-containing parts 3 n/a n/a 3 � � �.� 3 � 1 3 � �.� � �.� n/a
Antimon-free 3 YES 3 NO 0 NO 0 NO 0 NO 0 NO 0 NO 0 3
Phthalate-free 3 YES 3 NO 0 NO 0 NO 0 NO 0 NO 0 NO 0 3
Beryllium-free 3 YES 3 YES 3 NO 0 NO 0 NO 0 NO 0 YES 3 3
RoHS exemptions used 11 � 6 � � � � � � 8 3 6 � 6 � �
Energy use
On-mode % better than Energy star 8 ��.6% � 33.�% � �6.1% � ��.�% 8 �3.8% � �8.0% � ��.8% � 8
Sleep-mode % better than Energy Star 8 ��.�% 8no energy
use8 �0% 8 8�.0% 8 68% 8 6�.�% 8 66.�% 8 8
Off-mode % better than Energy Star 8 60% 8no energy
use8 �0% 8 �0.0% 8 ��% 6 �3% 8 ��.0% � 8
Hard-off switch 1 NO 0 YES 1 NO 0 NO 0 NO 0 NO 0 NO 0 1
Power-saving information � YES � YES �.� YES � YES 3 YES 3.� YES � YES 1 3.�
Lifecycle
Pixel defect warranty (months) n/a 36 n/a 36 n/a 6 n/a 1� n/a 36 n/a 36 n/a 1� n/a n/a
Pixel defects replacement policy (bright, dark, sub) � 3,6,6 3 1,�,� � 0,3.0 3 1,�,� 1 1,1,3 � 6,6,n/a 0 6, n/a, n/a 0 �
Warranty in years � 3 � 3 � 1 1 � 3 3 � 3 � 1 1 �
Components availabillity in years � � � � � � � � � � � � � 3 3 �
WEEE recyclability rate (%) 3 �0% 3 ��% 3 81% � �1% 3 ��% 3 8�% � ��% 3 3
Independent assessment for recyclability rate provided 1 NO 0 NO 0 NO 0 NO 0 NO 0 NO 0 partly 0.� 0.�
Recycled plastic weight % 3 �8 3 0 0 �0 3 8.� 1 �� 3 �8 3 0 0 3
Plastic part coded at < ��grams 1 NO 0 NO 0 NO 0 NO 0 NO 0 NO 0 NO 0 0
Take-back programme and information 3 YES 1 YES 1.� YES � YES � YES 1 YES � YES 1 �
Other
Energy in production tracked? 1 NO 0 NO 0 YES 1 YES 1 NO 0 NO 0 NO 0 1
Parts of production chain included? 3 0 0 0 0 � �.� � � 0 0 0 0 0 0 �.�
Other special features 3 YES 3 YES � YES 0 NO 0 YES � YES � NO 0 3
Visibility on web 3 � 1 3 1.� � 0.� � 1 � 0.� � 1 3 1.� 1.�
Total adjusted points 10 6.�0 6.33 �.8� �.�� �.�8 �.13 �.�� 8.60

Greenpeace International l Green Electronics: the search continues l Results, Green Electronics Survey l December 2008 l ��
CriteriaMaximum
pointsLenovo L���0x wide
Fujitsu Siemens SCENICVIEW P��W-� ECO
Samsung ���3BW LG W����TE HP L1��0g Dell E�00�W Acer V1��HQCombining greenest
parts from products submittedResults Points Results Points Results Points Results Points Results Points Results Points Results Points
Chemicals
PVC-free � YES � NO 0 NO 0 NO 0 NO 0 NO 0 NO 0 �
PVC-containing parts 3 n/a n/a 3 1.8 � �.� � �.� 3 1.8 3 1.8 � �.� n/a
BFR-free � YES � NO 0 NO 0 NO 0 NO 0 NO 0 NO 0 �
BFR-containing parts 3 n/a n/a 3 � � �.� 3 � 1 3 � �.� � �.� n/a
Antimon-free 3 YES 3 NO 0 NO 0 NO 0 NO 0 NO 0 NO 0 3
Phthalate-free 3 YES 3 NO 0 NO 0 NO 0 NO 0 NO 0 NO 0 3
Beryllium-free 3 YES 3 YES 3 NO 0 NO 0 NO 0 NO 0 YES 3 3
RoHS exemptions used 11 � 6 � � � � � � 8 3 6 � 6 � �
Energy use
On-mode % better than Energy star 8 ��.6% � 33.�% � �6.1% � ��.�% 8 �3.8% � �8.0% � ��.8% � 8
Sleep-mode % better than Energy Star 8 ��.�% 8no energy
use8 �0% 8 8�.0% 8 68% 8 6�.�% 8 66.�% 8 8
Off-mode % better than Energy Star 8 60% 8no energy
use8 �0% 8 �0.0% 8 ��% 6 �3% 8 ��.0% � 8
Hard-off switch 1 NO 0 YES 1 NO 0 NO 0 NO 0 NO 0 NO 0 1
Power-saving information � YES � YES �.� YES � YES 3 YES 3.� YES � YES 1 3.�
Lifecycle
Pixel defect warranty (months) n/a 36 n/a 36 n/a 6 n/a 1� n/a 36 n/a 36 n/a 1� n/a n/a
Pixel defects replacement policy (bright, dark, sub) � 3,6,6 3 1,�,� � 0,3.0 3 1,�,� 1 1,1,3 � 6,6,n/a 0 6, n/a, n/a 0 �
Warranty in years � 3 � 3 � 1 1 � 3 3 � 3 � 1 1 �
Components availabillity in years � � � � � � � � � � � � � 3 3 �
WEEE recyclability rate (%) 3 �0% 3 ��% 3 81% � �1% 3 ��% 3 8�% � ��% 3 3
Independent assessment for recyclability rate provided 1 NO 0 NO 0 NO 0 NO 0 NO 0 NO 0 partly 0.� 0.�
Recycled plastic weight % 3 �8 3 0 0 �0 3 8.� 1 �� 3 �8 3 0 0 3
Plastic part coded at < ��grams 1 NO 0 NO 0 NO 0 NO 0 NO 0 NO 0 NO 0 0
Take-back programme and information 3 YES 1 YES 1.� YES � YES � YES 1 YES � YES 1 �
Other
Energy in production tracked? 1 NO 0 NO 0 YES 1 YES 1 NO 0 NO 0 NO 0 1
Parts of production chain included? 3 0 0 0 0 � �.� � � 0 0 0 0 0 0 �.�
Other special features 3 YES 3 YES � YES 0 NO 0 YES � YES � NO 0 3
Visibility on web 3 � 1 3 1.� � 0.� � 1 � 0.� � 1 3 1.� 1.�
Total adjusted points 10 6.�0 6.33 �.8� �.�� �.�8 �.13 �.�� 8.60
© G
reen
peac
e /
Kat
e D
avis
on

Greenpeace InternationalOttho Heldringstraat 51066 AZ AmsterdamThe NetherlandsTel: +31 20 7182000Fax: +31 20 7182002
greenpeace.org
Greenpeace is an independent global campaigning organisation that acts to change attitudes and behaviour, to protect and conserve the environment and to promote peace.