green star financial transparency (july 2016) research paper · the green star financial...
TRANSCRIPT

Green Star Financial
Transparency
(July 2016)
Research paper
Green Star Financial Transparency (July 2016) / Research paper -- 2
Updated: 10 August 2016
Document Information
CONTACT FOR ENQUIRIES
If you have any questions regarding this document, please contact:
Helen Bell Senior Manager Research E [email protected] M 0414 714 191
PRINTING
Document is stored and controlled in electronic format. Uncontrolled if printed.
RECORD OF CHANGES
Version Date Author Nature of Amendment
0.1 Draft 2/06/2016 Helen Bell Initial draft
0.2 Draft 6/06/2016 Helen Bell Added dollar figures, expanded industrial comments based on GSAPs’ feedback
0.3 Draft 11/07/2016 Helen Bell Incorporated Green Star Steering Committee comments
0.4 Draft 21/07/2016 Karen Jamal Final edit
CONTRIBUTORS
Helen Bell Senior Manager Research Karl Desai Technical Manager Jorge Chapa Head of Market Transformation Karen Jamal Communications Consultant
The GBCA would like to thank those who contributed to this research by providing project information and reviewing the draft research paper.

Green Star Financial Transparency (July 2016) / Research paper -- 3
Updated: 10 August 2016
USE OF TRADEMARKS
All third-party trademarks are the property of their respective owners. All third-party trademarks referenced in this document are used in an editorial fashion and not to the detriment of the trademark holders.
INTELLECTUAL PROPERTY RIGHTS & CONFIDENTIALITY
© Copyright Green Building Council of Australia, 2016.
This document and the information it contains are confidential to Green Building Council of Australia.
No part of this document or the information contained within it may be (a) used for any purpose other than that stated within this document by the recipient; or (b) reproduced, transmitted or translated in any form or by any means, electronic, mechanical, manual, optical or otherwise, without prior written permission of Green Building Council of Australia.

Green Star Financial Transparency (July 2016) / Research paper -- 4
Updated: 10 August 2016
Table of Contents
Document Information 2
Introduction 5
Limitations 5
Sample 6
Methodology 7
Findings 7
Next steps 12
Appendix A: Financial transparency innovation challenge 13

Green Star Financial Transparency (July 2016) / Research paper -- 5
Updated: 10 August 2016
Introduction
The Green Star Financial Transparency Innovation Challenge was launched in 2014, with the aim of increasing the information available to industry on the costs and benefits of sustainable building.
By the end of June 2016, 30 Green Star projects had been awarded this Innovation Challenge for the design and/or construction of their building [1]. This initial research paper is based on the analysis of the data in those 30 project submissions. The initial research paper will be updated annually, becoming more valuable as the sample grows. As more projects take up the Innovation Challenge, the GBCA will be able to provide more reliable breakdowns of the cost of Green Star by rating tool and by Green Star rating.
To claim the Innovation Challenge, Green Star project teams complete a template that includes an itemised estimate of any additional cost incurred through the application of Green Star, on a credit-by-credit basis. The templates are accompanied by a statement of support from a quantity surveyor, project manager or Green Star Accredited Professional (GSAP) from the project.
The cost of Green Star is defined as the additional cost to a project as a result of targeting a Green Star rating. This includes:
the cost of documenting the credits and compiling the submission;
the certification fee (paid to the GBCA); and
any additional implementation cost (see break out box for definitions).
Documentation Cost – the cost being charged to the Applicant associated with documenting each specific credit. This only includes work that had to be undertaken in addition to what would have been done for the project as a base requirement, had it not been seeking a Green Star rating. As an example, in the Materials category there may be an additional cost for documenting the type of timber used.
Implementation Cost – the cost being charged to the Applicant for implementing the specific credit. This only includes the additional cost of materials and installation (implementation) that had to be undertaken to comply with the credit beyond what would have been done for the project as a base requirement, had it not been seeking a Green Star rating. As an example, in the Materials category there may be an additional cost for the timber used. If the timber used costs $25 per metre and the timber that would otherwise have been used costs $20, the cost recorded would be $5 x the total number of metres of timber on the project.
Limitations
It is difficult to isolate the cost of Green Star, as projects do not usually provide financial estimates for a non-Green Star alternative. Therefore, costs must be estimated to achieve the Financial Transparency Innovation Challenge. While the credit requires a justification for the estimates, they remain estimates only.
[1] There were 31 submissions, however one was excluded from this analysis as it had achieved the credit for both a Green Star Design and an As Built
rating.

Green Star Financial Transparency (July 2016) / Research paper -- 6
Updated: 10 August 2016
The data in this report can only be used as a guide. It is only a reflection of the estimated costs for the projects in the sample. All projects are unique. They vary in size, location and complexity. Within each project there are also multiple pathways to achieving a Green Star rating – even more so now with the uptake of Green Star Design & As Built. Project teams choose pathways based on the best value for their particular project in a holistic way, rather than using the cheapest option. As an example, for one project the end of trip facilities cost $50,000 to implement, making it a relatively ‘expensive’ credit to achieve, however these were something that was valuable to the building’s tenants and its owner. This report does not provide any insights into value judgements.
There are also variations (by owner and by sector) in what are considered to be the base case scenarios; these are not accounted for in the results. As an example, one owner might consider the specification of a certain material to be business as usual (not an additional cost), whereas another developer may have to upgrade to meet the credit and this would show an additional cost.
The sample size within each sector is small, therefore the results should be treated with caution.
Sample
Projects from across the suite of Green Star rating tools are included. Table 1 shows the breakdown of projects by rating tool and Green Star rating achieved. There was at least one project from every state.
TABLE 1
Number of Green Star projects in the sample
Sector 4 star 5 star 6 star Total
Custom (hotels, restaurants, supermarkets etc.) 1 1
Design & As Built 2 1 3
Education 1 1 1 3
Industrial 2 2
Multi Unit Residential 1 3 1 5
Office 5 6 11
Public Building 1 2 3
Retail 1 1 2
Grand Total 3 15 12 30
In addition to the projects awarded the Financial Transparency Innovation Challenge for design and construction, there have been five interiors projects (a mix of Green Star – Interiors PILOT, Interiors v1 and Office Interiors), three Green Star – Performance projects and one Green Star – Communities project that have been awarded the Financial Transparency Innovation Challenge.

Green Star Financial Transparency (July 2016) / Research paper -- 7
Updated: 10 August 2016
The sample in these rating tools remains too small for inclusion in this research paper, however we will watch these with a view to including them in the next edition.
Methodology
The cost of Green Star is based on data taken from the Financial Transparency Innovation Challenge submissions. Initially, the average cost was calculated as a percentage of the project cost by taking the total cost of Green Star and dividing it by the total project cost. This was amended, based on industry feedback, to account for project size. The total project cost has been divided by the gross floor area (GFA) to calculate an average cost per square metre. The average cost of Green Star is calculated by taking the average cost of Green Star per square metre and dividing it by the average project cost per square metre, thus the costs have been normalised by project area. The results should be treated with caution as the sample size is small. The sample size is noted in each of the tables.
There was a large range in the average project cost per square metre and in the cost of Green Star, particularly across sectors (industrial projects have the lowest cost per square metre, while public buildings have the highest). To ensure confidentiality, minimum and maximum project costs have not been provided as the small sample means it may have been possible to identify projects based on the data.
Findings
On average, developers/building owners are achieving Green Star ratings with 3 per cent of their overall project budgets.
The data shows that Green Star projects can be delivered for less than one per cent of the overall project budget. On average, projects are spending an additional:
1.5% per square metre to achieve a 4 Star Green Star rating
2.7% per square metre to achieve a 5 Star Green Star rating
3.2% per square metre to achieve a 6 Star Green Star rating
TABLE 2
Cost of Green Star per square metre and as a percentage of the overall project cost, by Green Star rating achieved
Green Star rating Project cost per m2 $AUD
Green Star cost per m2 $AUD
Green Star cost per m2 (%)
Sample size
4 Star 3020 45 1.5% 3
5 Star 3536 96 2.7% 15
6 Star 4588 147 3.2% 12
Total 3905 111 2.9% 30

Green Star Financial Transparency (July 2016) / Research paper -- 8
Updated: 10 August 2016
TABLE 3
Cost of Green Star per square metre and as a percentage of the overall project cost, by sector
Sector Project cost per m2 $AUD
Green Star cost per m2 $AUD
Green Star cost per m2 (%)
Sample size
Custom 1866 84 4.5% 1
Design & As Built 4643 164 3.5% 3
Education 5130 25 0.5% 3
Industrial 825 86 10.4% 2
Multi-Unit Residential 3779 150 4.0% 5
Office 3241 58 1.8% 11
Public Building 7282 343 4.7% 3
Retail 3962 53 1.3% 2
Total 3905 111 2.9% 30
The total cost of Green Star varies by sector. The industrial sector (based on two projects) stands out as having a much higher cost than in other sectors. This could be associated with the industrial sector having a low starting point for what would be delivered as a base case scenario, relative to other building types, particularly education and office. This means many of the components that are considered additional and thus included as a cost of Green Star are business as usual in other sectors, such as the office market. The project cost per square metre is also relatively low for industrial projects. The bulk of the cost of Green Star in the industrial sector was in implementation (see Table 6 for a breakdown of these costs).
In those two industrial projects, the big additional costs were solar systems, upgraded lighting (to LED) and water (tanks and treatment). These are all items that will lead to a decrease in operating costs. There were also credits targeted that would provide a direct benefit to the users, including cyclist facilities, noise reduction in break rooms and indoor plants.
BREAKING DOWN THE COST OF GREEN STAR
The documentation cost and Green Star certification fee combined account for an average of 0.7 per cent of the total project budget, or $208,000. The implementation cost accounts for an average of 2.2 per cent of the project budget, or $1.46 million. The dollar figures for the average cost of Green Star by sector (shown in Table 6) must be treated with caution as the sample sizes are small and the projects vary in size, design and complexity.

Green Star Financial Transparency (July 2016) / Research paper -- 9
Updated: 10 August 2016
TABLE 4
Breakdown of the average cost of Green Star per square metre, by rating achieved, as a percentage of the project budget
Green Star rating Green Star implementation per m2
Green Star documentation & certification per m2
Total Green Star cost per m2
Sample size
4 Star 0.7% 0.7% 1.5% 3
5 Star 2.4% 0.4% 2.7% 15
6 Star 2.2% 1.0% 3.2% 12
Total 2.2% 0.7% 2.9% 30
Note, the totals do not always add up due to rounding.
TABLE 5
Breakdown of the total average cost of Green Star per square metre, by rating achieved, $AUD
Green Star rating Green Star implementation per m2 $AUD
Green Star documentation & certification per m2 $AUD
Total Green Star cost per m2 $AUD
Sample size
4 Star 22 22 45 3
5 Star 84 13 96 15
6 Star 102 45 147 12
Total 85 26 111 30

Green Star Financial Transparency (July 2016) / Research paper -- 10
Updated: 10 August 2016
TABLE 6
Breakdown of the total average cost of Green Star, by rating achieved, $AUD
Green Star rating Green Star implementation $AUD
Green Star documentation & certification $AUD
Total cost of Green Star $AUD
Sample size
4 Star 163,200 229,339 392,539 3
5 Star 1,355,812 184,606 1,532,418 15
6 Star 1,915,816 232,801 2,148,617 12
Total 1,460,552 208,358 1,664,910 30
The relatively high cost of documentation and certification fees for a 4 Star Green Star rating should be treated with caution as there were only three 4 Star projects in the sample.
TABLE 7
Breakdown of the average cost of Green Star per square metre, by sector, as a percentage of the total project budget
Sector Green Star implementation per m2
Green Star documentation and certification per m2
Total Green Star cost per m2
Sample size
Custom 2.9% 1.6% 4.5% 1
Design & As Built 3.1% 0.4% 3.5% 3
Education 0.2% 0.3% 0.5% 3
Industrial 9.4% 1.0% 10.4% 2
Multi-unit Residential 3.5% 0.5% 4.0% 5
Office 1.5% 0.3% 1.8% 11
Public Building 2.7% 2.1% 4.7% 3
Retail 1.3% 0.1% 1.3% 2
Total 2.2% 0.7% 2.9% 30

Green Star Financial Transparency (July 2016) / Research paper -- 11
Updated: 10 August 2016
INDIVIDUAL CREDITS
The sample is not yet large enough to be able to report on the average cost of individual credits within the rating tools. Once there are five or more Green Star – Design & As Built projects in the sample the average cost of credits will be reported.
Based on the small sample currently available (three projects), Green Star is driving building owners to invest additional capital to achieve better outcomes in their buildings through key credits in each category.
Management: building commissioning (including hiring an independent commissioning agent); building tuning; and a monitoring strategy.
Indoor environment quality: ventilation systems; exhaust (or the illumination of pollutants); noise reduction and reduced exposure to pollutants (particularly paints, adhesives, sealants and carpets, but also engineered wood products). Capital is also being invested in daylight modelling and thermal comfort modelling to ensure best practice levels of comfort are achieved for occupants.
Energy: Glazing and greenhouse gas emission reduction.
Transport: End of trip facilities.
Water: Rainwater tanks and efficient fixtures.
Materials: Life cycle assessment; Portland cement; aggregates, structure reuse; sustainable timber; cables, pipes, floors and blinds; product transparency and sustainability; and reducing construction and demolition waste.
There is no reported additional spend to achieve the Land Use & Ecology credits (ecological value, sustainable sites and heat island effect) and there was only a small documentation cost reported to achieve the Emissions credits (stormwater, light pollution, microbial control and refrigerant impacts).
FEEDBACK ON THE CREDIT
Project teams reported gaining valuable information by using the Financial Transparency Innovation Challenge and plan to use this information to guide future projects.
“The financial transparency credit has shown that the cost of implementing 6 Star Green Star represents around 6% of the overall project cost. This project is a good example for the team to better understand the cost of a 6 Star Green Star project which we will be able to use as a reference for …future fitout projects. The experience gained through the … fitout project will provide opportunities to reduce this percentage on future projects.” Green Star – Interiors project team
“Creating a transparent financial account allows the project team to foresee costs and commitment costs for the future of the project. The project applicant can then decide whether it is financially viable to implement a similar initiative for future projects by referring directly to the financial transparency template. This will allow the project team to save time on comparing consultancy and implementation costs as well as setting a point of price reference as comparison for future projects.” Green Star – Communities project
Some project teams reported difficulty in isolating the cost of Green Star.
“The major difficulty faced was having everyone be open with cost breakdowns. There may also be a few differences between team members expected costs for items. Sometimes breaking out the Green Star cost was hard as it is sometimes rolled up into other aspects and only an estimate can be made.”

Green Star Financial Transparency (July 2016) / Research paper -- 12
Updated: 10 August 2016
Early feedback around the lack of clarity in the submission requirements has been addressed. The GBCA will continue to improve the credit templates and guidance as required.
Next steps
Data is being added to the sample each time a Green Star project achieves the Financial Transparency Innovation Challenge. The GBCA will monitor this incoming data and release a revised Green Star Financial Transparency research paper annually.
As the sample grows, the GBCA will split out the Green Star – Design & As Built projects by sector. Costs will also be provided by Green Star rating within each of the sectors, for example, comparing the cost of Green Star per square metre for a 5 Star Green Star multi-unit residential building to a 6 Star Green Star multi-unit residential building.
Several project teams suggested it would be beneficial if the GBCA provided a summary of the average cost of implementing each credit, either as a percentage of the overall project cost or as a cost per square metre, making is easier for project teams to explain the potential cost to clients. While any such average would only ever be a rough guide, this is something the GBCA will consider as the sample size within each of the rating tools (Green Star Design & As Built, Green Star – Interiors, Green Star – Performance and Green Star – Communities) grows.
The costs reported in this paper should be used as part of a broader discussion about the value of Green Star ratings, including the return on investment, the impact on operational costs, and the health and wellbeing of occupants.

Green Star Financial Transparency (July 2016) / Research paper -- 13
Updated: 10 August 2016
Appendix A: Financial transparency
innovation challenge

Innovation Challenges Handbook
Financial Transparency
Financial Transparency Points Available: 1
Aim To increase the amount of information available to industry on the costs and benefits of sustainable building.
Rating Tool Eligibility
Green Star
Communities
Green Star
Design & As Built
Green Star
Interiors
Green Star
Performance
Legacy Green Star
Rating Tools
Why is this Innovation Challenge Important?
The lack of transparent information on the costs and benefits of sustainable building practices has reduced the uptake of these practices by some sectors. Increasing this knowledge will demystify the costs, and, when combined with the benefits of sustainable building practices, provide clear information to the industry on the value proposition of sustainable buildings, fitouts and communities.
This Innovation Challenge aims to encourage owners, developers and operators to disclose the costs of sustainable building practices, and to agree to participate in a yearly report developed by GBCA that will inform the building industry on the true costs of sustainability. All results will be reported in aggregate and no project, owner or consultant will be identifiable.
Innovation Challenges Handbook
Financial Transparency
Compliance Requirements
To claim this Innovation Challenge your project team must:
Agree to complete the ‘Financial Transparency Disclosure Template’ that comprehensively itemises design, construction, documentation and project costs. In the case of building operations, the information provided will relate to the cost of collecting documentation, building operations and any building upgrades.
Provide this information in Excel format at the time of the project’s Green Star submission.
Agree to participate in the yearly GBCA report, using anonymized data provided by project teams.
Guidance
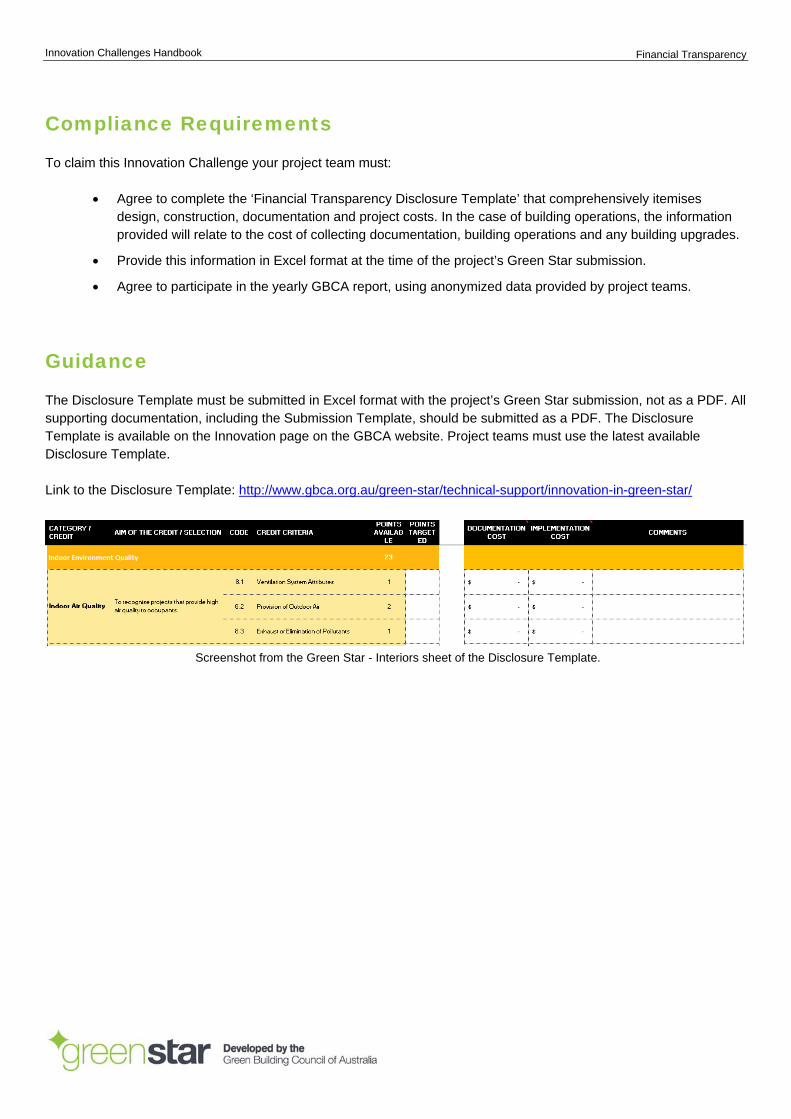
The Disclosure Template must be submitted in Excel format with the project’s Green Star submission, not as a PDF. All supporting documentation, including the Submission Template, should be submitted as a PDF. The Disclosure Template is available on the Innovation page on the GBCA website. Project teams must use the latest available Disclosure Template.
Link to the Disclosure Template: http://www.gbca.org.au/green-star/technical-support/innovation-in-green-star/
Screenshot from the Green Star - Interiors sheet of the Disclosure Template.

Innovation Challenges Handbook
Financial Transparency
The following is guidance surrounding the costs that need to be provided in the Disclosure Template.
Documentation Cost – the cost being charged to the Applicant for of documenting the specific credit. This only includes work that had to be undertaken in addition to what would have been done for the project as a base requirement, had it not been seeking a Green Star rating. As an example, in the Materials category there may be an additional cost for documenting the type of timber used.
Implementation Cost – the cost of being charged to the Applicant for implementing the specific credit. This only includes the additional cost of materials and installation (implementation) that had to be undertaken to comply with the credit beyond what would have been done for the project as a base requirement, had it not been seeking a Green Star rating. As an example, in the Materials category there may be an additional cost for the timber used. If the timber used costs $25 per metre and the timber that would otherwise have been used costs $20, the cost recorded would be $5 x the total number of metres of timber on the project.
Total Design Cost – this is the total cost of designing the project.
Total Construction Cost – this is the total cost of constructing the project (including any Green Star implementation costs).
Total Project Cost = Total Design Cost + Construction Cost.
Green Star Collation Fee: If a separate submission collation fee applies (in addition to the itemised documentation costs for each credit), include it here. For some projects this fee is included in the GSAP credit. Itemising either is fine.
Green Star Certification Fees – The cost to certify the project. If CIRs are included, please specify.
Total Green Star Fees and Costs – This is a calculation in the Disclosure Template:
Percentage of overall project costs – This is a calculation in the Disclosure Template:
Example of the calculations that take place in the Disclosure Template.

Innovation Challenges Handbook
Financial Transparency
Documentation Requirements
Design Review / Design and As Built Submission
Provide the following required documentation:
Submission Template outlining how the team has addressed the Innovation Challenge. The Submission Template also enables project teams to provide feedback on the Innovation Challenge to inform future developments; and
Disclosure Template submitted in Excel format to enable the GBCA to easily extract the data. Specifically, this will capture on a credit-by-credit basis the cost being charged to the project Applicant.
Where costs are to be estimated, the project team must provide an explanation and justification of how the estimates are an accurate representation of the costs (for GBCA's information only). This should be provided in the 'Comments' column of the Disclosure Template.
Statement or report from quantity surveyor, project manager or GSAP from the project, supporting the costs outlined in the Disclosure Template.
Provide documentation to support the claims made within the Submission Template. This may include:
Other supporting documentation, where required, to support the claims made, for example, bill of quantities or material schedule.