greenbook part 2 - federal reserve system · august 12, 1994 recent developments ... in july,...
TRANSCRIPT
Prefatory Note
The attached document represents the most complete and accurate version available based on original copies culled from the files of the FOMC Secretariat at the Board of Governors of the Federal Reserve System. This electronic document was created through a comprehensive digitization process which included identifying the best-preserved paper copies, scanning those copies,1 and then making the scanned versions text-searchable.2 Though a stringent quality assurance process was employed, some imperfections may remain.
Please note that this document may contain occasional gaps in the text. These gaps are the result of a redaction process that removed information obtained on a confidential basis. All redacted passages are exempt from disclosure under applicable provisions of the Freedom of Information Act.
1 In some cases, original copies needed to be photocopied before being scanned into electronic format. All scanned images were deskewed (to remove the effects of printer- and scanner-introduced tilting) and lightly cleaned (to remove dark spots caused by staple holes, hole punches, and other blemishes caused after initial printing). 2 A two-step process was used. An advanced optimal character recognition computer program (OCR) first created electronic text from the document image. Where the OCR results were inconclusive, staff checked and corrected the text as necessary. Please note that the numbers and text in charts and tables were not reliably recognized by the OCR process and were not checked or corrected by staff.
Confidential (FR) Class III FOMC
August 12, 1994
RECENT DEVELOPMENTS
Prepared for the Federal Open Market Committee
By the staff of the Board of Governors of the Federal Reserve System

DOMESTIC NONFINANCIALDEVELOPMENTS
DOMESTIC NONFINANCIAL DEVELOPMENTS
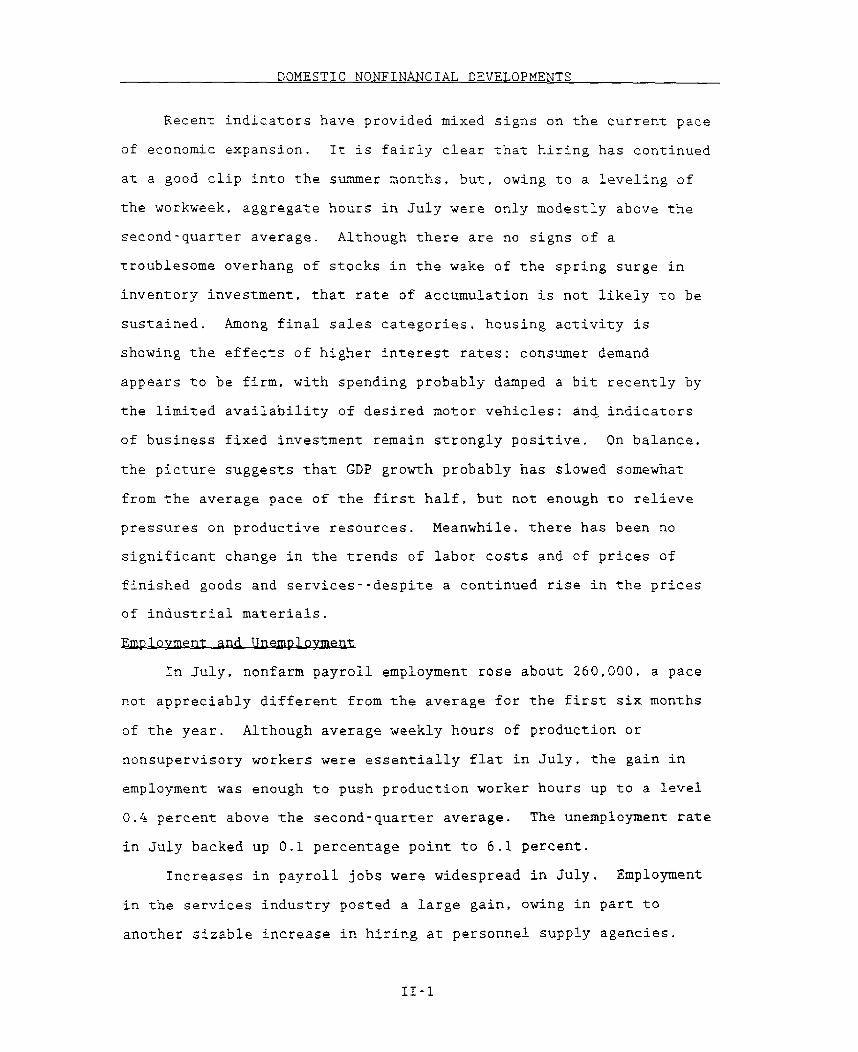
Recent indicators have provided mixed signs on the current pace
of economic expansion. It is fairly clear that hiring has continued
at a good clip into the summer months, but, owing to a leveling of
the workweek, aggregate hours in July were only modestly above the
second-quarter average. Although there are no signs of a
troublesome overhang of stocks in the wake of the spring surge in
inventory investment, that rate of accumulation is not likely to be
sustained. Among final sales categories, housing activity is
showing the effects of higher interest rates: consumer demand
appears to be firm, with spending probably damped a bit recently by
the limited availability of desired motor vehicles; and indicators
of business fixed investment remain strongly positive. On balance.
the picture suggests that GDP growth probably has slowed somewhat
from the average pace of the first half, but not enough to relieve
pressures on productive resources. Meanwhile, there has been no
significant change in the trends of labor costs and of prices of
finished goods and services--despite a continued rise in the prices
of industrial materials.
Employment and Unemployment
In July, nonfarm payroll employment rose about 260,000, a pace
not appreciably different from the average for the first six months
of the year. Although average weekly hours of production or
nonsupervisory workers were essentially flat in July, the gain in
employment was enough to push production worker hours up to a level
0.4 percent above the second-quarter average. The unemployment rate
in July backed up 0.1 percentage point to 6.1 percent.
Increases in payroll jobs were widespread in July. Employment
in the services industry posted a large gain, owing in part to
another sizable increase in hiring at personnel supply agencies.
II-1

II-2
CHANGES IN EMPLOYMENT1(Thousands of employees; based on seasonally adjusted data)
1993 1994 1994
1992 1993 Q4 Q1 Q2 May June July
------------Average monthly changes--------
Nonfarm payroll employment2 96 194 229 229 336 252 356 259
Private 76 179 219 222 311 219 353 261Manufacturing -14 -11 3 13 19 2 27 6
Durable -14 -7 10 12 20 1 32 -5Nondurable 0 -4 -7 0 -1 1 -5 11
Construction -1 19 24 23 39 14 16 25Trade 10 42 47 44 93 25 127 80Finance, insurance, real estate 4 10 11 4 6 -4 13 1Services 78 116 127 133 146 101 165 138Health services 22 23 20 23 21 13 24 18Business services 31 46 62 61 58 23 77 73
Total government 20 15 10 8 25 33 3 -2
Private nonfarm production workers 86 164 185 211 295 203 323 149Manufacturing production workers -3 -1 12 22 22 1 32 7
Total employment3 127 209 364 459 131- 534 -442 22Nonagricultural 120 219 363 349 195 557 -242 -22
Memo:Aggregate hours of private production
workers (percent change) .1 .3 .4 .4 .4 .7 -.3 .4Average workweek (hours) 34.4 34.5 34.5 34.6 34.7 34.8 34.6 34.6
Manufacturing (hours) 41.1 41.5 41.7 41.7 42.1 42.1 42.0 41.9
1. Average change from final month of preceding period to final month ofperiod indicated.
2. Survey of establishments.3. Survey of households. Data for 1994 are not directly comparable with earlier
years because of a redesign of the CPS in January 1994.
SELECTED UNEMPLOYMENT AND LABOR FORCE PARTICIPATION RATES 1
(Percent; based on seasonally adjusted data)
1993 1994 1994
1992 1993 Q4 Q1 Q2 May June July
Civilian unemployment rate(16 years and older) 7.4 6.8 6.5 6.6 6.2 6.0 6.0 6.1
Teenagers 20.0 19.0 18.3 18.0 18.4 18.3 16.9 17.720-24 years old 11.3 10.5 9.7 10.6 9.6 9.4 9.4 9.9Men, 25 years and older 6.4 5.8 5.5 5.3 4.8 4.6 4.7 4.9Women, 25 years and older 5.7 5.4 5.3 5.3 5.0 4.9 4.9 4.8
Full-time workers 7.4 6.8 6.2 6.7 6.2 6.0 6.1 6.2
Labor force participation rate 66.3 66.2 66.2 66.6 66.5 66.5 66.2 66.3
Teenagers 51.3 51.5 51.1 52.7 53.6 53.1 53.7 52.520-24 years old 77.1 77.1 76.7 77.0 77.0 77.1 77.2 76.4Men, 25 years and older 76.6 76.2 76.2 76.3 75.8 75.9 75.5 75.8Women, 25 years and older 57.0 57.1 57.5 58.0 57.9 58.1 57.6 57.8
1. Data for 1994 are not directly comparable with earlier years because of aredesign of the CPS in January 1994.

II-3
Retail trade employment grew 75,000, reflecting gains at eating and
drinking establishments as well as general merchandise and food
stores. In the construction industry, employment rose another
25,000 in July--a surprisingly large gain in light of the recent
trends in homebuilding activity. Manufacturing employment rose
6,000 in July; however, strike activity by the United Auto Workers
(UAW) at Caterpillar and General Dynamics reduced manufacturing
payrolls by 12,000 workers. The average workweek in manufacturing
edged down in July; nevertheless, at 41.9 hours, it remains very
high by the standards of recent years.
The latest strikes in manufacturing underscore the more
aggressive posture of organized labor this year. From January to
June of this year, 24 strikes involving 1,000 or more workers
occurred. Should strikes continue to occur at this rate, 1994 would
register the largest number of work stoppages since 1989.
Nevertheless, strike activity this year remains low in comparison
with the 1970s, when strikes totaled at least 200 or more each year.
MAJOR WORK STOPPAGES(Strikes involving 1.000 or more workers, for selected years)
1988 1989 1990 1991 1992 1993 1994 1
Strikes 40 51 44 40 35 35 24Workers involved
(thousands) 118 452 185 392 364 182 215
1. January to June, not annualized.
In the household survey, total employment increased just 22.000
in July. Since January, growth in household employment has fallen
1. The workweek was down in a number of industries and fellsharply in motor vehicles. Unlike in previous years, General Motorsshut down all of its plants in early July for summer vacation.Although most workers received paid time off for a regular workweek,their reported hours fell because no overtime was scheduled duringthat period.

II-4
LABOR FORCE PARTICIPATION RATES(Seasonally adjusted data)
Total Labor Force Participation Rate
1975 1976 1977 1978 1979 1980 1981 1982 1983 1984 1985 1986 1987 1988 1989 1990 1991 1992 1993 1994
Males, ages 16 to 24 Percent
975 1980 1985 1990
Females, ages 16 to 24 Percent
Males, ages 25 & over Percent
975 1980 1985 1990
Females, ages 25 & over Percent
1980 1985 1990
Note: Data for 1994 are not directly comparable with earlier years because of the redesign of the CPS in 1994.
Percent
---- Lin. . . . .. ...... .... .. . . ..... .I . . ..........
W
II-5
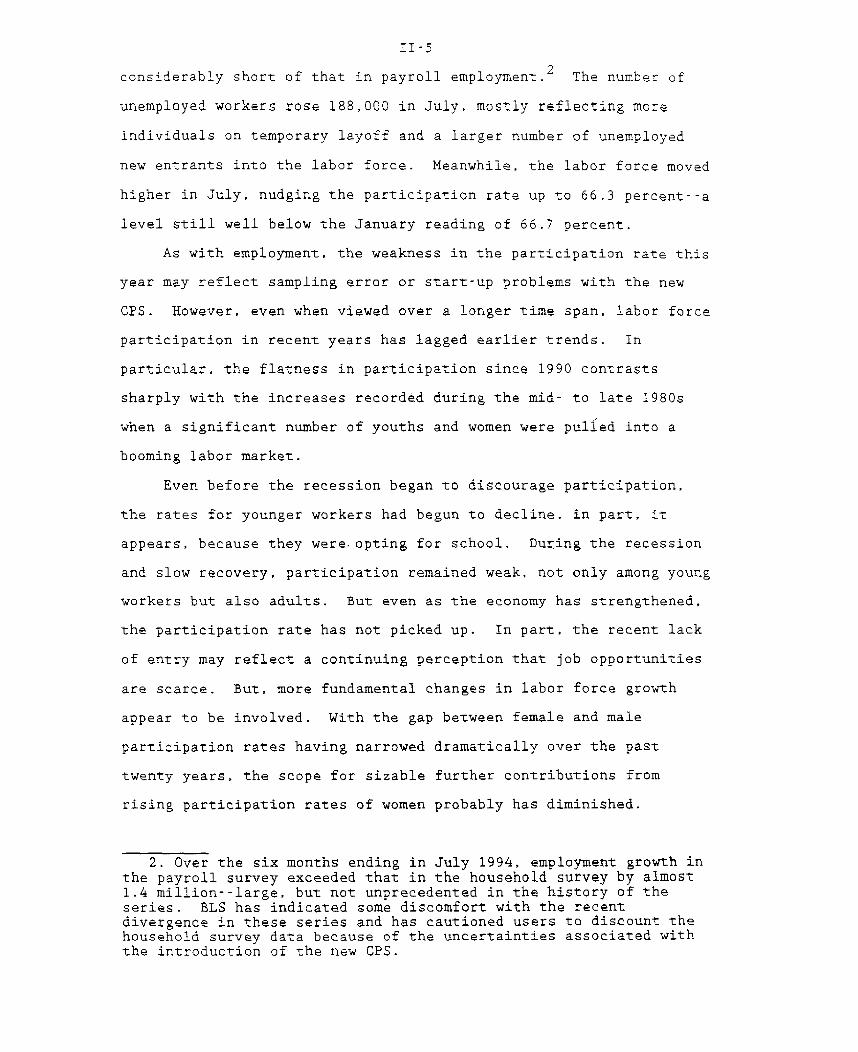
considerably short of that in payroll employment. The number of
unemployed workers rose 188,000 in July, mostly reflecting more
individuals on temporary layoff and a larger number of unemployed
new entrants into the labor force. Meanwhile, the labor force moved
higher in July, nudging the participation rate up to 66.3 percent--a
level still well below the January reading of 66.7 percent.
As with employment, the weakness in the participation rate this
year may reflect sampling error or start-up problems with the new
CPS. However, even when viewed over a longer time span, labor force
participation in recent years has lagged earlier trends. In
particular, the flatness in participation since 1990 contrasts
sharply with the increases recorded during the mid- to late 1980s
when a significant number of youths and women were pulled into a
booming labor market.
Even before the recession began to discourage participation,
the rates for younger workers had begun to decline, in part, it
appears, because they were opting for school. During the recession
and slow recovery, participation remained weak, not only among young
workers but also adults. But even as the economy has strengthened,
the participation rate has not picked up. In part, the recent lack
of entry may reflect a continuing perception that job opportunities
are scarce. But, more fundamental changes in labor force growth
appear to be involved. With the gap between female and male
participation rates having narrowed dramatically over the past
twenty years, the scope for sizable further contributions from
rising participation rates of women probably has diminished.
2. Over the six months ending in July 1994, employment growth inthe payroll survey exceeded that in the household survey by almost1.4 million--large, but not unprecedented in the history of theseries. BLS has indicated some discomfort with the recentdivergence in these series and has cautioned users to discount thehousehold survey data because of the uncertainties associated withthe introduction of the new CPS.
II-6
LABOR PRODUCTIVITY(Nonfarm business sector)
Output per Hour1987 dollars
1980 1981 1982 1983 1984 1985 1986 1987 1988 1989 1990 1991 1992 1993 1994
Revised Output per Hour1987 dollars
1990 1991 1992 1993 1994
REVISIONS TO LABOR PRODUCTIVITY(Nonfarm business sector; percent change at an annual rate)
1994 1993:Q2-1991 1992 1993 Q1 Q2 1994:02
Output per hourRevised 2.3 3.2 1.9 2.9 -1.2 2.6Previous 2.2 3.3 1.7 1.3 n.a. n.a.

II-7
Although some further gains are anticipated in aggregate
participation, the underlying uptrend is likely to fall short of the
rapid rate of increase seen over the previous two decades.
Initial claims for unemployment insurance were 327,000 during
the week ended August 6. With the exception of a brief run-up in
early July, weekly filings of initial claims in recent weeks have
moved below the 350,000 average evident between March and June of
this year.
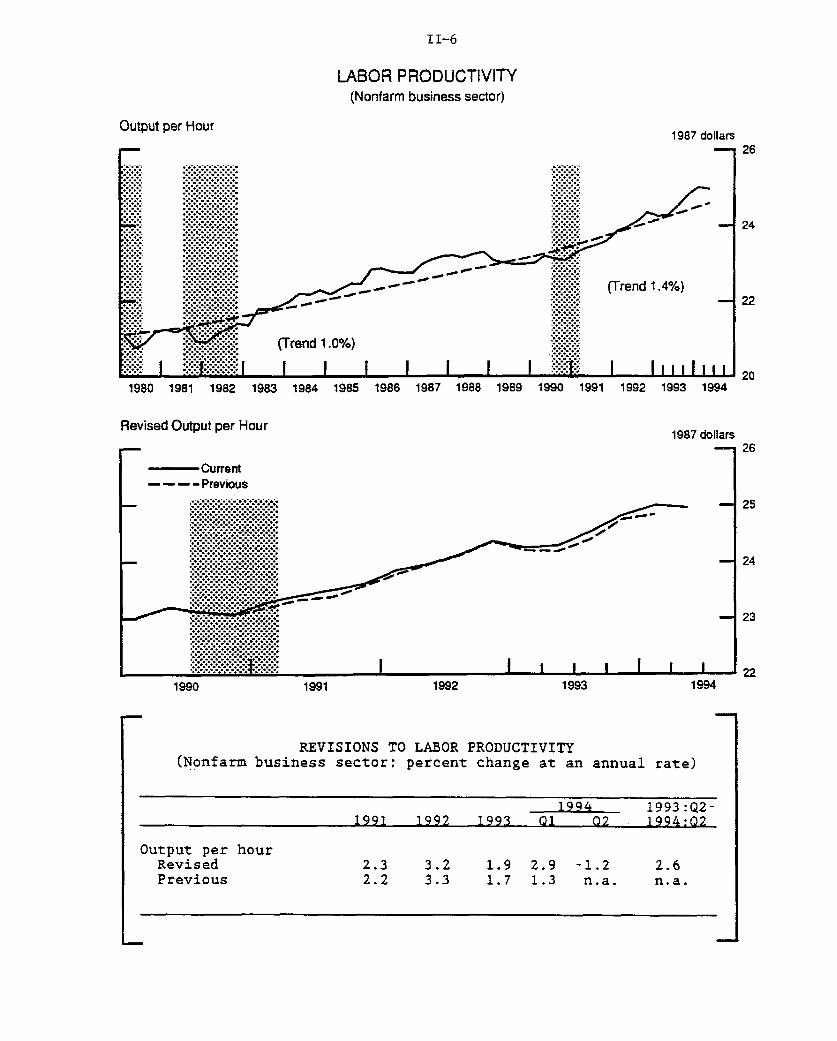
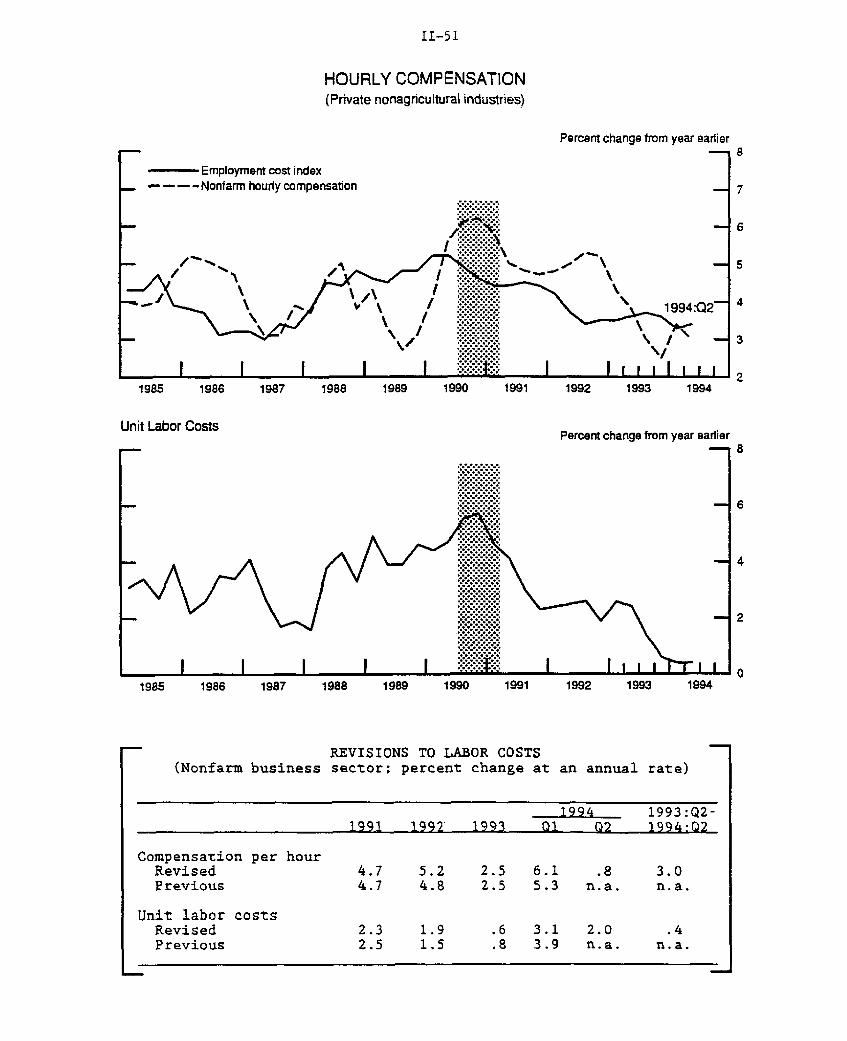
In the second quarter, output per hour in the nonfarm business
sector is estimated to have fallen at an annual rate of 1.2 percent.
Although nonfarm output rose 4.1 percent in the second quarter,
hours worked jumped 5.4 percent at an annual rate. Nonetheless,
over the four quarters ended in 1994:Q2, labor productivity rose
2.6 percent--a gain well above our estimate of 1.4 percent annual
trend growth.
In the first quarter, labor productivity growth was revised up
more than 1-1/2 percentage points to 2.9 percent (annual rate).
However, revisions to labor productivity in earlier years were
small, and left productivity only a little above its previous level
(chart).
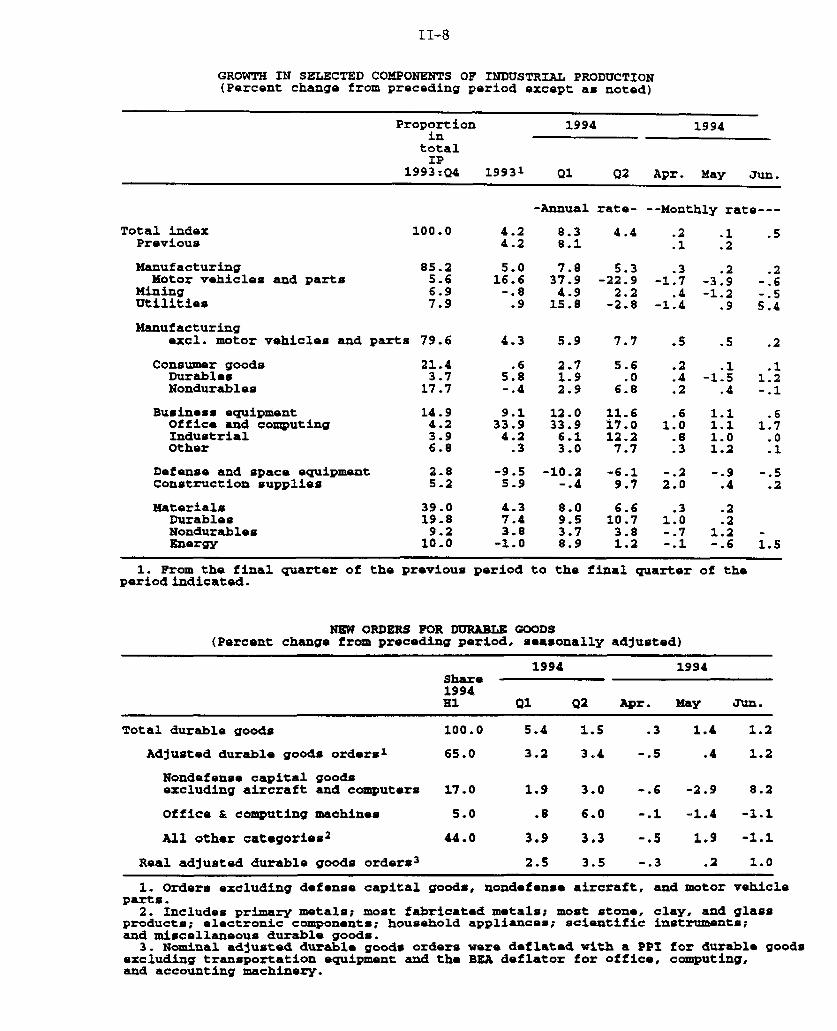
Industrial Production
Data on hours of production workers and measures of physical
product suggest that industrial production advanced moderately in
July, after rising 1/2 percent in June. A decline in electricity
generation from its unusually high June level is expected to reduce
the July gain by about 0.1 percentage point. Production in
manufacturing rose fairly strongly, and the rate of factory capacity
utilization probably remained near 83 percent. Utilization rates in
3. Claims were boosted in early July by some transitory factors.which included flood-related claims in the Southeast and shutdownsat General Motors plants for summer vacations.
II-8
GROWTH IN SELECTED COMPONENTS OF INDUSTRIAL PRODUCTION(Percent change from preceding period except as noted)
Proportionin
totalIP
1993:Q4
1994 1994
19931 Q1 Q2 Apr. May Jun.
Total index 100.0Previous
Manufacturing 85.2Motor vehicles and parts 5.6
Mining 6.9Utilities 7.9
Manufacturingexcl. motor vehicles and parts 79.6
Consumer goods 21.4Durables 3.7Nondurables 17.7
Business equipment 14.9Office and computing 4.2Industrial 3.9Other 6.8
Defense and space equipment 2.8Construction supplies 5.2
Materials 39.0Durables 19.8Nondurables 9.2Energy 10.0
4.24.2
5.016.6-.8.9
4.3
.65.8-.4
9.133.9
4.2.3
-9.55.9
4.37.43.8
-1.0
-Annual
8.38.1
7.837.94.9
15.8
5.9
2.71.92.9
12.033.96.13.0
-10.2-.4
8.09.53.78.9
rate-
4.4
5.3-22.9
2.2-2.8
7.7
5.6.0
6.8
11.617.012.27.7
-6.19.7
6.610.73.81.2
--Monthly rate---
.2 .1 .5
.1 .2
.3 .2 .2-1.7 -3.9 -.6
.4 -1.2 -.5-1.4 .9 5.4
.5
.2
.4
.2
.61.0
.8
.3
-. 22.0
.31.0-. 7-.1
.5
.1-1.5
.4
1.11.11.01.2
-.9.4
.2
.21.2-. 6
1. From the final quarter of the previous period to the final quarter of theperiod indicated.
NEW ORDERS FOR DURABLE GOODS(Percent change from preceding period, seasonally adjusted)
1994 1994Share1994HI Q1 Q2 Apr. May Jun.
Total durable goods 100.0 5.4 1.5 .3 1.4 1.2
Adjusted durable goods orders1 65.0 3.2 3.4 -.5 .4 1.2
Nondefense capital goodsexcluding aircraft and computers 17.0 1.9 3.0 -.6 -2.9 8.2
Office & computing machines 5.0 .8 6.0 -.1 -1.4 -1.1
All other categories 2 44.0 3.9 3.3 -.5 1.9 -1.1
Real adjusted durable goods orders3 2.5 3.5 -.3 .2 1.0
1. Orders excluding defense capital goods, nondefense aircraft, and motor vehicleparts.
2. Includes primary metals; most fabricated metals; most stone, clay, and glassproducts; electronic components; household appliances; scientific instruments;and miscellaneous durable goods.3. Nominal adjusted durable goods orders were deflated with a PPI for durable goods
excluding transportation equipment and the BEA deflator for office, computing,and accounting machinery.

II-9
primary processing industries, such as textiles, lumber, and iron
and steel, remained well above their 1967-93 averages.
Assembly schedules for the third quarter indicate little change
in car and truck output. In July, auto production was close to
schedules, and truck production actually exceeded plans. As in
July, car assemblies in August are expected to be held down by
extended model changeovers at some plants. Truck schedules call
for production to increase in August as additional capacity comes on
line.
PRODUCTION OF DOMESTIC AUTOS AND TRUCKS(Millions of units at an annual rate; FRB seasonal basis)
1994
May June July Q1 Q2 Q3s
U.S. production 11.5 11.6 11.3 12.9 11.8 11.7Autos 6.3 6.2 6.0 7.1 6.4 6.2Trucks 5.3 5.4 5.2 5.9 5.4 5.5
Days' supplyAutos 60.3 63.0 64.5 2 60.0 60.9Light trucks 61.7 64.2 61.7 53.0 60.0
1. Components may not add to totals due to rounding.2. Days' supply in July estimated from production and sales.s Scheduled.
The available evidence suggests that output of appliances and
other household durables was robust in July. Meanwhile, declines in
output of gasoline and residential electricity held down growth in
production of consumer nondurables. The fallback in residential
electricity came on the heels of a double-digit gain in June and
4. Altogether, unusually long downtimes reduced the level ofmotor vehicle output in the second quarter by roughly 0.2 million to0.3 million units (annual rate) and are likely to reduce the levelof motor vehicle output in the third quarter by a similar amount.The lost production is expected to be made up only gradually incoming quarters.

II-10
CAPACITY UTILIZATION IN INDUSTRY(Percent of capacity; seasonally adjusted)
1967-93 1988-89 1994 1994
Avg. High 1 Q1 Q2 May June
Total industry 81.9 84.8 83.4 83.8 83.6 83.9
Manufacturing 81.2 85.1 82.5 82.9 82.9 82.8
Primary processing 82.2 89.1 85.8 86.8 87.0 86.8Textile mill products 86.2 92.1 90.3 91.8 91.5 91.8Lumber and products 83.1 93.3 89.8 90.0 90.5 90.2Pulp and paper 92.2 98.1 93.7 92.3 94.1 90.2Chemicals2 83.3 92.3 85.5 86.3 86.7 86.5Petroleum products 85.5 88.5 90.5 94.1 94.6 93.6Stone, clay and glass 77.9 83.7 77.9 78.2 78.4 78.3Primary metals 80.1 92.9 89.6 93.1 93.0 92.8
Iron and steel 79.8 95.7 91.1 96.2 95.9 95.7Nonferrous metals 80.9 88.9 87.4 88.5 88.6 88.4
Fabricated metal products 77.2 82.0 80.3 81.3 81.1 81.5
Advanced processing 80.6 83.3 81.2 81.3 81.3 81.2Furniture and fixtures 81.7 86.8 82.0 83.1 82.5 83.6Chemicals3 77.3 82.0 78.5 78.9 79.3 79..Nonelectrical machinery 80.8 83.7 87.4 88.5 88.5 88.7Electrical machinery 80.4 84.9 85.1 86.3 86.4 86.1Motor vehicles and parts 75.7 84.5 90.5 83.7 82.8 81.9
Autos and light trucks4 89.6 92.8 83.0 81.7 80.1Aerospace and misc.
transportation equipment 75.5 88.3 62.4 62.4 62.4 62.6Instruments 82.0 81.2 73.5 73.3 73.0 73.5
Mining 87.4 87.0 89.0 89.5 89.3 88.8
Utilities 86.7 92.6 89.0 88.1 86.8 91.4
1. The historical highs shownin the same month.
are specific to each series and did not occur
2. Includes industrial organic and inorganic chemicals, synthetic materials,plastics resins, and fertilizers.
3. Includes drugs and toiletries, soaps and detergents, paints and alliedproducts, pesticides, and other miscellaneous chemical products.
4. Series begins in 1977.

II-11
reflected more moderate temperatures, which reduced air conditioning
demands.
Recent data also indicate that output of business equipment and
related parts (excluding motor vehicles) advanced quite strongly in
July, despite the ongoing weakness in aircraft and defense equipment
and the strike at Caterpillar. Production worker hours for
business equipment excluding motor vehicles increased moderately
last month, and the implied gains in production are consistent with
the uptrend in orders for information processing, industrial, and
other equipment.
Production of construction supplies looks to have changed
little for a second month in July, and growth in output of
industrial materials, which was rapid through March, has slowed
because of declines in the production of parts used to make
vehicles. Output of energy materials declined in July, and raw
steel production fell because of repairs to equipment at several
plants. Elsewhere, a rebound in paper and paperboard and continued
growth in equipment parts contributed to a small overall gain in
production of industrial materials.
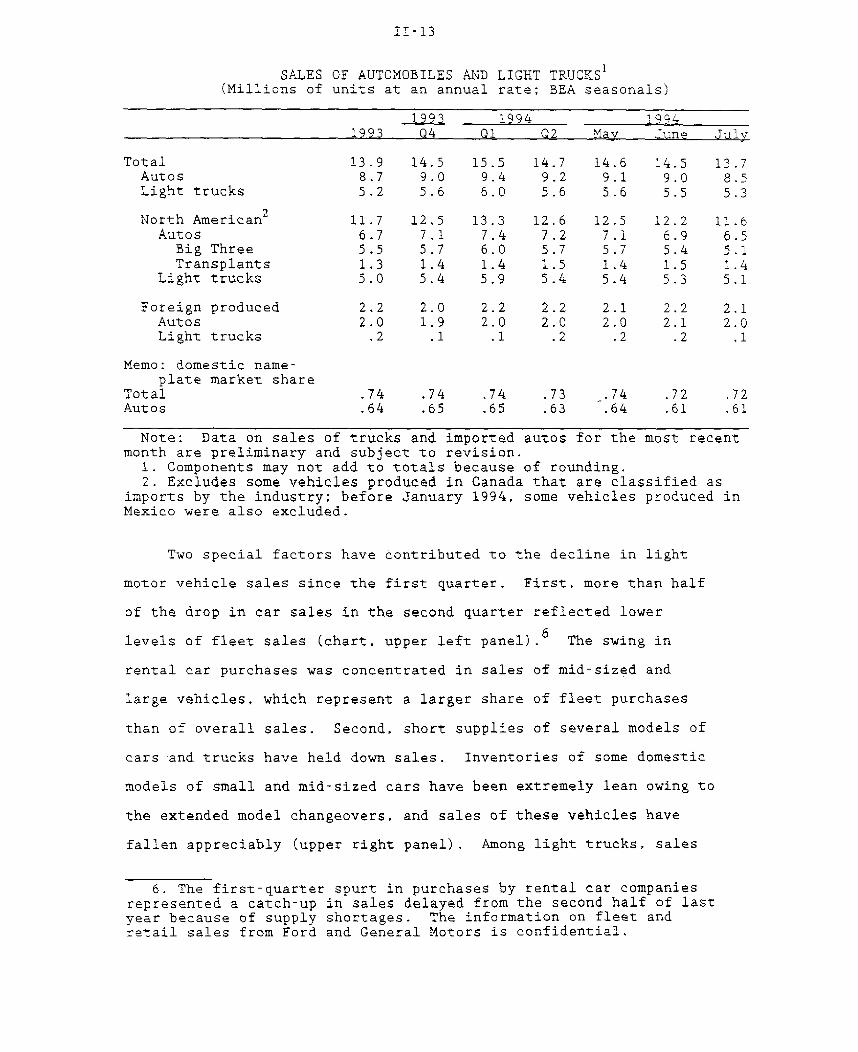
Motor Vehicles
Sales of new light vehicles fell to an average of a little over
14 million units (annual rate) in June and July, with declines in
purchases of both cars and trucks. Nearly all of this decline in
sales from the robust pace of the first quarter has occurred among
vehicles produced by the Big Three.
5. The strike at Caterpillar began on June 22. Sources atCaterpillar report that plants are currently operating with aworkforce that is at 75 percent of its pre-strike level. About25 percent of the regular hourly employees have returned, and beenjoined by roughly 13.500 white-collar workers, re-hired workers,contract employees, and newly hired permanent employees. Thisinformation suggests that the level of July production atCaterpillar was roughly one-half of the normal nonstrike level.

II-12
MOTOR VEHICLE SALES AND INVENTORIES
GM and Ford Domestic Auto Sales(Seasonally adjusted annual rate; FRB seasonals)Millions of Units
Auto Sales(Seasonally adjusted annual rate; BEA seasonals)
Millions of Units
Retail
-FleetFleet
I
* 4 ,/
St ,
1991 1992 1993 1994Note: Data are confidential. Retail includes consumer leasing.
Light Truck Sales(Seasonally adjusted annual rate; BEA seasonals)Millions of Units
1991 1992 1993 1994
Light Truck Stocks(Seasonally adjusted; FRB seasonals)
Millions of Units- -1 0.66
Jul
Pickups
Vans
Sport utility vehidcles -
1993 1994 1991 1992
-4 0.55
1 ! 1
19931991 1992
II-13
SALES OF AUTOMOBILES AND LIGHT TRUCKS1
(Millions of units at an annual rate; BEA seasonals)
1993 1994 19941993 Q4 Q1 Q2 May June July
Total 13.9 14.5 15.5 14.7 14.6 14.5 13.7Autos 8.7 9.0 9.4 9.2 9.1 9.0 8.5Light trucks 5.2 5.6 6.0 5.6 5.6 5.5 5.3
North American2 11.7 12.5 13.3 12.6 12.5 12.2 11.6Autos 6.7 7.1 7.4 7.2 7.1 6.9 6.5
Big Three 5.5 5.7 6.0 5.7 5.7 5.4 5.1Transplants 1.3 1.4 1.4 1.5 1.4 1.5 1.4
Light trucks 5.0 5.4 5.9 5.4 5.4 5.3 5.1
Foreign produced 2.2 2.0 2.2 2.2 2.1 2.2 2.1Autos 2.0 1.9 2.0 2.0 2.0 2.1 2.0Light trucks .2 .1 .1 .2 .2 .2 .1
Memo: domestic name-plate market share
Total .74 .74 .74 .73 .74 .72 .72Autos .64 .65 .65 .63 .64 .61 .61
Note: Data on sales of trucks and imported autos for the most recentmonth are preliminary and subject to revision.
1. Components may not add to totals because of rounding.2. Excludes some vehicles produced in Canada that are classified as
imports by the industry; before January 1994, some vehicles produced inMexico were also excluded.
Two special factors have contributed to the decline in light
motor vehicle sales since the first quarter. First, more than half
of the drop in car sales in the second quarter reflected lower
levels of fleet sales (chart, upper left panel). The swing in
rental car purchases was concentrated in sales of mid-sized and
large vehicles, which represent a larger share of fleet purchases
than of overall sales. Second, short supplies of several models of
cars and trucks have held down sales. Inventories of some domestic
models of small and mid-sized cars have been extremely lean owing to
the extended model changeovers, and sales of these vehicles have
fallen appreciably (upper right panel). Among light trucks, sales
6. The first-quarter spurt in purchases by rental car companiesrepresented a catch-up in sales delayed from the second half of lastyear because of supply shortages. The information on fleet andretail sales from Ford and General Motors is confidential.

II-14
RETAIL SALES(Percent change; seasonally adjusted)
1993 1994 1994
Q4 Q1 Q2 May June July
Total salesPrevious estimate
Retail control1Previous estimate
Total excl. automotive groupPrevious estimate
GAF2Previous estimate
Durable goods storesPrevious estimate
Bldg. material and supplyAutomotive dealersFurniture and appliancesOther durable goods
Nondurable goods storesPrevious estimate
ApparelFoodGeneral merchandise3
Gasoline stationsOther nondurables4
3.0 1.5 1.1.7
1.4 1.0 1.2
.7
.7 1.51.1
.7 1.81.4
5.7 2.2 1.4 -.6
1.1 -1.1
7.67.24.8
-1.8
-1.64.2
.0
.1
1.4 1.0
1.01.71.3
-.21.7
.1-1.81.42.1
.4
.1
-.5
.9
.1-1.3
.7
-1.3.9
1.93.0
.6
1. Total retail sales less building material and supply stores and
automotive dealers, except auto and home supply stores.2. General merchandise, apparel, furniture, and appliance stores.3. Excludes mail-order nonstores; mail-order sales are also excluded
from the GAP grouping.4. Includes sales at eating and drinking places, drug stores, and
proprietary stores.
-. 5
1.5-1.7
1.31.0
2.0
-.21.8
1.4.4

II-15
have been limited by short supplies of sport utility vehicles (lower
left panel), where production has run into capacity constraints at
either assembly or parts plants, and inventories have become very
tight (lower right panel).
In addition, the highly favorable market fundamentals that
boosted demand earlier this year have ebbed a bit. Prices have
increased further, and the average interest rate at auto finance
companies was 10 percent in June, 2-1/2 percentage points higher
than its recent low in January. The latest readings on car buying
attitudes from the Michigan SRC survey were little changed in early
August at a level somewhat below the high readings seen earlier this
7year.
Personal Income and Consumption
The latest spending data show that nominal retail sales were
flat in July. Nominal sales in the retail control category
increased only 0.3 percent; however, the previously slight gains in
May and June were revised upward to 0.5 percent and 0.7 percent,
respectively. Sales at general merchandise and furniture and
appliance stores increased further, while purchases at apparel
stores were off in July after large June increases. In combination
with today's CPI report, the retail sales data suggest that real
consumption of goods excluding motor vehicles in July was
0.4 percent above the second-quarter average. The upward revisions
to retail sales also imply second-quarter growth in real PCE of
nearly 2 percent, about 3/4 percentage point above the initial BEA
estimate.
The biggest contributor to the recent volatility in PCE growth
has been spending on durable goods, which jumped 8-3/4 percent at an
7. In recent months, fewer households have been reporting that itis a good time to buy a car because of low interest rates or lowprices, and more respondents have been saying that it is a good timeto buy because prices will rise in the future.

II-16
PERSONAL INCOME(Average monthly change at an annual rate; billions of dollars)
1993 1994 1994
1993 Q4 Q1 Q2 May June
Total personal income .1 33.5 30.3 18.8 23.4 4.9
Wages and salaries -8.8 13.7 19.8 15.9 24.8 1.4Private -10.2 13.6 17.0 13.7 19.1 3.2
Other labor income 2.5 2.7 1.8 1.7 1.7 1.7
Proprietors' income 2.9 16.2 .5 -4.9 -8.3 -5.3Farm .7 10.7 -1.7 -6.3 -10.2 -6.3
Rent 1.9 .7 2.3 -2.3 -. 7 -2.2Dividend .8 .3 .9 2.1 1.9 1.6Interest -2.7 -3.1 3.2 4.8 4.7 5.0
Transfer payments 4.6 4.1 4.9 2.6 .7 3.0
Less: Personal contributionsfor social insurance 1.1 1.1 3.1 1.0 1.4 .2
Less: Personal tax and nontaxpayments .1 4.4 5.2 3.9 -25.7 .6
Equals: Disposable personal income .0 29.1 25.1 14.9 48.9 4.4
Memo: Real disposable income -6.4 16.4 11.8 3.4 30.4 -5.3
REAL PCE SERVICES(Percent change from the preceding period)
1993 1994 1994
1993 Q4 Q1 Q2 May June
------ Annual rate----- Monthly rate
PCE Services 2.5 2.0 4.0 1.6 .7 .5
Energy 2.2 -1.2 5.9 -2.9 6.9 4.2
Nonenergy 2.5 2.2 3.9 1.9 .4 .3Housing 1.6 1.4 1.9 1.9 .1 .2Household operation 1.1 -.6 1.2 3.3 .2 .2Transportation 4.8 4.4 3.4 4.3 1.0 .5Medical 2.5 2.4 2.4 2.5 .4 .2Personal business 3.5 4.5 8.1 -1.9 -.2 .2Other 3.1 1.6 7.4 2.6 1.3 .4
II-17
annual rate in the first quarter, and then slowed substantially in
the second quarter. A temporary surge in consumer purchases of
motor vehicles in the first quarter more than accounted for the
swing: transactions in used cars, in particular, were boosted by
unusually large sales from rental car companies.
Spending on nondurable goods and services has also grown more
slowly than in the first quarter. In part, this pattern reflects
temporary first-quarter strength in spending on personal business
services--pushed up by increased securities trading--and energy
services, which were boosted by severe winter weather. The most
recent data show that services spending increased 0.5 percent in
June; about two-thirds of this gain was attributable to increased
outlays for electricity during the June heat wave.
During the past year or so, the pace of consumption growth has
roughly matched that of disposable income adjusted for the effects
of the California earthquake and other special factors (top and
middle panels). This pattern has produced a fairly flat adjusted
saving rate for this period (bottom panel). The recent
stability of the saving rate contrasts with the decline that
occurred between early 1992 and mid-1993.
Some analysts have suggested that the weakness in spending in
the second quarter is an important signal that household debt
burdens have again become too high and consumers are beginning to
retrench. The evidence is mixed: While the ratio of debt service
payments to income has stopped declining, it has not as yet shown a
significant increase (top panel). Although the ratio of debt to
8. The adjusted income and saving rate series exclude BEA'sadjustments for uninsured losses to residential and businessproperties that occurred during the Northridge earthquake andhurricanes Andrew, Iniki, and Hugo. The series also transfer somebonuses paid in the fourth quarter of 1992 for tax reasons to thefirst quarter of 1993, which is when they normally would have beenpaid. BEA has made no adjustment for bonus-shifting between 1993and 1994.

II-18
RECENT BEHAVIOR OF CONSUMPTION AND INCOME
Real Disposable IncomePercent change
Actual- --- Adjusted*
\Q2
'Adjusted to remove effects of special factors mentioned in the text
1991 1992 1993
Real PCE and Real Adjusted Disposable Income
1994
Percent change
-- PCE- - - -Adjusted Disposable Income
1990 1991 1992 1993 1994
Adjusted and Unadjusted NIPA Saving Rates
---- Actual- - - -Adjusted
'Staff estimate
Percent of disposable income
I Q2*
I I I I i199 199 19921993199
1990. I
1992 1993 19941990 1991

II-19
HOUSEHOLD SECTOR INDICATORS
Ratio of Debt Service Payments to Disposable IncomeRatio
1
I I I I I I I I I I i I I I I illii l i ll ll1975 1979 1983
Ratio of Total Household Debt to Disposable Income
1987 1991 1995
Ratio
1 1 I I I I I I I 1 1 I I 1 I I I iulu l i ia l l1975 1979
Consumer Sentiment
FMichigan Survey---- Conference Board Survey
1983 1987 1991
1
0.9
0.8
0.7
0.6
L 0 .51995
Index
1989 1990 1991
0.22
02
0.18
0.16
0.14
0.12
S60
19301995
I
1986 1987 1988 1992 1993 1994

II-20
PRIVATE HOUSING ACTIVITY(Millions of units; seasonally adjusted annual rate)
1993 1993 1994 1994
Annualr Q4 Q1 Q2 p Apr. May r June p
All unitsStarts 1.29 1.48 1.37 1.44 1.47 1.50 1.35Permits 1.21 1.38 1.29 1.35 1.38 1.36 1.32
Single-family units
Starts 1.13 1.29 1.17 1.19 1.21 1.20 1.16Permits 1.01 1.13 1.06 1.06 1.07 1.08 1.04
SalesNew homes .67 .77 .69 .65 .67 .69 .59Existing homes 3.80 4.17 4.05 4.06 4.12 4.11 3.96
Multifamily unitsStarts .16 .19 .20 .25 .26 .30 .19Permits .21 .25 .23 .29 .31 .27 .28
p Preliminary.r Revised estimates.
PRIVATE HOUSING STARTS
(Seasonally adjusted annual rate)
Millions of units
Total
: ' , , Multifamily '" -, .95 ., ., ,. *,;
A' I PI, ' I I ",Jw . . I L,'
' A4 f
Ifv Mnim/nmIrVJuneI I 1 I I i 1 ! I I I I I I I Inmnuihiimnninmmnim197 1980 192 18 9898 190 92 19
1978 1980 1982 1984 1986 1988 1990 1992 1994

II-21
income has edged up recently (middle panel), some of the recent debt
growth occurred because of increased transactions use of credit
cards, stimulated in part by incentives such as frequent flyer miles
or rebates.
Historically, movements in consumption spending have been more
closely related to consumer confidence than to debt burdens,
probably because perceptions about current and future economic
conditions are a key factor in determining whether a given debt
burden is acceptable or worrisome. The preliminary results from the
Michigan survey indicate that confidence improved in early August,
raising the level of the index back close to its recent peak. Gains
were evident in consumers' assessments of both current and expected
conditions. The Conference Board index edged off in July but
remained near its highest reading in four years.
Housing Markets
Housing markets have continued to weaken in response to the
higher level of mortgage interest rates, with activity slowing
further in June. Total private housing starts fell 9.8 percent in
June, to 1.35 million units at an annual rate.
In the single-family sector, housing starts declined to
1.16 million units in June, while sales of new single-family homes
fell to 591,000 units at an annual rate, the lowest level in two9
years. The latest data leave single-family starts and permits
unusually high in relation to sales, suggesting--as do other
indicators--that the June estimate of sales may understate the
actual level. The number of new homes for sale rose in June to
317,000 units, the highest level since late 1990, though not an
unusually high level historically. The declines in new home sales
and in single-family starts were accompanied by a small drop in
9. The sales estimates for April and May also were revised downconsiderably.

II-22
INDICATORS OF HOUSING DEMAND(Seasonally adjusted)
Consumer Homebuying Attitudes*Millions of units, annual rate
1.6 1
Diffusion index
Consumer homebuying atttudes (right scale)
A A Augsl(p)
A ,,/vW ,
June
Single-Family Starts (left scale)
I I I I I I I1987 1998 1989 1990 1991 1992 1993
SThe homobuying atlitudes index is calculated by the Survey Research Center (Unversity of Micnigan) as the proportion of respondentsrating current conditions as good minus the proportion rating such conditions as bad,
Builders' Rating of New Home Sales*Millions of units, annual rate
A
Diffusion indexBui ingofn h sals sal 80
Builders' rating of new home sales (right scale)
A .,
SS June
Single-Family Starts (left scale)
I I I I I I I I
1987 1988 1989 1990 1991 1992 1993'The index is calculated from National Association of Homebuilders data as the proportion of respondents rating current sales as good
to excellent minus the proportion rating them as poor.
(p 40
1994
MBA Index of Mortgage Loan ApplicationsMillions of units, annual rate
Purchase index (right scale)
1.6 -
March 16, 1990 = 100- 210
e August 5
I'/
r-\./-
0.8 I-
Single-Family Starts (left scale)
99 199 1993
8/12/94
1994
4,
1992 19931990

II-23
existing home sales in June (but most such sales are reported at
closing and thus lag the other series). Further, although
consumers' homebuying attitudes, home builders' assessments of new
home sales, and mortgage applications for purchasing a home all
edged up in early August, they remained well below the favorable
readings at the beginning of the year (chart).
In the multifamily sector, starts fell more than 100,000 units
(annual rate) in June, accounting for nearly three-fourths of the
decline in total housing starts. Averaging through the monthly
fluctuations, multifamily starts jumped 25 percent in the second
quarter. An increase in multifamily activity is consistent with
anecdotal reports of demand pressures for multifamily housing and
rising rents in various localities, but some of the recent pickup
may also reflect construction postponed during the first quarter.
Furthermore, market conditions for the nation as a whole do not
appear to favor sustained rapid growth in this sector. Vacancy
rates for apartments have been stuck at about the same level over
the past year, and they remain high by historical standards (chart).
Also, increases in residential rent have been persistently low
relative to the non-housing components of the consumer price index
(chart).
Recent press reports have suggested that reduced availability
of homeowners' insurance may adversely affect home sales in
California, which accounts for roughly 7 percent of single-family
construction activity nationwide. Under California law, companies
that write homeowners' insurance are required to offer earthquake
coverage. But, with losses mounting, many firms have stopped
selling new homeowner policies. (In most cases, renewals of
existing policies have not been affected.) Because lenders are
increasingly requiring earthquake coverage as a condition for a

II-248/12/94
MULTIFAMILY RENTAL HOUSING
Multifamily Rental Vacancy Rate(Seasonally adjusted)
94Q2
I I I I I I I I I 1 1 I I 1 I I I 1 I I I I I I I I I
1969 1974 1979 1984
Real Rent*
1989 1994
Twelve-month percent change
rPtA
1969 1974 1979 1984 1989
* CPI rent/ CPI excluding shelter
Percent

II-25
loan, difficulties in obtaining homeowners' policies could hamper
home sales. According to information obtained from the staff of
Governor Wilson and from the California Association of Realtors, few
if any closings have fallen through at this point, but some
settlements have been delayed. A state-run program that offers
minimal fire and earthquake coverage may provide an alternative to
private coverage.
For some time, home builders have been citing price increases
for some materials and shortages of skilled construction labor as
factors that have begun to exert upward pressure on home prices.
Lumber prices have stabilized somewhat at a fairly high level, and
the prices of many other building materials--including plywood,
gypsum products, concrete products, and insulation--have continued
to move upward (chart).
Employment of production or nonsupervisory workers in
construction has risen moderately over the past couple of years for
residential contractors and more noticeably for skilled workers in
special trades (chart).10 However, employment at operative
builders, who construct homes for sale, has only edged up. Data on
average hourly earnings of production or nonsupervisory workers in
residential construction indicate that hourly wage increases
generally have been modest in recent months. Although AHE for total
construction jumped 0.8 percent in July, data are not yet available
separately for the residential and nonresidential sectors.
The employment cost index provides more comprehensive data on
the construction industry. ECI hourly compensation in construction,
which includes residential, nonresidential, and public building,
rose at an annual rate of 4.8 percent over the March to June period,
following a 7 percent increase in the first quarter. Unpublished
10. Data for special trades employment are not specific toresidential construction.

1990
Insulation Materials*
Monthly
11-26
CONSTRUCTION MATERIAL PRICES(Not seasonally adjusted)
Dollars per thousand Plywood (Spot Price)board feet
1 i 500 Weekly
1985 1988 1991 1994 1
Gypsum Products* CiIndex
onthy 150 r
Monthly July
130
110
90
120
110
100
90
1992 1994
Index=i a
8/11/94
Dollars per thousandsquare feet
1985 1988 1991 1994
oncrete Products*Index
Monthly July
i i i i
1990
Asphalt Roofing*
Monthly
1992 1994
Index
July
1992 1994
Lumber (Spot Price)
FWeekly
I I I I
1990 1992 1994
*Producer price index, 1982 = 100.

II-27
CONSTRUCTION EMPLOYMENT AND WAGES
Employment
Residential General Contractors
Thousands Hourly Wage*-- 600 --
400
nn1980 1982 1985 1988 1991 1994 1980 1982
Special Trades
Employment Thousands Hourly Wage*-- - 3000-
June
- 2400
-1800
EL tI II I 1 1 1 1 1200 -1980 1982 1985 1988 19E
Employment
Percent-- 15
June
1985 1988 1991
91 1994 1980 1982
Operative Builders
Thousands Hourly Wage*-- 60 r--
-J 51994
Percent
Percent
I - l i 1 i I 1 1 1I 201980 1982 1985 1988 1991 1994
8/11/94
1 A IA I I J I I I
1980 1982 1985 1988 1991 1994
* Percent change in average hourly earnings from a year earlier.
June
Vw\

II-28
BUSINESS CAPITAL SPENDING INDICATORS(Percent change from preceding comparable period;
based on seasonally adjusted data, in current dollars)
1993 1994 1994
Q4 Q1 Q2 Apr. May June
Producers' durable equipment
Shipments of nondefense capital goods 7.1 1.0 1.8 -1.5 1.0 1.7Excluding aircraft and parts 8.0 1.2 4.0 1.3 1.9 .7
Office and computing 5.2 3.3 1.5 -2.3 -.3 1.9All other categories 8.8 .5 4.8 2.4 2.5 .3
Shipments of complete aircraft1 34.1 10.0 -32.5 -57.6 -9.9 67.2
Sales of heavy trucks 10.3 -1.0 5.3 3.3 -1.9 11.8
Orders of nondefense capital goods 10.4 6.2 -.2 -.9 -.9 5.9Excluding aircraft and parts 10.9 1.7 3.7 -.4 -2.5 6.0
Office and computing 12.9 .8 6.0 -.1 -1.4 -1.1All other categories 10.4 1.9 3.0 -.6 -2.9 8.2
Nonresidential structures
Construction put-in-place 5.0 -3.1 5.6 2.9 .9 .7Office 4.6 -.3 3.6 -2.5 -1.4 -2.1Other commercial 13.7 -6.0 12.0 4.5 2.2 2.3Institutional -4.5 -6.7 6.5 2.5 2.0 1.3Industrial 1.3 1.0 7.2 6.9 .7 -1.6Public utilities 7.4 -2.2 2.3 2.3 1.0 2.1Lodging and misc. .6 -2.7 1.1 2.2 -1.8 -3.6
Rotary drilling rigs in use -3.7 .8 2.2 1.9 -1.6 -.7
Memo:Business fixed investment2 21.1 10.9 10.0 n.a. n.a. n.a.
Producers' durable equipment2 27.5 18.6 7.7 n.a. n.a. n.a.Nonresidential structures2 3.3 -11.8 18.4 n.a. n.a. n.a.
1. From the Current Industrial Report "Civil Aircraft and Aircraft Engines."Monthly data are seasonally adjusted using FRB seasonal factors constrained toBEA quarterly seasonal factors. Quarterly data are seasonally adjusted usingBEA seasonal factors.2. Based on constant-dollar data; percent change, annual rate.n.a. Not available.

II-29
data from the BLS indicate that rising wages and benefits of
professional and managerial personnel have fueled most of the recent
pickup in overall construction compensation growth. 1 1
Although trade reports from some areas have mentioned rising
home prices as a partial explanation for lower sales in June,
increases in national measures of home prices remained moderate in
the second quarter. The constant-quality new home price index,
which adjusts for compositional changes in house quality and
geographic location, rose 3.0 percent from the level a year earlier,
with no clear trend in the rate of increase in recent quarters. The
constant-quality index of existing home prices (compiled jointly by
Fannie Mae and Freddie Mac from repeat sales of individual
properties) increased 3.7 percent during the same period; the rate
of increase in this index has been on a gradual uptrend since early
1993.
Business Fixed Investment
Real business fixed investment advanced at an annual rate of
10 percent in the second quarter, roughly the same pace as in the
first quarter, but down from the 16 percent growth rate registered
in 1993. Outlays in the second quarter were boosted by a strong
recovery in real nonresidential construction. Investment in
producers' durable equipment--which advanced at an annual rate of
21 percent in 1993--rose less than 8 percent in the second quarter.
A marked slowing in the growth rate of real outlays for office
and computing equipment accounted for much of the deceleration in
PDE. After soaring nearly 60 percent in 1993, real computer
purchases have advanced at only about one-quarter that pace so far
this year. While growth in nominal expenditures has tailed off a
bit, the deceleration in real expenditures has been intensified by a
11. Wages of workers in these occupations are excluded fromaverage hourly earnings.

II-30
PERSONAL COMPUTER PRICES(Adjusted for changes in system performance)*
DellIndex, 1987- 1
486, 66MHz
486 33MHz
S PDE deflator for office'- and computing equipment
Dollars, ratio scale5000
4000
Pentium, 60MHz 3000-'WI
N4
-WI-N WI
N ~ --WI--- ~-W --
---------N
NN
NN
NN
NN
NN
I 1992 19 I I
1992 1993 1994
Gateway 2000Index, 1987 - 1 Dollars, ratio scale
PDE deflator for officeS and computing equipment
-
W
N 486. 33MHzN<
* 8 *0, 09 V, z
*W * -
W-
Pentium, 60MHz-- Pentium, 66MHz
N.,---
N - IN WI - - -
N N
' FRB staff estimate. Data collected from vendor advertisements in various issues of PC Magazine.
10001993
1994
2000
1000
0.55
0.5
0.45 I-
0.4 -
5000
4000
3000
2000
1993 1994
II-31
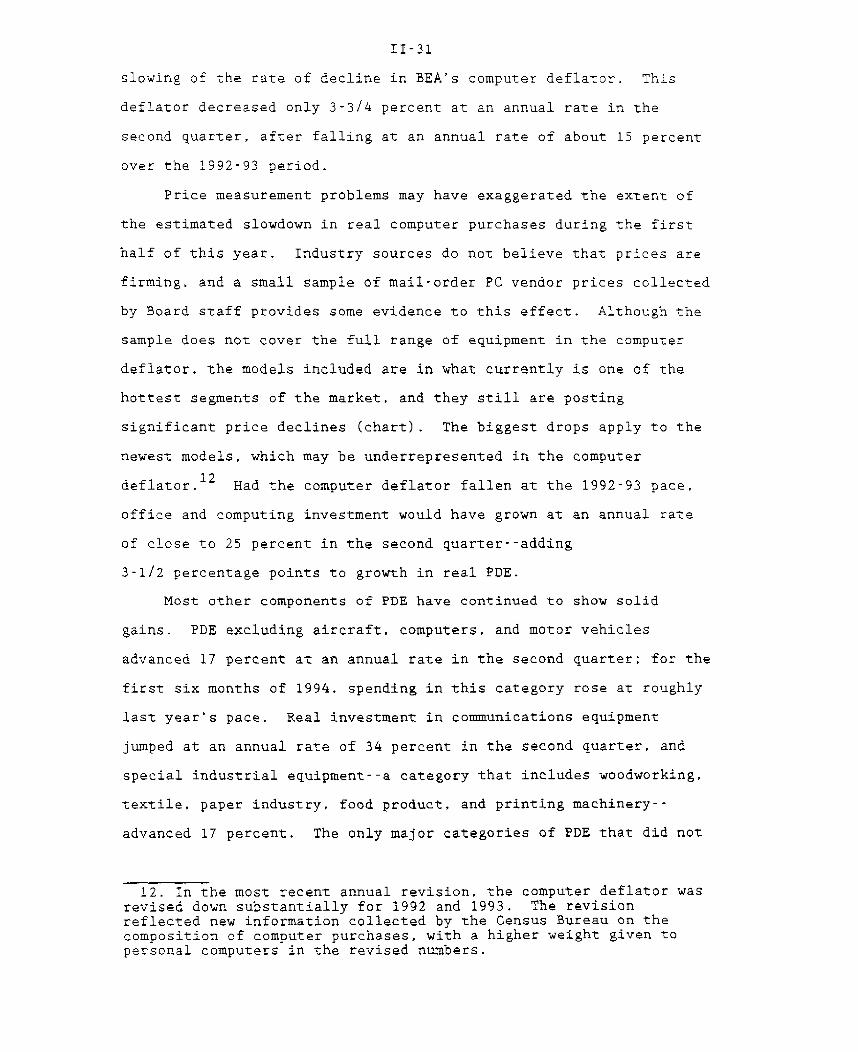
slowing of the rate of decline in BEA's computer deflator. This
deflator decreased only 3-3/4 percent at an annual rate in the
second quarter, after falling at an annual rate of about 15 percent
over the 1992-93 period.
Price measurement problems may have exaggerated the extent of
the estimated slowdown in real computer purchases during the first
half of this year. Industry sources do not believe that prices are
firming, and a small sample of mail-order PC vendor prices collected
by Board staff provides some evidence to this effect. Although the
sample does not cover the full range of equipment in the computer
deflator, the models included are in what currently is one of the
hottest segments of the market, and they still are posting
significant price declines (chart). The biggest drops apply to the
newest models, which may be underrepresented in the computer
deflator. 1 2 Had the computer deflator fallen at the 1992-93 pace,
office and computing investment would have grown at an annual rate
of close to 25 percent in the second quarter--adding
3-1/2 percentage points to growth in real PDE.
Most other components of PDE have continued to show solid
gains. PDE excluding aircraft, computers, and motor vehicles
advanced 17 percent at an annual rate in the second quarter; for the
first six months of 1994. spending in this category rose at roughly
last year's pace. Real investment in communications equipment
jumped at an annual rate of 34 percent in the second quarter, and
special industrial equipment--a category that includes woodworking,
textile, paper industry, food product, and printing machinery--
advanced 17 percent. The only major categories of PDE that did not
12. In the most recent annual revision, the computer deflator wasrevised down substantially for 1992 and 1993. The revisionreflected new information collected by the Census Bureau on thecomposition of computer purchases, with a higher weight given topersonal computers in the revised numbers.

II-32
ORDERS AND SHIPMENTS OF NONDEFENSE CAPITAL GOODS
Office and Computing Equipment
Billions of dollars Billions of dollars
1991 1992 1993 1994
- Unfilled orders
June
1991 1992 1993 1994
Other Equipment (Excluding Aircraft and Computing Equipment)
Billions of dollars
Shipments------- Orders
Billions of dollars
-- Unfilled orders
June
____-----------1991 1992 1993 1994 1992 1993

II-33
show solid growth were aircraft and motor vehicles. Business
purchases of aircraft declined sharply in the second quarter.3
Motor vehicle purchases were off 17 percent, as fleet sales dropped
from their high first-quarter level, and heavy truck sales flattened
out because of capacity constraints.
Most leading indicators of investment activity point to further
large gains in PDE in coming months. Orders for nondefense capital
goods surged in June, continuing a strong uptrend. Bookings have
been solid for most types of equipment, and the stock of unfilled
orders for nondefense capital goods (excluding aircraft and
computers) has risen sharply in recent months. In addition, heavy-
truck manufacturers report large order backlogs, and planned
capacity expansions should begin to come online in the early fall.
Unfilled orders for computers also have surged, and industry sources
are reporting that some major manufacturers are accumulating large
inventories in anticipation of another sharp jump in sales later
this year.
Real investment in nonresidential structures climbed 18 percent
at an annual rate in the second quarter, more than offsetting the
large weather-related decline in the first quarter.14 Outlays
advanced at double-digit rates in virtually every category, with the
largest gains occurring in the industrial and commercial sectors.
13. Because growth in aircraft spending has been depressed forsome time, this category is no longer a major component of PDE.In the second quarter, aircraft represented less than 1 percent ofPDE; this share is well below the shares in excess of 7 percentseen at times during the boom years of the late 1960s.
14. The June data on construction put-in-place for nonresidentialstructures were close to BEA's assumptions in the advance estimateof GDP and do not suggest any significant revision to realinvestment in the second quarter.

II-34
NONRESIDENTIAL CONSTRUCTION AND PERMITS(Six-month moving average)
Total Building
-" Construction (C) - 210------- Permits (P)
June 140
index, Dec. 1982 = 100 ratio scale-- 280
I I I I I I I I 1 I I I1982 1983 1984 1985 1986 1987 1988 1989 1990 1991 1992 1993 1994
Other Commercial
1982 1984 1986 1988 1990 1992 1994
Industrial
1982 1984 1986 1988 1990 1992 1994
Institutional
1982 1984 1986 1988 1990 1992 1994
Office
1982 1984 1986 1988 1990 1992 1994
II-35
The second-quarter jump in construction returned that series to last
year's slightly positive trend. 1 5
A recent spurt in permit issuance suggests that the modest
recovery in nonresidential construction may well continue into the
second half of the year. Permits for private nonresidential
structures increased 1.5 percent in June and were up 10 percent for
the second quarter as a whole. Permits for industrial and
commercial buildings have picked up, while institutional permits
have continued their recent downtrend.
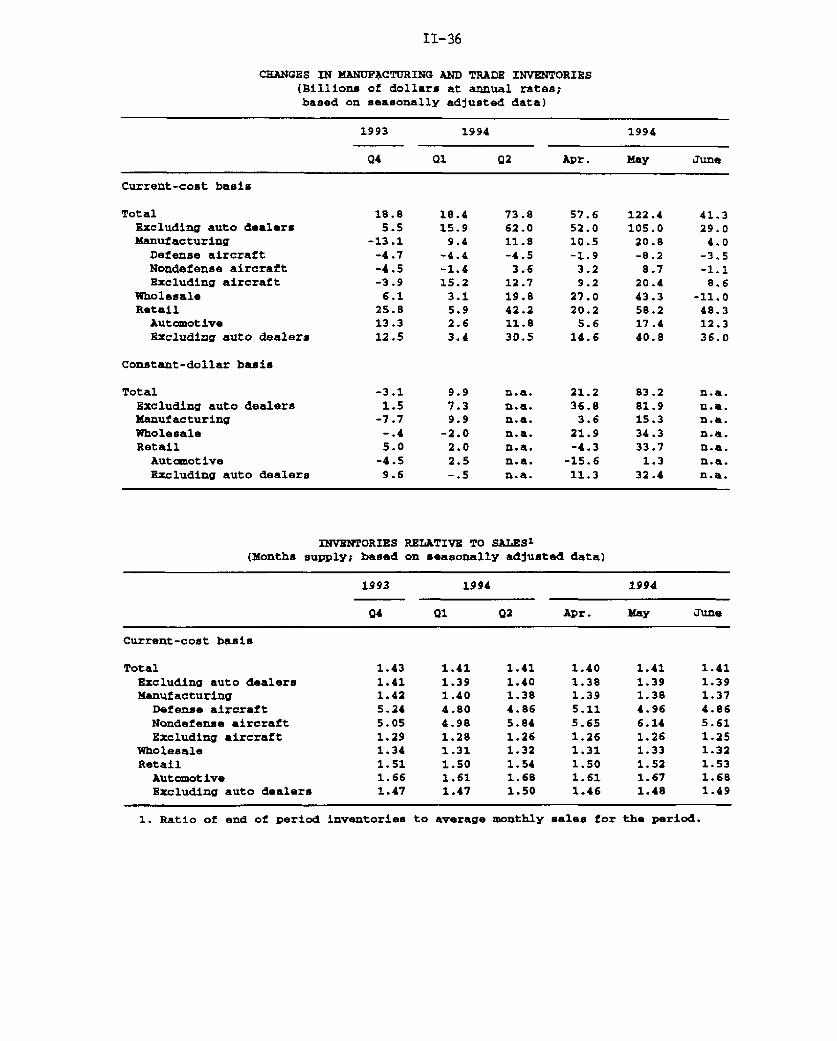
Manufacturing and Trade Inventories
Business inventory investment slowed in June after a sharp
acceleration in April and May. Excluding auto dealers, stocks in
manufacturing and trade rose in June at a $29 billion annual rate in
current-cost terms, as compared with the average $80 billion April-
May pace.16 Despite this surge last quarter, stocks do not appear
excessive at this point. The bulk of the runup was in retail and
wholesale trade inventories, but given the high level of demand,
stock-sales ratios in these sectors remained within their recent
ranges. And in manufacturing, stockbuilding appears to have been
the planned response to rising demand.
Recent buildups in manufacturing stocks have been concentrated
in just a few industries. Particularly noteworthy is the machinery
industry, where stocks have been trending upward over the past year.
Orders have been strong for many types of industrial machines and
electrical and electronic equipment, and the inventory investment in
15. Growth in nonresidential structures investment was reviseddown for 1991, 1992, and 1993 in the latest annual NIPA revision,with reductions in estimated spending on industrial buildings,utilities, and drilling and mining.
16. For the second quarter, the current-cost inventoryaccumulation for all manufacturing and trade excluding motorvehicles is now shown to have been $57 billion based on Census data,about $4 billion more than BEA's assumption in the advance GDPreport.
II-36
CHANGES IN MANUFACTURING AND TRADE INVENTORIES(Billions of dollars at annual rates;based on seasonally adjusted data)
1993 1994 1994
Q4 Q1 Q2 Apr. May June
Current-cost basis
Total 18.8 18.4 73.8 57.6 122.4 41.3Excluding auto dealers 5.5 15.9 62.0 52.0 105.0 29.0Manufacturing -13.1 9.4 11.8 10.5 20.8 4.0
Defense aircraft -4.7 -4.4 -4.5 -1.9 -8.2 -3.5Nondefense aircraft -4.5 -1.4 3.6 3.2 8.7 -1.1Excluding aircraft -3.9 15.2 12.7 9.2 20.4 8.6
Wholesale 6.1 3.1 19.8 27.0 43.3 -11.0Retail 25.8 5.9 42.2 20.2 58.2 48.3
Automotive 13.3 2.6 11.8 5.6 17.4 12.3Excluding auto dealers 12.5 3.4 30.5 14.6 40.8 36.0
Constant-dollar basis
Total -3.1 9.9 n.a. 21.2 83.2 n.a.Excluding auto dealers 1.5 7.3 n.a. 36.8 81.9 n.a.Manufacturing -7.7 9.9 n.a. 3.6 15.3 n.a.Wholesale -.4 -2.0 n.a. 21.9 34.3 n.a.Retail 5.0 2.0 n.a. -4.3 33.7 n.a.
Automotive -4.5 2.5 n.a. -15.6 1.3 n.a.Excluding auto dealers 9.6 -.5 n.a. 11.3 32.4 n.a.
INVENTORIES RELATIVE TO SALES 1
(Months supply; based on seasonally adjusted data)
1993 1994 1994
Q4 Q1 Q2 Apr. May June
Current-cost basis
Total 1.43 1.41 1.41 1.40 1.41 1.41Excluding auto dealers 1.41 1.39 1.40 1.38 1.39 1.39Manufacturing 1.42 1.40 1.38 1.39 1.38 1.37
Defense aircraft 5.24 4.80 4.86 5.11 4.96 4.86Nondefense aircraft 5.05 4.98 5.84 5.65 6.14 5.61Excluding aircraft 1.29 1.28 1.26 1.26 1.26 1.25
Wholesale 1.34 1.31 1.32 1.31 1.33 1.32Retail 1.51 1.50 1.54 1.50 1.52 1.53
Automotive 1.66 1.61 1.68 1.61 1.67 1.68Excluding auto dealers 1.47 1.47 1.50 1.46 1.48 1.49
1. Ratio of end of period inventories to average monthly sales for the period.

II-37
RATIO OF INVENTORIES TO SALES(Current-cost data)
ManufacturingRatio
-22
1.95
1,7
1.45
June
1 1 - A I I 1- i 1.21980 1982 1984 1986 1988 1990 1992 1994
WholesaleRatio
1.5
1.4
June
- 1.3
-- 1.1
1980 1982 1984 1986 1988 1990 1992 1994
RetailRatio Ratio
2.7 - 1.7
: # t *$A GAF group2.5 . T r . - - 1.6
S. June
2.3 - 1.4
2.1 - V Total excluding auto -1.4
1980 1982 1984 1986 1988 1990 1992 1994

II-38
this area appears to have been intended. Recent Census data show
that increases in manufacturers' bookings became more widespread in
June; orders for many types of nondefense capital goods--
construction and materials handling equipment, metalworking
machinery, and equipment for the telecommunications, rail and marine
transportation industries--increased substantially. By stage of
processing, inventories of materials and supplies and work in
process grew last quarter, but stocks of finished goods edged down.
This pattern also suggests that the accumulation of factory stocks
was largely intended.
In the trade sector, the sharp accumulations in April and May
followed sizable drawdowns in March and generally modest buildups
over the first quarter as a whole. In June, inventories were
reduced at some trade establishments and expanded much more slowly
at others. The accumulation of wholesale inventories in the second
quarter was largely in durable goods--motor vehicles, machinery,
electrical goods, and professional and commercial equipment. By and
large, this pattern of stockbuilding mirrors that observed for
manufacturers and is generally in line with the brisk pace of
business fixed investment in recent months. In contrast, retail
inventory buildups outside of automotive dealers in May and June
were concentrated in nondurable goods, especially in stocks of
general merchandise. Sales at general merchandise stores rebounded
in June, and inventories were up considerably. The inventory-sales
ratio for general merchandise stores at the end of June was still
below its recent high posted in November of last year.
Federal Sector
Real federal government purchases declined at a 4.8 percent
annual rate in the second quarter, with drops in both defense and
nondefense purchases. Much of the relatively steep 6.9 percent

II-39
FEDERAL GOVERNMENT OUTLAYS AND RECEIPTS(Unified basis, billions of dollars, except where otherwise noted)
Fiscal year to date
Jun. Jun. Dollar Percent1993 1994 FY1993 FY1994 change change
Outlays 117.5 122.9 1059.5 1089.2 29.7 2.8Deposit insurance (DI) -2.0 1.2 -20.5 -3.8 16.7 -81.4
Outlays excluding DI 119.5 121.7 1080.1 1093.0 13.0 1.2National defense 24.8 24.2 218.5 207.8 -10.7 -4.9Net interest 15.5 15.9 148.8 149.7 .9 .6Social security 28.7 30.1 227.9 239.2 11.3 5.0Medicare and health 21.3 23.0 170.0 186.6 16.6 9.8Income security 13.8 13.1 158.8 163.0 4.2 2.6Other 15.4 15.4 156.0 146.7 -9.4 -6.0
Receipts 128.6 138.1 858.4 939.1 80.8 9.4Personal income and socialinsurance taxesWithheld 70.4 74.4 604.4 647.8 43.4 7.2Nonwithheld 24.9 25.8 138.8 148.3 9.4 6.8Other -.5 -.6 -44.5 -44.1 .5 N.A.
Corporate income taxes 24.9 29.1 88.4 106.2 17.8 20.2Other 8.8 9.4 71.3 81.0 9.7 13.6
Deficit(+) -11.1 -15.2 201.2 150.1 -51.1 -25.4Excluding DI -9.1 -16.4 221.7 153.9 -67.8 -30.6
Details may not add to totals because of rounding.

II-40
Outlays
Receipts
Deficit
1. Estimates exclude the budgetary impact of the Presiden't healthcare reform proposal.
ADMINISTRATION BUDGET PROJECTIONS1(Billions of dollars)
Fiscal ye1994 1995 1996 19
1480 1521 1605 16
1260 1354 1426 14
220 167 179 1
arsars97 1998
83 1761
93 1569
90 192
ADMINISTRATION ECONOMIC ASSUMPTIONS
Calendar years... ..1994 1995 1996 1997 1998 1999
------ Percent change, Q4 over Q4------
Real GDP 3.0 2.7 2.6 2.5 2.5 2.5
GDP deflator 2.7 2.8 2.9 3.0 3.0 3.0
CPI-U 2.9 3.2 3.3 3.4 3.4 3.4
------- Percent, annual average-------
Civilian unemployment rate 6.3 6.2 6.1 6.1 6.1 6.1
Interest rates3-month Treasury bills10-year Treasury notes
4.0 4.7 4.8 4.8 4.8 4.86.8 7.0 7.0 7.0 7.0 7.0
Source: 0MB, Mid-Session Review of the Budget, July 1994.
1999
1852
1645
207
health
-- ~---I

II-41
decline in real nondefense spending stemmed from the government's
employee buyout program, which reduced the nondefense workforce by
roughly 17.000 people. 1 7 The accompanying transitory boost in
nominal compensation led to an increase in the nondefense
compensation deflator in the second quarter, as did the additional
paid leave given to the federal work force for the day of mourning
for former President Nixon.1 8
The unified budget deficit for the fiscal year through June was
$150 billion, 25 percent below the corresponding figure for fiscal
year 1993. The reduction in the deficit reflects continuing
strength in all categories of receipts, as well as restraint in the
growth of outlays.
The final data on June tax collections showed a $9.5 billion
increase over this same period last year. Corporate estimated tax
payments were particularly high, rising 17 percent above last year's
level, primarily because of continued growth in profits. Withheld
personal income and social insurance taxes in June were
5-1/2 percent above their level of a year ago; the gain roughly
matches the increase in wages and salaries over the past four
quarters. Nonwithheld personal taxes were up only 3-1/2 percent
from the June 1993 level, but these data are difficult to interpret
because of the variability in the timing of nonwithheld payments and
19the changes in tax rates and safe harbor provisions.
17. Real federal government purchases in the first quarter alsowere revised down sharply; most of the revision was in nondefensepurchases.
18. The effect of these factors is only temporary, and in thethird quarter the nondefense compensation deflator is expected toretrace its run-up.
19. OBRA-93 changed the safe harbor provisions such that taxpayerswhose income increased by more than $40,000 over the previous yearcould avoid interest or penalty charges by paying 110 percent ofthat year's tax liability. Previously, these taxpayers wererequired to pay 90 percent of current year tax liability in withheldor estimated payments.

II-42
STATE AND LOCAL SECTOR SURPLUS (DEFICIT)
Aggregate (NIPA Basis)*
- Revised--- - Previous
1974 1978 1982 1986 1990
SExcludes social insurance funds.
Cities with Deficits (General Fund Accounts)
1984 1985 1986
e - EstimateSource: National League of Cities.
1987 1988 1989 1990 1991 1992 1993
Billions of dollars
I - 751994
PercentS60
50
- 40
- 30
20

II-43
Federal outlays excluding deposit insurance so far this year
are 1.2 percent higher than outlays over the same period last year.
Outlays during June were 1.8 percent higher than outlays during June
1993; spending in the defense and income security categories was
lower, while spending in other categories was higher. The reduction
in income security expenditures reflected decreased spending on
unemployment benefits, through both lower unemployment and the
expiration of emergency unemployment benefits. Medicare and health
spending was up 8 percent over the June 1993 level.
In the Mid-Session Review of the 1995 Budget, OMB projected
deficits of $220 billion for 1994 and $167 billion for 1995.
Thereafter, the deficit is projected to increase gradually through
the end of the decade. The economic assumptions underlying these
projections are little different from those used in January, except
for higher projected interest rates. CBO has not yet released its
summer update of the economic and budget outlook, but press reports
indicate that their deficit forecast for 1994 will be close to
$200 billion, $20 billion below the Administration's forecast. Most
of the difference probably stems from projected outlays; OMB's
forecast looks high compared with the nine months of data that we
have for fiscal 1994.
State and Local Government Sector
Real purchases by state and local governments rose at a
2.0 percent annual rate in the second quarter, following a
1.4 percent decline in the first quarter. The second-quarter gain
was widespread across goods and services. Real construction
spending rose at a 1.9 percent annual rate in the second quarter,
reversing only a little of its sharp first-quarter decline. 2 0
20. The June data on construction put-in-place suggest an upwardrevision to real construction expenditures of $1 billion, whichwould raise the growth rate in this category to 6-1/2 percent(annual rate).

II-44
The BEA's annual revision has significantly reduced the deficit
on operating and capital accounts, excluding social insurance funds
21(chart). Most of the revision stems from lower estimates of
goods and services. Other factors contributing to the revision
include lower estimated transfer payments (mostly for Medicaid), and
greater personal nontax collections. In addition to being smaller
than previously estimated, the state and local deficit on operating
and capital accounts now appears to have improved slightly since
1991. Nevertheless, the sector has a long way to go before it can
see a surplus.
Although the condition of state general fund budgets--largely
operating accounts that represent about half of state spending--
appears to have improved during the past year, recent developments
for cities have been less positive. Survey data from the National
League of Cities show that the share of cities expecting deficits in
their general fund accounts increased in fiscal 1994, after dropping
considerably in fiscal 1993. The rising incidence of deficits is
apparent for cities of all sizes and in all regions but is most
pronounced in western cities. Many cities continue to see
infrastructure needs, federal and state mandates, crime, and the
demand for criminal justice as important sources of budgetary
pressure.
21. With the limited amount of current data on state and localgovernments available to BEA, large revisions are not unusual. Thedetailed information used for revised estimates is compiledprincipally from the Census of Governments. BEA is now using finaldata from the Census for FY1992 and preliminary data for FY1993; ithas no additional data on outlays for FY1994 (the year endedJune 30, 1994, for most state governments and about half of alllocal governments). On the revenue side, BEA has quarterly tax datafrom the Census of Governments through calendar 1993. It also hasmore timely information on Medicaid from the Health Care FinancingAdministration. But, even with these data, considerable uncertaintysurrounds the estimates of state and local government finances forthe most recent year.
II-45
Given the growing concern about crime, many recent state and
local legislative sessions focused on corrections and law
enforcement. Welfare reform and education also were important
topics. However, proposals for sweeping health care reform failed
in every state where they were considered, and implementation of
major plans has stalled; many legislatures avoided the issue as
debate at the federal level proceeded this year. Meanwhile,
legislation for less ambitious changes in health-care systems has
largely succeeded, particularly those resulting in Medicaid reform.
Labor Costs
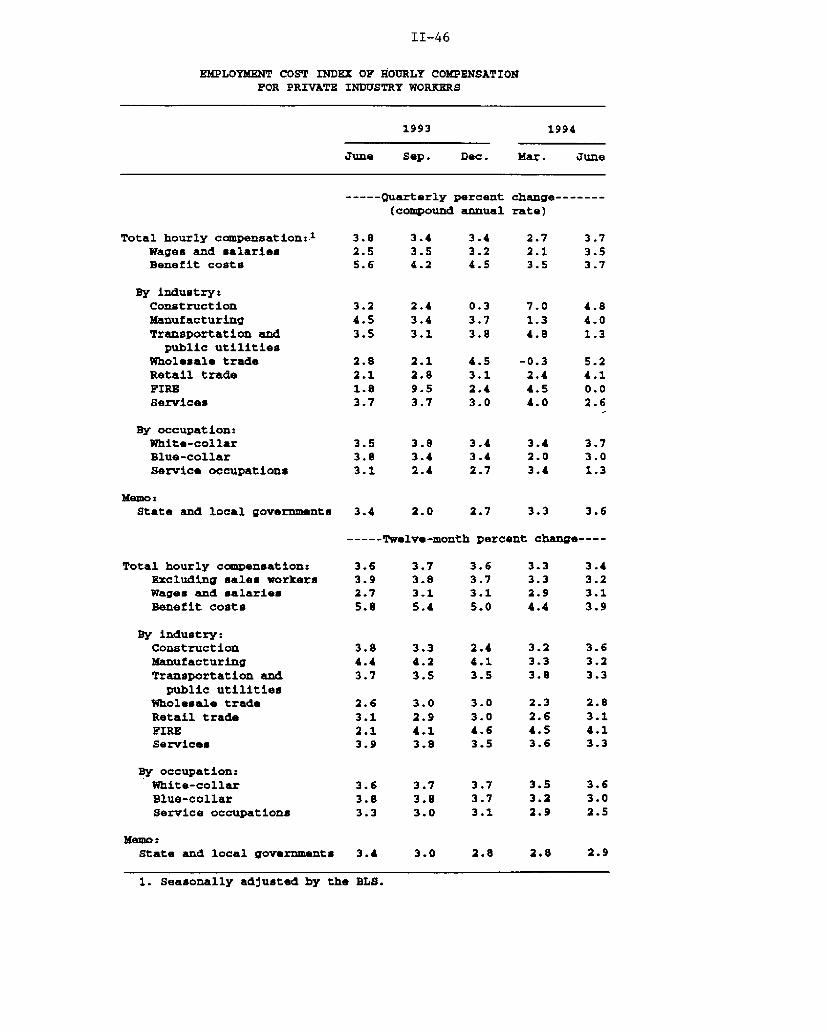
In the second quarter, hourly compensation, as measured by the
employment cost index (ECI), rose 3.7 percent at an annual rate,
following a sharp slowing in the first quarter. Over the twelve
months ended in June, ECI hourly compensation increased
223.4 percent. The acceleration in compensation last quarter
largely owed to a pickup in wage and salary growth. Hourly benefit
costs increased 3.7 percent at an annual rate over the March to June
period--just slightly faster than in the first quarter.
Over the past year, growth in wages and salaries has moved up
about 1/2 percentage point with almost all of the pickup due to
23increased earnings of sales workers.23 Wage growth of sales
workers rose from 1.4 percent over the twelve months ended in June
1993 to 4.1 percent ended in June of this year. Excluding sales
occupations, hourly wage and salary growth has held steady at about
3 percent over the past year.
22. Nonfarm hourly compensation increased 3 percent over the sameperiod. In recent revisions, nonfarm hourly compensation growth wasnot revised in 1993 at 2.5 percent, growth in compensation per hourin 1992 was revised up about 1/2 percentage point to 5.2 percent,and growth in 1991 was not revised.
23. Earnings of sales workers could increase because of a greatervolume of sales, an increase in the commission rate/base wage, orboth. An increase in the commission rate or base wage is moreindicative of wage pressure. Unfortunately, no information on thesource of change is available from the ECI data.
II-46
EMPLOYMENT COST INDEX OF HOURLY COMPENSATIONFOR PRIVATE INDUSTRY WORKERS
1993 1994
June Sep. Dec. Mar. June
----- Quarterly percent change(compound annual rate)
Total hourly compensation:.1
Wages and salariesBenefit costs
By industry:ConstructionManufacturingTransportation and
public utilitiesWholesale tradeRetail tradeFIREServices
By occupation:White-collarBlue-collarService occupations
Memo:State and local governments
Total hourly compensation:Excluding sales workersWages and salariesBenefit costs
3.8 3.4 3.4 2.7 3.72.5 3.5 3.2 2.1 3.55.6 4.2 4.5 3.5 3.7
3.2 2.4 0.3 7.0 4.84.5 3.4 3.7 1.3 4.03.5 3.1 3.8 4.8 1.3
-0.32.44.54.0
3.5 3.8 3.4 3.4 3.73.8 3.4 3.4 2.0 3.03.1 2.4 2.7 3.4 1.3
2.0 2.7 3.3 3.6
----- Twelve-month percent change----
By industry:ConstructionManufacturingTransportation and
public utilitiesWholesale tradeRetail tradeFIREServices
By occupation:White-collarBlue-collarService occupations
MemoState and local governments
3.8 3.3 2.4 3.2 3.64.4 4.2 4.1 3.3 3.23.7 3.5 3.5 3.8 3.3
3.6 3.7 3.7 3.5 3.63.8 3.8 3.7 3.2 3.03.3 3.0 3.1 2.9 2.5
3.0 2.8 2.8 2.9
1. Seasonally adjusted by the BLS.

II-47
Increases in hourly benefit costs have slowed nearly
2 percentage points over the past year owing largely to a
deceleration in the growth of health care costs. Growth in
employers' costs for health insurance was 5 percent over the twelve
months ended in June, down nearly 3 percentage points from the
previous year and considerably below the annual rates of increase of
close to 14 percent during the late 1980s. The deceleration in
employers' health costs probably reflects the combination of the
slowing in overall growth in health care costs, efforts by employers
to shift a greater proportion of costs onto workers, and the ongoing
shift away from traditional indemnity plans. Up-to-date data are
limited, but information from the Employee Benefits Survey (EBS) of
Medium to Large Firms (100 or more employees) indicates that the
percent of employees who contributed to their own employer-sponsored
health care plans rose from 35 percent in 1985, before the recent
run-up in ECI hourly health care costs, to more than 50 percent in
1991.24 Also, the percentage of employees participating in
employer-sponsored health plans declined from more than 90 percent
in 1989 (a coverage rate that had held for some time) to 83 percent
in 1991.25
The consumer price index also indicates that the cost of health
care has decelerated considerably. Over the twelve months ended in
July, the CPI for medical care (including services and commodities)
24. The survey covers the same group of firms as contained in theECI data. Trends evident between 1985 and 1991 likely havecontinued over the most recent 2-1/2 years.
25. Firms have put downward pressure on costs through preferredprovider organizations (PPOs). The EBS indicates that in recentyears participation in PPOs increased considerably at the expense oftraditional fee-for-service plans. The percentage participating inhealth maintenance organizations (HMOs) has held steady at about17 percent in recent years.

II-48
EMPLOYMENT COST INDEX OF HOURLY WAGES AND SALARIESFOR PRIVATE INDUSTRY WORKERS
(Twelve-month percent changes)
1993 1994
June Sep. Dec. Mar. June
Hourly wages and salaries 2.7 3.1 3.1 2.9 3.1By industry:
Construction 2.3 2.4 2.0 2.5 2.9Manufacturing 2.9 3.0 3.2 2.9 3.0Transportation and 3.1 3.1 3.2 3.1 2.8
public utilitiesWholesale trade 2.3 2.9 2.6 2.0 2.8Retail trade 2.9 2.9 2.9 2.3 2.8FIRE 1.0 3.8 4.2 4.0 3.6Services 3.2 3.2 3.0 3.2 3.1
By occupationsWhite-collar 2.8 3.4 3.3 3.1 3.3Blue-collar 2.5 2.7 2.9 2.8 2.9Service occupations 2.2 2.1 2.1 2.5 2.4
MemoState and local governments 2.8 2.9 2.7 2.7 2.8
EMPLOYMENT COST INDEX OF HOURLY BENEFIT COSTSFOR PRIVATE INDUSTRY WORKERS
(Twelve-month percent changes)
1993 1994
June Sep. Dec. Mar. June
Hourly benefit costs1 5.8 5.4 5.0 4.4 3.9Insurance costs 7.2 6.8 6.4 5.1 4.4
Health care 7.8 7.2 6.9 5.7 5.0Supplemental pay 4.3 4.8 2.8 5.3 5.5Retirement and savings 6.6 4.6 4.9 9.5 9.6Paid leave 3.7 3.7 3.4 2.9 2.8Legally required 5.3 4.6 4.4 3.7 3.1
By industry:Goods-producing 7.0 6.3 5.6 4.2 3.8Service-producing 4.9 4.4 4.5 4.5 4.1
By occupation:White-collar occupations 5.4 4.8 4.6 4.7 4.5Blue-collar occupations 6.3 5.9 5.5 4.0 3.3Service occupations 6.3 5.5 5.5 4.1 2.9
Memo:State and local governments 4.4 3.2 2.9 3.0 3.2
1. The detail on benefit costs is from unpublished data from theBLS.

II-49
rose 4.6 percent. 2 6 This is down from 6.0 percent over the same
period of a year ago and annual increases of more than 9-1/2 percent
in late 1990 and early 1991.
In addition to the slowing in employers' costs for health
insurance, benefit growth has been restrained by a sharp
deceleration in costs for workers' compensation and unemployment
insurance. For workers' compensation, the slowing reflects both the
deceleration in health care costs described above and some changes
in state laws that place additional restrictions on eligibility.
The slowing in unemployment insurance costs largely reflects
improvements in experience ratings, and the better condition of
state unemployment insurance funds associated with the ongoing
strengthening of the labor market.
In contrast to these areas of slowing benefit cost growth,
hourly pension costs and nonproduction bonuses increased more than
10 percent over the past twelve months, compared with increases of
about 6-1/2 percent for the same period a year ago. Anecdotal
evidence indicates that the acceleration in pension costs reflects
the need by some firms to lower overly optimistic investment
assumptions, as well as some efforts by regulators to push companies
with underfunded plans to increase their contributions. The faster
growth in nonproduction bonuses largely reflects improved profits at
many firms over the past year.
The only aggregate data that we have on wages in the third
quarter are average hourly earnings of production or nonsupervisory
workers. AHE rose 0.4 percent in July, following a decline in the
previous month. The largest increases last month were recorded in
26. The CPI measures list prices of a fixed basket of medicalservices and commodities. Although the PCE deflator for medicalservices is based partly on the CPI, it also incorporates data ontransactions prices (rather than list prices), which should make ita better measure of costs paid. The PCE deflator for medicalservices increased 4 percent over the year ending in June.

II-50
8/4/94
COMPONENTS OF ECI BENEFIT COSTS(Private industry workers; twelve-month percent change)
Insurance Costs
- Total insurance costs- - Health insurance
Twelve-month percent change, 16
4
21986 1987 1988 1989 1990 1991 1992 1993 1994
Paid Leave
Twelve-month percent change 55
5.0
4.5
4.0
3.5
3.0
. ".l 2.51986 1987 1988 1989 1990 191 1992 1993 1994
Supplemental Pay
- All supplemental pay- - Nonproducton bonuses
Twelve-month percent change
10/1
II
919I 1 I I I I,198 1987 1988 1989 1990 1991 1992 1993 1994
Savings and Pension Plans
- Retirement and savings- - Pension plans only
Twelve-month percent change
10
1v5
1 , i -
0
1 8 1 -5
1986 1987 1988 1989 1990 1991 1992 1993 1994
Legally Required Benefits
- Workers' compensation insurance
Twelve-month percent change
Legally Required Benefits
- State unemployment insurance
Twelve-month percent change
1986 1987 1988 1989 1990 1991 1992 1993 1994 1986 1987 1988 1989 1990 1991
II-51
HOURLY COMPENSATION(Private nonagricultural industries)
Percent change from year earlier
- Employment cost index- - -Nonfarm houry compensation
A / - /A
1985 1986 1987 1988 1989 1990 1991 1992 1993 1994
Unit Labor CostsPercent change from year earlier
1985 1986 1987 1988 1989 1990 1991 1992 1993 1994
REVISIONS TO LABOR COSTS(Nonfarm business sector; percent change at an annual rate)
1994 1993:Q2-1991 1992 1993 Q1 02 1994-Q2
Compensation per hourRevised 4.7 5.2 2.5 6.1 .8 3.0Previous 4.7 4.8 2.5 5.3 n.a. n.a.
Unit labor costsRevised 2.3 1.9 .6 3.1 2.0 .4Previous 2.5 1.5 .8 3.9 n.a. n.a.
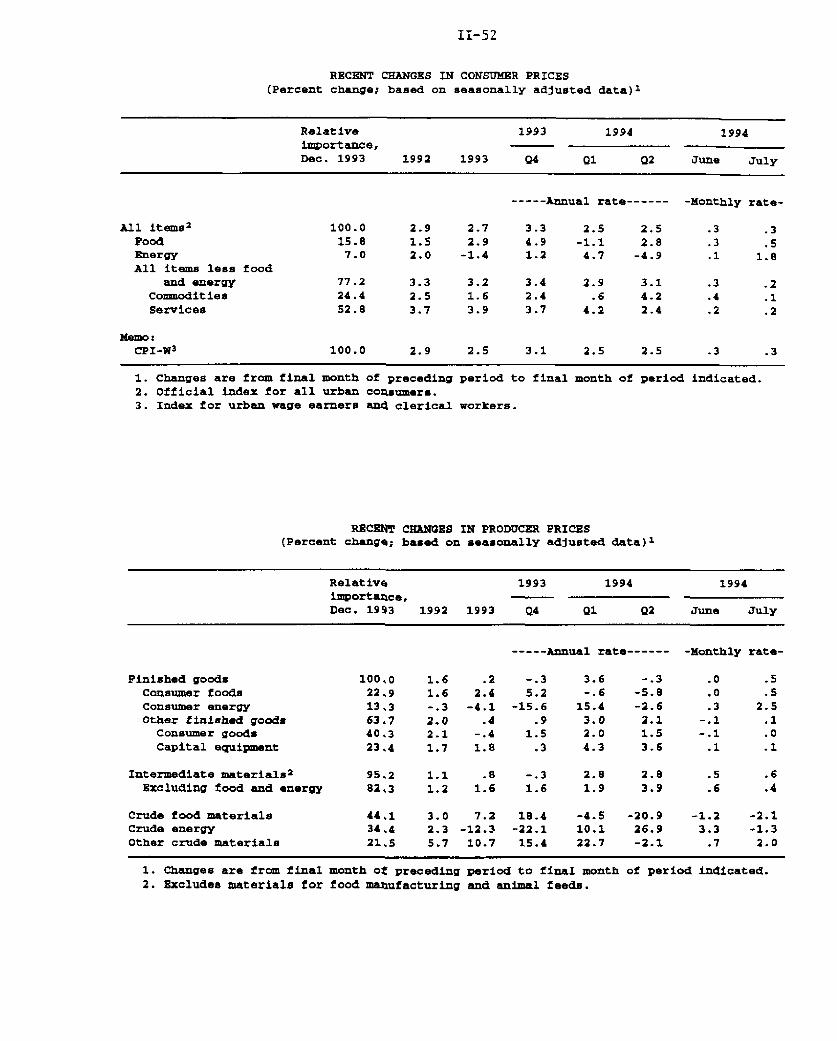
II52
RECENT CHANGES IN CONSUMER PRICES(Percent change; based on seasonally adjusted data) 1
Relative 1993 1994 1994importance,Dec. 1993 1992 1993 Q4 Q1 Q2 June July
----- Annual rate------ -Monthly rate-
All items 2 100.0 2.9 2.7 3.3 2.5 2.5 .3 .3Food 15.8 1.5 2.9 4.9 -1.1 2.8 .3 .5Energy 7.0 2.0 -1.4 1.2 4.7 -4.9 .1 1.8All items less food
and energy 77.2 3.3 3.2 3.4 2.9 3.1 .3 .2Commodities 24.4 2.5 1.6 2.4 .6 4.2 .4 .1Services 52.8 3.7 3.9 3.7 4.2 2.4 .2 .2
Memo:CPI-W3 100.0 2.9 2.5 3.1 2.5 2.5 .3 .3
1. Changes are from final month of preceding period to final month of period indicated.2. Official index for all urban consumers.3. Index for urban wage earners and clerical workers.
RECENT CHANGES IN PRODUCER PRICES(Percent change; based on seasonally adjusted data) 1
Relative 1993 1994 1994importance,Dec. 1993 1992 1993 Q4 Q1 Q2 June July
-----Annual rate------ -Monthly rate-
Finished goods 100,0 1.6 .2 -.3 3.6 -.3 .0 .5Consumer foods 22.9 1.6 2.4 5.2 -. 6 -5.8 .0 .5Consumer energy 13,3 -. 3 -4.1 -15.6 15.4 -2.6 .3 2.5Other finished goods 63.7 2.0 .4 .9 3.0 2.1 -. 1 .1
Consumer goods 40,3 2.1 -. 4 1.5 2.0 1.5 -. 1 .0Capital equipment 23.4 1.7 1.8 .3 4.3 3.6 .1 .1
Intermediate materials2 95.2 1.1 .8 -.3 2.8 2.8 .5 .6Excluding food and energy 82,3 1.2 1.6 1.6 1.9 3.9 .6 .4
Crude food materials 44.1 3.0 7.2 18.4 -4.5 -20.9 -1.2 -2.1Crude energy 34.4 2.3 -12.3 -22.1 10.1 26.9 3.3 -1.3Other crude materials 21.5 5.7 10.7 15.4 22.7 -2.1 .7 2.0
1. Changes are from final month of preceding period to final month of period indicated.2. Excludes materials for food manufacturing and animal feeds.
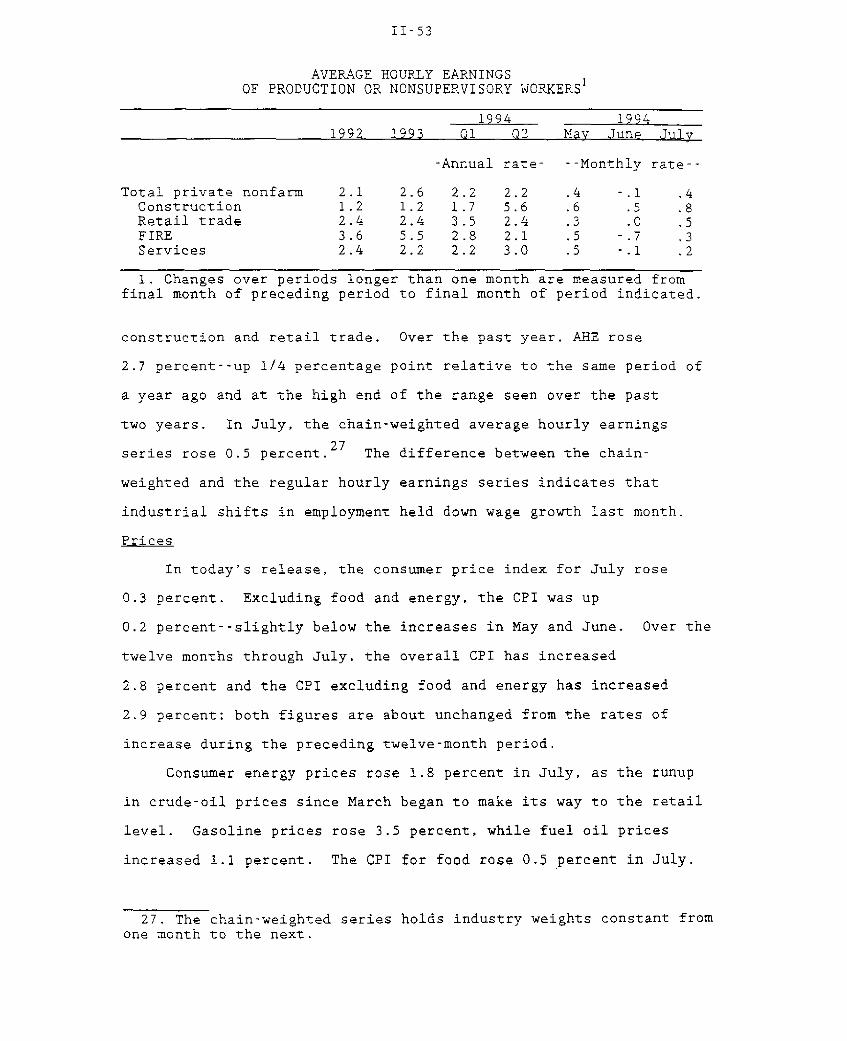
II-53
AVERAGE HOURLY EARNINGSOF PRODUCTION OR NONSUPERVISORY WORKERS
1994 19941992 1993 Q1 Q2 May June July
-Annual rate- --Monthly rate--
Total private nonfarm 2.1 2.6 2.2 2.2 .4 -.1 .4Construction 1.2 1.2 1.7 5.6 .6 .5 .8Retail trade 2.4 2.4 3.5 2.4 .3 .0 .5FIRE 3.6 5.5 2.8 2.1 .5 -.7 .3Services 2.4 2.2 2.2 3.0 .5 -.1 .2
1. Changes over periods longer than one month are measured fromfinal month of preceding period to final month of period indicated.
construction and retail trade. Over the past year, AHE rose
2.7 percent--up 1/4 percentage point relative to the same period of
a year ago and at the high end of the range seen over the past
two years. In July, the chain-weighted average hourly earnings
27series rose 0.5 percent.27 The difference between the chain-
weighted and the regular hourly earnings series indicates that
industrial shifts in employment held down wage growth last month.
Prices
In today's release, the consumer price index for July rose
0.3 percent. Excluding food and energy, the CPI was up
0.2 percent--slightly below the increases in May and June. Over the
twelve months through July, the overall CPI has increased
2.8 percent and the CPI excluding food and energy has increased
2.9 percent; both figures are about unchanged from the rates of
increase during the preceding twelve-month period.
Consumer energy prices rose 1.8 percent in July, as the runup
in crude-oil prices since March began to make its way to the retail
level. Gasoline prices rose 3.5 percent, while fuel oil prices
increased 1.1 percent. The CPI for food rose 0.5 percent in July.
27. The chain-weighted series holds industry weights constant fromone month to the next.

II-54
INFLATION RATES EXCLUDING FOOD AND ENERGY
Percent change from six monthsearlier
Jan. July Jan. July1993 1993 1994 1994
CPI 3.3 3.2 2.6 3.1
Goods 2.1 1.5 1.0 2.5
Alcoholic beverages 2.3 0.3 2.7 .0New vehicles 2.0 3.7 2.7 5.3Apparel 0.5 -0.6 1.2 0.8House furnishings -0.4 -0.4 4.3 0.9Housekeeping supplies .0 -0.6 3.0 0.9Medical commodities 4.2 3.4 3.0 2.7Entertainment 1.8 0.5 2.4 2.7Tobacco 11.4 2.8 -16.3 5.2
Services 3.9 3.9 3.4 3.4
Owners' equivalent rent 3.5 2.9 3.0 3.2Tenants' rent 2.6 2.0 2.4 2.2Other renters' costs 1.3 4.3 2.8 3.1Airline fares 16.6 22.7 2.5 3.3Medical care 6.8 6.5 4.7 5.2Entertainment 3.4 2.4 6.1 1.9Auto financing -13.1 -7.7 -5.5 27.2Tuition 8.7 8.0 5.7 7.5
PPI finished goods 1.8 1.6 -0.6 1.6
Consumer goods 1.6 1.4 -1.9 0.9
Capital goods, excludingcomputers 2.4 2.5 2.3 3.1
Computers -9.9 -15.9 -7.3 -5.6
PPI intermediate materials 1.1 1.5 1.5 3.4
PPI crude materials 8.3 10.9 9.2 8.2
Factors affecting price inflation
ECI hourly compensation1 3.4 3.8 3.4 3.2Goods-producing 3.9 4.3 3.2 3.3Service-producing 3.2 3.3 3.8 2.9
Civilian unemployment rate, 3 7.1 6.8 6.7 6.1
Capacity utilization2 , 3 79.7 80.1 82.3 82.8(manufacturing)
Inflation expectations5 ,6
Michigan Survey 4.6 4.9 3.7 4.7Conference Board 4.3 4.6 4.3 4.3
Non-oil import price7 1.8 -1.5 2.2 1.7Consumer goods, excluding autos,
food, and beverages 3.3 -0.8 1.9 .0Autos 1.5 -0.6 3.8 4.5
1. Private industry workers, periods ended in June.2. End-of-period value.3. Data for 1994 are not directly comparable with earlier values
because of a redesign of the CPS in January 1994.4. Latest reported value: June.5. One-year-ahead expectations.6. Latest reported value: August.7. BLS import price index (not seasonally adjusted).

II-55
Fresh fruit and vegetable prices registered another large increase,
and coffee prices were up 22 percent. Meat prices declined in July,
and price increases for other food categories were quite modest.
Food prices so far this year have risen at a 1-1/2 percent annual
rate, compared with a 3 percent increase in 1993.
In today's CPI report, new vehicle prices rose 0.4 percent.
These price increases reflected the effects of seasonal adjustment;
the prices before seasonal adjustment were unchanged. In recent
years, automotive companies have offered incentive programs at the
end of the model year. This year, however, such incentives were not
needed since stocks of cars and trucks are quite lean. Elsewhere,
apparel prices fell 0.5 percent in July, reflecting summer sales and
the slower-than-usual introduction of fall merchandise. Within the
services category, rent increases picked up in July, but this was
partially offset by a decline in other renters' costs and small
increases in other service components.
Over the six months through July, the CPI excluding food and
energy has increased 3.1 percent at an annual rate, essentially the
same pace as in the six-month period a year earlier. (The
intervening six-month period is distorted by an unusual decline in
tobacco prices.) Prices of consumer goods other than food and
energy have increased 2.5 percent over the past six months, about
twice the pace of the year-earlier period. New motor vehicle prices
have accelerated by about 1-1/2 percentage points at an annual rate,
reflecting both strong demand, which has pushed production of some
models to capacity, and the weakness of the dollar against the
Japanese yen, which has boosted prices of imported models. Among
other goods, apparel prices have also accelerated; however,
movements in these prices can be very erratic.
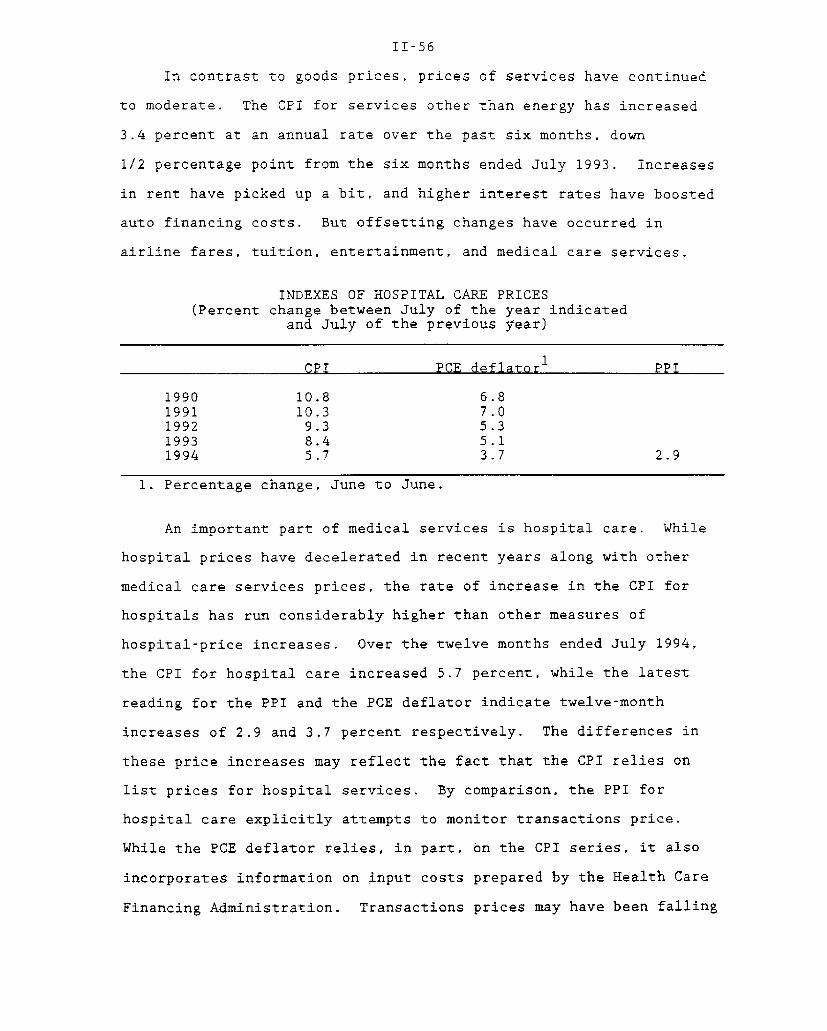
II-56
In contrast to goods prices, prices of services have continued
to moderate. The CPI for services other than energy has increased
3.4 percent at an annual rate over the past six months, down
1/2 percentage point from the six months ended July 1993. Increases
in rent have picked up a bit, and higher interest rates have boosted
auto financing costs. But offsetting changes have occurred in
airline fares, tuition, entertainment, and medical care services.
INDEXES OF HOSPITAL CARE PRICES(Percent change between July of the year indicated
and July of the previous year)
CPI PCE deflator1 PPI
1990 10.8 6.81991 10.3 7.01992 9.3 5.31993 8.4 5.11994 5.7 3.7 2.9
1. Percentage change, June to June.
An important part of medical services is hospital care. While
hospital prices have decelerated in recent years along with other
medical care services prices, the rate of increase in the CPI for
hospitals has run considerably higher than other measures of
hospital-price increases. Over the twelve months ended July 1994,
the CPI for hospital care increased 5.7 percent, while the latest
reading for the PPI and the PCE deflator indicate twelve-month
increases of 2.9 and 3.7 percent respectively. The differences in
these price increases may reflect the fact that the CPI relies on
list prices for hospital services. By comparison, the PPI for
hospital care explicitly attempts to monitor transactions price.
While the PCE deflator relies, in part, on the CPI series, it also
incorporates information on input costs prepared by the Health Care
Financing Administration. Transactions prices may have been falling

II-57
relative to list prices, as health insurance companies have
increasingly negotiated discounts with hospitals.
PRICES IN THE NATIONAL ACCOUNTS(Percent change, annual rate)
1992 1 1993 1 1994:Q1 1994:Q2
GDP fixed-weight price index 3.2 2.8 3.1 2.9
Federal government 3.3 3.9 4.8 7.7
GDP deflator 2.6 1.8 2.9 2.9
1. Fourth quarter to fourth quarter percent change.
Over the first half of the year, the fixed-weight price index
for GDP increased at a 3 percent annual rate, up slightly from the
2-3/4 percent increase over the four quarters of 1993. The pickup
in the price index for the federal government in the first half of
the year was particularly marked, reflecting the unusually large
number of days the government was shut down for inclement weather
and holidays, the effects of the early retirement "buy-out" scheme
for federal workers, and the pay raise in the first quarter of the
year. 2 8 Excluding the federal sector. GDP prices rose about as
fast in the first half of the year as in 1993. The larger
acceleration in the GDP deflator reflects both the price effects
evident in the fixed-weight index and shifts in the composition of
GDP--particularly the slower growth in business purchases of
computers, which have a very low deflator level.
Finished goods prices in yesterday's PPI report rose
0.5 percent, while, excluding food and energy, the PPI was up
0.1 percent. Finished energy prices posted a large 2.5 percent
increase, led by an 8 percent increase in gasoline prices.
28. As noted above, the early retirement program and the unusualnumber of shutdowns should have only a transitory effect on thelevel of the federal government deflator.
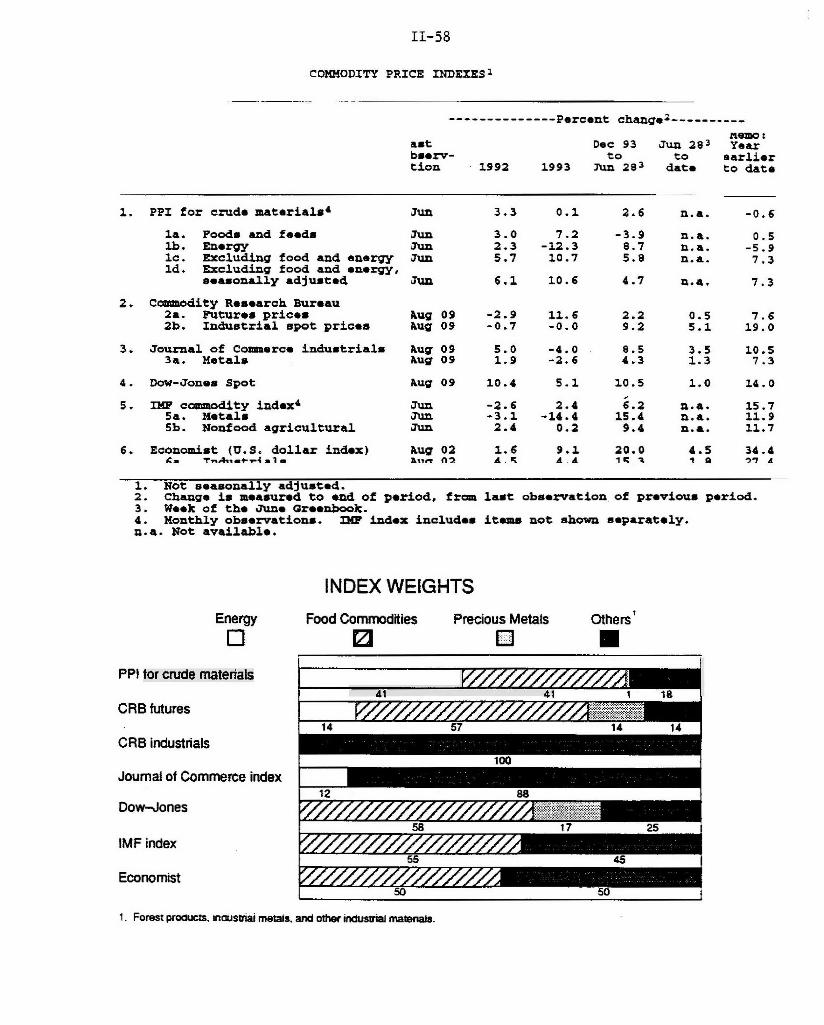
II-58
COMMODITY PRICE INDEXES1
------------- Percent change2- -- - -- --- -
PastObserv-ation
1. PPI for crude materials4
la. Foods and feedslb. Energylc. Excluding food and energy1d. Excluding food and energy,
seasonally adjusted
2. Commodity Research Bureau2a. Futures prices2b. Industrial spot prices
3. Journal of Commerce industrials3a. Metals
4. Dow-Jones Spot
5. IMF commodity index4
5a. Metals5b. Nonfood agricultural
6. Economist (U.S. dollar index)6a. Industrials
Jun
JunJunJun
Jun
Dec 93to
1992 1993 Jun 28 3
3.3
3.02.35.7
6.1
Aug 09Aug 09
Aug 09Aug 09
Aug 09
JunJunJun
Lug 02Lure A'2
-2.9-0.7
5.01.9
10.4
-2.6-3.1
2.4
1.6A-
0.1
7.2-12.3
10.7
10.6
11.6-0.0
-4.0-2.6
5.1
2.4-14.4
0.2
9.1A.A
2.6
-3.98.75.8
4.7
2.29.2
8.54.3
10.5
6.215.49.4
20.0tr 1
1. Not seasonally adjusted.2. change is measured to end of period, from3. Week of the June Greenbook.4. Monthly observations. IMF index includesn.a. Not available.
last observation of previous period.
items not shown separately.
INDEX WEIGHTS
Food Commodities
0Precious Metals
0PPI for crude materials
CRB futures
CRB industrials
Journal of Commerce index
Dow-Jones
IMF index
Economist
41 41 1 18
14 57 14 14
100
12 88
5B 17 25
55 45
5050
1. Forest products, mausbtna metals and other indusial matenals.
Jun 283to
date
n.a.
n.a.n.a.n.a.
n.a,
0.55.1
3.51.3
1.0
n.a.n.a.n.a.
4.5I a
nemo:Yearearlierto date
-0.6
0.5-5.97.3
7.3
7.619.0
10.57.3
14.0
15.711.911.7
34.4,T A
EnergyO
Others'
U

II-59
reflecting the recent run-up in crude oil prices. Finished food
prices rose 0.5 percent in July, boosted by a 43 percent jump in
coffee prices.
Prices of intermediate materials other than food and energy
rose 0.4 percent in July after increasing 0.6 percent in June. So
far this year, intermediate materials prices have increased at a
3 percent annual rate, up from 1-1/2 percent over the twelve months
of 1993. The pickup in intermediate materials price increases
likely reflects pressures from tightening capacity utilization and
from higher prices of nonfood, nonenergy crude materials, which have
risen at a 12 percent annual rate so far this year, following an
11 percent increase in 1993.
Spot commodity prices have been mixed since the last Greenbook.
Industrial materials have posted further increases, led by steel
scrap prices, which have surged in response to the continued high
level of demand in this sector. In contrast, prices of the major
crops have plummeted in recent weeks. The price of corn has fallen
16.5 percent since the last Greenbook and the price of soybeans has
dropped almost 17 percent. The recent declines have returned these
prices to their levels before last summer's flood. Coffee prices,
which had surged in the second quarter, increased further in the
early inter-Greenbook period. Although some of the increase has
since been reversed, spot prices are roughly triple the levels of a
year ago.
Driving prices lower for agricultural commodities have been
forecasts of near-record production. As expected at the time of the
last Greenbook, the USDA's August forecast of crop production,
indicates a bumper harvest in the major U.S. grain crops (table).
Corn production is expected to rise 45 percent over last year's
unusually low level, as a result of favorable growing conditions in

II-60
COMMODITY PRICE MEASURES
Journal of Commerce Index
Total- - Metals
Ratio scale, index(1980-100)
A x-1. \ it,SA 9.
I .
\ ~ e ~J'
1983 1984 1985 1986 1987 1988 1989 1990 1991 1992 1993 1994 19
CRB Spot Industrials
Ratio scale, index(1967-100)
Aug 9
130125
115
105
95
85
7595
CRB Futures
Ratio scale, index(1967-100) 320
- 310
-290
270
250Aug9
230
210
* * I I , I [ , , , I * I I * I I , i . I.* i 1 r .L I J , I r 1 r I i r. I " 1 ^901983 1984 1985 1986 1987 1988 1989 1990 1991 1992 1993 1994 1995
• Weekly data, Tuesdays: Journal of Commerce data monthly before 1985.
- 105- 104
- 100
i96Jun Jul Aug
1994
CRB hndustrial
Dashed lines indicate week oflast Greenbook.
ii II Yllil I L.L r L I I.L I ( 11 I I i 1 I L1 IL1 I L.1 I 1- I I'' - 1I.

II-61
the Midwest. The soybean harvest is expected to be roughly
25 percent higher than last year, and wheat production is
anticipated to be in line with last year's output. However, wheat
prices have been buoyed in recent weeks by the expected shortfalls
in world production of wheat, driven particularly by problems in the
former Soviet Union.
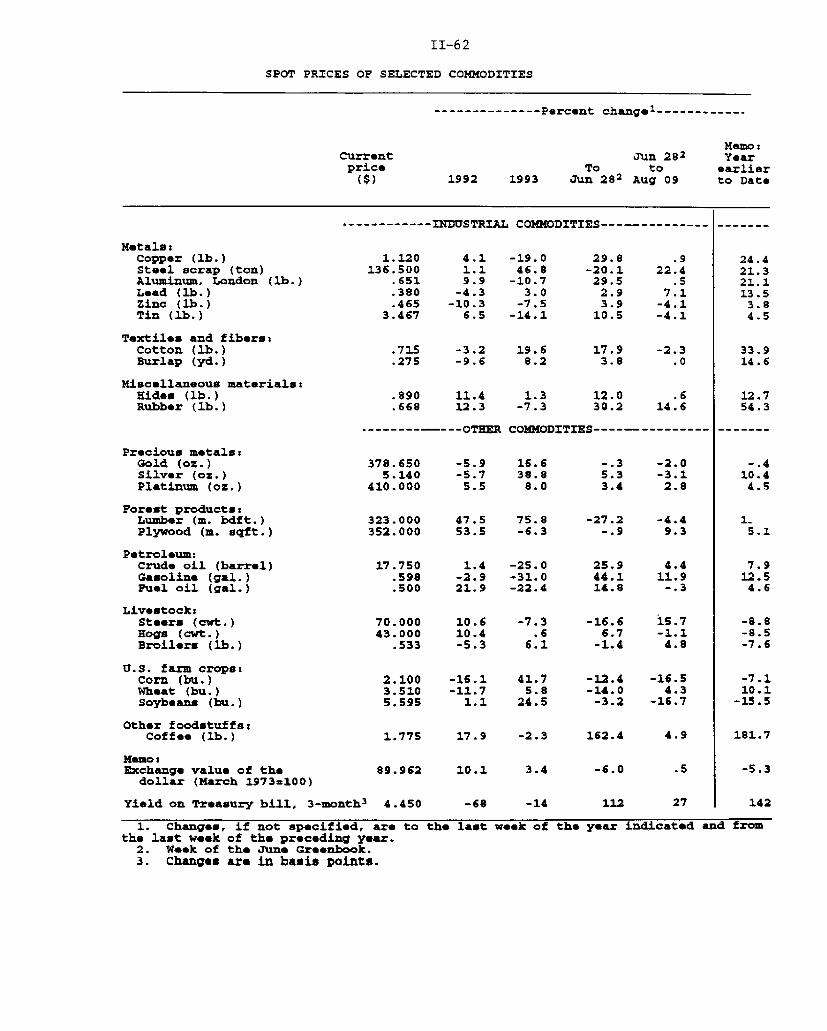
II-62
SPOT PRICES OF SELECTED COMMODITIES
-------------- Percent change1------------
Memo:Current Jun 28 2 Yearprice To to earlier
($) 1992 1993 Jun 28 2 Aug 09 to Date
----------- INDUSTRIAL COMMODITIES-------------- -------
Metals:Copper (lb.)Steel scrap (ton)Aluminum, London (lb.)Lead (lb.)Zinc (lb.)Tin (lb.)
Textiles and fibers:Cotton (lb.)Burlap (yd.)
Miscellaneous materials:Hides (lb.)Rubber (lb.)
Precious metals:Gold (oz.)Silver (oz.)Platinum (oz.)
Forest products:Lumber (m. bdft.)Plywood (m. sqft.)
Petroleum:Crude oil (barrel)Gasoline (gal.)Fuel oil (gal.)
Livestock:Steers (cwt.)Hogs (cwt.)Broilers (lb.)
U.S. farm crops:Corn (bu.)Wheat (bu.)Soybeans (bu.)
Other foodstuffs:Coffee (lb.)
Memo:Exchange value of the
dollar (March 1973=100)
1.120 4.1136.500 1.1
.651 9.9
.380 -4.3
.465 -10.33.467 6.5
.715 -3.2
.275 -9.6
.890 11.4
.668 12.3
------------OTHER
378.650 -5.95.140 -5.7
410.000 5.5
323.000 47.5352.000 53.5
17.750 1.4.598 -2.9.500 21.9
70.000 10.643.000 10.4
.533 -5.3
2.100 -16.13.510 -11.75.595 1.1
1.775 17.9
89.962 10.1
-19.0 29.8 .946.8 -20.1 22.4
-10.7 29.5 .53.0 2.9 7.1
-7.5 3.9 -4.1-14.1 10.5 -4.1
19.6 17.9 -2.38.2 3.8 .0
1.3 12.0 .6-7.3 30.2 14.6
COMMODITIES---------------
16.6 -. 3 -2.038.8 5.3 -3.18.0 3.4 2.8
75.8 -27.2 -4.4-6.3 -.9 9.3
-25.0 25.9 4.4-31.0 44.1 11.9-22.4 14.8 -. 3
-7.3 -16.6 15.7.6 6.7 -1.1
6.1 -1.4 4.8
41.7 -12.4 -16.55.8 -14.0 4.3
24.5 -3.2 -16.7
-2.3 162.4 4.9
3.4 -6.0 .5
Yield on Treasury bill, 3-month 3 4.450
1. Changes, if not specified, arethe last week of the preceding year.
2. Week of the June Greenbook.3. Changes are in basis points.
to the last week of the year indicated and from
24.421.321.113.5
3.84.5
33.914.6
12.754.3
-. 410.44.5
1-5.1
7.912.54.6
-8.8-8.5-7.6
-7.110.1
-15.5
181.7
-5.3
142; --

II-63
U.S. CROP PRODUCTION1
USDA Projectionsfor 1994
1992 1993 May 12 July 12 Aug. 12
- -- - - - Billions of bushels -
9.482.192.46.88.30.46
6.341.812.40.57.21.40
8.732.102.36
.59
.25
.40
9.002.162.42.62.25
9.202.282.39.66.25.39
- -- - Billions of hundredweight
7. Rice
- - - - - - Billions of pounds - - - - - - -
4.281.72
3.331.61
n.a.n.a.
n.a.n.a.
4.091.56
Millions of bales -
10. Cotton 16.22 16.18 17.70 18.00 19.2
- - - - - - - Millions of tons - -
11. Sugar beets12. Sugar cane
29.14 26.4030.36 30.53
n.a.n.a.
n.a. 29.2n.a. 31.4
Memo:
- ---- Billions of 1987 dollars -
13. Value, 12 crops13. Value, 12 crops 47.03 38.42 44.58 45.65 46.76
1. Data are from the U.S. Department of Agriculture.2. Calculated by the staff from USDA data.
CornSoybeansWheatSorghumOatsBarley
PeanutsTobacco

DOMESTIC FINANCIALDEVELOPMENTS
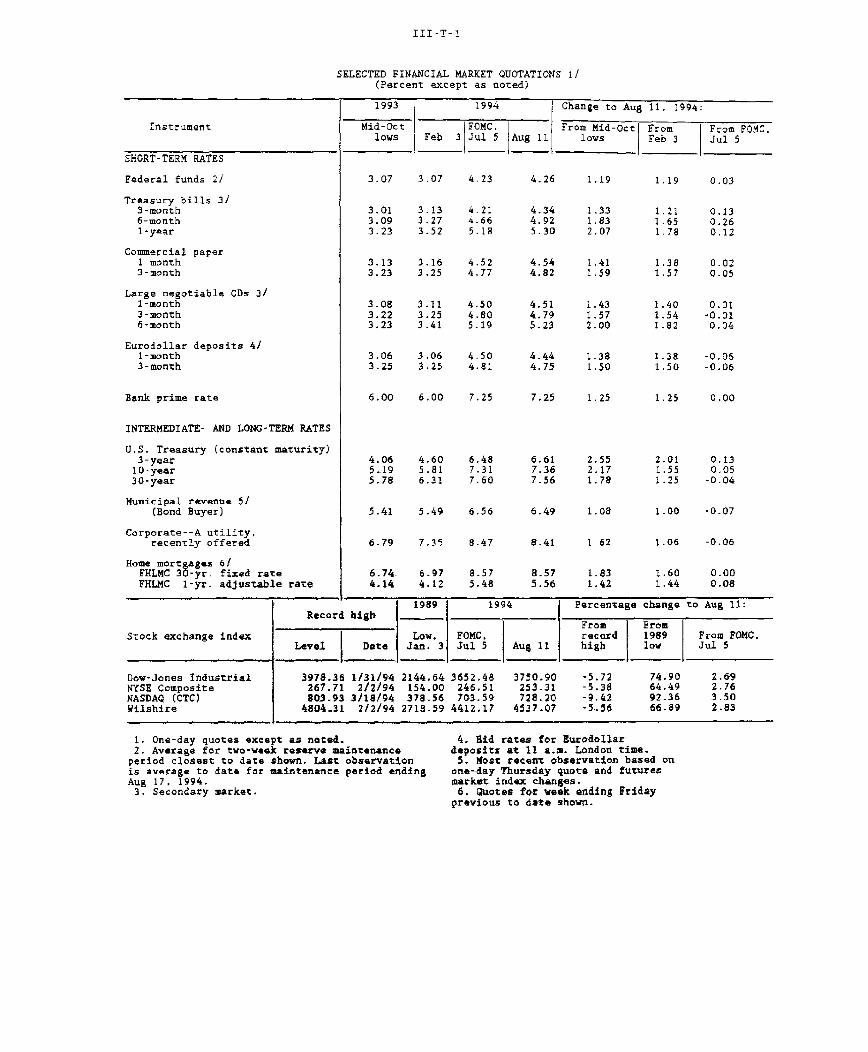
III-T-1
SELECTED FINANCIAL MARKET QUOTATIONS 1/(Percent except as noted)
Instrument
SHORT-TERM RATES
Federal funds 2/
Treasury bills 3/3-month6-month1-year
Commercial paper1-month3-month
Large negotiable CDs 3/1-month3-month6-month
Eurodollar deposits 4/1-month3-month
Bank prime rate
INTERMEDIATE- AND LONG-TERM RATES
U.S. Treasury (constant maturity)3-year10-year30-year
Municipal revenue 5/(Bond Buyer)
Corporate--A utility,recently offered
Home mortgages 6/FHLMC 30-yr. fixed rateFHLMC 1-yr. adjustable rate
1993 1994 Change to Aug 11, 1994:
Mid-Oct FOMC, From Mid-Oct From From FOMC,lows Feb 3 Jul 5 Aug 11 lows Feb 3 Jul 5
3.07 3.07 4.23 4.26 1.19
3.01 3.13 4.21 4.34 1.333.09 3.27 4.66 4.92 1.833.23 3.52 5.18 5.30 2.07
3.13 3.16 4.52 4.54 1.413.23 3.25 4.77 4.82 1.59
3.08 3.11 4.50 4.51 1.433.22 3.25 4.80 4.79 1.573.23 3.41 5.19 5.23 2.00
3.06 3.06 4.50 4.44 1.383.25 3.25 4.81 4.75 1.50
6.00 6.00 7.25
4.06 4.60 6.485..19 5.81 7.315.78 6.31 7.60
5.41 5.49 6.56
6.79 7.35 8.47
6.74. 6.974.14 4.12
7,25 1.25
6.61 2.557.36 2.177.56 1.78
6.49 1.08
8.41 1 62
8.57 1.835.56 1.42
1.19 0.03
1.21 0.131.65 0.261.78 0.12
1.38 0.021.57 0.05
1.40 0.011.54 -0.011.82 0.04
1.38 -0.061.50 -0.06
1.25 0.00
2.01 0.131.55 0.051.25 -0.04
1.00 -0.07
1.06 -0.06
1.60 0.001.44 0.08
1989 1994 Percentage change to Aug 11:Record high
From From
Stock exchange index Low. FOMC. record 1989 From FOMC.Level Date Jan. 3 Jul 5 Aug 11 high low Jul 5
Dow-Jones Industrial 3978.36 1/31/94 2144.64 3652.48 3750.90 -5.72 74.90 2.69NYSE Composite 267.71 2/2/94 154.00 246.51 253.31 -5.38 64.49 2.76NASDAQ (OTC) 803.93 3/18/94 378.56 703.59 728.20 -9-42 92.36 3.50Wilshire 4804-31 2/2/94 2718.59 4412.17 4537-07 -5.56 66.89 2.83
1. One-day quotes except as noted.2. Average for two-week reserve maintenanceperiod closest to date shown, Last observationis average to date for maintenance period endingAug 17, 1994.3. Secondary market.
4. Bid rates for Eurodollardeposits at 11 a.m. London time.5. Most recent observation based on
one-day Thursday quote and futuresmarket index changes.6. Quotes for week ending Friday
previous to date shown.
i

Selected Interest Rates*(percent)
Statement Week Averages-- 1 12
Short-Term
- Prime Rate (daily)-.... Federal Funds
--- 3-month T-Bill-- Discount Rate(daily)
4 F-
19 I I I I1990 1991 1992 1993 1994
FOMC7/5
3-month T-Bil
Federal Funds
J - p I - I-j7/1 7/8 7/15 7/22
19947/29 8/5
Weekly/Daiy- 10
FOMC7/5 Prm Fned-Rate
7
(Daily)
1 I I I I i78 7/15 722
19847/29 851990 1991 1992 1993
SStatement weeks are ploted through Aug 10; Friday weeks thughAug 5, 1994.

DOMESTIC FINANCIAL DEVELOPMENTS
Interest rates registered mixed changes over the intermeeting
period. A growing sense that additional tightening was not imminent
helped to tilt most rates down in the opening weeks of the period.
These early declines in yield were reversed in August, when the
monthly employment report and other data were interpreted as
suggesting that the economy had retained considerable momentum and
that a policy response would be forthcoming. Major equity indexes
rose 2-1/2 to 3-1/2 percent over the intermeeting period, on better-
than-expected earnings reports. The spread of the thirty-year
fixed-rate mortgage over the comparable Treasury yield remained
fairly tight, as did most quality spreads.
The monetary aggregates rebounded sharply in July, after
contracting in June. Growth in M2 was boosted by an acceleration in
liquid deposits and a turnaround in money market mutual funds.
The about-face in money market funds was accompanied by renewed
liquidations of bond mutual funds. The strength in M2 showed
through to M3, which was also propelled by inflows to M3-type money
funds and significant issuance of large time deposits, which at
least in part reflected strong expansion in bank credit.
Borrowing by businesses has apparently picked up some over June
and July, although remaining concentrated at the short end. Boosted
by business lending, as well as strong growth in consumer loans,
bank credit accelerated to a double-digit pace in July. Business
loans were boosted in part by a cutback in capital market financing
as well as by merger-related lending. The pace of public offerings
in corporate equity and bond markets remained sluggish in July,
barely exceeding the slow pace seen during the turbulent markets of
April. Issuance of long-term debt by state and local governments
was similarly slow, as the volume of bonds eligible for refunding
III-1

III-2
MONETARY AGGREGATES(Based on seasonally adjusted data)
1994 1994 1993:04 Leveto (bil, S,
1993 Q1 Q2 May Jun. Jul. Jul- 94 Jul. 94Aggregate or component (p) (p) (p)
Aggregate Percentage change (annual rate) 1
10.5 6.01.4 1.80.6 0.2
Selected components
4. Mi-A
5. Currency6. Demand deposits
7. Other checkable deposits
1.9 1.9 3.7 7.61.4 0.3 -3.2 4.9-0.1 -1.8 -1.1 6.0
1153.73595.94233.4
11.7 9.5 3.5 -0.3 5.6 9.6 6.6 740.9
10.3 11.8 10.6 10.0 9.6 10.2 11.1 343.213.3 7.7 -2.5 -9.6 2.5 9.0 2.9 389.5
8.4 -0.2 -1.1 5.6 0.6 3.8 0.3 412.7
8. M2 minus M1 -2.3 -0.1 1.2 -0.3 -6.4 3.6 0.3 2442.2
9. Overnight RPs and Eurodollars,n.s.a.
10. General-purpose and broker-dealer money market funds
11. Commercial banks12. Savings deposits13. Small time deposits14. Thrift institutions15. Savings deposits16. Small time deposits
17. M3 minus M2
11.6
-2.1-1.04.2-8.6-5.80.6
-13.2
20.3 0.0 0.0 21.6 64.8 18.0 101.5
-0.1 17.8 12.0 -19.1 14.0 7.3 363.50.7 -2.1 -1.5 -2.2 0.5 -0.7 1246.44.3 -3.3 -6.1 -7.7 -2.5 -0.8 777.6
-5.2 0.1 6.2 6.7 5.7 -0.4 468.8-4.6 -3.0 -4.4 -8.1 -5.7 -4.4 728.3
0.6 0.1 -2.2 -10.3 -9.5 -1.9 424.6-11.5 -7.3 -7.4 -5.1 -0.4 -7.7 303.7
-3.5 -8.9 -8.7 -14.2 10.9 12.4 -4.7 637.6
Large time depositsAt commercial banks3
At thrift institutionsInstitution-only money market
mutual fundsTerm RPS, n.s.a.Term Eurodollars, n.s.a.
Memo
Managed liabilities at com'l.banks (lines 25 + 26)
Large time deposits, grossNondeposit funds
Net due to related foreigninstitutions
Other 4
U.S. government deposits atcommercial banks 5
-6.9-6.6-8.2
-5.416.80.0
-4.7 -4.0 10.5 1.1 11.1 -1.4 336.9-3.6 -3.2 19.2 0.0 11.0 -0.4 276.2-9.5 -7.2 -27.5 6.0 12.0 -5.5 60.7
-2 .b -12.8 -52.2 1.4 9.9 -18.8 10.9-16.5 13.7 -31.8 47.1 5.0 1.9 95.7
0.0 8.5 -2.5 17.6 32.2 8.6 49.7
Average monthly change (billions of dollars) 2
5.5 24.2 11.4 -14.2 9.9 16.2 . . . 956.0-2.3 -3.3 1.6 6.4 -2.1 3.2 . . . 341.67.8 27.5 9.8 -20.6 12.0 13.0 . . . 614.4
4.5 13.0 8.9 -2.2 13.5 12.7 .. . 197.9
3.3 14.5 0.9 -18.5 -1.5 0.3 . . 416.5
0.2 0.2 -0.4 -2.9 -8.4 -5.2 . . . 16.7
1. For years, "percentage change' is percentage change in quarterly average from fourth quarter of precedingyear to fourth quarter of specified year. For quarters, it is the percentage change in quarterly average frompreceding quarter to specified quarter, annualized.
2. For years, "average monthly change' is the dollar change from December to December, divided by 12.For quarters, it is the dollar change from the last month of the preceding quarter to the last month ofthe specified quarter, divided by 3.
3. Net of holdings of money market mutual funds, depository institutions, U.S. government, and foreign bankand official institutions.
4. Borrowing from other than commercial banks in the form of federal funds purchased, securitiessold under agreements to repurchase, and other liabilities for borrowed money (including borrowing from theFederal Reserve and unaffiliated foreign banks, loan RPs, and other minor items). Data are partially estimated.
5. Treasury demand deposits and note balances at commercial banks.
1. M12. M23. M3
III-3
continued to dwindle. In the federal sector, net borrowing is
rising sharply in the current quarter, reflecting a typical seasonal
excess of outlays over receipts. Available data on home mortgage
lending indicate little pickup early in the third quarter. During
the second quarter, consumer credit registered its strongest
quarterly gain of the current expansion, and bank lending to
consumers continued to show considerable strength in July.
Monetary Aggregates and Bank Credit
M2 rebounded in July after a weak showing in June. Although
strength in demand deposits provided a boost, the main contribution
was from the nontransaction component of M2. Retail money market
funds had substantial inflows in July after experiencing outflows in
the previous month, in a saw-tooth pattern related to the movement
of long-term interest rates (chart). Over the past few years, as
bond yields have risen, inducing capital losses on bond mutual funds
and other capital market instruments, flows into money funds have
picked up. Bond mutual funds saw a modest inflow in June and then a
larger outflow in July, to an extent mirroring the pattern in money
funds;however, the dollar flows from bond funds were not so
pronounced as those from money funds. A large jump in the level of
overnight Eurodollars also contributed to M2 growth in July.
Although rates on retail CDs moved up considerably in July,
with Treasury yields also rising at the short end, yield spreads on
retail deposits remained unusually wide. In general, deposit rates
seem to be adjusting upward more slowly than is normal for a period
of rising market interest rates. Despite their considerable yield
disadvantage, growth in small time deposits accelerated to a 3-1/4
percent pace in July. Yield differentials were especially wide on
savings deposits (including MMDAs), and this component continued to
run off in July, albeit at a slower rate than in June. From the

III-4
Growth rate of MMMFs vs. Change in Yield of Thirty-year Treasury Bond
Growth Rate (monthly,saar) Percentage Points
S0.5
Correlation = 0.58
* 5A ,iA *A"*-". *
Change in Bond yield(right scale)
:*
4 4 4 ;1
0.4
0.3
Growth rate in MMMFs(left scale)
II I
1992 1993
Net Due To Related Foreign Officesmonthly$billions
S All BanksS Foreign
--- Domestic
1./ I I - .I I I 11988 1989 1991 1992 199I___1 9
-10 I-
1994
July-
- -Q.3
;~'
1988 1989 1991 1992 1993 1994

III-5
fourth quarter of 1993 to July, M2 expanded at a 1-1/2 percent
annual rate. lifting it above the lower bound of its 1-to-5 percent
annual range.
The turnaround in M2 in July showed through to M3, which rose
at a brisk 6 percent pace. M3 was also boosted by an acceleration
in large time deposits, perhaps reflecting increased funding needs
for credit growth at banks. Moreover, institution-only money market
funds, which had seen heavy outflows as short-term rates rose
earlier this year, grew moderately in July. On balance, M3 growth
from the fourth quarter of 1993 to July was at an annual rate of 1/2
percent, moving into its 0-to-4 percent annual range.
After expanding at only a 3 percent annual rate in June, bank
credit accelerated to a 12-1/2 percent pace in July, with both
securities and loans showing strength. Holdings of U.S. government
securities declined slightly, while other securities advanced at a
21 percent annual rate. Most of the growth in other securities was
caused by FIN 39, the accounting standard that limits banks' ability
to net off-balance-sheet contracts. The implementation of this
standard caused a one-time grossing up of other securities earlier
in the year. In addition, FIN 39 has ongoing effects as such off-
balance-sheet positions are marked to market.
Led by the business and consumer categories, loans expanded
smartly in July. Factors contributing to business loans were
merger-related lending and lack of appeal of capital markets to
nonfinancial firms. Even after accounting for these factors,
business loans were quite strong. Banks reported in the August
Survey of Bank Lending Practices that they saw increased demand for
business loans after May, related to rising inventory and working
capital financing needs and stronger investment outlays. The survey
also found that banks continued to assume a more aggressive lending

III-6
COMMERCIAL BANK CREDIT AND SHORT- AND INTERMEDIATE-TERM BUSINESS CREDIT(Percentage change at annual rate, based on seasonally adjusted data)
Dec. Level,
Type of credit 1992 1994 1994 1994 1994 1994 Julto Dec. Q1 Q2 May Jun Jul 19941993 ($billlions)
Commercial bank credit
1. Total loans and securities
2. Securities
3. U.S. government
4. Other
5. Loans
6. Business
7. Real estate
8. Consumer
9. Security
10. Other
11. Business loans net of bankersacceptances
12. Loans at foreign branches 2
13. Sum of lines 11 and 12
14. Commercial paper issued bynonfinancial firms
15. Sum of lines 13 and 14
16. Bankers acceptances, U.S.
trade-related3 ,4
17. Loans at finance companies4
18. Total (sum of lines 15, 16,
and 17)
8.5 16.0
9.6 10.0
1.7
-2.7
2.4 -11.1
4.3 39.6 23.2 28.3
4.0
-1.8
4.5
9.0 11.4 12.4
35.6 -19.6 -34.6
-. 6
3.2 12.6 3.237.9
2.7 4.0 966.7
-. 8 749.2
7.3 20.8 217.5
3.4 16.3 2,271.2
4.8 17.0 617.1
7.4 7.6 958.7
9.6 22.9 422.6
7.8 -20.2 26.8 77.8
6.5 -11.1 -16.0 -24.3 39.4 195.0
Short- and intermediate-term business credit
-2.1
-12.1 -7.4 18.8 16.3
-2.5
4.4 -12.2 -9.2 -14.3
-1.1
4.6 17.2 607.4
5.4 16.1 22.6
4.3 17.0 630.0
2.4 5.6 150.1
3.0 14.8 780.1
-12.2 17.9 -13.3 -22.6 -28.8 n.a.
-. 3 14.1 13.9 13.4
-1.1
520.3
8.5 n.a. 328.3
4.0 n.a. 1,119.2
1. Except as noted, levels are averages of Wednesday data and percentage changes are based on aver-ages of Wednesday data; data are adjusted for breaks caused by reclassification; changes are measuredfrom preceding period to period indicated.
2. Loans to U.S. firms made by foreign branches of domestically chartered banks.
3. Acceptances that finance U.S. imports, U.S. exports, and domestic shipment and storage of
goods.4. Changes are based on averages of month-end data.
5. June 1994.
n.a. Not available.

III-7
posture by further easing terms and standards for C&I loans.1
Consumer loans expanded at more than a 20 percent annual rate in
July, but this acceleration over the previous month reflects a lack
of securitizations.
Real estate loans maintained solid growth in July. The recent
prominence of adjustable-rate mortgages (ARMs) in originations may
have continued into July, boosting bank credit, since ARMs are less
likely to be securitized. Moreover, a few banks have been reporting
in recent months that they are more willing to make loans for
nonresidential real estate, and other banks indicate that they have
stopped tightening standards and terms for such loans. About 3
percentage points of the July growth in real estate loans at banks
owed to the acquisition of mortgage assets from thrift institutions.
Reluctant to bid aggressively for retail deposits, banks have
funded loan growth by borrowing from affiliates abroad. July saw
substantial increases in banks' net due-to position with related
foreign offices (chart). U.S. branches and agencies of foreign
banks have traditionally been large borrowers from foreign
affiliates, especially since 1991. Recently, U.S. chartered banks
have also begun to expand rapidly their net due-to position.
Respondents to the August loan officer survey mentioned more
attractive borrowing costs as a reason why they have been relying
Mutual Funds
Net sales of stock and bond fund shares moderated in the second
quarter (table). Stock funds continued to attract investors.
although inflows have slowed somewhat. Among stock funds, net sales
of domestic funds moderated in July but still provided support to
1. The results of the August survey are discussed more fully inthe appendix.
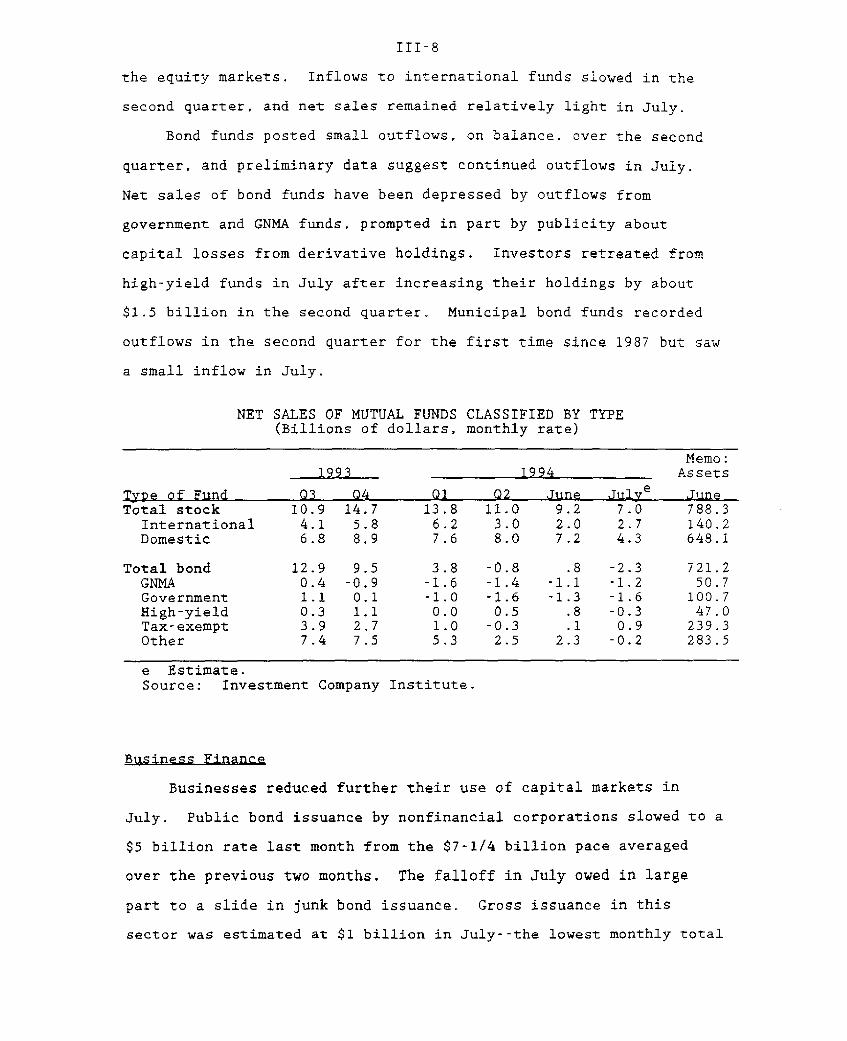
III-8
the equity markets. Inflows to international funds slowed in the
second quarter, and net sales remained relatively light in July.
Bond funds posted small outflows, on balance, over the second
quarter, and preliminary data suggest continued outflows in July.
Net sales of bond funds have been depressed by outflows from
government and GNMA funds, prompted in part by publicity about
capital losses from derivative holdings. Investors retreated from
high-yield funds in July after increasing their holdings by about
$1.5 billion in the second quarter. Municipal bond funds recorded
outflows in the second quarter for the first time since 1987 but saw
a small inflow in July.
NET SALES OF MUTUAL FUNDS CLASSIFIED BY TYPE(Billions of dollars, monthly rate)
Memo:1993 1994 Assets
Type of Fund Q3 Q4 Q1 Q2 June July e JuneTotal stock 10.9 14.7 13.8 11.0 9.2 7.0 788.3
International 4.1 5.8 6.2 3.0 2.0 2.7 140.2Domestic 6.8 8.9 7.6 8.0 7.2 4.3 648.1
Total bond 12.9 9.5 3.8 -0.8 .8 -2.3 721.2GNMA 0.4 -0.9 -1.6 -1.4 -1.1 -1.2 50.7Government 1.1 0.1 -1.0 -1.6 -1.3 -1.6 100.7High-yield 0.3 1.1 0.0 0.5 .8 -0.3 47.0Tax-exempt 3.9 2.7 1.0 -0.3 .1 0.9 239.3Other 7.4 7.5 5.3 2.5 2.3 -0.2 283.5
e Estimate.Source: Investment Company Institute.
Business Finance
Businesses reduced further their use of capital markets in
July. Public bond issuance by nonfinancial corporations slowed to a
$5 billion rate last month from the $7-1/4 billion pace averaged
over the previous two months. The falloff in July owed in large
part to a slide in junk bond issuance. Gross issuance in this
sector was estimated at $1 billion in July--the lowest monthly total
III-9
since the junk market revived, in mid-1991, Junk yield spreads over
Treasuries widened about 15 basis points in July but have since come
back in. In general, spreads over Treasuries remain on the narrow
side.
Ratings changes by Moody's in the second quarter continued the
general pattern seen over the past year. While the financial sector
experienced no downgrades and twenty-one upgrades--ten of these for
bank holding companies--downgrades in the nonfinancial sector
outnumbered upgrades by a factor of three to two. Perhaps most
notable among the upgrades was that of Chrysler Corporation, which
jumped two notches from Baa2 to A3. In a departure from the recent
pattern of ratings changes, downgrades outnumbered upgrades for
speculative-grade industrial firms.
Gross public equity issuance by nonfinancial corporations
slowed to $1.7 billion in July, half of June's pace and one of the
lowest monthly totals in the current business expansion. In keeping
with the recent patterns, the number of IPOs brought to market has
continued high, but prices and volumes of IPOs have come in well
below issuer expectations. Issuance by financial corporations in
July apparently totaled a moderate $3.2 billion, nearly half of
which was accounted for by several large REIT offerings. As a
result of the falloff in gross equity issuance and an increase in
stock repurchases, it now appears likely that net equity issuance
will turn negative this quarter.
Merger and takeover activity seems to be distinctly on the
rise, with implications for share retirements. Repurchases in the
quarter thus far have been boosted by the employee buyout of United
Airlines. Prospective mergers and acquisitions include the takeover
of Gerber by Sandoz and bids for QVC and a large pharmaceutical

III-10
GROSS OFFERINGS OF SECURITIES BY U.S. CORPORATIONS1(Billions of dollars; monthly rates, not seasonally adjusted)
1994
Type of security 1992 1993 Q1 Q2 Mayp Jun Julp
All U.S. corporations 40.84 53.42 53.12 41.87 43.90 44.83 24.32Stocks 2 7.04 9.65 8.40 6.56 3.93 8.20 4.85Bonds 33.80 43.77 44.72 35.30 39.96 36.63 19.47
Nonfinancial corporationsStocks 2 4.42 5.32 4.58 4.42 2.44 5.25 1.68
Sold in U.S. 4.03 5.12 4.02 3.19 2.23 3.69 1.23Utility .87 1.06 .65 .44 .37 .77 .08Industrial 3.16 4.00 3.37 2.75 1.86 2.92 1.16
Sold abroad .39 .19 .56 1.23 .21 1.56 .45
Bonds 13.67 16.20 11.07 6.50 6.85 7.53 5.10Sold in U.S. 12.83 15.56 10.33 5.63 5.89 6.67 4.50Utility 5.33 7.34 4.57 1.84 1.71 2.26 1.20Industrial 7.50 8.22 5.76 3.79 4.18 4.41 3.30
Sold abroad .84 .64 .74 .87 .97 .87 .60
By quality 3
Aaa and Aa 2.18 2.56 .80 .59 .65 .92 .26A and Baa 7.74 8.71 5.60 3.01 2.64 4.00 3.26Less than Baa 2.86 4.17 3.92 1.98 2.46 1.73 .98Unrated or rating unknown .09 .09 .00 .00 .00 .01 .00
Financial corporationsStocks 2 2.62 4.61 3.81 2.15 1.50 2.95 3.17
Sold in U.S. 2.51 4.16 3.54 1.97 1.38 2.75 2.28Sold abroad .11 .45 .27 .18 .12 .20 .89
Bonds 20.13 27.57 33.65 28.81 33.11 29.10 14.37Sold in U.S. 18.67 25.01 29.28 24.59 26.90 25.09 13.00Sold abroad 1.46 2.56 4.37 4.22 6.21 4.00 1.37
By quality 3
Aaa and Aa 1.55 1.78 3.31 3.99 3.89 2.16 2.71A and Baa 6.77 8.99 11.24 9.67 11.86 10.80 4.52Less than Baa .31 .49 .66 .17 .15 .20 .20Unrated or rating unknown .04 .08 .02 .11 .03 .20 .01
1. Securities issued in the private placement market are not included. Totalreflects gross proceeds rather than par value of original discount bonds.2. Excludes equity issues associated with equity-for-equity swaps that have
occurred in restructurings.3. Bonds categorized according to Moody's bond ratings, or to Standard & Poor's
if unrated by Moody's. Excludes mortgage-backed and asset-backed bonds.p Preliminary.
III-l1
firm. Merger activity this year, however, has not yet reached the
levels seen in the late 1980s. Until recently, much of the activity
had been financed with stock-for-stock swaps and therefore had only
a relatively small impact on equity retirement by nonfinancial
corporations.
Amid positive second-quarter earnings reports, major stock
price indexes have moved up from the lows posted at the beginning of
July, with most indexes rising 2-1/2 to 3-1/2 percent over the
intermeeting period. Among the industrials, the basic materials
group showed the strongest gains, rising about 5 percent during this
period. Second-quarter earnings reports so far suggest that
operating earnings of the firms making up the S&P 500 have climbed
about 15 percent from a year earlier, exceeding most analysts'
expectations.
State and Local Government Finance
Gross issuance of long-term tax-exempt debt was just $12-1/2
billion in July. continuing the second quarter's relatively sluggish
pace. The July figure was boosted by $4 billion in revenue
anticipation warrants (twenty-two month maturity) issued by
California. Short-term issuance was nearly $6-1/2 billion, buoyed
by $3 billion in California revenue anticipation notes. Through
July, long-term issuance is down 40 percent from the comparable
period last year, depressed by the sharp falloff in advance and
current refundings. The decline in refunding volume owes mostly to
the reduction in bonds eligible to be advance refunded. News
concerning municipal securities has continued to be dominated by
California. Passage of a budget paved the way for more borrowing,
narrowly averting the need to issue IOUs.2 Although the state
2. The controversial budget is balanced only through theunrealistic assumption that the federal government will pay thestate a total of $3.6 billion spread out over 1995 and 1996 to coverthe state's costs of providing services to illegal immigrants.

III-12
issued securities totaling $7 billion in a single week, consisting
of both the warrants and notes, they were well received. Almost all
of the warrants were credit-enhanced through letters of credit
provided by an international consortium of banks. The banks
provided the letters of credit only after the budget included a
provision that forces spending cuts if a deficit materializes. S&P
and Moody's gave the credit-enhanced warrants their highest credit
rating. The notes also received the highest ratings, reflecting
high expected cash flow coverage over their short duration.
GROSS OFFERINGS OF MUNICIPAL SECURITIES(Monthly rates, not seasonally adjusted, billions of dollars)
1994
1992 1993 Q1 Q2 May Junep Julyp
Total offerings1 21.8 27.8 18.5 16.4 13.8 24.4 18.9Total tax-exempt 21.2 27.1 17.7 16.0 13.6 23.7 18.8
Long-term 2 17.9 23.3 15.5 12.4 12.4 14.8 12.4Refundings 7.9 15.7 7.4 3.4 3.3 5.1 2.1New capital 10.0 7.6 8.1 9.0 9.1 9.7 10.3
Short-term 3.3 3.8 2.4 3.6 1.2 8.9 6.4
Total taxable .6 .7 .8 .4 .2 .7 .1
1. Includes issues for public and private purposes.2. Includes all refunding bonds, not just advance refundings.p preliminary.
At the same time, Moody's, S&P, and Fitch all downgraded $18.4
billion in California long-term general obligation debt on July 18.
The S&P downgrade was from A+ to A and Moody's was from Aa to A. In
related actions, S&P lowered the ratings of more than $5 billion of
other California debt, including $273 million of California State
University System revenue bonds and $3.2 billion of appropriation-
backed debt issued through the Public Works Board, the Los Angeles
State Building Authority, and the San Francisco State Building
Authority.

III-13
The ratio of yields on tax-exempts to those on Treasuries has
edged down since the last FOMC meeting and is near its lowest levels
of the year. The yield ratio remained especially low at the short
end, owing in part to strong demand from tax-exempt money market
funds and from bond mutual funds, which have added to their short-
term holdings perhaps to hedge against a further rise in interest
rates.
Treasury and Sponsored Agency Financing
The staff anticipates that the $56 billion fiscal deficit in
the third quarter will be financed primarily by $40 billion of
marketable borrowing. The swing in marketable borrowing, from a
thirteen-year low of $8 billion in the second quarter to a level
more in line with recent experience, will remove the support that
the Treasury market has lately enjoyed from low supply.
At the midquarter refunding, the Treasury announced that its
experiment with single-price auctions at two- and five-year note
auctions will be continued indefinitely. After twenty-three rounds
of experimentation, the preliminary evidence on the new auction
technique was judged by Treasury officials to be "neutral to
slightly positive."3 The Treasury also announced that a new 30-
1/4-year bond would be auctioned rather than a 30-year bond, with
3. On the neutral side, at single-price auctions, the markups ofauction average rates over when-issued rates at the times ofauctions--a measure of the premium that market participants extractfrom the Treasury for bearing the uncertainty of bidding atauctions--have differed little between single-price anddiscriminatory-price auctions. On the positive side, prices havemoved less after single-price auctions than after discriminatory-price auctions, consistent with the view that more information isrevealed prior to the auction under the single-price format.

III-14
TREASURY FINANCING1
(Total for period: billions of dollars)
1994 1994
Item Q2 Q3 p Jul. e Aug.p Septp
Total surplus/deficit (-) .6 -56.1 -38.0 -32.2 14.1
Means of financing deficit:
Net cash borrowing/repayments(-) 7.7 39.5 -4.3 50.8 -7.0Nonmarketable -.5 -2.1 -3.3 .7 .6Marketable 8.2 41.6 -1.0 50.1 -7.6
Bills -22.7 2.1 5.9 9.4 -13.2Coupons 30.9 39.5 -6.9 40.7 5.7
Decrease in the cash balance -6.4 2.7 30.7 -14.5 -13.6
2Other -2.0 14.0 11.6 -4.1 6.4
Memo:Cash balance, end of period 51.0 48.3 20.3 34.8 48.3
1. Data reported on a payment basis.2. Includes checks issued less checks paid,
transactions.p--projected.e--estimated.
accrued items, and other
Note: Details may not add to totals because of rounding.
NET CASH BORROWING OF FEDERALLY SPONSORED CREDIT AGENCIES1(Billions of dollars)
1993 1994 1994Agency Q3 Q4 Q1 Apr. May June
FHLBs 5.4 8.9 5.7 6.2 3.4 --FHLMC 17.1 -2.7 12.9 2.7 5.7 2.1FNMA 19.3 5.3 15.3 2.4 4.3 4.7Farm Credit Banks -.1 1.5 -.7 0.2 -0.1 1.2SLMA -.1 1.0 1.3 3.2 1.5 2.1FAMC2 0 0 0 0 0 0
1. Excludes mortgage pass-through securities issued by FNMAand FHLMC.
2. Federal Agricultural Mortgage Corporation.

III-15
the goal of increasing the liquidity and the flexibility of the
strips market. Since last year, when the Treasury began auctioning
long-term bonds semiannually rather than quarterly, the coupon
payment dates of these issues have been concentrated in February and
August. The Treasury hopes that by spreading coupon payments across
four dates, including May and November, long-term bonds will be more
heavily demanded by investors for defeasance purposes or for
constructing synthetic instruments.
Mortgage Markets
Interest rates on conventional mortgages have registered mixed
changes over the intermeeting period. In the primary market, the
average commitment rate on thirty-year fixed-rate loans is
unchanged, on net, but initial ARM rates have edged up 8 basis
points. Spreads of ARMs to Treasuries remain tight, as many
lenders, especially thrifts, continue to price ARMs aggressively.
Although the FRM-ARM spread has narrowed from its all-time high in
April, by historical standards it remains fairly wide.
The FRM-ARM initial rate spread is an important determinant of
borrowers' demands for ARMs, as is the level of FRM interest rates
(chart). With rates on FRMs remaining well above their lows of last
fall, the wide initial rate advantage of ARMs has contributed to a
steady increase in the ARM share of conventional loans closed at
major institutional lenders. According to Federal Housing Finance
Board data, the ARM share of all conventional home purchase
mortgages closed in June was 43 percent, its largest share since
June 1989. At thrift institutions, the ARM share in June was
71 percent, compared with shares of 27 percent and 44 percent
respectively at mortgage companies and commercial banks. Thrifts
reportedly have been offering very competitive starting rates on

III-16
ARM Origination Proportion and FRM-ARM Spread(Monthly; not seasonally adjusted)
Percent
1984 1985 1986 1987 1988 1989 1990 1991 1992 1993 1994
ARM Origination Proportion andFHLMC Thirty-Year Conventional FRM Rate
(Monthly; not seasonally adjusted) Percent
FRM Rate
1989 1990 1991 1992 1993
Basis Points
Percent
19941984 1985 1986 1987 1988

III-17
ARMs and thus have been gaining market share in mortgage
originations from commercial banks and mortgage companies.
Available data on mortgage lending activity in the third
quarter suggest little pickup from the slower second-quarter pace.
Adjusted for thrift acquisitions, real estate loan growth at
commercial banks appears to have edged up in July to about a 4-1/2
percent annual rate. Meanwhile, the Mortgage Bankers Association's
index of applications to purchase new and existing homes is off
about 10 percent since late June, and the MBA's refinancing index
remains near historical lows.
Given the drop-off in gross mortgage loan originations in
recent months and the rising popularity of ARMs, gross issuance of
agency pass-through securities has slowed sharply from the record
$66 billion pace set last December to $24 billion in June (table).
Historically, issuance of agency pass-through securities has shown a
strong inverse correlation with the level of FRM interest rates
(chart), owing in part to variations in the appeal of ARMs. Thus,
in the current environment of higher long-term interest rates and
lower refinancing activity, some drop-off in gross pass-through
issuance is to be expected.
Among loan categories, much of the increase in pass-throughs
outstanding has been in the conventional market, which continues to
gain market share at the expense of government-backed FHA and VA
loans. Legislation has passed the House that would increase FHA
loan limits, making FHA insurance available to more borrowers and
possibly boosting GNMA market share. The current loan limits are
$67,500 in most parts of the country and up to $151,725 in certain
high-cost markets. The increases in the House bill would raise the

III-18
ISSUANCE OF MORTGAGE-BACKED SECURITIES(Monthly averages; billions of dollars; not seasonally adjusted except as noted)
Pass-through securities Multiclass securitiesFederal agency Federal agency
Fixed- ARM- Non- FNMA FHLMC GNMA Non-Period Total1 rate1 backed1 agency2 Total REMICs REMICs REMICS STRIPs agency3
1990 20.1 17.2 2.2 .6 10.6 5.1 3.4 0 .8 1.41991 23.7 20.2 1.9 1.6 18.1 8.4 6.0 0 1.1 2.61992 40.0 34.7 3.2 2.2 30.4 12.9 10.9 0 1.3 5.31993 48.6 42.3 4.6 1.7 37.0 14.0 11.9 0 4.9 6.2
1993:Q3 54.3 46.5 5.3 2.5 43.7 17.3 12.6 0 6.7 7.1:Q4 59.0 52.1 5.1 1.8 44.4 15.9 17.7 0 3.8 7.0
1994:01 55.1 47.2 6.2 1.7 37.2 10.9 13.8 0 4.0 8.5:02 p 33.6 27.4 4.8 1.4 17.9 4.7 7.3 .2 2.4 3.4
1994:Apr 44.1 36.3 5.8 2.1 32.7 8.9 14.5 0 5.1 4.3May 31.5 25.5 5.0 1.0 13.6 2.9 5.2 0 2.1 3.5Jun p 25.1 20.4 3.7 1.0 7.4 2.3 2.1 .5 0 2.5
1. Seasonally adjusted.2. Collateralized by adjustable-rate mortgages.3. Collateralized by fixed-rate mortgages.p Preliminary. r Revised.Note: Details may not sum to totals because of rounding.
Issuance of Agency Pass-Through Securities andFHLMC Thirty-Year Conventional FRM Rate
(Monthly; not seasonally adjusted)Percent Billions of dollars
Pass-Through Security Issuance
1986 1987 1988 1989 1990 1991 1992 19931985

III-19
low-cost limit to $101.575 and the high-cost limit to $172,678. The
Senate has yet to act on this legislation.
Issuance of agency multiclass securities declined further in
June, with REMIC production falling to about $5 billion, down from
$8 billion in May and the all-time high of nearly $41 billion in
December 1993. The decline in REMIC issuance owes largely to the
drop in pass-throughs; however, with reports continuing to circulate
about losses on derivative investments, it may also reflect
investors' lingering concerns about the market value and liquidity
of certain specialized tranches. Apparently, turmoil in the MBS
market has had little feedback to the primary market, as spreads to
Treasuries remain relatively tight.
Consumer Installment Credit
Buttressed by a fourth consecutive month of rapid increase in
June, consumer installment credit during the second quarter recorded
its strongest quarterly gain in the current economic expansion. At
a 15-1/2 percent annual rate, growth in the second quarter climbed
to the 15-to-20 percent range attained at some point during most
previous expansions (chart). Such levels were reached sooner in
past upswings, but an unusually slow pickup in spending on consumer
durables in the early stages of this expansion held down consumer
credit growth. Since late last summer, however, outlays for autos
and other durable goods have strengthened, providing a significant
boost to credit expansion. The June increase of 15-1/2 percent
reflected continuing strength in auto and revolving credit. Slower
but still hefty growth was evident in the volatile "other" category,
consisting of personal cash loans, boat and mobile home loans, home
4. It is unclear by how much the new limits would boost FHAmarket share. FHA insurance fees are considerably higher thanprivate mortgage insurance fees. Consequently, even though moreborrowers would fall within the upward revised FHA limits, those whomet the underwriting requirements of the conventional loan marketpresumably would still opt for private mortgage insurance.

III-20
GROWTH OF CONSUMER CREDIT(Percent change: seasonally adjusted annual rate)
Memo:OutstandingJune 1994
Type of credit 1994 1994 (Billions1992 1993 Q1 Q2p May r Jun p of dollars)
Installment .2 9.0 10.9 15.9 16.6 15.6 849.6Auto -1.0 9.2 9.1 18.5 15.7 18.8 301.2Revolving 4.8 11.9 15.6 17.9 16.6 15.5 312.6Other -3.4 5.4 7.0 10.1 17.9 11.6 235.9
Noninstallment 6.3 -5.5 4.2 -16.6 -22.3 -15.4 51.0
Total .6 8.0 10.4 13.9 14.3 13.8 900.6
r Revised. p Preliminary.
INTEREST RATES ON CONSUMER LOANS(Annual percentage rate)
1993 1994Type of loan 1991 1992 1993 Nov. Feb. May June
At commercial banks1New cars (48 mo.) 11.1 9.3 8.1 7.6 7.5 7.8 ...Personal (24 mo.) 15.2 14.0 13.5 13.2 12.9 13.0..Credit cards 18.2 17.8 16.8 16.3 16.1 16.2 ...
At auto finance cos.New cars 12.4 9.9 9.5 9.0 8.9 9.9 10.0Used cars 15.6 13.8 12.8 12.4 12.2 13.5 13.8
1. Average of "most common" rate charged for specified type and maturity duringthe first week of the middle month of each quarter.
2. For monthly data, rate for all loans of each type made during the monthregardless of maturity.Note: Annual data are averages of quarterly data for commercial bank rates and
of monthly data for auto finance company rates.
CONSUMER INSTALLMENT CREDIT
Quarterly (Percent change, seasonally adjusted annual rate) Percent
1976 19821964 1970 1988 1994
III-21
improvement loans, and other specialized loans to finance consumer
durables. Consistent with these figures, some banks reported
strengthening of consumer loan demand in the August Bank Lending
Practices Survey.
Of the three components of installment credit, revolving credit
has shown the most consistent strength over the past year and a
half. Growing acceptance of credit cards as a means of payment has
likely boosted the growth rate of revolving credit by several
percentage points. For example, credit cards are more frequently
being used for the purchase of groceries, the payment of college
tuition, and, in some states, the payment of taxes.
One reason for the greater use of credit cards for such
payments is the proliferation of programs that tie rebates and other
rewards to the volume of charges made to an account. Prominent
among such programs are those that award credits toward "free"
airline tickets and toward automobile purchases. Airline cards have
existed for several years, but their use has reportedly intensified
in the past two years. General Motors initiated a program in
September 1992, in partnership with a bank subsidiary of Household
International, that grants up to $500 per year in discounts toward
the purchase of a new General Motors car. At the end of June,
receivables under this program totaled $5.8 billion, accounting for
10 percent of the increase in revolving credit outstanding since
September 1992. Ford launched a similar program with Citibank in
February 1993, apparently also with good results. Apple Computer
and some gasoline companies have recently initiated cards with
volume incentives. Because these plans provide the customary "grace
period" of twenty-five to thirty days during which no interest is
assessed if billed amounts are paid in full by the due date,
cardholders can generate a high volume of charges without incurring

III-22
any interest cost. Such usage raises the measured level of consumer
credit.
Rising market interest rates have probably had only little
restraining effect on consumer credit to date, partly because rate
increases on consumer loans have a relatively small impact on
monthly payments and also because consumer rates generally have
risen less than market rates. The Bank Rate Monitor indicates that
rates on new-car loans at banks rose about 3/4 percentage point from
the end of January to the end of July, less than half the increase
in yields on three-year Treasury notes. Over the same period,
credit card rates have apparently risen very little.

APPENDIX
The August Senior Loan Officer Opinion Survey onBank Lending Practices
The August 1994 Senior Loan Officer Opinion Survey on BankLending Practices posed questions about changes in bank lendingstandards and terms, changes in loan demand by businesses andhouseholds, the maturity of banks' holdings of securities, netborrowing from banks' offices abroad, and the effects of the CreditAvailability Program.
The results show a continuation of the easing of terms andstandards on loans to both businesses and households found in thelast several surveys, although at a somewhat diminished pace.Respondents eased terms and standards on commercial and industrialloans to firms of all size categories, with more banks easing formiddle-market firms than for larger and smaller firms. As in theFebruary and May surveys, the responses indicated a slight easing ofstandards for commercial real estate loans. Respondents reported anincreased willingness to make loans to individuals and, on net, aslight easing in standards for home mortgage loans. Demand forbusiness loans increased over the last three months at a significantfraction of respondent banks, although slightly off the recordnumbers reported in the May survey. Demand for credit fromhouseholds was mixed across types of credit: demand for mortgagesdeclined significantly; demand for home equity lines of creditdeclined slightly, on net; and demand for consumer installment loanswent up.
Special questions on the survey addressed the average remainingmaturities of banks' holdings of securities. The median responsesindicate an average remaining maturity of just under three years forbanks' investment account assets that are classified as available-for-sale; three and a half years for investment account securitiesclassified as held-to-maturity; and two and a half years for tradingaccount securities. Additional questions examined the recent run-upin net borrowing from overseas offices by domestic banks and bybranches and agencies of foreign banks. About half the respondentsreported increasing such borrowing over recent periods. Most banksattributed the increase to lower interest rates abroad. The mostpopular source for the borrowing was the eurodollar market and themost popular maturity was under three months. Special questionsalso addressed the effects of the Credit Availability Program (CAP).Little evidence of an effect on loan terms and standards or loanvolume was found.
Lending to businessesCommercial and industrial loans other than for mergers.
Between 5 and 10 percent of domestic respondents, on net, reportedsome easing of credit standards for firms in all size categories,with the greatest easing reported for middle-market firms and theleast for large firms. The number of respondents who eased was offslightly from the levels found in the May and February surveys.Also, for the first time since late last year, several banksreported tightening standards. Lending standards at foreignrespondents were essentially unchanged.
Many banks responded that they had eased loan terms over thelast three months. Specifically, about half the domesticrespondents eased spreads of loan rates over base rates and the costof credit lines for large and middle-market borrowers while under aquarter eased these terms for small borrowers. Smaller, althoughstill considerable numbers of banks eased other terms, including

III-A-2
credit line size, loan covenants, and collateralization. Thefraction of foreign respondents that eased terms was similar to thatfor domestic banks. The main reason given by respondents for easingwas increased competition followed by a more favorable economicoutlook.
Commercial real estate loans. Domestic respondents indicatedthat credit standards for commercial real estate loans easedslightly, on net. Only a few banks indicated any change instandards for commercial office buildings, with one more bank havingeased than tightened. The results were about the same for otherforms of commercial real estate. The February and May surveys alsofound evidence of a slight easing.
Demand. Demand for business loans strengthened over the lastthree months at a significant fraction of respondent banks. Betweena fifth and a third of banks reported increased demand from firms ofvarious sizes, with the largest fraction reporting increased demandfrom middle-market firms. These fractions are slightly off therecord levels reported in the previous survey, but still indicatestrong demand for business loans. Banks attributed the increaseddemand largely to increases in customers' inventory financing needsand expenditures on plant and equipment. Surprisingly few banksattributed the increased demand to reductions in nonbank financing,although this may be because banks are more aware of the purpose ofa loan than their customer's alternative sources of funds.
Lending to householdsRespondents were also more willing to make consumer and
residential mortgage loans. About 20 percent of the respondentswere more willing now than three months ago to make consumerinstallment and home equity loans. On net, only a few banks easedstandards for approving mortgage applications for purchasing homes.
With respect to the demand for household credit, the surveyresults were mixed across types of credit. As in May, respondentsexperienced a significant decline in demand for residentialmortgages, with over half the banks, on net, reporting a decline andseveral banks reporting a substantial decline. Demand for homeequity lines of credit decreased at some banks and increased atothers; on net, less than 10 percent of the banks experienced adecrease. Demand for consumer installment credit increased, on net,with about 20 percent of the respondents indicating an increase indemand.
SecuritiesAt the beginning of 1994 banks, in accordance with financial
accounting standard 115 (FAS 115), began marking to market thosesecurities in their investment portfolio that are classified asavailable for sale. The August survey asked the respondents for theaverage maturities of the three classifications of securities: heldin investment accounts and classified as available for sale, held ininvestment accounts and classified as held to maturity, and held intrading accounts. The survey responses indicate that the maturitiesof banks' portfolios are quite different across banks, with severalbanks indicating average maturities of less than two years and manyindicating maturities of greater than five years. Overall, themedian average maturity of the trading account was shortest, two anda half years; followed by the available-for-sale securities in theinvestment account, just under three years; and the held-to-maturity
1. As in May, increased competition was the most common reasonprovided for easing, even though it was not listed as a reason foreasing of terms and standards.

III-A-3
securities had the longest average maturity, about three and a halfyears.
Borrowing from abroadSince mid-1993, U.S. domestic banks have significantly
increased their net borrowing from their non-U.S. offices andinternational banking facilities (I.B.F.). Since mid-1991, branchesand agencies have significantly increased their net borrowing fromtheir parent bank, their parent bank's non-U.S. offices and theirI.B.F. Questions on the August survey explored the reasons for andthe characteristics of this increase in borrowing from abroad.About half of the domestic and foreign respondents indicated thatthey had increased this source of funding. The most frequentlycited reason for the increase was lower interest rates abroad. Theresponses indicate that banks avoid currency exposure in thetransactions by borrowing primarily in the eurodollar market.Virtually all of the domestic respondents indicated that they mostcommonly borrowed at maturities under six months, with almost two-fifths of respondents indicating an overnight maturity and a likeamount indicating other maturities under three months. All of theforeign respondents indicated that they most commonly borrowed atmaturities under six months.
Effects of the Credit Availability ProgramIn March 1993, the Credit Availability Program (CAP) was
announced. The CAP included the following initiatives: regulatorychanges allowing the strongest banks and thrifts to make and carry alimited portfolio of small business and farm loans with minimaldocumentation, reductions in the appraisal burden on loans securedby real estate, changes in the rules for financing the sale of OREO,clarification of the use of the category other assets especiallymentioned, and improvements in the examination process. The August1993 survey asked the domestic respondents a series of questionsabout the effects of the CAP and found that it did not have asubstantial effect on the supply of credit to small and medium-sizedbusinesses. At that time, many respondents anticipated that thereductions in the appraisal burdens, which had not yet beenimplemented, would have a substantial effect. Recently bankregulatory agencies increased from $100,000 to $250,000 thethreshold level above which the services of an appraiser arerequired for loans collateralized with real estate. They have alsoexempted from appraisal requirements business loans of $1 million orless where the sale of, or rental income derived from, the realestate taken as collateral is not the primary source of repayment.The current survey asked domestic respondents if these changesaffected their terms and standards and loan volumes. Both changeshad allowed less than 20 percent of respondents to ease lendingterms and standards and resulted in increased lending volume at lessthan 10 percent of respondents. Even fewer banks indicated a changein terms and standards or loan volume resulting from the otherinitiatives of the CAP. Over three quarters of the respondents saidthat none of the initiatives had any effect on their bank's lendingto small and medium-sized businesses. Among those banks that statedthe CAP had had some effect, most selected improvements in theexamination process as having had the largest effect.

INTERNATIONAL DEVELOPMENTS
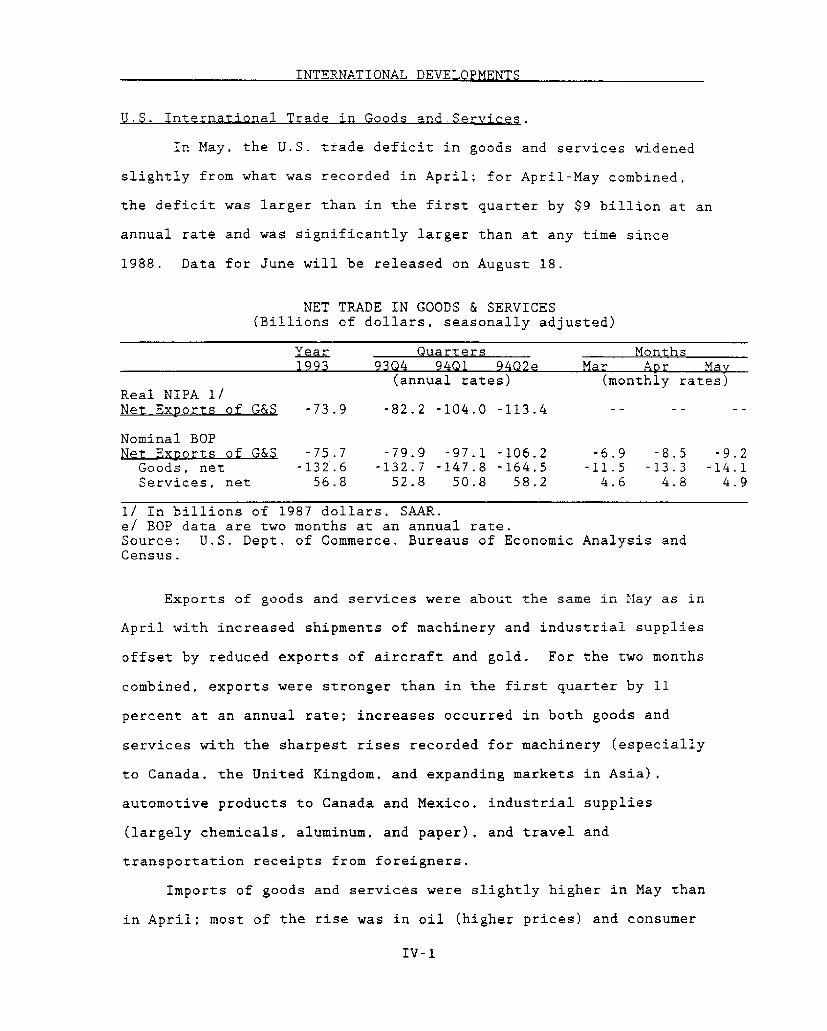
INTERNATIONAL DEVELOPMENTS
U.S. International Trade in Goods and Services
In May, the U.S. trade deficit in goods and services widened
slightly from what was recorded in April; for April-May combined,
the deficit was larger than in the first quarter by $9 billion at an
annual rate and was significantly larger than at any time since
1988. Data for June will be released on August 18.
NET TRADE IN GOODS & SERVICES(Billions of dollars, seasonally adjusted)
Year Quarters Months1993 93Q4 94Q1 94Q2e Mar Apr May
(annual rates) (monthly rates)Real NIPA 1/Net Exports of G&S -73.9 -82.2 -104.0 -113.4
Nominal BOPNet Exports of G&S -75.7 -79.9 -97.1 -106.2 -6.9 -8.5 -9.2
Goods, net -132.6 -132.7 -147.8 -164.5 -11.5 -13.3 -14.1Services, net 56.8 52.8 50.8 58.2 4.6 4.8 4.9
1/ In billions of 1987 dollars, SAAR.e/ BOP data are two months at an annual rate.Source: U.S. Dept. of Commerce, Bureaus of Economic Analysis andCensus.
Exports of goods and services were about the same in May as in
April with increased shipments of machinery and industrial supplies
offset by reduced exports of aircraft and gold. For the two months
combined, exports were stronger than in the first quarter by 11
percent at an annual rate; increases occurred in both goods and
services with the sharpest rises recorded for machinery (especially
to Canada, the United Kingdom, and expanding markets in Asia),
automotive products to Canada and Mexico, industrial supplies
(largely chemicals, aluminum, and paper), and travel and
transportation receipts from foreigners.
Imports of goods and services were slightly higher in May than
in April; most of the rise was in oil (higher prices) and consumer
IV-I

IV-2
U.S. International Trade in Goods & Services
Net Exports of Goods & ServicesBii$. SAAR
1991 1992 1993 1994
Real NIPA Goods & ServicesRatio Scale, Bil 87$, SAAR
1991 1992 1993 1994
Selected ExportsBil 87$. SAAR
Selected ImportsBil 87$, SAAR
- Machinery Ex Computers------. Automotive- ind. Supp. (Nonag Ex Gold)
1 --- "
I, iI lli iiI lli ll1991 1992 1993 1
- Machinery Ex Computers--- ---- Automotive
-Consumer Goods
19921991 1993 1994

IV-3
U.S. EXPORTS AND IMPORTS OF GOODS AND SERVICES(Billions of dollars, SAAR, BOP basis)
Quarters MonthsLevels $Change 1/ Levels $Chg 1/
94Q1 94Q2e/ Q1 Q2e/ Apr May May
Exports of G&S 656.8 674.6 -8.3 17.8 673.8 675.3 1.5
Goods Exports 472.1 485.0 -6.6 12.9 484.5 485.4 0.9Agricultural 43.7 43.9 -1.6 0.2 42.8 45.1 2.3Gold 9.4 7.3 -3.8 -2.1 8.5 6.0 -2.5Computers 31.3 31.0 0.7 -0.3 30.6 31.5 0.9Other Goods 387.7 402.7 -2.0 15.0 402.6 402.8 0.2
Aircraft & Pts 34.2 33.6 -0.2 -0.7 37.4 29.7 -7.7Semiconductors 23.5 23.8 2.8 0.3 23.4 24.1 0.7Other Cap Gds 105.6 111.7 -0.1 6.1 109.5 113.8 4.3
Automotive 54.4 55.6 -0.6 1.2 56.7 54.6 -2.1to Canada 29.0 30.7 -0.4 1.8 31.5 30.0 -1.6to Mexico 7.9 8.3 -0.5 0.3 7.9 8.6 0.7to ROW 17.5 16.6 0.2 -0.9 17.2 16.0 -1.2
Ind Supplies 96.2 100.8 -0.2 4.6 98.3 103.3 5.0Consumer Goods 55.4 56.8 -1.5 1.4 55.9 57.8 1.8All Other 18.4 20.5 -2.1 2.1 21.4 19.6 -1.8
Services Exp 184.7 189.6 -1.7 4.9 189.3 189.9 0.6
Imports of G&S 753.8 780.8 8.8 26.9 776.2 785.4 9.2
Goods Imports 619.9 649.4 8.5 29.5 644.6 654.3 9.7Petroleum 41.6 47.8 -6.0 6.2 46.6 49.1 2.5Gold 8.8 6.1 -1.2 -2.7 6.3 6.0 -0.3Computers 41.8 44.0 1.5 2.2 43.6 44.4 0.8Other Goods 527.7 551.5 14.2 23.7 548.1 554.8 6.7
Aircraft & Pts 11.3 12.4 -1.1 1.1 12.3 12.5 0.2Semiconductors 23.1 23.7 1.3 0.7 23.8 23.6 -0.2Other Cap Gds 94.4 97.4 5.6 3.1 97.0 97.8 0.8
Automotive 108.1 113.9 2.2 5.8 113.9 113.9 -0.0from Canada 36.9 40.0 -1.1 3.1 40.1 40.0 -0.1from Mexico 13.4 14.1 0.4 0.7 13.8 14.3 0.5from ROW 57.8 59.8 2.9 2.0 60.0 59.6 -0.4
Ind Supplies 101.3 105.8 5.4 4.5 104.7 106.9 2.2Consumer Goods 137.8 143.7 -0.2 6.0 142.1 145.3 3.2FFB 29.4 30.1 0.5 0.8 29.9 30.4 0.5All Other 22.5 24.3 0.4 1.9 24.3 24.4 0.0
Services Imp 133.9 131.3 0.3 -2.6 131.6 131.1 -0.5Memo:
Oil Qty (mb/d) 9.00 9.27 -0.24 0.28 9.38 9.16 -0.22
1/ Change from previous quarter or month. e/ Average of two months.Source: U.S. Dept. of Commerce, Bureaus of Economic Analysis and Census

IV-4
goods. For the two months combined, imports were higher than in the
first quarter by 15 percent at an annual rate. The increase was
spread about evenly among all major merchandise trade categories;
service payments to foreigners declined slightly. Higher imports of
machinery and non-oil industrial supplies (especially metals)
reflected the strength of U.S. expenditures on business equipment
and construction supplies. The rise in imported consumer goods was
largely in durable items such as household goods and recreational
and home entertainment equipment, and appears to have contributed to
a sharp run-up in U.S. retail inventories. Two-thirds of the
increase in imported consumer goods in April-May came from China.
In May, the quantity of imported oil declined for the second
consecutive month. Nonetheless, for April/May combined imports
averaged a bit above the first quarter rate as a decline in
consumption was more than offset by an increase in U.S. stocks.
Preliminary Department of Energy statistics suggest that in June oil
consumption increased sharply with the onset of the driving season,
likely pushing imports above 9.5 mb/d.
Prices of U.S. Imports and Exports
Prices of imported oil have continued to rise, climbing more
than $1.00 per barrel in May as OPEC production remained roughly
unchanged in the face of increasing oil demand, both in the United
States and abroad. For April-May on average, the price of imported
oil was 11 percent (NOT an annual rate) higher than in the first
quarter. Since the June Greenbook, West Texas Intermediate (WTI)
spot and futures prices have risen on balance in response to unrest
in Nigeria. Spot WTI peaked in early August at almost $21.00 per
barrel, and is currently trading at [$18.55] per barrel. These
developments should lead to further increases in import prices in
July and August.

IV-5
PRICES OF U.S. IMPORTS AND EXPORTS
(percent change from previous period)
Quarter93Q4 9401
(annual r
Merchandise ImportsOilNon-Oil
Foods, Feeds, Bev.Ind Supp Ex OilComputersCapital Goods Ex CompAutomotive ProductsConsumer Goods
Memo:Oil Imports ($/bbl)
Merchandise ExportsAgriculturalNonagricultural
Ind Supp Ex AgComputersCapital Goods Ex CompAutomotive ProductsConsumer Goods
Fixed-WeightImports of Gds & Serv.Non-oil Merch Ex Comp
Exports of Gds & Serv.Nonag Merch Ex Comp
-0.7-24.3
2.0
5.9-0.9-6.1
2.36.90.9
-2.1-30.2
1.3
0.85.4
-5.1-0.12.0
-0.1
s Months9402 Apr May Jun
ates) (monthly rates)----- BLS Prices----------------
7.363.8
2.8
15.84.2
-6.62.72.61.0
0.7 0.9 0.75.1 8.3 4.40.3 0.2 0.3
1.40.5
-0.20.20.30.2
1.8-0.2-0.90.10.30.2
2.10.5
-0.20.30.0-0.1
14.09 12.67 14.12 13.57 14.67
0.58.2
-0.6
-4.0-6.92.31.30.7
4.119.9
2.2
7.8-10.0
0.91.50.8
1.4-7.52.9
9.4-6.4-0.31.10.3
0.0-2.20.4
0.9-0.3-0.2-0.10.2
0.4 0.01.4 -2.10.2 0.3
0.6-0.8-0.10.20.1
1.2-1.00.20.0
-0.2
-------- Prices in the NIPA Accounts--------
-2.80.5
4.42.9
Oil Prices$ per bbi
-- Spot WTI- Import Unit Value
1991 1992 1993 19941987 1988 1989 1990

IV-6
Prices of non-oil imports rose 0.3 percent in June, about the
same rate as in four of the previous five months. In the second
quarter on average, prices (BLS) rose 2.8 percent at an annual rate;
while increases were recorded in all major end-use trade categories,
the largest rise was in foods. Two aspects of non-oil import price
developments are worth noting -- price increases in recent months
are a bit stronger than a year earlier, and prices (fixed-weight
excluding computers) now have risen in five consecutive quarters (at
an average annual rate of 2.4 percent); the last period of sustained
import price rise was 1987-88.
Prices of agricultural exports fell in June bringing the
decline in the second quarter to 7.5 percent at an annual rate.
This was the first price decline recorded since the second quarter
of 1993 and reflected, in part, an improvement in crop conditions.
In June, prices of nonagricultural exports rose for the sixth
consecutive month. The increase in the second quarter was slightly
more than in the first quarter, but was still less than 3 percent
AR. Price increases were recorded in most major trade categories,
led by a rise in industrial supplies. Slightly offsetting this
increase was a decline in the price of exported capital goods.
U.S. International Financial Transactions
Foreign official assets in the United States rose by $13
billion in June, largely as the result of central bank efforts to
stabilize the foreign exchange value of the dollar. (See line 1 of
the Summary of U.S. International Transactions table.) Partial
information from the FRBNY suggests that G-10 holdings rose by a
further net $6 billion in July. For the second quarter as a whole,
large increases in holdings by the G-10 countries were offset
somewhat by reduced holdings of several OPEC countries and Mexico.

IV-7
SUMMARY OF U.S. INTERNATIONAL TRANSACTIONS(Billions of dollars, not seasonally adjusted except as noted)
SQuarter Month
Year 1993 1994 1994
1992 1993 Q3 Q4 Q1 Q2 Apr. May June
Official capital
1. Changes in foreign official reserve
assets in U.S. (+ - increase)
a. G-10 countries
b. OPEC countries
c. All other countries
2. Changes in U.S. official reserve
assets (+ - decrease)
Private capital
Banks
3. Change in net foreign positions of
banking offices in the U.S.3
Securities
4. Foreign net purchases of
U.S. securities (+)4
a. Treasury securities
b Corporate and other bonds
c. Corporate stocks
5. U.S. net purchases (-) of
foreign securities
a. Bonds
b. Stocks
Other flows (quarterly data, s.a.)
6. U.S. direct investment (-) abroad
7. Foreign direct investment in U.S.6
8. Other (+ = inflow)
U.S. current account balance (s.a.)
Statistical discrepancy (s.a.)
38.34.84.9
28.6
70.0
29.8
-5.1
45.3
3.9 -. 7
35.6 13.6
68.1
37.4
34.3
-3.7
-47.9-15.6-32.3
-41.0
9.9
18.1
106.8
25.6
61.6
19.6
-124.3-61.0
-63.3
-57.9
21.4
53.9
-67.9 -103.9
-17.1 21.1
18.5
9.1
-3.1
12.1
23.04.7
-. 9
19.1
10.610.9
-2.32.0
7.515.3
-4.4
-3.3
-.5 -. 7 -. 1 3.5
20.2 5.3 35.3 38.2
21.43.6
14.9
2.8
-42.0-21.6
-20.4
46.6
8.3
26.1
12.2
-31.6-10.7
-20.9
-6.3 -22.7
3.0 8.1
22.0 -1.5
31.1
9.4
14.6
7.0
-26.4-7.9
-18.6
-20.4
8.1
-11.0
-27.9 -30.6 -31.9 n.a.
-8.4 4.0 4.7 n.a.
6.6-7.3
15.1
-1.3
-16.5
-5.8
-10.7
-14.0.6
-2.0
-12.7
8.5
6.4
-1.33.4
13.08.3
-1.2
5.9
.5 1.7 1.3
16.6 10.6 11.1
-9.6
-10.4
2.3
-1.5
11.7
7.7
2.5
1.6
4.4
-4.5
10.3
-1.4
-6.7 -4.1 -5.7-5.5 -.1 -.2
-1.2 -4.0 -5.5
n.a. n.a. n.a. n.a.
n.a. n.a. n.a. n.a.
n.a. n.a. n.a. n.a.
n.a.
n.a.
n.a. n.a.
n.a. n.a.
1. The sum of official capital, privatediscrepancy is zero. Details may not sum
capital, the current account balance, and the statistical
to totals becuse of rounding.
2. Changes in dollar-denominated positions of all depository institutions and bank holding companies
plus certain transactions between broker-dealers and unaffiliated foreigners (particularly borrowing and
lending under repurchase agreements). Includes changes in custody liabilities other than U.S. Treasurybills.
3. Includes commissions on securities transactions and therefore does not match exactly the data on
U.S. international transactions published by the Department of Commerce.
4. Includes Treasury bills.
5. Includes U.S. government agency bonds.6. Transactions by nonbanking concerns and other banking and official transactions not shown elsewhere
plus amounts resulting from adjustments made by the Department of Commerce and revisions in lines 1
through 5 since publication of the quarterly data in the Survey of Current Business.
n.a. Not available. * Less than $50 million.

IV-8
Large net capital inflows through banks (including RPs by
nonbank securities dealers) continued in June (line 3). During the
second quarter, both U.S. and foreign-based banks relied on net
borrowings from their own offices outside the United States as an
important source of funds. In addition, $16 billion of the $38
billion inflow was accounted for by swings in RP transactions of
nonbank securities dealers. Moreover, the Brazilian debt
restructuring in April resulted in a shift of about $5 billion from
reported bank claims to holdings of securities.
Private foreign net purchases of U.S. securities (line 4) were
modest in June and amounted to only $6.6 billion in the second
quarter as a whole. Net purchases of U.S. corporate and government
agency bonds (line 4b) were very strong, particularly in June,
reflecting in part settlement for the large volume of Eurobonds
issued by U.S. borrowers in May. In contrast, private foreigners
sold U.S. Treasury securities net (line 4a) during the quarter.
Large net sales of Treasury securities were recorded for the British
West Indies and Bermuda. (It appears that some of the proceeds from
these sales probably were lent back to U.S. nonbank securities
dealers; net liabilities of U.S. nonbank securities dealers to
nonbanks in the British West Indies and Bermuda increased by $10.2
billion in the second quarter.) In contrast, Japanese residents
were recorded as having bought over $10 billion in U.S. Treasury
securities in the second quarter. In addition, private foreigners
reduced their holdings of U.S. corporate stocks (line 4c) in the
second quarter, as stock prices remained below the highs reached
earlier in the year.
U.S. residents continued to add to their holdings of foreign
stocks in the second quarter (line 5b), but increases in holdings of
foreign bonds (line 5a) were far more modest. Net purchases of

IV-9
stocks in Japan accounted for about 40 percent of total net
purchases in the second quarter, in contrast to more than 50 percent
in the first quarter. Net purchases of foreign bonds were held down
in the second quarter, as they were in the first quarter, by very
large sales to the United Kingdom in the last month of the quarter.
Through the first six months of 1994, U.S. residents have sold net
$23 billion in foreign bonds to the United Kingdom. In contrast,
U.S. residents made large net purchases of foreign bonds from the
rest of Europe and Brazil (the latter in connection with Brazil's
debt restructuring).
Net shipments of U.S. currency abroad by banks reporting to
the FRBNY picked up from $5.1 billion in the first quarter to $8.2
billion in the second quarter. Of the total so far this year, $8.2
billion net has been shipped to Russia.
BEA is continuing its efforts to estimate changes in foreign
holdings of U.S. currency, but no data were incorporated in the U.S.
International Transactions Accounts in this June's revisions. BEA
did revise its estimates of credit extended by banks outside the
United States to U.S. nonbanks. As with data on the Eurodeposits of
U.S. nonbank residents, BEA is now using data from the BIS, Federal
Reserve, and other central banks instead of the notoriously
inadequate components from the Treasury International Capital (TIC)
reports. (See lines 4 and 5 of the International Banking Data
table.)

IV-10
INTERNATIONAL BANKING DATA 1/
(Billions of dollars)
1991 1992 1993 1994Dec. Dec. Sept. Dec. Mar. May June July
1. Net claims of U.S.
banking offices
(excluding IBFs)
on own foreignoffices and IBFS
a. U.S.-chartered
banks
b. Foreign-
chartered
banks
-35.8 -71.6
12.4
-48.3 -88.6
-114.6 -122.1 -157.5 -177.3 -175.4 -191.0
12.5 4.2 -15.1 -29.5 -29.9 -41.0
-127.1 -126.3 -142.4 -147.9 -145.6 -150.0
2. Credit extended to
U.S. nonbank
residents
a. By foreign
branches of
U.S. banks
b. By Caribbean
offices of
foreign-chartered
banks
3. Eurodollar holdings
of U.S. nonbank
residents
a. At all U.S.-chartered
banks and foreign-
chartered banks in
Canada and the
United Kingdom
b. At the Caribbean
offices of
foreign-chartered
banks
MEMO: Data as recorded in the
4. Credit extended to
U.S. nonbank
residents
5. Eurodeposits of U.S.
nonbank residents
23.9
n.a.
102.9
n.a.
24.8
n.a.
90.0
n.a.
21.4 21.8
95.9 90.9
77.0 77.8
82.4 79.2
U.S. international transactions accounts
183 195 201 206
271 255 252 253
21.4 22.4 22.2 22.4
88.6 n.a. n.a. n.a.
75.1 72.1 73.6 79.3
84.2 n.a. n.a. n.a.
n.a. n.a. n.a. n.a.
n.a. n.a. n.a. n.a.
1. Data on lines 1 through 3 are from Federal Reserve sources and sometimes differ in timing from thebanking data incorporated in the U.S. international transactions accounts.
Lines la, lb, and 2a are averages of daily data reported on the FR 2950 and FR 2951.
Lines 2b and 3b are end-of-period data reported quarterly on the FFIEC 002s.
Line 3a is an average of daily data (FR 2050) supplemented by the FR 2502 and end of quarter data suppliedby the Bank of Canada and the Bank of England. There is a break in the series in April 1994.
Lines 4 and 5 are end-of-period data estimated by BEA on the basis of data provided by the BIS, the Bankof England, and the FR 2502 and FFIEC 002s. It includes some foreign-currency denominated deposits andloans. Source: SCB

IV-11
Foreign Exchange Markets
The weighted-average foreign exchange value of the dollar has
shown little net change on balance since the July 5 FOMC meeting.
Over this period, the dollar has depreciated about 1-1/2 percent
against the mark and risen about 1 percent relative to the yen. The
dollar declined in early July, apparently reflecting market
perceptions that U.S. officials were not concerned over the dollar's
value, or perhaps even were willing to look favorably on dollar
depreciation as a way of creating pressure in trade negotiations
with Japan. However, the dollar recovered these loses later in the
month following statements of concern over the dollar by Chairman
Greenspan and Treasury officials. On July 20, Chairman Greenspan in
his Humphrey-Hawkins testimony indicated that the weakness of the
dollar was a concern and had recently been a focus of Federal
Reserve policy. The next day Treasury Under Secretary Summers
stated that the Administration wanted the dollar to strengthen in
value and that a dollar decline had potentially adverse
consequences. The July 31 announcement that the Unites States was
starting trade sanctions proceedings against Japan over
discriminatory government procurement practices for
telecommunications and medical equipment caused only a temporary
decline of the dollar against the yen.
Since the July FOMC meeting, the weighted-average of short-term
interest rates in the major industrial countries has risen about 15
basis points while U.S. short-term rates have declined 5 basis
points. The largest individual change has been in Italy, where
short-term rates have risen 130 basis points. Most of this rise
took place after the Bank of Italy's August 11 announcement of 50
basis point increases in its official lending rates in an attempt to
provide support for the lira. In Canada, the three-month rate has
IV-12
declined by 75 basis points in response to an easing of pressure on
the Canadian dollar, apparently reflecting some lessening market
concerns over the outcome of the upcoming Quebec provincial
elections. Since reaching a peak in late June, Canadian short-term
interest rates have declined about 100 basis points, reversing about
one-third of their rise of earlier in the year. Short-term rates in
the United Kingdom have risen 50 basis points over the past month.
Indications of strength in the U.K. economy seem to have convinced
market participants that the next interest rate adjustment by the
Bank of England is likely to be an increase. Japanese short-term
rates have edged up about 20 basis points over the past month,
apparently reflecting a growing perception that the Bank of Japan is
likely soon to start nudging short-term interest rates higher as the
Japanese economy turns around.
Short-term interest rates in Germany have shown almost no net
change since the July FOMC meeting. On July 21, the Bundesbank
Council, at its last meeting before its August recess, decided to
keep its discount and Lombard rates unchanged and indicated that for
the following four weeks the repo transactions through which the
Bundesbank provides liquidity to the German money market would be
conducted at a fixed rate of 4.85 percent. In the weeks leading up
to this announcement, the repo rate had been reduced in
progressively smaller increments to 4.88 percent.
The weighted-average of long-term interest rates in the foreign
industrial countries has increased about 20 basis points since the
July FOMC meeting, while U.S. long-term rates has been about
unchanged on balance over this period. The long-term rate in
Germany has risen about 25 basis points on balance, and long-term

IV-13
WEIGHTED AVERAGE EXCHANGE VALUE OF THE DOLLARMarch 1973 = 100
May June July August
INTEREST RATES IN THE MAJOR INDUSTRIAL COUNTRIES
Three-month RatesJuly 5 August 12 Change
10-year Bond YieldsJuly 5 August 12 Change
GermanyJapanUnited KingdomCanadaFranceItaly
Weighted-averageforeign
4.75 -0.05 7.31
4.902.095.136.605.508.38
4.77
4.902.295.635.855.569.69
4.94
0.000.200.50
-0.750.061.31
0.17
7.044.338.729.297.67
10.88
7.35
7274.578.729.137.87
11.64
7.56
0230240.00
-0.160200.76
021
7.31 0.00United States 4.80

IV-14
rates in other European countries have also generally moved higher.
Nearly all of the increases in European long-term rates came in the
wake of the August 11 announcements by the Swedish and Italian
central banks of increases in their official lending rates.
Although these moves appeared to have come in response to
exclusively internal developments unique to Italy and Sweden, they
appear to have reinforced market perceptions that the next short-
term interest rate moves in a number of other European are also
likely to be in an upward direction, and touched off a sharp rise in
long-term rates throughout Europe. In Japan, the long-term rate has
risen by about 25 basis points over the past month, apparently
reflecting market perceptions that the Japanese economy is starting
to show signs of reviving, as well as concerns over the possible
impact on future interest rates of the widening Japanese budget
deficit.
The Desk has not
intervened over this period.
Developments in Foreign Industrial Countries
Monthly indicators suggest that recovery continued in the
second quarter in the major foreign industrial countries. The
moderate recovery in continental Europe that began late last year
appears to have firmed, while growth continued at a healthy pace in
the United Kingdom and Canada. In Japan, where signs of established
recovery still are tentative, economic activity softened somewhat
from the strong expansion registered in the first quarter, but
growth, albeit on a weaker pace, continued.
In the United Kingdom and Canada, unemployment rates in the
second quarter fell from rates registered in the first quarter.

IV-15
Unemployment in western Germany and France may have peaked in the
second quarter as rates in June edged down from May. Nevertheless.
the unemployment rate in every foreign G-7 country remains high by
historical standards.
Consumer price inflation remains subdued, especially in Canada
and Japan where excise tax cuts and yen appreciation respectively
have lowered year-on-year inflation rates to zero. However, input
prices in the United Kingdom have picked up in recent months.
Individual Country Notes. In Japan, second-quarter data suggest
that GDP growth likely slowed from the nearly 4 percent (SAAR) pace
registered in the first quarter. Industrial production and housing
starts moved up moderately in the April-June period, and the index
of leading indicators remained well above the boom-bust demarcation
line of 50. Machinery orders in May and June regained part of the
sharp drop-off registered in April. In contrast, new car
registrations declined sharply in the second quarter, despite the
pickup in June, and the most recent measures of labor market
tightness -- particularly the job offers-to-applicants ratio --
showed further deterioration.
JAPANESE ECONOMIC INDICATORS(percent change from previous period except where noted, SA)
1993 1994Q3 Q4 Q1 Q2 Apr. May Jun.
Industrial Production 0.1 -3.7 1.9 0.9 -1.9 -1.2 2.0Machinery Orders 0.4 -0.7 6.9 -16.7 -23.1 1.7 8.6New Car Registrations 1.6 -3.3 8.5 -7.5 -12.3 -4.6 7.4
Job Offers Ratio* 0.71 0.66 0.66 0.64 0.66 0.64 0.63Index Leading Ind.* 42.9 35.8 64.9 n.a. 72.7 60.0 n.a.Business Sentiment** -51 -56 -56 -50 -
* Level of indicator.** Percent of manufacturing firms having a favorable view of
business conditions minus those with an unfavorable outlook.
On July 31, the United States identified Japanese government
procurement practices for telecommunications and medical equipment

IV-16
as discriminatory against imports, giving Japan 60 days to take
corrective steps or face the risk of higher sanctions on some
exports to the United States. This development added temporarily to
downward pressure on the dollar against the yen, exacerbating
concerns that the rising yen may stifle Japan's nascent recovery.
Notwithstanding the roughly 10 percent appreciation of the yen
against the dollar since the beginning of the year. Japan's trade
surplus totalled $126.5 billion (SAAR) in the first seven months of
1994. up from the $119.6 billion surplus registered in all of 1993.
This increase largely reflects movements in dollar prices of
Japanese exports and imports, stemming in part from the rise in the
yen. Measures of the constant-dollar value of Japan's trade, based
on wholesale export and import price indices, indicate that the real
surplus has declined thus far in 1994 from its 1993 average.
In western Germany, available data suggest that recovery likely
strengthened further in the second quarter. Industrial production
and manufacturing orders posted moderate gains, and the rate of
capacity utilization exceeded 80 percent for the first time since
the fourth quarter of 1992. However, retail sales in the second
quarter were down 3.3 percent relative to the first quarter. In
eastern Germany, industrial production (NSA) has continued to show
strong gains, advancing 19.2 percent during the year ending in May.
WESTERN GERMAN ECONOMIC INDICATORS(percent change from previous period except where noted, SA)
1993 1994Q3 Q4 Q1 Q2 May Jun. Jul.
Industrial Production 0.7 -0.4 0.0 2.4 -0.1 1.0 n.a.Manufacturing Orders 1.9 -1.1 2.6 3.6 -0.1 2.2 n.a.Capacity Utilization 78.2 78.1 79.4 81.5Unemployment Rate (%) 8.5 9.0 9.2 9.3 9.3 9.3 9.2
Production Plans* -15.0 -8.0 3.3 7.7 8.0 9.0 n.a.
* Percent of manufacturing firms planning to increase production inthe next three months minus those planning to decrease production.

IV-17
Growth of the targeted monetary aggregate M3 has moderated
since the early months of this year but remains high. In June,
German M3 increased 11.4 percent (SAAR) relative to the fourth
quarter of 1993, down from 13.4 percent in May. It appears unlikely
that M3 will fall within its official target range of 4 to 6 percent
this year. In its mid-year review on July 21, the Bundesbank
Council reaffirmed this year's target range for M3 growth.
First-quarter GDP growth in France recently was revised upward
to 2.8 percent (SAAR) from an initial estimate of 2 percent. This
upward revision was largely due to an increase in the contribution
from inventories and a smaller negative contribution from business
fixed investment.
FRENCH REAL GDP(percent change from previous period, SAAR)
1992 1993 1993 1994Q4/Q4 Q4/Q4 Q3 Q4 Q1
GDP 0.6 -0.5 1.2 0.0 2.8
Total Domestic Demand -0.3 -2.0 -2.0 -1.6 6.8Net Exports (contribution) 0.8 1.5 2.5 1.1 -3.4
Monthly indicators suggest that the French recovery continued
in the second quarter. Industrial production rose in April and May
due to stronger manufacturing output. The increase in May was small
relative to April due to unseasonably cold weather in April that
contributed to a temporary rise in energy output. Second-quarter
consumption appears to have been quite strong as consumption of
manufactured products rose sharply. Survey data for June show that
business confidence and domestic and foreign orders continued to
improve. Employment data for June indicate that French unemployment
may have peaked in May--somewhat earlier than expected.

IV-18
FRENCH ECONOMIC INDICATORS(percent change from previous period except where noted, SA)
1993 1994Q3 Q4 Q1 Q2 Apr. May Jun.
Industrial Production 0.9 -0.5 0.8 n.a. 2.3 0.3 n.a.Consumption ofManufactured Products 1.9 -1.5 0.6 1.4 1.8 -1.1 0.2Unemployment Rate (%) 11.9 12.3 12.5 12.6 12.6 12.7 12.6
* Roughly 1/3 of total real consumption
In the United Kingdom, preliminary data show that the GDP
growth rate rose in the second quarter despite large tax increases
that took effect at the beginning of April. Although oil production
continued to boost growth, non-oil output also grew strongly and now
UNITED KINGDOM REAL GDP(percent change from previous period, SAAR)
1992 1993 1993 1994Q4/Q4 Q4/Q4 Q3 Q4 Q1 Q2
GDP 0.3 2.6 3.8 3.0 2.7 3.6*Non-oil GDP 0.2 2.2 2.9 2.4 2.0 3.2
* preliminary
UNITED KINGDOM ECONOMIC INDICATORS(percent change from previous period except where noted, SA)
Industrial ProductionRetail SalesAverage Earnings
Production Plans* (%)Consumer Confidence**Unemployment Rate (%)
Input Prices (NSA)***RPI ex. MIP (NSA)****
1993
1.3 1.41.0 0.83.3 3.1
12.0(%) -4.7
10.4
9.712.010.0
Q10.91.13.8
20.7-7.79.8
1994
2.0 0.41.0 0.0n.a. 3.8
20.3-14.09.4
23.0-10.0
9.4
Jun.0.20.3n.a.
22.0-10.09.4
Jul.n.a.n.a.n.a.
13.0-6.0n.a.
5.4 -0.7 -3.0 0.6 0.9 2.2 2.93.1 2.7 2.7 2.4 2.5 2.4 n.a.
* Percent of manufacturing firms planning to increase productionin the next four months minus those that plan to decreaseproduction. NSA.
** Percent of individuals who expect the general economic situationto improve minus those who expect it to worsen. NSA.
*** Producers' input prices, percent change from year earlier.*** Retail prices excluding mortgage interest payment, percent
change from year earlier.
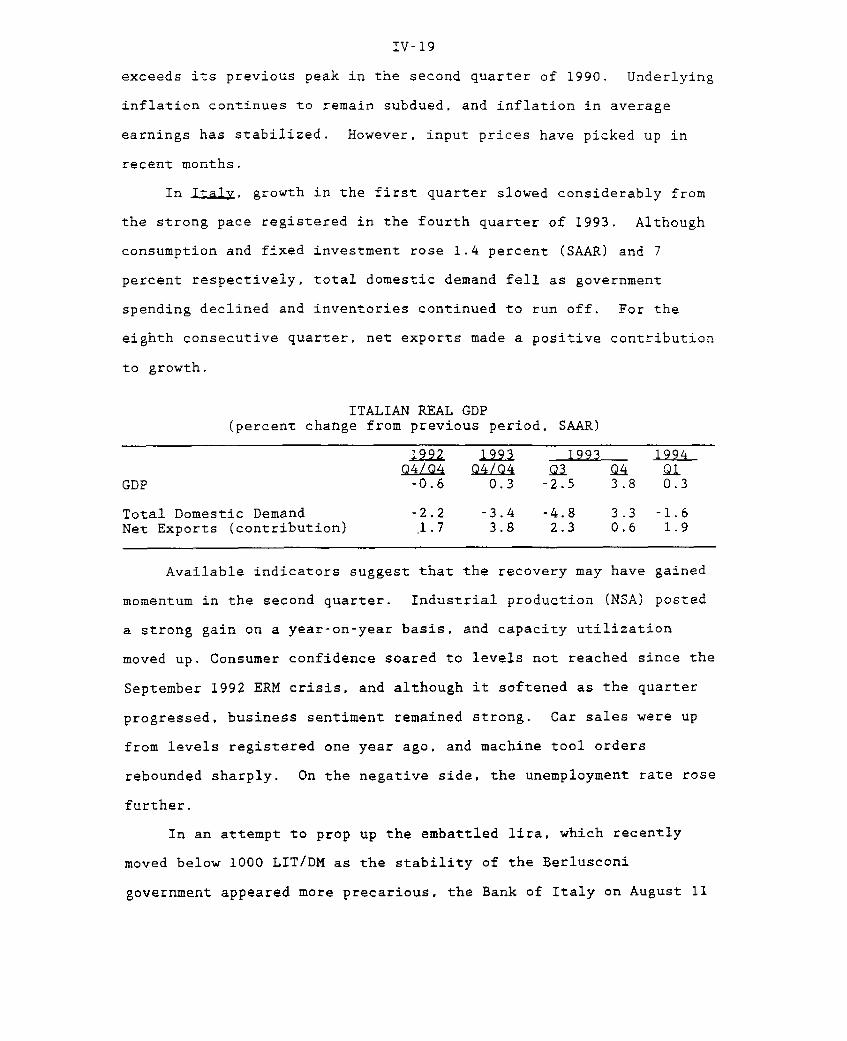
IV-19
exceeds its previous peak in the second quarter of 1990. Underlying
inflation continues to remain subdued, and inflation in average
earnings has stabilized. However, input prices have picked up in
recent months.
In Italy, growth in the first quarter slowed considerably from
the strong pace registered in the fourth quarter of 1993. Although
consumption and fixed investment rose 1.4 percent (SAAR) and 7
percent respectively, total domestic demand fell as government
spending declined and inventories continued to run off. For the
eighth consecutive quarter, net exports made a positive contribution
to growth.
ITALIAN REAL GDP(percent change from previous period, SAAR)
1992 1993 1993 1994Q4/Q4 Q4/Q4 Q3 Q4 Q1
GDP -0.6 0.3 -2.5 3.8 0.3
Total Domestic Demand -2.2 -3.4 -4.8 3.3 -1.6Net Exports (contribution) 1.7 3.8 2.3 0.6 1.9
Available indicators suggest that the recovery may have gained
momentum in the second quarter. Industrial production (NSA) posted
a strong gain on a year-on-year basis, and capacity utilization
moved up. Consumer confidence soared to levels not reached since the
September 1992 ERM crisis, and although it softened as the quarter
progressed, business sentiment remained strong. Car sales were up
from levels registered one year ago, and machine tool orders
rebounded sharply. On the negative side, the unemployment rate rose
further.
In an attempt to prop up the embattled lira, which recently
moved below 1000 LIT/DM as the stability of the Berlusconi
government appeared more precarious, the Bank of Italy on August 11

IV-20
surprised financial markets by raising the discount rate 1/2
percentage point to 7-1/2 percent.
ITALIAN ECONOMIC INDICATORS (NSA)
1993 1994Q3 Q4 Q1 Q2 Apr. May Jun.
Industrial Production* -2.7 0.1 2.6 6.1 0.2 9.2 8.7Capacity Utilization (%) 73.7 74.4 74.5 76.0 -- -
Unemployment Rate (%) 10.3 11.3 11.3 11.6 -- -
Consumer Confidence 98.5 96.3 100.6 112.8 108.4 112.6 117.3Business Sentiment** (%) -3 4 19 17 25 17 8
* Percent change from year earlier level.** Percent of manufacturing firms having a favorable view of business
conditions minus those with an unfavorable outlook.
Preliminary data for Canada indicate that economic activity
continued to expand at a robust pace in the second quarter.
Strength in manufacturing industries boosted industrial production
in April and May, and the Index of Business Confidence reached its
highest level in 15 years. Employment gains remained strong through
July. Consumer confidence slipped, however, as consumers expressed
increased caution about spending plans in light of recent steep
interest rate increases. Consumer-price inflation remains subdued.
Excluding the effects of recent excise tax cuts, inflation in the
second quarter averaged 1.4 percent (year-on-year).

IV-21
CANADIAN ECONOMIC INDICATORS(percent change from previous period except where noted, SA)
1993 1994Q3 Q3 Q1 Q2 Apr. May Jun. Jul.
Industrial Production 1.0 1.2 0.5 n.a. 1.3 0.7 n.a. n.a.Retail Sales 1.3 1.0 3.2 n.a. -1.7 1.0 n.a. n.a.Consumer Attitudes -0.2 10.6 4.5 -1.3 -- --Business Confidence* -7.7 10.0 8.8 12.3 -- -- -- -Employment 0.2 0.3 0.4 0.8 0.0 0.5 0.1 0.5Unemployment Rate (%) 11.4 11.1 11.0 10.7 11.0 10.7 10.3 10.2Consumer Prices** 1.7 1.8 0.6 0.0 0.2 -0.2 0.0 n.a.
* NSA.* Percent change from year earlier.
EXTERNAL BALANCES(Billions of U.S. dollars, seasonally adjusted)
1993 - 1994
Q4 Q1 Q2 Apr. May Jun. Jul.Japan: trade 30.5 31.3 30.9 11.6 8.5 10.7 11.6current accnt 30.6 33.8 34.2 12.5 10.0 11.8 n.a.
Germany: trade* 14.4 10.2 n.a. 3.9 3.0 n.a. n.a.current accnt* -3.4 -5.1 n.a. -1.0 -3.7 n.a. n.a.
France: trade 5.5 2.8 n.a. 1.5 1.3 n.a. n.a.current accnt n.a. n.a. n.a. - -- -
U.K.: trade -5.0 -4.4 n.a. -1.1 -1.6 n.a. n.a.current accnt -2.7 -0.8 n.a. -- -- -
Italy: trade 6.2 6.9 n.a. 2.0 2.7 n.a. n.a.current accnt* 6.4 1.3 7.1 1.4 1.6 4.2 n.a.
Canada: trade 1.8 1.7 n.a. 0.8 -0.2 n.a. n.a.current accnt -6.1 -5.3 n.a. -- -- -
* Not seasonally adjusted.-- Data not available on a monthly basis.

IV-22
Chart I August 12. 1994
Industrial Production for Major Foreign CountriesRatio Scale, Seasonally Adjusted, Monthly
1987=100 1987=100
1990 1991 1992 1993 1994
130 - -France
120
110
100
\ I I !1990 1991 1992 1993 1994
130 --Italy
120
110
100
1990 1991 1992 1993 1994
1990 1991 1992 1993 1994
United Kingdom
I I I I1990 1991 1992 1993 1994
Canada
1990 1991 1992 1993 1994
130
120
110
100
130
120
110
100

IV-23
Chart 2 August 12, 1994
Consumer Price Inflation for Major Foreign CountriesYearly Percent Change
Japan
6 -
91
6
I I I L1990 1991 1992 1993 1994
France
1 I I I1990 1991 1992 1993 1994
Italy
9 F-
6
3
I I
W. Germany
- 6
I 1 1 I1990 1991 1992 1993 1994
1990 1991 1992 1993 1994
*Excluding mortgage interest payments.
1990 1991 1992 1993 1994
I1990 1991 1992 1993 1994

IV-24
Economic Situation in Other Countries
The Mexican economy has experienced signs of economic recovery,
as export performance has been stimulated by NAFTA as well as a more
competitive real exchange rate. Uncertainty about the August 21
presidential election contributed to strong pressure on the peso in
early July, but this pressure abated and the exchange rate
subsequently appreciated. In Venezuela, recently imposed foreign
exchange and price controls have caused shortages of imported raw
materials and a sharp contraction in industrial output and exports.
Brazil has implemented a new stabilization program that pegs its
currency to the U.S. dollar, and monthly inflation fell from 50
percent in June to 7.8 percent in July. In Argentina, the
unemployment rate has reached a record high of 10.8 percent despite
strong growth in industrial production and exports.
In China, output growth and inflation slowed slightly in the
first half of 1994, and the trade deficit declined sharply.
Taiwan's industrial output in June was up 9.8 percent (year/year),
while Korea's second-quarter industrial production was up 10 percent
(year/year). In Russia, inflation has slowed in recent months, but
the fiscal outlook has deteriorated due to an increase in tax
evasion and an unexpectedly steep decline in industrial production.
Individual country notes. In Mexico, new data on GDP growth is
expected to be released prior to the August 21 presidential and
congressional elections. First-quarter real GDP growth is likely to
be revised upward to nearly 1 percent (year/year), compared with the
previous estimate of 0.5 percent. Recent sectoral data suggests
that GDP growth may have risen further in the second quarter.
Signs of economic recovery have been visible in the growth of
imports (19.3 percent higher in January-May 1994 than in the same
period of 1993) and of exports of manufactured goods (25 percent

IV-25
higher). Total exports during January-May were up 17.3 percent from
the same period in 1993, despite a 14 percent drop in the value of
petroleum exports. The cumulative trade deficit reached $7.3
billion, up $1.5 billion from the same period a year
earlier.Automobile companies are responsible for a substantial share
of increased trade, as production lines at Mexican and U.S.
facilities are restructured under the impetus of NAFTA. Export
performance in recent months has also been stimulated by U.S.
economic expansion and a more competitive real exchange rate. The
peso depreciated by nearly 9 percent against the dollar from mid-
February through July, while consumer price inflation remained
steady at about 0.5 percent per month over this period. At the end
of July, the CPI was 6.8 percent higher than a year earlier.
In early July, uncertainty about the approaching presidential
election contributed to strong pressure against the peso, but this
pressure abated and the exchange rate subsequently appreciated.
As shown in the following chart on Mexican financial markets, the
peso/dollar exchange rate moved away from the "lower" limit of its
fluctuation band, and was 0.6 percent above the "lower" limit on
August 11. The Mexico City stock market index on August 11 was 33
percent above the trough recorded in April, but remained 10 percent
below last February's all-time high. The rate on one-month peso-
denominated Treasury bills at the August 10 auction declined further
to 15.2 percent, but remained well above its mid-February low of
8.8 percent.
In Venezuela, the Caldera administration's adoption of foreign
exchange and price controls has disrupted trade and economic
activity. These controls were imposed by emergency decree on June
27 in response to rapidly deteriorating inflation and international
reserves. Foreign exchange markets were closed for two weeks until

IV-26
RECENT MEXICAN FINANCIAL INDICATORS
EXCHANGE VALUE OF THE MEXICAN PESO
FDailyPeso/$
Jan Feb Mar Apr May June July Aug
1-MONTH INTEREST RATE IN MEXICO PerceneekPercent
Weekly A
Jan Feb
MEXICAN STOCK INDEX
June July Aug
January 3, 1994 - 100
Mar AprJan Feb June

IV-27
detailed regulations could be issued, and trading resumed in mid-
July at a single official rate of 170 bolivars per dollar, a
revaluation of 15 percent from the previous free market rate.
Although foreign exchange purchases for foreign travel and debt
service were authorized by the new Exchange Control Board, importers
did not receive approval for any foreign exchange purchases until
July 28.
Shortages of imported raw materials reportedly forced
widespread plant shutdowns and accelerated vacations during July,
causing a substantial drop in industrial production. Non-oil
exports fell an estimated 50 percent in July, after falling 20
percent the previous month. The flow of imports presumably slowed
to a trickle in July, after a 30 percent drop in imports over the
previous six months due to weak economic activity. Foreign exchange
reserves increased by about $900 million during July to an estimated
$9.8 billion. The authorities have indicated that the central bank
will sell importers about $300 million per month in foreign
exchange, about half the amount required to finance imports at
January-June levels. Despite the evident shortfall in the supply of
dollars, the government has apparently succeeded thus far in
suppressing a black market inside Venezuela by announcing heavy
fines and prison sentences for foreign exchange violations.
However, a small parallel market has developed across the border in
Colombia, with bolivars trading at a discount of about 25 percent
below the official exchange rate.
Price controls have been imposed on over 100 basic goods and
services, including price rollbacks of 10 to 20 percent on some
products. These controls probably contributed to the drop in
industrial output, with only partial success in restraining
inflation. The consumer price index rose 6.3 percent in July, down
IV-28
from 9 percent inflation in June, but still more than twice the
inflation rate of 3.1 percent a year earlier. Government officials
blamed July's inflation on raw materials shortages. However, the
recent shift to a highly expansionary monetary policy has probably
contributed to the upward pressure on prices. In mid-July, the
central bank cut its discount rate to 45 percent, from 73 percent
a week earlier.
In late June, an emergency oversight board was established with
very broad authority over the banking system. The oversight board
may instruct a bank to deposit funds in another bank, and may
confiscate the assets of any bank that fails to comply with board
directives. In early August, the authorities took over Banco de
Venezuela, the country's second-largest bank and the tenth bank to
be taken over this year.
Brazil's implementation of a new stabilization program has
caused a sharp drop in the inflation rate. Under the Plan Real, a
new currency called the real was introduced on July 1, and the
central bank is committed to maintaining the value of the currency
at no less than one dollar per real. Confidence in the new plan has
been strengthened by the central bank's large holdings of
international reserves, which exceeded $40 billion at the end of
May. In fact, tight monetary policy in July generated upward
pressure on domestic interest rates and contributed to an
appreciation of the currency to $1.10 per real on August 11.
Consumer prices (in real terms) rose by 7.8 percent in July,
compared with June's inflation rate of 50 percent under the old
currency. However, the long-term sustainability of the plan depends
on the extent to which Brazil reduces its fiscal deficit and avoids
the need for inflationary financing. The impact of recent fiscal
adjustments remains unclear, despite optimistic government claims.

IV-29
Brazil's unemployment rate was 5.5 percent over the first six
half of 1994, down slightly from 5.7 percent a year earlier. The
cumulative trade surplus for January-June was $7 billion, roughly
unchanged from a year earlier.
In Argentina, the unemployment rate has reached a record high
despite strong growth in industrial production and exports. In
May's semi-annual survey, urban unemployment jumped to 10.8 percent,
up from 6.6 percent in 1992 and 9.9 percent in 1993. Meanwhile,
industrial production during January-May was up 6.2 percent from a
year earlier. Faced with relatively high labor costs and the
elimination of tariffs on imported capital goods, the manufacturing
sector has cut back its work force and invested heavily to achieve
higher labor productivity and improve its international competitive-
ness. Unemployment has also risen due to layoffs by privatized
utilities and by provincial governments with more stringent budget
requirements. The Menem administration has responded to higher
unemployment by establishing job retraining, by changing regulations
to stimulate employment in the construction sector, and by pushing
legislation to increase the flexibility of work arrangements.
The January-May trade deficit widened to $1.8 billion, from
$140 million a year earlier, reflecting moderate export growth and
soaring capital goods imports. In early August, Argentina and
Brazil reached agreement on the structure of external tariffs of the
Mercosur customs union, which is scheduled for implementation on
January 1, 1995.
Consumer prices in July were 3.6 percent higher than a year
earlier. However, recent polls reveal widespread perceptions that
the benefits of low inflation and rapid economic growth have not
"trickled down" to the average working family. In early August,

IV-30
a constitutional assembly gave final approval to reforms that will
permit President Menem to run for a second term, but growing public
discontent has clouded the prospects for his reelection next year.
In China, output growth and inflation slowed slightly in the
first half of 1994, while the trade deficit declined sharply.
Output grew 11.6 percent (year/year), down from 13.7 percent a year
earlier. Urban consumer inflation in June slowed to 23 percent
(year/year), down from February's peak of 26 percent. China ran a
trade deficit of $820 million over the first six months of 1994,
down from $2.7 billion a year earlier, as export growth of 30
percent outpaced import growth of 20 percent.
Foreign direct investment in China during the first half of
1994 was $14.7 billion, up 55 percent from the same period of 1993.
Foreign exchange reserves reached $32 billion in June, up sharply
from $21 billion at the beginning of the year. The rapid increase
in official reserves reflects the shrinking trade deficit, large
capital inflows, and the influence of the unified exchange rate
system established in January. The new system has provided Chinese
enterprises with more stable access to foreign exchange and has
reduced the incentive to hide export earnings abroad.
In a July report to Congress, the U.S. Treasury concluded again
that China's manipulation of its foreign exchange system prevents
effective adjustment of the balance of payments. The U.S. Treasury
particularly objected to the exclusion of foreign-funded enterprises
from the new interbank foreign exchange market.
Taiwan's industrial production in June was 9.8 percent higher
than a year earlier; for the first half of 1994, industrial
production was up 6.9 percent. The January-July trade surplus was
$3.1 billion, down from $4 billion a year earlier. Exports rose 4.2
percent, and imports grew 6.7 percent. Foreign exchange reserves
IV-31
topped $90 billion at the end of June, boosted by the appreciation
of the yen and deutschmark.
In Korea, second-quarter industrial production rose about 10
percent (year/year), with particularly strong growth in the
automotive and electronics sectors. Although the central bank has
pursued a less-accommodative monetary policy since mid-February,
consumer price inflation rose to 6.9 percent (year/year) in June, up
from 4.3 percent a year earlier. The unexpected jump in inflation
prompted a further tightening of liquidity, and the three-month time
deposit rate rose to 14.5 percent on August 9, up about 200 basis
points since early June.
Merchandise imports during the first half of 1994 rose 14.6
percent from a year earlier, while exports grew by 11.4 percent.
The current account deficit rose sharply to $2.7 billion over
January-April, up from $1.2 billion a year earlier.
On July 1, the government changed its regulations to allow
small- and medium-sized Korean enterprises to sell convertible bonds
directly to foreign investors. Overseas borrowing had previously
been limited mainly to firms engaged in producing technologically
sophisticated manufactured goods. To promote greater international
portfolio diversification, the government also liberalized
restrictions on foreign stock purchases by domestic residents.
In Russia, official statistics indicate that real GDP fell 17
percent during the first half of 1994 (year/year), while industrial
production was 26 percent below its year-earlier level. The sharp
contraction in output has been exacerbated by rising fuel and raw
materials prices, growing inter-enterprise arrears, and reduced
government purchases. However, these official statistics probably
overstate the actual decline in economic activity, due to incomplete
coverage of the private sector. Russia's largest private investment

IV-32
fund, the MMM corporation, collapsed in late July, but no immediate
macroeconomic impact was evident.
Inflation has slowed in recent months; consumer prices
increased by 4.8 percent in June and by 5.1 percent in July,
compared with last year's average rate of over 20 percent per month.
The ruble has depreciated at a steady rate of about 1 percent a week
since late February. On August 11, the MICEX exchange rate was 2108
rubles per dollar. The Central Bank of Russia has progressively
lowered its refinance rate from 17.5 percent a month in April to
12.5 percent a month in early August, but the rate remains
substantially higher than monthly consumer price inflation.
A large shortfall in revenue contributed to the fiscal deficit
of about 10 percent of GDP during January-June, well above this
year's target of 7.2 percent of GDP specified in the Systemic
Transformation Facility (STF) arrangement with the IMF. The revenue
shortfall reflects the unexpectedly steep decline in industrial
production, growing tax evasion, and incomplete implementation of
revenue enhancement measures outlined in the STF.