greendeavor carbon calculator reference...
TRANSCRIPT
Greendeavor Carbon Calculator
Reference Guide
Prepared for the 1772 Foundation
by
Sophie Agbonkhese, MLOG 2010
Rebbie Hughes, MBA 2011
Monique Tucker, MBA 2011
Annebel Hsiau-Chuan Yu, MBA 2011
submitted
May 12, 2010

TABLE OF CONTENTS
1. Introduction ............................................................................................................................. 3
2. Problem Statement ................................................................................................................... 3
3. Background .............................................................................................................................. 3
4. The Greendeavor Carbon Calculator ....................................................................................... 4
4.1 Methodology .................................................................................................................... 4
4.2 Pages................................................................................................................................. 5
4.2.1 Dashboard ................................................................................................................. 5
4.2.2 Green Building .......................................................................................................... 7
4.2.3 Preservation............................................................................................................. 12
5. Application of the Carbon Calculator: The Anna Clapp Harris Smith House ...................... 12
6. Recommendations for Future Improvements of the Carbon Calculator................................ 13
7. Resources ............................................................................................................................... 14
Appendix 1: Year of Indifference Equation.................................................................................. 16
Appendix 2: User Guide ............................................................................................................... 17
Construction Emissions ............................................................................................................. 17
Operational Emissions............................................................................................................... 19
Appendix 3: Material Weights ...................................................................................................... 22

Team Greendeavor Carbon Calculator Reference Guide 05/06/10
3
1. INTRODUCTION
Team Greendeavor consists of Sophie Agbonkhese, Rebbie Hughes, Monique Tucker, and
Annebel Hsiau-Chuan Yu. We partnered with the 1772 Foundation, a non-profit foundation that
makes grants for historic preservations, to develop a methodology to calculate the carbon
footprint of sustainable historic preservation.
2. PROBLEM STATEMENT
This project addressed two questions. First, what are the steps in the sustainable historic
preservation process and what are the carbon and energy implications involved with each step?
Second, how does this compare to the embodied carbon released in the demolition of an existing
building to create a new one?
3. BACKGROUND
In the past four years, over 5,000 homes have been certified by the LEED (Leadership in Energy
and Environmental Design) for Homes program1. According to the US Green Building Council,
“green” homes use less energy, water, and natural resources, create less waste, are more durable,
and provide a comfortable and healthy living environment. Green homes result from either green
design and new construction or upgrades performed on existing buildings. Therefore, creating
green infrastructure and preserving historic buildings need not be mutually exclusive.
Tradeoffs exist, however, that determine whether a new green building or a retrofitted historic
building has a greater environmental footprint. For example, a 200-year-old building with every
possible energy efficiency upgrade will never be as efficient as a building designed in 2010 for
maximum efficiency. On the other hand, substantial amounts of waste are created, embodied
1 http://www.usgbc.org/DisplayPage.aspx?CMSPageID=147
Team Greendeavor Carbon Calculator Reference Guide 05/06/10
4
energy is released, and energy is used in the demolition of an existing building and subsequent
production of a new one. Numerous variables such as the building’s condition, size, location, and
purpose play a role in determining which alternative is more environmentally-friendly. In both
cases, the building is constantly in a state of deterioration and one catches only a snapshot of a
building in a certain stage of its lifecycle. The 1772 Foundation sought to understand the
relationship between these variables and test its hypothesis that preserving the existing built
environment is the most sustainable form of construction.
4. THE GREENDEAVOR CARBON CALCULATOR
The Greendeavor Carbon Calculator is an Excel workbook that calculates the carbon impacts of
two scenarios and selects the less carbon-intensive option. Given a set of inputs, it also calculates
the year of indifference, that is, the year at which the two options are equivalent.
This section describes the methodology used by Greendeavor to create the carbon calculator. It
then explains the three sections of the calculator and each set of decision components used
within the sections.
4.1 METHODOLOGY
Several reputable models exist on the Internet for calculating carbon emissions of a new
building. Greendeavor chose to evaluate these models and select one as the basis for the
Greendeavor Carbon Calculator. Because these models focus on the construction2 and operating
3
emissions of a new, green building, we decided to create two models—a Green Building model,
adapted from the selected existing tool, and a Preservation model, adapted, in turn, from
Greendeavor’s Green Building model. 2 Construction emissions account for all CO2 emissions related to construction activities, including: extraction and
processing of raw materials, transportation of materials, and construction of the building. 3 Operating emissions accrue from the ongoing operations and energy consumption of a building.
Team Greendeavor Carbon Calculator Reference Guide 05/06/10
5
The two calculators we used as guidance are www.greenfootstep.org/ and
www.buildcarbonneutral.org. We used these calculators to determine the important variables that
the models must consider. We also relied on the resources listed on these sites and an interview
with the Green Footstep administrator to understand and replicate the underlying data that drives
each section.
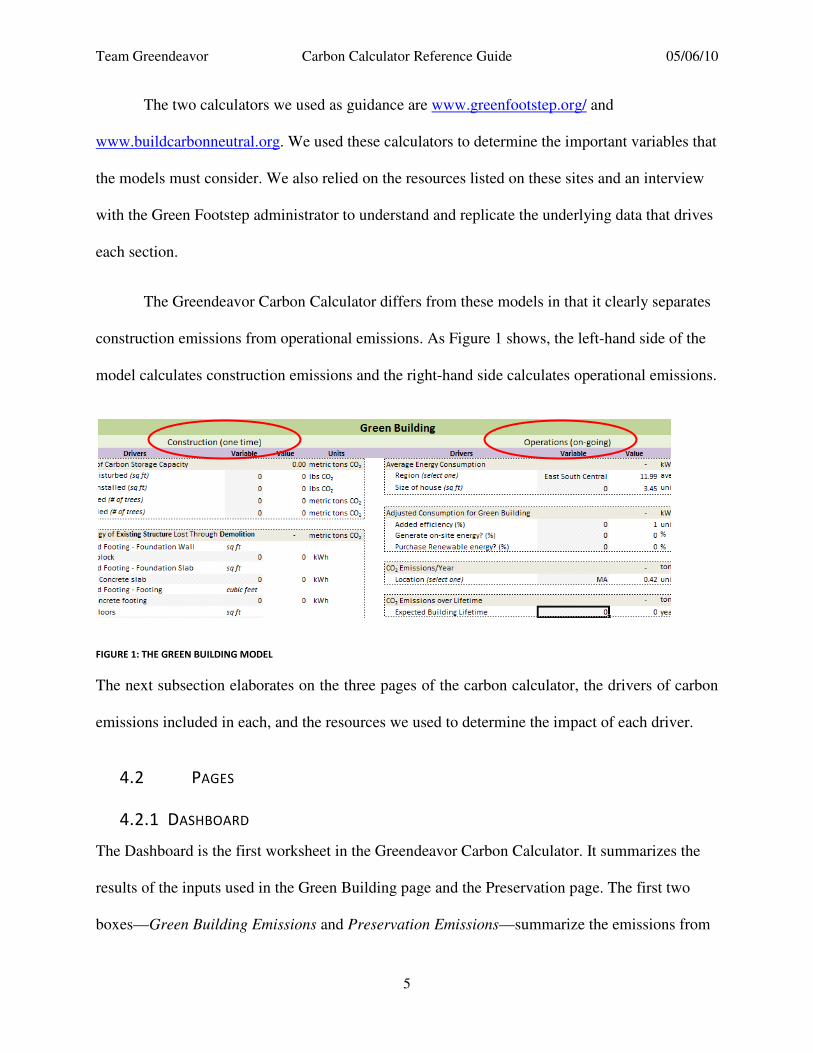
The Greendeavor Carbon Calculator differs from these models in that it clearly separates
construction emissions from operational emissions. As Figure 1 shows, the left-hand side of the
model calculates construction emissions and the right-hand side calculates operational emissions.
FIGURE 1: THE GREEN BUILDING MODEL
The next subsection elaborates on the three pages of the carbon calculator, the drivers of carbon
emissions included in each, and the resources we used to determine the impact of each driver.
4.2 PAGES
4.2.1 DASHBOARD
The Dashboard is the first worksheet in the Greendeavor Carbon Calculator. It summarizes the
results of the inputs used in the Green Building page and the Preservation page. The first two
boxes—Green Building Emissions and Preservation Emissions—summarize the emissions from
Team Greendeavor Carbon Calculator Reference Guide 05/06/10
6
each option. The summaries are divided into one time construction emissions (Total One Time
Emissions), annual operating emissions (Total Emissions/Year), and total emissions (Total
Emissions over Expected Lifetime). The total emissions are calculated as:
Total One Time Emissions + (Total Emissions/Year)*(Years in Expected Lifetime)
Each of these numbers is determined in the Green Building and Preservation models
respectively.
The Lower Emissions box chooses the lower of the two options and calculates the
difference between the Total Emissions over Expected Lifetime of each option. The default is
Preservation.
The Year of Indifference box calculates the Expected Lifetime value that results in
equivalent CO2 emissions for both options. The model assumes that the Green Building usually
has higher construction emissions and lower operating emissions than the Preservation. Thus, the
Year of Indifference is the year when the operating energy savings of a Green Building offsets its
higher construction emissions. The formula for the year of indifference is4:
(One Time (Green) – One Time (Preservation))
(Operating (Preservation) – Operating (Green))
The Year of Indifference will usually be a positive number. A negative number indicates that the
chosen option is more efficient during construction and operations, indicating that the two
options will never be equivalent. A value of zero indicates that the two options are equal over
the Expected Lifetime.
4 Appendix 1 shows the derivation of this equation.
Team Greendeavor Carbon Calculator Reference Guide 05/06/10
7
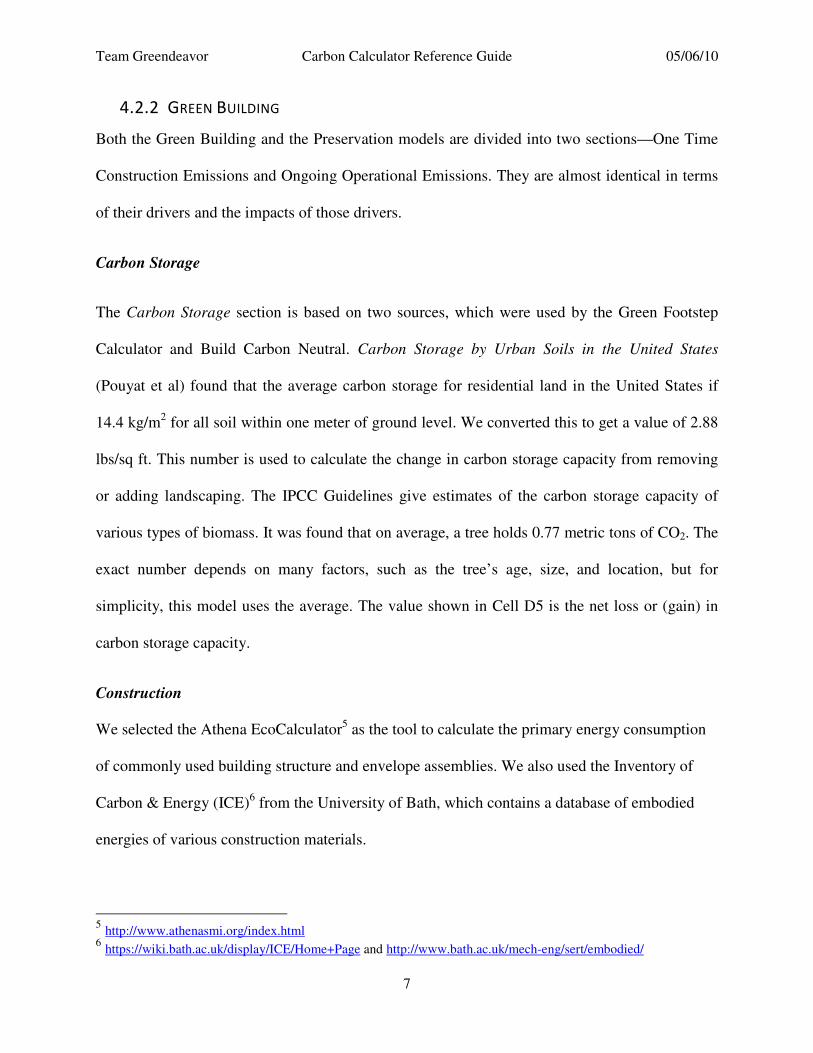
4.2.2 GREEN BUILDING
Both the Green Building and the Preservation models are divided into two sections—One Time
Construction Emissions and Ongoing Operational Emissions. They are almost identical in terms
of their drivers and the impacts of those drivers.
Carbon Storage
The Carbon Storage section is based on two sources, which were used by the Green Footstep
Calculator and Build Carbon Neutral. Carbon Storage by Urban Soils in the United States
(Pouyat et al) found that the average carbon storage for residential land in the United States if
14.4 kg/m2 for all soil within one meter of ground level. We converted this to get a value of 2.88
lbs/sq ft. This number is used to calculate the change in carbon storage capacity from removing
or adding landscaping. The IPCC Guidelines give estimates of the carbon storage capacity of
various types of biomass. It was found that on average, a tree holds 0.77 metric tons of CO2. The
exact number depends on many factors, such as the tree’s age, size, and location, but for
simplicity, this model uses the average. The value shown in Cell D5 is the net loss or (gain) in
carbon storage capacity.
Construction
We selected the Athena EcoCalculator5 as the tool to calculate the primary energy consumption
of commonly used building structure and envelope assemblies. We also used the Inventory of
Carbon & Energy (ICE)6 from the University of Bath, which contains a database of embodied
energies of various construction materials.
5 http://www.athenasmi.org/index.html
6 https://wiki.bath.ac.uk/display/ICE/Home+Page and http://www.bath.ac.uk/mech-eng/sert/embodied/
Team Greendeavor Carbon Calculator Reference Guide 05/06/10
8
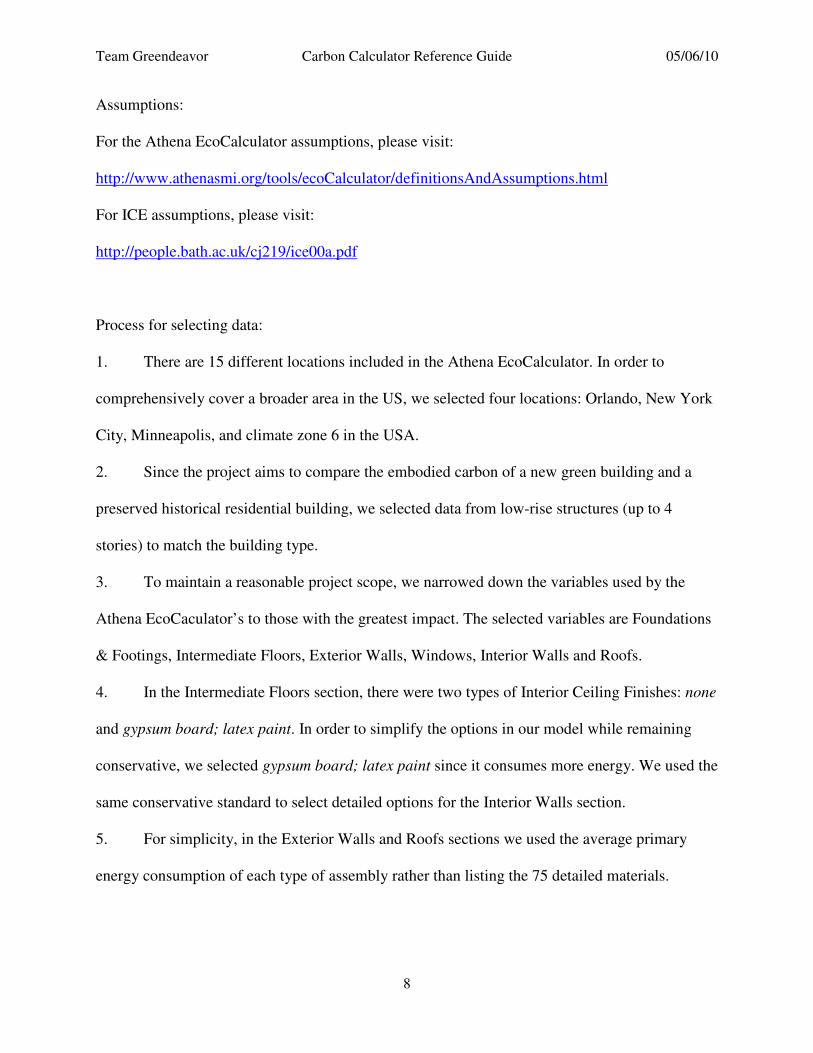
Assumptions:
For the Athena EcoCalculator assumptions, please visit:
http://www.athenasmi.org/tools/ecoCalculator/definitionsAndAssumptions.html
For ICE assumptions, please visit:
http://people.bath.ac.uk/cj219/ice00a.pdf
Process for selecting data:
1. There are 15 different locations included in the Athena EcoCalculator. In order to
comprehensively cover a broader area in the US, we selected four locations: Orlando, New York
City, Minneapolis, and climate zone 6 in the USA.
2. Since the project aims to compare the embodied carbon of a new green building and a
preserved historical residential building, we selected data from low-rise structures (up to 4
stories) to match the building type.
3. To maintain a reasonable project scope, we narrowed down the variables used by the
Athena EcoCaculator’s to those with the greatest impact. The selected variables are Foundations
& Footings, Intermediate Floors, Exterior Walls, Windows, Interior Walls and Roofs.
4. In the Intermediate Floors section, there were two types of Interior Ceiling Finishes: none
and gypsum board; latex paint. In order to simplify the options in our model while remaining
conservative, we selected gypsum board; latex paint since it consumes more energy. We used the
same conservative standard to select detailed options for the Interior Walls section.
5. For simplicity, in the Exterior Walls and Roofs sections we used the average primary
energy consumption of each type of assembly rather than listing the 75 detailed materials.

Team Greendeavor Carbon Calculator Reference Guide 05/06/10
9
6. We included an average option in each section for those instances where the user does
not know the materials used for construction.
7. The original Embodied Primary Energy is reported in Mega-Joules (MJ). We converted
the unit to kWh to standardize the units in our model.
Operations
To calculate the energy consumption involved with the ongoing operations of a home, we looked
at the U.S. Energy Information Administration Independent Statistics and Analysis for estimates.
Average Energy Consumption
We used the U.S. Energy Information Administration Independent Statistics and Analysis
2005 Residential Energy Consumption Survey7 to determine the average annual energy use per
home on a regional basis as well as a total square foot basis.
Region
This model incorporates a choice of Census regions and divisions to account for variations of
energy consumption based on the geographical location of the house.8
The U.S. states that correspond with each division are as follows:
• East North Central: Indiana, Illinois, Michigan, Ohio, Wisconsin
• East South Central: Alabama, Kentucky, Mississippi, Tennessee
• Middle Atlantic: New Jersey, New York, Pennsylvania
• Mountain: Arizona, Colorado, Idaho, New Mexico, Montana, Utah, Nevada, Wyoming
• New England: Connecticut, Maine, Massachusetts, New Hampshire, Rhode Island,
Vermont
• Pacific: Alaska, California, Hawaii, Oregon, Washington
7 http://www.eia.doe.gov/emeu/recs/recs2005/c&e/detailed_tables2005c&e.html, Table US1. Total Energy
Consumption, Expenditures, and Intensities, 2005, Part 1: Housing Unit Characteristics and Energy Usage Indicators
8 Source: US Census Bureau Regions and Divisions http://www.eia.doe.gov/emeu/recs/glossary.html

Team Greendeavor Carbon Calculator Reference Guide 05/06/10
10
• South Atlantic: Delaware, District of Columbia, Florida, Georgia, Maryland, North
Carolina, South Carolina, Virginia, West Virginia
• West North Central: Iowa, Kansas, Minnesota, Missouri, Nebraska, North Dakota, South
Dakota
• West South Central: Arkansas, Louisiana, Oklahoma, Texas
We converted the average energy consumption per square foot per year from thousand Btu to
kWh9:
X thousand Btu * (1,000 Btu/ 1 thousand Btu) * (1,055 joules/ 1 Btu) * (1 kWh/ 3,600,000 joules)
Size of house (sq ft): Unitless multiplier
This model takes into account the average energy consumption per sq ft per year based on the
overall U.S. average and on total floorspace of the building.
To determine this, a unitless multiplier was calculated as follows:
(avg energy consumption per sq ft for each range of floorspaces) / (U.S. total avg energy
consumption per sq ft)
For example, the multiplier for 400 sq ft home is calculated as follows:
U.S. average energy consumption per sq ft = 12.8 kWh
Average energy consumption per sq ft for a home smaller than 500 sq ft = 44.2 kWh
44.2 kWh /12.8 kWh = 3.45
This number is then calculated for each size house that falls within the range of 100 sq ft to 5,000
sq ft. The appropriate unitless multiplier is then multiplied by the regional average consumption
9 Source: http://www.eia.doe.gov/emeu/recs/glossary.html

Team Greendeavor Carbon Calculator Reference Guide 05/06/10
11
per sq ft and the number of sq ft of the house. Following on the example above, if the house is
located in the East South Central Region, where average energy consumption is 11.99 kWh per
sq ft per year, the total energy consumption for the year would be:
11.99 kWh/sq ft/year * 400 sq ft * 3.45 = 16,546 kWh per year
Adjusted Consumption for Green Building
Added efficiency (%)
The model will adjust the average energy consumption from 0% to 50% in increments of 5% to
account for the added energy efficiency a new green building would have.
Generate on-site energy? (%)
The model will adjust the average energy consumption to account for the percentage of energy
that is generated on-site.
Purchase Renewable energy? (%)
The model will adjust the average energy consumption to account for the percentage of
renewable energy that is purchased.
CO2 Emissions/Year: Location
The model translates the average energy consumption total into CO2 emissions based on the
carbon coefficient10
that is determined by U.S. state.
Expected Building Lifetime and CO2 Emissions Over Lifetime
The model allows the comparison of CO2 emissions based on the expected building lifetime.
10
Source: Rocky Mountain Institute’s Green Footstep, http://www.greenfootstep.org/

Team Greendeavor Carbon Calculator Reference Guide 05/06/10
12
4.2.3 PRESERVATION
The Preservation model is designed to mirror the Green Building model except for the following
differences.
Retrofit
This model observes the carbon emissions of retrofitting an existing building.
Removal of Materials from Existing Structures Emissions
Any materials removed during a retrofit release the embodied energy of the existing structure.
Emissions from Retrofits
This model takes into account any emissions that are created due to the addition of new materials
from the retrofit.
Operations
Adjusted Consumption for Old Building: Decreased Efficiency vs. Added Efficiency
This model takes into account that an existing building may either have a percentage of
decreased efficiency or added efficiency in comparison to the average energy consumption.
Please select one or the other, but not both.
5. APPLICATION OF THE CARBON CALCULATOR: THE ANNA CLAPP HARRIS
SMITH HOUSE
We ran the model using figures from the planned preservation of the Anna Clapp Harris Smith
house at 65 Pleasant Street, Dorchester, MA and from alternate plans for a new building of equal
size. Figure 2 shows the dashboard for the test run. In this case, it would take 82 years before the
savings in operational emissions of the green building would compensate for its higher
construction emissions. If the house will likely be used for more than 82 years, the green
building may be the more sustainable option.

Team Greendeavor Carbon Calculator Reference Guide 05/06/10
13
FIGURE 2: DASHBOARD FOR THE ANNA CLAPP HARRIS SMITH HOUSE
6. RECOMMENDATIONS FOR FUTURE IMPROVEMENTS TO THE CARBON
CALCULATOR
The Greendeavor Carbon Calculator considers a range of drivers of carbon emissions from both
the construction and operations side, but there are more we suggest should be explored further to
make this calculator more comprehensive.
- Different types of vegetation such as grasslands and wetlands store different amounts of
carbon. The model takes an average of residential soil, but would be more robust if it
included options for other types of vegetation.
- The model only considers residential buildings, but it could be expanded to look at other
types of buildings as well.
- The embodied energy numbers are averages of several locations. The Athena
EcoCalculator has specific numbers for over 10 locations. These options could be built
into the model. Also, we only selected the materials with the highest average impact, but
the model could be expanded to include other building materials.

Team Greendeavor Carbon Calculator Reference Guide 05/06/10
14
- Transportation is considered part of the embodied energy of the buildings, but might be
disaggregated to give a more accurate number. Also, it is not necessarily accurate to
assume that the materials in a 200 year old home have the same embodied energy as they
would in a 20 year old home, because they probably did not travel as far and they were
probably processed differently. This could be explored further.
- The model does not take into account the consumption of other resources such as water,
or the generation of solid or hazardous waste. The inclusion of such factors could greatly
affect the results of the model.
- The model also does not account for the social and cultural benefits of maintaining
historic structures, which should not be hastily discounted.
- This model does not account for the monetary costs involved in making construction or
operating decisions. The model can be used to compare the carbon emissions of alternate
retrofits to an existing building (or features on a new construction) by running the model
with each scenario, saving separate copies of the file and comparing the results. This
would allow the organization to choose the alternatives that bring the highest return on its
investment (in terms of CO2 reduction per dollar spent). Perhaps a future version of the
model could make this process more streamlined.
7. RESOURCES
Athena EcoCalculator http://www.athenasmi.org/index.html
http://www.athenasmi.org/tools/ecoCalculator/definitionsAndAssumptions.html
Rocky Mountain Institute’s Green Footstep
http://www.greenfootstep.org/
Build Carbon Neutral
http://www.buildcarbonneutral.org

Team Greendeavor Carbon Calculator Reference Guide 05/06/10
15
Inventory of Carbon & Energy (ICE) from the University of Bath
Database of embodied energies of various construction materials https://wiki.bath.ac.uk/display/ICE/Home+Page
http://www.bath.ac.uk/mech-eng/sert/embodied/ http://people.bath.ac.uk/cj219/ice00a.pdf
2005 Residential Energy Consumption Survey
http://www.eia.doe.gov/emeu/recs/recs2005/c&e/detailed_tables2005c&e.html
http://www.eia.doe.gov/emeu/recs/glossary.html
Team Greendeavor Carbon Calculator Reference Guide 05/06/10
16
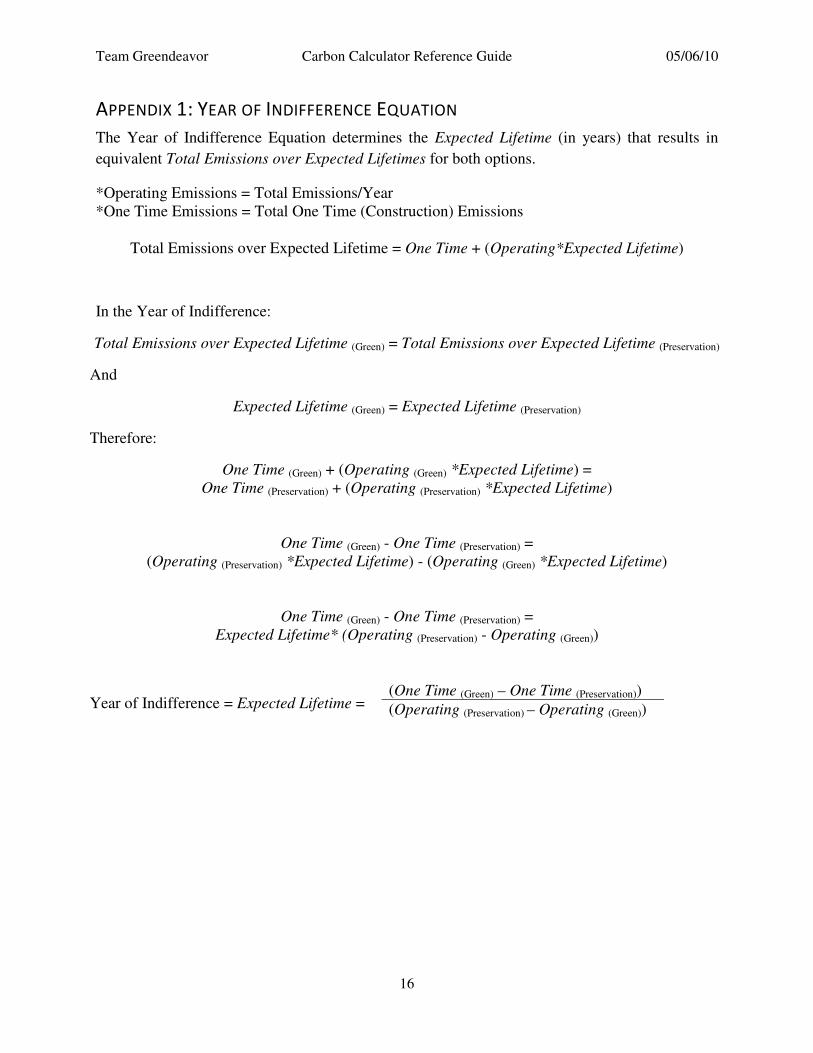
APPENDIX 1: YEAR OF INDIFFERENCE EQUATION
The Year of Indifference Equation determines the Expected Lifetime (in years) that results in
equivalent Total Emissions over Expected Lifetimes for both options.
*Operating Emissions = Total Emissions/Year
*One Time Emissions = Total One Time (Construction) Emissions
Total Emissions over Expected Lifetime = One Time + (Operating*Expected Lifetime)
In the Year of Indifference:
Total Emissions over Expected Lifetime (Green) = Total Emissions over Expected Lifetime (Preservation)
And
Expected Lifetime (Green) = Expected Lifetime (Preservation)
Therefore:
One Time (Green) + (Operating (Green) *Expected Lifetime) =
One Time (Preservation) + (Operating (Preservation) *Expected Lifetime)
One Time (Green) - One Time (Preservation) =
(Operating (Preservation) *Expected Lifetime) - (Operating (Green) *Expected Lifetime)
One Time (Green) - One Time (Preservation) =
Expected Lifetime* (Operating (Preservation) - Operating (Green))
Year of Indifference = Expected Lifetime =
(One Time (Green) – One Time (Preservation))
(Operating (Preservation) – Operating (Green))
Team Greendeavor Carbon Calculator Reference Guide 05/06/10
17
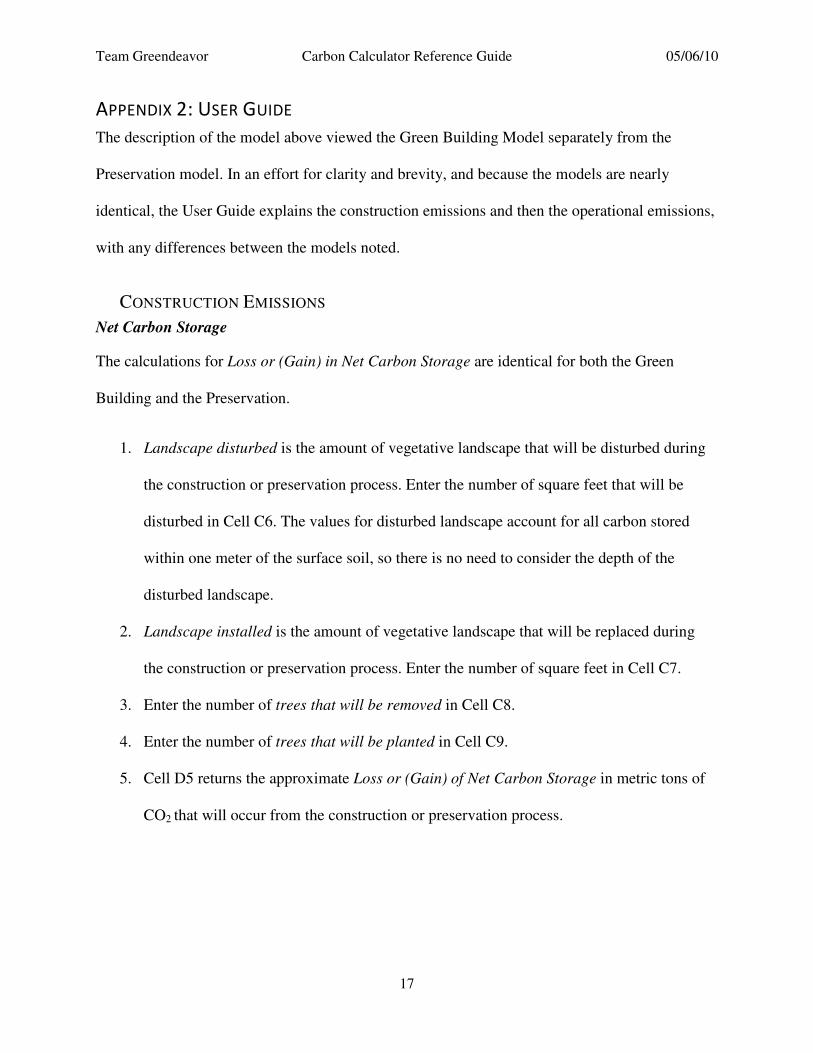
APPENDIX 2: USER GUIDE
The description of the model above viewed the Green Building Model separately from the
Preservation model. In an effort for clarity and brevity, and because the models are nearly
identical, the User Guide explains the construction emissions and then the operational emissions,
with any differences between the models noted.
CONSTRUCTION EMISSIONS
Net Carbon Storage
The calculations for Loss or (Gain) in Net Carbon Storage are identical for both the Green
Building and the Preservation.
1. Landscape disturbed is the amount of vegetative landscape that will be disturbed during
the construction or preservation process. Enter the number of square feet that will be
disturbed in Cell C6. The values for disturbed landscape account for all carbon stored
within one meter of the surface soil, so there is no need to consider the depth of the
disturbed landscape.
2. Landscape installed is the amount of vegetative landscape that will be replaced during
the construction or preservation process. Enter the number of square feet in Cell C7.
3. Enter the number of trees that will be removed in Cell C8.
4. Enter the number of trees that will be planted in Cell C9.
5. Cell D5 returns the approximate Loss or (Gain) of Net Carbon Storage in metric tons of
CO2 that will occur from the construction or preservation process.

Team Greendeavor Carbon Calculator Reference Guide 05/06/10
18
FIGURE 3: A POSITIVE NUMBER INDICATES A DECREASE IN CARBON STORAGE CAPACITY.
Embodied Energy of Existing Structure Lost Through Demolition, Construction of Green
Building, Removal of Materials from Existing Structure Emissions, and Emissions from
Retrofits
The remaining two sections on the construction emissions side of each model (Embodied Energy
of Existing Structure Lost through Demolition and Construction of Green Building for the Green
Building; Removal of Materials from Existing Structure Emissions and Emissions from Retrofits
for the Preservation) are identical.
These sections aim to calculate the embodied energy of the structure(s).
1. For each Driver, select the material applied to the house in the dropdown box. Then enter the
total square feet or lbs for each material. For example, to enter 100 square feet of concrete
block, under Foundation and Footing – Foundation Wall select Concrete block from the
dropdown menu:
FIGURE 4: FOUNDATION AND FOOTING DROP DOWN MENU
Then enter in 100 in the box labeled “sq ft.”
Team Greendeavor Carbon Calculator Reference Guide 05/06/10
19
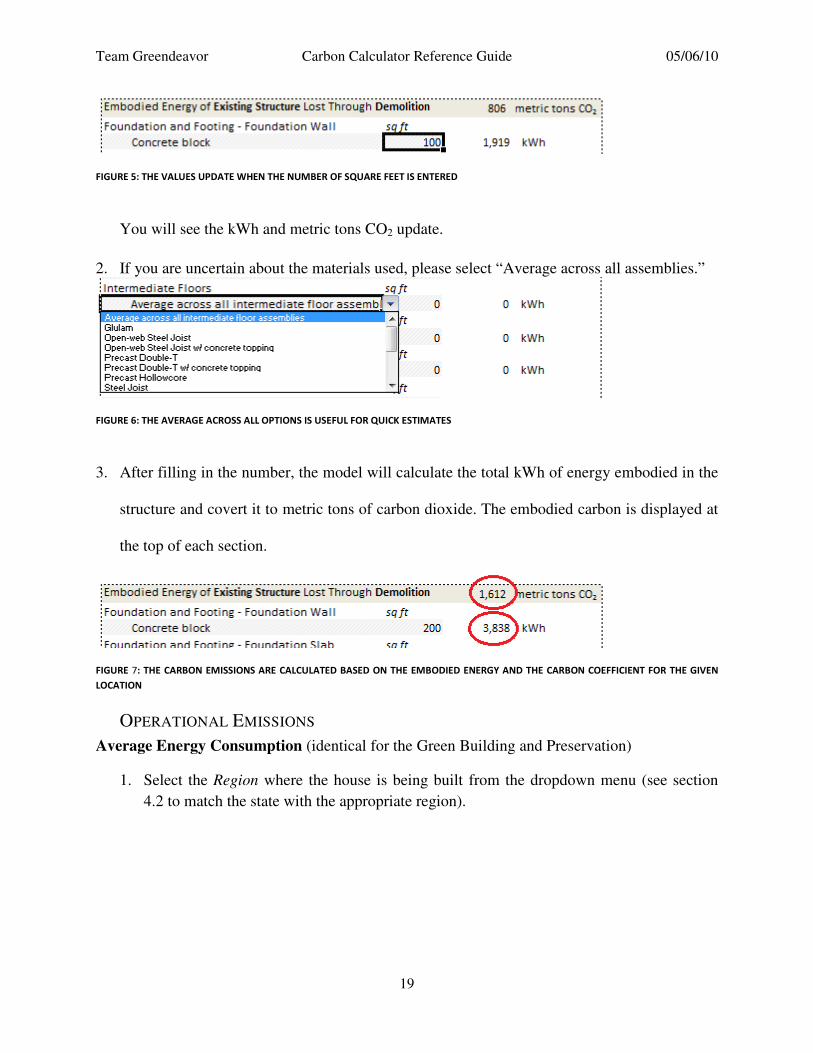
FIGURE 5: THE VALUES UPDATE WHEN THE NUMBER OF SQUARE FEET IS ENTERED
You will see the kWh and metric tons CO2 update.
2. If you are uncertain about the materials used, please select “Average across all assemblies.”
FIGURE 6: THE AVERAGE ACROSS ALL OPTIONS IS USEFUL FOR QUICK ESTIMATES
3. After filling in the number, the model will calculate the total kWh of energy embodied in the
structure and covert it to metric tons of carbon dioxide. The embodied carbon is displayed at
the top of each section.
FIGURE 7: THE CARBON EMISSIONS ARE CALCULATED BASED ON THE EMBODIED ENERGY AND THE CARBON COEFFICIENT FOR THE GIVEN
LOCATION
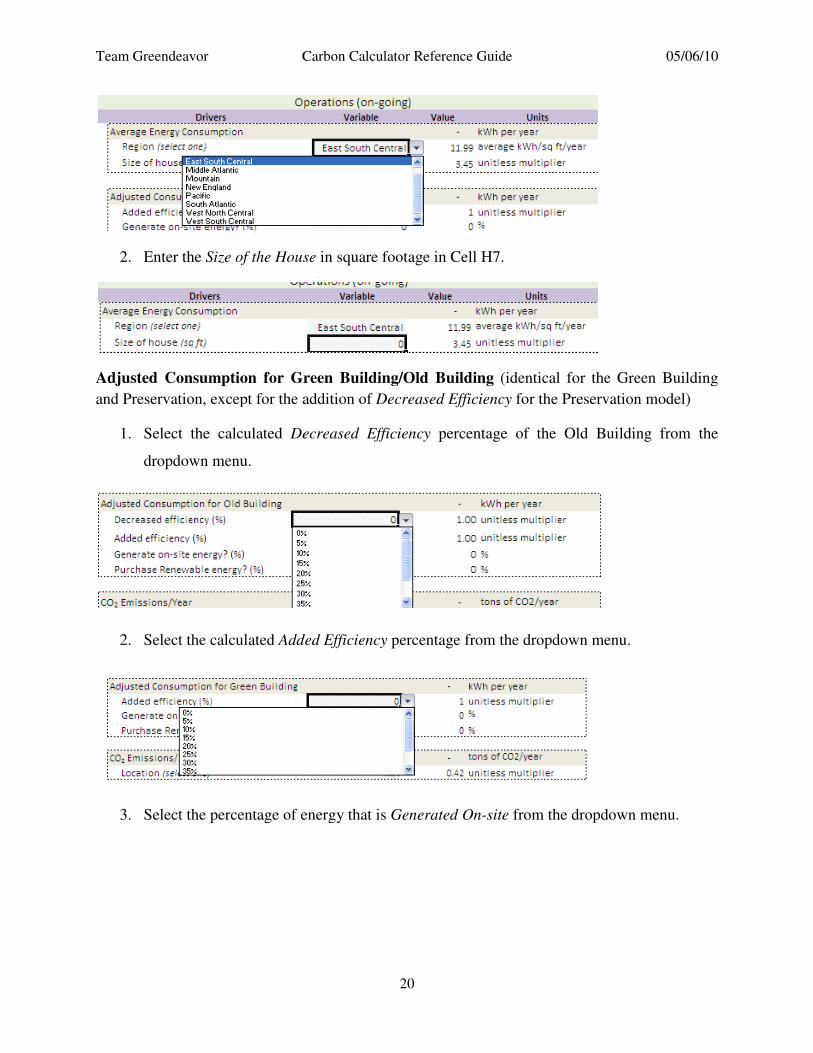
OPERATIONAL EMISSIONS
Average Energy Consumption (identical for the Green Building and Preservation)
1. Select the Region where the house is being built from the dropdown menu (see section
4.2 to match the state with the appropriate region).
Team Greendeavor Carbon Calculator Reference Guide
2. Enter the Size of the House
Adjusted Consumption for Green Building/
and Preservation, except for the addition of
1. Select the calculated Decreased
dropdown menu.
2. Select the calculated Added
3. Select the percentage of energy that is
Carbon Calculator Reference Guide
20
Size of the House in square footage in Cell H7.
Green Building/Old Building (identical for the Green Building
and Preservation, except for the addition of Decreased Efficiency for the Preservation model)
Decreased Efficiency percentage of the Old Building from the
Added Efficiency percentage from the dropdown menu
Select the percentage of energy that is Generated On-site from the dropdown
05/06/10
(identical for the Green Building
for the Preservation model)
percentage of the Old Building from the
menu.
from the dropdown menu.
Team Greendeavor Carbon Calculator Reference Guide
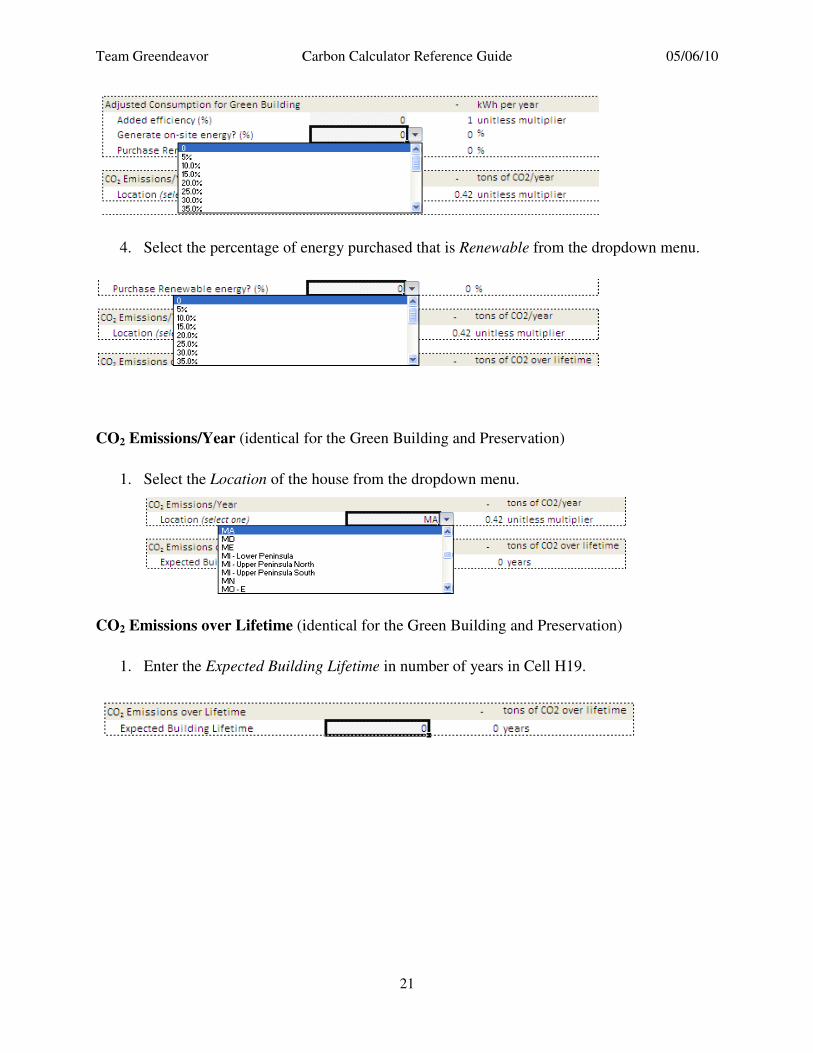
4. Select the percentage of energy purchased that is
CO2 Emissions/Year (identical for the Green Building and Preservation)
1. Select the Location of the house from the dropdown menu.
CO2 Emissions over Lifetime (identical for the Green Building and Preservation)
1. Enter the Expected Building Lifetime
Carbon Calculator Reference Guide
21
Select the percentage of energy purchased that is Renewable from the dropdown menu.
(identical for the Green Building and Preservation)
of the house from the dropdown menu.
(identical for the Green Building and Preservation)
Expected Building Lifetime in number of years in Cell H19.
05/06/10
from the dropdown menu.
(identical for the Green Building and Preservation)

Team Greendeavor Carbon Calculator Reference Guide 05/06/10
22
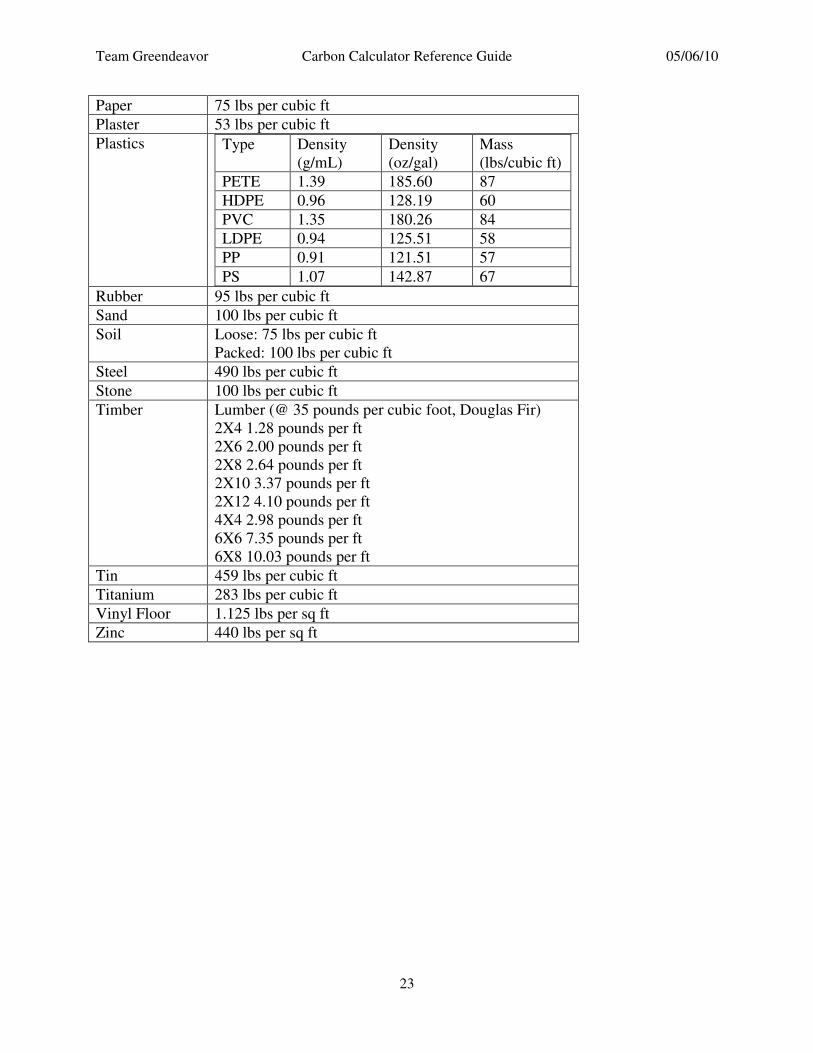
APPENDIX 3: MATERIAL WEIGHTS
The following table shows the conversions used to translate the miscellaneous items in the model
from square or cubic feet to pounds, which are then converted into kWh.11
.
Material Weight
Aluminum 171 lbs per cubic ft
Asphalt 45 lbs per cubic ft
Bitumen 62.43 lbs per cubic ft
Brass 534 lbs per cubic ft
Bronze 508 lbs per cubic ft
Carpet 6 lbs per sq ft
Cement 94 lbs per cubic ft
Ceramics 3 lbs per sq ft
Clay/Bricks 4” brick: 42 lbs per sq ft
8” block: 55 lbs per sq ft
12: block: 80 lbs per sq ft
Concrete 150 lbs per cubic ft
Copper 542 lbs per cubic ft
Glass Thickness:
1/16”: 0.97 lbs per sq ft
1/8”: 1.6 lbs per sq ft
1/4”: 3.23 lbs per sq ft
1/2:”: 6.37 lbs per sq ft
Insulation Mineral fiber (fiberglass): 2 lbs per cubic ft
Extruded polystyrene: 1.8 lbs per cubic ft
Expanded polystyrene: 1.5 lbs per cubic ft
Polyurethane: 1.5 lbs per cubic ft
Vermiculite: 40 lbs per cubic ft
Iron 485 lbs per cubic ft
Lead 708 lbs per cubic ft
Lime Quick: 53-75 lbs per cubic ft
Stone: 96-168 lbs per cubic ft
Hydrated: 30 lbs per cubic ft
Linoleum 1.5 lbs per sq ft
Paint 10 lbs per gallon; 1 gallon covers 350 sq ft
~0.3 lbs/sq ft
11
http://www.abe.psu.edu/extension/factsheets/h/H20.pdf
http://www.desertbreezeglass.com/Calculate-the-Weight-for-Glass.html
http://www.reade.com/Particle_Briefings/spec_gra2.html
http://www.demolitionforum.com/material-weights.php
http://www.paintcenter.org/rj/sep06d.cfm
http://www.americanchemistry.com/s_plastics/hands_on_plastics2/activities/pdfs/day4.pdf
http://www.engineeringtoolbox.com/earth-soil-weight-d_1349.html
Team Greendeavor Carbon Calculator Reference Guide 05/06/10
23
Paper 75 lbs per cubic ft
Plaster 53 lbs per cubic ft
Plastics Type Density
(g/mL)
Density
(oz/gal)
Mass
(lbs/cubic ft)
PETE 1.39 185.60 87
HDPE 0.96 128.19 60
PVC 1.35 180.26 84
LDPE 0.94 125.51 58
PP 0.91 121.51 57
PS 1.07 142.87 67
Rubber 95 lbs per cubic ft
Sand 100 lbs per cubic ft
Soil Loose: 75 lbs per cubic ft
Packed: 100 lbs per cubic ft
Steel 490 lbs per cubic ft
Stone 100 lbs per cubic ft
Timber Lumber (@ 35 pounds per cubic foot, Douglas Fir)
2X4 1.28 pounds per ft
2X6 2.00 pounds per ft
2X8 2.64 pounds per ft
2X10 3.37 pounds per ft
2X12 4.10 pounds per ft
4X4 2.98 pounds per ft
6X6 7.35 pounds per ft
6X8 10.03 pounds per ft
Tin 459 lbs per cubic ft
Titanium 283 lbs per cubic ft
Vinyl Floor 1.125 lbs per sq ft
Zinc 440 lbs per sq ft