greenhouse gas emissions for battery electric and fuel ... · battery electric vehicle (bev) ghg...
TRANSCRIPT

©Fraunhofer ISE/Foto: Guido Kirsch
© Fraunhofer ISE FHG-SK: ISE-PUBLIC
GREENHOUSE GAS EMISSIONS FOR BATTERY ELECTRIC AND FUEL CELL ELECTRIC VEHICLES WITH RANGES OVER 300 KILOMETERS
André Sternberg, Christoph Hank und Christopher Hebling
Fraunhofer Institute for Solar Energy Systems ISE
Freiburg, Germany, 13.07.2019
www.ise.fraunhofer.de
Study commissioned by H2 Mobility
© Fraunhofer ISE
2
FHG-SK: ISE-PUBLIC
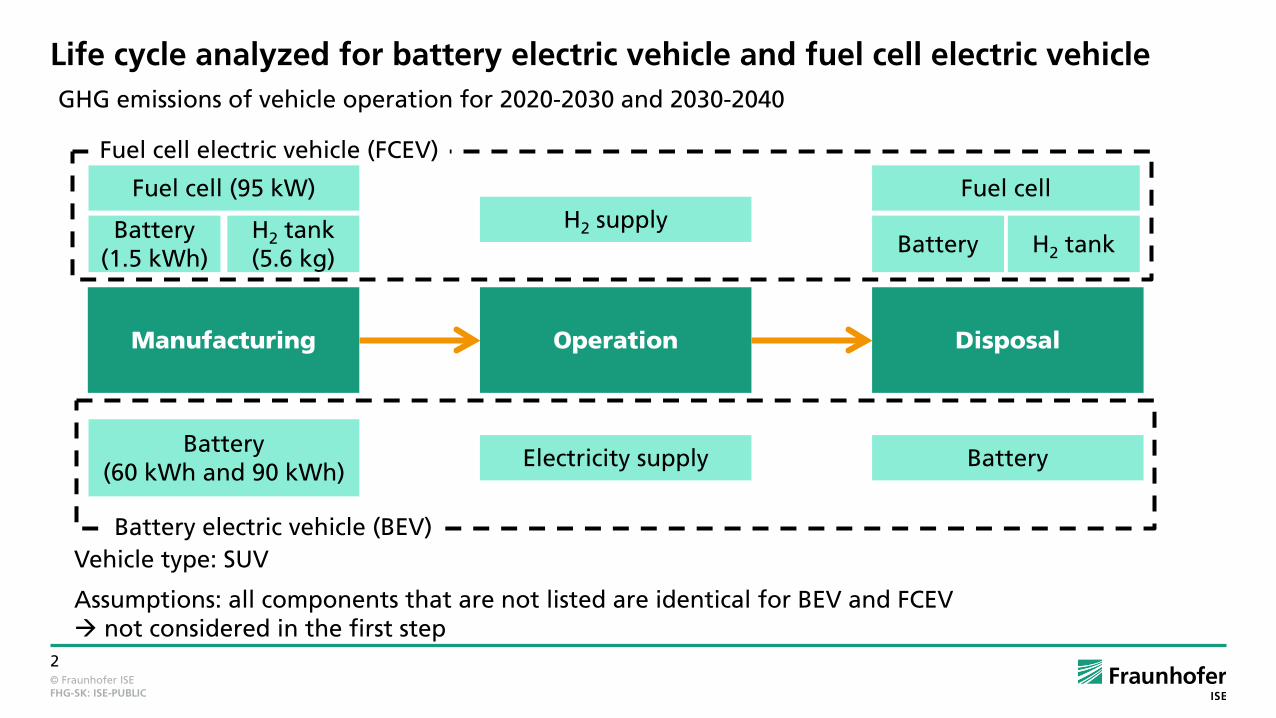
Life cycle analyzed for battery electric vehicle and fuel cell electric vehicle
Manufacturing Operation Disposal
Battery (60 kWh and 90 kWh)
H2 tank (5.6 kg)
Battery (1.5 kWh)
H2 supply
Electricity supply
Fuel cell
H2 tank Battery
Battery
Fuel cell electric vehicle (FCEV)
Battery electric vehicle (BEV)
GHG emissions of vehicle operation for 2020-2030 and 2030-2040
Fuel cell (95 kW)
Vehicle type: SUV
Assumptions: all components that are not listed are identical for BEV and FCEV not considered in the first step
© Fraunhofer ISE
3
FHG-SK: ISE-PUBLIC
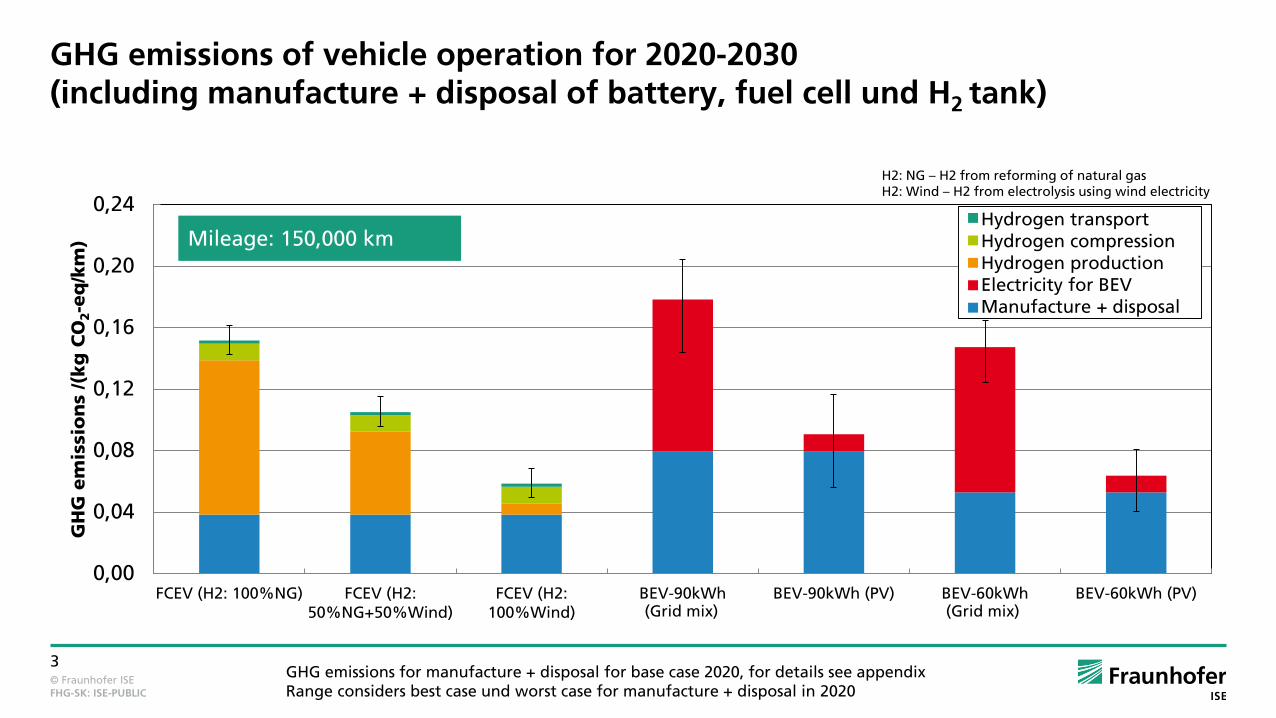
GHG emissions of vehicle operation for 2020-2030 (including manufacture + disposal of battery, fuel cell und H2 tank)
0,00
0,04
0,08
0,12
0,16
0,20
0,24
FCEV (H2: 100%NG) FCEV (H2:50%NG+50%Wind)
FCEV (H2:100%Wind)
BEV-90kWh(Strommix)
BEV-90kWh (PV) BEV-60kWh(Strommix)
BEV-60kWh (PV)
GH
G e
mis
sio
ns
/(kg
CO
2-e
q/k
m)
WasserstofftransportWasserstoffverdichtungWasserstoffherstellungStrom - BEVHerstellung+Entsorgung
GHG emissions for manufacture + disposal for base case 2020, for details see appendix Range considers best case und worst case for manufacture + disposal in 2020
Mileage: 150,000 km
H2: NG – H2 from reforming of natural gas H2: Wind – H2 from electrolysis using wind electricity
Hydrogen transport Hydrogen compression Hydrogen production Electricity for BEV Manufacture + disposal
(Grid mix) (Grid mix)
© Fraunhofer ISE
4
FHG-SK: ISE-PUBLIC
0
5.000
10.000
15.000
20.000
25.000
30.000
35.000
0 20.000 40.000 60.000 80.000 100.000 120.000 140.000 160.000 180.000 200.000
GH
G e
mis
sio
ns
/ kg
CO
2-e
q
Mileage / km
FCEV (H2: 100%NG)FCEV (H2: 50%NG+50%Wind)FCEV (H2: 100%Wind)BEV-90kWh (Strommix)BEV-90kWh (PV)BEV-60kWh (Strommix)BEV-60kWh (PV)
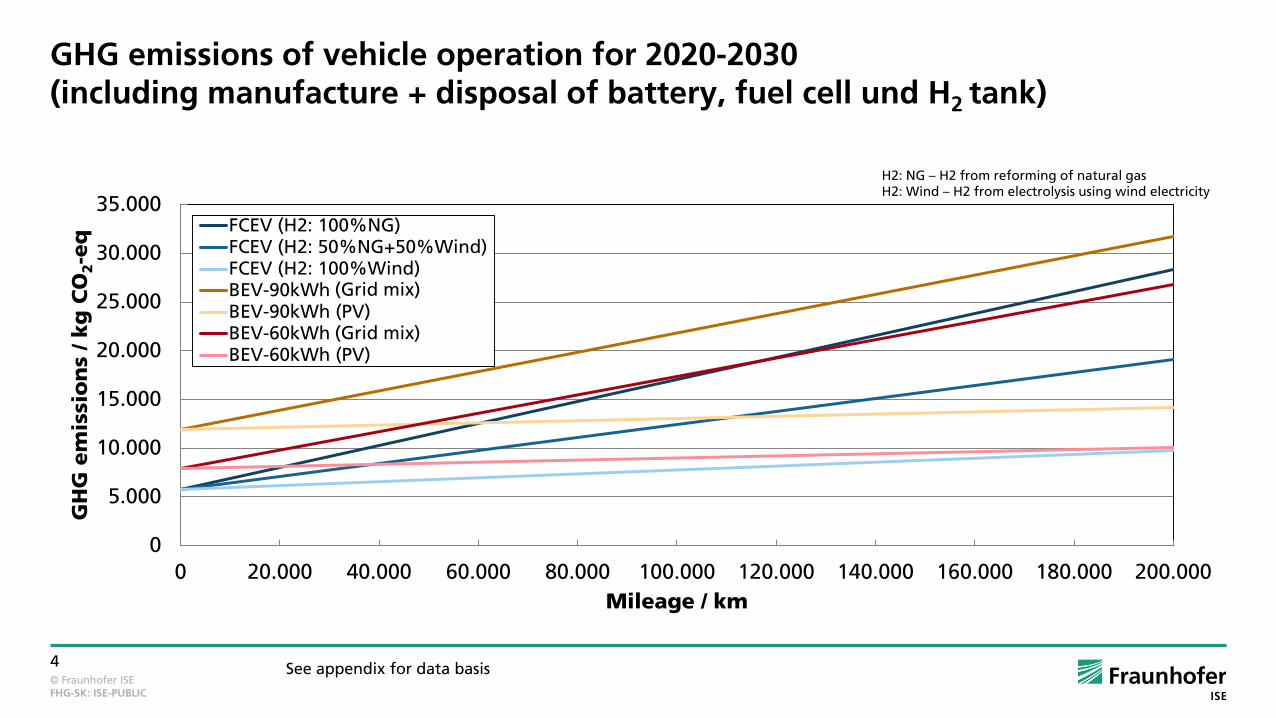
GHG emissions of vehicle operation for 2020-2030 (including manufacture + disposal of battery, fuel cell und H2 tank)
See appendix for data basis
H2: NG – H2 from reforming of natural gas H2: Wind – H2 from electrolysis using wind electricity
(Grid mix)
(Grid mix)

© Fraunhofer ISE
5
FHG-SK: ISE-PUBLIC
GHG emissions of vehicle operation for 2030-2040 (including manufacture + disposal of battery, fuel cell und H2 tank)
0,00
0,04
0,08
0,12
0,16
0,20
0,24
FCEV (H2: 100%NG) FCEV (H2:50%NG+50%Wind)
FCEV (H2:100%Wind)
BEV-90kWh(Strommix)
BEV-90kWh (PV) BEV-60kWh(Strommix)
BEV-60kWh (PV)
GH
G e
mis
sio
ns
/(kg
CO
2-e
q/k
m)
WasserstofftransportWasserstoffverdichtungWasserstoffherstellungStrom - BEVHerstellung+Entsorgung
Mileage: 150,000 km
H2: NG – H2 from reforming of natural gas H2: Wind – H2 from electrolysis using wind electricity
GHG emissions for manufacture+disposal for base case 2030, for details see appendix Range considers best case und worst case for manufacture+disposal in 2030
Hydrogen transport Hydrogen compression Hydrogen production Electricity for BEV Manufacture + disposal
(Grid mix) (Grid mix)

© Fraunhofer ISE
6
FHG-SK: ISE-PUBLIC
GHG emissions of vehicle operation for 2030-2040 (including manufacture + disposal of battery, fuel cell und H2 tank)
0
5.000
10.000
15.000
20.000
25.000
30.000
35.000
0 20.000 40.000 60.000 80.000 100.000 120.000 140.000 160.000 180.000 200.000
GH
G e
mis
sio
ns
/ kg
CO
2-e
q
Mileage / km
FCEV (H2: 100%NG)FCEV (H2: 50%NG+50%Wind)FCEV (H2: 100%Wind)BEV-90kWh (Strommix)BEV-90kWh (PV)BEV-60kWh (Strommix)BEV-60kWh (PV)
H2: NG – H2 from reforming of natural gas H2: Wind – H2 from electrolysis using wind electricity
See appendix for data basis
(Grid mix)
(Grid mix)

© Fraunhofer ISE
7
FHG-SK: ISE-PUBLIC
Comparison with diesel vehicle (100% fossil fuel)
Manufacturing Operation Disposal
Battery
Fuel cell
H2 tank Battery H2 supply
Electricity supply
Fuel cell
H2 tank Battery
Battery
Fuel cell electric vehicle (FCEV)
Battery electric vehicle (BEV)
Time horizon: vehicle operation for 2020-2030
Glider Diesel supply
Diesel vehicle
Drive Glider Drive
Glider Drive Glider Drive
Glider Drive Glider Drive
Glider and drive (e.g. electric and combustion engine) based on Agora Verkehrswende (2019) - GHG emissions for manufacturing and disposal scaled by vehicle mass

© Fraunhofer ISE
8
FHG-SK: ISE-PUBLIC
GHG emissions of vehicle operation for 2020-2030 Comparison with diesel vehicle (100% fossil fuel)
0,00
0,05
0,10
0,15
0,20
0,25
0,30
FCEV (H2: 100%NG) FCEV (H2:50%NG+50%Wind)
FCEV (H2: 100%Wind) BEV-90kWh (Strommix) BEV-90kWh (PV) Diesel
GH
G e
mis
sio
ns
/ (kg
CO
2-e
q/k
m)
Dieselverbrennung
Wasserstofftransport
Wasserstoffverdichtung
Wasserstoffherstellung
Strom - BEV
Herstellung+Entsorgung
Mileage: 150,000 km
Glider and drive taken additionally into account, compared to slide 3.
See appendix for data basis
Diesel combustion also includes GHG emissions for diesel supply
H2: NG – H2 from reforming of natural gas H2: Wind – H2 from electrolysis using wind electricity
(Grid mix)
Diesel combustion
Hydrogen transport
Hydrogen compression
Hydrogen production
Electricity for BEV
Manufacture + disposal

© Fraunhofer ISE
9
FHG-SK: ISE-PUBLIC
GHG emissions of vehicle operation for 2020-2030 Comparison with diesel vehicle (100% fossil fuel)
0
5.000
10.000
15.000
20.000
25.000
30.000
35.000
40.000
45.000
50.000
0 20.000 40.000 60.000 80.000 100.000 120.000 140.000 160.000 180.000 200.000
GH
G e
mis
sio
ns
/ kg
CO
2-e
q
Mileage / km
FCEV (H2: 100%NG)FCEV (H2: 50%NG+50%Wind)FCEV (H2: 100%Wind)BEV-90kWh (Strommix)BEV-90kWh (PV)Diesel
H2: NG – H2 from reforming of natural gas H2: Wind – H2 from electrolysis using wind electricity
Glider and drive taken additionally into account, compared to slide 4.
See appendix for data basis
(Grid mix)

© Fraunhofer ISE
10
FHG-SK: ISE-PUBLIC
Conclusions Manufacturing:
Greenhouse gas (GHG) emissions of fuel cell electric vehicles are lower than for considered battery electric vehicles (60 kWh and 90 kWh battery capacity)
Crucial factors for battery electric vehicles: Cell production and GHG footprint for electricity
Crucial factors for fuel cell electric vehicles: Platinum und H2 tank
Entire life cycle:
Time horizon 2020-2030: lower GHG emissions for fuel cell electric vehicle
Higher efficiency of battery electric vehicle cannot offset higher GHG emissions during manufacturing phase
Hydrogen supply generated with wind power Path with lowest GHG emissions
Time horizon 2030-2040
For similar ranges, fuel cell electric vehicles have lower GHG emissions than battery electric vehicles if both vehicles use renewable electricity
Battery electric vehicles with lower battery capacity / range (about < 50 kWh/250 km) have lower GHG emissions than fuel cell electric vehicles

© Fraunhofer ISE
11
FHG-SK: ISE-PUBLIC
Limitations
Future improvements in manufacturing process for materials (e.g., platinum and aluminum) were not considered
Future hydrogen tank concepts could not be considered
Besides GHG emissions also other environmental impact categories should be analyzed (e.g., land used and water consumption)
GHG emissions for construction of mobility infrastructure were not considered (e.g., charging infrastructure and hydrogen distribution)
Interactions with energy system need to be analyzed in more detail
Analysis of further renewable propulsion concepts required (e.g., hybrid vehicles, combustion engines with synthetic fuels)
Second life is not considered for battery and fuel cell
No GHG credit for materials after disposal
© Fraunhofer ISE
12
FHG-SK: ISE-PUBLIC
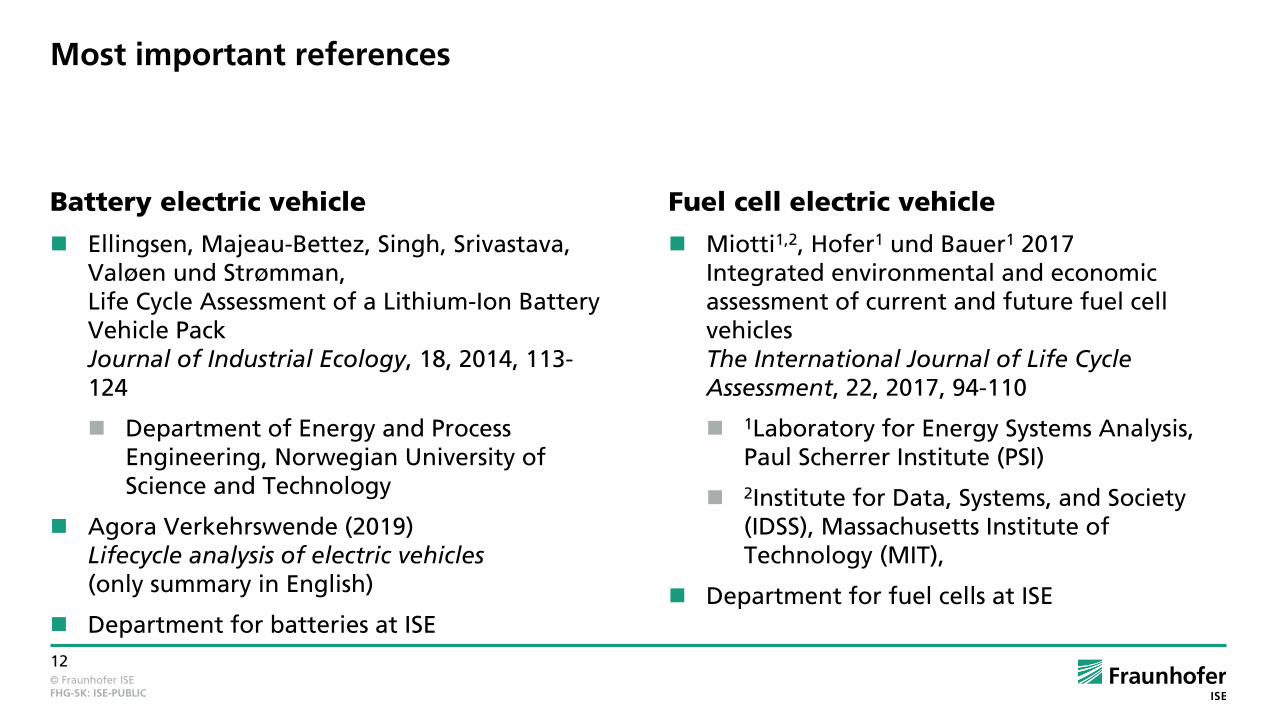
Most important references
Battery electric vehicle
Ellingsen, Majeau-Bettez, Singh, Srivastava, Valøen und Strømman, Life Cycle Assessment of a Lithium-Ion Battery Vehicle Pack Journal of Industrial Ecology, 18, 2014, 113-124
Department of Energy and Process Engineering, Norwegian University of Science and Technology
Agora Verkehrswende (2019) Lifecycle analysis of electric vehicles (only summary in English)
Department for batteries at ISE
Fuel cell electric vehicle
Miotti1,2, Hofer1 und Bauer1 2017 Integrated environmental and economic assessment of current and future fuel cell vehicles The International Journal of Life Cycle Assessment, 22, 2017, 94-110
1Laboratory for Energy Systems Analysis, Paul Scherrer Institute (PSI)
2Institute for Data, Systems, and Society (IDSS), Massachusetts Institute of Technology (MIT),
Department for fuel cells at ISE

© Fraunhofer ISE
13
FHG-SK: ISE-PUBLIC
Thank you for your Attention!
Fraunhofer Institute for Solar Energy Systems ISE
André Sternberg
www.ise.fraunhofer.de
© Fraunhofer ISE
14
FHG-SK: ISE-PUBLIC
APPENDIX
Assumptions for vehicle operation
Comparison for manufacturing of battery electric vehicles and fuel cell electric vehicles
Details for manufacturing of batteries
Details for manufacturing of fuel cells
Details for manufacturing of hydrogen tank
References for scenarios considered

© Fraunhofer ISE
15
FHG-SK: ISE-PUBLIC
Vehicle operation – assumptions Fuel cell electric vehicle (FCEV) based on Hyundai Nexo
Curb weight: 1919 kg
Weight without fuel cell and hydrogen tank: 1600 kg [1] (Basis for comparison with BEV)
H2 demand based on WLTP: 0.95 kg H2 /100km (used for 2020); 2030: 0.93 kg H2 /100km
Fuel cell power: 95 kW
Hydrogen tank: 5.6 kg H2 Range: > 500 km
Battery electric vehicle (BEV) with 60 kWh battery (generic, weight without battery = 1600 kg)
Weight, incl. 60 kWh battery: 2044 kg (2020) and 1924 kg (2030)
Electricity demand (without charging losses): 19.5 kWh/100km (2020) and 19.0 kWh/100km (2030)
Range: ~300 km
BEV with 90 kWh battery (generic, weight without battery = 1600 kg)
Weight, incl. 90 kWh battery : 2266 kg (2020) and 2086 kg (2030)
Electricity demand (without charging losses): 20.4 kWh/100km (2020) and 19.7 kWh/100km (2030)
Range: > 400 km
[1] Weight of fuel cell and H2 tank based on Miotti et al., 2017 Electricity demand of BEV was derived from hydrogen demand of FCEV: Assumptions: - 60% efficiency for fuel cell - additional electricity demand per kg additional load: 4,2 Wh/100km (Redelbach et al. 2012, Impact of lightweight design on energy consumption and cost effectiveness of alternative powertrain concepts)
© Fraunhofer ISE
16
FHG-SK: ISE-PUBLIC
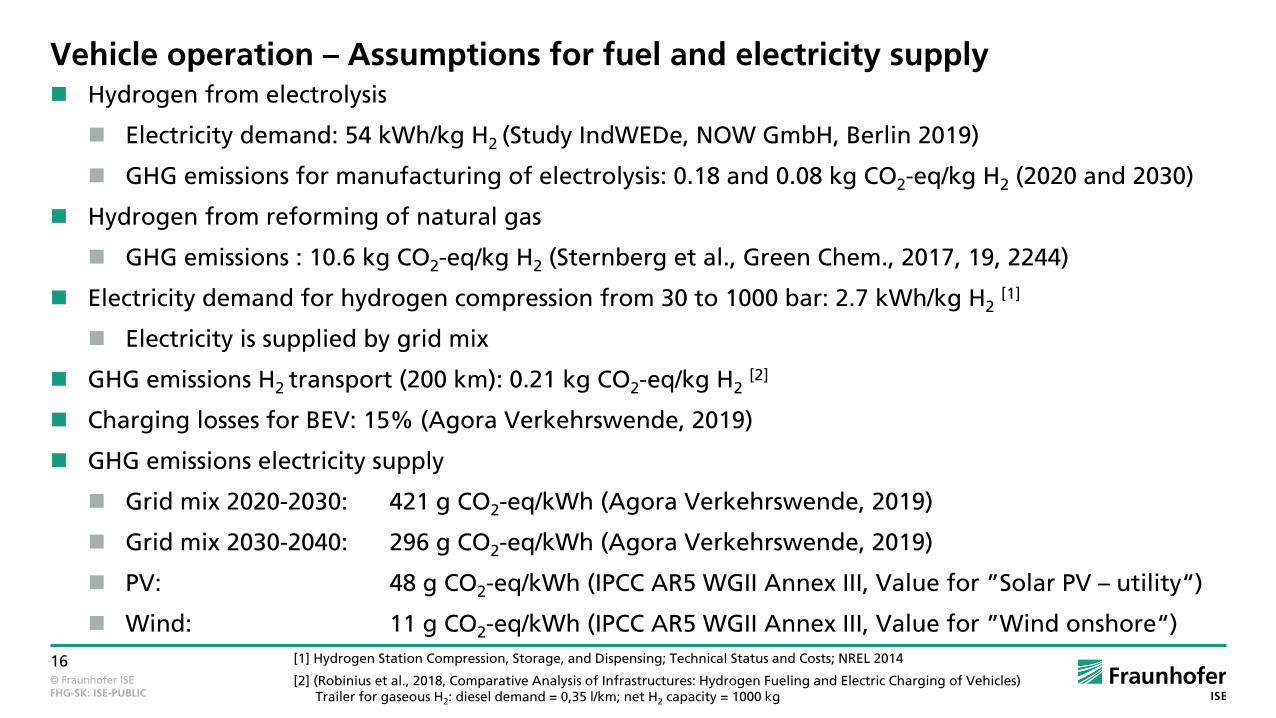
Vehicle operation – Assumptions for fuel and electricity supply Hydrogen from electrolysis
Electricity demand: 54 kWh/kg H2 (Study IndWEDe, NOW GmbH, Berlin 2019)
GHG emissions for manufacturing of electrolysis: 0.18 and 0.08 kg CO2-eq/kg H2 (2020 and 2030)
Hydrogen from reforming of natural gas
GHG emissions : 10.6 kg CO2-eq/kg H2 (Sternberg et al., Green Chem., 2017, 19, 2244)
Electricity demand for hydrogen compression from 30 to 1000 bar: 2.7 kWh/kg H2 [1]
Electricity is supplied by grid mix
GHG emissions H2 transport (200 km): 0.21 kg CO2-eq/kg H2 [2]
Charging losses for BEV: 15% (Agora Verkehrswende, 2019)
GHG emissions electricity supply
Grid mix 2020-2030: 421 g CO2-eq/kWh (Agora Verkehrswende, 2019)
Grid mix 2030-2040: 296 g CO2-eq/kWh (Agora Verkehrswende, 2019)
PV: 48 g CO2-eq/kWh (IPCC AR5 WGII Annex III, Value for ”Solar PV – utility“)
Wind: 11 g CO2-eq/kWh (IPCC AR5 WGII Annex III, Value for ”Wind onshore“)
[1] Hydrogen Station Compression, Storage, and Dispensing; Technical Status and Costs; NREL 2014
[2] (Robinius et al., 2018, Comparative Analysis of Infrastructures: Hydrogen Fueling and Electric Charging of Vehicles) Trailer for gaseous H2: diesel demand = 0,35 l/km; net H2 capacity = 1000 kg

© Fraunhofer ISE
17
FHG-SK: ISE-PUBLIC
Diesel vehicle: Definition of vehicle weight and consumption
Reference: Hyundai Tucson 1.6 CRDi (100 kW)
Curb weight: 1,683-1,810 kg
Consumption based on NEDC[1]
: 4.4 l/100km
CO2 emissions based on NEDC[1]
: 117 g/km
CO2-Emissionen based on WLTP: 157 g/km
Consumption based on WLTP[2]
: 5.9 l/100km
Considered values:
Curb weight : 1,750 kg
Consumption based on WLTP: 5.9 l/100km (100% fossil fuel)
[1] Use of WLTP to derive fuel consumption and recalculated to NEDC [2] Calculated from WLTP CO2 emissions (2.65 kg CO2-eq per liter diesel)
© Fraunhofer ISE
18
FHG-SK: ISE-PUBLIC
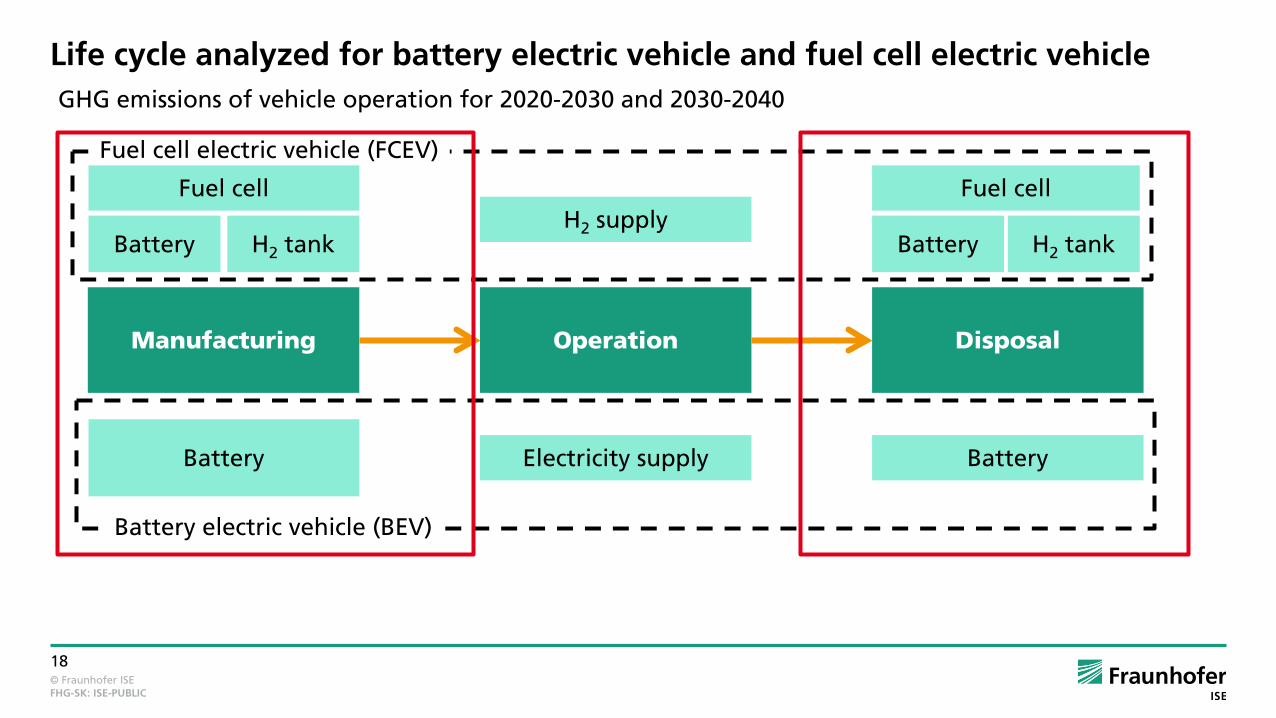
Life cycle analyzed for battery electric vehicle and fuel cell electric vehicle
Manufacturing Operation Disposal
Battery
H2 tank Battery H2 supply
Electricity supply
Fuel cell
H2 tank Battery
Battery
Fuel cell electric vehicle (FCEV)
Battery electric vehicle (BEV)
GHG emissions of vehicle operation for 2020-2030 and 2030-2040
Fuel cell

© Fraunhofer ISE
19
FHG-SK: ISE-PUBLIC
Manufacturing + disposal: greenhouse gas emissions
2020 2030
GHG fuel cell system (95 kW) ≈ GHG battery with 45 kWh
GHG fuel cell system (95 kW) ≈ GHG battery with 60 kWh
FCEV includes fuel cell + 5.6 kg H2 tank + 1.5 kWh battery
0
5
10
15
20
25
GH
G e
mis
sio
ns
/ t C
O2-e
q
EntsorgungHerstellung BatterieHerstelllung H2-TankHerstellung Brennstoffzelle
0
2
4
6
8
10
GH
G e
mis
sio
ns
/ t C
O2-e
q Entsorgung
Herstellung BatterieHerstelllung H2-TankHerstellung Brennstoffzelle
Disposal Manufacturing of battery Manufacturing of H2 tank Manufacturing of fuel cell
Disposal Manufacturing of battery Manufacturing of H2 tank Manufacturing of fuel cell

© Fraunhofer ISE
20
FHG-SK: ISE-PUBLIC
Life cycle analyzed for battery electric vehicle and fuel cell electric vehicle
Manufacturing Operation Disposal
Battery
H2 tank Battery H2 supply
Electricity supply
Fuel cell
H2 tank Battery
Battery
Fuel cell electric vehicle (FCEV)
Battery electric vehicle (BEV)
GHG emissions of vehicle operation for 2020-2030 and 2030-2040
Fuel cell

© Fraunhofer ISE
21
FHG-SK: ISE-PUBLIC
Most important assumptions for battery
2020 2030
Cell chemistry [1] NCM (6:2:2) NCM (9:0.5:0.5)
Cell container [2] pouch
Pack housing [2] aluminum
Electrolyte salt [2] LiPF6
Solvent [2,4] n-methyl-2-pyrrolidone
Energy density (battery pack) [3] 135 Wh/kg 185 Wh/kg
N – nickel C – cobalt M - manganese
[1] Cell chemistry with highest market share according to Azevedo et al., Lithium and cobalt – a tale of two commodities, Metals and Mining, June 2018 [2] Ellingsen et al., 2014 [3] see slide ”Energy density for battery packs “ [4] based on Agora Verkehrswende (2019) 99.5% are recycled
Battery was modeled in LCA-Software Umberto LCA+ using database ecoinvent 3.5 Data for manufacturing of battery is based on [2]
© Fraunhofer ISE
22
FHG-SK: ISE-PUBLIC
0
20
40
60
80
100
120
140
160
180
Best Case Base Case Worst Case Best Case Base Case Worst Case
GH
G e
mis
sio
ns
/ (kg
CO
2-e
q/k
Wh
)
Cooling system
BMS
Packaging
Cell container
Separator
Electrolyte
Cathode
Anode
Cell assembly
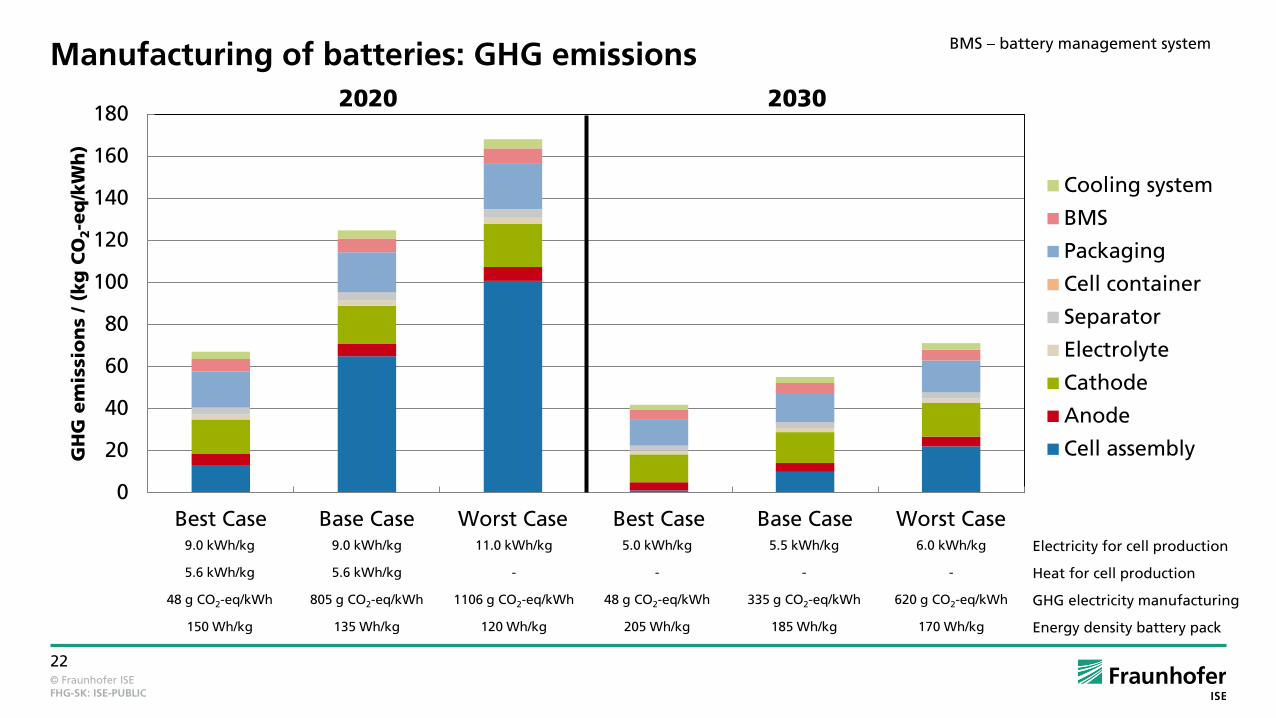
Manufacturing of batteries: GHG emissions 2020 2030
9.0 kWh/kg 9.0 kWh/kg 11.0 kWh/kg 5.0 kWh/kg 5.5 kWh/kg 6.0 kWh/kg Electricity for cell production
5.6 kWh/kg 5.6 kWh/kg - - - - Heat for cell production
48 g CO2-eq/kWh 805 g CO2-eq/kWh 1106 g CO2-eq/kWh 48 g CO2-eq/kWh 335 g CO2-eq/kWh 620 g CO2-eq/kWh GHG electricity manufacturing
150 Wh/kg 135 Wh/kg 120 Wh/kg 205 Wh/kg 185 Wh/kg 170 Wh/kg Energy density battery pack
BMS – battery management system

© Fraunhofer ISE
23
FHG-SK: ISE-PUBLIC
0
20
40
60
80
100
120
140
160
180
Best Case Base Case Worst Case Best Case Base Case Worst Case
GH
G e
mis
sio
ns
/ (kg
CO
2-e
q/k
Wh
) Anderes
Andere Chemikalien
Nylon
Elektronik
Lithiumverbindungen
Mangansulfat
Cobaltsulfat
Nickelsulfate
Metall & Plastik Bearbeitung
Wärme
Stahl, Messing & Zinn
Kupfer
Aluminium
Strom
Manufacturing of batteries: GHG emissions in more detail 2020 2030
9.0 kWh/kg 9.0 kWh/kg 11.0 kWh/kg 5.0 kWh/kg 5.5 kWh/kg 6.0 kWh/kg Electricity for cell production
5.6 kWh/kg 5.6 kWh/kg - - - - Heat for cell production
48 g CO2-eq/kWh 805 g CO2-eq/kWh 1106 g CO2-eq/kWh 48 g CO2-eq/kWh 335 g CO2-eq/kWh 620 g CO2-eq/kWh GHG electricity manufacturing
150 Wh/kg 135 Wh/kg 120 Wh/kg 205 Wh/kg 185 Wh/kg 170 Wh/kg Energy density battery pack
Others
Other chemicals
Nylon
Electronics
Lithium compounds
Manganese sulfate
Cobalt sulfate
Nickel sulfate
Metal + plastic processing
Heat
Steel, brass & tin
Copper
Aluminum
Electricity

© Fraunhofer ISE
24
FHG-SK: ISE-PUBLIC
Life cycle analyzed for battery electric vehicle and fuel cell electric vehicle
Manufacturing Operation Disposal
Battery
H2 tank Battery H2 supply
Electricity supply
Fuel cell
H2 tank Battery
Battery
Fuel cell electric vehicle (FCEV)
Battery electric vehicle (BEV)
GHG emissions of vehicle operation for 2020-2030 and 2030-2040
Fuel cell

© Fraunhofer ISE
25
FHG-SK: ISE-PUBLIC
Most important assumptions for fuel cell
2020 2030
Platinum loading [1] 0.4 mg/cm² 0.2 mg/cm²
Power density [1] 1060 mW/m² 1310 mW/m²
Platinum demand [1] 0.43 g/kW 0.165 g/kW
[1] Miotti et al., 2017
Fuel cell was modeled in LCA-Software Umberto LCA+ using database ecoinvent 3.5 Data for manufacturing of fuel cell is based on [1]

© Fraunhofer ISE
26
FHG-SK: ISE-PUBLIC
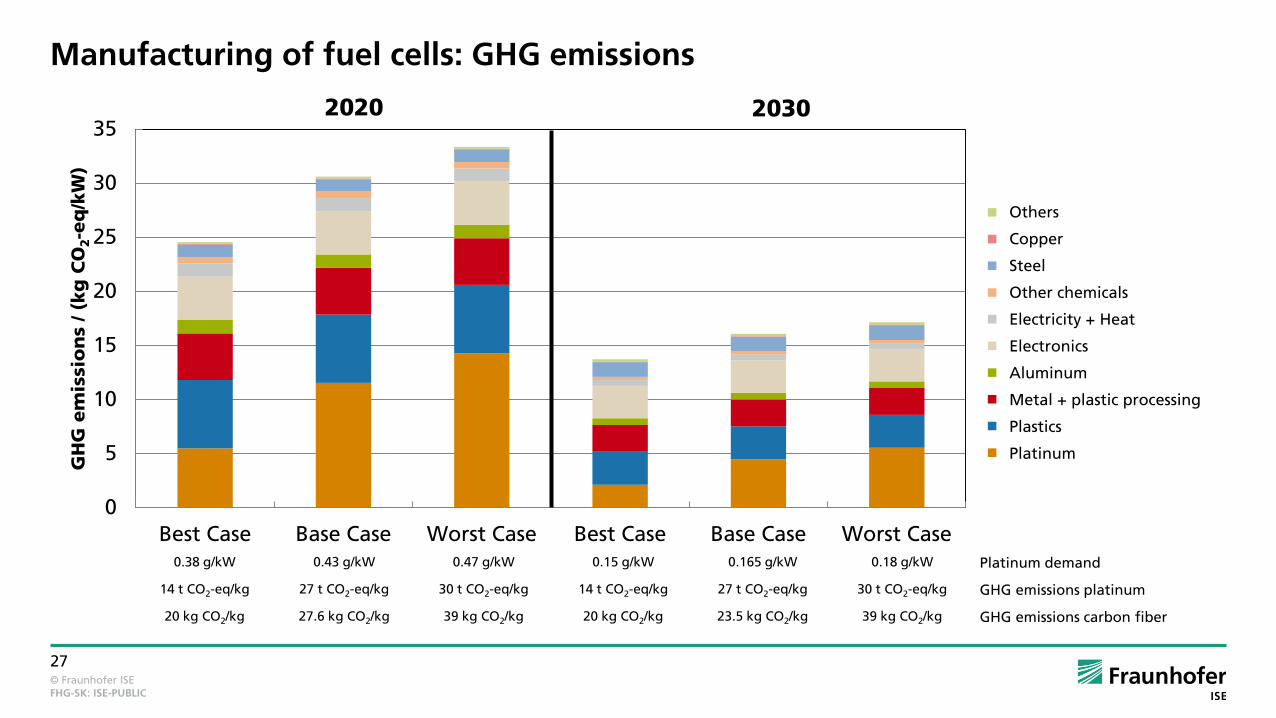
Manufacturing of fuel cells: GHG emissions 2030 2020
0
5
10
15
20
25
30
35
Best Case Base Case Worst Case Best Case Base Case Worst Case
GH
G e
mis
sio
ns
/ (kg
CO
2-e
q/k
W)
Others
Bipolar plate
MEA
Catalyst
Gas diffusion layer
Membrane
BOP
MEA – Membrane electrode assembly
BOP – Balance of plant
0.38 g/kW 0.43 g/kW 0.47 g/kW 0.15 g/kW 0.165 g/kW 0.18 g/kW Platinum demand
14 t CO2-eq/kg 27 t CO2-eq/kg 30 t CO2-eq/kg 14 t CO2-eq/kg 27 t CO2-eq/kg 30 t CO2-eq/kg GHG emissions platinum
20 kg CO2/kg 27.6 kg CO2/kg 39 kg CO2/kg 20 kg CO2/kg 23.5 kg CO2/kg 39 kg CO2/kg GHG emissions carbon fiber
© Fraunhofer ISE
27
FHG-SK: ISE-PUBLIC
Manufacturing of fuel cells: GHG emissions
0
5
10
15
20
25
30
35
Best Case Base Case Worst Case Best Case Base Case Worst Case
GH
G e
mis
sio
ns
/ (kg
CO
2-e
q/k
W)
Anderes
Kupfer
Stahl
Andere Chemikalien
Strom + Wärme
Elektronik
Aluminium
Metall & Plastik Bearbeitung
Plastik
Platinum
0.38 g/kW 0.43 g/kW 0.47 g/kW 0.15 g/kW 0.165 g/kW 0.18 g/kW Platinum demand
14 t CO2-eq/kg 27 t CO2-eq/kg 30 t CO2-eq/kg 14 t CO2-eq/kg 27 t CO2-eq/kg 30 t CO2-eq/kg GHG emissions platinum
20 kg CO2/kg 27.6 kg CO2/kg 39 kg CO2/kg 20 kg CO2/kg 23.5 kg CO2/kg 39 kg CO2/kg GHG emissions carbon fiber
2030 2020
Others
Copper
Steel
Other chemicals
Electricity + Heat
Electronics
Aluminum
Metal + plastic processing
Plastics
Platinum

© Fraunhofer ISE
28
FHG-SK: ISE-PUBLIC
Most important assumptions for hydrogen tank
2020 2030
Tank type Typ IV (700 bar); 2 tank system
Size 5.6 kg H2
Material demand 15% lower compared to 2020 [1]
[1] Miotti et al., 2017
Hydrogen tank was modeled in LCA-Software Umberto LCA+ using database ecoinvent 3.5 Data for manufacturing of hydrogen tank is based on ”Argonne National Lab, ANL-10/24 Technical Assessment of Compressed Hydrogen Storage Tank Systems for Automotive Applications“

© Fraunhofer ISE
29
FHG-SK: ISE-PUBLIC
0
100
200
300
400
500
600
700
800
Best Case Base Case Worst Case Best Case Base Case Worst Case
GH
G e
mis
sio
ns
/ (kg
CO
2-e
q/k
g H
2)
Carbon fibre
HDPE
BOP
Manufacturing of hydrogen tank: GHG emissions 2030 2020
20 kg CO2/kg 27.6 kg CO2/kg 39 kg CO2/kg 20 kg CO2/kg 23.5 kg CO2/kg 39 kg CO2/kg GHG emissions for carbon fiber
BOP – Balance of plant
fiber Carbon fiber

© Fraunhofer ISE
30
FHG-SK: ISE-PUBLIC
References for manufacturing scenarios of battery
2020 2030
Best Case Base Case Worst Case Best Case Base Case Worst Case
Electricity demand for cell production
9.0 kWh/kg 9.0 kWh/kg 11.0 kWh/kg 5.0 kWh/kg 5.5 kWh/kg 6.0 kWh/kg
Heat demand for cell production
5.6 kWh/kg 5.6 kWh/kg - - - -
Reference for electricity and heat demand
[Peters et al., 2018] [Peters et al., 2018] [Agora Verkehrswende, 2019]
Own assumption: Base Case -10%
[Agora Verkehrswende, 2019]
Own assumption: Base Case +10%
GHG emissions electricity
48 g CO2-eq/kWh 805 g CO2-eq/kWh 1106 g CO2-eq/kWh 48 g CO2-eq/kWh 335 g CO2-eq/kWh 620 g CO2-eq/kWh
Reference for GHG emissions electricity
[IPCC] PV electricity
[Agora Verkehrswende, 2019]
grid mix of manufacturing
countries
[Agora Verkehrswende, 2019]
grid mix China
[IPCC] PV electricity
[Agora Verkehrswende, 2019]
grid mix EU, 2030
Forecast grid mix China, 2030
Energy density battery pack [1]
150 Wh/kg 135 Wh/kg 120 Wh/kg 205 Wh/kg 185 Wh/kg 170 Wh/kg
[1] see next slide
© Fraunhofer ISE
31
FHG-SK: ISE-PUBLIC
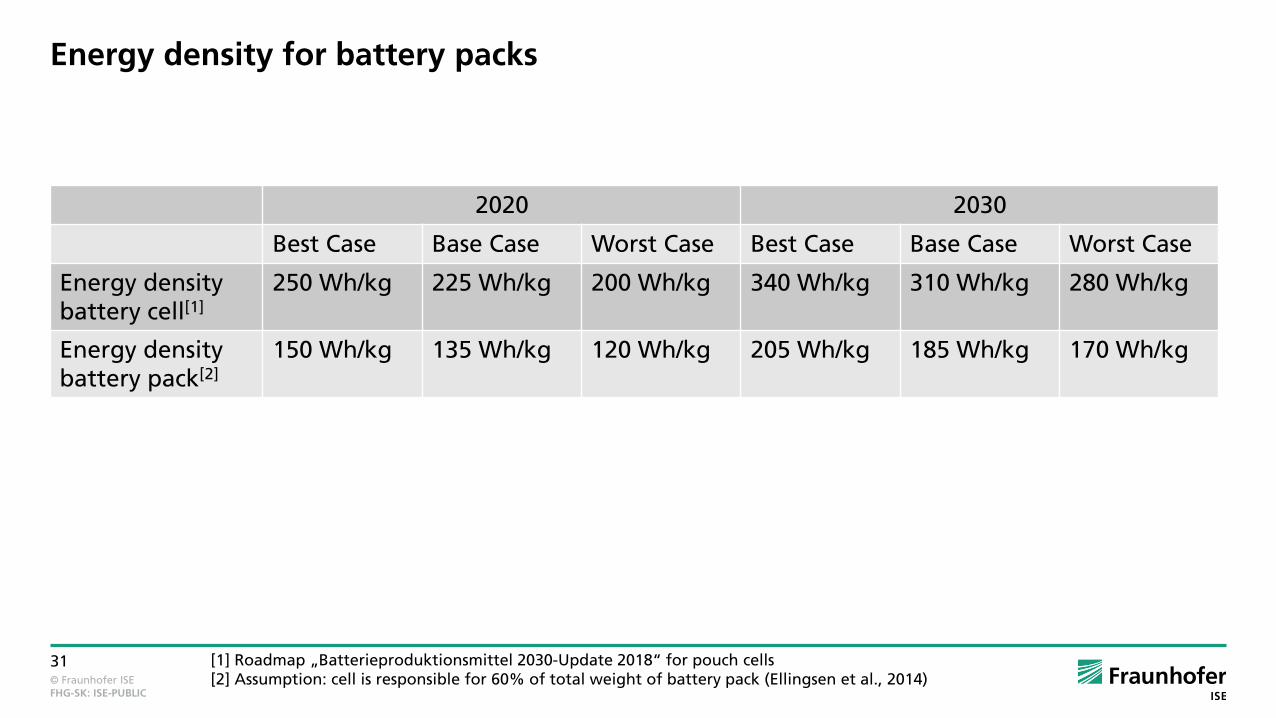
Energy density for battery packs
2020 2030
Best Case Base Case Worst Case Best Case Base Case Worst Case
Energy density battery cell[1]
250 Wh/kg 225 Wh/kg 200 Wh/kg 340 Wh/kg 310 Wh/kg 280 Wh/kg
Energy density battery pack[2]
150 Wh/kg 135 Wh/kg 120 Wh/kg 205 Wh/kg 185 Wh/kg 170 Wh/kg
[1] Roadmap „Batterieproduktionsmittel 2030-Update 2018“ for pouch cells [2] Assumption: cell is responsible for 60% of total weight of battery pack (Ellingsen et al., 2014)

© Fraunhofer ISE
32
FHG-SK: ISE-PUBLIC
References for manufacturing scenarios of fuel cell and H2 tank
2020 2030
Best Case Base Case Worst Case Best Case Base Case Worst Case
Platinum demand 0.38 g/kW 0.43 g/kW 0.47 g/kW 0.15 g/kW 0.165 g/kW 0.18 g/kW
Reference for platinum demand
Own assumption: Base Case -10%
[Miotti et al., 2017] Own assumption: Base Case +10%
Own assumption: Base Case -10%
[Miotti et al., 2017] Own assumption: Base Case +10%
GHG emissions platinum
14 t CO2-eq/kg 27 t CO2-eq/kg 30 t CO2-eq/kg 14 t CO2-eq/kg 27 t CO2-eq/kg 30 t CO2-eq/kg
Reference for GHG emissions platinum
[ecoinvent 3.5] Platinum from Russia
[ecoinvent 3.5] Global Platinum mix, about 20% Russia + 80% South Africa
[ecoinvent 3.5] Platinum from South Africa
[ecoinvent 3.5] Platinum from Russia
[ecoinvent 3.5] Global Platinum mix, about 20% Russia + 80% South Africa
[ecoinvent 3.5] Platinum from South Africa
GHG emissions carbon fiber
20 kg CO2/kg 27.6 kg CO2/kg 39 kg CO2/kg 20 kg CO2/kg 23.5 kg CO2/kg 39 kg CO2/kg
Reference for GHG emissions carbon fiber
[Miotti et al., 2017] Own calculation based on documentation of Eco Impact Calculators
GHG electricity: 805 g CO2-eq/kWh
[Eco Impact Calculator] http://ecocalculator.euci
a.eu/
[Miotti et al., 2017] Own calculation based on documentation of Eco Impact Calculators
GHG electricity: 335 g CO2-eq/kWh
[Eco Impact Calculator] http://ecocalculator.euci
a.eu/