greenhouse gas emissions related to water and … wastewater.pdf · baseline, reduction strategies,...
TRANSCRIPT
Greenhouse Gas Emissions Related to Water and Wastewater Services:
Baseline, Reduction Strategies, and Recommendations
June 2008
Final
Report prepared for the
Utilities Department City of Santa Rosa
by
Climate Protection Campaign
Dave Erickson, Technical Director www.climateprotectioncampaign.org
and Edwin B. Orrett, P.E.
President, Resource Performance Partners, Inc., Petaluma, California and
John Rosenblum, Ph.D. Rosenblum Environmental Engineering, Sebastopol, California
Santa Rosa Utilities Greenhouse Gas Study i
Greenhouse Gas Emissions Related to Water and Wastewater Services: Baseline, Reduction Strategies, and Recommendations
Table of Contents ACKNOWLEDGEMENTS ....................................................................................................................................... i
1.0 EXECUTIVE SUMMARY ................................................................................................................................... 1
1.1 BACKGROUND .................................................................................................................................................... 1 1.2 SUMMARY OF FINDINGS ..................................................................................................................................... 2 1.3 RECOMMENDATIONS .......................................................................................................................................... 6
2.0 INTRODUCTION ............................................................................................................................................... 7
2.1 GHG INVENTORY RESULTS ................................................................................................................................ 8 2.2 GHG EMISSIONS REDUCTION IN THE MUNICIPAL WATER CYCLE ................................................................. 12 2.3 COST EFFECTIVE PATHWAYS TO GHG EMISSIONS REDUCTION ..................................................................... 14
3.0 BASELINE ........................................................................................................................................................... 16
3.1 SYSTEMS FRAMEWORK ..................................................................................................................................... 16 3.2 CITY OF SANTA ROSA OPPORTUNITIES FOR INTERVENTION ........................................................................... 20
4.0 GHG REDUCTION STRATEGIES ................................................................................................................ 21
4.1 REDUCE ENERGY DEMAND .............................................................................................................................. 21 4.2 IMPROVE RENEWABLE CONTENT OF ENERGY PURCHASED ............................................................................ 35
5.0 ANALYSIS .......................................................................................................................................................... 37
5.1 INTERACTION AMONG STRATEGIES ................................................................................................................. 37 5.2 SCENARIO DEVELOPMENT ............................................................................................................................... 39
6.0 RECOMMENDATIONS .................................................................................................................................. 41
APPENDIX A : COMMUNITY CHOICE AGGREGATION ........................................................................... 42
APPENDIX B: RECOMMENDATIONS FOR MONITORING PROGRESS TOWARD GHG REDUCTION TARGETS ....................................................................................................................................... 44
APPENDIX C: ROSENBLUM ENVIRONMENTAL ENGINEERING STUDY ........................................... 46
APPENDIX D: BASELINE GHG EMISSIONS — WATER-RELATED ENERGY USE BY SANTA ROSA WATER UTILITY CUSTOMERS ........................................................................................................... 137
APPENDIX E: PAY AS YOU SAVE® (PAYS®) ................................................................................................ 141
APPENDIX F: IMPROVING INDOOR RESIDENTIAL WATER EFFICIENCY WITH PAYS ............... 144
APPENDIX G: EMERGING END USE EFFICIENCY PRODUCTS AND STRATEGIES ....................... 154
Acknowledgements We greatly appreciate the following Santa Rosa Utilities Department Staff for their assistance in preparing this report: Dell Tredinnick, Joe Schwall, and Dan Carlson. We also are grateful to Dick Dowd, Chair, and the Board of the Public Utilities for initiating and overseeing this report.
Santa Rosa Utilities Greenhouse Gas Study 1
1.0 EXECUTIVE SUMMARY
1.1 Background
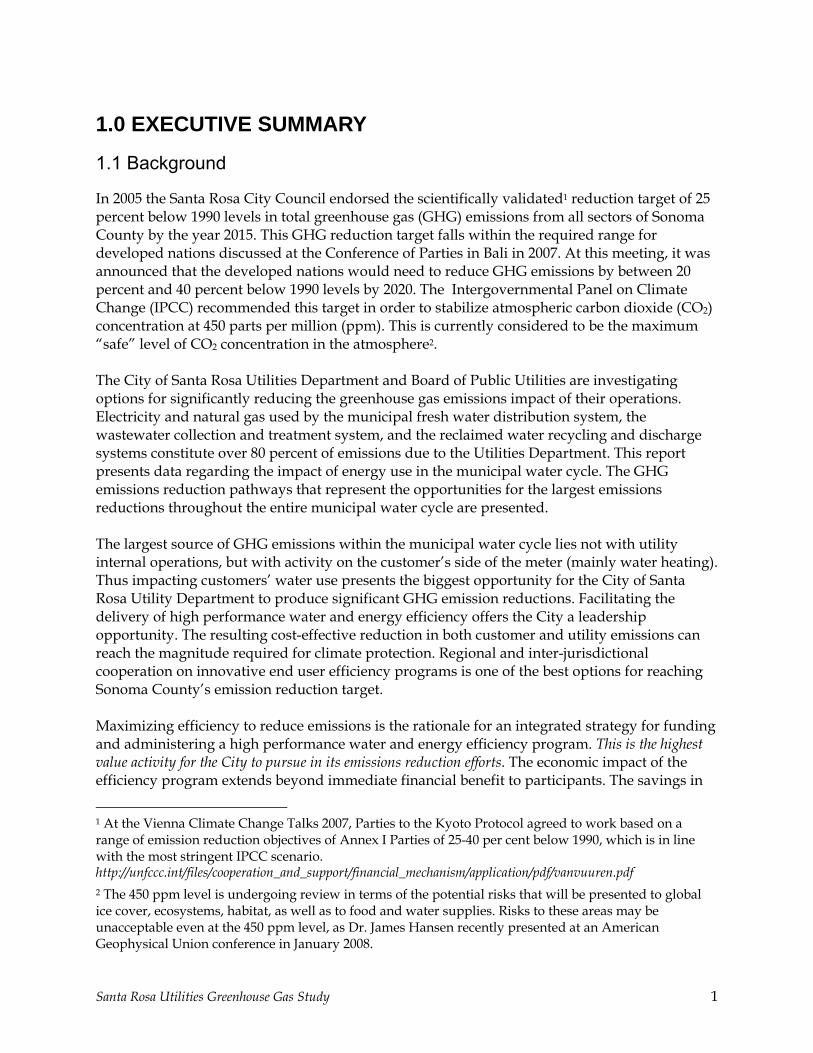
In 2005 the Santa Rosa City Council endorsed the scientifically validated1 reduction target of 25 percent below 1990 levels in total greenhouse gas (GHG) emissions from all sectors of Sonoma County by the year 2015. This GHG reduction target falls within the required range for developed nations discussed at the Conference of Parties in Bali in 2007. At this meeting, it was announced that the developed nations would need to reduce GHG emissions by between 20 percent and 40 percent below 1990 levels by 2020. The Intergovernmental Panel on Climate Change (IPCC) recommended this target in order to stabilize atmospheric carbon dioxide (CO2) concentration at 450 parts per million (ppm). This is currently considered to be the maximum “safe” level of CO2 concentration in the atmosphere2. The City of Santa Rosa Utilities Department and Board of Public Utilities are investigating options for significantly reducing the greenhouse gas emissions impact of their operations. Electricity and natural gas used by the municipal fresh water distribution system, the wastewater collection and treatment system, and the reclaimed water recycling and discharge systems constitute over 80 percent of emissions due to the Utilities Department. This report presents data regarding the impact of energy use in the municipal water cycle. The GHG emissions reduction pathways that represent the opportunities for the largest emissions reductions throughout the entire municipal water cycle are presented. The largest source of GHG emissions within the municipal water cycle lies not with utility internal operations, but with activity on the customer’s side of the meter (mainly water heating). Thus impacting customers’ water use presents the biggest opportunity for the City of Santa Rosa Utility Department to produce significant GHG emission reductions. Facilitating the delivery of high performance water and energy efficiency offers the City a leadership opportunity. The resulting cost-effective reduction in both customer and utility emissions can reach the magnitude required for climate protection. Regional and inter-jurisdictional cooperation on innovative end user efficiency programs is one of the best options for reaching Sonoma County’s emission reduction target. Maximizing efficiency to reduce emissions is the rationale for an integrated strategy for funding and administering a high performance water and energy efficiency program. This is the highest value activity for the City to pursue in its emissions reduction efforts. The economic impact of the efficiency program extends beyond immediate financial benefit to participants. The savings in
1 At the Vienna Climate Change Talks 2007, Parties to the Kyoto Protocol agreed to work based on a range of emission reduction objectives of Annex I Parties of 25-40 per cent below 1990, which is in line with the most stringent IPCC scenario. http://unfccc.int/files/cooperation_and_support/financial_mechanism/application/pdf/vanvuuren.pdf 2 The 450 ppm level is undergoing review in terms of the potential risks that will be presented to global ice cover, ecosystems, habitat, as well as to food and water supplies. Risks to these areas may be unacceptable even at the 450 ppm level, as Dr. James Hansen recently presented at an American Geophysical Union conference in January 2008.

1.0 Executive Summary
Santa Rosa Utilities Greenhouse Gas Study 2
cost to all ratepayers for avoiding future water infrastructure capacity expansion cannot be overstated. For enhanced emissions reduction and financial impact, the efficiency delivery program is integrated with an approach to building new, low cost, renewable electricity generation resources that provide “low carbon” electricity for all customers within the City.
1.2 Summary of Findings
This study found that of the City of Santa Rosa GHG emissions, the Utilities Department operations represent the largest share (46%). Of Utilities Department operations, water supply, wastewater treatment, and reclamation represent the largest share (82%). The largest single source of emissions in the City of Santa Rosa operations is the Subregional System, at 37% of total emissions. Emissions due to the Subregional System increased significantly in 2004, due to the operation of the Geysers Pipeline. In order to identify and rank opportunities for investment in GHG reduction, this report investigates findings on emissions from each element of the Santa Rosa municipal water cycle. Figure ES-1 illustrates the water cycle for Santa Rosa.
Figure ES-1
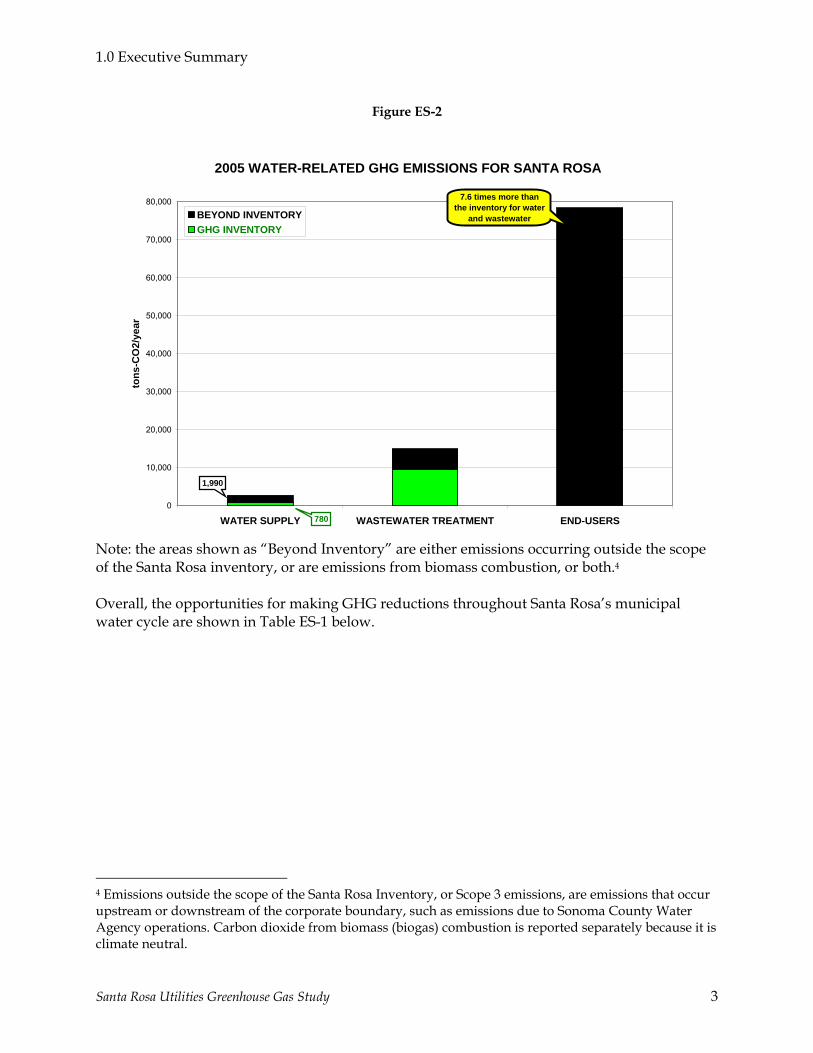
This report incorporates findings on emissions from Sonoma County Water Agency operations to show a complete assessment of the contributions of all of the components of the water cycle to total emissions from water-related activities. The following chart shows the total GHG emissions associated with principal sections of the municipal water cycle3.
3 Developed in the accompanying technical report in Appendix C by Rosenblum Environmental Engineering.
1.0 Executive Summary
Santa Rosa Utilities Greenhouse Gas Study 3
Figure ES-2
2005 WATER-RELATED GHG EMISSIONS FOR SANTA ROSA
0
10,000
20,000
30,000
40,000
50,000
60,000
70,000
80,000
WATER SUPPLY WASTEWATER TREATMENT END-USERS
tons
-CO
2/ye
ar
BEYOND INVENTORYGHG INVENTORY
780
1,990
7.6 times more than the inventory for water
and wastewater
Note: the areas shown as “Beyond Inventory” are either emissions occurring outside the scope of the Santa Rosa inventory, or are emissions from biomass combustion, or both.4 Overall, the opportunities for making GHG reductions throughout Santa Rosa’s municipal water cycle are shown in Table ES-1 below.
4 Emissions outside the scope of the Santa Rosa Inventory, or Scope 3 emissions, are emissions that occur upstream or downstream of the corporate boundary, such as emissions due to Sonoma County Water Agency operations. Carbon dioxide from biomass (biogas) combustion is reported separately because it is climate neutral.

1.0 Executive Summary
Santa Rosa Utilities Greenhouse Gas Study 4
Table ES-1
The findings of this study are:
o Water efficiency improvements for end users offer by far the largest potential for reducing emissions throughout Santa Rosa’s municipal water cycle. This study finds that there is significant improvement potential in residential water efficiency in Santa Rosa. As an example, delivering these improvements to half of the single family, detached homes in Santa Rosa using a high performance efficiency retrofit delivery system would result in:
• GHG emission reduction of approximately 11,000 tons/yr (slightly more than all present emissions from the City’s water and wastewater operations);
• $34 million worth of services rendered; and
• Net cash savings of $4.2 million per year for participating City water customers5
o Energy efficiency improvement in water delivery and treatment operations is a cost-effective method for reducing GHG emissions from Utility Department operations. The
5 This value does not reflect the effects of either utility rate adjustments to address “revenue erosion,” nor cost savings potentially made possible by avoiding future utility infrastructure, as both are beyond the scope of this analysis.

1.0 Executive Summary
Santa Rosa Utilities Greenhouse Gas Study 5
City is currently investigating improving the efficiency of the pumps in the reclamation system.
o For municipal operations, increased electricity generated from biogas produced at the Laguna Treatment Plant is the most cost effective option for creating more “carbon-free” electricity. In addition, currently unused heat created in co-generation can be used to reduce the amount of electricity and natural gas required for wastewater treatment. 6
o The most cost-effective method for decreasing emission intensity7 of energy used for water supply and wastewater treatment, as well as for end use, can be found through evaluating options for increasing the percentage of renewable power generation resources in the grid fuel mix. These options are discussed in more detail in Sections 4, 5 and Appendix A.
o The net reduction in GHG emissions from the Geysers project is very large – equal to 47% of all water related GHG emissions by the City and its customers. However, other entities receive the credit. If significant water efficiency improvements become part of a future regional effort to reduce GHG emissions, reducing summer pumping to the Geysers, while increasing local irrigation to displace potable water demands, might yield a more sustainable and more cost-effective option than pumping as much as possible to the Geysers. The effects of this option should be evaluated in further study. See Figure ES-3.
Figure ES-3
1,1703,590
25,000
0
10,000
20,000
30,000
40,000
50,000
60,000
70,000
Santa Rosa's portion of SRGRP PG&E (for NET OUTPUT)
tons
-CO
2/yr
GHG EMISSIONS FROM THE GEYSERS PROJECT (2005)
NET OUTPUTCALPINE PUMPSLAGUNA PUMPSAVOIDED GHG
41,000 tons-CO2/yr
6 This option is fully described in the accompanying technical report in Appendix C by Rosenblum Environmental Engineering. 7 Quantity of greenhouse gas emitted for each unit of electrical energy consumed. Units are “pounds of equivalent CO2 per kilowatt hour”. The intensity depends on the “fuel mix” of the electricity available on the grid. This is set by the local utility. In the case of Santa Rosa, the emissions intensity of grid electricity is determined by PG&E electricity procurement.

1.0 Executive Summary
Santa Rosa Utilities Greenhouse Gas Study 6
1.3 Recommendations
1. Reduce flow through the entire municipal water cycle by instituting a high performance end user water efficiency program. A next-generation implementation system designed to do this is described in this report.
2. Continue improving energy efficiency throughout the water distribution pumping and wastewater treatment systems. Consider replacing older, less efficient electric motors before burnout whenever cost-effective, rather than waiting for scheduled maintenance.
3. Fully exploit opportunities for increasing both biogas production and cogen efficiency at the Laguna Treatment Plant. Expanded heat recovery offers a large potential for use of the heat for other processes in the plant that can save energy or displace more natural gas.
4. Fully investigate the potential for regional cooperation for:
a. Purchasing or building more renewable electricity for the electric grid. b. Developing biomass resources for electricity generation or natural gas
displacement c. Coordinating with the Water Agency on tank level management and pumping
schedules to reduce peak flows d. Expand opportunities for renewable fuel manufacturing co-located with
wastewater treatment facilities. 5. Monitoring, tracking and reporting recommendations
a. Please see Appendix B for full description of recommendations for monitoring tracking and reporting.
6. Identify opportunities for financing both efficiency and new renewables through the legal frameworks available for alternative electricity procurement8.
a. Municipal Revenue Bonds b. Private Activity Bonds c. Assessment districts d. Public-Private partnerships
7. Further studies should be done in the following areas: a. Evaluate impact of reducing flow to Geysers and using the reclaimed water to
offset potable water use during the summer b. Evaluate the potential for minimizing the effect of “revenue erosion” from high
performance water efficiency improvement by offsetting the need for spending on infrastructure. This might best be accomplished through quantification of costs to the City over a 20 year period if not implementing the high performance end user efficiency versus costs to the City if the program was implemented.
8 See Appendix A for discussion.

Santa Rosa Utilities Greenhouse Gas Study 7
2.0 Introduction The City of Santa Rosa Utilities Department is a rate and fee funded enterprise providing water delivery and wastewater collection services to nearly 50,000 residential and commercial service locations. The City’s Utilities Department operates the Subregional Wastewater Treatment, Disposal and Industrial Waste pretreatment systems serving not only Santa Rosa, but also Rohnert Park, Sebastopol, Cotati and the South Park County Sanitation District. Santa Rosa City Council and the Santa Rosa Board of Public Utilities have made important steps toward quantifying and reducing the greenhouse gas emissions (GHG) due to their operations. This report presents the results of the study conducted by Climate Protection Campaign on how to achieve cost effective reduction of GHG throughout the municipal water cycle. This report focuses on the largest source of emissions within the City of Santa Rosa operational boundary: the Water Supply and Wastewater systems. Operation of these systems accounted for 37% of total emissions for the City in the baseline year 2000. Since the Geysers pipeline went into operation in 2004, the emissions associated with the treatment and recycling portions of the water cycle have increased significantly. Achieving maximum cost-effective GHG reductions for Utilities Department operations is the primary focus of this report. However, the report also examines the broader context for water-related GHG emissions (the “water-energy nexus”). The impact of greenhouse gas emissions reductions on a community-wide basis is also analyzed, with regard to the implications for the water cycle. The studies presented in this report were conducted with the following aims:
• Determine accurate and verifiable baselines for current water system, wastewater processing, and reclamation systems including:
1. total and unit9 energy cost (electricity and natural gas);
2. total and unit10 energy use (electricity and natural gas);
3. Total and unit11 GHG emissions
• Determine an accurate and verifiable baseline for per capita water consumption
• Evaluate community wide energy use, costs, and GHG emissions associated with water use, for each element of the municipal water cycle.
• Quantify costs and emissions reduction benefits associated with measures in each element of the municipal water cycle
9 Unit energy cost is dollars per million gallons ($/MG) 10 Unit energy use is kilowatt hours (kWh) or megawatt hours (MWh) per MG 11 Unit GHG emissions is tons eCO2 per MG

2.0 Introduction
Santa Rosa Utilities Greenhouse Gas Study 8
2.1 GHG Inventory Results
The “organizational boundary” is important for understanding the scope of the emissions inventory. The organizational boundary of this inventory is set using the “equity share” approach12. The emissions of the Subregional System are assigned based on the share of participation each of the users of the System. The City of Santa Rosa accounts for approximately 73% of the volume of wastewater processed by the Subregional System, and thus is assigned the same percentage of total emissions from those facilities.
2.1.1. Inventory Scope The emissions inventory covers “Scope 1” and “Scope 2” emissions.13 Scope 1 emissions are “direct emissions” from fossil fuel combustion, methane emissions, and process emissions of the other greenhouse gases. Scope 2 emissions are “indirect emissions” (primarily from electricity use). The inventory does not cover “Scope 3” emissions which are related to procurement or transport functions. For example, the emissions of the Sonoma County Water Agency that result from transport of water to the Santa Rosa water system are “Scope 3” for the Santa Rosa inventory. Emissions produced by energy used by Calpine to pump reclaimed water it receives from Santa Rosa are also quantified as Scope 3 emissions. Since they are related to the impact of Santa Rosa water use, the emission reduction studies also consider the impact of measures on Scope 3 emissions.
2.1.2 Carbon Dioxide Emissions from Biogenic Sources Emissions of carbon dioxide from biomass combustion are considered neutral in terms of their effect on atmospheric carbon dioxide concentration. This is also the case for other biogenic carbon dioxide emissions, such as from composting. For this reason, they are reported separately (and optionally) from the required reporting of emissions of carbon dioxide from fossil fuel combustion. In the overall Utilities department inventory, they were not quantified. However, for the purposes of evaluating emissions reduction measures, the carbon dioxide emissions from the combustion of biogas at the Laguna Treatment Plant are included in the study.
2.1.3 Emission Factors Emission factors are used to convert measured units of consumption to the weight of the greenhouse gas produced by that consumption. Emission factors for direct emissions from fossil fuel combustion used in this inventory are as follows: Fuel Consumption Unit Emission factor (lbs eCO2) Gasoline US Gallon 19.379 Diesel #2 US Gallon 22.223 Natural Gas Therm 11.67
12 World Resources Institute and World Business Council, The GHG Protocol, March 2004 13 Defined in The GHG Protocol (cited above)

2.0 Introduction
Santa Rosa Utilities Greenhouse Gas Study 9
Electricity emission factors are somewhat controversial. Since the emission of the greenhouse gases occurs at the point where the electricity is generated, rather than used, the emissions are known as indirect emissions. The electrons that are actually delivered to the point of use via the electricity grid can originate at any of many generators. Thus there is a question of the method used to evaluate the emission factor. There are two methods currently in use: 1) the grid average method and 2) the utility specific method. The original inventories for the City of Santa Rosa and for the Utilities Department used the grid average method. The reason for this was that, at the time, a utility specific factor for PG&E was not available. PG&E has since reported its total emissions and delivered electricity for 2004 and 2005 with the California Climate Action Registry.14 Factor Type Consumption Unit Pounds of CO2 Grid Average (2000-2007) Kilowatt hour 0.73 Utility Specific (PG&E 2004) Kilowatt hour 0.566 Utility Specific (PG&E 2005) Kilowatt hour 0.48915 In 2001, an inventory of emissions was completed for all City operations for the year 2000. The results of this inventory are shown below in Figure 116. Electricity and natural gas use in water and wastewater operations, administered by the Board of Public Utilities, account for 37% of the emissions total for the City.
Figure 1
City of Santa Rosa GHG Emissions - 2000 (25,916 tons)
9,904, 37%
6,382, 25%
3,563, 14% 2,575, 10%
3,508, 14%-16, 0%
Buildings
Vehicle Fleet
Other fuels
Streetlights/Traffic lights
Water/Wastew ater
Solid Waste
Note: The Solid Waste sector represents a negative contribution to overall emissions due to the carbon content of material that is
landfilled. However, the overall impact of landfilling is also dependent on the management of landfill gas emissions.
14 www.climateregistry.org 15 All equivalent carbon dioxide amounts for Scope 2 electricity emissions in this report have been adjusted to use the 2005 PG&E-specific emission factor. 16 These results were adjusted by Climate Protection Campaign for this report to align with the methodology used to prepare the Utilities Department inventory.
2.0 Introduction
Santa Rosa Utilities Greenhouse Gas Study 10
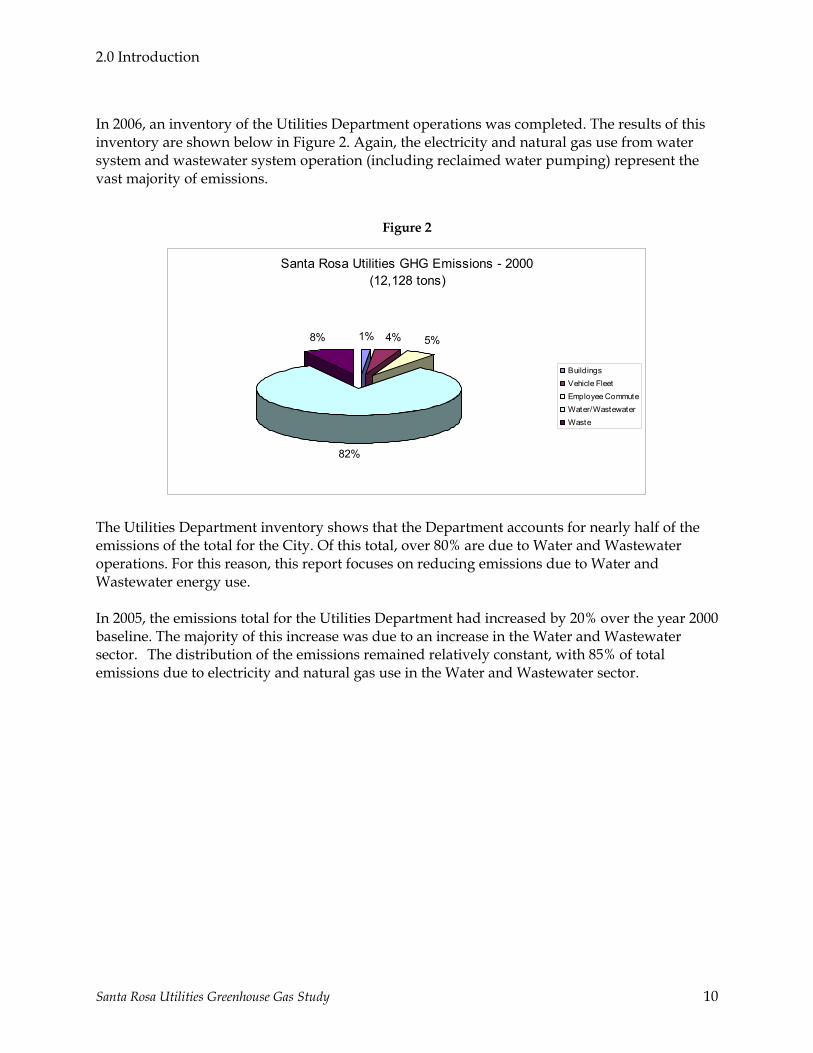
In 2006, an inventory of the Utilities Department operations was completed. The results of this inventory are shown below in Figure 2. Again, the electricity and natural gas use from water system and wastewater system operation (including reclaimed water pumping) represent the vast majority of emissions.
Figure 2
Santa Rosa Utilities GHG Emissions - 2000 (12,128 tons)
1% 4% 5%
82%
8%
BuildingsVehicle FleetEmployee CommuteWater/WastewaterWaste
The Utilities Department inventory shows that the Department accounts for nearly half of the emissions of the total for the City. Of this total, over 80% are due to Water and Wastewater operations. For this reason, this report focuses on reducing emissions due to Water and Wastewater energy use. In 2005, the emissions total for the Utilities Department had increased by 20% over the year 2000 baseline. The majority of this increase was due to an increase in the Water and Wastewater sector. The distribution of the emissions remained relatively constant, with 85% of total emissions due to electricity and natural gas use in the Water and Wastewater sector.

2.0 Introduction
Santa Rosa Utilities Greenhouse Gas Study 11
Figure 3 shows the breakdown of emissions contributions from the various activities within the Water and Wastewater sector.

2.0 Introduction
Santa Rosa Utilities Greenhouse Gas Study 12
Figure 3
Emissions from Water and Wastew ater Operations - 2005(9,701 tons eCO2)
8407, 86%
244, 3%
775, 8%
57, 1%170, 2% 37, 0%
10, 0%
Laguna Waste Treatment Plant
Pumping Plants
Ag. Pumps
Reclamation Pumps
Lift Station Maint.
Oakmont Treatment Plant
Wells
The Subregional System, including the Laguna Treatment Plant, accounts for the vast majority of emissions within the operations of the Utilities Department, and for the City government as a whole. The Laguna Treatment Plant has several major operations that use electricity that is measured by a single meter. These operations are:
1. Laguna Plant operations
2. EA and EB Reclaim pumps
3. Geysers pumps As shown in Figure 4 below, the Geysers pumps went into operation in 2004, which significantly increased energy use. Reclaim pumping (EA and EB pumps) is also a significant energy user, but the annual energy use and emissions have not been disaggregated at this time.

2.0 Introduction
Santa Rosa Utilities Greenhouse Gas Study 13
Figure 417
Emissions From Laguna Treatment Plant (LTP) and Llano Geysers Pumps (Santa Rosa share - Tons eCO2)
3,608 4,021 3,943 4,278
3,9683,803 3,654 3,099
1,166 1,165
0
1,000
2,000
3,000
4,000
5,000
6,000
7,000
8,000
9,000
10,000
2002 2003 2004 2005
Year
Tons
eC
O2
Geyser Pump Electricity
LTP and Reclaim Electricity
LTP Natural Gas
2.2 GHG Emissions Reduction in the Municipal Water Cycle
In order to identify the most cost-effective means for reducing greenhouse gas emissions associated with Utilities Department operations, the Water and Wastewater operations were examined. The State of California is very interested in the so-called “Water-Energy Nexus” because of its double impact: both on the water supply and on greenhouse gas emissions. Thus, Santa Rosa’s activities in this regard line up very well with State priorities. Eleven percent of the greenhouse gas emissions in the State of California are associated with water-related energy use. Although in Sonoma County this percentage is somewhat less, the Sonoma County Water Agency and the Subregional System, along with other wastewater treatment facilities, are among largest energy users in the County.
17 This chart uses the “Utility Specific” emission factors for electricity. The Santa Rosa share of emissions from the Laguna Plant is approximately 73% of total emissions.

2.0 Introduction
Santa Rosa Utilities Greenhouse Gas Study 14
Figure 5
As shown in Figure 5, the City of Santa Rosa is responsible for emissions associated with the Water Distribution, Wastewater Collection and Treatment, and Water Recycling portions of the Water Cycle. The rate paying customers of the City water utility are responsible for energy use and emissions associated with the Santa Rosa End Users portion of the cycle. Sonoma County Water Agency (SCWA) is responsible for the emissions associated with Water Supply and Conveyance, and Calpine is responsible for the impacts of the Geysers Pipeline, outside of the initial pumping operations. For the purposes of this study, all energy use and emissions associated with Water Recycling are included in Wastewater Collection and Treatment. Figure 66 (below) shows the distribution of total GHG emissions associated with Water and Wastewater processing for the City of Santa Rosa Municipal Water Cycle (Distribution, End Use18, Wastewater Collection, Wastewater Treatment and Recycled Water Distribution). In order to identify opportunities for emissions reduction due to energy use in the Water Cycle, total energy use was quantified in each element of the Cycle. The methodology employed in the studies identified how to make maximum emissions reduction in the Cycle as a whole. A separate study quantified emissions from the Sonoma County Water Agency, and some of those results are referred to in this report.19 The emissions due to energy use by SCWA, End Users and Calpine are considered “Scope 3” within the context of the organizational boundary used in for the SR Utilities GHG inventory. This study considers potential changes in Scope 3 18 Not a part of City operations. 19 Sonoma County Water Agency Greenhouse Gas Emissions from Water Supply Operations: Current Inventory and Potential Reductions, Rosenblum Environmental Engineering, 2006 (Appendix to Sonoma County Water Agency Final Report: Greenhouse Gas Emissions, Energy Use and Emissions Reduction Potential Climate Protection Campaign, 2007).

2.0 Introduction
Santa Rosa Utilities Greenhouse Gas Study 15
emissions in order to look at the City of Santa Rosa as part of the larger context of regional greenhouse gas emissions reduction. To further identify opportunities for emissions reduction, carbon dioxide emissions from biomass combustion (biogas) are quantified. These emissions are considered carbon neutral and are accounted for separately from emissions of carbon dioxide from fossil fuel combustion.
2.3 Cost Effective Pathways to GHG Emissions Reduction
The City of Santa Rosa provides potable water and wastewater treatment services to its customers. As noted earlier the water and wastewater have “embedded” GHG emissions associated with the energy used to transport and process, as well as the end use by the customer. There are two aspects of the problem of significantly reducing embedded GHG emissions. One aspect is the amount of energy use or “energy intensity” associated with water. The other dimension related to the quantity of emissions is the amount of water actually used. Water use has a double impact: the “water-energy nexus.” The State of California has developed a method for prioritizing energy procurement known as “the loading order.” This is a preferred order for prioritizing investment in new supply. The loading order can also, with small modification, be applied to the municipal water cycle. The basic finding of this report is that emissions reductions can be most cost-effectively made by investing in capacity according to the loading order. The Energy and Water Loading Order
• Conservation/Demand Reduction
• Efficiency Improvement
• Renewable Energy The elements of the loading order can be applied at each stage in the water cycle in order to reduce emissions. In terms of the contribution of each stage in the water cycle to overall GHG emissions, the largest impact occurs in the End Use portion of the cycle, as shown in Figure 6 below.

2.0 Introduction
Santa Rosa Utilities Greenhouse Gas Study 16
Figure 620
2005 WATER-RELATED GHG EMISSIONS FOR SANTA ROSA
0
10,000
20,000
30,000
40,000
50,000
60,000
70,000
80,000
WATER SUPPLY WASTEWATER TREATMENT END-USERS
tons
-CO
2/ye
ar
BEYOND INVENTORYGHG INVENTORY
780
1,990
7.6 times more than the inventory for water
and wastewater
The findings of this study are:
o Energy and water efficiency improvements for end users offer by far the largest potential for reducing emissions throughout Santa Rosa’s municipal water cycle.
o Electric energy efficiency improvement in water delivery and treatment operations is a cost-effective method for reducing GHG emissions. The City is currently investigating improving the efficiency of the pumps in the reclamation system.
o For Utility Department operations, increasing the amount of electricity generated from biogas produced at the Laguna Treatment Plant is the most cost effective option for creating more “carbon-free” electricity. In addition, currently unused heat created in co-generation can potentially be used to reduce the amount of grid electricity and natural gas required for wastewater treatment.21
o The most cost-effective method for decreasing emission intensity of electricity used for water supply and wastewater treatment, as well as for end use, can be found through investigating the variety of options for increasing the percentage of renewable power generation resources in the grid fuel mix. These options are discussed in more detail in Section 5.
20 Described in Appendix C. 21 Complete description in Rosenblum Environmental Engineering report (Appendix C).
Santa Rosa Utilities Greenhouse Gas Study 17
3.0 BASELINE
3.1 Systems Framework
Water use, energy use, and greenhouse gas emissions: these factors are connected with decisions and events that the City of Santa Rosa and its citizens may affect in many ways. This study is organized around a systems framework so the story of municipal water use and greenhouse gas emissions may be grasped comprehensively. This will help reveal the relative value of changes introduced at various points in the system, and suggest where the City might focus its efforts for greatest effect.
3.1.1 Municipal Water Cycle The municipal water cycle is a subset of the larger hydrologic cycle that occurs in nature. The principal elements, and their connection with GHG emissions, include:
• Water Supply: Water is extracted from natural sources (principally the Russian River; also groundwater wells in the Santa Rosa plain) and delivered to the City’s system via electrically-driven pumps;
• Water Distribution: Water is distributed, with assistance from more electrically powered pumps, to all utility customers;
• End Use: Most of the City’s customers apply additional energy for water-related uses – mainly heating, and also motor drive power (e.g., clothes washers) pressurization, or cooling;
• Wastewater Collection: Wastewater is collected and transported, with pumping assistance, for treatment;
• Wastewater Treatment: Wastewater treatment (pumping and aeration) and disinfection (electrically driven process);
• Recycled Water Distribution: Treated effluent is pumped to storage ponds and then to reclamation sites or to the pipe that leads to the Geysers;
• Discharge: Pumped for urban irrigation or electricity generation via geothermal steam turbines at the Geysers; or discharge to the Laguna.
The following schematic (Figure 7a) depicts these elements. Prime responsibility for decision-making within each element is indicated by its color (those elements exclusively under control by the City of Santa Rosa are denoted by a rose shade and are enclosed within a dashed line).

3.0 Baseline
Santa Rosa Utilities Greenhouse Gas Study 18
Figure 7a
While this study focuses upon the elements of the water cycle that are controlled directly by the City of Santa Rosa, the overall GHG emission baseline was completed by adding data about SCWA’s water supply (estimated in a companion study recently released by the Climate Protection Campaign), and End Users (contributed by Resource Performance Partners, Inc.). This information is summarized in Table 1, and is depicted by Figures 7b and 8 below.

3.0 Baseline
Santa Rosa Utilities Greenhouse Gas Study 19
3.1.2 Baseline GHG Emissions Table 1
VOLUME VOLUMEMG/yr ton/MG tons/yr MG/yr ton/MG tons ton/MG tons
WATER SUPPLYSCWA (Santa Rosa's portion) 7,460 0.27 1,990City of Santa Rosa
Groundwater Pumps 10 1.0 10 n.a n.a n.a.Booster Pumps 7,470 0.10 770 n.a n.a n.a.
Subtotal Santa Rosa 7,470 0.10 780 n.a n.a n.a.Subtotal Water Supply 0.37 2,770
END USEIndoor Residential n.a n.a n.a. 3,625 21 74,350Indoor Commercial n.a n.a n.a. 1,058 6.7 7,094
Subtotal End Use n.a n.a n.a. 4,683 17.4 81,444 17.4 81,444WASTEWATER
Pumping (Lift Stations) 6,450 0.01 60 n.a n.a n.a.Treatment (SR portion) 6,450 1.14 7,363 n.a n.a n.a.Treated Effluent Discharge
Reclaim (Urban) 1,920 0.48 920 n.a n.a n.a.Geysers 3,800 0.31 1,170Russian River Discharge 700 0.00 0 n.a n.a n.a.
Subtotal Discharge 6,420 0.33 2,090 n.a n.a n.a.Subtotal Wastewater 6,420 1.48 9,513 1.47 9,513
TOTAL 10,293 93,727
GHG (eCO2)
3. The annual wastewater volume, in addition to the wastewater reported above, includes 1,660 MG of water that leaked into the collection system ("Infiltration and Inflow"). These volumes were developed from city data by the Climate Protection Campaign. The wastewater volume developed by this means is 2% greater than that given in the 2005 UWMP.
not included in this report
Notes1. Annual Greenhouse Gas (GHG) emissions are summarized above for fossil energy consumption directly associated with municipal water use within the City of Santa Rosa (e.g., for pumping and heating water, and treating wastewater). Wastewater services for Subregional System partners are excluded, as are support activities such as vehicle use, building heating, and embodied energy in materials).
4. Treated Effluent Discharge: This reports only GHG emissions associated with pumps operated by the City of Santa Rosa. Most of the energy required to pump treated effluent to the Geysers is supplied by Calpine and is not included above. The small amount of pumping for Russian River Discharge is included within energy charged to Treatment.
2. End Use activities are those that give rise to GHGs on the customer's side of the water meter (e.g., natural gas and electricity used to heat, pressurize, chill, move, and otherwise support the services provided by municipal water). This reports GHGs associated with two of the three principal end use categories by which water delivery is reported in Santa Rosa (Residential and Commercial). Minimal end use GHG emissions are assumed for Irrigation (the third category). Water usage volumes for End Users are those reported the City of Santa Rosa's 2005 Urban Water Management Plan (UWMP).
CITY OF SANTA ROSA WATER & WASTEWATER SERVICESGreenhouse Gas Emisssions for Calendar Year 2005
CONTROLLED BY OTHERS
GHG (eCO2)ACTIVITY
CONTROLLED BY CITY OF SANTA ROSA TOTAL GHG
GHG (eCO2)
The most GHG-intensive aspect of the municipal water system under direct control of the City is wastewater treatment (1.14 tons of eCO2 emitted per million gallons), followed by pumping reclaimed water to agricultural and urban uses (0.48 tons/MG), and then pumping to the Geysers system (0.31 tons/MG). Ground water pumping may also be important (the coefficient

3.0 Baseline
Santa Rosa Utilities Greenhouse Gas Study 20
appears to be 1.0 ton/MG), but usage is so low that the data are not representative of continuous operation.22 At a larger level, the unit emission associated with water supply is 0.37 tons/MG. Reclaimed wastewater, due principally to the required treatment, is approximately four times more climate-intensive (1.63 tons/MG) than the water supplied from SCWA. These emission coefficients are dwarfed, however, when energy applied to indoor water by end users is considered (17.4 tons/MG). These emission coefficients are summarized on Figure 7. Total annual emissions for the three major categories in the water cycle are shown in Table 2. Put another way, this means that a reduction of approximately 12% in the water-related emissions of Santa Rosa’s end users would offset all emissions presently associated with Santa Rosa’s water and wastewater infrastructure (~10,000 tons/yr). Total annual emissions for water supply, wastewater, and end use are illustrated in Figure 8. Finally, there is consideration of the effect upon greenhouse gas emissions of reclaimed water that is pumped to the Geysers steamfield (covered in depth in Appendix C of this report). A considerable amount of electricity is provided by Calpine to power the main pumps. This electricity has a low emission coefficient, but when used to drive these pumps it is unavailable to displace grid electricity with a higher GHG impact. Upon discharge into the geothermal steamfield, however, Santa Rosa’s reclaimed water is expected to generate more steam-generated 22 This may change as Water Agency withdrawals from the Russian River are restricted.
Fig. 7b
SANTA ROSA MUNICIPAL WATER CYCLEUnit GHG Emissions
0
4
8
12
16
20
SCWA Supply
City W
ells
City B
ooste
rs
Indoo
r Use
W/W C
ollec
tion
W/W Trea
tmen
t
W/W D
ischa
rge
Ton
eCO
2/MG
ton eCO2/MG
Fig. 8
SANTA ROSA MUNICIPAL WATER CYCLE 2005 GHG Emissions (~94,000 tons eCO2)
2,770
81,444
9,963Water SupplyEnd UseWastewater
SANTA ROSA MUNICIPAL WATER CYCLE 2005 GHG Emissions (~94,000 tons eCO2)
2,770
81,444
9,513Water SupplyEnd UseWastewater
Fig. 8

3.0 Baseline
Santa Rosa Utilities Greenhouse Gas Study 21
electricity than consumed to deliver it. Under the rules of GHG accounting, however, this benefit will appear on Calpine’s books, not the City’s.
3.2 City of Santa Rosa Opportunities for Intervention
Table 2
OPPORTUNITIES FOR INTERVENTION
Focus Area Realm of Action
Strategy Comments Santa Rosa
Multi Agency Community
Water Cycle
Water Supply
Coordinate pumping; reduce aqueduct friction to minimize electrical demand during peak afternoon hours
Electricity provided during peak hours is generally the most costly and GHG-intensive
Water Distribution Improve pump efficiency
End Use
Improve water efficiency (especially hot water); upgrade to solar water heating; provide rain harvesting and onsite reuse where appropriate
This strategy uniquely leverages GHG savings across the entire water cycle. May be leveraged by Subregional Partners.
W/W Collection Improve pump efficiency,
reduce I&I
W/W Treatment Improve plant efficiency;
generate more biogas
Specialized high solids food waste digester may be helpful
Effluent Distribution Improve pump efficiency;
adjust destination
Other
Energy Purchase Purchase electricity with
lower GHG content
Most leverage at community scale (e.g., develop CCA)
GHG Offsets Invest in GHG reductions created elsewhere in local economy
May be lower cost while leveraging local benefits (e.g., dairy manure digesters)
Overhead Reduce GHG in buildings, vehicles, employee commute, etc.
Maintain an internally consistent, comprehensive effort

Santa Rosa Utilities Greenhouse Gas Study 22
4.0 GHG REDUCTION STRATEGIES GHG reduction may be accomplished via two principal pathways: (1) reducing the demand for energy that gives rise to GHG emissions, and (2) reducing the GHG content or “carbon intensity” of energy used within the system.
4.1 Reduce Energy Demand
Reducing energy demand within the water cycle can be accomplished in two ways: 1) improving efficiency of conveyance, distribution, treatment and recycling systems; 2) reducing overall flow through the water cycle by improving end user water efficiency, and water-related energy efficiency.
4.1.1 Infrastructure Directly Controlled by City Wells, distribution pumping, tanks, wastewater collection system, wastewater treatment, water recycling systems are all directly under the control of the City of Santa Rosa. The energy efficiency of these systems has been carefully examined by numerous studies. Over time, many measures have been taken to improve the efficiency of these systems. As components such as pumps and motors become obsolete or worn out, they are generally replaced with more efficient, more modern units. However, it is generally more cost-effective to replace inefficient units before burnout, due to cost savings on energy use.
4.1.1.1 Water Supply
The water supply system for the City of Santa Rosa is well run and fairly efficiently. Probably the greatest opportunity for emission/energy reduction lies in participating in tank level management with the Water Agency. If appropriate instrumentation data is available from the City to the Agency, the Agency can manage its pumping schedules such that storage tanks are maintained at safe levels, with a minimum amount of energy used for on-peak pumping. Overall, if the Agency can reduce peak flows through its system, it will use less energy. This has a benefit for the City, in that water should be able to be delivered at a lower cost. This strategy is discussed in more detail in Section 4.1.2.1.
4.1.1.2 Wastewater
A major issue with reducing wastewater flow to the Laguna Treatment Plant is the need for a minimum flow and solids level to maintain efficient operation of the plant. Also, a tremendous amount of energy is expended to deal with treated wastewater, either through the reclaimed water distribution system, or to the Geysers pipeline.
4.1.2 Infrastructure Indirectly Controlled by City The City water use patterns and water reserve requirements have an upstream effect on the energy use of the Sonoma County Water Agency. Through coordination with the Agency peak flows can be “smoothed out,” which give an overall energy savings on the conveyance side.
4.0 GHG Reduction Strategies
Santa Rosa Utilities Greenhouse Gas Study 23
Coordination with Subregional partners can also provide GHG reduction on the downstream side of the water cycle. Cooperation on green electricity purchasing schemes and distributed wastewater flow and solids reduction can increase reduction in GHG emissions.
4.1.2.1 Water Supply: Interaction with SCWA
According to a study by Climate Protection Campaign done for the Sonoma County Water Agency23, pumping energy can be reduced by reducing peak flow requirements. As recommended in this study, “In the long term, to help coordinate load management, it would be prudent to install flowmeters and power meters (on the contractor side) and link them to SCWA’s SCADA system. It would also be worthwhile linking to level gauges in the contractors’ storage tanks to enable effective coordination of demands.” Full sharing of SCADA data from the contractor system with the Agency would enable the Agency to plan its pumping schedule to reduce peak flows through the system. This reduces overall energy use and GHG emissions by the Water Agency. Reducing energy use due to peak flows would lower costs to the Agency, which could conceivably be passed on to the contractors. Tank level management is a key element of reducing peak flows, and pumping during peak energy price periods. According to the previously mentioned study, “Creat(ion) of new storage/emergency procedures with fire-prevention agencies” in the contractor service territories would enable a probabilistic “real time” evaluation of required storage tank levels. To the extent that tank levels could be maintained based on real time fire danger probabilities, rather than absolute worst case scenarios, significant GHG emissions reduction could be obtained.
4.1.2.2 Wastewater Management: Interaction with Subregional Partners
Onsite low carbon energy production to operate the Laguna Treatment Plant represents an opportunity to leverage the Subregional partnership. Biomass feedstock from both agricultural waste and food waste can be culled from the Subregional service territory. This additional feedstock could be used in an auxiliary digester(s) to augment biogas production and increase electricity production. Creation of the auxiliary digester facility, along with expanded cogeneration capacity could be cost effectively accomplished using funding available through the creation of a regional Community Choice Aggregation (CCA), as described in Appendix A. , a CCA may issue municipal revenue bonds to fund construction of new renewable generation resources. This method of funding electricity generation projects enables a much lower cost of construction than private capital sources, at a very low risk. Even solar photovoltaic installations, typically the highest cost renewable energy generation technology, can produce electricity at a nearly competitive price when financed with revenue bonds. The CCA has other benefits that can be extended to Subregional partners. For example, low cost satellite treatment plants that have anaerobic digester/combined heat and power installations could be funded by the CCA. This would enable flows to be reduced to the Laguna Treatment Plant, without negatively impacting the operation of the plant.
23 Greenhouse Gas Emissions from Water Supply Operations: Current Inventory and Potential Reductions, 2007, Climate Protection Campaign and Rosenblum Environmental Engineering
4.0 GHG Reduction Strategies
Santa Rosa Utilities Greenhouse Gas Study 24
4.1.2.3 End Use Water Efficiency
Activities on the customer’s side of the water meter bear directly upon the total amount of GHGs emitted due to water use in Santa Rosa. The volume of water and wastewater moved by the City, and to some extent the mass of pollutants it removes, is determined largely by decisions made by developers, owners, and tenants as they design, purchase, use, and maintain water-related equipment, services, and landscapes. Additionally, most customers use fossil energy to heat water, and some also to chill, move, or further treat it, thus giving rise to water-related GHG emissions beyond those directly attributable to the City’s utility operations. This section reviews the magnitude of the former emissions, the City’s efforts to improve their customer’s water efficiency, and prospects for reducing GHG emissions on both sides of water meters via further improvements in efficiency.
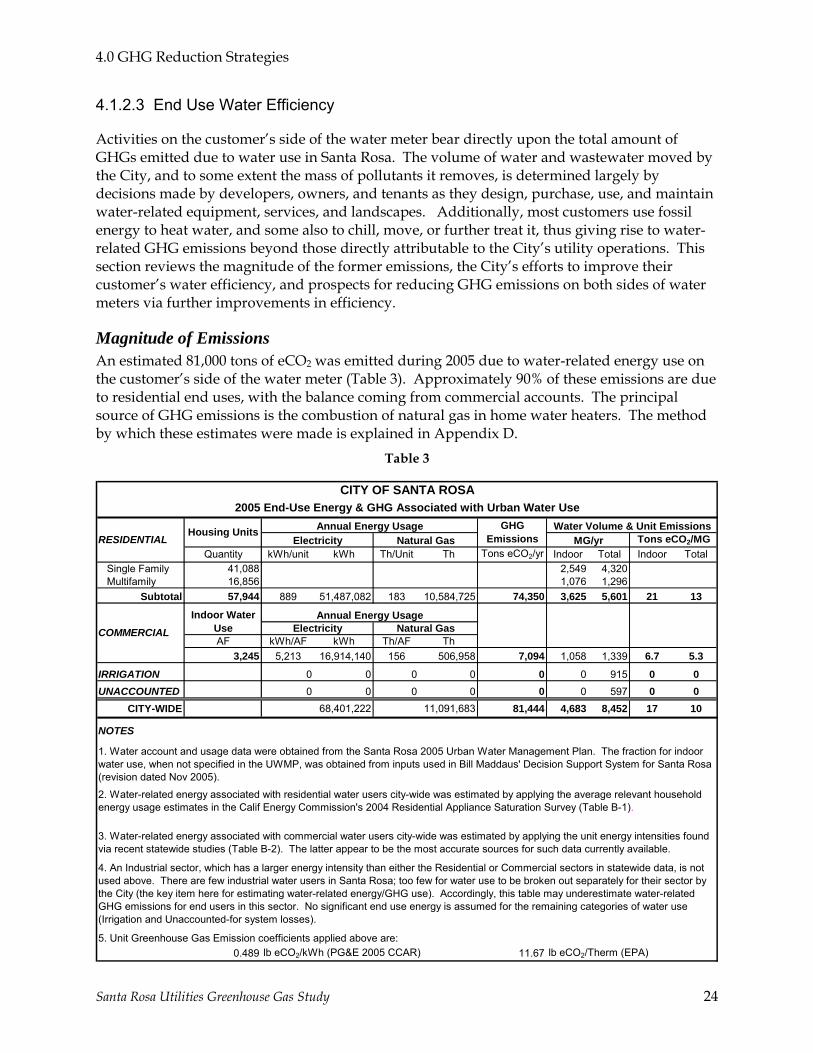
Magnitude of Emissions An estimated 81,000 tons of eCO2 was emitted during 2005 due to water-related energy use on the customer’s side of the water meter (Table 3). Approximately 90% of these emissions are due to residential end uses, with the balance coming from commercial accounts. The principal source of GHG emissions is the combustion of natural gas in home water heaters. The method by which these estimates were made is explained in Appendix D.
Table 3
Quantity kWh/unit kWh Th/Unit Th Tons eCO2/yr Indoor Total Indoor TotalSingle Family 41,088 2,549 4,320Multifamily 16,856 1,076 1,296
Subtotal 57,944 889 51,487,082 183 10,584,725 74,350 3,625 5,601 21 13
AF kWh/AF kWh Th/AF Th3,245 5,213 16,914,140 156 506,958 7,094 1,058 1,339 6.7 5.3
IRRIGATION 0 0 0 0 0 0 915 0 0UNACCOUNTED 0 0 0 0 0 0 597 0 0
CITY-WIDE 68,401,222 11,091,683 81,444 4,683 8,452 17 10
NOTES
0.489 lb eCO2/kWh (PG&E 2005 CCAR) 11.67 lb eCO2/Therm (EPA)
Water Volume & Unit EmissionsMG/yr
Indoor Water Use Electricity
RESIDENTIAL
CITY OF SANTA ROSA2005 End-Use Energy & GHG Associated with Urban Water Use
Annual Energy UsageElectricity Natural Gas
GHG EmissionsHousing Units Tons eCO2/MG
5. Unit Greenhouse Gas Emission coefficients applied above are:
1. Water account and usage data were obtained from the Santa Rosa 2005 Urban Water Management Plan. The fraction for indoor water use, when not specified in the UWMP, was obtained from inputs used in Bill Maddaus' Decision Support System for Santa Rosa (revision dated Nov 2005).
Natural Gas
4. An Industrial sector, which has a larger energy intensity than either the Residential or Commercial sectors in statewide data, is not used above. There are few industrial water users in Santa Rosa; too few for water use to be broken out separately for their sector by the City (the key item here for estimating water-related energy/GHG use). Accordingly, this table may underestimate water-related GHG emissions for end users in this sector. No significant end use energy is assumed for the remaining categories of water use (Irrigation and Unaccounted-for system losses).
COMMERCIAL
2. Water-related energy associated with residential water users city-wide was estimated by applying the average relevant household energy usage estimates in the Calif Energy Commission's 2004 Residential Appliance Saturation Survey (Table B-1).
3. Water-related energy associated with commercial water users city-wide was estimated by applying the unit energy intensities found via recent statewide studies (Table B-2). The latter appear to be the most accurate sources for such data currently available.
Annual Energy Usage

4.0 GHG Reduction Strategies
Santa Rosa Utilities Greenhouse Gas Study 25
Water Efficiency Efforts to Date The City of Santa Rosa, particularly as the result of its “Go Low Flow” program, leads the region in water efficiency. The success of the City’s efforts is borne out by data that reveals its single family sector as the most water-efficient among the Water Agency’s principal contractors (Fig. 9). The City of Santa Rosa’s 2005 Urban Water Management Plan reports the following facts about water conservation achievements to date: 1998: Santa Rosa signs CUWCC MOU
BMP 1: Relative to 1995 housing stock, City Staff has completed surveys on 50% (11,037 each) of SFRs and 56% of all MFR units. Savings total 1,846 AF for 1994-2004.
BMP 2: Low-flow showerheads and faucet aerators installed for 87% and 76% of all SFR and MFR customers, respectively. Savings total 597 AF for 1994-2004
BMP 3: UAW < 6% for 7 years. Informs customers of leaks suspected via billing records.
BMP 4: Provides water meters for all new connections, and billing by volume.
BMP 5: Water budgets determined for 93% of all dedicated irrigation accounts. Rebates provided for customer irrigating below goal; also for replacing mixed use meters. Working to develop ET budgets for all customers via remote sensing. Savings total 3,839 AF for 1994-2004
BMP 6: City offers rebates for residential washing machines ($100-$150 for residential depending upon efficiency). Savings total 147 AF for 1998-2004 via >5,000 rebates.
BMP 7: City conducts an extensive public information campaign. Savings not estimated.
BMP 8: City conducts an extensive school education program. Savings not estimated.
BMP 9: Replaced ~ 4,356 toilets, showerheads, and aerators at 1,041 CII sites. Since 1996, offers $100 for every 1,000 gl/mo of sustained water savings via process or hardware changes. Restaurant, commercial kitchen, and laundromats can qualify for a reduced wastewater
Fig. 9
Source: SCWA Draft 2005 Urban Water Management Plan (Table 4)
PER CAPITA WATER USEResidential Single Family Detached Homes
0
40
80
120
160
Santa
Rosa
Petalum
a
Wind
sor
North
Marin
Rohne
rtPar
k
Valley
of th
e Moo
n
Cotati
Fore
stville
Sonom
aga
llons
per
per
son-
day
Figure 9
Source: SCWA Draft 2005 Urban Water Management Plan (Table 4)
PER CAPITA WATER USEResidential Single Family Detached Homes
0
40
80
120
160
Santa
Rosa
Petalum
a
Wind
sor
North
Marin
Rohne
rtPar
k
Valley
of th
e Moo
n
Cotati
Fore
stville
Sonom
aga
llons
per
per
son-
day

4.0 GHG Reduction Strategies
Santa Rosa Utilities Greenhouse Gas Study 26
demand fee via participation in the “Best Available Technologies” Program. 363 H-axis commercial washing machines rebated at $300 - $450/machine through June, 2005. 352 ea 1.6 gpm pre-rinse nozzles installed (CPUC program). Savings total 3,575 AF for 1994-2004
BMP 10: Not applicable.
BMP 11: 85% of water and wastewater revenue is obtained via volumetric fees. Increasing block rate to be implemented in 2007. Santa Rosa has the lowest water use in the single family sector in the region.
BMP 12: Four full time conservation staff, including a water conservation technician.
BMP 13: Water waste prohibition in effect
BMP 14: Residential ULFT: program run from 1995–2002. Replaced 41,981 toilets (29,941 in 17,575 SFR and 12,490 in 2,723 MFR accounts). Of all 3.5+ gpf residential toilets, the City replaced 47% of those in SFRs and 60% in MFRs. Savings total 8,847 AF for 1994-2004.
Prospects for Further Improvements in Efficiency Further improvements in end use efficiency will provide GHG benefits by reducing the volume of water that must be pumped through the system, and by reducing water-related fossil energy demands at points of use. The remaining opportunity for efficiency improvements can be understood by first considering the projected increase in population and water use. Baseline estimates presented in Santa Rosa’s 2005 Urban Water Management Plan indicate increases of 34% and 37% for population and water, respectively, between 2005 and 2030 (Figure 10).24 Water use as presented here rises faster than population: that is, water use overall may become slightly less efficient over time.
24 Figure 10 reflects all water supplied, including distribution system losses (“Unaccounted for Water”)
Figure 10
City of Santa Rosa
0
50,000
100,000
150,000
200,000
250,000
2000 2005 2010 2015 2020 2025 2030 2035Source: Santa Rosa 2005 UWMP (Tables 3-1 & 3-4)
Pop
ulat
ion
0
10,000
20,000
30,000
40,000
50,000
Tota
l Wat
er U
se (A
F/yr
)Population
Water Use
Figure 10
City of Santa Rosa
0
50,000
100,000
150,000
200,000
250,000
2000 2005 2010 2015 2020 2025 2030 2035Source: Santa Rosa 2005 UWMP (Tables 3-1 & 3-4)
Pop
ulat
ion
0
10,000
20,000
30,000
40,000
50,000
Tota
l Wat
er U
se (A
F/yr
)Population
Water Use
4.0 GHG Reduction Strategies
Santa Rosa Utilities Greenhouse Gas Study 27
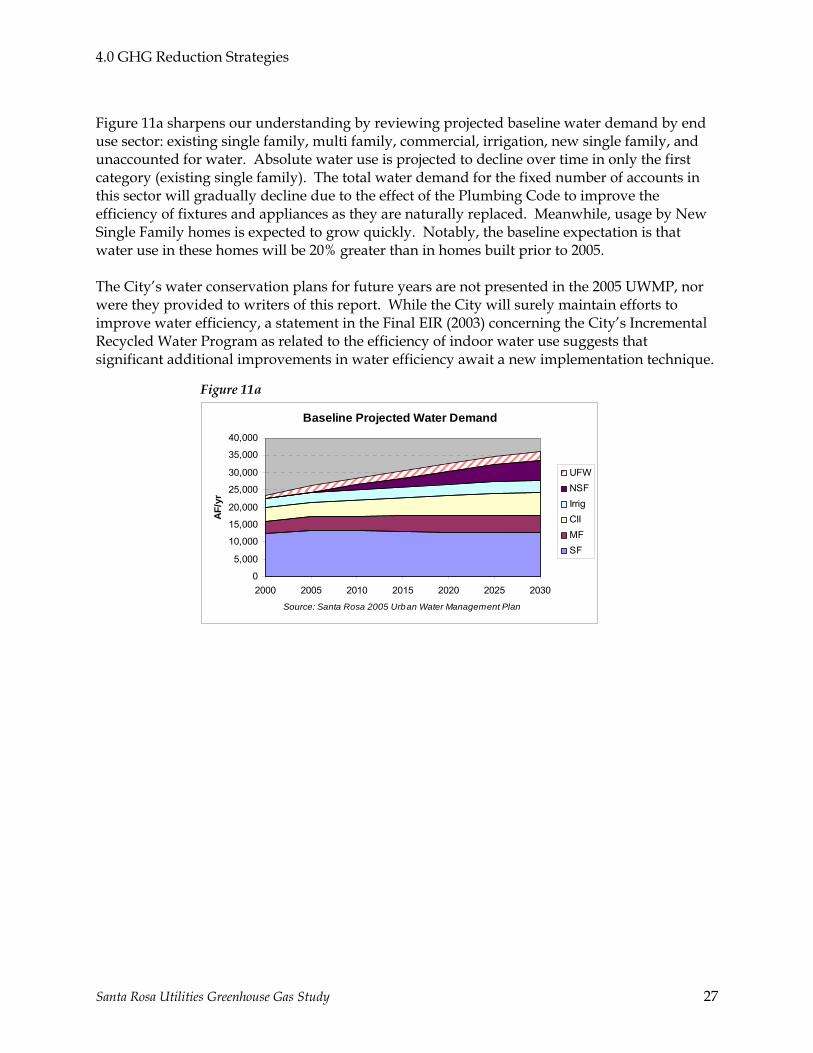
Figure 11a sharpens our understanding by reviewing projected baseline water demand by end use sector: existing single family, multi family, commercial, irrigation, new single family, and unaccounted for water. Absolute water use is projected to decline over time in only the first category (existing single family). The total water demand for the fixed number of accounts in this sector will gradually decline due to the effect of the Plumbing Code to improve the efficiency of fixtures and appliances as they are naturally replaced. Meanwhile, usage by New Single Family homes is expected to grow quickly. Notably, the baseline expectation is that water use in these homes will be 20% greater than in homes built prior to 2005. The City’s water conservation plans for future years are not presented in the 2005 UWMP, nor were they provided to writers of this report. While the City will surely maintain efforts to improve water efficiency, a statement in the Final EIR (2003) concerning the City’s Incremental Recycled Water Program as related to the efficiency of indoor water use suggests that significant additional improvements in water efficiency await a new implementation technique.
Figure 11a
Baseline Projected Water Demand
0
5,000
10,000
15,000
20,000
25,000
30,000
35,000
40,000
2000 2005 2010 2015 2020 2025 2030
Source: Santa Rosa 2005 Urban Water Management Plan
AF/
yr
UFWNSFIrrigCIIMFSF
4.0 GHG Reduction Strategies
Santa Rosa Utilities Greenhouse Gas Study 28
Growth of Average Dry Weather Flow from 1992 to 200225
As pointed out by several commenters, average dry weather flow (ADWF) at the Laguna Plant was less in 2002 (16.8 mgd) than in 1992 (17.6 mgd). Looking at the trend over these ten years more carefully, ADWF grew irregularly but slightly until 2000 (18.1 mgd), and then declined the last two years. Both population and employment grew substantially during this time, but wastewater growth was kept low due to effective indoor water conservation techniques such as low flow toilets and an aggressive toilet replacement program. Most indoor water savings were realized by the year 2001 in the City of Santa Rosa, the primary source of the flow. Although new water conservation techniques will be used by each of the Subregional System members in the future, gains in indoor conservation are expected to be small compared to those of the past 10 years. The City has already completed implementation of the Go Lo Flow toilet program. The City plans to continue to implement this program, but further reductions in flow are expected to be modest. New techniques or policies may emerge that have as great a potential for success as the City’s Go Low Flow toilet program. If so, the City will consider implementing such effective techniques or policies. At this time, however, the City is not aware of such techniques or policies. For purposes of projecting future wastewater flows, it would be imprudent to assume that techniques or policies with an equal potential for reduction in wastewater flow will be discovered.
Do sufficient opportunities remain to warrant considering a new technique for implementing water efficiency? One way to answer this is to compare single family indoor water use in Santa Rosa to the average found in the nation, and to that measured before and after comprehensive, professionally documented retrofit projects that replaced toilets, clothes washers, faucet aerators, and showerheads. As illustrated in Figure 11b below, these data indicate two things: (1) indoor usage in Santa Rosa single family homes, despite the extensive retrofits, apparently differs little from the US average; and (2) to the extent it is possible to widely implement improvements of the type modeled in Seattle, Oakland, and Tampa, there is a significant opportunity for water savings in this sector alone for Santa Rosa.26
25 Copied verbatim from Incremental Recycled Water Program, Final Environmental Impact Report, Response to Comments, Volume 1 of 3, October 2003: page H-2 (emphasis added). 26 Data in for all four reference studies – the best available of this type in the United States – were developed by Aquacraft, Inc. The successive demonstration retrofits in Seattle, Oakland, and Tampa, which employed better equipment in each city, achieved successively higher savings percentages. Although post retrofit savings measurements were made too soon to capture inevitable leakage from toilets, and thus may be judged as overstated, the use of flapperless toilets, or scheduled “tune-ups” (to replace flapper valves and perform other maintenance or upgrades), will maintain savings at a high level.

4.0 GHG Reduction Strategies
Santa Rosa Utilities Greenhouse Gas Study 29
Figure 11b
New Efficiency Implementation Technique A new approach has been developed that enables utility customers, vendors, and capital providers, each acting in their own interest, to produce extensive and unprecedented investment in resource efficiency. Customers include renters, developers, and building owners — anyone who either owns or occupies a building and pays a utility bill. Called Pay As You Save®, or PAYS®, this is a system — with a set of market rules, a tariff, and a certification process.27 Now used by two electric utilities in New Hampshire, three in Hawaii, and being considered by others, it may also be applied to water utility service. PAYS® was designed to remove the barriers that thwart customers from purchasing proven cost effective resource efficiency products and saving money. With a PAYS®-based system in place, customers have:
• No up-front payment, no debt obligation, no credit checks, no liens;
• A guarantee that their monthly charge is lower than their estimated savings;
• The assurance they will pay only while they remain at the location; and
• A promise that failed measures will be repaired or the payment obligation will end. The PAYS® system includes qualified vendors to deliver and support high performance products, a lender to finance them, the utility billing system adjusted to collect payments for efficiency service from each meter served, and a third-party certification agent to ensure proper service delivery (the latter service could be provided by utility conservation staff). Fees for service under this system run with the meter. This means that only the current occupant (and successor occupants) – those who benefit from efficiency service provided to that location – pay
27 For additional information about this system, see Appendix B or visit www.PAYSAmerica.org.
Residential Indoor Water Usage
0
20
40
60
80
100
US avg1999
Seattle1999
Oakland2001
Tampa2003
gallo
ns /
pers
on-d
ay
PrePostSR ExistingSR New

4.0 GHG Reduction Strategies
Santa Rosa Utilities Greenhouse Gas Study 30
for it. This innovation enables people to purchase cost-saving efficiency services even when they are uncertain if they will remain at a location long enough to repay their investment. The PAYS® system is designed to eliminate the principal barriers that impair transactions within the efficiency marketplace. These include concerns about initial cost, payback, product and vendor performance, educational issues, and the unwillingness of a developer or a building owner to purchase efficiency equipment when they do not pay the follow-on utility bills (or a renter to upgrade an owner’s property). The PAYS® approach eliminates those barriers, and shifts the product procurement focus from lowest initial cost to highest lifecycle value. Furthermore, vendors would be sought via a bid process to assure bulk prices and quality service for customers. This system can help Santa Rosa’s water and wastewater utilities save money on: (1) incentives (no longer required for measures that are cost-effective for their customers); (2) program overhead, because efficiency programs will be simpler to manage; and most importantly (3) supply-side infrastructure projects that may be avoided when water demand is more easily and rapidly reduced. This should reduce water demand more than by standard methods, and therefore GHG emissions as well from water supply and wastewater services.
Performance of PAYS®-type Implementation System One of the principal attractions of the PAYS® approach to implementation is that it unleashes the power of a freely-flowing market to achieve high participation rates. While the traditional method of a financial incentive (via money transferred from all ratepayers to participants) is useful, either by itself or particularly when integrated with the PAYS® system, it addresses few of the implementation barriers, and is effective only until program funds are exhausted. In contrast, capital is not limited with the PAYS® approach, and customer acceptance of offers is encouraged by trying to make them too good to refuse. As an example, the opportunity to offer indoor water efficiency measures to occupants of single-family detached homes in Santa Rosa was studied during the preparation of this report (details are provided in Appendix F). This sector was selected because:
• It is the largest single category of water use within the City;
• Water and energy consumption is relatively well understood for indoor water uses, which makes it easy to represent in a financial model; and
• City documents indicate that relatively little incremental improvement in water efficiency is expected following the success of the “Go Low Flow” campaign.
The study summarized in Appendix F indicates that even if the City water utility were to offer no rebates whatsoever, the occupants of the average single-family home, regardless if they own or rent, can save more than they pay each year for the purchase of one high efficiency (1 gl/flush) toilet, a full-sized premium clothes washer, leak repairs, and possibly the installation of an on-demand hot water circulation system.28 To upgrade a home with this equipment
28 This assumes other water efficiency products have already been installed in the average home due to the City’s “Go Low Flow” program.
4.0 GHG Reduction Strategies
Santa Rosa Utilities Greenhouse Gas Study 31
would reduce per capita indoor water use by an estimated 40% from its regional leading value of 65.5 to approximately 40 gpd. Total annual savings per house under this scenario would be approximately $210 (net) for the customer, 26,000 gallons, and 1,150 lb eCO2. Put another way, this suggests that if just half the single-family home customers in Santa Rosa accepted this no-initial cost upgrade package from local vendors, the following could occur:
• GHG emission reduction of approximately 11,000 tons/yr (slightly more than all present emissions from the City’s water and wastewater operations)
• $34 million worth of services rendered
• Net cash savings of $4.2 million per year for participating City water customers The financial model developed for this study follows the rules established for PAYS®. Provision of equipment is subject to assuring that the annual cost for the package of installed measures will not exceed 75% of the annual savings. Annual cost includes the annual principal and interest for all measures, including overhead; with the financial term limited to 75% of normal measure lifetime. Annual savings are the total of water, wastewater, natural gas, and electricity fees for the customer at the rates in effect at the time of service. When in service for Santa Rosa, savings estimates will be made for each customer by an algorithm approved by the Certification Agent (a third party); and vendors will post a bond against their failure to follow it. Customers are further protected by provisions to repair or replace non-functioning equipment, and to suspend billing for such measures when no benefit is provided. There is insufficient experience to estimate the percentage of water utility customers who will accept such offers, although a third-party review of early results from the pilot programs for the New Hampshire electric utilities is encouraging.29 Homeowners (offered compact fluorescent lamps and weatherization services) and municipal customers (street lights) purchased more services through this approach than via traditional programs. The example of applying the PAYS® system to improving indoor water efficiency for existing single family homes may be replicated for all other water-using sectors for which proven technologies or strategies are available that are cost-effective for the customer. This includes indoor and outdoor services for single family, multi family, and commercial customers. Sub-metering (a water saving measure by itself) in would be necessary under PAYS® for locations currently billed through a master meter. Water efficiency services under the PAYS® system may also be extended to new construction. This is an important intervention, for it is far less expensive to fund incremental improvements (e.g., the difference in cost between premium and code-compliant equipment) than it is to fund the complete replacement of equipment as a retrofit later. With the PAYS® system in place, developers would be spared the show-stopping burden of driving up their costs to improve hard-to-sell lifecycle value for their tenants. Instead, they would be paid up front by a third-party lender to make such improvements when they can be shown to be cost-effective over their lifetime for building occupants. Those occupants would pay for the improvements later, over
29 http://www.paysamerica.org/Pilot_Programs/pilot_programs.html
4.0 GHG Reduction Strategies
Santa Rosa Utilities Greenhouse Gas Study 32
time, on their water bill, while benefiting by savings on all resource bills. Furthermore, at the time of sale, sellers would have third-party documentation attesting to the net benefits. The PAYS® implementation system may also be enhanced with investment on the utility side of the meter, particularly for water utilities such as Santa Rosa’s. If the growth of water demand (and GHG) cannot be checked, the city will face steeply rising financial costs, among other risks (e.g., those of concern to Seattle Public Utilities, as described below) . Consequently, it is prudent for the City to invest to save water when this is the most attractive option. In this case, such an investment is not a subsidy – it is a strategy to help develop the least expensive source of water available to the City: that used (or going to be used) by its customers. Investment by the City will add to the large potential water savings already cost-effective for customers (as determined for residential customers in Appendix F). For example, this could make cost-effective some of the emerging efficiency technologies outlined in Appendix G, such as onsite wastewater treatment and reuse in new high rise residential buildings.
Demand Reduction from the Utility Financial Perspective When total system throughput (i.e., water demand, or wastewater flow) is reduced below the level anticipated when rates were established, it is generally true that a rate increase is necessary to maintain revenue requirements. Rate increases are, of course, unappealing for obvious political reasons, and are generally avoided whenever possible. For that reason, high performance efficiency services always appear at odds with good management, for they are tantamount to high rates. It is helpful to consider financial performance from the perspective of costs, not rates. For example, what will it cost per year for the next twenty years to operate the utility with and without a high performance efficiency services program in place? And, what will the average cost per customer be for each of those years? Ideally, utility planning includes estimates of such cost curves for various scenarios. While the scope of this study does not allow developing such curves, the concept may be addressed qualitatively. If the City’s improved efficiency services are able to reduce demand, costs should decline relative to the default scenario. This is due to reduced operating costs (e.g., less water, less energy, and less need for customer product rebates as market barriers are removed). Additionally, the capital cost of new infrastructure otherwise needed to keep pace with rising throughput will be reduced, if not avoided altogether. The latter costs are typically large. When improved efficiency services enable overall utility costs to fall relative to the baseline scenario, less money is needed from customers. Although rates may be higher, bills will generally be less (note: Customer Bill = Fixed Fees + (Variable Rate x Volume)). The total bill is therefore the critical variable, not the rate by which that bill is calculated. To the extent rates rise as demand falls, the price signal to water customers will become stronger. Those who have not purchased efficiency services will increasingly feel inclined to do so. Rising rates will also enable more efficiency measures to become cost-effective, thereby increasing the ability to further reduce demand and overall costs. Meanwhile, the implementation system proposed enables customers to participate while enjoying positive cash

4.0 GHG Reduction Strategies
Santa Rosa Utilities Greenhouse Gas Study 33
flow. Therefore, higher rates create a positive feedback loop. Special consideration can always be made for the few customers who may be unable to participate. Financial performance is a subset of a larger set of performance metrics important to natural resource utilities today. For that reason, this section on End Use Water Efficiency concludes with a look at two exemplar cities: Seattle and Melbourne (Australia).
High Performance Municipal Water Resource Planning This section on End Use Water Efficiency concludes with a look at two exemplar cities: Seattle and Melbourne (Australia). The City of Seattle is a leader in the United States for embedding the principles of sustainability in its planning. This is reflected, if not anticipated, by water resource planning and the implementation of those plans by the Seattle Public Utilities. Figure 12 illustrates how total consumption and population broke its lockstep relationship early in the 1980s. Afterwards, total consumption began to decline even though population growth continued unabated. Why? SPU determined it was cheaper to save water than to develop the next sources of supply. They then began to create increasingly effective efficiency programs, which emboldened the next round of planning, and so forth (Figure 13).
Figure 12

4.0 GHG Reduction Strategies
Santa Rosa Utilities Greenhouse Gas Study 34
Figure 13 (Seattle Public Utilities)
SPU has become increasingly sophisticated with their understanding of risks (including global climate change) associated with water supply. Instead of asking “Why is conservation a priority for Seattle area water utilities?” they suggest: “What are the utility risks in not having successful conservation?” This reasoning is reflected in the triple bottom line analysis they now use in planning – a systems approach that goes beyond the traditional financial analysis to include social and environmental bottom line. A principal programmatic output at SPU is their program for reducing per capita water use by 1% per year between 2000 and 2010. Intended to offset demand growth, save salmon, and support system reliability among other objectives, this is featured in their most recent Annual Report.30 In Melbourne, Australia, perhaps Seattle’s antipodal conjugate, water planning is conducted with similar foresight. Melbourne Water, the largest water provider in this region of 3.6 million people, participated in a GHG study that identifies the risks ahead.31 Its current Annual Report identifies the goal of reducing GHG emissions by 2005/06 to a level 35% less than their baseline
30 Seattle Public Utilities, A Better Way to be Beautiful: Regional 1% Water Conservation Program, 2005 Annual Report. 31 Melbourne Water Climate Change Study: Implications of Potential Climate Change for Melbourne’s Water Resources, CSIRO/Melbourne Water, March 2005

4.0 GHG Reduction Strategies
Santa Rosa Utilities Greenhouse Gas Study 35
in 2000/01, and progress toward it.32 Like Seattle, Melbourne Water uses Triple Bottom Line accounting, and has a goal of a 1% reduction in per capita water use for the period 1990–2020 for most sectors of water use. A large multi-stakeholder group subsequently produced a study with a remarkable 50-year timeline that reviews the water/energy/climate change nexus for the region.33 A primary recommendation is to conserve water first as this also saves energy. Figure 14 summarizes actual and projected water use data from Seattle and Melbourne. System-wide water use divided by total population served is used as a crude metric useful only for general comparison. Similar data is juxtaposed from Santa Rosa. These data have not been adjusted to account for weather or types of water uses served. Available data for future use in Santa Rosa is only that provided by its Urban Water Management Plan, which does not yet include the effect of its future conservation plans. Perhaps this is because Santa Rosa, as leader the Sonoma / North Bay League in water conservation, is looking for better competition. Why not the Climate Action League?
Figure 14
Utility-wide Efficiency Trends
0
40
80
120
160
200
1960 1980 2000 2020 2040 2060
gl/p
erso
n-da
y Santa Rosa ActualSanta Rosa UWMPSeattle ActualSeattle ProjectedMelbourne ActualMelbourne Projected
32 Melbourne Water, Sustainability Report 2005/06. 33 Water Supply-Demand Strategy for Melbourne 2006-2055 (Prof. John Lovering, Chair)

4.0 GHG Reduction Strategies
Santa Rosa Utilities Greenhouse Gas Study 36
4.2 Improve Renewable Content of Energy Purchased
The electric energy used by the City of Santa Rosa is primarily supplied by PG&E. There are several notable renewable energy projects that the City has undertaken that reduce its carbon footprint. These projects, several large (20 kW or greater) net-metered solar photovoltaic arrays are helping the City meet its commitment to lower its GHG emissions. In addition, the City is using biogas generated at the Laguna Treatment Plant to generate electricity. However, these measures, thus far, have not approached the scale required to meet the City’s target of 20% reduction below 2000 levels by 2010. Community-wide, the City has endorsed the target of 25% reduction below 1990 levels by 2015. Reaching both of these goals will require a significant reduction in the “carbon intensity” (GHG emissions per kilowatt hour) of electricity being provided by PG&E. Currently, the electricity supplied by PG&E accounts for 0.489 lbs CO2 per kilowatt hour.34 There are other electric power procurement options that allow the City to provide more renewably generated electricity for both its own operations, and to the citizens living within City boundaries. These options are described below.
4.2.1 Increase use of local renewable resources for distributed generation As mentioned above, the City of Santa Rosa has invested in solar photovoltaic systems to provide renewable power for its operations. There is also significant potential to increase the amount of renewable electricity produced from biogas combustion at the Laguna Treatment Plant. In particular, there is high potential to increase the amount of biogas produced. The heat energy produced in electrical generation can potentially be captured to a greater degree to increase the efficiency of the cogeneration system. Both of these options are described in more detail in the accompanying technical report35.
4.2.2 Increase percentage of low carbon electricity available on grid For all operations currently served by electricity supplied by PG&E, the City is reliant on electricity generation sources secured by PG&E procurement. Currently, the electricity supplied by PG&E is approximately 43 percent natural gas fired generation and about one percent coal fired generation. This fuel mix creates about 0.5 pounds of carbon dioxide equivalent for each kilowatt hour of energy consumed by City operations. For all of its accounts except one, the only option the City has currently for decreasing emissions intensity related to electricity use is known as “net metering.” This is a method for connecting solar photovoltaic arrays or cogeneration systems on the customer side of the meter, to offset grid electricity. The renewable energy systems that the City currently has in place are connected via net metering. The “million dollar meter” at the Laguna Treatment Plant is a Direct Access account. This means that it is possible for the City to procure electricity from vendors other than PG&E for 34 2005 Annual Emissions Report, Pacific Gas and Electric Company. Available from California Climate Action Registry. http://www.climateregistry.org 35 Section 3.2 in Appendix C (Rosenblum Environmental Engineering).

4.0 GHG Reduction Strategies
Santa Rosa Utilities Greenhouse Gas Study 37
this account only. The City has the option to select an “Electric Service Provider” (ESP) to procure the electricity from sources of the City’s choosing. It would be possible for the City to select electricity generated by a greater percentage of non-emitting resources than what is currently supplied by PG&E. However, there may be a change in the rate charged for the greener power. This is an option that could come in to play for reducing the emissions further from the operations associated with the Laguna Treatment Plant. The City has other options for assuming broader local control of electricity procurement. These options allow for both buying and building greener grid electricity. Achieving this local power goal involves instituting a type of public power agency or municipal utility. There are several legal forms available to California municipalities to supply and/or procure electricity for their citizens. The public power entity enables local control over electricity sources that is not currently possible with the investor-owned utilities. The municipal utility district is the form of public power or publicly owned utility (POU) most common in California today. The POUs currently supply about one quarter of the California electricity customer with their electricity, and do so competitively and reliably. There is a new form of local control over electricity supply that has only been available since 2001. This form is called Community Choice Aggregation (CCA). It allows a local government entity to use an Electric Service Provider to procure the electricity for ratepayers within its jurisdiction. The mix of generation resources used to supply the electricity is wholly under the control of the local jurisdiction, and can include resources that are built and owned by the jurisdiction. This method of local control over electricity procurement does not require that the local government become a utility. The incumbent investor owned utility still owns and operates the transmission and distribution network, and does the meter reading and billing. The CCA is established via ordinance, and the individual ratepayers have the opportunity to opt out. Once established, the CCA may issue bonds without voter approval for the construction of new generation resources. The bonding authority along with the ratemaking authority of a CCA allow it to construct new renewable resources at a much lower cost than what the City must currently pay for a net-metered solar photovoltaic array. The CCA is described in more detail in Appendix A of this report.

Santa Rosa Utilities Greenhouse Gas Study 38
5.0 ANALYSIS The perspective on the Santa Rosa municipal water cycle presented in this report quantifies all sources and amounts of GHG emissions associated with water use in Santa Rosa. The reason for presenting this view is to show how to achieve the maximum total reduction in GHG possible throughout the water cycle. It is clear from this system perspective that the end user of water is responsible for the vast majority of emissions attributable to the water cycle. Although the delivery of water and the treatment and discharge of wastewater account for large point sources of emissions they represent a relatively small percentage of the total emissions associated with water use. This situation creates an interesting dilemma for the agencies associated with the water supply on a regional basis. These agencies can focus on their own internal operations and continue with business as usual in dealing with the demand side for water and wastewater treatment services. However, this approach does not address the largest emissions source in the water cycle, the end user. There are additional problems in addressing the end user. Agencies have difficulty cooperating and coordinating across jurisdictional boundaries. There is the traditional problem that suppliers of any commodity have with implementing demand reduction: reduced demand means reduced revenue. There is a more integrated and strategic approach which focuses on regional cooperation for: 1) administration of next generation, high performance demand side approaches as described in this report (PAYS®) to dramatically reduce overall demand for water; 2) development of new renewable generation resources; 3) public financing strategies; 4) operational coordination between water wholesale and retail distributors and among Subregional partners; 5) leveraging wastewater treatment facilities to provide access to renewable energy and fuels. There is a great degree of interaction among various approaches for reducing emissions in the water, wastewater and energy sectors. Public agencies involved in these areas can serve to coordinate the variety of actions that are required, as well as provide a funding mechanism. Whether these strategies will succeed will depend, to a great extent, on whether the public agencies can develop policies and programs to engage the private sector, as well as the economic self-interest of the public. The most difficult challenge to agencies perhaps is to make the transition to marketing demand reduction, rather than simply increasing supply. Integrating development of new renewable electricity generation along with energy and water efficiency delivery is the key to making this transition. The next section discusses the interaction between electricity procurement, new renewable generator deployment and funding water and energy efficiency retrofits across residential and commercial sectors.
5.1 Interaction Among Strategies
Reducing demand for water is the most cost effective strategy for reducing emissions in the municipal water cycle. There are two reasons for this: 1) reducing overall flow through the municipal water cycle gives the largest reduction in energy use for conveyance, distribution, treatment and discharge; 2) reduction in energy use on the customer side of the meter for heating water and in water-using appliances gives a multiplier effect in emissions reduction on a regional basis.

5.0 Analysis
Santa Rosa Utilities Greenhouse Gas Study 39
After reducing demand, the carbon emissions in municipal water operations can be further curbed by introducing more renewably generated electricity for pumping and treatment of water. This can be done either by onsite distributed generation, or by adding new, larger scale renewable generation capacity to the grid, preferably both. Creating a “low carbon” electricity mix available on the grid has multiple benefits. It not only reduces emissions for the municipal water utilities and wholesaler, but it can potentially reduce emissions for the region as a whole. Under current law, there are no options for individual utility customers to purchase “low carbon” electricity other than what the incumbent makes available to them in its “grid mix.” This restriction includes local government customers with some exceptions.36 Individual customers may install small generation systems (less than 1 MW), such as photovoltaic arrays or biomass cogen, and use them to offset the amount of electricity purchased from the utility. These systems are typically relatively expensive, and, although rebates are available, a significant portion of the cost must be paid for out of the pocket of the utility customer. Utility customers may also invest in efficiency, so-called “nega-watts” or “nega-gallons”: new technology that uses less energy or water for a particular application. In nearly all cases, investments in efficiency are much more cost effective37 than investments in new generation resources. Nonetheless, utility customers, particularly in the residential sector, see the initial capital investment in efficiency as a barrier. Although rebate programs can reduce this barrier somewhat, the discussion of PAYS® in Appendix G of this report describes how an efficiency retrofit program with no upfront cost removes this and four more barriers. This type of program also has the benefit that there is little cost to the utility other than the initial cost of establishing the program (ongoing administration costs can be included with service charges assessed solely to participants).38 However, a low cost source of capital to fund the program can make the economics of efficiency even more attractive to the customer. Using the same low-cost funding source for water efficiency retrofits, electrical energy efficiency retrofits and new renewable generation is the key to the integrated implementation of the strategies described in this report. The question confronting local utilities is: How can water efficiency, energy efficiency and “low carbon” electricity be implemented at the required technical level39, for the lowest possible cost, in a fashion that will be economically attractive enough to have a high customer take level? The key lies in leveraging funding available through a legal entity (CCA or MUD) that allows local control of electricity procurement. This entity may also issue municipal revenue bonds without voter approval. These bonds have a variety of uses and represent, in most cases, the lowest cost 36 Any accounts that are classified as Direct Access may purchase electricity from suppliers other than the incumbent utility. 37 Cost-effectiveness is typically measured by simple payback. However, more sophisticated cash-flow analysis such as net present value or internal rate of return should be used to gauge the cost effectiveness of efficiency measures. These measures of cost-effectiveness should be evaluated over the life of the asset (lifecycle cost) using an appropriate utility escalation rate. 38 Utilities may choose to provide rebates as well to extend the range of measures found cost-effective by potential participants 39 To meet the emissions reduction goal of 25% below 1990 levels by 2015

5.0 Analysis
Santa Rosa Utilities Greenhouse Gas Study 40
capital available today. This gives local governments the ability to build new generation resources at the lowest possible cost. These bonds may also provide capital to invest in energy and water efficiency retrofit programs. Electric energy procurement is a key element of reducing emissions, not only on the municipal operations side, but also on the end user side. The mix of generation resources used to provide electricity throughout the service territories of the Water Agency and its contractors, as well as the Subregional partners, determines the level of GHG emissions due to electric energy use. This generation mix is currently determined by the incumbent utility, PG&E. In order to obtain more “low carbon” electricity from sources other than expensive, privately financed small generation systems, a municipality may elect to take over electricity procurement on behalf of the customers within its jurisdiction. In California, there are currently two methods for doing this: 1) form a municipal utility district (MUD); 2) form a Community Choice Aggregation. Under both these legal forms, it is possible for the local government entity to issue municipal revenue bonds to obtain funding for public works projects, including both building new electricity generation resources, and for efficiency projects. Although a discussion of public and private activity bonds is beyond the scope of this report, it is safe to say that this financing venue creates many opportunities for public-private partnerships.
5.2 Scenario Development
The development of a platform for administering the delivery of the programs described above is subject, ultimately, to the political will of the jurisdictions involved. Given that there are a number of compelling reasons to pursue options other than the status quo for efficiency delivery and development of renewable power, a roadmap is presented in this report for achieving the targets that have been set by the City. This roadmap is one of a set of options that include doing nothing at the local level. This latter approach assumes that the state of California is doing everything necessary to achieve the reduction in GHG emissions that is known to be required, “to prevent dangerous anthropogenic interference in the climate.”40 It also assumes that there will be no untoward consequences if no concerted local action is taken at this time, and that the AB 32 target will not change. Under the auspices of an energy authority such as one of the forms mentioned above, it is possible for the City of Santa Rosa, along with its regional partners, to exceed the target set at the state level by AB 32. The target that has been set for Sonoma County and endorsed by the City of Santa Rosa is more aggressive than the AB 32 target41. Although the AB 32 target is now state law, the adequacy of this target is becoming questionable. At this point in time, the consensus science on global warming and climate change is indicating that much more
40 United Nations Framework Convention on Climate Change sets an ultimate objective of stabilizing greenhouse gas concentrations "at a level that would prevent dangerous anthropogenic (human induced) interference with the climate system." It states that "such a level should be achieved within a time-frame sufficient to allow ecosystems to adapt naturally to climate change, to ensure that food production is not threatened, and to enable economic development to proceed in a sustainable manner." 41 AB 32 requires that the total GHG emissions of the state of California be reduced to 1990 levels by the year 2020.

5.0 Analysis
Santa Rosa Utilities Greenhouse Gas Study 41
aggressive action than the AB 32 target must be undertaken by the developed world. In fact, the European Union is considering a target of 20 percent to 40 percent below 1990 levels by 2020. The Sonoma County target is more aligned with action that is being taken outside the United States, and presages what the United States will ultimately need to do. The fact that the AB 32 target is not aligned with the growing international consensus on the level of reduction the developed world must achieve, is disconcerting. However, it validates action that local government in Sonoma County is taking to set and meet its own target. The ability of the City of Santa Rosa, along with its regional partners, to proactively exceed the state mandate for GHG reduction has several important ramifications:
• It insures that the City will not be blind-sided by mandates from the State if the AB 32 implementation extends to local government.
• It immunizes the City against draconian regulation that may be put into place if the United States participates in an international emissions cap.
• It is the best protection against skyrocketing electricity and natural gas prices that are virtually certain to occur as AB 32 is implemented.
The potential for countywide cooperation on issues of energy independence, water supply management and GHG emissions reduction is very promising. Legal, financial and technical tools exist that enable the Cities and the County to cost-effectively exceed the GHG emissions target set by the State, and implemented by the major utilities. The Cities and the County have the right to investigate the implementation of these tools, and make deals that are competitive and financially and technically sound. There are “off-ramps” at all times in the pursuit of GHG emissions reduction. The only off ramp that doesn’t exist is the one that allows escape from the costs and consequences of inaction.
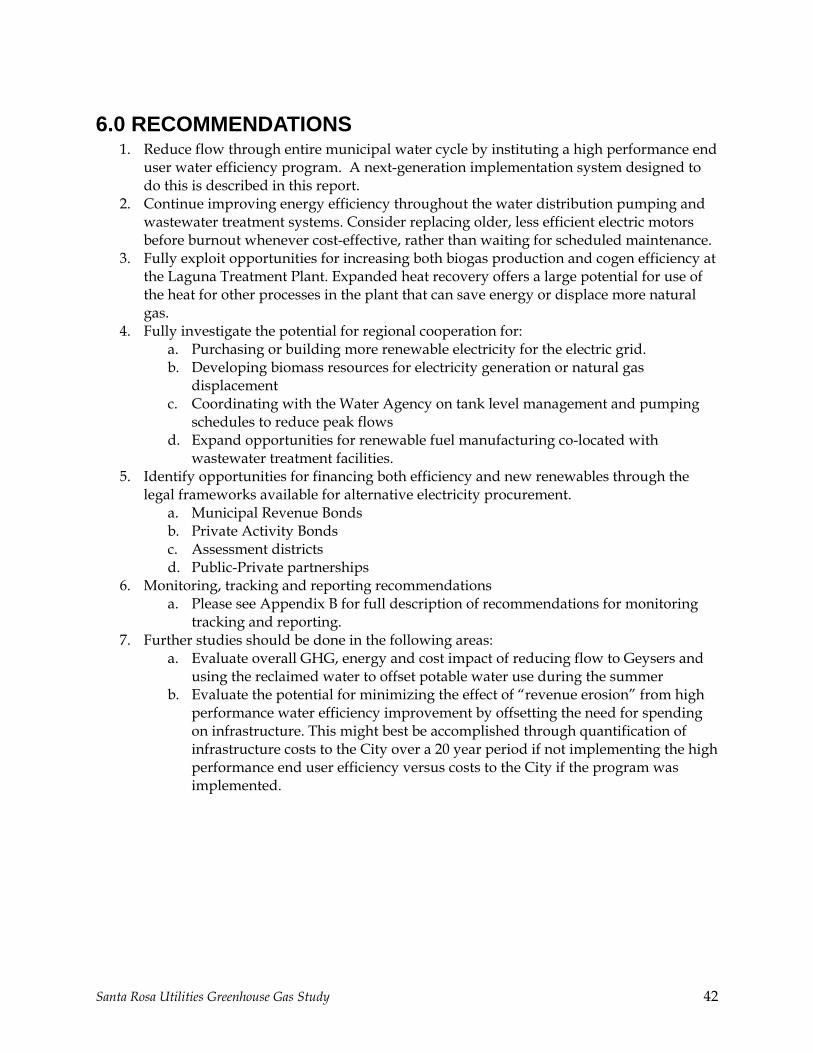
Santa Rosa Utilities Greenhouse Gas Study 42
6.0 RECOMMENDATIONS 1. Reduce flow through entire municipal water cycle by instituting a high performance end
user water efficiency program. A next-generation implementation system designed to do this is described in this report.
2. Continue improving energy efficiency throughout the water distribution pumping and wastewater treatment systems. Consider replacing older, less efficient electric motors before burnout whenever cost-effective, rather than waiting for scheduled maintenance.
3. Fully exploit opportunities for increasing both biogas production and cogen efficiency at the Laguna Treatment Plant. Expanded heat recovery offers a large potential for use of the heat for other processes in the plant that can save energy or displace more natural gas.
4. Fully investigate the potential for regional cooperation for: a. Purchasing or building more renewable electricity for the electric grid. b. Developing biomass resources for electricity generation or natural gas
displacement c. Coordinating with the Water Agency on tank level management and pumping
schedules to reduce peak flows d. Expand opportunities for renewable fuel manufacturing co-located with
wastewater treatment facilities. 5. Identify opportunities for financing both efficiency and new renewables through the
legal frameworks available for alternative electricity procurement. a. Municipal Revenue Bonds b. Private Activity Bonds c. Assessment districts d. Public-Private partnerships
6. Monitoring, tracking and reporting recommendations a. Please see Appendix B for full description of recommendations for monitoring
tracking and reporting. 7. Further studies should be done in the following areas:
a. Evaluate overall GHG, energy and cost impact of reducing flow to Geysers and using the reclaimed water to offset potable water use during the summer
b. Evaluate the potential for minimizing the effect of “revenue erosion” from high performance water efficiency improvement by offsetting the need for spending on infrastructure. This might best be accomplished through quantification of infrastructure costs to the City over a 20 year period if not implementing the high performance end user efficiency versus costs to the City if the program was implemented.

Santa Rosa Utilities Greenhouse Gas Study 43
APPENDIX A1: Community Choice Aggregation Established as a right under California state law, Community Choice allows cities and counties to determine their own electric energy supply. With Community Choice the local government does not go into the business of supplying electricity but contracts with an experienced electric service provider. The local government’s role is primarily as a planning and authorizing agency. Without Community Choice, decision making regarding energy supply resides primarily with the utility company and state regulatory agencies. Because energy supply for electricity, heating and transportation is the source of over 80% of greenhouse gas (GHG) emissions, if local governments are to address the climate crisis effectively they must address how they obtain and use energy. Dealing with climate change is rapidly becoming a necessity for local governments. State, federal and international laws promise to require governments at all levels to reduce GHG. An advisory committee to the California Air Resources Board recently singled out local governments as key decision makers in achieving reductions in GHG in the energy sector.2 Traditional players are not yet moving swiftly enough to reduce GHG emissions to the levels that the law and climate science require. In PG&E’s own planning documents, the only scenario for major GHG reduction—up to 23% below 2007 levels—is if local governments like Santa Rosa implement Community Choice. 3 Community Choice allows local governments not only to choose where they get their electric power as noted above, but also to develop programs to increase efficiency of energy use, and to reduce demand. A Community Choice program covers not only government agencies, but also the power supply for all businesses and residential customers within their jurisdiction. The program does not require participation, but gives any customer the right to “opt out” and return to their former electric utility company provider if they prefer. This “opt out” system greatly reduces marketing costs as well as startup and planning risks compared to a door to door method of gathering customers. Combining all local customers into a single group provides many market advantages such as bargaining power with suppliers and the financial resources to build and finance renewable energy facilities. As a powerful financing tool, Community Choice enables local governments to issue municipal revenue bonds to fund construction of new renewable generation resources. This method of 1 From Climate Protection Campaign’s Sonoma County Community Climate Action Plan. “Energy Solutions: A Plan to Achieve Accelerated, Scaled & Cost-Effective Greenhouse Gas Emission Reductions in the County’s Energy Sector by 2015” prepared by: Local Power Incorporated, www.localpower.com 2 California Air Resources Board, Economic and Technology Advancement Advisory Committee, Economic and Technology Advancements for California Climate Solutions Draft Report, November 15, 2007. 3 Pacific Gas and Electric Company, 2006 Long-Term Procurement Plan, Volume I—Amendment, page IV-11 to 12.

Appendix A: Community Choice Aggregation
Santa Rosa Greenhouse Gas Study 44
funding electricity generation projects enables a much lower cost of construction than private capital sources, at a very low risk. Even solar photovoltaic installations, typically the highest cost renewable energy generation technology, can produce electricity at a nearly competitive price when financed with revenue bonds.
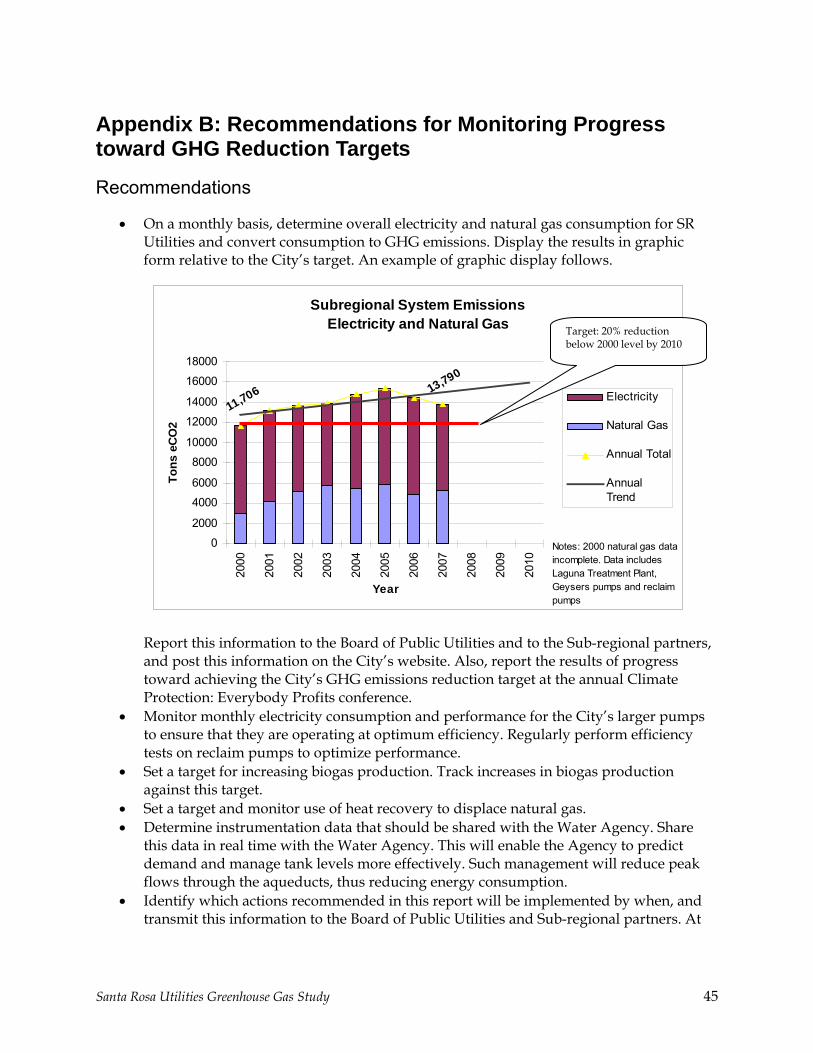
Santa Rosa Utilities Greenhouse Gas Study 45
Appendix B: Recommendations for Monitoring Progress toward GHG Reduction Targets
Recommendations
• On a monthly basis, determine overall electricity and natural gas consumption for SR Utilities and convert consumption to GHG emissions. Display the results in graphic form relative to the City’s target. An example of graphic display follows.
Subregional System EmissionsElectricity and Natural Gas
11,706 13,790
0
2000
4000
6000
8000
10000
12000
14000
16000
18000
2000
2001
2002
2003
2004
2005
2006
2007
2008
2009
2010
Year
Tons
eC
O2
Electricity
Natural Gas
Annual Total
AnnualTrend
Notes: 2000 natural gas data incomplete. Data includes Laguna Treatment Plant, Geysers pumps and reclaim pumps
Report this information to the Board of Public Utilities and to the Sub-regional partners, and post this information on the City’s website. Also, report the results of progress toward achieving the City’s GHG emissions reduction target at the annual Climate Protection: Everybody Profits conference.
• Monitor monthly electricity consumption and performance for the City’s larger pumps to ensure that they are operating at optimum efficiency. Regularly perform efficiency tests on reclaim pumps to optimize performance.
• Set a target for increasing biogas production. Track increases in biogas production against this target.
• Set a target and monitor use of heat recovery to displace natural gas. • Determine instrumentation data that should be shared with the Water Agency. Share
this data in real time with the Water Agency. This will enable the Agency to predict demand and manage tank levels more effectively. Such management will reduce peak flows through the aqueducts, thus reducing energy consumption.
• Identify which actions recommended in this report will be implemented by when, and transmit this information to the Board of Public Utilities and Sub-regional partners. At
Target: 20% reduction below 2000 level by 2010

Appendix B: Recommendations for Monitoring Progress toward GHG Reduction Targets
Santa Rosa Utilities Greenhouse Gas Study 46
least annually report on progress in implementing the recommended actions to the Board and Sub-regional partners.

Santa Rosa Utilities Greenhouse Gas Study 46
Appendix C: Rosenblum Environmental Engineering Study ROSENBLUM Tel: (707) 824-8070 ENVIRONMENTAL Fax: (707) 824-8071 ENGINEERING [email protected] 900 Dorthel Street, Sebastopol, CA 95472 May 22, 2008
CITY OF SANTA ROSA GREENHOUSE GAS EMISSIONS
FROM WATER AND WASTEWATER OPERATIONS: CURRENT INVENTORY AND POTENTIAL REDUCTIONS
Prepared as part of City of Santa Rosa Greenhouse Gas Emissions Related to Water and Wastewater Services:
Baseline, Reduction Strategies, and Recommendations Climate Protection Campaign, February 2008
www.climateprotectioncampaign.org, (707) 823-2665

Appendix C: Rosenblum Environmental Engineering Study
Santa Rosa Utilities Greenhouse Gas Study 47
Acknowledgements This report was prepared for Climate Protection Campaign, with funding from the City of Santa Rosa Utilities Department. Many thanks to Ann Hancock, Executive Director of CPC and to Dell Tredinnick Project Development Manager for the City of Santa Rosa for directing the project. Dave Erickson, Chief Analyst for CPC worked hard to track down and verify all the required data from a multitude of sources, and then smoothly integrated this report into the larger CPC report for all Greenhouse gas emissions from the Utilities Department’s operation. Ned Orrett, P.E., of Resource Performance Partners made the initial hypothesis about the tremendous Greenhouse gas reductions from end-use water efficiency – and provided the detailed analysis to show how it would work for residential customers in Santa Rosa. Dan Carlson, Deputy Director of Santa Rosa Utilities, and his staff were very gracious with their time helping us understand and validate the data. Many thanks especially to Randy Piazza, Joe Schwall, and Bob Austin.
Appendix C: Rosenblum Environmental Engineering Study
Santa Rosa Utilities Greenhouse Gas Study 48
Table of Contents ACKNOWLEDGEMENTS ..................................................................................................................................... 47
EXECUTIVE SUMMARY ....................................................................................................................................... 50
BASELINE RESULTS ................................................................................................................................................. 50 COMMUNITY-WIDE CONTEXT ............................................................................................................................... 53 CONCLUSIONS ........................................................................................................................................................ 55 RECOMMENDATIONS FOR NEXT STEPS .................................................................................................................. 55
BASELINE ANALYSIS ........................................................................................................................................... 56
MONTHLY VARIABILITY ......................................................................................................................................... 56 Overview ............................................................................................................................................................ 56 Water and Wastewater Volumes........................................................................................................................ 56 Water Supply Energy and GHG Emissions ...................................................................................................... 56 Laguna Wastewater Plant Energy Use and Costs ............................................................................................. 59 Reclaimed Wastewater ....................................................................................................................................... 64
GHG EMISSIONS .................................................................................................................................................... 67 Overview ............................................................................................................................................................ 67 Water Supply ..................................................................................................................................................... 67 Laguna Plant ..................................................................................................................................................... 68
COMPARISON OF ANNUAL ENERGY, COSTS, AND GHG EMISSIONS .................................................................... 68 Water Supply and Wastewater Treatment Elements ......................................................................................... 68 Total GHG Emissions and GHG Inventory Emissions ..................................................................................... 73 Annual Variations in GHG Emissions .............................................................................................................. 78
COMMUNITY CONTEXT OF GHG EMISSIONS FROM WATER/WASTEWATER OPERATIONS ................................. 79 Overview ............................................................................................................................................................ 79 Santa Rosa Water/Wastewater Operations Compared to End-Users ................................................................ 80 GHG Benefits and Emissions from Santa Rosa’s Geysers Recharge Project ..................................................... 86
SUMMARY ............................................................................................................................................................... 90
CONCLUSIONS ........................................................................................................................................................ 90 RECOMMENDATIONS FOR NEXT STEPS .................................................................................................................. 92
APPENDIX C/1:BASELINE (2004-2005) DATA SOURCES ............................................................................. 93
SONOMA COUNTY WATER AGENCY (SCWA) SUPPLY ......................................................................................... 93 CITY OF SANTA ROSA WELLS ................................................................................................................................ 93 WATER BOOSTER PUMPS ........................................................................................................................................ 95 SEWAGE LIFT STATIONS, WASTEWATER, INFLOW/INFILTRATION, AND INDOOR/OUTDOOR WATER .............. 97 LAGUNA REGIONAL WASTEWATER TREATMENT PLANT (LAGUNA PLANT) .................................................... 101
System Description .......................................................................................................................................... 101 Biogas/Natural Gas Cogeneration ................................................................................................................... 102 Purchased Electricity for Laguna Plant Operations ........................................................................................ 105
EFFLUENT MANAGEMENT ................................................................................................................................... 106 System Description and Water Balance ........................................................................................................... 106 Geysers ............................................................................................................................................................. 108 Reclaimed Wastewater Irrigation .................................................................................................................... 110 Russian River Discharge ................................................................................................................................. 114
TOTAL GHG EMISSIONS AND INVENTORY .......................................................................................................... 114
APPENDIX C/2: DESIGN AND OPERATION OF THE LAGUNA PLANT DIGESTER/ COGENERATION SYSTEM FOR GHG REDUCTIONS .............................................................................. 116
OVERVIEW ............................................................................................................................................................ 116

Appendix C: Rosenblum Environmental Engineering Study
Santa Rosa Utilities Greenhouse Gas Study 49
OPPORTUNITIES FOR OPTIMIZATION ................................................................................................................... 116 IMPROVING COGENERATION EFFICIENCY ........................................................................................................... 118
APPENDIX C/3: THE GEYSERS RECLAIMED WASTEWATER PROJECT ............................................. 122
BACKGROUND ...................................................................................................................................................... 122 GEOTHERMAL ELECTRICITY PRODUCTION AT THE GEYSERS .............................................................................. 122
Addressing Declining Steam Production ........................................................................................................ 122 Water Recharge in the Geothermal Field ......................................................................................................... 124 Summary of Operational Measures to Stabilize Electricity Production .......................................................... 129
GHG BENEFITS AND EMISSIONS FROM SANTA ROSA’S GEYSERS RECHARGE PROJECT ..................................... 129 GHG Emissions Factor for The Geysers .......................................................................................................... 129 GHG Emissions from Pumping Reclaimed Wastewater to The Geysers ......................................................... 130 GHG Emissions and Benefits from Electricity Generation at The Geysers ..................................................... 133
APPENDIX C/4: INTEGRATION OF HIGH-PERFORMANCE WATER EFFICIENCY INTO INFRASTRUCTURE PROJECT PLANNING .................................................................................................. 135

Santa Rosa Utilities Greenhouse Gas Study 50
Executive Summary
Baseline Results
This report summarizes greenhouse gas (GHG) emissions from energy use in the urban water and wastewater cycle for the City of Santa Rosa, California, and is part of the Climate Protection Campaign’s (CPC) project to produce a GHG Inventory for the Santa Rosa Utilities Department. CPC adheres to the Greenhouse Gas Protocol (GHG Protocol) which is the most widely used international accounting tool for government and business leaders to understand, quantify, and manage greenhouse gas emissions1. In this report, emissions within the jurisdiction of the Santa Rosa Utilities Department are referred to as “GHG inventory”, while total emissions, including those outside jurisdictional boundaries are referred to as “total GHG”. For this report, the terms are defined as follows: • GHG Inventory – CO2 emissions only2 from the use of fossil fuels to operate
water/wastewater equipment within the jurisdictional boundaries of the City of Santa Rosa Utilities Department.
• Total GHG – all CO2 emissions from supplying water and treating wastewater for the City of Santa Rosa.
Not all GHG emissions, nor all regional elements of Santa Rosa’s water supply and wastewater treatment system are included in the Santa Rosa Utilities Department GHG inventory: 1. The energy used by Sonoma County Water Agency (SCWA) to supply water to Santa Rosa,
and its GHG emissions, are already included in SCWA’s inventory. 2. Biogas produced at the Laguna plant is a biogenic fuel, and is not counted in GHG
inventories that focus on the impact of non-renewable fossil fuels. The reason for tracking total GHG emissions in this report beyond those reported in the GHG inventory is that this aids in identification of opportunities to effectively reduce emissions. Effective identification of reduction opportunities requires considering regional impacts such as SCWA’s operation and the Laguna wastewater plant’s cogeneration system. The scope of the Utilities Department GHG inventory encompasses only 50% of the total electrical energy required to deliver Santa Rosa’s water and to treat wastewater (including effluent management). The inventory quantifies only 58% of total GHG emissions. By expanding the scope used in the inventory to include biogenic emissions, and regional energy use, a picture emerges that is very useful in guiding the search for cost-effective improvements.
1 The GHG Protocol is a decade-long partnership between the World Resources Institute and the World Business Council for Sustainable Development. 2 The GHG Protocol considers emissions of six gases that have global warming potential (GWP), and converts the emissions totals for each gas to “equivalent CO2.” The six gases are anthropogenic carbon dioxide from fossil fuel combustion (GWP=1), methane (GWP=23), nitrous oxide (GWP=320), HFC, PFC and SF6. For this study, only emissions of carbon dioxide were calculated.
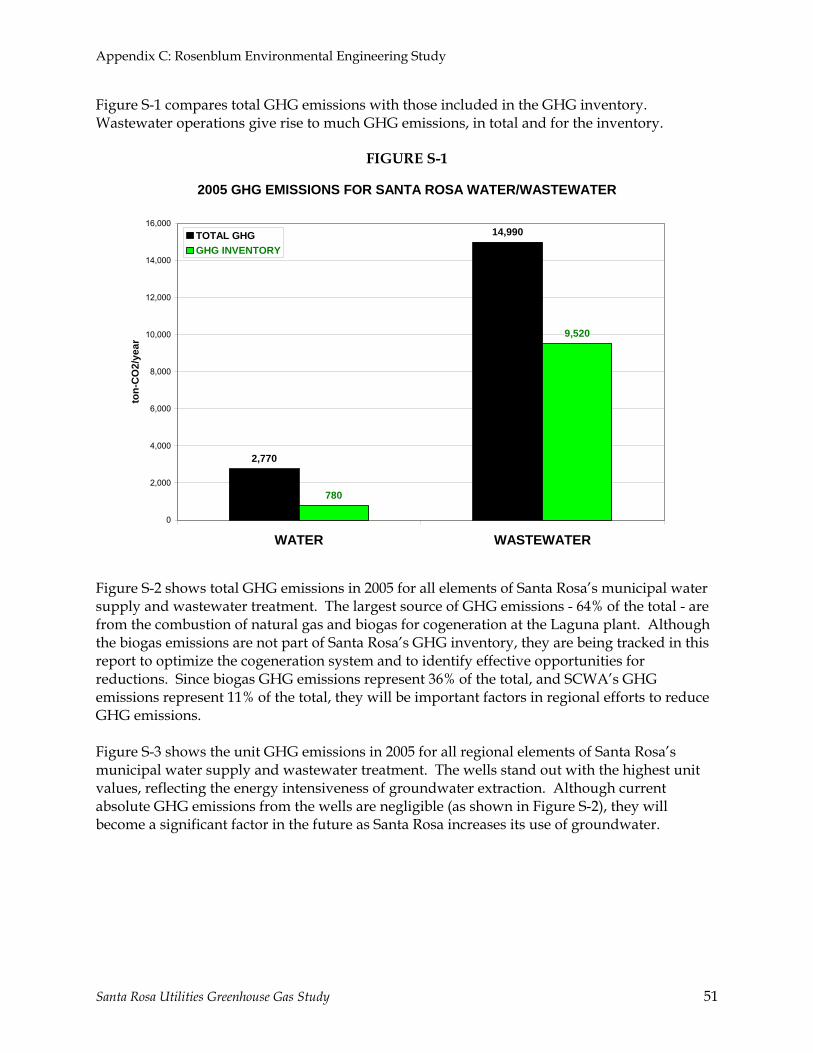
Appendix C: Rosenblum Environmental Engineering Study
Santa Rosa Utilities Greenhouse Gas Study 51
Figure S-1 compares total GHG emissions with those included in the GHG inventory. Wastewater operations give rise to much GHG emissions, in total and for the inventory.
FIGURE S-1
2005 GHG EMISSIONS FOR SANTA ROSA WATER/WASTEWATER
2,770
14,990
780
9,520
0
2,000
4,000
6,000
8,000
10,000
12,000
14,000
16,000
WATER WASTEWATER
ton-
CO
2/ye
ar
TOTAL GHGGHG INVENTORY
Figure S-2 shows total GHG emissions in 2005 for all elements of Santa Rosa’s municipal water supply and wastewater treatment. The largest source of GHG emissions - 64% of the total - are from the combustion of natural gas and biogas for cogeneration at the Laguna plant. Although the biogas emissions are not part of Santa Rosa’s GHG inventory, they are being tracked in this report to optimize the cogeneration system and to identify effective opportunities for reductions. Since biogas GHG emissions represent 36% of the total, and SCWA’s GHG emissions represent 11% of the total, they will be important factors in regional efforts to reduce GHG emissions. Figure S-3 shows the unit GHG emissions in 2005 for all regional elements of Santa Rosa’s municipal water supply and wastewater treatment. The wells stand out with the highest unit values, reflecting the energy intensiveness of groundwater extraction. Although current absolute GHG emissions from the wells are negligible (as shown in Figure S-2), they will become a significant factor in the future as Santa Rosa increases its use of groundwater.

Appendix C: Rosenblum Environmental Engineering Study
Santa Rosa Utilities Greenhouse Gas Study 52
FIGURE S-2
2005 TOTAL GHG EMISSIONS FOR SANTA ROSA WATER/WASTEWATER
6010
0
1,000
2,000
3,000
4,000
5,000
6,000
SCWAWATER
WELLWATER
WATERBOOSTERS
W/W LIFT W/W N.GAS W/WBIOGAS
W/W PG&EELEC
W/WRECLAIM
tons
-CO
2/ye
ar
TOTAL 17,760 tons-CO2/yr
not inGHG inventory
not inGHG inventory
FIGURE S-3
2005 TOTAL UNIT GHG EMISSIONS FOR SANTA ROSA WATER/WASTEWATER
0.01
0.0
0.1
0.2
0.3
0.4
0.5
0.6
0.7
0.8
0.9
1.0
1.1
SCWAWATER
WELLWATER
WATERBOOSTERS
W/W LIFT W/W N.GAS W/WBIOGAS
W/W PG&EELEC
W/WRECLAIM
tons
-CO
2/M
G
TOTAL 2.4 tons-CO2/MG-water supply
not inGHG inventory
not inGHG inventory

Appendix C: Rosenblum Environmental Engineering Study
Santa Rosa Utilities Greenhouse Gas Study 53
Community-Wide Context
The City of Santa Rosa’s water/wastewater operations use only a small fraction of the energy required by City’s water and wastewater customers during their use of water (e.g. for heating water). An evaluation of customer water use in Santa Rosa3 shows that:
1. Water-related GHG emissions from end-users are 7.6 times larger than the GHG inventory for the City of Santa Rosa’s water and wastewater operations. Figure S-4 shows that for each gallon of reduced water demand, reduction of emissions from end users is 6.6 times greater than emissions reduction in Santa Rosa’s water and wastewater operations. This means that water efficiency programs will produce a regional benefit far larger than their direct effect on Santa Rosa’s water and wastewater operations (or in SCWA’s water supply system).
2. Water-related energy costs are more than 5.0 times larger than costs included in the City of Santa Rosa’s GHG inventory for water and wastewater operations. Figure S-5 for unit energy costs, shows that for each gallon of reduced water demand, there will be 4.4 times more savings for end-users than in Santa Rosa’s water and wastewater operations. This means that water efficiency programs will produce much larger savings for customers than for Santa Rosa’s water and wastewater operations. This in turn suggests that the customers’ self-interest should attract widespread participation in water efficiency programs which will greatly improve the likelihood of regional reductions in water-related GHG emissions.
An evaluation of high-performance water efficiency products and measures in cities in the USA and abroad4 shows that reductions of 30-40% in water demands through efficiency are feasible even in Santa Rosa. This level of reduction would be larger than the 32% increase in regional water demand due to population growth anticipated by SCWA for 20205 - and could significantly reduce water and wastewater infrastructure expansion costs. Implementation costs for efficiency would thus be offset by the reduction in infrastructure cost. Although additional evaluation is needed, it appears that water efficiency could reduce regional GHG emissions and energy costs by 2020 — even with anticipated population growth.
3 Appendix C, City of Santa Rosa Greenhouse Gas Emissions Related to Water and Wastewater Services: Baseline, Reduction Strategies, and Recommendations, Climate Protection Campaign, June 2008. 4 Appendices C and D in City of Santa Rosa Greenhouse Gas Emissions Related to Water and Wastewater Services: Baseline, Reduction Strategies, and Recommendations, Climate Protection Campaign, June 2008. 5 Sonoma County Water Agency Greenhouse Gas Emissions from Water Supply Operations: Current Inventory and Potential Reductions, Rosenblum Environmental Engineering, 2006 (Appendix to Sonoma County Water Agency Final Report: Greenhouse Gas Emissions, Energy Use and Emissions Reduction Potential Climate Protection Campaign, 2007).

Appendix C: Rosenblum Environmental Engineering Study
Santa Rosa Utilities Greenhouse Gas Study 54
FIGURE S-4
2005 WATER-RELATED UNIT GHG EMISSIONS FOR SANTA ROSA
0
1
2
3
4
5
6
7
8
9
10
11
WATER SUPPLY WASTEWATER TREATMENT END-USERS
tons
-CO
2/M
G
BEYOND INVENTORYGHG INVENTORY
0.1
0.3
6.6 times more than the inventory for water
and wastewater
FIGURE S-5
2005 WATER-RELATED UNIT ENERGY COSTS FOR SANTA ROSA
$0
$200
$400
$600
$800
$1,000
$1,200
$1,400
$1,600
$1,800
$2,000
WATER SUPPLY WASTEWATER TREATMENT END-USERS
$/M
G
BEYOND INVENTORYGHG INVENTORY
$43
4.4 times more than the inventory for water
and wastewater
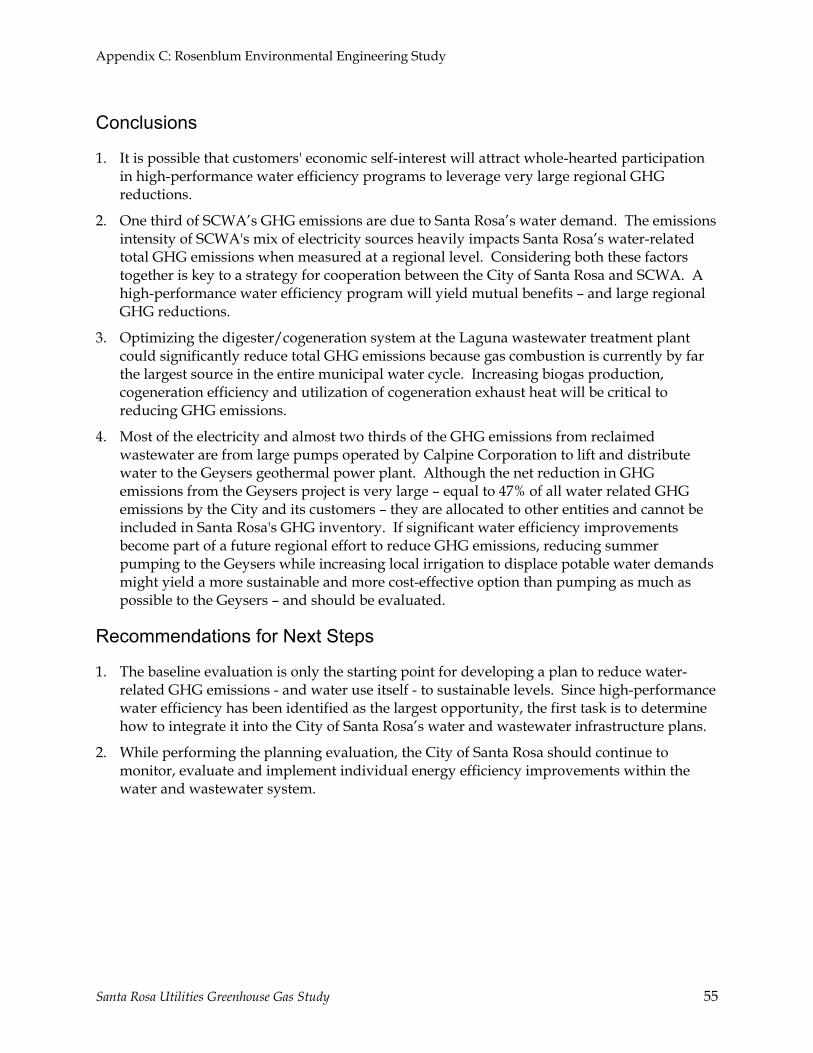
Appendix C: Rosenblum Environmental Engineering Study
Santa Rosa Utilities Greenhouse Gas Study 55
Conclusions
1. It is possible that customers' economic self-interest will attract whole-hearted participation in high-performance water efficiency programs to leverage very large regional GHG reductions.
2. One third of SCWA’s GHG emissions are due to Santa Rosa’s water demand. The emissions intensity of SCWA's mix of electricity sources heavily impacts Santa Rosa’s water-related total GHG emissions when measured at a regional level. Considering both these factors together is key to a strategy for cooperation between the City of Santa Rosa and SCWA. A high-performance water efficiency program will yield mutual benefits – and large regional GHG reductions.
3. Optimizing the digester/cogeneration system at the Laguna wastewater treatment plant could significantly reduce total GHG emissions because gas combustion is currently by far the largest source in the entire municipal water cycle. Increasing biogas production, cogeneration efficiency and utilization of cogeneration exhaust heat will be critical to reducing GHG emissions.
4. Most of the electricity and almost two thirds of the GHG emissions from reclaimed wastewater are from large pumps operated by Calpine Corporation to lift and distribute water to the Geysers geothermal power plant. Although the net reduction in GHG emissions from the Geysers project is very large – equal to 47% of all water related GHG emissions by the City and its customers – they are allocated to other entities and cannot be included in Santa Rosa's GHG inventory. If significant water efficiency improvements become part of a future regional effort to reduce GHG emissions, reducing summer pumping to the Geysers while increasing local irrigation to displace potable water demands might yield a more sustainable and more cost-effective option than pumping as much as possible to the Geysers – and should be evaluated.
Recommendations for Next Steps
1. The baseline evaluation is only the starting point for developing a plan to reduce water-related GHG emissions - and water use itself - to sustainable levels. Since high-performance water efficiency has been identified as the largest opportunity, the first task is to determine how to integrate it into the City of Santa Rosa’s water and wastewater infrastructure plans.
2. While performing the planning evaluation, the City of Santa Rosa should continue to monitor, evaluate and implement individual energy efficiency improvements within the water and wastewater system.

Appendix C: Rosenblum Environmental Engineering Study
Santa Rosa Utilities Greenhouse Gas Study 56
Baseline Analysis
Monthly Variability
Overview Although 2005 is the baseline, the 24 month period from January 2004 to December 2005 provides a more reliable basis for projecting future performance. Appendix C/1 provides monthly data for 2004 and 2005 for all elements of Santa Rosa’s water supply and wastewater treatment. In particular, monthly data illuminates the seasonal variability of water demands and wastewater generation, and their related energy use, costs, and GHG emissions.
Water and Wastewater Volumes Figure 1 shows how Santa Rosa’s water supply peaks during dry weather months because of outdoor water demands, while Figure 2 shows that Santa Rosa’s influent to the Laguna plant peak during wet weather months because of Inflow & Infiltration (I&I). Even though annual outdoor water use averages 43% of total water supply, it varies from 0% in February to 60% of the much larger total in August. Similarly, annual I&I averages only 23% of Santa Rosa’s influent to the Laguna plant, but varies from 0% in July-September, to 40-46% in January-February.
Water Supply Energy and GHG Emissions Figure 3 shows monthly electricity used to supply water to Santa Rosa, not surprisingly revealing that most electricity is for SCWA’s supply pumps and that much more is used in summer than in winter. The difference in the shape of the SCWA electricity curve in summer 2004 and summer 2005 was caused by heavy rains in June 2005 that significantly reduced outdoor water demands (this can be seen clearly in Figure 1). As a result, SCWA’s annual energy use to supply Santa Rosa was only 16,000 MWh in 2005, compared to 17,400 MWh in 2004.
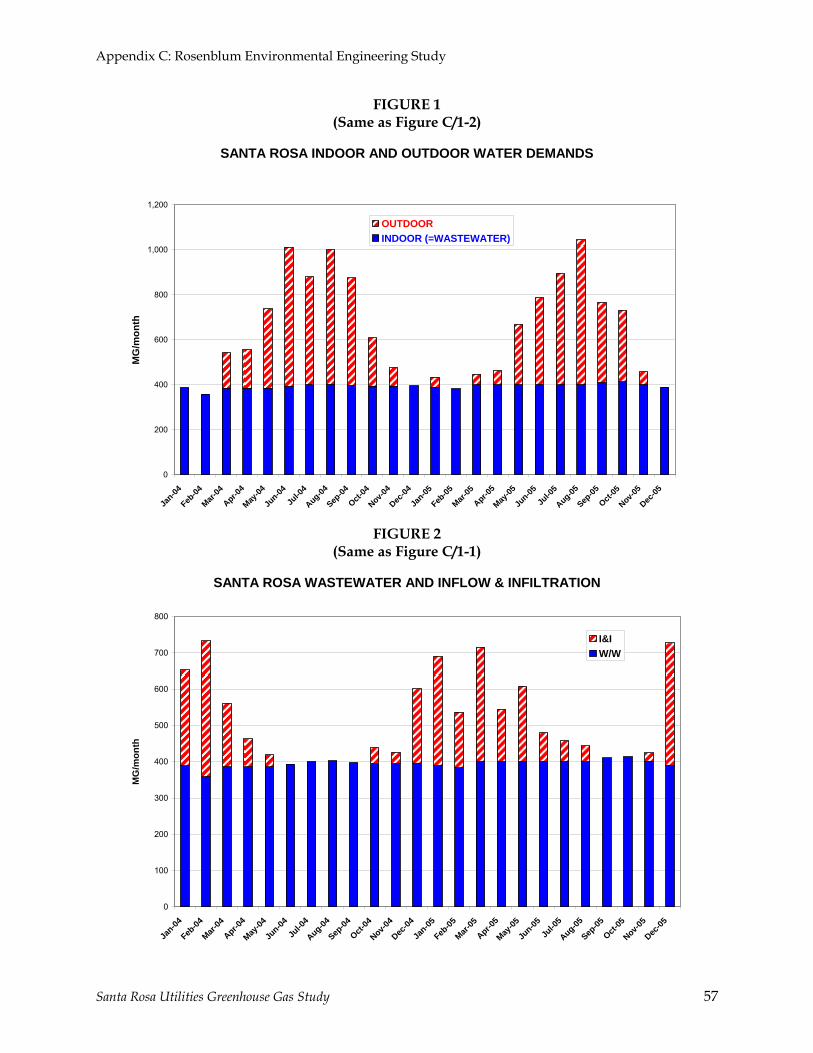
Appendix C: Rosenblum Environmental Engineering Study
Santa Rosa Utilities Greenhouse Gas Study 57
FIGURE 1 (Same as Figure C/1-2)
SANTA ROSA INDOOR AND OUTDOOR WATER DEMANDS
0
200
400
600
800
1,000
1,200
Jan-04
Feb-04
Mar-04
Apr-04
May-04
Jun-04
Jul-0
4
Aug-04
Sep-04
Oct-04
Nov-04
Dec-04
Jan-05
Feb-05
Mar-05
Apr-05
May-05
Jun-05
Jul-0
5
Aug-05
Sep-05
Oct-05
Nov-05
Dec-05
MG
/mon
th
OUTDOORINDOOR (=WASTEWATER)
FIGURE 2
(Same as Figure C/1-1)
SANTA ROSA WASTEWATER AND INFLOW & INFILTRATION
0
100
200
300
400
500
600
700
800
Jan-04
Feb-04
Mar-04
Apr-04
May-04
Jun-04
Jul-0
4
Aug-04
Sep-04
Oct-04
Nov-04
Dec-04
Jan-05
Feb-05
Mar-05
Apr-05
May-05
Jun-05
Jul-0
5
Aug-05
Sep-05
Oct-05
Nov-05
Dec-05
MG
/mon
th
I&IW/W

Appendix C: Rosenblum Environmental Engineering Study
Santa Rosa Utilities Greenhouse Gas Study 58
FIGURE 3
ELECTRICITY USED FOR SANTA ROSA WATER SUPPLY
0
500
1,000
1,500
2,000
2,500
Jan-04
Feb-04
Mar-04
Apr-04
May-04
Jun-04
Jul-0
4
Aug-04
Sep-04
Oct-04
Nov-04
Dec-04
Jan-05
Feb-05
Mar-05
Apr-05
May-05
Jun-05
Jul-0
5
Aug-05
Sep-05
Oct-05
Nov-05
Dec-05
MW
h/m
onth
SCWABOOSTERSWELLS
The wells are not part of Santa Rosa regular water supply in 2004 and 2005, and their insignificant energy use is for testing only. However, Santa Rosa’s plans for the future include the wells for regular water supply6, so it is important to note that their 4.0 MWh/MG unit electricity use is almost double the 2.1 MWh/MG of SCWA. A very similar pattern to Figure 3 can be shown for costs but for GHG emissions, Figure 4 shows a markedly different pattern: 1. As explained in a companion report7, SCWA’s electricity supply is a mix of hydropower
with zero GHG emissions, and “market” power assumed to have the same emissions as PG&E (0.489 lb-CO2/kWh)8. In summer months, when less hydropower is available but water demand is high, SCWA needs to purchase more “market” power. Adding to this
6 City of Santa Rosa 2005 Urban Water Management Plan (2005 UWMP), p.4-6. 7 Sonoma County Water Agency Greenhouse Gas Emissions from Water Supply Operations: Current Inventory and Potential Reductions, Rosenblum Environmental Engineering, 2006 (Appendix to Sonoma County Water Agency Final Report: Greenhouse Gas Emissions, Energy Use and Emissions Reduction Potential Climate Protection Campaign, 2007). 8 This coefficient is from PG&E’s February 2005 CCAR report to the Climate Registry. The report for SCWA was based on 0.73 lb-CO2/kWh used by the Western Systems Coordinating Council for California and Nevada utilities.

Appendix C: Rosenblum Environmental Engineering Study
Santa Rosa Utilities Greenhouse Gas Study 59
complexity, SCWA’s purchasing contract was changed significantly in January 20059, providing less access to hydropower.
2. Since all of the electricity for the booster pumps is “market” power, the difference in GHG emissions between the boosters and SCWA is much smaller than difference in electricity use. In other words, even though annual energy use for SCWA is ~5 times higher than for the boosters, hydropower reduces SCWA’s GHG emissions to only 2.6 times higher than the boosters (changes significantly from the average depending on the availability of hydropower).
Laguna Wastewater Plant Energy Use and Costs Figure 5 shows electricity use for Santa Rosa’s wastewater10. Usage for the lift stations is insignificant compared to treatment. Total electricity (purchased+cogeneration) is generally higher in wet winter months, and lower in summer. Electricity purchased from PG&E is generally higher in the wet winter months, while electricity provided by on-site cogeneration is relatively stable (although there is a minor increase in summer months that displaces relatively more purchased electricity). On average 40% of annual the Laguna plant electrical energy is provided by cogeneration, and 60% purchased from PG&E. However, a more detailed examination of the cogeneration system reveals significant changes at the end of 2005.
9 Until 2005, SCWA had a direct contract with the Western Area Power Authority (WAPA) to purchase hydropower. In 2005 Federal rules for purchasing hydropower changed, and now SCWA purchases WAPA hydropower through the Power and Water Pooling Authority (PWRPA). 10 Electricity for the lift stations is billed directly to Santa Rosa. Santa Rosa’s allocation of Laguna plant electricity can be extracted from Table A4 by dividing Santa Rosa’s combined wastewater and I&I by the Laguna Influent’s combined wastewater and I&I.

Appendix C: Rosenblum Environmental Engineering Study
Santa Rosa Utilities Greenhouse Gas Study 60
FIGURE 4
GHG EMISSIONS FOR SANTA ROSA WATER SUPPLY
0
50
100
150
200
250
300
Jan-04
Feb-04
Mar-04
Apr-04
May-04
Jun-04
Jul-0
4
Aug-04
Sep-04
Oct-04
Nov-04
Dec-04
Jan-05
Feb-05
Mar-05
Apr-05
May-05
Jun-05
Jul-0
5
Aug-05
Sep-05
Oct-05
Nov-05
Dec-05
ton-
CO
2/m
onth
SCWABOOSTERSWELLS
FIGURE 5
ELECTRICITY USED FOR SANTA ROSA WASTEWATER TREATMENT
0
200
400
600
800
1,000
1,200
1,400
1,600
1,800
2,000
2,200
2,400
Jan-04
Feb-04
Mar-04
Apr-04
May-04
Jun-04
Jul-0
4
Aug-04
Sep-04
Oct-04
Nov-04
Dec-04
Jan-05
Feb-05
Mar-05
Apr-05
May-05
Jun-05
Jul-0
5
Aug-05
Sep-05
Oct-05
Nov-05
Dec-05
MW
h/m
onth
LAGUNA COGENLAGUNA PG&ELIFT

Appendix C: Rosenblum Environmental Engineering Study
Santa Rosa Utilities Greenhouse Gas Study 61
Figure 611 shows the total fuel inputs (not only Santa Rosa’s portion) to the cogeneration system, and its electrical output. At the end of 2005 plant operators reduced the use of natural gas and generated much less electricity. Further examination reveals that this was driven by sharp increase in natural gas costs.
FIGURE 6
TOTAL INPUTS AND OUTPUTS FOR LAGUNA PLANT COGENERATION
0
20,000
40,000
60,000
80,000
100,000
120,000
140,000
160,000
Jan-04
Feb-04
Mar-04
Apr-04
May-04
Jun-04
Jul-0
4
Aug-04
Sep-04
Oct-04
Nov-04
Dec-04
Jan-05
Feb-05
Mar-05
Apr-05
May-05
Jun-05
Jul-0
5
Aug-05
Sep-05
Oct-05
Nov-05
Dec-05
Fuel
Inpu
t (Th
erm
s/m
onth
)
0
200,000
400,000
600,000
800,000
1,000,000
1,200,000
Elec
tric
al O
utpu
t (kW
h/m
onth
)
N.GASBIOGASELECTRICITY
Figure 7 shows energy costs for Santa Rosa’s wastewater12, revealing that natural gas costs were generally increasing. Between May and August 2005 natural gas costs increased 60% even though Figure 6 shows that biogas use, natural gas use, and cogeneration electrical output were very similar. Although the pattern of electricity costs is more variable and complex13, the sharp increase at the end of 2005 is clearly related to the reduction in cogeneration output shown in Figure 6. Further examination of natural gas and electricity rates reveals the basis for these trends.
11 Same as Figure C/1-3, and derived from Laguna plant records. 12 Cost for the lift stations is billed directly to Santa Rosa. Santa Rosa’s allocation of Laguna plant energy costs can be extracted from Table C/1-4 by dividing Santa Rosa’s combined wastewater and I&I by the Laguna Plant’s total combined influent wastewater and I&I. 13 Influenced by weather, influent volume, cogeneration output, and PG&E’s seasonal rates.

Appendix C: Rosenblum Environmental Engineering Study
Santa Rosa Utilities Greenhouse Gas Study 62
FIGURE 7
ENERGY COSTS FOR SANTA ROSA WASTEWATER TREATMENT
$0
$20,000
$40,000
$60,000
$80,000
$100,000
$120,000
$140,000
Jan-04
Feb-04
Mar-04
Apr-04
May-04
Jun-04
Jul-0
4
Aug-04
Sep-04
Oct-04
Nov-04
Dec-04
Jan-05
Feb-05
Mar-05
Apr-05
May-05
Jun-05
Jul-0
5
Aug-05
Sep-05
Oct-05
Nov-05
Dec-05
$/m
onth
LIFT (Elec)LAGUNA (N.Gas)LAGUNA (Elec)
Figure 8 shows natural gas rates, electricity rates, and the unit energy cost of cogeneration (gas cost divided by net electrical output). The Laguna plant purchased natural gas at steadily increasing rates from PG&E until January 2005, when a new purchasing contact with the Association of Bay Area Governments (ABAG) began. From January 2005 PG&E was paid only for transmission while the commodity cost was paid to ABAG. Until July 2005, the much lower ABAG commodity rate reduced and stabilized unit cogeneration costs. In July 2005, ABAG sharply increased rates, causing the unit energy cost of cogeneration to increase while PG&E’s already low14 electricity rates were decreasing. In September 2005, the unit cost of cogeneration was higher than PG&E’s electricity rate. This meant that it was cheaper to buy electricity than cogenerate. Starting in October, less natural gas was purchased, which increased the fraction of “free” biogas and reduced the unit cost of cogeneration. Figure 9 shows Santa Rosa’s allocation of the Laguna plant’s monthly GHG emissions, revealing that emissions from fuel (biogas and natural gas) for cogeneration are much larger than for electricity purchases (GHG emissions from the lift stations’ electricity use are almost insignificant15). The cogeneration system is the largest source of GHG emissions in Santa Rosa’s urban water/wastewater system.
14 The Laguna plant purchases high voltage electrical power from PG&E at a much lower electricity rate than for standard 480 V power (because the substation was financed by the plant and is located on site). 15 However unit energy use (kWh/MG) indicates that efficiency improvements could be significant.
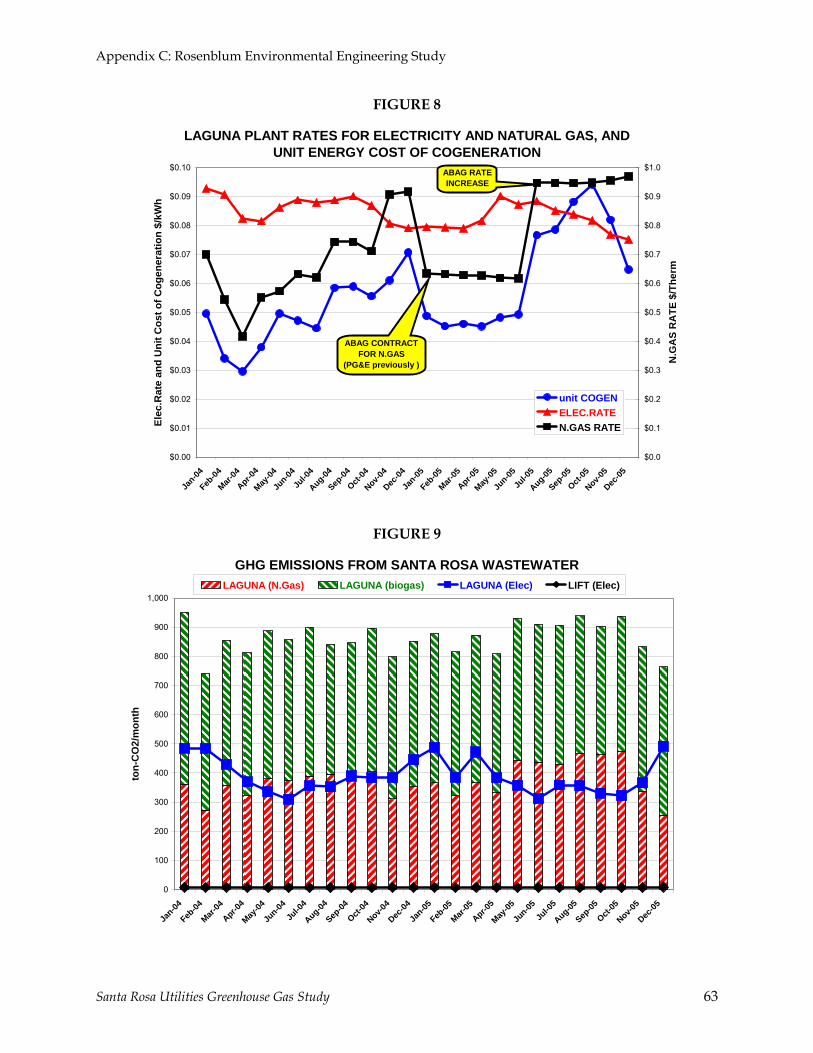
Appendix C: Rosenblum Environmental Engineering Study
Santa Rosa Utilities Greenhouse Gas Study 63
FIGURE 8
LAGUNA PLANT RATES FOR ELECTRICITY AND NATURAL GAS, AND UNIT ENERGY COST OF COGENERATION
$0.00
$0.01
$0.02
$0.03
$0.04
$0.05
$0.06
$0.07
$0.08
$0.09
$0.10
Jan-04
Feb-04
Mar-04
Apr-04
May-04
Jun-04
Jul-0
4Aug-04Sep
-04Oct-
04Nov-0
4Dec
-04Ja
n-05Feb
-05Mar-
05Apr-0
5May
-05Ju
n-05Ju
l-05
Aug-05Sep
-05Oct-
05Nov-0
5Dec
-05
Elec
.Rat
e an
d U
nit C
ost o
f Cog
ener
atio
n $/
kWh
$0.0
$0.1
$0.2
$0.3
$0.4
$0.5
$0.6
$0.7
$0.8
$0.9
$1.0
N.G
AS
RA
TE $
/The
rm
unit COGENELEC.RATEN.GAS RATE
ABAG CONTRACTFOR N.GAS
(PG&E previously )
ABAG RATEINCREASE
FIGURE 9
GHG EMISSIONS FROM SANTA ROSA WASTEWATER
0
100
200
300
400
500
600
700
800
900
1,000
Jan-04
Feb-04
Mar-04
Apr-04
May-04
Jun-04
Jul-0
4
Aug-04
Sep-04
Oct-04
Nov-04
Dec-04
Jan-05
Feb-05
Mar-05
Apr-05
May-05
Jun-05
Jul-0
5
Aug-05
Sep-05
Oct-05
Nov-05
Dec-05
ton-
CO
2/m
onth
LAGUNA (N.Gas) LAGUNA (biogas) LAGUNA (Elec) LIFT (Elec)

Appendix C: Rosenblum Environmental Engineering Study
Santa Rosa Utilities Greenhouse Gas Study 64
At the Laguna plant, electricity from the existing cogeneration system will always have higher GHG emissions than an equal amount of electricity purchased from PG&E. This is because (a) PG&E has a very low GHG emissions factor due to a large fraction of renewable, large hydropower, and nuclear in its supply portfolio, (b) cogeneration systems have lower fuel-to-electricity conversion efficiencies than large central power plants16, and (c) the biogas fueling the Laguna plant cogeneration system has a much higher GHG emissions factor than natural gas17. On the other hand, since biogas is a renewable fuel, its combustion emissions are not counted in GHG inventories18. PG&E’s GHG inventory emissions factor is 0.489 lb-CO2/kWh while the Laguna plant cogeneration system’s is 0.802 lb-CO2/kWh19, however the cogeneration system also provides digester heating and eliminates the need to flare surplus biogas20. Even without counting biogas, natural gas combustion in the cogeneration system still represents 57% of the Laguna plant GHG inventory. Besides the GHG inventory emissions it is worthwhile tracking total GHG emissions, including both natural gas and biogas, to identify and optimize the cost-effectiveness of various improvements that could be integrated into upgrades needed for the digesters and cogeneration system21, 22 (more details in Appendix C/2): 1. Increasing biogas production to displace natural gas. 2. Maximizing utilization of exhaust heat. 3. Increasing the efficiency of electricity generation. 4. Stripping CO2 from the biogas before combustion. 5. Compressing the methane fraction of biogas for sale off-site23.
Reclaimed Wastewater Figure 10 shows Santa Rosa’s allocation24 of the volume of reclaimed wastewater delivered from the Laguna plant to the Geysers and to irrigation pumps. As expected, demand for irrigation is
16 Cogeneration systems range from 25-30% efficiency, while central plants range from 30-40%. However, transmission losses between central plants and end-users are 6-13% (Small is Profitable, Rocky Mountain Institute, 2002, p.211-213). 17 Biogas contains 29% CO2 (by volume) before combustion, and only 64% methane, while natural gas is 92% methane. 18 The Climate Protection Campaign adheres to the Greenhouse Gas Protocol (GHG Protocol) which is the most widely used international accounting tool for government and business leaders to understand, quantify, and manage greenhouse gas emission (The GHG Protocol is a decade-long partnership between the World Resources Institute and the World Business Council for Sustainable Development). 19 This is from 2004-2005 data for natural gas purchases and total electrical output (i.e. excluding biogas as a fuel but including its electrical output). 20 Required for safety but also converts methane to a much lower CO2 emission. 21 City of Santa Rosa Power Master Plan, Brown & Caldwell 2006. 22 Laguna Subregional Water Reclamation Facility Final Biosolids Program, Phase II, Brown & Caldwell 2003. 23 Which implies eliminating or severely downsizing on-site cogeneration. 24 Santa Rosa’s allocation of Laguna plant’s reclaimed wastewater is according to influent volume, and can be extracted from Table C/1-4 by dividing Santa Rosa’s combined wastewater and I&I by the Laguna Plant’s total combined influent wastewater and I&I.

Appendix C: Rosenblum Environmental Engineering Study
Santa Rosa Utilities Greenhouse Gas Study 65
high in summer and almost zero in winter. Delivery to the Geysers is made according to an annual target of 12,300 AF/yr (4,000 MG/yr)25. Laguna plant staff can reduce deliveries to the Geysers to 4 MGD during irrigation season and raise deliveries in wet season months. Figure 10 shows that this was done in 2004, but not so dramatically in 2005.
FIGURE 10
VOLUME OF SANTA ROSA RECLAIMED WASTEWATER
0
100
200
300
400
500
600
700
800
900
Jan-04
Feb-04
Mar-04
Apr-04
May-04
Jun-04
Jul-0
4
Aug-04
Sep-04
Oct-04
Nov-04
Dec-04
Jan-05
Feb-05
Mar-05
Apr-05
May-05
Jun-05
Jul-0
5
Aug-05
Sep-05
Oct-05
Nov-05
Dec-05
MG
/mon
th
GEYSERSIRRIGATION
Figure 11 shows that Santa Rosa’s allocation of reclaimed wastewater electricity use follows the seasonal variation in volumes. Figure 12 shows that Santa Rosa’s allocation of electricity costs for reclaimed wastewater electricity follows the variation in volumes. High summer electricity rates sharply increase costs for irrigation, while the cost for the Geysers pumps is not influenced by seasonal rates – only by volume. Figure 12 shows the difference in rates for the months with the maximum irrigation demand in 2004 and 2005. The Geysers pump station operates from the Laguna plant’s high voltage electricity supply, with relatively low and stable rates ($0.082-0.086/kWh). The irrigation pumps operate from PG&E’s low voltage retail supply, with seasonal rates that peak in summer when irrigation demand is highest26.
25 2005 UWMP, p.5-7 26 The highest peak rates can be avoided by not irrigating from noon to 6pm on summer weekdays, but most irrigators do not have either automation or night-time staff.
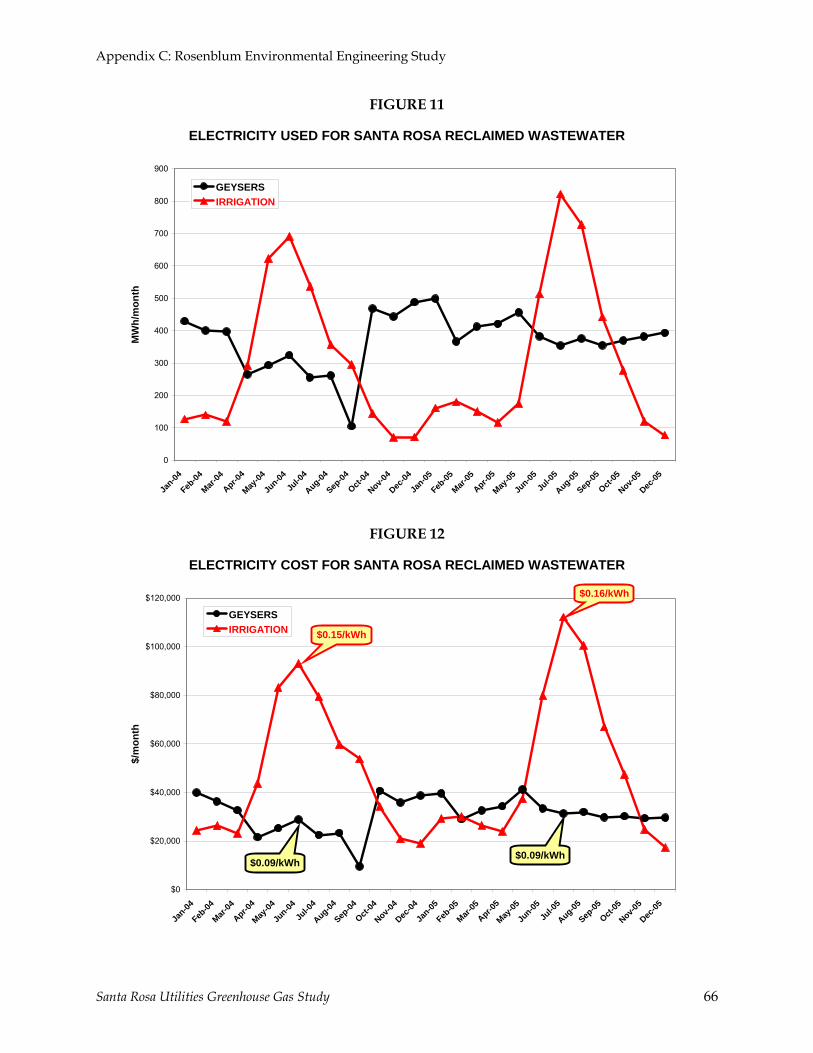
Appendix C: Rosenblum Environmental Engineering Study
Santa Rosa Utilities Greenhouse Gas Study 66
FIGURE 11
ELECTRICITY USED FOR SANTA ROSA RECLAIMED WASTEWATER
0
100
200
300
400
500
600
700
800
900
Jan-04
Feb-04
Mar-04
Apr-04
May-04
Jun-04
Jul-0
4
Aug-04
Sep-04
Oct-04
Nov-04
Dec-04
Jan-05
Feb-05
Mar-05
Apr-05
May-05
Jun-05
Jul-0
5
Aug-05
Sep-05
Oct-05
Nov-05
Dec-05
MW
h/m
onth
GEYSERSIRRIGATION
FIGURE 12
ELECTRICITY COST FOR SANTA ROSA RECLAIMED WASTEWATER
$0
$20,000
$40,000
$60,000
$80,000
$100,000
$120,000
Jan-04
Feb-04
Mar-04
Apr-04
May-04
Jun-04
Jul-0
4
Aug-04
Sep-04
Oct-04
Nov-04
Dec-04
Jan-05
Feb-05
Mar-05
Apr-05
May-05
Jun-05
Jul-0
5
Aug-05
Sep-05
Oct-05
Nov-05
Dec-05
$/m
onth
GEYSERSIRRIGATION $0.15/kWh
$0.16/kWh
$0.09/kWh$0.09/kWh

Appendix C: Rosenblum Environmental Engineering Study
Santa Rosa Utilities Greenhouse Gas Study 67
GHG Emissions
Overview The Climate Protection Campaign adheres to the Greenhouse Gas Protocol (GHG Protocol) which is the most widely used international accounting tool for government and business leaders to understand, quantify, and manage greenhouse gas emissions27. In this report, emissions within the GHG Protocol are referred to as “GHG inventory”, while total emissions, including those outside the boundaries of the GHG Protocol are referred to as “total GHG”. For this report, the terms are defined as follows: • GHG Inventory – CO2 emissions only from the use of fossil fuels to operate
water/wastewater equipment within the jurisdictional boundaries of the City of Santa Rosa Utilities Department.
• Total GHG – all CO2 emissions from supplying water and treating wastewater for the City of Santa Rosa.
This section will separate the GHG inventory from total GHG emissions for water supply and wastewater treatment at the Laguna plant. Not all GHG emissions, nor all regional elements of Santa Rosa’s water supply and wastewater treatment system are included in the Santa Rosa Utilities Department GHG inventory: 1. The energy used by SCWA to supply water to Santa Rosa, and its GHG emissions, are
already included in SCWA’s inventory. However it is useful to track this embedded energy and its GHG emissions so that the upstream impact of Santa Rosa’s water efficiency programs can be evaluated and become the basis of regional cooperation between Santa Rosa, SCWA, and other SCWA contractors28.
2. Biogas produced at the Laguna plant is a renewable fuel, and is not counted in GHG inventories that focus on the impact of non-renewable fossil fuels. However, optimization of upgrades needed for the digester/cogeneration system requires tracking all fuel inputs including biogas (see Appendix C/2). This would be especially important in future multi-jurisdictional cooperation to reduce regional GHG emissions with the Laguna plant at the center of a regional biofuels system.
Water Supply Figure 13 recasts Figure 4 to separate annual water-supply GHG emissions from SCWA and Santa Rosa (GHG emissions from the wells are insignificant). The reason for the large increase for SCWA in 2005 - even though 8% less electricity was used - was a change in SCWA’s electricity supply mix (as explained for Figure 4). In 2004, Santa Rosa’s GHG emissions were 44% of the total; in 2005 only 28%.
27 The GHG Protocol is a decade-long partnership between the World Resources Institute and the World Business Council for Sustainable Development. 28 Contractor is the term used for the municipal water retailers supplied by SCWA.

Appendix C: Rosenblum Environmental Engineering Study
Santa Rosa Utilities Greenhouse Gas Study 68
FIGURE 13
GHG EMISSIONS FROM WATER SUPPLY OPERATIONS
16 10
830 770
1,070
1,990
0
500
1,000
1,500
2,000
2,500
3,000
2004 2005
Tons
-CO
2/ye
ar
SCWABOOSTERSWELLS
Laguna Plant Figure 9 showed that GHG emissions from cogeneration are the largest element of the Laguna plant’s total GHG emissions. Figure 14 recasts Figure 9 for annual GHG emissions, showing no significant difference between 2004 and 2005. Total GHG emissions average 12,800 tons-CO2/year of which 43% are from biogas combustion. Without biogas, Santa Rosa’s average GHG inventory for wastewater is therefore only 7,300 tons-CO2/year.
Comparison of Annual Energy, Costs, and GHG Emissions
Water Supply and Wastewater Treatment Elements Figure 15 shows the total electricity used in 2005 for all elements of Santa Rosa’s water supply and wastewater treatment. It includes SCWA’s electricity use and biogas use at the Laguna plant, which are not part of the GHG inventory. However, since SCWA electricity use has such large GHG emissions – of which Santa Rosa is responsible for at least 25%29 - multi-jurisdictional efforts to reduce regional GHG emissions in the future will need to understand where they are triggered. The same regional effort will benefit from tracking and optimizing total fuel use in
29 Derived from data in Sonoma County Water Agency Greenhouse Gas Emissions from Water Supply Operations: Current Inventory and Potential Reductions, Rosenblum Environmental Engineering, 2006 (Appendix to Sonoma County Water Agency Final Report: Greenhouse Gas Emissions, Energy Use and Emissions Reduction Potential Climate Protection Campaign, 2007).

Appendix C: Rosenblum Environmental Engineering Study
Santa Rosa Utilities Greenhouse Gas Study 69
the Laguna plant cogeneration system – especially if it becomes the heart of a regional biofuels system.
FIGURE 14
ANNUAL GHG EMISSIONS FROM SANTA ROSA WASTEWATER
60 60
3,160 3,100
3,920 4,270
5,580 5,470
0
2,000
4,000
6,000
8,000
10,000
12,000
14,000
2004 2005
tons
-CO
2/ye
ar
LAGUNA (biogas)LAGUNA (N.Gas)LAGUNA (Elec)LIFT (Elec)
FIGURE 15
2005 TOTAL ELECTRICTY USE FOR SANTA ROSA WATER/WASTEWATER
23040
0
2,000
4,000
6,000
8,000
10,000
12,000
14,000
16,000
18,000
SCWAWATER
WELLWATER
WATERBOOSTERS
W/W LIFT W/W N.GAS W/WBIOGAS
W/W PG&EELEC
W/WRECLAIM
MW
h/ye
ar
cogeneration
TOTAL 49,740 MWh/yrnot inGHG inventory
not inGHG inventory

Appendix C: Rosenblum Environmental Engineering Study
Santa Rosa Utilities Greenhouse Gas Study 70
Figure 16 shows total energy (electricity and natural gas) costs in 2005 for all elements of Santa Rosa’s water supply and wastewater treatment. The total shows SCWA’s very large electricity cost, which is embedded in the cost of water and is not charged separately to Santa Rosa. The energy cost of biogas is zero, but the Laguna plant does incur other operating costs (e.g. labor) in producing biogas.
FIGURE 16
2005 TOTAL ENERGY COSTS FOR SANTA ROSA WATER/WASTEWATER
$33,900$0$4,400
$0
$200,000
$400,000
$600,000
$800,000
$1,000,000
$1,200,000
$1,400,000
SCWAWATER
WELLWATER
WATERBOOSTERS
W/W LIFT W/W N.GAS W/WBIOGAS
W/W PG&EELEC
W/WRECLAIM
$/ye
ar
TOTAL $4,162,300/yrnot in
GHG inventory
Figure 17 shows total GHG emissions in 2005 for all elements of Santa Rosa’s water supply and wastewater treatment. It includes GHG emissions from SCWA’s electricity use and from biogas use at the Laguna plant, which are not part of the GHG inventory. SCWA’s GHG emissions are smaller than for other elements, even though its electricity use and costs are larger. This is because SCWA’s electricity mix includes a large fraction of hydropower which reduces emissions (see discussion for Figure 4). Since SCWA’s GHG emissions still represent 11% of the total, they will be an important factor in regional efforts to reduce GHG emissions. The largest GHG emissions - 64% of the total - are from the combustion of natural gas and biogas for cogeneration at the Laguna plant (36% of the fuel emissions are from biogas). Although the biogas emissions are not part of Santa Rosa’s GHG inventory, they must be tracked to optimize total fuel use in the Laguna plant cogeneration system – especially if it becomes the heart of a regional biofuels system.
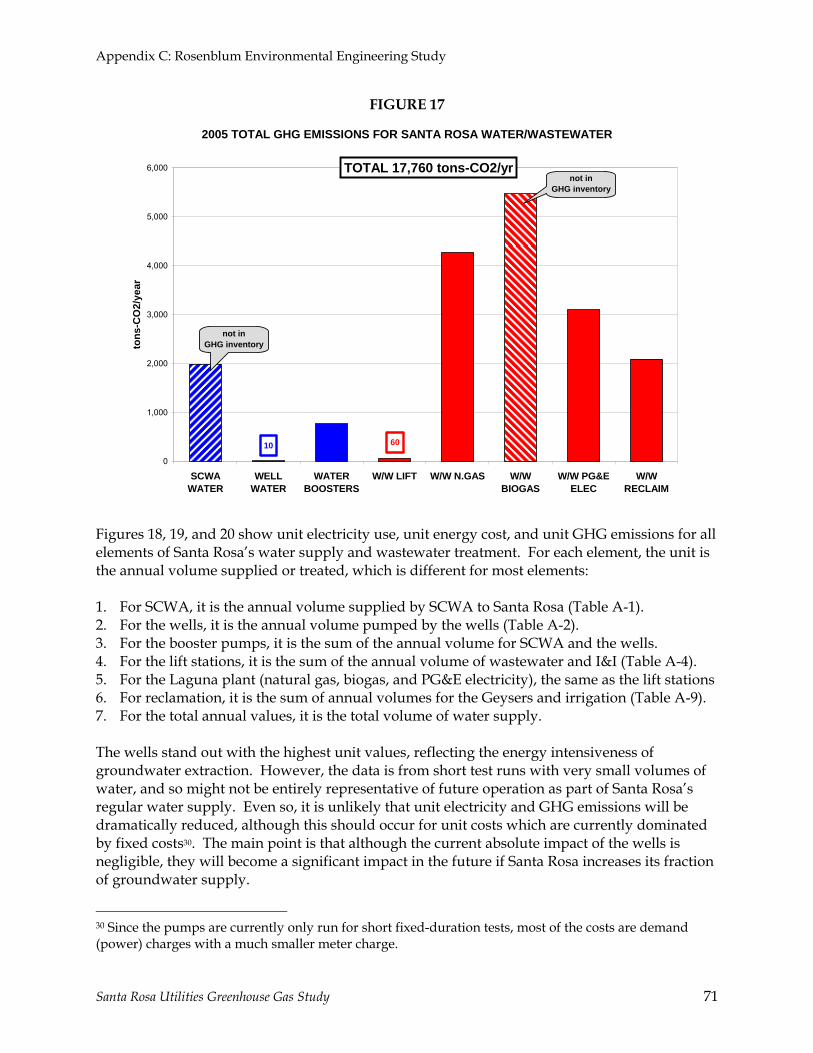
Appendix C: Rosenblum Environmental Engineering Study
Santa Rosa Utilities Greenhouse Gas Study 71
FIGURE 17
2005 TOTAL GHG EMISSIONS FOR SANTA ROSA WATER/WASTEWATER
6010
0
1,000
2,000
3,000
4,000
5,000
6,000
SCWAWATER
WELLWATER
WATERBOOSTERS
W/W LIFT W/W N.GAS W/WBIOGAS
W/W PG&EELEC
W/WRECLAIM
tons
-CO
2/ye
ar
TOTAL 17,760 tons-CO2/yr
not inGHG inventory
not inGHG inventory
Figures 18, 19, and 20 show unit electricity use, unit energy cost, and unit GHG emissions for all elements of Santa Rosa’s water supply and wastewater treatment. For each element, the unit is the annual volume supplied or treated, which is different for most elements: 1. For SCWA, it is the annual volume supplied by SCWA to Santa Rosa (Table A-1). 2. For the wells, it is the annual volume pumped by the wells (Table A-2). 3. For the booster pumps, it is the sum of the annual volume for SCWA and the wells. 4. For the lift stations, it is the sum of the annual volume of wastewater and I&I (Table A-4). 5. For the Laguna plant (natural gas, biogas, and PG&E electricity), the same as the lift stations 6. For reclamation, it is the sum of annual volumes for the Geysers and irrigation (Table A-9). 7. For the total annual values, it is the total volume of water supply. The wells stand out with the highest unit values, reflecting the energy intensiveness of groundwater extraction. However, the data is from short test runs with very small volumes of water, and so might not be entirely representative of future operation as part of Santa Rosa’s regular water supply. Even so, it is unlikely that unit electricity and GHG emissions will be dramatically reduced, although this should occur for unit costs which are currently dominated by fixed costs30. The main point is that although the current absolute impact of the wells is negligible, they will become a significant impact in the future if Santa Rosa increases its fraction of groundwater supply.
30 Since the pumps are currently only run for short fixed-duration tests, most of the costs are demand (power) charges with a much smaller meter charge.

Appendix C: Rosenblum Environmental Engineering Study
Santa Rosa Utilities Greenhouse Gas Study 72
FIGURE 18
2005 TOTAL UNIT ELECTRICTY USE FOR SANTA ROSA WATER/WASTEWATER
0.04
0.0
0.5
1.0
1.5
2.0
2.5
3.0
3.5
4.0
4.5
SCWAWATER
WELLWATER
WATERBOOSTERS
W/W LIFT W/W N.GAS W/WBIOGAS
W/W PG&EELEC
W/WRECLAIM
MW
h/M
G
cogeneration
TOTAL 6.7 MWh/MG-water supply
not inGHG inventory
not inGHG inventory
FIGURE 19
2005 TOTAL UNIT ENERGY COSTS FOR SANTA ROSA WATER/WASTEWATER
$5$0
$0
$50
$100
$150
$200
$250
$300
$350
$400
$450
SCWAWATER
WELLWATER
WATERBOOSTERS
W/W LIFT W/W N.GAS W/WBIOGAS
W/W PG&EELEC
W/WRECLAIM
$/M
G
TOTAL $557/MG-water supply
not inGHG inventory

Appendix C: Rosenblum Environmental Engineering Study
Santa Rosa Utilities Greenhouse Gas Study 73
FIGURE 20
2005 TOTAL UNIT GHG EMISSIONS FOR SANTA ROSA WATER/WASTEWATER
0.01
0.0
0.1
0.2
0.3
0.4
0.5
0.6
0.7
0.8
0.9
1.0
1.1
SCWAWATER
WELLWATER
WATERBOOSTERS
W/W LIFT W/W N.GAS W/WBIOGAS
W/W PG&EELEC
W/WRECLAIM
tons
-CO
2/M
G
TOTAL 2.4 tons-CO2/MG-water supply
not inGHG inventory
not inGHG inventory
Total GHG Emissions and GHG Inventory Emissions In this report, emissions within the GHG Protocol31 are referred to as “GHG inventory”, while total emissions are referred to as “total GHG”. The terms are defined as follows: • GHG Inventory – CO2 emissions only from the use of fossil fuels to operate
water/wastewater equipment within the jurisdictional boundaries of the City of Santa Rosa Utilities Department.
• Total GHG – all CO2 emissions from supplying water and treating wastewater for the City of Santa Rosa.
Not all GHG emissions, nor all regional elements of Santa Rosa’s water supply and wastewater treatment system are included in the Santa Rosa Utilities Department GHG inventory: 1. The energy used by SCWA to supply water to Santa Rosa, and its GHG emissions, are
already included in SCWA’s inventory. However it is useful to track this embedded energy and its GHG emissions so that the upstream impact of Santa Rosa’s water efficiency
31 The Climate Protection Campaign adheres to the Greenhouse Gas Protocol (GHG Protocol) which is the most widely used international accounting tool for government and business leaders to understand, quantify, and manage greenhouse gas emission (The GHG Protocol is a decade-long partnership between the World Resources Institute and the World Business Council for Sustainable Development).

Appendix C: Rosenblum Environmental Engineering Study
Santa Rosa Utilities Greenhouse Gas Study 74
programs can be evaluated and become the basis of regional cooperation between Santa Rosa, SCWA, and other SCWA contractors32.
2. Biogas produced at the Laguna plant is a renewable fuel, and is not counted in GHG inventories that focus on the impact of non-renewable fossil fuels. However, optimization of upgrades needed for the digester/cogeneration system requires tracking all fuel inputs including biogas (see Appendix C/2). This would be especially important in future multi-jurisdictional cooperation to reduce regional GHG emissions with the Laguna plant at the center of a regional biofuels system.
Figure 21 compares electricity use for all the water and wastewater elements included in total GHG emissions (the sum of all the elements in Figure 15, including cogeneration) with the GHG inventory. Wastewater requires more electricity, in total and for the inventory. The difference between total and inventory is much larger for water since 83% of the electricity is for SCWA’s water supply33.
FIGURE 21
2005 ELECTRICITY USE FOR SANTA ROSA WATER/WASTEWATER
19,170
30,570
3,210
21,460
0
5,000
10,000
15,000
20,000
25,000
30,000
35,000
WATER WASTEWATER
MW
h/ye
ar
TOTAL GHGGHG INVENTORY
Figure 22 compares energy costs for all the water and wastewater elements included in total GHG emissions (the sum of all the elements in Figure 16, including SCWA) with the GHG inventory. Wastewater costs more, in total and for the inventory. There is no difference between total and inventory for wastewater since all costs are for elements included in both
32 Contractor is the term used for the municipal water retailers supplied by SCWA. 33 From Tables C/1-1, C/1-2, and C/1-3, total electricity for water supply is 19,170 MWh/yr, of which SCWA requires 15,960 MWh/yr.

Appendix C: Rosenblum Environmental Engineering Study
Santa Rosa Utilities Greenhouse Gas Study 75
categories; for water, 79% of the costs are for SCWA’s water supply which is not included in Santa Rosa’s inventory34.
FIGURE 22
2005 ENERGY COST FOR SANTA ROSA WATER/WASTEWATER
$1,519,400
$319,400
$2,642,900
$0
$500,000
$1,000,000
$1,500,000
$2,000,000
$2,500,000
$3,000,000
WATER WASTEWATER
$/ye
ar
TOTAL GHGGHG INVENTORY
Figure 23 compares GHG emissions for all the water and wastewater elements included in total GHG emissions (the sum of all the elements in Figure 17, including SCWA and biogas) with the GHG inventory. Wastewater has much larger GHG emissions, in total and for the inventory. The difference between total and inventory is much larger for water since 72% of the emissions are from SCWA’s water supply (see Figure 13). Figures 24, 25, and 26 show the unit values for electricity, energy costs, and GHG emissions. For water, the unit volume is the total annual water demand (SCWA plus Santa Rosa’s wells)35; for wastewater, the unit value is annual influent to the Laguna plant (wastewater plus I&I)36.
34 From Tables C/1-1, C/1-2, and C/1-3, total energy costs for water supply are $1.52 million/yr, of which SCWA’s share is $1.2 million/yr. 35 From Table C/1-3 for the booster pumps. 36 From Table C/1-4 for Santa Rosa.

Appendix C: Rosenblum Environmental Engineering Study
Santa Rosa Utilities Greenhouse Gas Study 76
FIGURE 23
2005 GHG EMISSIONS FOR SANTA ROSA WATER/WASTEWATER
2,770
14,990
780
9,520
0
2,000
4,000
6,000
8,000
10,000
12,000
14,000
16,000
WATER WASTEWATER
ton-
CO
2/ye
ar
TOTAL GHGGHG INVENTORY
FIGURE 24
2005 UNIT ELECTRICITY FOR SANTA ROSA WATER/WASTEWATER
2.6
4.7
0.4
3.3
0.0
0.5
1.0
1.5
2.0
2.5
3.0
3.5
4.0
4.5
5.0
WATER WASTEWATER
MW
h/M
G
TOTAL GHGGHG INVENTORY

Appendix C: Rosenblum Environmental Engineering Study
Santa Rosa Utilities Greenhouse Gas Study 77
FIGURE 25
2005 UNIT ENERGY COST FOR SANTA ROSA WATER/WASTEWATER
$203
$43
$410
$0
$50
$100
$150
$200
$250
$300
$350
$400
$450
WATER WASTEWATER
$/M
G
TOTAL GHGGHG INVENTORY
FIGURE 26
2005 UNIT GHG EMISSIONS FOR SANTA ROSA WATER/WASTEWATER
0.4
2.3
0.1
1.5
0.0
0.5
1.0
1.5
2.0
2.5
WATER WASTEWATER
ton-
CO
2/M
G
TOTAL GHGGHG INVENTORY

Appendix C: Rosenblum Environmental Engineering Study
Santa Rosa Utilities Greenhouse Gas Study 78
Annual Variations in GHG Emissions Annual variations in water use, energy demands, costs, and GHG emissions can be quite large due to complex interactions between weather conditions, regulatory/administrative changes, and technical factors. It is not valid to use baseline unit energy, cost, and GHG emissions to project trends into the future. Understanding the specific performance of individual elements and their interactions, and then aggregating into a system-wide impact is the only valid method to project future GHG emissions. Figure 27 compares Santa Rosa’s total GHG emissions and the GHG inventory from water and wastewater operations, for 2004 and 2005. The 45% increase in total emissions for water between the years - even with a 5% reduction in water volume - is driven by the change in SCWA’s electricity supply mix (resulting in less hydropower, as explained for Figure 4). For wastewater, total GHG emissions increase only 3% from 2004 to 2005 as wastewater volume increases 9.5%. The main cautionary conclusion from Figure 27 is that GHG emissions are not dependent only on volume, and do not even trend in the same direction so unit values cannot be extrapolated without paying careful attention to details.
FIGURE 27
2004 & 2005 GHG EMISSIONS FOR SANTA ROSA WATER/WASTEWATER
0
1,000
2,000
3,000
4,000
5,000
6,000
7,000
8,000
9,000
10,000
11,000
12,000
13,000
14,000
15,000
16,000
2004 TOTAL 2004 INVENTORY 2005 TOTAL 2005 INVENTORY
tons
-CO
2/ye
ar
WASTEWATERWATER
45% change in GHG (-5% change in water volume)
3% change in GHG (9.5% change in
wastewater volume)
Figure 28 compares Santa Rosa’s electricity use for all water and wastewater elements included in total GHG emissions and in the GHG inventory, for 2004 and 2005. For water, total electricity

Appendix C: Rosenblum Environmental Engineering Study
Santa Rosa Utilities Greenhouse Gas Study 79
decreased 8% as water volume decreased 5% from 2004 to 200537, accenting the overwhelming impact of the change in SCWA’s electricity supply mix on total GHG emissions (a 45% increase in emissions with an 8% reduction in electricity38). For wastewater, electricity increased only 2.5% as wastewater volume increased 9.5% - almost the same as total GHG emissions.
FIGURE 28
2005 & 2004 ELECTRICITY USE FOR SANTA ROSA WATER/WASTEWATER
0
2,000
4,000
6,000
8,000
10,000
12,000
14,000
16,000
18,000
20,000
22,000
24,000
26,000
28,000
30,000
32,000
2004 TOTAL 2004 INVENTORY 2005 TOTAL 2005 INVENTORY
MW
h/ye
ar
WASTEWATERWATER
-8% change in electricity (-5% change
in water volume)
2.5% change in electricity (9.5% change in wastewater volume)
Since the differences in electricity use and total GHG emissions are almost completely masked when considering only the GHG inventory, identifying effective measures to reduce emissions from the inventory would be difficult, and completely misleading.
Community Context of GHG Emissions from Water/Wastewater Operations
Overview The City of Santa Rosa’s water/wastewater operations are only a small fraction of the energy required by customers during their use of water (e.g. for heating water). Consequently, the City’s Utilities Department GHG emissions are much smaller than those of the customers’
37 This could be a reflection of the quadratic relationship between electrical power and flowrate shown in Sonoma County Water Agency Final Report: Greenhouse Gas Emissions, Energy Use and Emissions Reduction Potential Climate Protection Campaign, 2007. Essentially, as lower flows are needed, much less friction is developed in the aqueducts and pipelines. 38 Table C/1-12 reveals that total GHG per unit of electricity (ton-CO2/MWh) increased 59% for water from 2004 to 2005.

Appendix C: Rosenblum Environmental Engineering Study
Santa Rosa Utilities Greenhouse Gas Study 80
water-related energy requirements. This section compares the customers’ water-related GHG emissions with those of the City’s water/wastewater operations. The community context will demonstrate that the City’s actions (and SCWA’s) efforts to reduce GHG emissions can have a very large regional “multiplier effect” – especially from water efficiency programs. A 2005 report by the California Energy Commission (CEC)39 estimated that when including customers’ water-related energy, water (and wastewater) uses 19% of California’s annual electricity, and 32% of natural gas40. This estimate was based on a preliminary review of the CEC’s energy database, which although covering many years and divided into many specific user categories, is an aggregate for the State and does not clearly separate energy end-use for water. Table 1 is from the CEC report, and provides a rough comparison of energy use for water and wastewater operations against end-use water-related energy. For example, electricity use for urban water supply is only 27% of electricity end-uses for residential, commercial, and industrial sectors; wastewater treatment is only 7% of end-uses. A similar comparison for natural gas yields fractions that are less than 1%.
TABLE 1
Water-Related Energy Use in California in 2001 (Table 1-1, California’s Water-Energy Relationship: Final Staff Report, 2005)
Santa Rosa Water/Wastewater Operations Compared to End-Users The aggregated values in Table 1 are heavily influenced by Southern California, with a high energy requirement for supplying water from very distant sources, and relatively low energy
39 California’s Water-Energy Relationship: Final Staff Report, CEC-700-2005-011-SF, November 2005. 40 The database does include categories for urban and agricultural water supply, wastewater treatment, and even reclaimed wastewater, but does not, for example, separate water heating from other end-uses within different categories. The CEC is currently conducting a detailed review of the database and developing a methodology for extracting water-related energy use.

Appendix C: Rosenblum Environmental Engineering Study
Santa Rosa Utilities Greenhouse Gas Study 81
use for secondary wastewater treatment for ocean disposal from populous areas along the coast. In Northern California, water sources are much closer, while inland wastewater discharge and/or reclamation require much more energy to meet stringent water quality standards41. Figure 28 confirms that for Santa Rosa, electricity required for water supply is significantly less than for wastewater treatment. For this reason, and because detailed information was available from other CEC sources for residential uses – which make up 70% of water use in Santa Rosa – a site-specific version of Table 1 was created for Santa Rosa42, and shown in Table 2
TABLE 2
Water-Related Energy Use and GHG Emissions in Santa Rosa 2005 (From Table C/1-3 in Appendix C/1 of main report; Source: E.B. Orrett, Resource Performance Partners)
41 The 2005 CEC report discusses these differences in detail. 42 Appendix B in City of Santa Rosa Greenhouse Gas Emissions Related to Water and Wastewater Services: Baseline, Reduction Strategies, and Recommendations, Climate Protection Campaign, February 2008.
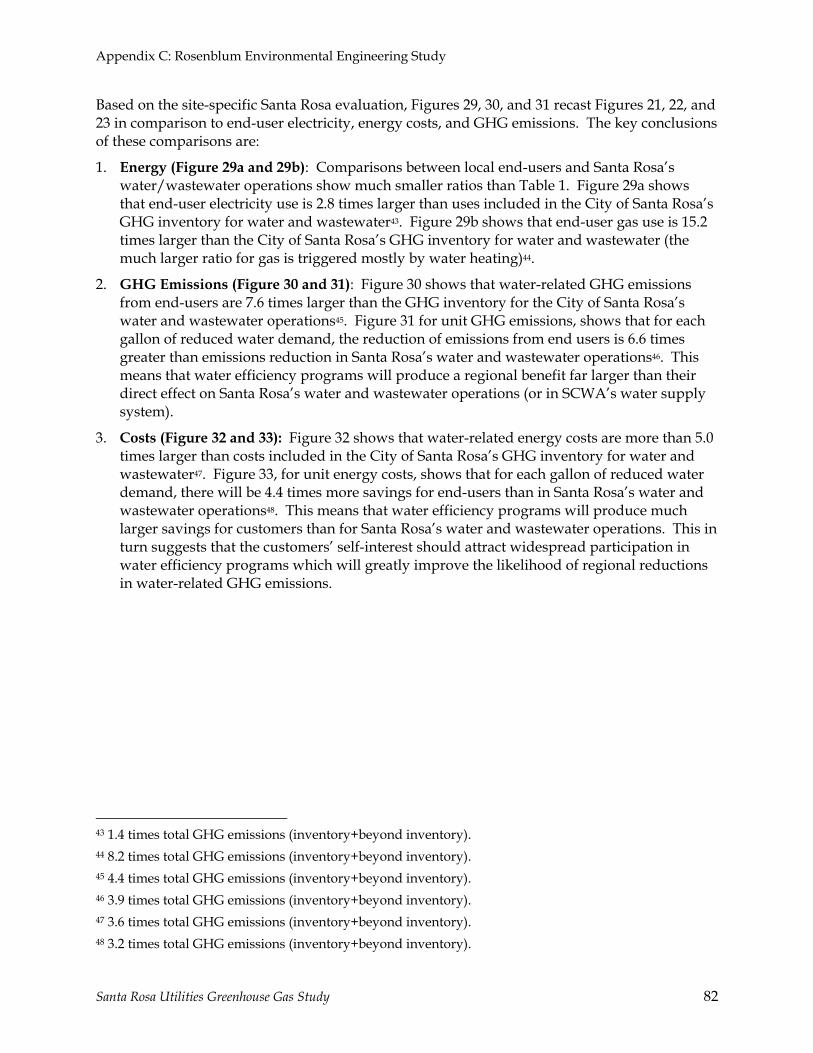
Appendix C: Rosenblum Environmental Engineering Study
Santa Rosa Utilities Greenhouse Gas Study 82
Based on the site-specific Santa Rosa evaluation, Figures 29, 30, and 31 recast Figures 21, 22, and 23 in comparison to end-user electricity, energy costs, and GHG emissions. The key conclusions of these comparisons are:
1. Energy (Figure 29a and 29b): Comparisons between local end-users and Santa Rosa’s water/wastewater operations show much smaller ratios than Table 1. Figure 29a shows that end-user electricity use is 2.8 times larger than uses included in the City of Santa Rosa’s GHG inventory for water and wastewater43. Figure 29b shows that end-user gas use is 15.2 times larger than the City of Santa Rosa’s GHG inventory for water and wastewater (the much larger ratio for gas is triggered mostly by water heating)44.
2. GHG Emissions (Figure 30 and 31): Figure 30 shows that water-related GHG emissions from end-users are 7.6 times larger than the GHG inventory for the City of Santa Rosa’s water and wastewater operations45. Figure 31 for unit GHG emissions, shows that for each gallon of reduced water demand, the reduction of emissions from end users is 6.6 times greater than emissions reduction in Santa Rosa’s water and wastewater operations46. This means that water efficiency programs will produce a regional benefit far larger than their direct effect on Santa Rosa’s water and wastewater operations (or in SCWA’s water supply system).
3. Costs (Figure 32 and 33): Figure 32 shows that water-related energy costs are more than 5.0 times larger than costs included in the City of Santa Rosa’s GHG inventory for water and wastewater47. Figure 33, for unit energy costs, shows that for each gallon of reduced water demand, there will be 4.4 times more savings for end-users than in Santa Rosa’s water and wastewater operations48. This means that water efficiency programs will produce much larger savings for customers than for Santa Rosa’s water and wastewater operations. This in turn suggests that the customers’ self-interest should attract widespread participation in water efficiency programs which will greatly improve the likelihood of regional reductions in water-related GHG emissions.
43 1.4 times total GHG emissions (inventory+beyond inventory). 44 8.2 times total GHG emissions (inventory+beyond inventory). 45 4.4 times total GHG emissions (inventory+beyond inventory). 46 3.9 times total GHG emissions (inventory+beyond inventory). 47 3.6 times total GHG emissions (inventory+beyond inventory). 48 3.2 times total GHG emissions (inventory+beyond inventory).

Appendix C: Rosenblum Environmental Engineering Study
Santa Rosa Utilities Greenhouse Gas Study 83
FIGURE 29a
2005 WATER-RELATED ELECTRICITY USE FOR SANTA ROSA
0
5,000
10,000
15,000
20,000
25,000
30,000
35,000
40,000
45,000
50,000
55,000
60,000
65,000
70,000
WATER SUPPLY WASTEWATER TREATMENT END-USERS
MW
h/ye
ar
BEYOND INVENTORYGHG INVENTORY
2.8 times more than the inventory for water
and wastewater
FIGURE 29b
2005 WATER-RELATED GAS USE FOR SANTA ROSA
00
1,000,000
2,000,000
3,000,000
4,000,000
5,000,000
6,000,000
7,000,000
8,000,000
9,000,000
10,000,000
11,000,000
12,000,000
WATER SUPPLY WASTEWATER TREATMENT END-USERS
Ther
ms/
year
BEYOND INVENTORYGHG INVENTORY
622,000 biogas
730,000 nat.gas
15.2 times more than the inventory for water
and wastewater

Appendix C: Rosenblum Environmental Engineering Study
Santa Rosa Utilities Greenhouse Gas Study 84
FIGURE 30
2005 WATER-RELATED GHG EMISSIONS FOR SANTA ROSA
0
10,000
20,000
30,000
40,000
50,000
60,000
70,000
80,000
WATER SUPPLY WASTEWATER TREATMENT END-USERS
tons
-CO
2/ye
ar
BEYOND INVENTORYGHG INVENTORY
780
1,990
7.6 times more than the inventory for water
and wastewater
FIGURE 31
2005 WATER-RELATED UNIT GHG EMISSIONS FOR SANTA ROSA
0
1
2
3
4
5
6
7
8
9
10
11
WATER SUPPLY WASTEWATER TREATMENT END-USERS
tons
-CO
2/M
G
BEYOND INVENTORYGHG INVENTORY
0.1
0.3
6.6 times more than the inventory for water
and wastewater
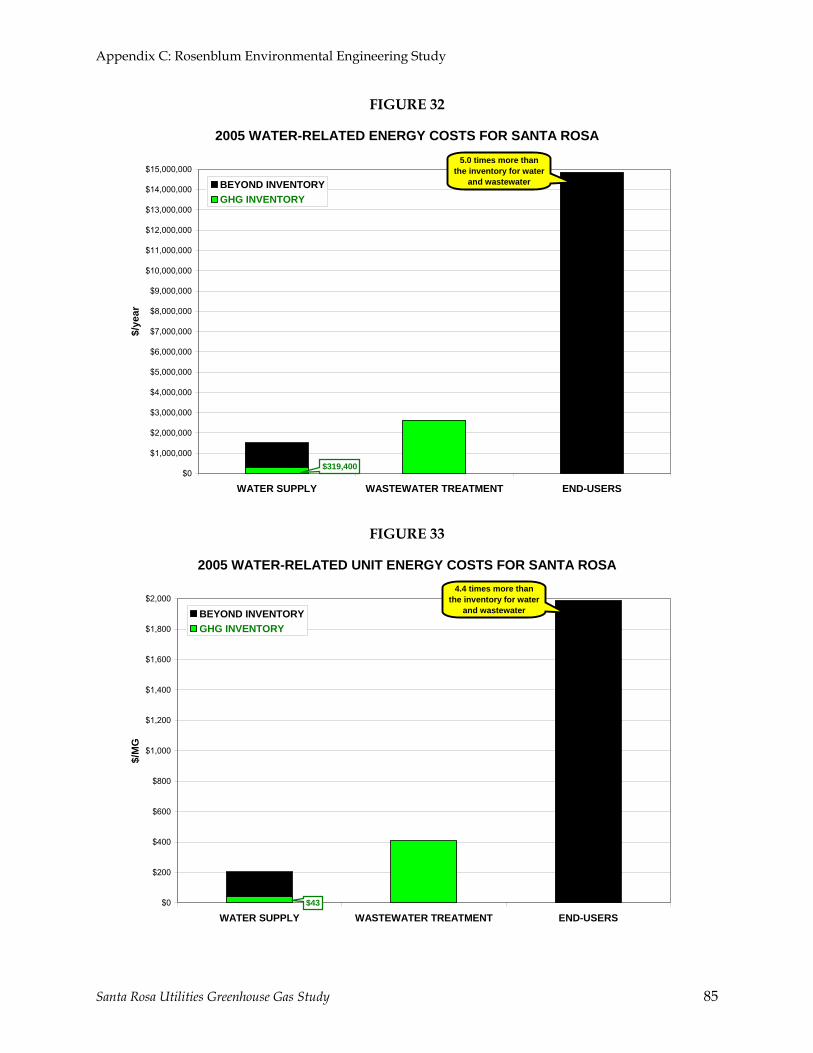
Appendix C: Rosenblum Environmental Engineering Study
Santa Rosa Utilities Greenhouse Gas Study 85
FIGURE 32
2005 WATER-RELATED ENERGY COSTS FOR SANTA ROSA
$0
$1,000,000
$2,000,000
$3,000,000
$4,000,000
$5,000,000
$6,000,000
$7,000,000
$8,000,000
$9,000,000
$10,000,000
$11,000,000
$12,000,000
$13,000,000
$14,000,000
$15,000,000
WATER SUPPLY WASTEWATER TREATMENT END-USERS
$/ye
ar
BEYOND INVENTORYGHG INVENTORY
$319,400
5.0 times more than the inventory for water
and wastewater
FIGURE 33
2005 WATER-RELATED UNIT ENERGY COSTS FOR SANTA ROSA
$0
$200
$400
$600
$800
$1,000
$1,200
$1,400
$1,600
$1,800
$2,000
WATER SUPPLY WASTEWATER TREATMENT END-USERS
$/M
G
BEYOND INVENTORYGHG INVENTORY
$43
4.4 times more than the inventory for water
and wastewater

Appendix C: Rosenblum Environmental Engineering Study
Santa Rosa Utilities Greenhouse Gas Study 86
GHG Benefits and Emissions from Santa Rosa’s Geysers Recharge Project To reduce effluent discharges to the Russian River as water quality limitations became increasingly stringent, the City of Santa Rosa invested approximately $200 million in a pipeline and pumping stations to deliver 11 MGD to Calpine Corporation’s geothermal facilities at The Geysers. The project has been operating since October 2003 and injection of Santa Rosa’s reclaimed water has helped stabilize electrical energy output from The Geysers. The project has reduced wastewater impacts in the Laguna de Santa Rosa and lower Russian River, reduced GHG emissions in PG&E’s service area, assured regulatory compliance for the City of Santa Rosa, and increased earnings for Calpine Corporation. Appendix C/3 contains a detailed description and evaluation of GHG emissions and benefits of the Geysers project. The two main measures taken to stabilize electricity production at The Geysers and extend the useful life of the geothermal field are: 1. Reducing steam extraction rates and turbine operation far below the unsustainable levels of
the late 1980s. In practice this means operating the turbines at a 55% average annual utilization factor (i.e. 55% of the energy output possible from running the turbines at their full rated power capacity for 8,760 hrs/year).
2. Recharging the field by injecting condensate, creek water, and reclaimed wastewater from Lake County via the South Eastern Geysers Effluent Pipeline (SEGEP) and Santa Rosa’s Geysers Recharge Project (SRGRP). Since only an average of 27% of the injected water is converted to steam, steam production would not have stabilized without simultaneously reducing turbine operation.
Figure C/3-3 shows that by 2006, the injection projects had restored 146 MW of electrical power capacity. Based on the volume composition of the injected water49, a power output capacity of 86 MW can be allocated to SRGRP. Figure C/3-3 also confirms that steam production has been stabilized compared to the rapid declines shown in Figure C/3-2 for previous years, but it was still declining in 2006 at the rate of 3.5%/yr. Skillful optimization of turbine operations will help extend cost-effective electricity production for quite some time, but annual electrical output will eventually decline. In this report greenhouse gas (GHG) emissions are calculated according to the Greenhouse Gas Protocol (GHG Protocol) 50 which is the most widely used tool for quantifying GHG inventories. Although The Geysers is a low carbon source of electricity, there are measurable CO2 and CH4 releases in non-condensable gases. These gases are from a geological source and must be counted in the GHG Inventory. The injected wastewater does not contain gases from geological sources so its GHG emissions will be zero. Based on available information about the blend of
49 In 2006 11.7 billion gallons were injected: 35% SRGRP, 31.5% condensate, 17.5% creek water, and 16% SEGEP. 50 The GHG Protocol is a decade-long partnership between the World Resources Institute and the World Business Council for Sustainable Development.

Appendix C: Rosenblum Environmental Engineering Study
Santa Rosa Utilities Greenhouse Gas Study 87
steam from geological sources and from injected water, the GHG emissions factor for the Geysers was estimated at 0.1394 lb-CO2/kWh. This emissions factor is 71.5% lower than PG&E’s emissions factor of 0.489 lb-CO2/kWh. Electricity for the Geysers pumps at the Laguna plant is supplied from PG&E, and is thus included in both the total GHG emissions and in Santa Rosa’s GHG inventory. Electricity supplied by Calpine Corporation from the Geysers geothermal power plants to lift the reclaimed wastewater 3,300 ft and then distribute it to injection wells is not included in Santa Rosa’s GHG inventory. This pumping is an element of Calpine’s operations, and is an auxiliary load from which to calculate net electrical output and GHG emissions from the geothermal plants. Figure C/3-5 shows that the Calpine pump stations used 86% of the total electrical energy needed for reclaimed wastewater operations. However, due to the low GHG emissions factor of the Geysers, Figure C-6 shows that the use of geothermal electricity generates only 63% of the total GHG emissions from reclaimed wastewater operations. Even though Calpine’s electricity use is a water-related end-use, an estimate is required to fully identify the net GHG impact of the SRGRP — and to compare it with other options for reclaimed wastewater that might provide larger reductions in GHG emissions and displace potable water demands. For example, if significant water efficiency improvements become part of a future regional effort to reduce GHG emissions, reducing summer pumping to the Geysers to increase local irrigation with reclaimed wastewater might yield a more sustainable and more cost-effective overall reduction in Santa Rosa’s GHG emissions51. Looking into the future, there seems to be considerable opportunity for combined optimization of reclaimed wastewater applications and managing steam extraction at the Geysers. Pumping reclaimed wastewater to The Geysers reduces the need to discharge wastewater into the Laguna de Santa Rosa, and helps extend low GHG electricity production at The Geysers. In other words, the SRGRP is a wastewater compliance project that provides net reductions in GHG emissions. Although the Geysers electricity is defined as renewable52, Santa Rosa cannot claim it as a GHG emissions offset because it is part of Calpine’s portfolio. When Calpine sells electricity from the Geysers, the GHG offsets are then re-allocated to the purchasers, which is why a premium is charged for “low carbon” or “green” power. Geothermal energy - almost all from the Geysers - accounts for 2% of PG&E’s electricity, and is included PG&E’s remarkably low GHG emissions factor. 51 Local urban landscape irrigation would sharply reduce peak summer energy use to deliver potable water for urban irrigation (Sonoma County Water Agency Greenhouse Gas Emissions from Water Supply Operations: Current Inventory and Potential Reductions, Rosenblum Environmental Engineering, 2006). Less energy would be used by the Laguna plant Geysers pumps to support local irrigation than pumping to the first Calpine lift station. Besides GHG reductions, the reduction in pumping to the Geysers would allow Calpine to sell more electricity at higher summer rates. To make up for the summer reductions, winter deliveries to The Geysers could be increased, depending on pipeline and storage capacities, operational requirements of the injection wells, and contractual obligations. 52 As explained in Appendix C/3, there is an inevitable decline in steam production even with all the recharge projects – but the 3.5%/yr rate of decline in 2006 is dramatically lower than the 25%/yr of the late 1980s.

Appendix C: Rosenblum Environmental Engineering Study
Santa Rosa Utilities Greenhouse Gas Study 88
Figure 34 compares the GHG emissions from Santa Rosa’s portion of the SRGRP in 2005 with the GHG emissions that would have been otherwise generated by PG&E53. The net reduction in GHG emissions is 41,000 tons-CO2/yr.
FIGURE 34
(Same as Figure C/3-7)
1,1703,590
25,000
0
10,000
20,000
30,000
40,000
50,000
60,000
70,000
Santa Rosa's portion of SRGRP PG&E (for NET OUTPUT)
tons
-CO
2/yr
GHG EMISSIONS FROM THE GEYSERS PROJECT (2005)
NET OUTPUTCALPINE PUMPSLAGUNA PUMPSAVOIDED GHG
41,000 tons-CO2/yr
Figure 35 is an extension of Figure 30, and shows that the Geysers net electrical output from Santa Rosa’s portion of the SRGRP could offset 47% of total GHG emissions from City water/wastewater operations and customers’ use of water. However, it must be noted that these offsets have already been allocated to other entities. Even though Santa Rosa cannot claim GHG emissions offsets – nor income – the Geysers project demonstrates how the City’s infrastructure investments contribute far beyond jurisdictional limits (especially across PG&E’s service area).
53 Appendix C/3 estimates a net electrical output of 261,800 MWh/yr restored at the Geysers with Santa Rosa’s portion of SRGRP. PG&E avoided purchasing this energy from other sources with higher GHG emissions.

Appendix C: Rosenblum Environmental Engineering Study
Santa Rosa Utilities Greenhouse Gas Study 89
FIGURE 35
-60,000
-40,000
-20,000
0
20,000
40,000
60,000
80,000
WATER SUPPLY WASTEWATER TREATMENT
END-USERS GEYSERS
tons
-CO
2/ye
ar
2005 WATER-RELATED GHG EMISSIONS FOR SANTA ROSA
BEYOND INVENTORYGHG INVENTORY
these offsets are already allocated to Calpine and its customers
Appendix C: Rosenblum Environmental Engineering Study
Santa Rosa Utilities Greenhouse Gas Study 90
Summary
Conclusions
The main conclusion is that the City of Santa Rosa’s water/wastewater operations use only a small fraction of the energy required by customers during their use of water, and that reductions in end-use water demands will on average: • Reduce 6.6 times more GHG emissions per gallon reduced from customers than from Santa
Rosa’s water and wastewater operations54. • Save 4.4 times more in energy costs per gallon reduced from customers than from Santa
Rosa’s water and wastewater operations 55. This suggests that customers’ financial self-interest should attract widespread participation in water efficiency programs –on top of rapidly growing public desire to contribute meaningfully to climate protection. Both factors greatly improve the likelihood that multi-jurisdictional cooperation on water efficiency programs could successfully reduce regional water-related GHG emissions. An evaluation of high-performance water efficiency products and measures in cities in the USA and abroad56 shows that reductions of 30-40% in water demands through efficiency are feasible, even in Santa Rosa. This reduction would be larger than the 32% increase in regional water demand due to population growth anticipated by SCWA for 202057 - and could significantly reduce large water and wastewater infrastructure expansion costs. Reducing these large infrastructure costs will offset implementation costs for efficiency measures. Although additional evaluation is needed to confirm cost-effectiveness (see Recommendations and Appendix C/4), it appears that water efficiency could reduce regional GHG emissions and energy costs by 2020, even with anticipated population growth. A companion report58 describes how high-performance water efficiency improvements may be achieved at relatively little cost to the City of Santa Rosa with a next-generation implementation system that (a) removes the market barriers experienced today, (b) recognizes energy cost
54 Based on Santa Rosa’s GHG inventory (the ratio would be 3.9 times based on total GHG emissions). It is important to recognize, however, that end use-related GHG savings are derived almost exclusively from indoor water efficiency measures that relate just to hot water. 55 Based on Santa Rosa’s GHG inventory (the ratio would be 3.2 times based on total GHG emissions). As noted above, these savings are developed from measures that address hot water. 56 Appendix F in City of Santa Rosa Greenhouse Gas Emissions Related to Water and Wastewater Services: Baseline, Reduction Strategies, and Recommendations, Climate Protection Campaign, February 2008. 57 Sonoma County Water Agency Greenhouse Gas Emissions from Water Supply Operations: Current Inventory and Potential Reductions, Rosenblum Environmental Engineering, 2006 (Appendix to Sonoma County Water Agency Final Report: Greenhouse Gas Emissions, Energy Use and Emissions Reduction Potential Climate Protection Campaign, 2007). 58 Appendix D in City of Santa Rosa Greenhouse Gas Emissions Related to Water and Wastewater Services: Baseline, Reduction Strategies, and Recommendations, Climate Protection Campaign, February 2008.

Appendix C: Rosenblum Environmental Engineering Study
Santa Rosa Utilities Greenhouse Gas Study 91
savings for customers, and (c) can utilize municipal bond financing to capitalize efficiency investments. All these elements were combined in a specific evaluation of how to develop such a high-performance water efficiency program for the City of Santa Rosa59. These reports imply that water efficiency could become the driving force for the largest possible water-related GHG reductions. Besides identifying the large opportunity for GHG reductions from water efficiency, this baseline for Santa Rosa also reveals the following: • Santa Rosa’s water demand triggers approximately one third of SCWA’s GHG emissions,
and conversely, SCWA's mix of electricity sources heavily impacts Santa Rosa’s water-related total GHG emissions. However it would be unwise for Santa Rosa to merely switch from SCWA's surface water supply to local groundwater because GHG emissions would increase, and so would costs. Cooperation between the City of Santa Rosa and SCWA on a high-performance water efficiency program will yield mutual benefits – and large regional GHG reductions.
• The GHG inventory encompasses only 50% of the electrical energy required for Santa Rosa’s water and wastewater operations and only 58% of total GHG emissions; which could be very misleading in guiding the search for cost-effective improvements. The search for effective regional GHG reduction measures will require tracking total GHG emissions rather than only the GHG inventory.
• Due to the complexity of interactions between regulatory, administrative, and technical factors it is not valid to use baseline unit water, energy, cost, and GHG emissions to project trends into the future. Understanding the specific performance of individual elements and their interactions, and then aggregating into a system-wide impact is the only way to project potential improvements. This is especially critical in considering the impacts of large reductions in water demands from a high-performance water efficiency program.
• Optimizing the digester/cogeneration system at the Laguna wastewater treatment plant could significantly reduce total GHG emissions, because natural gas and biogas combustion is by far the largest source. Optimization to increase biogas production and cogeneration efficiency could be included upgrades recommended by the recent Biosolids and Power Master Plans for the plant – especially when considered together rather than in separately. Beyond the Master Plan recommendations, finding ways to significantly increase utilization of cogeneration exhaust heat will be critical to offsetting GHG emissions.
• Most of the electricity and almost two thirds of the GHG emissions from reclaimed wastewater are from large pumps operated by Calpine Corporation to lift and distribute water to the Geysers geothermal power plant. Although the net reduction in GHG emissions from the Geysers project is very large – equal to 47% of all water related GHG emissions by the City and its customers – they are allocated to other entities and cannot be included in Santa Rosa's GHG inventory. If significant water efficiency improvements become part of a future regional effort to reduce GHG emissions, reducing summer pumping to the Geysers while increasing local irrigation to displace potable water demands might yield a more sustainable and more cost-effective option than pumping as much as possible to the Geysers – and should be evaluated.
59 Appendix E in City of Santa Rosa Greenhouse Gas Emissions Related to Water and Wastewater Services: Baseline, Reduction Strategies, and Recommendations, Climate Protection Campaign, February 2008.
Appendix C: Rosenblum Environmental Engineering Study
Santa Rosa Utilities Greenhouse Gas Study 92
Recommendations for Next Steps
This baseline evaluation is only the starting point for developing plans to reduce water-related GHG emissions - and water use itself - to sustainable levels. Since water efficiency has been identified as the largest opportunity, the first recommendation is to integrate a high-performance water efficiency program into the City of Santa Rosa and SCWA’s water and wastewater infrastructure plans, and County and State GHG reduction plans, such as: • The Laguna Subregional Incremental Recycled Wastewater Plan (IRWP). • The Laguna plant Power Master Plan (PMP). • The Laguna plant Biosolids Master Plan (BMP) • The City of Santa Rosa and SCWA’s Urban Water Management Plans (UWMPs). • SCWA’s Water Supply, Transmission, and Reliability Project (WSTR). • The City of Santa Rosa’s Rate Task Force’s water and wastewater rate-setting
model/procedures (RTF). • County GHG emissions reduction planning. • State (AB 32) GHG emissions reduction planning. Appendix C/4 provides a detailed list of factors to consider for integration of high-performance water efficiency into infrastructure projects and estimating future reductions in regional GHG emissions. Although the list of considerations is large and seemingly complex, existing reports for infrastructure plans (e.g. the water balances of the IRWP and UWMP) can be modified quite straightforwardly to integrate high performance water efficiency. While performing the preceding planning evaluation, the City of Santa Rosa should continue to monitor, evaluate and implement individual energy efficiency improvements within the water and wastewater system. Recent evaluations funded by PG&E, CPUC, and CEC energy efficiency programs have identified several cost-effective projects that can be implemented in the near future while more extensive planning is under way.

Appendix C: Rosenblum Environmental Engineering Study
Santa Rosa Utilities Greenhouse Gas Study 93
Appendix C/1:BASELINE (2004-2005) Data Sources
Sonoma County Water Agency (SCWA) Supply
Table C/1-1 shows the monthly volume, electrical energy, electricity cost, and GHG emissions for the City of Santa Rosa’s portion of the SCWA’s deliveries: 1. Volume was taken directly from SCWA records. 2. Electrical energy was calculated from SCWA’s energy used to deliver water to the Laguna
de Santa Rosa area cities of Santa Rosa, Rohnert Park, Cotati, Windsor, and Forestville (developed for the GHG emissions report for SCWA60), multiplied by Santa Rosa’s fraction of deliveries to the Laguna area.
3. Electricity costs were calculated by the same method used for electrical energy. 4. GHG emissions were calculated by the same method used for electrical energy, but were
reduced from GHG emissions report for SCWA to reflect PG&E’s revised emissions intensity of 0.489 lb-CO2/kWh61
City of Santa Rosa Wells
Table C/1-2 shows the monthly volume, electrical energy, electricity cost, and GHG emissions for the City of Santa Rosa’s wells: 1. The wells are currently not used for water supply, and the data is mainly from periodic
testing. There are five wells: • Carley Well (W2-1)
capacity 700 gpm pumped 2003-2006: 34,827,850 gal
• Peters Spring (W2-2) capacity 500 gpm pumped 2003-2006: 5,928,602 gal
• Leete Well (W-1) capacity 300 gpm pumped 2003-2006: 899,000 gal
• Farmers Ln. Well (W4-1) capacity 950 gpm pumped 2003-2006: 4,121,100 gal
• Farmers Ln. (W4-2) capacity 1,500 gpm pumped 2003-2006: 6,651,000 gal
60 Sonoma County Water Agency Greenhouse Gas Emissions from Water Supply Operations: Current Inventory and Potential Reductions, Rosenblum Environmental Engineering, 2006 (Appendix to Sonoma County Water Agency Final Report: Greenhouse Gas Emissions, Energy Use and Emissions Reduction Potential Climate Protection Campaign, 2007). 61 This coefficient is from PG&E’s February 2005 CCAR report to the Climate Registry. The report for SCWA was based on 0.73 lb-CO2/kWh used by the Western Systems Coordinating Council for California and Nevada utilities.
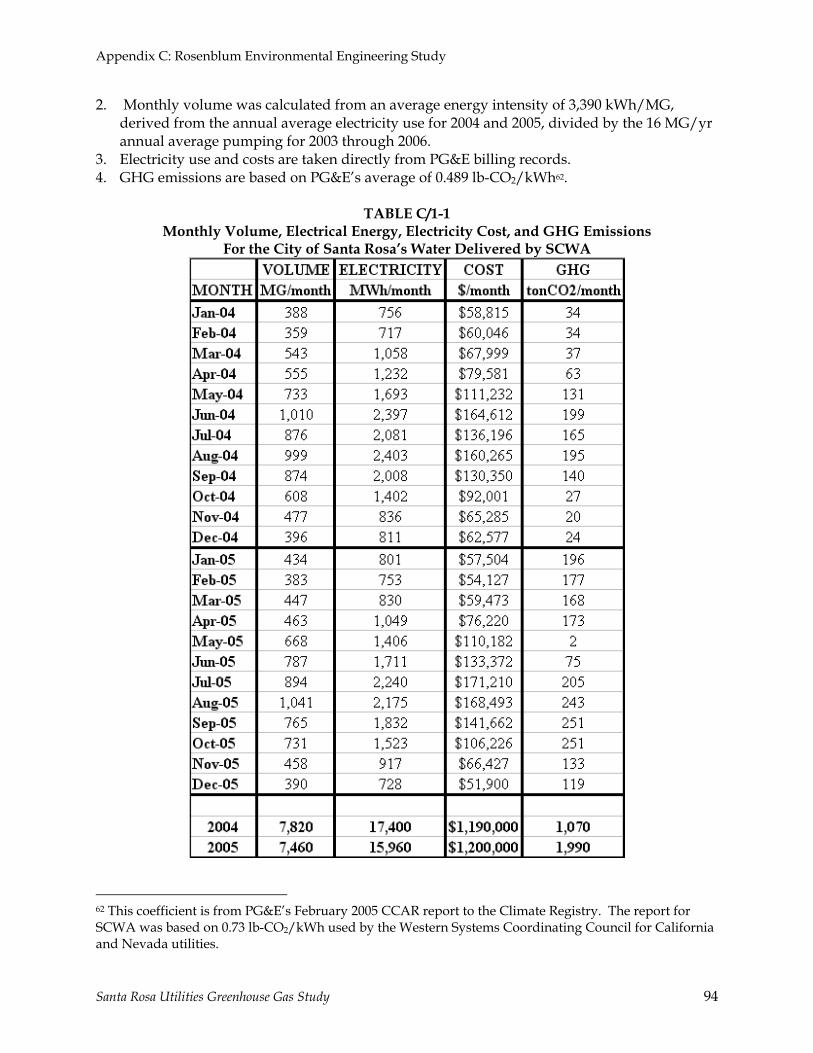
Appendix C: Rosenblum Environmental Engineering Study
Santa Rosa Utilities Greenhouse Gas Study 94
2. Monthly volume was calculated from an average energy intensity of 3,390 kWh/MG, derived from the annual average electricity use for 2004 and 2005, divided by the 16 MG/yr annual average pumping for 2003 through 2006.
3. Electricity use and costs are taken directly from PG&E billing records. 4. GHG emissions are based on PG&E’s average of 0.489 lb-CO2/kWh62.
TABLE C/1-1
Monthly Volume, Electrical Energy, Electricity Cost, and GHG Emissions For the City of Santa Rosa’s Water Delivered by SCWA
62 This coefficient is from PG&E’s February 2005 CCAR report to the Climate Registry. The report for SCWA was based on 0.73 lb-CO2/kWh used by the Western Systems Coordinating Council for California and Nevada utilities.

Appendix C: Rosenblum Environmental Engineering Study
Santa Rosa Utilities Greenhouse Gas Study 95
TABLE C/1-2 Monthly Volume, Electrical Energy, Electricity Cost, and GHG Emissions
For the City of Santa Rosa’s Wells
Water Booster Pumps
Table C/1-3 shows the monthly volume, electrical energy, electricity cost, and GHG emissions for the City of Santa Rosa’s water booster pumps: 1. Assuming that the booster pumps will transfer all water, from SCWA and the City’ wells (in
the future when they are used for water supply), volume is calculated as the sum of SCWA and the wells.
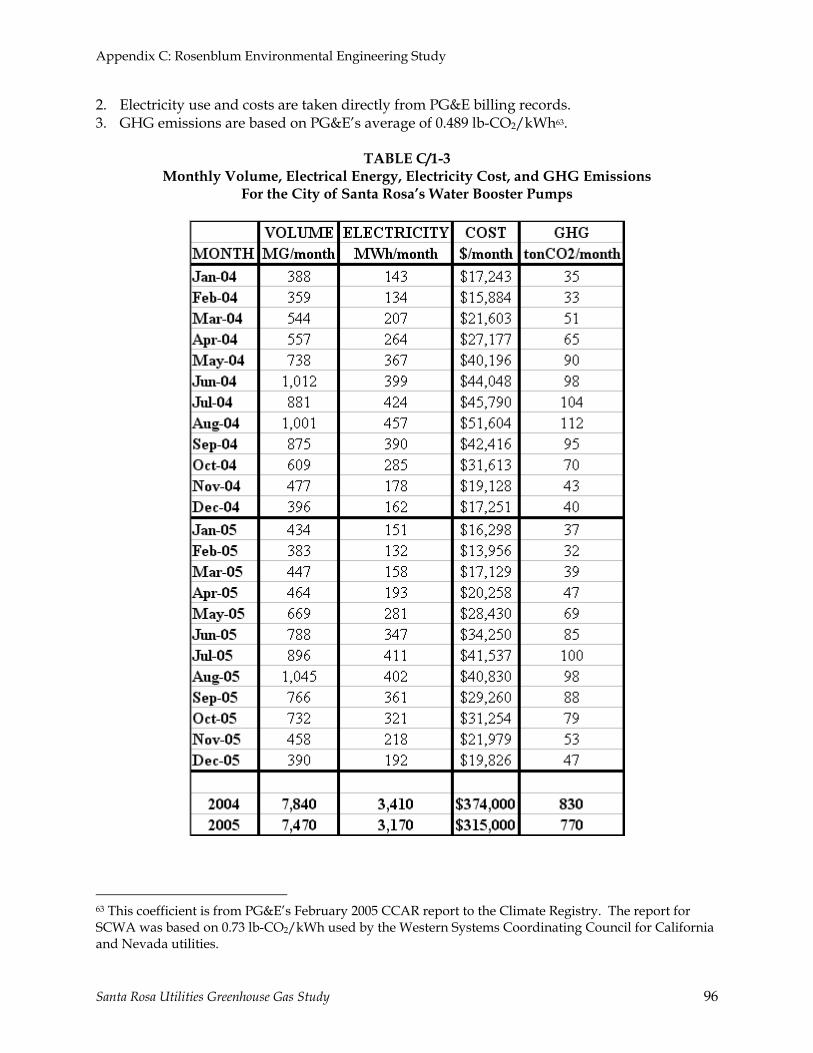
Appendix C: Rosenblum Environmental Engineering Study
Santa Rosa Utilities Greenhouse Gas Study 96
2. Electricity use and costs are taken directly from PG&E billing records. 3. GHG emissions are based on PG&E’s average of 0.489 lb-CO2/kWh63.
TABLE C/1-3
Monthly Volume, Electrical Energy, Electricity Cost, and GHG Emissions For the City of Santa Rosa’s Water Booster Pumps
63 This coefficient is from PG&E’s February 2005 CCAR report to the Climate Registry. The report for SCWA was based on 0.73 lb-CO2/kWh used by the Western Systems Coordinating Council for California and Nevada utilities.
Appendix C: Rosenblum Environmental Engineering Study
Santa Rosa Utilities Greenhouse Gas Study 97
Sewage Lift Stations, Wastewater, Inflow/Infiltration, And Indoor/Outdoor Water
The sewage lift stations pump not only wastewater, but also the wet weather inflow and infiltration (I&I) into the sewers. To estimate the total volume of wastewater and I&I it is necessary to compare and balance water supply data and influent data from the Laguna de Santa Rosa Regional Wastewater Treatment Plant (Laguna plant). The Laguna plant uses several meters to estimate monthly influent/effluent volumes: 1. Sewer trunk lines from Rohnert Park, Cotati, Sebastopol, and Santa Rosa (together with a
very small volume from an unincorporated area South West of the City). In general, the fractional volume distributions are: • Rohnert Park – 18.0% • Cotati – 2.6% • Sebastopol – 3.1% • Santa Rosa – 76.1%
2. Three plant meters, for total influent, the UV system, and total plant effluent. This evaluation uses the average to estimate the total combined wastewater and I&I.
The monthly influent from each city to the Laguna plant is calculated by multiplying the total combined wastewater and I&I by the monthly distribution fraction. For Rohnert Park, Cotati, and Sebastopol, it is assumed that the wastewater volume is equal to the minimum monthly dry weather influent volume for each year (i.e. without I&I). All volumes larger than the minimum are allocated to I&I. For Santa Rosa, water supply data was also included in the balancing of wastewater and I&I. The monthly influent to the Laguna plant is calculated in the same manner as the other cities, but wastewater is assumed equal to the minimum water demand during wet months (without outdoor demand). Simultaneously, I&I calculated as the influent minus wastewater, cannot be negative, so where necessary, I&I is set to zero and the wastewater volume adjusted upward64. This balancing was also carried over to the apportioning of monthly indoor (equal to wastewater) and outdoor water demand. In general, indoor water demand is assumed constant and equal to the minimum volume water demand during wet months (without outdoor demand) – the same as wastewater. Monthly outdoor water demand is then calculated as the difference between total water supply (from SCWA and the City’s wells) and the fixed indoor volume. Outdoor water demand is adjusted when the monthly wastewater volume (and therefore indoor water demand) is adjusted to avoid negative I&I. Table C/1-4 shows the monthly volumes of wastewater, I&I, and total influent to the Laguna plant. Figure C/1-1 shows the monthly volumes of wastewater and I&I in 2004 and 2005. The
64 This occurred in June-September 2004, and September/October 2005.

Appendix C: Rosenblum Environmental Engineering Study
Santa Rosa Utilities Greenhouse Gas Study 98
distribution of I&I follows wet weather patterns. In 2004 I&I was 20% of the combined influent, rising to 26% in 2005 because of the longer wet season (especially the storms in May).
TABLE C/1-4 Monthly Volume of Wastewater, I&I, and Total Influent to the Laguna Plant
FIGURE C/1-1
SANTA ROSA WASTEWATER AND INFLOW & INFILTRATION
0
100
200
300
400
500
600
700
800
Jan-04
Feb-04
Mar-04
Apr-04
May-04
Jun-04
Jul-0
4
Aug-04
Sep-04
Oct-04
Nov-04
Dec-04
Jan-05
Feb-05
Mar-05
Apr-05
May-05
Jun-05
Jul-0
5
Aug-05
Sep-05
Oct-05
Nov-05
Dec-05
MG
/mon
th
I&IW/W

Appendix C: Rosenblum Environmental Engineering Study
Santa Rosa Utilities Greenhouse Gas Study 99
Table C/1-5 and Figure C/1-2 show the distribution of indoor and outdoor water demands in Santa Rosa. On average 60% of demand is for indoor use and 40% for outdoors, although the longer wet season in 2005 reduced outdoor use by 15%.
TABLE C/1-5
Monthly Distribution of Indoor and Outdoor Water Demands in Santa Rosa

Appendix C: Rosenblum Environmental Engineering Study
Santa Rosa Utilities Greenhouse Gas Study 100
FIGURE C/1-2
SANTA ROSA INDOOR AND OUTDOOR WATER DEMANDS
0
200
400
600
800
1,000
1,200
Jan-04
Feb-04
Mar-04
Apr-04
May-04
Jun-04
Jul-0
4
Aug-04
Sep-04
Oct-04
Nov-04
Dec-04
Jan-05
Feb-05
Mar-05
Apr-05
May-05
Jun-05
Jul-0
5
Aug-05
Sep-05
Oct-05
Nov-05
Dec-05
MG
/mon
th
OUTDOORINDOOR (=WASTEWATER)
Table C/1-6 shows the monthly volume, electrical energy, electricity cost, and GHG emissions for the City of Santa Rosa’s sewage lift stations 1. Monthly volumes are from Table C/1-4 (Santa Rosa). 2. Electricity use and costs are taken directly from PG&E billing records. 3. GHG emissions are based on PG&E’s average of 0.489 lb-CO2/kWh65.
65 This coefficient is from PG&E’s February 2005 CCAR report to the Climate Registry. The report for SCWA was based on 0.73 lb-CO2/kWh used by the Western Systems Coordinating Council for California and Nevada utilities.
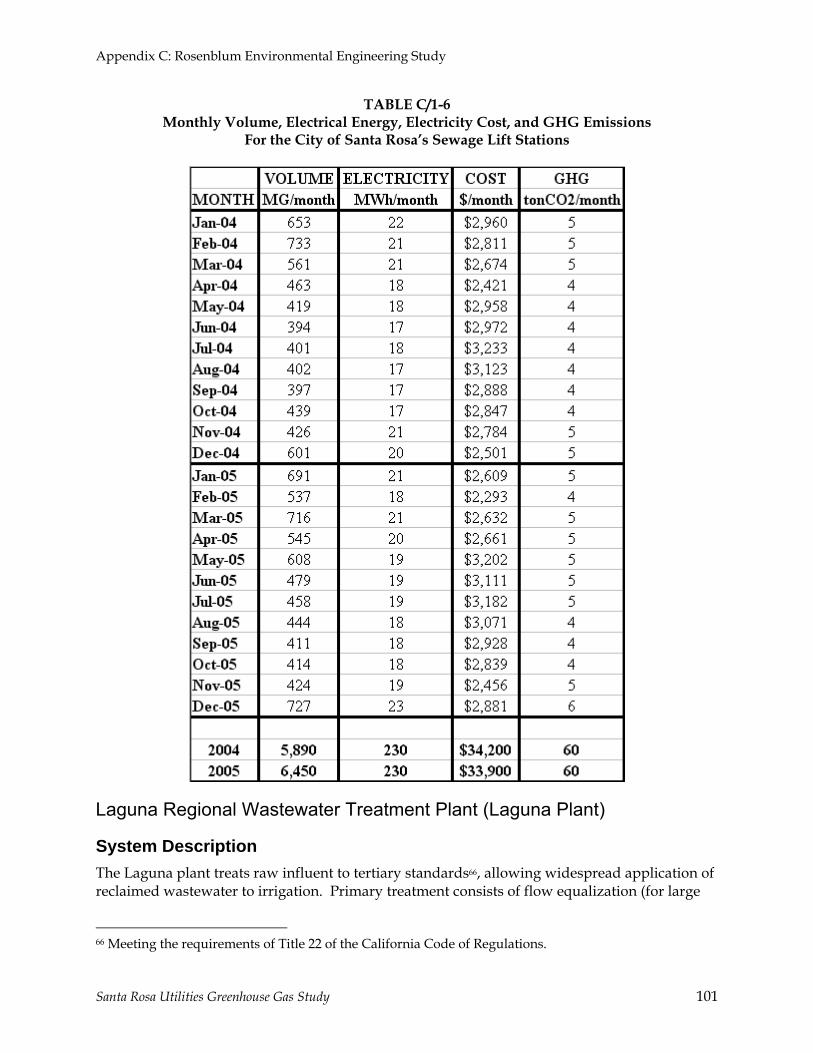
Appendix C: Rosenblum Environmental Engineering Study
Santa Rosa Utilities Greenhouse Gas Study 101
TABLE C/1-6 Monthly Volume, Electrical Energy, Electricity Cost, and GHG Emissions
For the City of Santa Rosa’s Sewage Lift Stations
Laguna Regional Wastewater Treatment Plant (Laguna Plant)
System Description The Laguna plant treats raw influent to tertiary standards66, allowing widespread application of reclaimed wastewater to irrigation. Primary treatment consists of flow equalization (for large
66 Meeting the requirements of Title 22 of the California Code of Regulations.
Appendix C: Rosenblum Environmental Engineering Study
Santa Rosa Utilities Greenhouse Gas Study 102
wet weather volumes), screening, and primary clarification. Primary treatment requires electricity for pumping, but sludge removed in the clarifier also provides the majority of the feed for production of biogas in the anaerobic digester. Secondary treatment consists of Activated Sludge reactors with Biological Nutrient Removal followed by secondary clarification. Large aeration blowers use approximately 15-20% of the plant’s electricity use, even after a successful energy efficiency upgrade in 200367. Low head/high flow recirculation pumps are also required for several stages in the process. Sludge from the clarifier is thickened, and then fed to the anaerobic digester to produce biogas. Tertiary treatment consists of filtration followed by Ultra Violet disinfection (supplemented by chlorination in wet weather). The UV lamps require approximately 30-35% of the plant’s electricity use. Some UV channels can be closed off during low flow conditions, but beyond that, power cannot be reduced very much without risking compliance with disinfection regulations68. On the other hand, the UV systems can be controlled by flowrate/detention time, water clarity/UV transmissivity, and adjusted for lamp age. Large pumps are required to pump the effluent from the filters, through the UV system, and then to the nearby first storage reservoir for reclaimed wastewater. The anaerobic digesters require electricity for sludge pumping, to feed and mix the digesters, and for flow through heat exchangers. Electricity is also required for dewatering the digested sludge. The combined demand is approximately 2-5% of the plant’s electricity use. Organic load drives electricity requirements for the aeration blowers and the digesters, while influent volume drives the much larger electricity demand for the rest of the plant. In general, this report assumes that currently 80% of the Laguna plant’s electricity use is related to volume and 20% to load69.
Biogas/Natural Gas Cogeneration Table C/1-7 shows Santa Rosa’s allocations of (a) the monthly influent to the Laguna plant, (b) natural gas energy use, cost and GHG emissions for the cogeneration system, (c) biogas energy production and GHG emissions, and (d) electrical energy output from the cogeneration system: 1. The monthly volume includes wastewater and I&I from Table C/1-4 for Santa Rosa. 2. Natural gas usage and costs were calculated from Laguna plant billing records, multiplied
by the monthly influent volume fraction for Santa Rosa70.
67 Energy Efficiency Upgrade for Aeration Blowers at the Laguna de Santa Rosa Subregional Wastewater Treatment Plant, Provimetrics, Inc., 2002. 68 The pathogen (“Coliform”) regulations are based on the results of a 72-hr incubation cycle, so reducing lamp power could result in 2-3 days of non-compliance. 69 This distribution will change significantly with large improvements in indoor water efficiency. 70 Derived from sewage flow metering. Represented in Table A4 by dividing Santa Rosa’s combined wastewater and I&I by the Laguna Influent’s combined wastewater and I&I.
Appendix C: Rosenblum Environmental Engineering Study
Santa Rosa Utilities Greenhouse Gas Study 103
3. Natural gas GHG emissions were calculated by applying 11.67 lb-CO2/Therm71. 4. Biogas energy production was calculated from Laguna plant volume data, with methane
providing 557.8 Btu/ft3 under the conditions in the digester72, multiplied by the monthly influent volume fraction for Santa Rosa.
5. Biogas GHG emissions were calculated by applying 11.67 lb-CO2/Therm73 for combustion of the methane, and adding 0.0329 lb-CO2/ft3 for the CO2 content under the conditions in the digester74. Although these emissions are from a renewable fuel and are not counted in GHG inventories, they are important for identifying potential improvements in digester operations.
6. Electrical output was calculated from Laguna plant data75, multiplied by the monthly influent volume fraction for Santa Rosa.
In Table C/1-7, the average electricity rate for 2004 was $0.086/kWh, and $0.082/kWh. In comparison, low voltage rates range from $0.12/kWh to as high as 0.15/kWh. Figure C/1-3 shows the total (not only Santa Rosa’s portion) fuel inputs to the cogeneration system, and its electrical output. For 2004 and 2005, 60% of the fuel was natural gas, but the plant operators can choose to use less and generate less electricity as can be seen at the end of 2005.
71 This value is the default value used by EPA’s Climate Leaders Program, (Climate Leaders Greenhouse Gas Inventory Protocol Core Module Guidance: Direct Emissions from Stationary Combustion Sources, EPA 2004), and is used to provide CPC with results in conformance with the program. However, assuming that natural gas is a standard mixture of 92.1% methane, 4.1% propane, 3.4% nitrogen, and 0.4% CO2 at 60°F and 14.7 psia atmospheric pressure, basic thermodynamics yields a value of 12.84 lb-CO2/kWh. 72 Based on thermodynamic calculations for a 7” H2O pressure, 90°F water-saturated mixture of 64% methane, 29% CO2, 4.7% water, and 3% other non-combustible gases. 73 This value is the default value used by EPA’s Climate Leaders Program, (Climate Leaders Greenhouse Gas Inventory Protocol Core Module Guidance: Direct Emissions from Stationary Combustion Sources, EPA 2004), and is used to provide CPC with results in conformance with the program. However, assuming that biogas is a water-saturated mixture of 64% methane, 29% CO2, 4.7% water, and 3% other non-combustible gases at 7” water pressure and 90°F, basic thermodynamics yields a value of 12.77 lb-CO2/kWh. 74 Based on thermodynamic calculations for a 7” H2O pressure, 90°F water-saturated mixture of 64% methane, 29% CO2, 4.7% water, and 3% other non-combustible gases. 75 Net of the ~12% energy required to compress the biogas and natural gas for injection into the engines.

Appendix C: Rosenblum Environmental Engineering Study
Santa Rosa Utilities Greenhouse Gas Study 104
TABLE C/1-7 Santa Rosa’s Allocation of Natural Gas Use, Biogas Production,
And Electrical Output for the Laguna Plant Cogeneration System

Appendix C: Rosenblum Environmental Engineering Study
Santa Rosa Utilities Greenhouse Gas Study 105
FIGURE C/1-3
TOTAL INPUTS AND OUTPUTS FOR LAGUNA PLANT COGENERATION
0
20,000
40,000
60,000
80,000
100,000
120,000
140,000
160,000
3801
738
046
3807
738
106
3813
438
168
3819
738
230
3826
038
290
3832
038
350
3838
338
411
3844
238
471
3849
938
533
3856
238
595
3862
538
655
3868
538
715
Fuel
Inpu
t (Th
erm
s/m
onth
)
0
200,000
400,000
600,000
800,000
1,000,000
1,200,000
Elec
tric
al O
utpu
t (kW
h/m
onth
)
N.GASBIOGASELECTRICITY
60%N.GAS
Purchased Electricity for Laguna Plant Operations Besides cogenerated electricity, the Laguna plant purchases high voltage electrical power from PG&E at a much lower electricity rate than for standard 480 V power (because the substation was financed by the plant and is located on site). Electricity is used for treatment processes, for pumping effluent to various storage reservoirs, and for the first stage76 of pumping reclaimed wastewater to the Geysers geothermal power plant. The large Geysers pump station was separated out from the total electrical purchases (as will be described later). Table C/1-8 shows Santa Rosa’s allocation of the plant’s monthly influent volume, purchased electrical energy, electricity cost, and related GHG emissions: 1. The monthly volume includes wastewater and I&I from Table C/1-4 for Santa Rosa. 2. Monthly electrical energy use and costs were extracted from billing records, and after
deducting the Geysers pump station, multiplied by the monthly influent volume fraction for Santa Rosa.
4. GHG emissions are based on PG&E’s average of 0.489 lb-CO2/kWh77
76 A much larger (~X10) second stage pumping station is operated by Calpine with power directly from the Geysers. 77 This coefficient is from PG&E’s February 2005 CCAR report to the Climate Registry. The report for SCWA was based on 0.73 lb-CO2/kWh used by the Western Systems Coordinating Council for California and Nevada utilities.
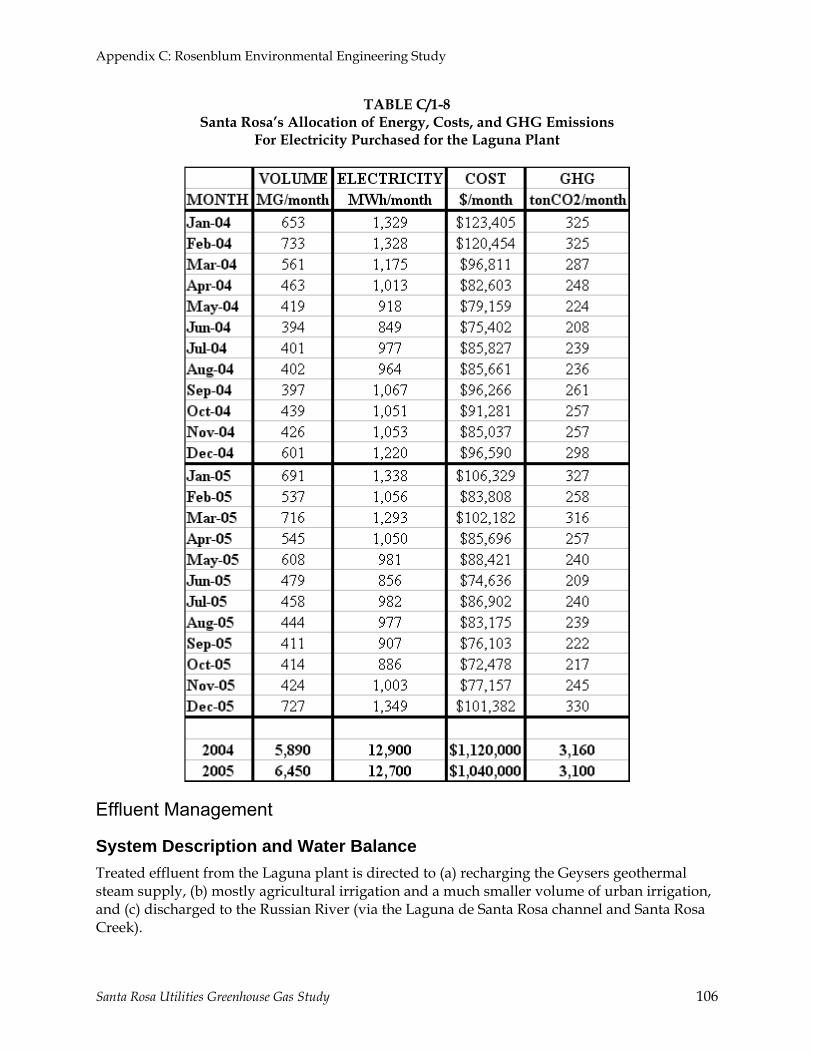
Appendix C: Rosenblum Environmental Engineering Study
Santa Rosa Utilities Greenhouse Gas Study 106
TABLE C/1-8 Santa Rosa’s Allocation of Energy, Costs, and GHG Emissions
For Electricity Purchased for the Laguna Plant
Effluent Management
System Description and Water Balance Treated effluent from the Laguna plant is directed to (a) recharging the Geysers geothermal steam supply, (b) mostly agricultural irrigation and a much smaller volume of urban irrigation, and (c) discharged to the Russian River (via the Laguna de Santa Rosa channel and Santa Rosa Creek).
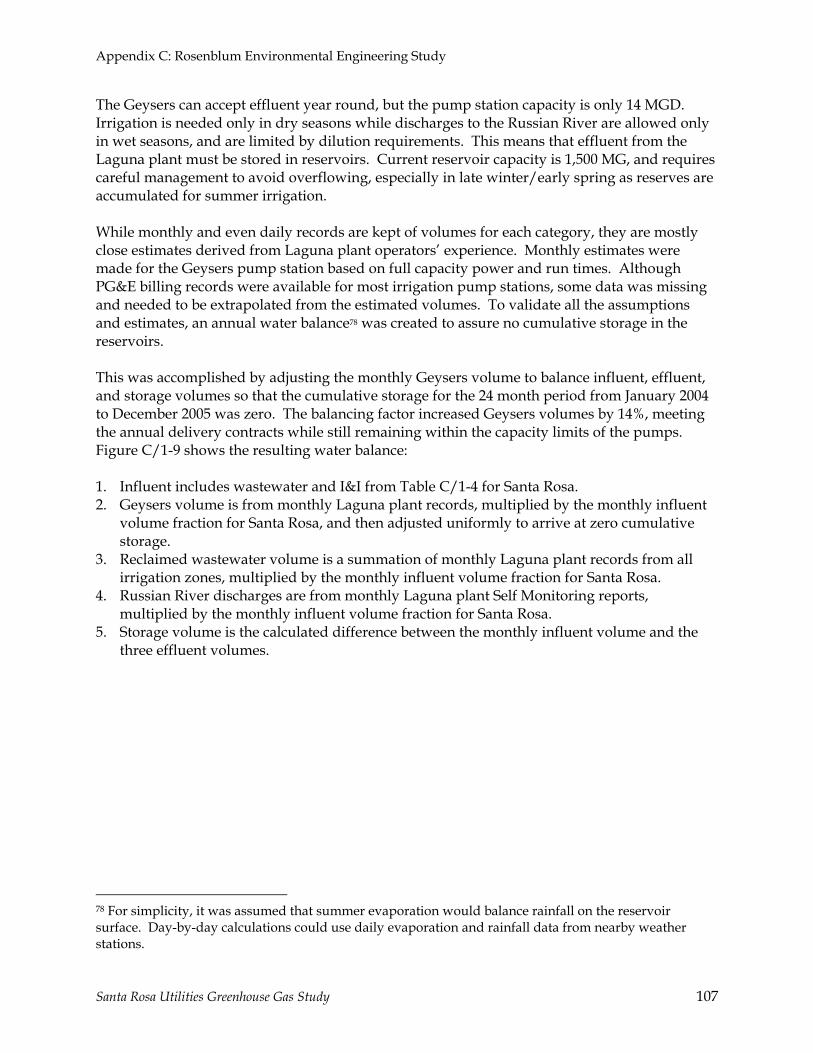
Appendix C: Rosenblum Environmental Engineering Study
Santa Rosa Utilities Greenhouse Gas Study 107
The Geysers can accept effluent year round, but the pump station capacity is only 14 MGD. Irrigation is needed only in dry seasons while discharges to the Russian River are allowed only in wet seasons, and are limited by dilution requirements. This means that effluent from the Laguna plant must be stored in reservoirs. Current reservoir capacity is 1,500 MG, and requires careful management to avoid overflowing, especially in late winter/early spring as reserves are accumulated for summer irrigation. While monthly and even daily records are kept of volumes for each category, they are mostly close estimates derived from Laguna plant operators’ experience. Monthly estimates were made for the Geysers pump station based on full capacity power and run times. Although PG&E billing records were available for most irrigation pump stations, some data was missing and needed to be extrapolated from the estimated volumes. To validate all the assumptions and estimates, an annual water balance78 was created to assure no cumulative storage in the reservoirs. This was accomplished by adjusting the monthly Geysers volume to balance influent, effluent, and storage volumes so that the cumulative storage for the 24 month period from January 2004 to December 2005 was zero. The balancing factor increased Geysers volumes by 14%, meeting the annual delivery contracts while still remaining within the capacity limits of the pumps. Figure C/1-9 shows the resulting water balance: 1. Influent includes wastewater and I&I from Table C/1-4 for Santa Rosa. 2. Geysers volume is from monthly Laguna plant records, multiplied by the monthly influent
volume fraction for Santa Rosa, and then adjusted uniformly to arrive at zero cumulative storage.
3. Reclaimed wastewater volume is a summation of monthly Laguna plant records from all irrigation zones, multiplied by the monthly influent volume fraction for Santa Rosa.
4. Russian River discharges are from monthly Laguna plant Self Monitoring reports, multiplied by the monthly influent volume fraction for Santa Rosa.
5. Storage volume is the calculated difference between the monthly influent volume and the three effluent volumes.
78 For simplicity, it was assumed that summer evaporation would balance rainfall on the reservoir surface. Day-by-day calculations could use daily evaporation and rainfall data from nearby weather stations.
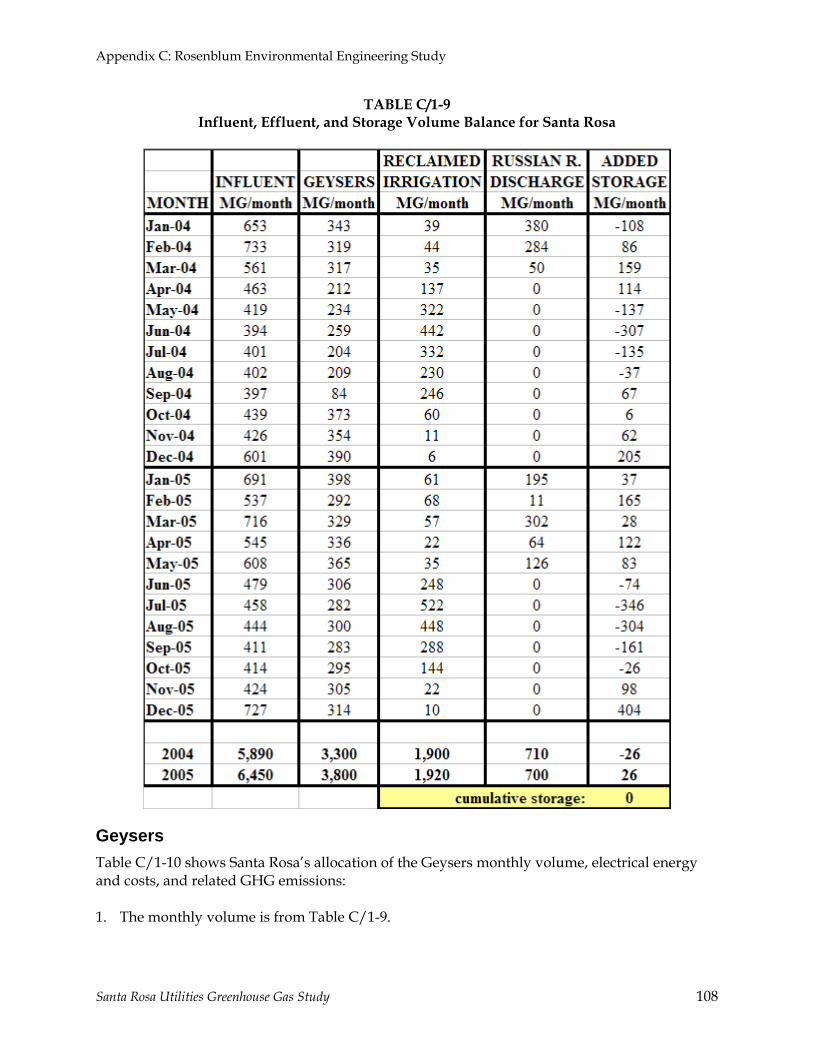
Appendix C: Rosenblum Environmental Engineering Study
Santa Rosa Utilities Greenhouse Gas Study 108
TABLE C/1-9 Influent, Effluent, and Storage Volume Balance for Santa Rosa
Geysers Table C/1-10 shows Santa Rosa’s allocation of the Geysers monthly volume, electrical energy and costs, and related GHG emissions: 1. The monthly volume is from Table C/1-9.
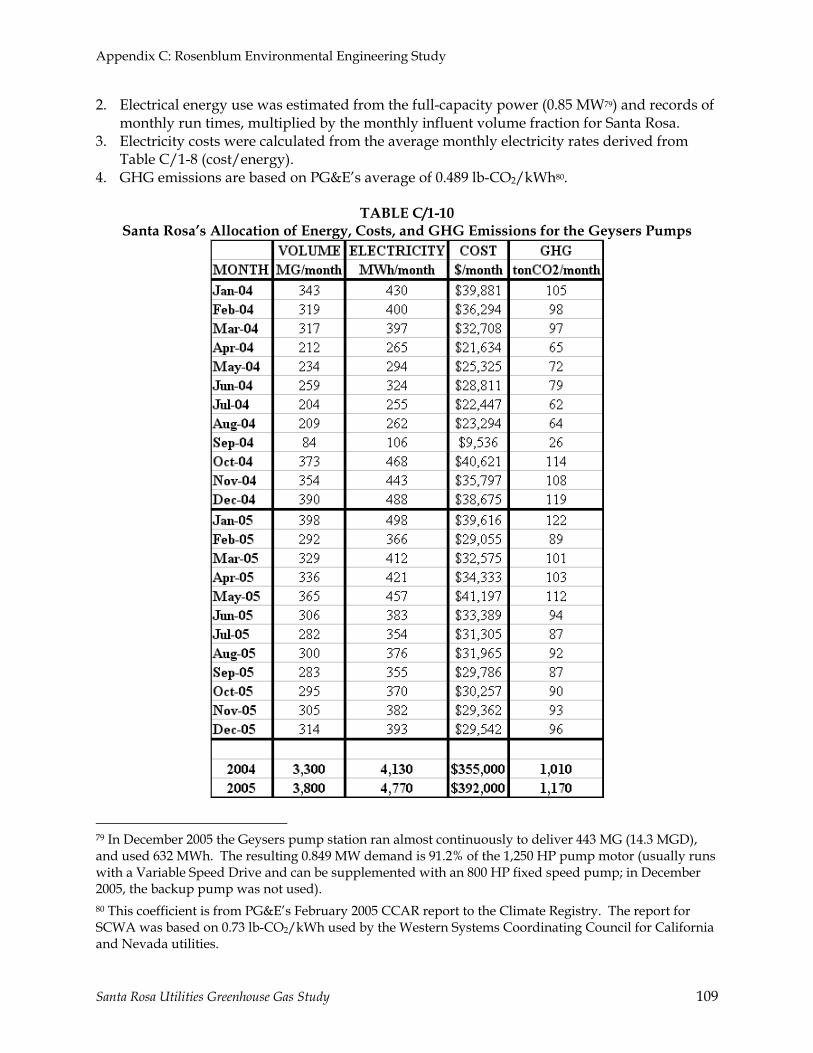
Appendix C: Rosenblum Environmental Engineering Study
Santa Rosa Utilities Greenhouse Gas Study 109
2. Electrical energy use was estimated from the full-capacity power (0.85 MW79) and records of monthly run times, multiplied by the monthly influent volume fraction for Santa Rosa.
3. Electricity costs were calculated from the average monthly electricity rates derived from Table C/1-8 (cost/energy).
4. GHG emissions are based on PG&E’s average of 0.489 lb-CO2/kWh80.
TABLE C/1-10 Santa Rosa’s Allocation of Energy, Costs, and GHG Emissions for the Geysers Pumps
79 In December 2005 the Geysers pump station ran almost continuously to deliver 443 MG (14.3 MGD), and used 632 MWh. The resulting 0.849 MW demand is 91.2% of the 1,250 HP pump motor (usually runs with a Variable Speed Drive and can be supplemented with an 800 HP fixed speed pump; in December 2005, the backup pump was not used). 80 This coefficient is from PG&E’s February 2005 CCAR report to the Climate Registry. The report for SCWA was based on 0.73 lb-CO2/kWh used by the Western Systems Coordinating Council for California and Nevada utilities.

Appendix C: Rosenblum Environmental Engineering Study
Santa Rosa Utilities Greenhouse Gas Study 110
Reclaimed Wastewater Irrigation Reclaimed wastewater is distributed to 5 irrigation zones, with several pump stations in each zone. The Laguna plant maintains the pump stations, records monthly volumes, and pays for approximately 69% of the electricity81. Figures A4, A5, and A6 compare the volume, energy, and energy cost for the zones. Zone 1 is clearly the largest, averaging 36% of the volume, 48% of the energy, and 42% of the cost in 2004-200582.
FIGURE C/1-4
LAGUNA PLANT ANNUAL RECLAIMED WASTEWATER IRRIGATIONVOLUME
0
100
200
300
400
500
600
700
800
900
1,000
Zone-1 Zone-2 Zone-3 Zone-4 Zone-5
MG
/yr
20042005
81 In 2004 this fraction was 74%; in 2005 65%. Where electricity billings were not available from the Laguna plant, we extrapolated from unit electricity use (kWh/MG) in the same zone, and the monthly record of irrigation volume which is always reported to the Laguna plant (a regulatory requirement, and also the basis of compensation to the irrigator). 82 The Laguna plant paid 88% of the electricity for Zone 1, so it also had the most reliable data records with very little need to extrapolate.

Appendix C: Rosenblum Environmental Engineering Study
Santa Rosa Utilities Greenhouse Gas Study 111
FIGURE C/1-5
LAGUNA PLANT ANNUAL RECLAIMED WASTEWATER IRRIGATIONELECTRICITY
0
250,000
500,000
750,000
1,000,000
1,250,000
1,500,000
1,750,000
2,000,000
2,250,000
2,500,000
Zone-1 Zone-2 Zone-3 Zone-4 Zone-5
kWh/
yr
20042005
FIGURE C/1-6
LAGUNA PLANT ANNUAL RECLAIMED WASTEWATER IRRIGATIONCOST
$0
$50,000
$100,000
$150,000
$200,000
$250,000
$300,000
$350,000
Zone-1 Zone-2 Zone-3 Zone-4 Zone-5
$/yr
20042005

Appendix C: Rosenblum Environmental Engineering Study
Santa Rosa Utilities Greenhouse Gas Study 112
Summarizing across all zones, Figure C/1-7 shows that total energy use83 closely follows total volume irrigated – with a clear wet/dry seasonal difference. Figure C/1-8 reveals that although costs also follow volumes, in the wet winter months costs flatten out to a $25-30,000 minimum. This reflects the relatively high and constant demand (power) charge and the very small energy charge for short-duration pump testing, plus fixed meter charges all accounts. This creates an extremely high and unrepresentative average electricity rate ($/kWh) in winter months. Figure C/1-9 shows energy use, total energy cost, and unit energy cost (average rate) as a function of monthly volume of reclaimed wastewater irrigation. The correlation factors are very high (0.8-1), so the equations shown in the graph can be used with confidence. On the other hand, it is not valid to calculate an average annual electricity rate and apply it to the annual volume to estimate annual costs (because of the exponential impact of fixed costs for low flows). This is why energy use and costs for pump stations where billing records were unavailable were extrapolated from other pump station data only in the same zone, and only in the same month
FIGURE C/1-7
LAGUNA PLANT ANNUAL RECLAIMED WASTEWATER IRRIGATIONMonthly Energy and Costs for All Zones
0
200,000
400,000
600,000
800,000
1,000,000
1,200,000
Jan-04
Feb-04
Mar-04
Apr-04
May-04
Jun-04
Jul-0
4
Aug-04
Sep-04
Oct-04
Nov-04
Dec-04
Jan-05
Feb-05
Mar-05
Apr-05
May-05
Jun-05
Jul-0
5
Aug-05
Sep-05
Oct-05
Nov-05
Dec-05
Elec
tric
ity k
Wh/
mo
0
100
200
300
400
500
600
700
800
Volu
me
MG
/mo
ENERGYVOLUME
83 Where electricity billings for a particular pump station were not available from the Laguna plant, they were derived by multiplying average unit electricity use (kWh/MG) in the same zone and for the same month, by the monthly record of irrigation volume for the pump station.
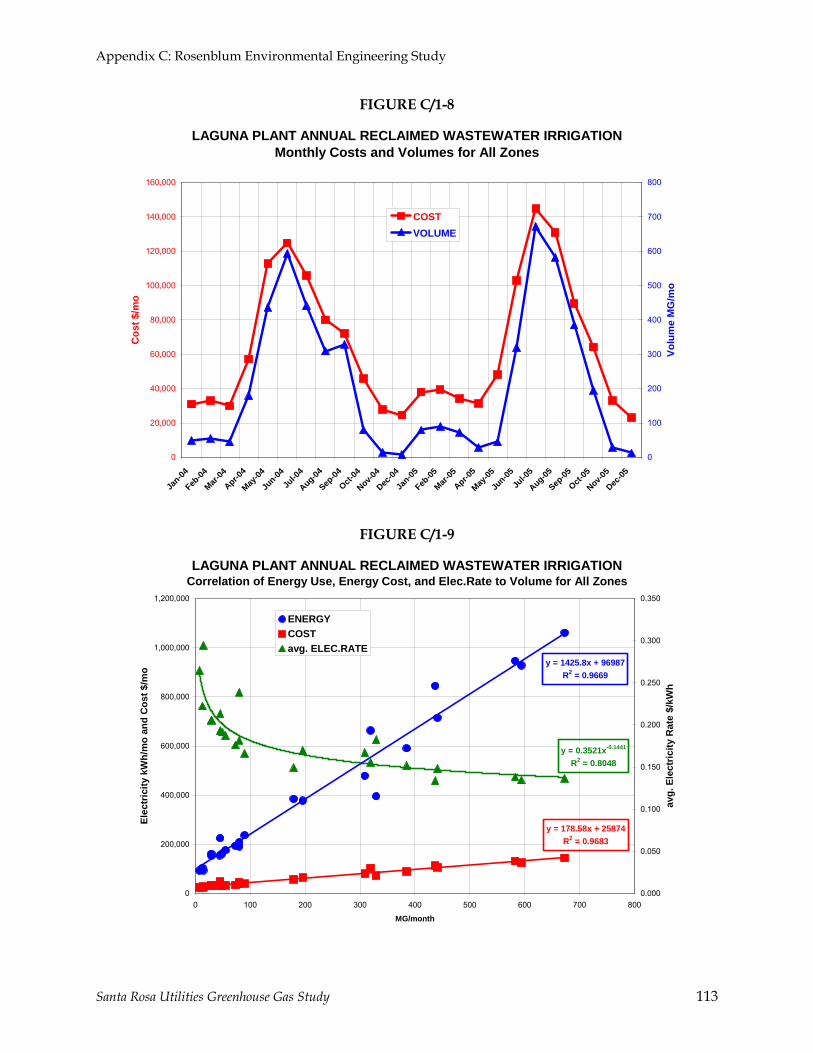
Appendix C: Rosenblum Environmental Engineering Study
Santa Rosa Utilities Greenhouse Gas Study 113
FIGURE C/1-8
LAGUNA PLANT ANNUAL RECLAIMED WASTEWATER IRRIGATIONMonthly Costs and Volumes for All Zones
0
20,000
40,000
60,000
80,000
100,000
120,000
140,000
160,000
Jan-04
Feb-04
Mar-04
Apr-04
May-04
Jun-04
Jul-0
4
Aug-04
Sep-04
Oct-04
Nov-04
Dec-04
Jan-05
Feb-05
Mar-05
Apr-05
May-05
Jun-05
Jul-0
5
Aug-05
Sep-05
Oct-05
Nov-05
Dec-05
Cos
t $/m
o
0
100
200
300
400
500
600
700
800
Volu
me
MG
/mo
COSTVOLUME
FIGURE C/1-9
LAGUNA PLANT ANNUAL RECLAIMED WASTEWATER IRRIGATIONCorrelation of Energy Use, Energy Cost, and Elec.Rate to Volume for All Zones
y = 0.3521x-0.1441
R2 = 0.8048
y = 178.58x + 25874R2 = 0.9683
y = 1425.8x + 96987R2 = 0.9669
0
200,000
400,000
600,000
800,000
1,000,000
1,200,000
0 100 200 300 400 500 600 700 800
MG/month
Elec
tric
ity k
Wh/
mo
and
Cos
t $/m
o
0.000
0.050
0.100
0.150
0.200
0.250
0.300
0.350
avg.
Ele
ctric
ity R
ate
$/kW
h
ENERGYCOSTavg. ELEC.RATE

Appendix C: Rosenblum Environmental Engineering Study
Santa Rosa Utilities Greenhouse Gas Study 114
Table C/1-11 shows Santa Rosa’s allocation of the reclaimed wastewater irrigation monthly volume, electrical energy and costs, and related GHG emissions: 1. The monthly volume is from Table C/1-9. 2. Electrical energy use was derived from the data shown in Figure C/1-7, multiplied by the
monthly influent volume fraction for Santa Rosa. 3. Electricity costs were derived from the data shown in Figure C/1-8, multiplied by the
monthly influent volume fraction for Santa Rosa. 4. GHG emissions are based on PG&E’s average of 0.489 lb-CO2/kWh84.
Russian River Discharge Wastewater is released from reservoirs by gravity, into the Laguna de Santa Rosa channel or Santa Rosa Creek, so no energy is needed. The discharged volumes are shown in Table C/1-9.
Total GHG Emissions and Inventory
Not all GHG emissions, nor all elements of Santa Rosa’s water and wastewater system will be included in Santa Rosa’s GHG inventory: 1. The energy used by SCWA to supply water to Santa Rosa, and its GHG emissions, are
already included in SCWA’s inventory. 2. Biogas produced at the Laguna plant is a biogenic fuel, and is not counted in GHG
inventories. 3. Combustion of natural gas in the cogeneration system will be included in the GHG
inventory, but to avoid double-counting, the electrical output of the cogeneration system is not included.
Table C/1-12 shows the differences in electricity, energy costs, and GHG emissions for the all water and wastewater elements included in the total, versus the subset of elements included in the inventory. Absolute annual values and unit values (i.e. intensity) are shown in the table: 1. For water, the unit volume is the total annual water demand (SCWA and wells). 2. For wastewater, the unit value is annual influent to the Laguna plant (wastewater plus I&I). 3. For combined water and wastewater, the unit volume is the total annual water demand. The reason for tracking total GHG emissions rather than only the inventory is that identification of opportunities to effectively reduce emissions requires considering upstream impacts such as SCWA’s operation, and wastewater process optimization, especially for biogas and cogeneration. Table C/1-12 shows that the inventory encompasses only 50% of the electrical energy required for Santa Rosa’s water and wastewater operations and only 60% of GHG emissions; which could be very misleading in guiding the search for cost-effective improvement (especially if based on extrapolations from unit values). A detailed methodology for guiding the search is described in the section on next steps.
84 This coefficient is from PG&E’s February 2005 CCAR report to the Climate Registry. The report for SCWA was based on 0.73 lb-CO2/kWh used by the Western Systems Coordinating Council for California and Nevada utilities.
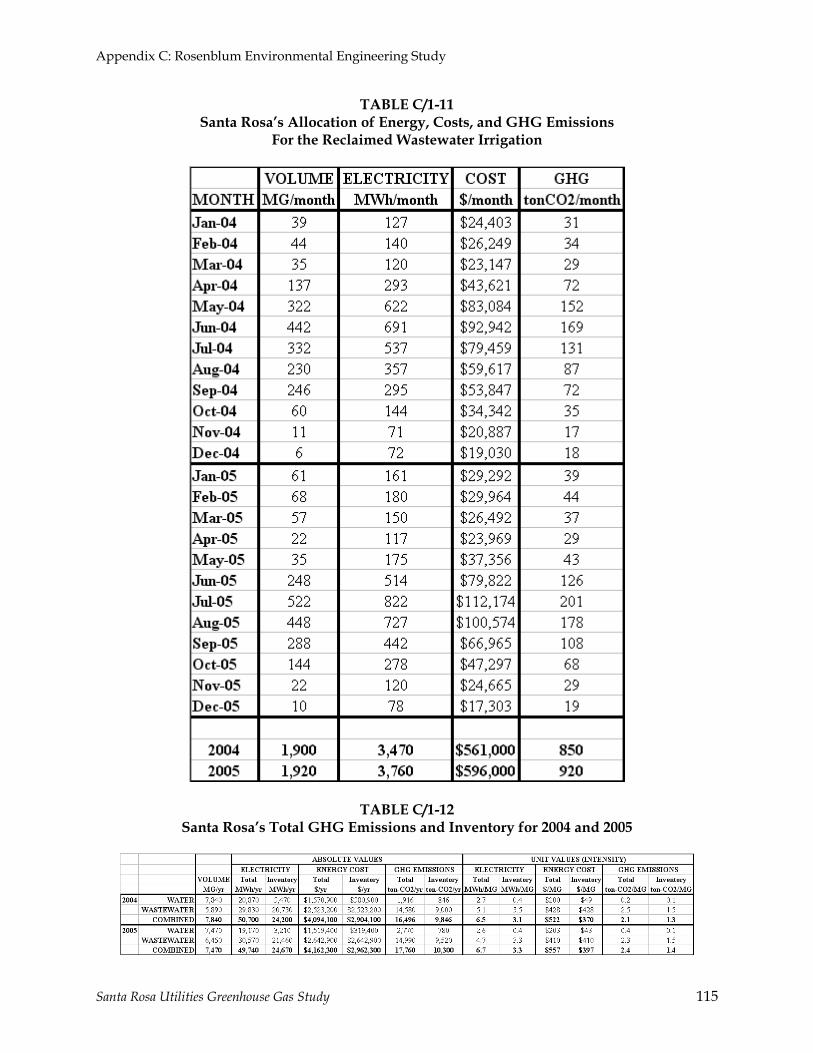
Appendix C: Rosenblum Environmental Engineering Study
Santa Rosa Utilities Greenhouse Gas Study 115
TABLE C/1-11 Santa Rosa’s Allocation of Energy, Costs, and GHG Emissions
For the Reclaimed Wastewater Irrigation
TABLE C/1-12 Santa Rosa’s Total GHG Emissions and Inventory for 2004 and 2005

Appendix C: Rosenblum Environmental Engineering Study
Santa Rosa Utilities Greenhouse Gas Study 116
Appendix C/2: Design and Operation of the Laguna Plant Digester/ Cogeneration SYSTEM for GHG Reductions
Overview
The cogeneration system at the Laguna plant is due for major upgrades which were summarized the Cogeneration Master Plan of 200685, and are currently proceeding towards detailed design. Short-term operational improvements have deferred digester upgrades, which were summarized in the Biosolids Master Plan of 200386, to a longer planning horizon. This section describes the technical and economic opportunities for combined optimization of the design and operation of the digesters and cogeneration system (i.e. combining measures from the separate Master Plans).
Opportunities for Optimization
At the Laguna plant, electricity from the existing cogeneration system will always have higher GHG emissions than an equal amount of electricity purchased from PG&E. This is because (a) PG&E has a very low GHG emissions factor due to a large fraction of renewable, large hydropower, and nuclear in its supply portfolio, (b) cogeneration systems have lower fuel-to-electricity conversion efficiencies than large central power plants87, and (c) the biogas fueling the Laguna plant cogeneration system has a much higher GHG emissions factor than natural gas88. On the other hand, since biogas is a renewable fuel, its combustion emissions are not counted in GHG inventories89. PG&E’s GHG inventory emissions factor is 0.489 lb-CO2/kWh while the Laguna plant cogeneration system’s is 0.802 lb-CO2/kWh90, however the cogeneration system also provides digester heating and eliminates the need to flare surplus biogas91. Even without counting biogas, natural gas combustion in the cogeneration system still represents 57% of the Laguna plant GHG inventory.
85 City of Santa Rosa Power Master Plan, Brown & Caldwell 2006. 86 Laguna Subregional Water Reclamation Facility Final Biosolids Program, Phase II, Brown & Caldwell 2003. 87 Cogeneration systems range from 25-30% efficiency, while central plants range from 30-40%. However, transmission losses between central plants and end-users are 6-13% (Small is Profitable, Rocky Mountain Institute, 2002, p.211-213). 88 Biogas contains 29% CO2 (by volume) before combustion, and only 64% methane, while natural gas is 92% methane. 89 The Climate Protection Campaign adheres to the Greenhouse Gas Protocol (GHG Protocol) which is the most widely used international accounting tool for government and business leaders to understand, quantify, and manage greenhouse gas emission (The GHG Protocol is a decade-long partnership between the World Resources Institute and the World Business Council for Sustainable Development). 90 This is from 2004-2005 data for natural gas purchases and total electrical output (i.e. excluding biogas as a fuel but including its electrical output). 91 Required for safety but also converts methane to CO2 with 23 times less Global Warming Potential.

Appendix C: Rosenblum Environmental Engineering Study
Santa Rosa Utilities Greenhouse Gas Study 117
A first step in reducing the Laguna plant’s GHG inventory would be to reduce natural gas use in the cogeneration system. Actions taken by Laguna plant staff at the end of 2005 to keep the unit cost of cogenerated electricity below PG&E’s rates is a simple example of reducing natural gas input. However this type of action also reduces system utilization, which in the long term reduces the cost-effectiveness of the cogeneration investment. A more cost effective approach would be to increase biogas production to displace natural gas – which would simultaneously reduce fuel costs, electricity costs, and the GHG inventory triggered by natural gas and purchased electricity. Besides the GHG inventory it is worthwhile tracking total GHG emissions, including both natural gas and biogas, to identify and optimize the cost-effectiveness of various improvements that could be integrated into upgrades needed for the digesters and cogeneration system: 1. Increasing biogas production with process improvements92 and/or feed supplementation to
displace natural gas. 2. Maximizing utilization of exhaust heat, especially if it displaces heating with electricity or
natural gas93. 3. Improving the fuel efficiency of electricity generation. 4. Stripping the large fraction of CO2 from the biogas before combustion. This will reduce total
GHG emissions from cogeneration, improve operation of the cogeneration prime-movers94, and also displace GHG emissions from producing and utilizing CO2 elsewhere95. The compressed CO2 would be supplied in standard cylinders, but could probably be sold at a premium as a “green” product.
5. Compressing the methane fraction of biogas for sale off-site, and abandoning on-site cogeneration. Since the methane is from a renewable source, it could be sold at a significant premium under contract to specific end-users, utilizing PG&E’s pipelines for transmission (this arrangement is known as “wheeling”). This might yield better economic returns while simultaneously reducing GHG emissions (especially in an electricity service area of a low-carbon utility such as PG&E96), but must be balanced against the need for digester heating, and the ability to utilize cogeneration exhaust heat in nearby thermal processes97. Another very important economic consideration is that biogas is a wholly owned fuel supply for the plant and is not susceptible to price shocks and interruptions.
92 The Digester Master Plan recommends converting to Temperature Phased Anaerobic Digestion. 93 If the temperature of the exhaust heat is high enough (e.g. from gas turbines), it could be used for cooling with adsorption refrigeration. 94 The CO2 effects combustion temperature and useful heat, and auxiliary energy for compressing the fuel supply. 95 This is already practiced in municipal wastewater plants in Germany and Sweden. 96 This is already the case in Sweden where liquefied methane can displace very high-priced fuel for municipal transit fleets, and where a very high fraction of electricity is already renewable. Sweden also has a national plan to reduce energy demands and increase renewable generation to approach zero GHG inventory. 97 For example many treatment plants in Europe and Canada already provide district heating for nearby neighborhoods.

Appendix C: Rosenblum Environmental Engineering Study
Santa Rosa Utilities Greenhouse Gas Study 118
6. Although the technical and economic feasibility of direct hydrogen generation from biological treatment process is not yet clear, evolving R&D might change eliminate the need to produce and burn biogas and/or natural gas in the future – but would probably require a major modification of the Laguna plant. The hydrogen could then be used in a fuel cell with no GHG emissions and very little exhaust heat98.
To summarize, integrating and optimizing the design and operation of the digesters and cogeneration system could lead to cost-effective reductions in total GHG emissions and GHG inventory. Since the Laguna plant must upgrade both the digesters and the cogeneration system to meet 2020 build-out conditions, there will soon be an opportunity to consider such optimization.
Improving Cogeneration Efficiency
Cogeneration electrical efficiency is calculated by dividing the electrical energy output by the fuel (biogas and natural gas) energy input99. Total cogeneration efficiency is calculated by dividing the useful outputs - electricity and digester heating - by the fuel energy input. Most of the required values are shown in Figure 6; digester heat requirements were estimated in the 2003 Biosolids Master Plan as 1,984,000 Btu/hr in summer and 3,856,000 Btu/hr in winter. Exhaust heat from cogeneration is calculated as the difference between fuel input and electrical output. Figure C/2-1 first shows that very little exhaust heat from the cogeneration system is usefully recovered for heating the digester. In cold months, the digesters can utilize up to 40% of the waste heat, while in warm summer months the digester require only 15% of the waste heat. In 2004 and 2005 digester heating required only 21% of the cogeneration exhaust heat.
98 Producing hydrogen from biogas for a fuel cell is already practiced in some wastewater treatment plants, however the required thermal processing counter-balances the GHG advantage of the fuel cell (from both a total and an inventory perspective). 99 All energy inputs and outputs must converted to the same units (in this case Therms).

Appendix C: Rosenblum Environmental Engineering Study
Santa Rosa Utilities Greenhouse Gas Study 119
FIGURE C/2-1
COGENERATION EFFICIENCY AND EXHAUST HEAT UTILIZATION
0
10,000
20,000
30,000
40,000
50,000
60,000
70,000
80,000
90,000
100,000
110,000
120,000
Jan-04
Feb-04
Mar-04
Apr-04
May-04
Jun-04
Jul-0
4
Aug-04
Sep-04
Oct-04
Nov-04
Dec-04
Jan-05
Feb-05
Mar-05
Apr-05
May-05
Jun-05
Jul-0
5
Aug-05
Sep-05
Oct-05
Nov-05
Dec-05
Cog
en E
xhau
st H
eat T
herm
s/m
onth
0%
10%
20%
30%
40%
50%
60%
70%
80%
90%
100%
Effic
ienc
y
LOST HEATDIGESTER HEATTOTAL EFFICIENCYELEC.EFFICIENCY
Figure C/2-1 also shows that electrical efficiency changes very little from month to month, and is reasonably high for the reciprocating engines used at the Laguna plant. However, electrical efficiency could be increased in the future by replacing the reciprocating engines with gas turbines, then exploiting the much higher exhaust temperature to operate steam and Organic Rankine Cycle (ORC) turbines in a bottoming-cycle100. Such improvements could increase electrical efficiency from the existing average of 26% to approximately 37%101. Total efficiency increases with utilization of the exhaust heat. It is currently significantly higher in winter than in summer because of larger utilization of exhaust heat for the digester. Since even the most efficient electricity generation will still release 63% of the fuel energy as exhaust heat, improving total efficiency will depend on closely matching exhaust heat to useful thermal
100 The 2006 Cogeneration Master Plan excluded gas turbines because of the expense of removing siloxanes from the biogas. Adding a 700°F steam turbine bottoming-cycle to the reciprocating engines was deemed infeasible for economic reasons (the increased electrical output would not cover cost of employing a certified high-pressure steam system operator). Organic Rankine Cycle turbines were listed but not evaluated in detail. 101 With a turbine exhaust temperature of 1,500°F and a bottoming-cycle outlet temperature of 150°F, the theoretical (Carnot) efficiency is 69%. Assuming that practical efficiency is only 25% of the theoretical means that electrical efficiency would be 17% for the bottoming cycle. If 10% of the output is required for auxiliary equipment, the net efficiency of the bottoming cycle would be 15.5%. Assuming reasonably that the gas turbine electrical efficiency would be the same 26% as the existing engines (after deducting 12% for auxiliary equipment), and that exhaust heat would remain the same (but at 1,500°F), results in a 37% electrical efficiency for the entire cogeneration system.

Appendix C: Rosenblum Environmental Engineering Study
Santa Rosa Utilities Greenhouse Gas Study 120
demands102. Most industrial cogeneration systems are designed primarily to match thermal loads103, and this is also the optimal way to reduce GHG emissions at the Laguna plant. There are several potentially large thermal loads for that could be developed in the future to improve total cogeneration efficiency: 1. Currently the only off-site thermal load for the cogeneration exhaust heat is the composting
facility across the street. Even though no natural gas would be displaced, the 2003 Biosolids Master Plan evaluates several regulatory/environmental needs and operational benefits that could also improve the economics of the composting facility.
2. The 2003 Biosolids Master Plan recommends converting to multi-stage higher temperature digestion that would utilize far more of the cogeneration exhaust heat. The multi stage process would also reduce volatile solids in the residual sludge, making dewatering easier, reducing hauling and disposal costs, and providing more regulatory flexibility.
3. Expansion to a much larger regional biogas facility with feed supplementation from other waste streams104. New multi-stage digesters would be required, but with optimal design much more electricity could be generated with a much larger fraction biogas than in the existing system. This would not only increase exhaust heat utilization but would also displace natural gas and reduce electricity purchases from PG&E to directly reduce the Laguna plant’s GHG inventory.
4. Low temperature vacuum distillation 105 of liquids from residual solids dewatering could divert concentrated nutrient return streams away from the secondary treatment process to the composting operation106. Another potential application might be to the wastewater influent, to produce reclaimed wastewater without need for most of the plant’s treatment process energy. Both options would reduce electricity demands and directly reduce the Laguna plant’s GHG inventory.
5. Recent successful pilot testing of pasteurizing final filter effluent implies that if a gas turbine was used for cogeneration (to provide a higher exhaust temperature than the existing reciprocating engines) and it was sized to handle at least 20 MGD, at least one of the UV disinfection channels could be turned off most of the dry weather season (when electricity costs are also highest). Since the UV disinfection uses 20-30% of the plant’s electrical energy, such an application of exhaust heat could greatly reduce GHG inventory – as long as
102 Bottoming cycles require condensation of steam (or heat transfer fluid vapors for ORC), which can be done via heat exchange with wastewater or in cooling towers, but this is not counted as useful utilization. 103 Thermal matching is a well known strategy for thermodynamic optimization, and is widely practiced in the petrochemical and paper/pulp industries. In general it implies operating the cogeneration system so that exhaust heat and electrical output will vary according to thermal demand. Many examples have been published in the journal Applied Thermal Engineering. 104 For example, dairy manure, food service and processing wastes, and crop residues. There are successful programs with all these wastes at many wastewater plants, including East Bay MUD in Oakland, and IEUA in San Bernardino County. 105 A multiple effect evaporator with vapor recompression could be designed to optimize thermal and electrical energy requirements. 106 A very small volume of highly concentrated nutrients (perhaps even crystallized solids) would be transferred to the composting facility, while the remaining volume would be returned to the secondary treatment inlet with hardly any nutrients.

Appendix C: Rosenblum Environmental Engineering Study
Santa Rosa Utilities Greenhouse Gas Study 121
additional natural gas demand for a large enough gas turbine does not increase GHG emissions by a similar factor.
To summarize, increasing electrical efficiency is possible but limited by the laws of thermodynamics. The potential to increase total efficiency by increasing utilization of exhaust heat is much larger, and can significantly reduce GHG inventory emissions.

Appendix C: Rosenblum Environmental Engineering Study
Santa Rosa Utilities Greenhouse Gas Study 122
Appendix C/3: The Geysers Reclaimed Wastewater Project
Background
To reduce effluent discharges to the Russian River as water quality limitations became increasingly stringent, the City of Santa Rosa invested approximately $200 million in a pipeline and pumping stations to deliver 11 MGD to Calpine Corporation’s geothermal facilities at The Geysers107. The project has been operating since October 2003 and injection of Santa Rosa’s reclaimed water has helped stabilize electrical energy output from The Geysers. The project has reduced wastewater impacts in the Laguna de Santa Rosa and lower Russian River, reduced GHG emissions in PG&E’s service area, assured regulatory compliance for the City of Santa Rosa108, and increased earnings for Calpine Corporation109.
Geothermal Electricity Production at the Geysers
Addressing Declining Steam Production Modern commercial electricity production started at The Geysers in the 1960s and reached a peak capacity of 2,000 MW in 1989. However this peak capacity was unsustainable, causing a dramatic 25%/yr decline in steam production from the field110. Detailed analysis revealed that static steam pressure declined from 490 psia in 1969 to 230 psia in 1998, with the most dramatic drop from 1985 to 1990111. This was accompanied by a 9%/yr average reduction in normalized112 steam production (lb/hr) in 1980-1985, and 23%/yr in 1986-1990. To address the problems declining steam production, a Technical Advisory Committee (TAC) of interested parties was formed to reduce the rate of decline and extend the life of the geothermal field. These objectives have largely been met by sophisticated modeling and optimization of wellhead steam extraction, turbine operation, and deep injection of condensate, wastewater, and creek water113.
107 The Press Democrat, Monday November 29, 2004, Mike McCoy The Geysers – One Year Later. 108 City of Santa Rosa website description of The Geysers project, http://ci.santa-ros.ca.us/geysers. 109 The 2004 article in The Press Democrat cites $50 million per year from the output attributable to Santa Rosa’s wastewater – an outstanding return for Calpine’s $50 million investment in the project. 110 Goyal, K.P. and Pingol, A.S. (2007) Geysers Performance Update Through 2006, Geothermal Resource Council, vol 31, p435-439. 111 Sanyal, S.K. et al (2000) An Investigation of Productivity and Pressure Decline Trends in Geothermal Steam Reservoirs, Proceedings of the World Geothermal Congress 2000, Kyishu-Tohoku, Japan. 112 At 100 psia wellhead pressure (Sanyal et al 2000). As the pressure of the steam declines, its ability to generate power decreases, so normalizing is critical to understand the impact on The Geysers power generation over time. 113 Personal communication, Dr. Keshav Goyal, Calpine Corporation.

Appendix C: Rosenblum Environmental Engineering Study
Santa Rosa Utilities Greenhouse Gas Study 123
In practice, this has meant lowering The Geysers electrical energy output114 from its peak in the late 1980s - by shutting down some facilities and operating turbines at reduced power115 and for shorter durations116. Figure C-1 shows the recent stability of electrical energy produced by Calpine, based on data reported to the CEC. The major monthly reductions in late 2004/early 2005, and again in early 2006, were the result of transmission line curtailments117. Based on Calpine’s installed turbine capacity of 1,302 MW118, this implies that the optimal level of annual utilization is approximately 55%119.
114 Lower wholesale power prices were also a motivating factor in reducing electrical output in the 1990s Stark, M.A. et al (2005) The Santa Rosa-Geysers Recharge Project, Geysers Geothermal Field, California, USA, Proceedings of the World Geothermal Congress 2005, Antalaya, Turkey. 115 The turbines are operating at 50% capacity because of much lower inlet pressures and steam flowrates than they were designed for, leading to lower efficiencies. Some have been modified to increase efficiency by changing steam pathways (but this usually also de-rates output capacity). Stark, M.A. et al (2005). 116 Personal communication, Dr. Keshav Goyal, Calpine Corporation. 117 Goyal and Pingol (2007). 118 Goyal and Pingol (2007). 119 Calculated by dividing the 6.22 million MWh/yr average annual 2001-2005 output by 1,302 MW*8,760 hrs/yr. This is in the same range as reflected by the reduced capacity from operating the turbines at lower than design inlet pressures and steam flows.

Appendix C: Rosenblum Environmental Engineering Study
Santa Rosa Utilities Greenhouse Gas Study 124
FIGURE C/3-1
0
500,000
1,000,000
1,500,000
2,000,000
2,500,000
3,000,000
3,500,000
4,000,000
4,500,000
5,000,000
5,500,000
6,000,000
6,500,000
0
50,000
100,000
150,000
200,000
250,000
300,000
350,000
400,000
450,000
500,000
550,000
600,000
650,000
Ann
ual M
Wh
Mon
thly M
Wh
ELECTRICAL OUTPUT FROM CALPINE FACILITIES AT THE GEYSERS
ANNUAL
MONTHLY
55% avg. annual utilization of Calpine's 1,302 MW
installed capacity
Water Recharge in the Geothermal Field The Geysers geothermal field is vapor-dominated, with no detectable groundwater120 and almost no natural recharge. This is why steam extraction for the turbines causes a decline in pressure and steam flow. By 2006, a cumulative 5 trillion pounds of steam had been extracted from the geothermal field and only 1.9 trillion pounds of water/wastewater had been recharged – creating a deficit of 3.1 trillion pounds121. The impact of this deficit is the reason for the careful turbine optimization now practiced and for the implementation of large-scale recharge projects. The earliest recharge projects started in 1969 as a method to dispose of condensate while meeting new water quality regulations. In the beginning, the injection wells were sited far away from extraction wells because it was feared that water might break through and damage the turbines122. As experience accumulated revealing that injection could safely increase steam
120 The scientific consensus is that water is trapped in rock matrices, and flashes to steam as it moves into fractures (Goyal and Pingol 2007). 121 Goyal and Pingol (2007). 122 The turbines are very finely machined and operate at high speeds. They cannot withstand impact from water droplets and are designed to operate only with steam – all the way to the outlet. Water droplets are removed by separators at the inlet, and then steam pressure/temperature must be monitored to avoid condensation in any of the turbine stages.

Appendix C: Rosenblum Environmental Engineering Study
Santa Rosa Utilities Greenhouse Gas Study 125
production, the injection wells were brought in closer, and in 1980 more water was added from nearby creeks during wet weather. The injection of condensate and creek water was not enough to halt the decline in steam pressure and mass flow rate — especially during overexploitation in the 1980s. The TAC recommended additional injection to recharge the geothermal fields, and this coincided with the need to manage wastewater disposal in Lake County and for the City of Santa Rosa’s Laguna Subregional Wastewater treatment Plant. The Southeast Geysers Effluent Pipeline (SEGEP) started to deliver 7.8 MGD of lake water and secondary wastewater from Lake County in September 1997. The Santa Rosa Geysers Recharge Project (SRGRP) started to deliver 11 MGD of tertiary treated reclaimed wastewater in October 2003. Figure C/3-2 shows several trends related to measures taken to optimize electricity production at The Geysers: 1. Steam production123 increased rapidly up to unsustainable levels of 1986-1988, and then
drastically declined. By 1995 turbine operations were optimized for stable electrical energy output with greatly reduced but stable steam production rates.
2. Water injection and recharge increased steadily up to 1985 as condensate increased and creek pumping facilities were added. Injection rates were relatively stable from 1985 through 1997 even as drastic reductions were occurring in steam production. This implies that in this period injection rates and locations were not influencing steam production, and that optimization of turbine operations had far more impact on steam production than recharge rates. This is also reflected in the fact that total water injection was only 36% of annual steam production until 1994, with only a small fraction showing up as steam124.
3. In 1995, optimization of turbine operations reduced steam production to levels that allowed annual water injection to approach ~45% of steam production; after SEGEP began to influence operations in 1998, injection reached ~55%. By 2005, with operation of SRGRP, injection was 85-90% of steam production. However, only an average 27% of all the injected water turns into steam125.
123 Production is the term used by the facility operators, but a more accurate term would be extraction (of geothermal steam). 124 Tritium tracer studies implied that only 10-15% of the injected water was recovered as steam (Fig. 7 in Barker, B.J.et al (1995) Water Injection Management for Resource Maximization: Observations From 25 Years Experience at The Geysers California, Proceedings of the World Geothermal Congress 1995, p.1959-1964). Later numerical simulations estimated that recovery increases over time from 14 to 42% and then slowly declines again (Stark et al 2005). 125 Steam recovery of SRGRP injection water was 17.6% in 2004, and rose to a predicted maximum of 37.1% in 2006 (Goyal and Pingol 2007).

Appendix C: Rosenblum Environmental Engineering Study
Santa Rosa Utilities Greenhouse Gas Study 126
FIGURE C/3-2 Goyal, K.P. and Pingol, A.S. (2007) Geysers Performance Update Through 2006,
Geothermal Resource Council.
Figure C/3-3 shows how recharge has increased maximum126 hourly steam production for the Calpine “market” units (13 of 17 units) since 1995 - the period after turbine operations were optimized and injection was significantly increased with SEGEP and SRGRP. In 2006, the injection increased maximum steam flow by 2,560 klbm/hr supporting an additional 146 MW of electrical power output. In 2006, composition of the 11.7 billion gallons of water injected was: 35% SRGRP, 31.5% condensate, 17.5% creek water, and 16% SEGEP127. Based on this volume composition, maximum power capacity of 86 MW can be allocated to SRGRP. Figure C/3-3 also shows that maximum steam production was11,560 klbm/hr in 2006, while natural geothermal steam extraction was 9,000 klbm/hr. Records for all the Calpine units, including the 4 additional units providing power exclusively to PG&E, show that maximum steam production in 2006 was ~13,500 klbm/hr128, so overall 81% of the steam is geothermal and 19% from injected water129. In 2004 and 2005, as SRGRP was increasing its effect, the fraction of injected water was significantly smaller, but the ratio in 2006 will be assumed to hold stable - and will be used later to calculate GHG emissions.
126 Obtained from continuous monitoring; personal communication, Dr. Keshav Goyal, Calpine Corporation. 127 Goyal and Pingol (2007). 128 Fig.4 in Goyal and Pingol (2007). 129 All technical evaluations allocate additional power output to Calpine’s “market” units, which implies that the “Qualifying Facility” units providing PG&E are not influenced by injection.
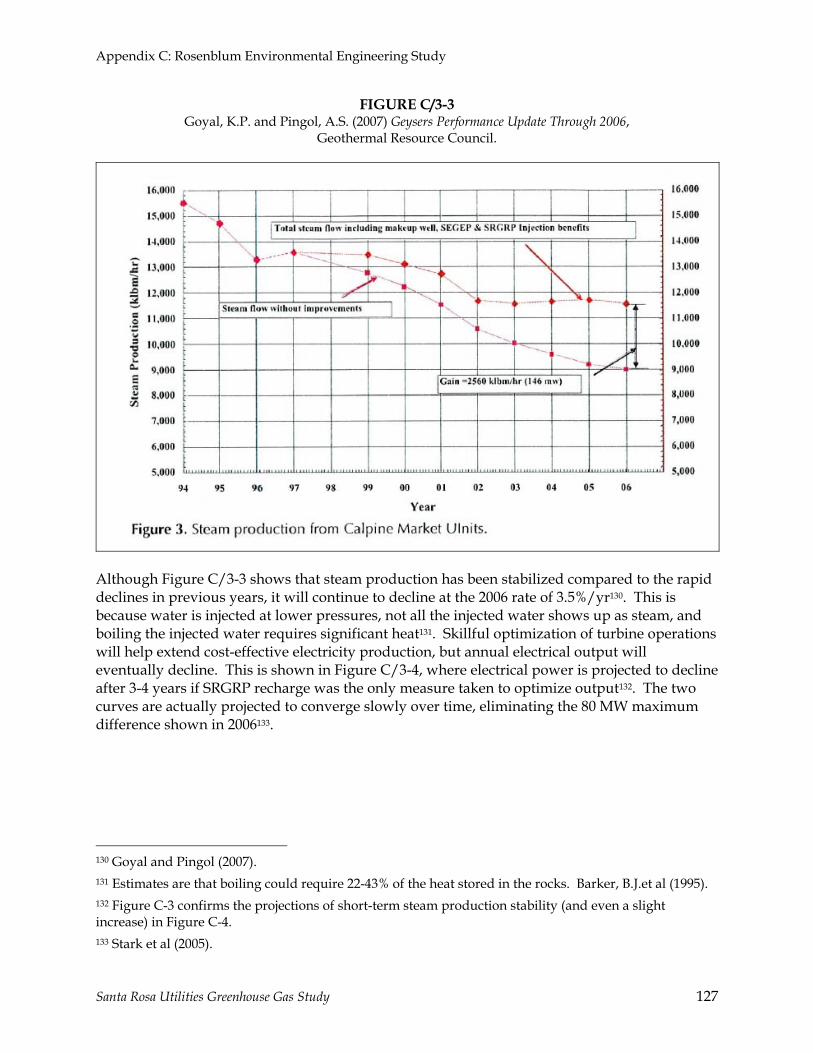
Appendix C: Rosenblum Environmental Engineering Study
Santa Rosa Utilities Greenhouse Gas Study 127
FIGURE C/3-3 Goyal, K.P. and Pingol, A.S. (2007) Geysers Performance Update Through 2006,
Geothermal Resource Council.
Although Figure C/3-3 shows that steam production has been stabilized compared to the rapid declines in previous years, it will continue to decline at the 2006 rate of 3.5%/yr130. This is because water is injected at lower pressures, not all the injected water shows up as steam, and boiling the injected water requires significant heat131. Skillful optimization of turbine operations will help extend cost-effective electricity production, but annual electrical output will eventually decline. This is shown in Figure C/3-4, where electrical power is projected to decline after 3-4 years if SRGRP recharge was the only measure taken to optimize output132. The two curves are actually projected to converge slowly over time, eliminating the 80 MW maximum difference shown in 2006133.
130 Goyal and Pingol (2007). 131 Estimates are that boiling could require 22-43% of the heat stored in the rocks. Barker, B.J.et al (1995). 132 Figure C-3 confirms the projections of short-term steam production stability (and even a slight increase) in Figure C-4. 133 Stark et al (2005).

Appendix C: Rosenblum Environmental Engineering Study
Santa Rosa Utilities Greenhouse Gas Study 128
FIGURE C/3-4 Stark, M.A. et al (2005) The Santa Rosa-Geysers Recharge Project, Geysers Geothermal Field, California, USA,
Proceedings of the World Geothermal Congress 2005, Antalaya, Turkey

Appendix C: Rosenblum Environmental Engineering Study
Santa Rosa Utilities Greenhouse Gas Study 129
Summary of Operational Measures to Stabilize Electricity Production The two main measures taken to stabilize electricity production at The Geysers and extend the useful life of the geothermal field are: 1. Reducing steam extraction rates and turbine operation far below the unsustainable levels of
the late 1980s. In practice this means operating the turbines at a 55% average annual utilization factor (i.e. 55% of the energy output possible from running the turbines at their full rated power capacity for 8,760 hrs/year).
2. Recharging the field by injecting condensate, creek water, and reclaimed wastewater. Since only an average of 27% of the injected water is converted to steam, steam production would not have stabilized without simultaneously reducing turbine operation.
Thermodynamic principles134 suggest that recharge cannot recover all the capacity lost in the original geothermal steam – and that there is an upper limit to the effectiveness of increasing injection volumes135. However recent reports from Calpine’s technical experts indicate that adjustments to turbine operations will be able to maintain cost-effective electricity production for quite a long time yet.
GHG Benefits and Emissions from Santa Rosa’s Geysers Recharge Project
GHG Emissions Factor for The Geysers In this report greenhouse gas (GHG) emissions are calculated according to the Greenhouse Gas Protocol (GHG Protocol) 136 which is the most widely used tool for quantifying GHG inventories. Although The Geysers is a low carbon source of electricity, there are measurable CO2 and CH4 releases in non-condensable gases. These gases are from a geological source and must be counted in the GHG Inventory for Calpine (and the other smaller geothermal electricity producers at The Geysers). The GHG emissions factor for The Geysers electrical energy is derived from combining reported CO2 emissions of 0.0888 lb/kWh137, and an estimate of CH4 emissions based on mole fraction data in non-condensable gases. Data from 1990 to 1994 - before the impacts of SEGEP and
134 For example: irreversibility of practical heat transfer and energy conversion, steam properties, equipment efficiencies and operating limits. 135 Eventually steam temperature/pressure at the turbine inlet will be too low and too close to saturation to be useful. Completely different types of turbines could be used at much lower temperatures with an intermediate organic vapor cycle. This would require a huge new infrastructure investment, but it might be possible to actually increase output by utilizing the latent heat of steam condensation rather than the smaller enthalpy change of steam in vapor phase. 136 The GHG Protocol is a decade-long partnership between the World Resources Institute and the World Business Council for Sustainable Development. 137 Kagel, A. et al (2005) Clearing the Air: Air Emissions from Geothermal Power Facilities Compared to Fossil-Fuel Power Plant in the United States GRC Bulletin, May/June 2005, p.113-116.

Appendix C: Rosenblum Environmental Engineering Study
Santa Rosa Utilities Greenhouse Gas Study 130
SRGRP — indicate that the average mole fraction for CO2 is 55%, and 12% for CH4138. Applying basic rules for gas mixtures results in CH4 emissions of 0.0071 lb/kWh139. Since the Global Warming Potential (GWP) of CH4 is 23 times that of CO2, the CH4 emissions are equivalent to 0.1624 lb/kWh of CO2 emissions. Thus the total GHG emissions factor for The Geysers before SEGEP and SRGRP was 0.2512 lb-CO2/kWh140. The injected wastewater does not contain CO2 or CH4 from geological sources so its GHG emissions will be zero. Applying the 2006 steam makeup of 81% geological and 19% injected (described with Figure C-3) reduces the total GHG emissions factor to 0.2035 lb-CO2/kWh. There are some short-term indications that new SRGRP injection wells have reduced the concentration of non-condensable gases by 70% in close by extraction wells141. However it has not been confirmed whether this is from dilution or from displacement to extraction wells further away from the new injection wells, and it might only be temporary. To accommodate the uncertainty in the absence of available data142, an average reduction of 44.5% is assumed, resulting in a total GHG emissions factor of 0.1394 lb-CO2/kWh for The Geysers. The 0.1394 lb-CO2/kWh emissions factor for The Geysers is very low compared to fossil-fueled power plants, and is 71.5% lower than PG&E’s emissions factor of 0.489 lb-CO2/kWh143.
GHG Emissions from Pumping Reclaimed Wastewater to The Geysers Electricity for reclaimed wastewater irrigation and the Geysers pumps at the Laguna plant is supplied from PG&E, and is thus included in both the total GHG emissions and in Santa Rosa’s GHG inventory. However, electricity supplied by Calpine Corporation from the Geysers geothermal power plants to lift the reclaimed wastewater 3,300 ft and then distribute it to injection wells is not included in Santa Rosa’s GHG inventory. This pumping is an element of Calpine’s operations, and is an auxiliary load from which to calculate net electrical output and GHG emissions from the geothermal plants.
138 Haizlip, J.R. et al (circa 1995) Changes in Plant Inlet Gas Chemistry with Reservoir Condition, Location, and Time Over 15 Years of Production at The Geysers, California, U.S.A Geothermal Resource Council, vol?, p.1939-1944. 139 The mass of each component gas is mi=M*yi*ni, where M is the total mass of non-condensable gases, yi is the mole fraction of the component gas, and ni is the molar mass of the component gas. This allows calculation of the CH4 mass emissions rate as 0.0888lb-CO2/kWh*(12%*16.04lb/mole-CH4)/(55%*44.04lb/mole-CO2)=0.0071 lb-CH4/kWh. 140 An evaluation of 85 international geothermal power plants yielded a similar average emissions factor of 0.29 lb-CO2/kWh. Bloomfield, K.K. et al (2003) Geothermal Energy Reduces Greenhouse Gases GRC Bulletin March/April 2003. 141 Stark et al (2005). 142 Analysis of non-condensable gases is performed from time to time, so confirming data should be available from Calpine in the near future. 143 This coefficient is from PG&E’s February 2005 CCAR report to the Climate Registry. Previously the coefficient was based on 0.73 lb-CO2/kWh used by the Western Systems Coordinating Council for California and Nevada utilities.

Appendix C: Rosenblum Environmental Engineering Study
Santa Rosa Utilities Greenhouse Gas Study 131
Since monthly energy data was not available for the Calpine electricity, it is assumed that Calpine energy use will follow the same pattern as the Laguna plant Geysers pumps, scaled up according to the 10.8 ratio of pumping power144. Figure C/3-5 shows that in 2004 and 2005, the Calpine pump stations used 86% of the total electrical energy needed for reclaimed wastewater operations. The difference between the years is a reflection of the difference in influent volume, and the parallel increase in pumping to the Geysers. Due to the low GHG emissions factor of the Geysers, Figure C/3-6 shows that in 2004 and 2005, the use of Calpine electricity generated only 63% of the total GHG emissions from reclaimed wastewater operations. Even though Calpine’s electricity use is a water-related end-use, an estimate is required to fully identify the net GHG impact of the SRGRP – and to compare it with other options for reclaimed wastewater that might provide larger reductions in GHG emissions and displace potable water demands. For example, if significant water efficiency improvements become part of a future regional effort to reduce GHG emissions, reducing summer pumping to the Geysers to increase local irrigation with reclaimed wastewater might yield a more sustainable and more cost-effective overall reduction in Santa Rosa’s GHG emissions145. Looking into the future, there seems to be considerable opportunity for combined optimization of reclaimed wastewater applications and managing steam extraction at the Geysers.
144 In December 2005 the Geysers pump station ran almost continuously to deliver 443 MG (14.3 MGD), and used 632 MWh. The resulting 0.849 MW demand is 91.2% of the 1,250 HP pump motor capacity (usually runs with a Variable Speed Drive and can be supplemented with an 800 HP fixed speed pump; in December 2005, the backup pump was not used). There are three lift pump stations, each with five 1,000 HP pumps (normal operation is with 2-4 pumps), so assuming that 4 pumps were required in each station in December 2005 the maximum power demand would have been 8.155 MW (3stations*4pumps*1,000HP*0.745/1000*91.2%). Information about the distribution pumps was not available, but nominally, 8 MW is required for the lift and 1 MW for distribution (Stark et al 2005), so the total Calpine power demand in December 2005 would have been 9.174 MW (8.15MW*(1+1/8)). Thus the overall Calpine to Laguna power ratio is 10.8 (9.174MW/0.849MW). 145 Local urban landscape irrigation would sharply reduce peak summer energy use to deliver potable water for urban irrigation (Sonoma County Water Agency Greenhouse Gas Emissions from Water Supply Operations: Current Inventory and Potential Reductions, Rosenblum Environmental Engineering, 2006). Less energy would be used by the Laguna plant Geysers pumps to support local irrigation than pumping to the first Calpine lift station. Besides GHG reductions, the reduction in pumping to the Geysers would allow Calpine to sell more electricity at higher summer rates. To make up for the summer reductions, winter deliveries to The Geysers could be increased, depending on pipeline and storage capacities, operational requirements of the injection wells, and contractual obligations.

Appendix C: Rosenblum Environmental Engineering Study
Santa Rosa Utilities Greenhouse Gas Study 132
FIGURE C/3-5
3,470 3,7604,130 4,770
44,604
51,516
0
5,000
10,000
15,000
20,000
25,000
30,000
35,000
40,000
45,000
50,000
55,000
60,000
65,000
2004 2005
MW
h/ye
ar
ELECTRICITY USE FOR RECLAIMED WASTEWATER OPERATIONS
CALPINE/GEYSERSLAGUNA/GEYSERSIRRIGATION
FIGURE C/3-6
850 920
1,0101,170
3,109
3,591
0
500
1,000
1,500
2,000
2,500
3,000
3,500
4,000
4,500
5,000
5,500
6,000
2004 2005
tons
-CO
2/ye
ar
GHG EMISSIONS FROM RECLAIMED WASTEWATER OPERATIONS
CALPINE/GEYSERSLAGUNA/GEYSERSIRRIGATION
Appendix C: Rosenblum Environmental Engineering Study
Santa Rosa Utilities Greenhouse Gas Study 133
GHG Emissions and Benefits from Electricity Generation at The Geysers Pumping reclaimed wastewater to The Geysers reduces the need to discharge wastewater into the Laguna de Santa Rosa, and helps extend low GHG electricity production at The Geysers. In other words, the SRGRP is a wastewater compliance project that provides net reductions in GHG emissions. Although the Geysers electricity is defined as renewable146, Santa Rosa cannot claim it as a GHG emissions offset because it is part of Calpine’s portfolio. When Calpine sells electricity from the Geysers, the GHG offsets are then re-allocated to the purchasers, which is why a premium is charged for “low carbon” or “green” power. Geothermal energy - almost all from the Geysers - accounts for 2% of PG&E’s electricity, and is included PG&E’s remarkably low GHG emissions factor. To calculate the net reduction in GHG emissions, first the electrical energy attributable to Santa Rosa’s portion of the SRGRP annual output must be calculated, and then the Calpine energy used to lift and distribute the water must be subtracted. In 2005, the result was that PG&E avoided purchasing 261,800 MWh/yr with higher emissions147. Figure C/3-7 compares the GHG emissions from Santa Rosa’s portion of the SRGRP with the GHG emissions that would have been otherwise generated by PG&E. The net reduction in GHG emissions is 41,000 tons-CO2/yr.
146 As explained in previous sections, there is an inevitable decline in steam production even with all the recharge projects – but the 3.5%/yr rate of decline in 2006 is dramatically lower than the 25%/yr of the late 1980s. 147 Santa Rosa’s portion of reclaimed wastewater is 75%; SRGRP’s capacity allocation is 86 MW; average annual capacity utilization factor for Calpine is 55%; the lift and distribution pumping for Santa Rosa’s portion of reclaimed wastewater required 51,516 MWh in 2005.
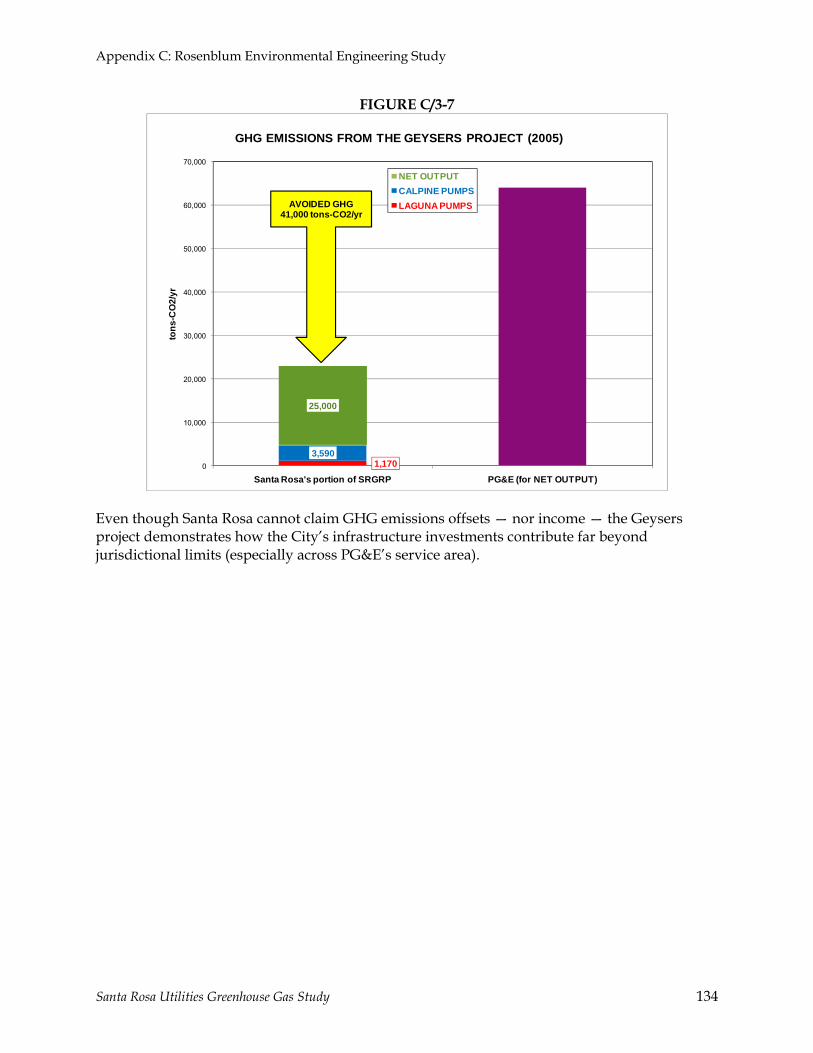
Appendix C: Rosenblum Environmental Engineering Study
Santa Rosa Utilities Greenhouse Gas Study 134
FIGURE C/3-7
1,1703,590
25,000
0
10,000
20,000
30,000
40,000
50,000
60,000
70,000
Santa Rosa's portion of SRGRP PG&E (for NET OUTPUT)
tons
-CO
2/yr
GHG EMISSIONS FROM THE GEYSERS PROJECT (2005)
NET OUTPUTCALPINE PUMPSLAGUNA PUMPSAVOIDED GHG
41,000 tons-CO2/yr
Even though Santa Rosa cannot claim GHG emissions offsets — nor income — the Geysers project demonstrates how the City’s infrastructure investments contribute far beyond jurisdictional limits (especially across PG&E’s service area).

Appendix C: Rosenblum Environmental Engineering Study
Santa Rosa Utilities Greenhouse Gas Study 135
Appendix C/4: Integration of High-Performance Water Efficiency into Infrastructure Project Planning This baseline evaluation is only the starting point for developing plans to reduce water-related GHG emissions - and water use itself - to sustainable levels. Since water efficiency has been identified as the largest opportunity, the first recommendation is to integrate a high-performance water efficiency program into the City of Santa Rosa and SCWA’s water and wastewater infrastructure plans, and County and State GHG reduction plans, such as: • The Laguna Subregional Incremental Recycled Wastewater Plan (IRWP). • The Laguna plant Power Master Plan (PMP). • The Laguna plant Biosolids Master Plan (BMP). • The City of Santa Rosa and SCWA’s Urban Water Management Plans (UWMPs). • SCWA’s Water Supply, Transmission, and Reliability Project (WSTR). • The City of Santa Rosa’s Rate Task Force’s water and wastewater rate-setting
model/procedures (RTF). • County GHG emissions reduction planning • State (AB 32) GHG emissions reduction planning Integration of high-performance water efficiency into infrastructure projects and estimating future regional GHG reductions should include the following:
1. Agreement on the same rate of population growth in all plans.
2. Setting of possible water efficiency improvement targets for indoor and outdoor uses, in residential, commercial, institutional, and industrial sectors (i.e. a range of “what if” implementation targets for each type of use).
3. In the SCWA’s WSTR project (details in the report on SCWA’s GHG emissions148): a. Electrical power reductions will be larger than flowrate reductions, following a
quadratic relationship. b. GHG reductions will be heavily influenced by SCWA’s mix of electricity sources.
4. In the Laguna plant IRWP: a. The ratio of volume-related energy to load-related energy will be significantly changed
with water efficiency and must be evaluated before making projections: i. Water efficiency will reduce volume/flow related energy use, but energy use related
to organic load will change with population. ii. Load related energy use could be reduced if decentralized satellite treatment plants
(managed by the City) are added to the IRWP. iii. Improving sewers to reduce I&I will reduce volume/flow related energy use in
winter, and the design of the associated flow equalization basins could help manage power demand during summer peak periods.
148 Sonoma County Water Agency Greenhouse Gas Emissions from Water Supply Operations: Current Inventory and Potential Reductions, Rosenblum Environmental Engineering, 2006 (Appendix to Sonoma County Water Agency Final Report: Greenhouse Gas Emissions, Energy Use and Emissions Reduction Potential Climate Protection Campaign, 2007).
Appendix C: Rosenblum Environmental Engineering Study
Santa Rosa Utilities Greenhouse Gas Study 136
b. The large GHG emissions from the digester/cogeneration will be significantly influenced by design decisions in the IRWP, the BMP, and the PMP, such as: i. Better sludge thickening and longer digester retention time to increase biogas
production. ii. Multi-stage mesophilic and thermophilic processes to increase biogas production
and increase exhaust heat utilization. iii. Feed supplementation with wastes from restaurants, food-processing, cow manure,
and plant residues to increase biogas production. iv. Selection of turbines and bottoming cycles to increase electricity production and the
potential for exhaust heat utilization. v. Stripping and compressing methane (and CO2) for sale off-site, with abandonment of
on-site cogeneration. c. The distribution of reclaimed wastewater between different applications:
i. Increasing urban landscape irrigation will displace energy use and GHG emissions from existing potable water supply.
ii. Reducing pumping to the Geysers while increasing local urban landscape irrigation will reduce GHG emissions by the Calpine pumps, and might not necessarily reduce State-wide availability of renewable electricity if recharge can be optimized to sustain performance of the geothermal field.
iii. Energy efficiency improvements to agricultural (and future urban) reclaim wastewater pump stations will reduce GHG emissions.
iv. The total volume of reclaimed wastewater, and the allocation between each application will depend on the water balance for the entire Laguna Sub-regional system, including influent flows, effluent storage volume, and allowable and/or desired discharge to the Russian River. With high-performance water efficiency it is likely that storage volumes for close to zero discharge will become feasible.
d. Required treatment standards for discharges and reclaimed wastewater will influence energy use and GHG emissions.
5. Analyze the life-cycle economics for alternative scenarios using the RTF procedures, including the following factors: a. Capital and operating costs for Santa Rosa’s portion of all water supply and wastewater
treatment infrastructure projects, and Russian River watershed restoration. b. Capital and operating costs for water efficiency improvements. c. Projections of PG&E rates for electricity and natural gas. d. City bond rating and terms of financing. e. Depreciation/amortization of equipment and investments. f. Carbon emissions regulations and related fees and/or taxes. g. Rate structure.
Although the above list of considerations is large and seemingly complex, existing reports for infrastructure plans (e.g. the water balances of the IRWP and UWMP) can be modified quite straightforwardly to integrate high performance water efficiency.

Santa Rosa Utilities Greenhouse Gas Study 137
APPENDIX D: Baseline GHG Emissions — Water-Related Energy Use by Santa Rosa Water Utility Customers1
Residential Customers
Perhaps the best overview of water-related GHG emissions for residential units in Santa Rosa’s service area is provided by the most recent Residential Appliance Saturation Survey. This statewide study, most recently prepared for the California Energy Commission in 2004, is a survey-based econometric analysis that estimates the electric and natural gas demand by residential end use for the state’s different climate zones. Data for water-related end uses within Santa Rosa’s climate zone are presented in Table D-1 below.
Table D-1
RESIDENTIAL WATER-RELATED ENERGY CONSUMPTION California Forecast Climate Zone 4
kWh/household-year Saturation Average
HouseholdTh/household-
year Saturation Average Household
Household Water HeaterOwned by User 2,592 5% 130 191 81% 155Included in Rent 2,375 1% 30 175 10% 17
Clothes Washer 97 78% 76Dryer 652 45% 293 26 27% 7Dishwasher 77 67% 52Pools
Pump 2,580 8% 206Heat 0 174 1% 2
SpasPump Energy 428 8% 34Heating 1,346 5% 67 73 3% 2
Total per Household (avg) 889 183
1. This table summarizes unit energy and saturation data obtained from the California Statewide Residential Appliance Saturation Study, Volume 2, Study Results Final Report, prepared for the California Energy Commission (Publication 300-00-004) by KEMA-XENERGY, Itron, and RoperASW: June, 2004. The unit energy values, by end use, were derived via conditional demand analysis performed upon survey data from 21,920 residential accounts. These were supported by onsite metering data from a subset of 180 participants. The data above is for California Forecast Climate Zone 4, where Santa Rosa is located. Note that climate zones are different for this study than those otherwise used for California energy analysis (e.g., Title 24).
3. Unit energy consumption values for water heaters were determined for 86% of all households. Hot water for an additional 11% of all homes in Forecast Climate Zone 4 is provided by common systems for which the fuel cost is included in the rent. Unit energy consumption and distribution between electric and gas for these was estimated by the pattern of known apartment usage. Energy consumed by other households that use a water heating fuel other than electricity or gas was ignored.
END USEELECTRICITY NATURAL GAS
NOTES
2. Average energy use per end use is shown above. For example, electric dryers in Zone 4 homes use an average of 652 kWh/yr, whereas gas dryers use 26 Therms/yr. "Saturation" indicates the percentage of residential units equipped with each appliance or service: 45% of Zone 4 homes have electric dyers; 27% have gas dryers. Electric and Gas use in the fictitious average residence is found by multiplying average usage by the saturation percentage for each end use, then totalling across all end uses and fuel types.
The water-related residential uses to which electricity and natural gas are supplied is summarized by Figure D-1. Water heating is the biggest load, and natural gas is the principal energy source. Clothes drying, a distant second, is accomplished in ~45% of residential units
1 Prepared by E. B. Orrett, PE (President, Resource Performance Partners, Inc.), Petaluma, CA

Appendix D: Baseline GHG Emissions: Water Related Energy Use by Santa Rosa Water Utility Customers
Santa Rosa Utilities Greenhouse Gas Study 138
RESIDENTIAL ENERGY USE(BTU/yr delivered for Water Related and Other Uses)
22,000,000
18,300,000
3,000,000
18,300,000
Gas (other)Gas (wtr)Elec (wtr)Elec (other)
with electricity, and 27% with natural gas. To simplify comparison, the energy value of electricity and natural gas delivered to homes is expressed in common units (BTU).
Figure D-1
The water-related fraction of household energy use in Forecast Climate Zone 4 comprises, on average, 45% of delivered natural gas and 15% of electricity (Figure D-2). On the basis of total energy delivered, approximately 30% of household energy is used for water-related purposes. These data reflect average annual energy use per residential household across all forms of housing (single family detached, attached homes, apartments, and mobile homes).
Non-Residential Customers
Data available for estimating water-related energy used by the City of Santa Rosa’s non-residential customers are not as well developed as for the residential sector. Summary metrics published in statewide studies are used to develop values for the unit consumption of water-related electricity and natural gas within the commercial sector (Table D-2).
RESIDENTIAL ENERGY USE RELATED TO WATERCalifornia Forecast Climate Zone 4 (average household)
0
4,000,000
8,000,000
12,000,000
16,000,000
20,000,000
Water H
eatin
g
Clothe
s Was
her
Dryer
Dishwas
her
Pool
Spa
BTU
/yr
ElectricityNatural Gas
Figure D-2

Appendix D: Baseline GHG Emissions: Water Related Energy Use by Santa Rosa Water Utility Customers
Santa Rosa Utilities Greenhouse Gas Study 139
Table D-2
WATERElectricity Natural Gas Indoor Elec Gas Both
GWh 106 Therm 106 AF kWh/AF Th/AF Btu/glResidential 13,528 2,055 3.3 4,099 623 234Commercial 8,341 250 1.6 5,213 156 103Industrial 6,017 1,914 0.7 8,596 2,734 929
TOTAL 27,886 4,219 5.6 4,980 753 283
3. The assumption is made that the end use energy reported above is virtually all associated with indoor use. Energy intensities are therefore calculated in relation to indoor instead of total water use to avoid the distorting effect of the variation in outdoor water use around the
NOTES
CALIFORNIA STATEWIDEEnd-Use Energy Associated with Urban Water Users
1. Energy usage data taken from Gary Klein, et al., California's Water-Energy Relationship , California Energy Commission Publication 700-2005-SF: November 2005 (Table 1-6).2. Water Usage data taken from California Water Plan Update 2005, Volume 3 , California Department of Water Resources (Table 1-3).
ENERGY ENERGY INTENSITYSECTOR
Citywide GHG Emissions We may combine estimated energy usage for the residential and commercial sectors from Tables D-1 and D-2 above with Santa Rosa utility data about numbers of customers and their water demand to estimate customer energy use related to water use city-wide. GHG emissions may then be estimated by extending those totals with applicable coefficients (Table D-3). The estimated total, 81,000 tons eCO2/yr, is due mostly to the residential demand for hot water (Figure D-3).
Figure D-3
Fig. A-3 2005 Water-Related GHG Emissions from End Users(81,000 tons eCO2)
Residential91%
Non-Residential9%

Appendix D: Baseline GHG Emissions: Water Related Energy Use by Santa Rosa Water Utility Customers
Santa Rosa Utilities Greenhouse Gas Study 140
Table D-3
Quantity kWh/unit kWh Th/Unit Th Tons eCO2/yr Indoor Total Indoor TotalSingle Family 41,088 2,549 4,320Multifamily 16,856 1,076 1,296
Subtotal 57,944 889 51,487,082 183 10,584,725 74,350 3,625 5,601 21 13
AF kWh/AF kWh Th/AF Th3,245 5,213 16,914,140 156 506,958 7,094 1,058 1,339 6.7 5.3
IRRIGATION 0 0 0 0 0 0 915 0 0UNACCOUNTED 0 0 0 0 0 0 597 0 0
CITY-WIDE 68,401,222 11,091,683 81,444 4,683 8,452 17 10
NOTES
0.489 lb eCO2/kWh (PG&E 2005 CCAR) 11.67 lb eCO2/Therm (EPA)
Tons eCO2/MG
5. Unit Greenhouse Gas Emission coefficients applied above are:
1. Water account and usage data were obtained from the Santa Rosa 2005 Urban Water Management Plan. The fraction for indoor water use, when not specified in the UWMP, was obtained from inputs used in Bill Maddaus' Decision Support System for Santa Rosa (revision dated Nov 2005).
Natural Gas
4. An Industrial sector, which has a larger energy intensity than either the Residential or Commercial sectors in statewide data, is not used above. There are few industrial water users in Santa Rosa; too few for water use to be broken out separately for their sector by the City (the key item here for estimating water-related energy/GHG use). Accordingly, this table may underestimate water-related GHG emissions for end users in this sector. No significant end use energy is assumed for the remaining categories of water use (Irrigation and Unaccounted-for system losses).
COMMERCIAL
2. Water-related energy associated with residential water users city-wide was estimated by applying the average relevant household energy usage estimates in the Calif Energy Commission's 2004 Residential Appliance Saturation Survey (Table B-1).
3. Water-related energy associated with commercial water users city-wide was estimated by applying the unit energy intensities found via recent statewide studies (Table B-2). The latter appear to be the most accurate sources for such data currently available.
Annual Energy UsageIndoor Water Use Electricity
RESIDENTIAL
CITY OF SANTA ROSA2005 End-Use Energy & GHG Associated with Urban Water Use
Annual Energy UsageElectricity Natural Gas
GHG EmissionsHousing Units Water Volume & Unit Emissions
MG/yr
Santa Rosa Utilities Greenhouse Gas Study 141
APPENDIX E: Pay As You Save® (PAYS®)
Barriers to Efficiency and Climate Change Improvements
The marketplace for resource efficiency products, even when stimulated by rebate programs, is rife with market barriers that inhibit many consumers and businesses from buying them:
• Lack of capital (or competing demands for capital); • Limited debt capacity (or need to preserve it); • Uncertainty about length of occupancy; • Risk that measures may fail before savings pay for measure cost; and • Building owner is not the bill payer (e.g., new development or rental property).
Public funds for efficiency and climate change programs are limited. Limited program budgets can actually dampen the market for efficiency products when they are oversubscribed.
PAYS®: Designed to Eliminate Barriers
Pay As You Save® (PAYS®) is a market based system that eliminates these barriers to the purchase and installation of proven, cost effective energy efficiency measures.
1. PAYS® eliminates the barriers that have kept customers from purchasing efficiency products and saving money. PAYS® customers have:
• No up-front payment, no debt obligation, no credit checks, no liens; • A guarantee that their monthly charge is lower than their estimated savings; • The assurance they will pay only while they remain at the location; and • A promise that failed measures will be repaired or the payment obligation will end.
2. PAYS® assigns bill-paying responsibility to a meter location rather than to an individual customer. Since customers assume no new debt when they buy PAYS® products, the approval process for customers such as public or private facilities managers is simplified. Successive customers at that location pay the PAYS® charge and benefit from the savings.
3. The monthly tariff charge is always lower than the estimated savings from the PAYS® product. The charge remains on the bill for that location until all the costs are recovered. This means tenants or anyone uncertain about the duration of their occupancy can purchase PAYS® products assured they will receive savings that exceed their payments during their occupancy.
4. Third party capital pays the upfront costs for PAYS® products. Because PAYS® offers solid investment opportunities, it attracts sufficient capital to meet demand. PAYS® can also be used to enhance current efficiency programs, making them available to more types of customers while producing more efficiency with available funding.

Appendix E: Pay As You Save® (PAYS®)
Santa Rosa Utilities Greenhouse Gas Study 142
PAYS® System Requirements
• A capital provider to fund the up-front costs of the measures; • A certification agent to certify that PAYS® products will result in sufficient savings to
cover the costs of installation, financing and management fees, and still deliver net savings;
• A utility to bill PAYS® charges, collect payments from customers with PAYS® products, and forward the funds to the certification agent who repays the capital provider; and
• A PAYS® tariff to enable a utility to bill customers for PAYS® products at the location where they were installed.
Roles and Responsibilities
The roles and responsibilities in the PAYS® system are as follows:
Pays Contractors for Completed Jobs
Capital Provider
Customer
Utility Certification Agent
Certified Contractor
Escrow Account
Repays Capital
Provider
Sends Payments
Draws Funds to Pay Contractors
Installs PAYS® Products
Monthly PAYS®
Payment

Appendix E: Pay As You Save® (PAYS®)
Santa Rosa Utilities Greenhouse Gas Study 143
Certification Agent • Contracts with certified contractors and
customers
• Certifies projects as PAYS® products
• Contracts with utility so it may authorize PAYS® tariff at installation location
• Collects payments from Utility and forwards to capital provider
Utility • Implements tariff at locations when
notified by Certification Agent • Bills and collects payments from
customers with PAYS® products • Sends Certification Agent payments
equal to monthly billed PAYS® charges
• Notifies successor customers of PAYS® obligations upon application for service
Certified Contractor • Markets PAYS® products • Identifies qualifying products • Applies to Certification Agent to qualify
PAYS® products • Installs products and is paid by
Certification Agent upon successful installation
• Can finance installations
Customer • Contracts with Certification Agent to
buy certified PAYS® products • Pays monthly charges as long as they
remain at the premises and product functions
• Realizes net savings • If owner, obligated to notify successor
customers about PAYS®
Santa Rosa Utilities Greenhouse Gas Study 144
APPENDIX F: Improving Indoor Residential Water Efficiency with PAYS®1 Table F-1 of the main report indicates that indoor residential water use is directly responsible for nearly 80% of all GHG emissions associated with the City’s municipal water cycle.2 According to the City of Santa Rosa’s 2005 Urban Water Management Plan, indoor residential water use accounted for 46% of all water supplied by the City to its customers in 2005.3 Of this amount, 70% was used in single family homes, and the balance in multi-family homes. The model used to estimate the efficacy of water efficiency measures across all end use sectors served by the City of Santa Rosa is not available to the writers of this report. However, indoor residential water use is generally understood in the US municipal context, so may be relied upon to estimate the capability of the PAYS® system to serve customers occupying single family homes. This is the most important end use in the City. Accordingly, the purpose of this Appendix is explore the potential for the PAYS® system to improve water savings performance throughout the City via a pro forma estimate of its application to just this one end use sector.4 To be additionally conservative, no rebates are assumed from the City utility, nor is an escalation in water, wastewater, or energy rates faced by customers.
Pro Forma Savings Estimate
1. Current Water Use The first step is to estimate the distribution of water use within existing homes. This is provided in Table F-1 below, where the total estimated indoor water use of 65.5 gallons per capita-day given in the 2005 Urban Water Management Plan is distributed among the principal end uses pursuant to the standard pattern measured in US, modified according to reported “Go Low Flow” performance.
1 Prepared by E. B. Orrett, P.E. (President, Resource Performance Partners, Inc.), Petaluma, CA 2 Approximately 74,000 tons of eCO2 was emitted in 2005 directly due to indoor residential water use, due mainly to water heating. Emissions for the entire municipal water cycle, including commercial end uses and emissions due to water supply and wastewater management, totaled ~94,000 tons of eCO2 in 2005. 3 Of 24,402 AF delivered to metered end uses, 13,253 AF and 3,976 AF were delivered to single and multiple family residences, respectively. With the indoor fraction of water use estimated at 59% and 83% for these end uses, respectively, total indoor use in 2005 was approximately 7,819 AF and 3,300 AF. This means indoor water use as a percentage of all delivered water was 32% and 14% for single family and multifamily sectors, respectively, or 46% of all water delivered. 4 This system may be applied as well to all other end use sectors, including new construction.

Appendix F: Improving Indoor Water Efficiency with PAYS®
Santa Rosa Utilities Greenhouse Gas Study 145
Table F-1
2. Post Retrofit Water Use To improve upon current usage, the assumption is made that the dependable water savings sought here will be achieved with improved technology, not changed behavior. Comprehensive indoor home retrofit projects demonstrated in Seattle, Oakland, and Tampa (referred to in Tables F-1 and F-2) were used as a guide for this study, for they included the best of proven technology available at the time. Consequently, this study assumed a completely retrofitted Santa Rosa home would feature the same types of indoor equipment: top quality toilets, showerheads, aerators, and a premium clothes washer. For Santa Rosa, two additional measures were considered: installation of an on-demand hot water circulation system, and attention to leaks other than those addressed via
US Seattle Oakland Tampa Santa Rosa RationaleToilet 18.5 18.8 19.9 17.9 14.9 Go Low FlowClothes washer 15.0 14.8 13.9 14.7 14.1 Go Low FlowShower 11.6 9.0 12.0 12.7 9.8 Go Low FlowFaucet 10.9 9.2 10.5 9.4 8.9 Go Low FlowLeak 9.5 6.5 25.7 18.9 8.4 Go Low FlowOther domestic 1.6 0.2 0.1 0.5 7.3 UnknownBath 1.2 3.7 3.0 2.6 1.2 US avgDishwasher 1.0 1.4 1.0 0.6 1.0 US avg
TOTAL 69.3 63.6 86.1 77.3 65.5 n.a.Homes surveyed 1,188 37 33 26 n.a.Avg # residents 2.8 2.54 2.56 2.91 2.61 n.a.
2. The Suggested Baseline for Santa Rosa is estimated above to match the average indoor usage of 65.5 gcd provided in the Santa Rosa 2005 UWMP. Water use in the average home was adjusted downwards from the national average for each of the first five end use categories to a likely value given the retrofit percentages achieved by the City's "Go Low Flow" program (50%, 15%, 87%, 76%, and 25% for toilets, clothes washers, showerheads, faucets, and leaks associated with toilet replacement, respectively). Bath and dishwasher usage is estimated at the US average. 5.7 gcd is added to the "other domestic" category as a conservative way to reconcile this breakout with the total described in the UWMP.
INDOOR RESIDENTIAL WATER USE
c. Oakland: Peter W. Mayer, William B. DeOreo, Erin Towler, and David M. Lewis, Aquacraft, Inc. Water Engineering and Management, Residential Indoor Water Conservation Study: Evaluation of High Efficiency Indoor Plumbing Fixture Retrofits in Single-Family Homes in the East Bay Municipal Utility District Service Area, July 2003: 172 pp.d. Tampa: Peter W. Mayer, William B. DeOreo, Erin Towler, Leslie Martien, and David M. Lewis, Aquacraft, Inc. Water Engineering and Management, Tampa Water Department Residential Water Conservation Study: The Impacts of High Efficiency Plumbing Fixture Retrofits in Single-Family Homes, January 2004: 187 pp.
Notes1. Data Sources
a. US: AWWA Research Foundation, Residential End Uses of Water, 1999 (12 US Cities)b. Seattle: http://www.aquacraft.com/Publications/seattle.htm
Table 1
SUGGESTED BASELINEMEASUREDEND USE
Typical Usage in Single-Family Residences (gl/person-day)
Appendix F: Improving Indoor Water Efficiency with PAYS®
Santa Rosa Utilities Greenhouse Gas Study 146
toilet replacement. The hot water system, a fairly new device, circulates water back to the water heater when activated by a user until water of sufficient temperature is available at the point of use.5 This saves water, and residual thermal energy retained within it, from loss down the drain. For this analysis, it is assumed that subsequent to the City’s “Go Low Flow” program, the average Santa Rosa home will receive the following measures to complete its upgrade:
• One High Efficiency Toilet (Mancesa “Cyclone” 1.0 gallon per flush (gpf));
• One premium clothes washer (e.g., LG Electronics WM2075CW);
• One Metlund D’Mand on demand hot water recirculation system; and
• Plumber attention to leaks. Estimated water use following installation of this equipment is provided on Table F-2.
5 Savings performance is variable, and poorly understood known for this device. Savings projections used herein (3.5 gcd) are conservative in comparison with the range of values reported in the literature. A first-rate field study now being designed by Lawrence Berkeley National Laboratory (March, 2007) will help considerably.

Appendix F: Improving Indoor Water Efficiency with PAYS®
Santa Rosa Utilities Greenhouse Gas Study 147
Table F-2
Usage ImprovementsToilet 7.9 9.8 7.8 new 1.3+ gpf toilet 6.5 new 1.0 gpf toiletClothes washer 9.2 8.8 7.8 new unit (good) 5.5 new unit (premium)Shower 8.7 10.7 9.1 new showerhead 7.9 new + Hot Wtr recircFaucet 8.0 10.5 6.2 flow control 7.2 flow c + Hot Wtr recircLeak 2.2 8.9 3.7 via new toilet 1.5 via toilet & plumberOther domestic 0.1 0.2 1.4 unaddressed 7.3 unaddressedBath 2.7 2.8 2.4 unaddressed 1.2 US AverageDishwasher 1.2 0.9 0.5 unaddressed 1.0 US Average
TOTAL 40.0 52.6 38.9 n.a. 38.2 n.a.Savings vs. Pre Retrofit Usage 37% 39% 50% 42%
Homes surveyed 37 33 26 n.a. n.a. Avg # residents 2.48 2.52 2.91 n.a. 2.61 n.a.
e. Leak: The assumption is made that a plumber is employed to repair leaks in indoor plumbing caused by things other than toilets, and that the average leak rate may be reduced from ~4.9 to 1.5 gl/person-day. This is ~30% lower than the lowest rate measured in the three reference studies, where leaks are eliminated only via replacing toilets.
f. Faucets and Shower: In addition to a new showerhead and flow control fittings for faucets, a Metlund Hot Water D'Mand system is installed to recirculate water from hot water faucets back to the water heater until water of sufficient temperature is available at the point of use. This eliminates wasting "warm-up" water down the drain. A US DOE study (ORNL/TM-2002/245) indicates this will save a family of four about 12,000 gl/yr, or 8.2 gl/person-day. We rely here on a more conservative estimate of 3,600 gl/yr for the average existing household made by Ned Orrett, P.E., after consulting with industry experts. With a US average household population of 2.8 persons, this is 3.5 gl/person-day. This saved volume is distributed on a pro rata basis between shower and faucet uses. This device was not included in the three city tests reported above.
2. Measured Performance: the retrofit projects reported by Aquacraft commenced in 1999, 2001, and 2003 for Seattle, Oakland, and Tampa, respectively. The mix of equipment changed slightly across these projects as different toilets, clothes washers, and other items were employed. The effects of each alteration are described and examined for statistical significance within the unusually well-crafted reports.
Notes
END USEPROJECTED PERFORMANCE
Tampa Usage
Table 2
1. Sources for Measured Usage data: Studies by Aquacraft, Inc., cited in Note 1 of Table 1.
Single-Family Residences after High Efficiency Retrofit (usage in gl/person-day)INDOOR RESIDENTIAL WATER USE
3. Improvements Modeled and Estimated Post Retrofit Usage
Post RetrofitMEASURED PERFORMANCE
ImprovementsSeattle Usage
Oakland Usage
a. Toilet: One each 1.0 gpf Mancessa "Cyclone" High Efficiency Toilet (now being deployed to thousands of satisfied utility customers in Redwood City). This assumes one ULF toilet was previously installed by the Go Low Flow program.b. Clothes Washer: This assumes use of a machine with a reported Energy Star Water Factor of 3.9 gl/ft3-load. The water usage rate of 5.6 gl/person-day was found by multiplying the Water Factor by the clothes washer usage rate of 0.37 loads per person-day (AWWA Research Foundation, Residential End Uses of Water, 1999), and adjusting that result upwards by 19% to account for the relatively higher actual usage reported in the Aquacraft studies (that is, higher than would be expected based upon the Water Factors reported for the various clothes washer used). c. Shower: New head installed previously via Go Low Flow. Usage is reduced by an additional 1.8 gcd via an on demand hot water demand recirculation system (per Note (f) below).d. Faucet: New flow controls previously installed during Go Low Flow program for all kitchen and bathroom faucets. Post retrofit usage here is estimated to decline by an additional 1.7 gcd with hot water recirculation (see (f) below).
3. Energy Use A variety of sources were consulted to cobble together an internally consistent estimate of water-related energy use for the average Santa Rosa home. Although unit values reported across different studies vary (e.g., the volume of hot water used per load in clothes washers), the model used here was adjusted such that total water heating energy for the Standard Efficiency scenario is equal to that reported for homes in the Santa Rosa climate zone by the
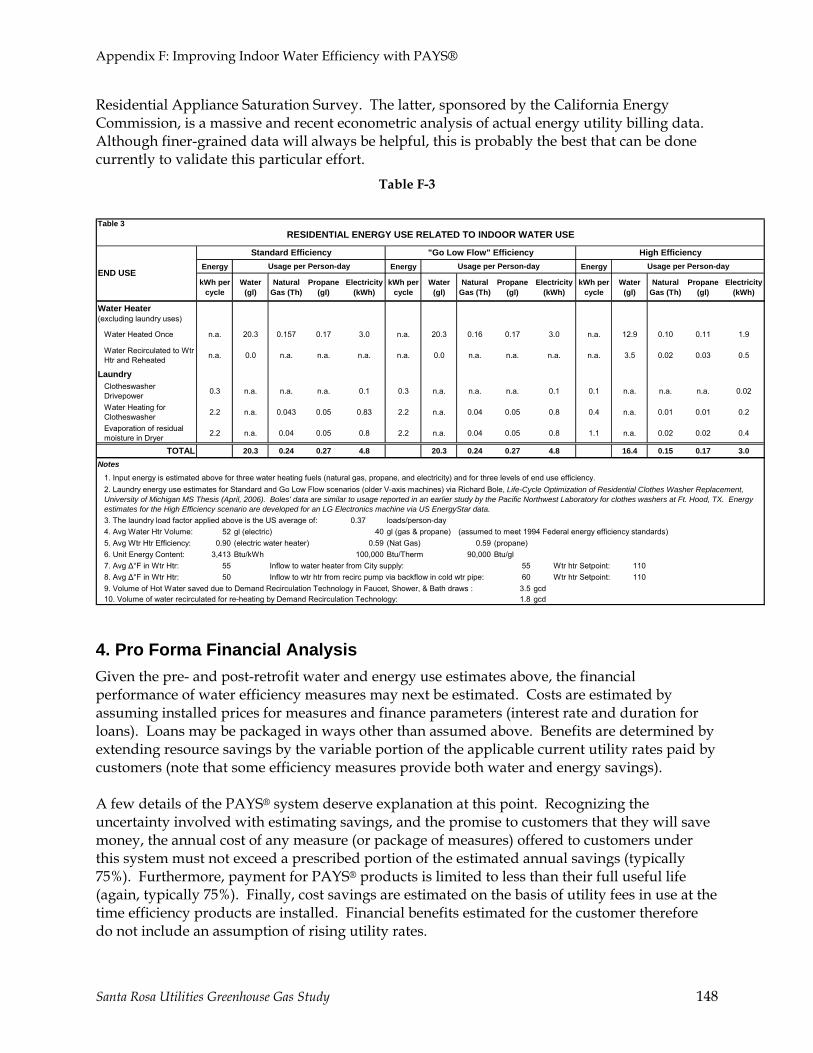
Appendix F: Improving Indoor Water Efficiency with PAYS®
Santa Rosa Utilities Greenhouse Gas Study 148
Residential Appliance Saturation Survey. The latter, sponsored by the California Energy Commission, is a massive and recent econometric analysis of actual energy utility billing data. Although finer-grained data will always be helpful, this is probably the best that can be done currently to validate this particular effort.
Table F-3
4. Pro Forma Financial Analysis Given the pre- and post-retrofit water and energy use estimates above, the financial performance of water efficiency measures may next be estimated. Costs are estimated by assuming installed prices for measures and finance parameters (interest rate and duration for loans). Loans may be packaged in ways other than assumed above. Benefits are determined by extending resource savings by the variable portion of the applicable current utility rates paid by customers (note that some efficiency measures provide both water and energy savings). A few details of the PAYS® system deserve explanation at this point. Recognizing the uncertainty involved with estimating savings, and the promise to customers that they will save money, the annual cost of any measure (or package of measures) offered to customers under this system must not exceed a prescribed portion of the estimated annual savings (typically 75%). Furthermore, payment for PAYS® products is limited to less than their full useful life (again, typically 75%). Finally, cost savings are estimated on the basis of utility fees in use at the time efficiency products are installed. Financial benefits estimated for the customer therefore do not include an assumption of rising utility rates.
Energy Energy Energy
kWh per cycle
Water (gl)
Natural Gas (Th)
Propane (gl)
Electricity (kWh)
kWh per cycle
Water (gl)
Natural Gas (Th)
Propane (gl)
Electricity (kWh)
kWh per cycle
Water (gl)
Natural Gas (Th)
Propane (gl)
Electricity (kWh)
Water Heater (excluding laundry uses)
Water Heated Once n.a. 20.3 0.157 0.17 3.0 n.a. 20.3 0.16 0.17 3.0 n.a. 12.9 0.10 0.11 1.9
Water Recirculated to Wtr Htr and Reheated n.a. 0.0 n.a. n.a. n.a. n.a. 0.0 n.a. n.a. n.a. n.a. 3.5 0.02 0.03 0.5
LaundryClotheswasher Drivepower 0.3 n.a. n.a. n.a. 0.1 0.3 n.a. n.a. n.a. 0.1 0.1 n.a. n.a. n.a. 0.02
Water Heating for Clotheswasher 2.2 n.a. 0.043 0.05 0.83 2.2 n.a. 0.04 0.05 0.8 0.4 n.a. 0.01 0.01 0.2
Evaporation of residual moisture in Dryer 2.2 n.a. 0.04 0.05 0.8 2.2 n.a. 0.04 0.05 0.8 1.1 n.a. 0.02 0.02 0.4
TOTAL 20.3 0.24 0.27 4.8 20.3 0.24 0.27 4.8 16.4 0.15 0.17 3.0
0.374. Avg Water Htr Volume: 52 gl (electric) 40 gl (gas & propane) (assumed to meet 1994 Federal energy efficiency standards)5. Avg Wtr Htr Efficiency: 0.90 (electric water heater) 0.59 (Nat Gas) 0.59 (propane)6. Unit Energy Content: 3,413 Btu/kWh 100,000 Btu/Therm 90,000 Btu/gl7. Avg Δ°F in Wtr Htr: 55 Inflow to water heater from City supply: 55 Wtr htr Setpoint: 1108. Avg Δ°F in Wtr Htr: 50 Inflow to wtr htr from recirc pump via backflow in cold wtr pipe: 60 Wtr htr Setpoint: 1109. Volume of Hot Water saved due to Demand Recirculation Technology in Faucet, Shower, & Bath draws : 3.5 gcd10. Volume of water recirculated for re-heating by Demand Recirculation Technology: 1.8 gcd
Usage per Person-day
Table 3RESIDENTIAL ENERGY USE RELATED TO INDOOR WATER USE
END USE
Standard Efficiency "Go Low Flow" Efficiency High EfficiencyUsage per Person-day Usage per Person-day
Notes
1. Input energy is estimated above for three water heating fuels (natural gas, propane, and electricity) and for three levels of end use efficiency.2. Laundry energy use estimates for Standard and Go Low Flow scenarios (older V-axis machines) via Richard Bole, Life-Cycle Optimization of Residential Clothes Washer Replacement, University of Michigan MS Thesis (April, 2006). Boles' data are similar to usage reported in an earlier study by the Pacific Northwest Laboratory for clothes washers at Ft. Hood, TX. Energy estimates for the High Efficiency scenario are developed for an LG Electronics machine via US EnergyStar data.3. The laundry load factor applied above is the US average of: loads/person-day

Appendix F: Improving Indoor Water Efficiency with PAYS®
Santa Rosa Utilities Greenhouse Gas Study 149
Table F-4 provides estimated unit costs, and summarizes unit performance based upon data presented in Tables F-1, F-2, and F-3 above.
Table F-4
Table F-5 pulls everything together to compare costs and benefits. This shows that only the on demand hot water system for homes with gas water heating fails to qualify on its own as a PAYS® product (i.e., when financed for a term equal to 75% of the measure life, annual finance costs slightly exceed 75% of annual savings). However, the hot water system easily qualifies when delivered as part of a package with any other measure (toilet, clothes washer, or leak repair). This is contingent, of course, upon the hot water demand system being a good fit for the home it is offered to (this will provide better value in some homes than in others).
Water Drive Pwr(gl) Gas (Th) Elec (kWh) (kWh) Gas Htg Elec Htg
Leak Repair Service $61 5 1,260 1 20 0 17 15One High Efficiency Toilet (1.0 gpf) $266 25 4,308 0 0 0 16 16Premium Clothes Washer $992 14 3,117 20 389 33 264 219On Demand Hot Water Recirc $493 15 1,278 12 229 -2 142 116
Total $1,812 n.a. 9,963 33 638 32 439 366Notes
1. Heating Energy: Estimates are provided for homes equipped with either natural gas or electric water heaters2. GHG: Pounds of equivalent CO2/yr emitted via use of energy for utility processes, and heating and drivepower in homes3. Leak Repair: Average estimate (note that significant leaks typically occur in fewer than 20% of homes)4. Toilet: Mancesa Cyclone 1 gpf toilet (with Sloan Flushmate IV technology). The price is Redwood City's direct install cost (@ 10,000 units).5. Clothes Washer: LG Electronics WM2075CW (tied for 5th best in water efficiency performance among all 233 EnergyStar certified clothes washers for which data was published in March 2006). This is one of several excellent full-size machines clustered near this price point. The price is retail for one unit with tax, less a $75 PG&E rebate.
7. Unit prices above include administrative fees.6. Hot Water Recirculation: Metlund D'mand system (retail price with vendor's estimate for the cost of installation)
Table 4RESIDENTIAL WATER EFFICIENCY MEASURES
Measure Installed Unit Cost
Lifetime (years)
Savings per Person-Year when Retrofitted in Average SR HomeHeating Energy GHG (lb eCO2/yr)
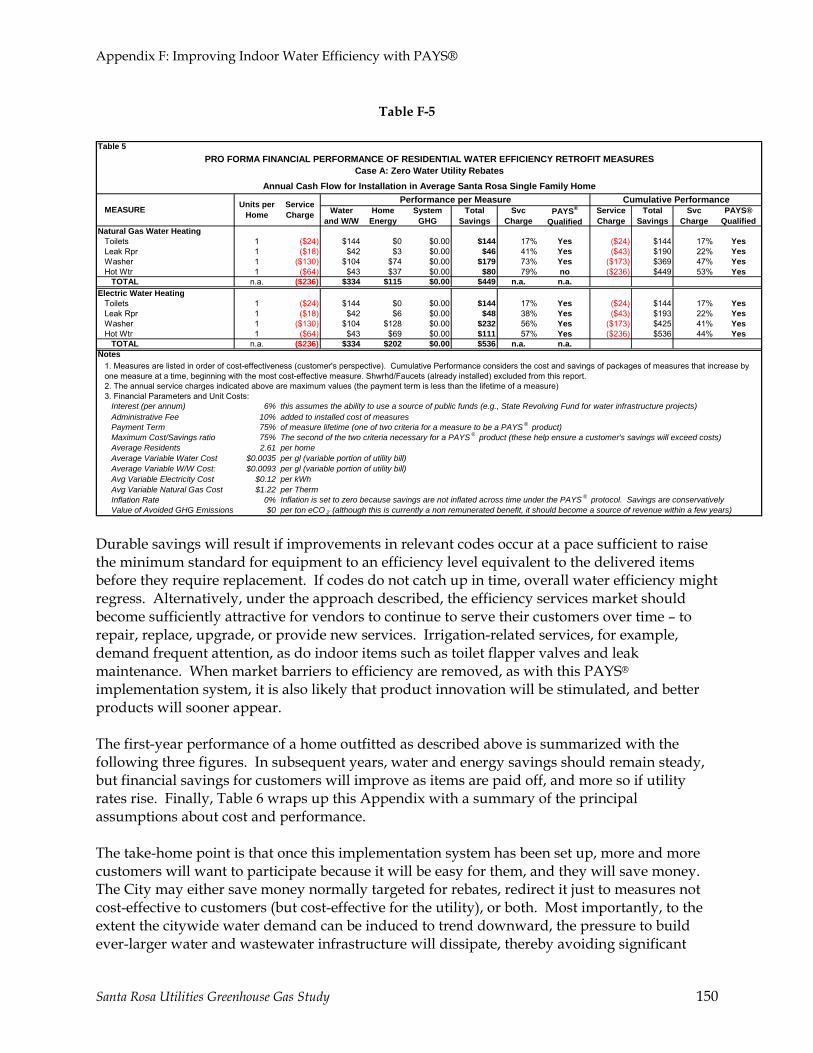
Appendix F: Improving Indoor Water Efficiency with PAYS®
Santa Rosa Utilities Greenhouse Gas Study 150
Table F-5
Durable savings will result if improvements in relevant codes occur at a pace sufficient to raise the minimum standard for equipment to an efficiency level equivalent to the delivered items before they require replacement. If codes do not catch up in time, overall water efficiency might regress. Alternatively, under the approach described, the efficiency services market should become sufficiently attractive for vendors to continue to serve their customers over time – to repair, replace, upgrade, or provide new services. Irrigation-related services, for example, demand frequent attention, as do indoor items such as toilet flapper valves and leak maintenance. When market barriers to efficiency are removed, as with this PAYS® implementation system, it is also likely that product innovation will be stimulated, and better products will sooner appear. The first-year performance of a home outfitted as described above is summarized with the following three figures. In subsequent years, water and energy savings should remain steady, but financial savings for customers will improve as items are paid off, and more so if utility rates rise. Finally, Table 6 wraps up this Appendix with a summary of the principal assumptions about cost and performance. The take-home point is that once this implementation system has been set up, more and more customers will want to participate because it will be easy for them, and they will save money. The City may either save money normally targeted for rebates, redirect it just to measures not cost-effective to customers (but cost-effective for the utility), or both. Most importantly, to the extent the citywide water demand can be induced to trend downward, the pressure to build ever-larger water and wastewater infrastructure will dissipate, thereby avoiding significant
Natural Gas Water HeatingToilets 1 ($24) $144 $0 $0.00 $144 17% Yes ($24) $144 17% YesLeak Rpr 1 ($18) $42 $3 $0.00 $46 41% Yes ($43) $190 22% YesWasher 1 ($130) $104 $74 $0.00 $179 73% Yes ($173) $369 47% YesHot Wtr 1 ($64) $43 $37 $0.00 $80 79% no ($236) $449 53% Yes
TOTAL n.a. ($236) $334 $115 $0.00 $449 n.a. n.a.Electric Water Heating
Toilets 1 ($24) $144 $0 $0.00 $144 17% Yes ($24) $144 17% YesLeak Rpr 1 ($18) $42 $6 $0.00 $48 38% Yes ($43) $193 22% YesWasher 1 ($130) $104 $128 $0.00 $232 56% Yes ($173) $425 41% YesHot Wtr 1 ($64) $43 $69 $0.00 $111 57% Yes ($236) $536 44% Yes
TOTAL n.a. ($236) $334 $202 $0.00 $536 n.a. n.a.Notes
Interest (per annum) 6%Administrative Fee 10%Payment Term 75%Maximum Cost/Savings ratio 75%Average Residents 2.61Average Variable Water Cost $0.0035Average Variable W/W Cost: $0.0093Avg Variable Electricity Cost $0.12Avg Variable Natural Gas Cost $1.22Inflation Rate 0%Value of Avoided GHG Emissions $0
per homeThe second of the two criteria necessary for a PAYS ® product (these help ensure a customer's savings will exceed costs)of measure lifetime (one of two criteria for a measure to be a PAYS ® product)
Inflation is set to zero because savings are not inflated across time under the PAYS ® protocol. Savings are conservatively per ton eCO 2 (although this is currently a non remunerated benefit, it should become a source of revenue within a few years)
per gl (variable portion of utility bill)per gl (variable portion of utility bill)per kWhper Therm
added to installed cost of measures
2. The annual service charges indicated above are maximum values (the payment term is less than the lifetime of a measure) 3. Financial Parameters and Unit Costs:
this assumes the ability to use a source of public funds (e.g., State Revolving Fund for water infrastructure projects)
1. Measures are listed in order of cost-effectiveness (customer's perspective). Cumulative Performance considers the cost and savings of packages of measures that increase by one measure at a time, beginning with the most cost-effective measure. Shwrhd/Faucets (already installed) excluded from this report.
Svc Charge
PAYS®
Qualified Service Charge
Total Savings
System GHG
Total Savings
Svc Charge
PAYS® Qualified
Annual Cash Flow for Installation in Average Santa Rosa Single Family Home
MEASURE Units per Home
Service Charge
Performance per Measure Cumulative PerformanceWater
and W/W Home
Energy
PRO FORMA FINANCIAL PERFORMANCE OF RESIDENTIAL WATER EFFICIENCY RETROFIT MEASURES Case A: Zero Water Utility Rebates
Table 5

Appendix F: Improving Indoor Water Efficiency with PAYS®
Santa Rosa Utilities Greenhouse Gas Study 151
capital expenses. Revenue erosion may be balanced with connection fees, and the City can Go Low Flow with ever more vigor. Measures are displayed from left to right, with the most cost-effective first. Unit water usage is depicted with the chain of blue dots: if all four measures are installed, estimated usage can decline by approximately 40% from 66 to less than 40 gl/person-day. Likewise, total annual savings could accumulate up to 26,000 gl per single family detached residence.
This summarizes first-year costs and savings for each measure (costs drop to $0 upon reaching 75% of measure life). Even without a water utility rebate, all measures are estimated to produce positive net cash flow for the average customer. The 1 gl/flush toilet shows the best value. The hot water system, the least cost-effective, still saves money.
PRO FORMA WATER SAVINGS PERFORMANCEPotential Savings: Santa Rosa Single Family Dwelling
0
20
40
60
80
Baseli
ne
One Toil
et
+ Lea
k Rpr
+ Was
her
+ Hot
Wtr
Gal
lons
per
per
son-
day
0
10,000
20,000
30,000
40,000
Gl/S
FD-y
r
gl/house-yrgl/person-day
PRO FORMA FINANCIAL PERFORMANCE Santa Rosa Indoor Water Saving Measures
$0
$40
$80
$120
$160
$200
Toilets Leak Rpr Washer Hot Wtr
$/H
ouse
-yr
CostSavings

Appendix F: Improving Indoor Water Efficiency with PAYS®
Santa Rosa Utilities Greenhouse Gas Study 152
Annual savings of net cash, water, and greenhouse gas emissions are depicted for the average Santa Rosa detached home according to the package of measures installed: one toilet, that plus leak repair, then a new premium washing machine, and finally an on demand hot water system to complete this pro forma package of measures. Estimated annual savings performance for this package of measures: • 26,000 gl water • $212 (net to customer) • 1,150 lb eCO2
PRO FORMA RESIDENTIAL PERFORMANCEAnnual Savings for Cumulative Package
0
100
200
300
Baseli
ne
One Toil
et
+ Leak
Rpr
+ Was
her
+ Hot
Wtr
Mon
ey &
Wat
er
0
500
1,000
1,500
GH
G E
mis
sion
s A
void
edNet Cash ($/yr)
Water (100 gl/yr)
Climate (lb eCO2/yr)

Appendix F: Improving Indoor Water Efficiency with PAYS®
Santa Rosa Utilities Greenhouse Gas Study 153
Table F-6
Utility: City of Santa Rosa
Water Use Sector: Existing Residential (Single Family Detached)
Baseline ConditionsAverage Occupancy: 2.61 persons/SFD residence
Indoor 65.5 gallons/person-dayOutdoor 45.1 gallons/person-day
Total 111 gallons/person-day
Proposed Efficiency Services
Water OtherEnergy Water (gl) (Therms) (kWh) (kWh)
Showerhead/faucetsExisting 5 6,806 32 610 0
Proposed 5 $0 $0 $0 $0 6,806 32 610 0High Efficiency Toilets
Existing 25 6,695 0 0 0Proposed 25 $266 $0 $0 $0 2,387 0 0 0
Leak Repair (>toilets)Existing n.a. 1,801 1 29 0
Proposed 5 $61 $0 $0 $0 540 0 9 0Clothes Washer
Existing 5,134 31 595 42Proposed 14 $992 $0 $75 $0 2,017 11 206 8
Hot Water RecircExisting n.a. 4,087 32 610 0
Proposed 15 $493 $2 $0 $0 2,810 20 381 2
Water Heating Energy
Energy Source
Nat Gas -0.0019Electricity -0.00132
55 for cold supply50 for recirculated water
Average Rated Storage Volume: 40 gl( gas-fired) 52 gl (electric)
Financial Parameters Adminstrative Adder: 10%
End User's Average Resource Price (variable component) Interest Rate for Capital: 6%Water $0.0035 per gl Inflation Rates Assumed:Wastewater Equipment Cost: 0%
Residential $0.0093 per gl Labor Rate: 0%Commercial n.a per gl Water Price: 0%
Wastewater Price: 0%Natural Gas $1.22 per Therm (Avg 2007 Baseline Rate) Natural Gas Price: 0%Electricity $0.116 per kWh (avg Baseline Jan '08) Electricity Price: 0%
Greenhouse Gas Emission CoefficientsNatural Gas 11.67 lb eCO2/Therm (EPA)Electricity 0.489 lb eCO2/kWh (PG&E 2005 CCAR)Water Supply 0.74 lb eCO2/1,000 gl (via electrical use in the delivery system)Wastewater Mgmnt 3.08 lb eCO2/1,000 gl (via electrical use in sewer, treatment, and reclamation activities)
Source: SR 2005 UWMP (Appendix B)
SUMMARY OF INPUTS FOR PRO FORMA MODEL
Average Usage:
End Use Lifetime (years)
Cost Annual Usage (per person)Total
InstalledAnnual Maint.
Rebates
Table 6
Heat Transfer Efficiency (1994 Federal Energy Efficiency Std ):
0.670.97
Heating Energy
Heat Transfer out of Tank (per gl of Rated Storage Volume)
Notes1. Usage of the various end uses is estimated on the basis of measurements by four US studies conducted by Aquacraft, and one estimate made by Ned Orrett based upon work by the CEC (for the on-demand hot water recirculation system).2. High Efficiency Toilets - The cost is for the Mancessa Cylone 1.0 gpf HET used in Redwood City's direct installation program (bulk price for 10,000 each), plus, as is the case for all other measures listed here, a project administration fee. Post retrofit water use with this 1.0 gpf toilet is assumed to be 30% less than that reported by Aquacraft for the Caroma Dual Fush and Niagara Flapperless 1.6 gpf toilets. Savings include leaks attributable to replacing old toilets.
3. Clothes Washer: This assumes the LG Electronics WM2075CW model (retail price). This has the 5th best water use factor among 233 EnergyStar-rated clothes washers, excellent performance, and an attractive price. The hot water savings indicated above are probably underestimated.
Water Temperature Rise (Avg Δ°F in Wtr Htr):
4. Hot Water Recirc: This assumes ability to retrofit a Metlund D'Mand on-demand hot water recirculation system. The installed cost and usage estimates for this water saving strategy are less reliable than those for the other measures.
Parameter Heat Transfer from Heat Source

Santa Rosa Utilities Greenhouse Gas Study 154
APPENDIX G: Emerging End Use Efficiency Products And Strategies1 The range of technologies currently in play for end users, even if fully deployed, are not likely to reduce water demand and associated GHG emissions sufficiently to satisfy overarching environmental requirements. The latter, as reflected by metrics such as the Ecological Footprint, makes clear the need for significant reductions of environmental pressures throughout the US economy, including that in Sonoma County.2 This Appendix surveys emerging technologies that signal an ever-greater ability to reduce environmental impacts.
Toilets
Water-Using Fixtures Unit water consumption of toilets used in the American market has been falling steadily. Once commonly using more than 5 gallons per flush (gpf), the standard fell to 3.5 gpf in the 1980s, then 1.6 gpf with the “Ultra Low Flow” toilets introduced in the 1990s. Currently, “High Efficiency Toilets” (HETs), such as the Caroma Caravelle Dual Flush (averaging <1.3 gpf), or the Mancesa Cyclone 1.0 gpf pressure assisted toilet modeled for the retrofit described by Appendix E of this report, are readily available. Although rarely used in the residential sector, vacuum toilets that perform well at 0.25 gpf are commonly used for marine applications, such as aboard luxury cruise ships. As for the commercial and institutional sector, 0.5 gpf urinals are available (usage is now regulated to a maximum of 1.0 gpf).
Dry Fixtures At least three manufacturers of high quality non water-using urinals are active in the U.S., and their products are in wide use. Composting toilets have long been available in the US, but are rarely employed except for special circumstances (e.g., remote locations in National Parks). 3 However, considerable attention is being given via the “Eco San” movement to special urine-diverting/composting toilets as a key technology that is fundamental to upgrading public health in developing economies. Although not a fit with cultural norms in Sonoma County today, the Eco San strategy, and its special toilet, is noteworthy as a “leapfrog” approach that avoids the need to construct, operate, and maintain expensive centralized wastewater systems, and to some extent agricultural chemical infrastructure, via the ability to sanitize and directly recycle organic material and nutrients in human “waste” for use in local food production.
1 Prepared by E. B. Orrett, PE (President, Resource Performance Partners, Inc.) 2 http://www.footprintnetwork.org/ “Our Mission: To support a sustainable economy by advancing the Ecological Footprint, a measurement and management tool that makes the reality of planetary limits relevant to decision-makers throughout the world.” 3 Among industrialized economies, these are receiving attention drought-stricken NE Australia
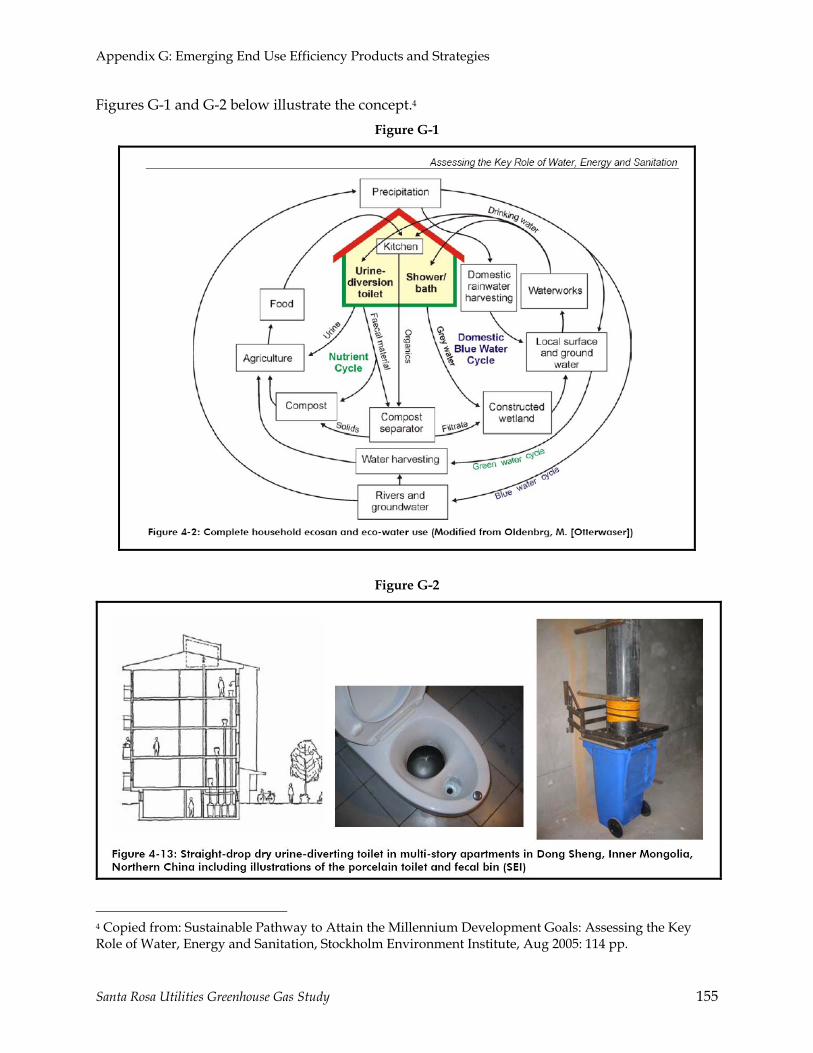
Appendix G: Emerging End Use Efficiency Products and Strategies
Santa Rosa Utilities Greenhouse Gas Study 155
Figures G-1 and G-2 below illustrate the concept.4 Figure G-1
Figure G-2
4 Copied from: Sustainable Pathway to Attain the Millennium Development Goals: Assessing the Key Role of Water, Energy and Sanitation, Stockholm Environment Institute, Aug 2005: 114 pp.
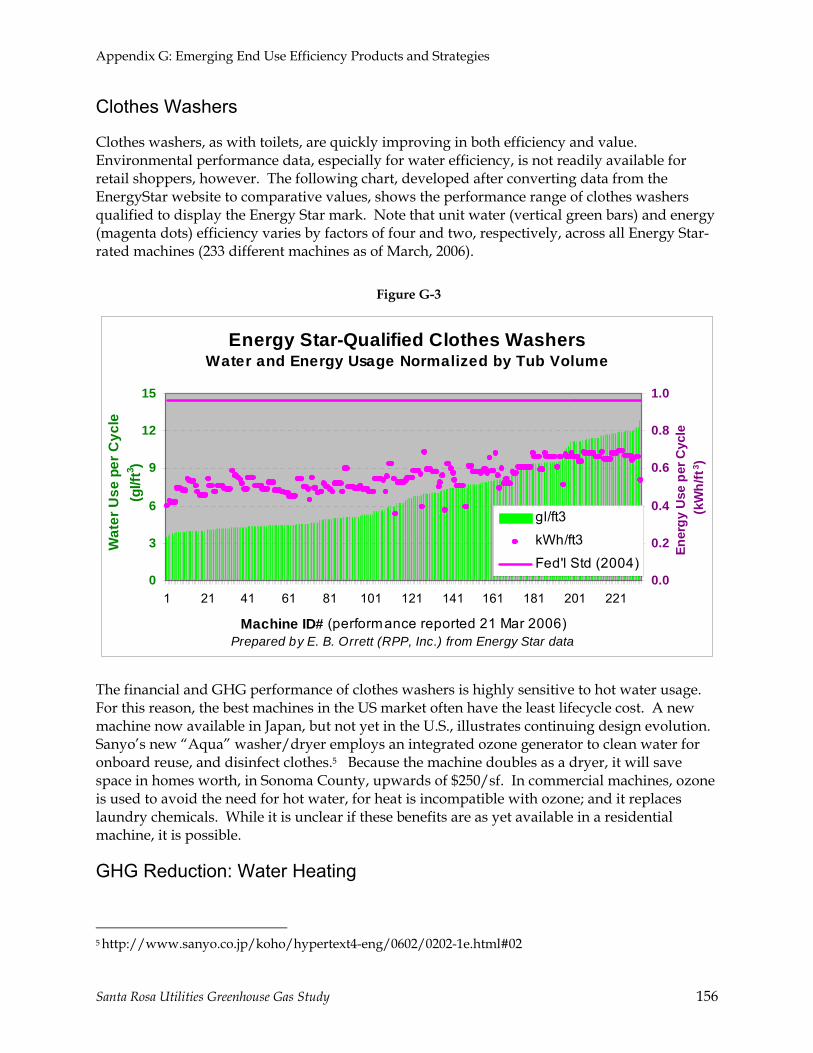
Appendix G: Emerging End Use Efficiency Products and Strategies
Santa Rosa Utilities Greenhouse Gas Study 156
Clothes Washers
Clothes washers, as with toilets, are quickly improving in both efficiency and value. Environmental performance data, especially for water efficiency, is not readily available for retail shoppers, however. The following chart, developed after converting data from the EnergyStar website to comparative values, shows the performance range of clothes washers qualified to display the Energy Star mark. Note that unit water (vertical green bars) and energy (magenta dots) efficiency varies by factors of four and two, respectively, across all Energy Star-rated machines (233 different machines as of March, 2006).
Figure G-3
Energy Star-Qualified Clothes WashersWater and Energy Usage Normalized by Tub Volume
0
3
6
9
12
15
1 21 41 61 81 101 121 141 161 181 201 221
Machine ID# (performance reported 21 Mar 2006) Prepared by E. B. Orrett (RPP, Inc.) from Energy Star data
Wat
er U
se p
er C
ycle
(gl/f
t3 )
0.0
0.2
0.4
0.6
0.8
1.0
Ener
gy U
se p
er C
ycle
(k
Wh/
ft3 )
gl/ft3
kWh/ft3
Fed'l Std (2004)
The financial and GHG performance of clothes washers is highly sensitive to hot water usage. For this reason, the best machines in the US market often have the least lifecycle cost. A new machine now available in Japan, but not yet in the U.S., illustrates continuing design evolution. Sanyo’s new “Aqua” washer/dryer employs an integrated ozone generator to clean water for onboard reuse, and disinfect clothes.5 Because the machine doubles as a dryer, it will save space in homes worth, in Sonoma County, upwards of $250/sf. In commercial machines, ozone is used to avoid the need for hot water, for heat is incompatible with ozone; and it replaces laundry chemicals. While it is unclear if these benefits are as yet available in a residential machine, it is possible.
GHG Reduction: Water Heating
5 http://www.sanyo.co.jp/koho/hypertext4-eng/0602/0202-1e.html#02
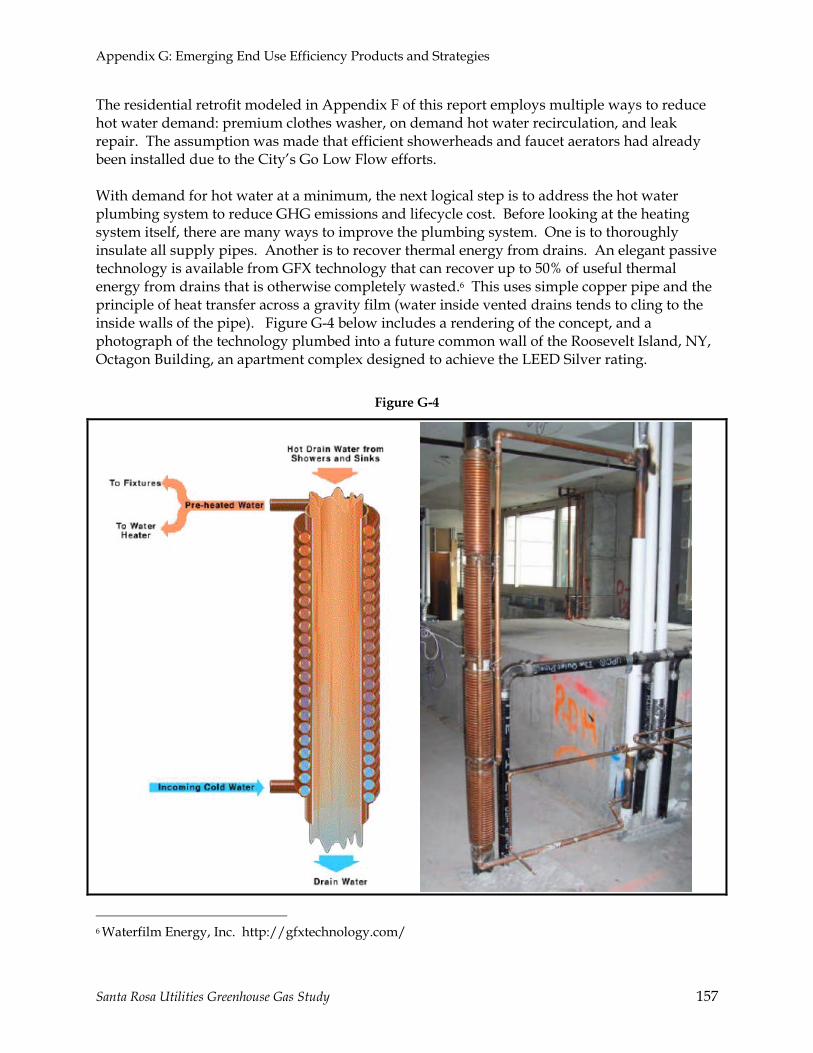
Appendix G: Emerging End Use Efficiency Products and Strategies
Santa Rosa Utilities Greenhouse Gas Study 157
The residential retrofit modeled in Appendix F of this report employs multiple ways to reduce hot water demand: premium clothes washer, on demand hot water recirculation, and leak repair. The assumption was made that efficient showerheads and faucet aerators had already been installed due to the City’s Go Low Flow efforts. With demand for hot water at a minimum, the next logical step is to address the hot water plumbing system to reduce GHG emissions and lifecycle cost. Before looking at the heating system itself, there are many ways to improve the plumbing system. One is to thoroughly insulate all supply pipes. Another is to recover thermal energy from drains. An elegant passive technology is available from GFX technology that can recover up to 50% of useful thermal energy from drains that is otherwise completely wasted.6 This uses simple copper pipe and the principle of heat transfer across a gravity film (water inside vented drains tends to cling to the inside walls of the pipe). Figure G-4 below includes a rendering of the concept, and a photograph of the technology plumbed into a future common wall of the Roosevelt Island, NY, Octagon Building, an apartment complex designed to achieve the LEED Silver rating.
Figure G-4
6 Waterfilm Energy, Inc. http://gfxtechnology.com/

Appendix G: Emerging End Use Efficiency Products and Strategies
Santa Rosa Utilities Greenhouse Gas Study 158
Another way, also for new construction, is to design the layout of the hot water system to maximize efficiency by attending to layout, pipe diameter, and low-friction fittings.7 Commonly referred to as “Structured Plumbing,” this is depicted below. This system includes the on-demand hot water circulation pump that is included in the pro forma package of residential retrofit measures presented in Appendix F of this report.
Having taken all practical steps toward minimizing the capacity, and therefore lifecycle cost, of the water heating system, the upgrade of the water heater and any storage may be addressed. Choices include a higher efficiency tank-type water heater, an instantaneous (tankless) water heater, or solar water heater with a backup system for wintry days. Solar water heating is curiously a sleeper these days. While solar photovoltaic systems are becoming popular, the more cost-effective solar water heating systems languish on the sidelines. Interestingly, after hot water demand has been minimized, solar water heating, the most climate-friendly of water heating options, can become especially attractive. This is because the scale of back up water heating declines, and might even be met without a traditional heater. For example, sufficient heat may be scavenged from that rejected from other equipment in a home, such as a refrigerator (the California Energy Commission has conducted research on this topic, but with the difficult objective of offsetting the normal full-scale water heating load). This attention to water heating is worthwhile in the context of this study because home water heating is by far the largest contributor to GHG emissions from Santa Rosa’s municipal water cycle at nearly 80% of the total.
7 Slide 23 in presentation dated Dec, 2007 by Gary Klein of Affiliated International Management and GreenPlumbers USA entitled The Water-Energy-Greenhouse Gas Connection

Appendix G: Emerging End Use Efficiency Products and Strategies
Santa Rosa Utilities Greenhouse Gas Study 159
Onsite Reuse
Once water demands have been minimized by use of high performance fixtures and appliances, the next step to save water is usually to find ways to reuse it onsite. Unlike water recycling at the municipal level, which requires miles of transport and uniformly high levels of treatment, onsite reuse requires treatment only to the quality necessary for each application, and transport distance measured in feet. Onsite reuse also provides users the ability to control the quality of reused water with regard to content of chemicals that may be of concern to them, such as pharmaceuticals and pthalates. An excellent review (September, 2007) of commercially available graywater systems is available on the California Urban Water Conservation Council’s website.8 Here, John Koeller summarizes products offered by six firms from around the world. The technology ranges from simple to sophisticated (see below). se range in complexity from simple (e.g., the ) to sophisticated (e.g., AquaCycle® by PONTOS®, an automated aerobic treatment plant). Koeller counsels, however, that current graywater regulations in California generally disallow the use of recovered water indoors: it is for outdoor use only. Until this restriction is lifted, the value offered by such technologies cannot be fully realized.
Simple The Aqus™ Water Reuse System captures water from a lavatory drain to operate an adjacent toilet via a simple filter, disinfectant system, and pump.9 8 http://www.cuwcc.org/Uploads/product/Water_Logue_Volume_5_No_2.pdf 9 www.WaterSaverTech.com
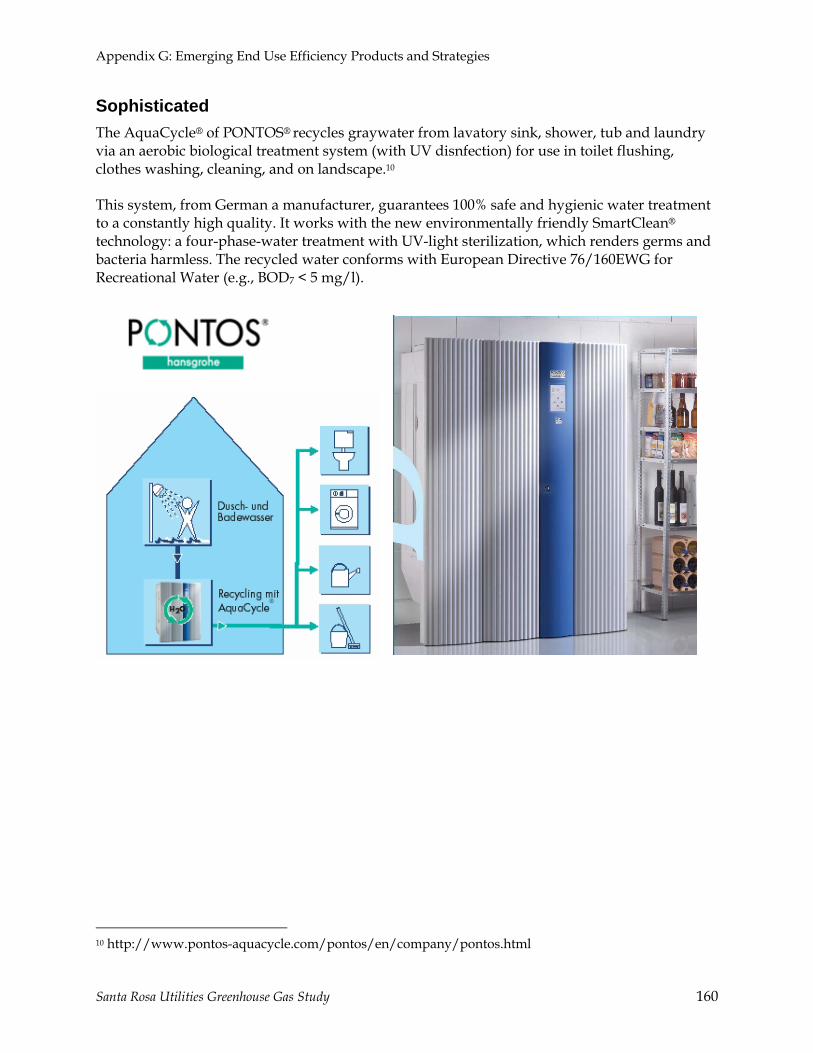
Appendix G: Emerging End Use Efficiency Products and Strategies
Santa Rosa Utilities Greenhouse Gas Study 160
Sophisticated The AquaCycle® of PONTOS® recycles graywater from lavatory sink, shower, tub and laundry via an aerobic biological treatment system (with UV disnfection) for use in toilet flushing, clothes washing, cleaning, and on landscape.10 This system, from German a manufacturer, guarantees 100% safe and hygienic water treatment to a constantly high quality. It works with the new environmentally friendly SmartClean® technology: a four-phase-water treatment with UV-light sterilization, which renders germs and bacteria harmless. The recycled water conforms with European Directive 76/160EWG for Recreational Water (e.g., BOD7 < 5 mg/l).
10 http://www.pontos-aquacycle.com/pontos/en/company/pontos.html

Appendix G: Emerging End Use Efficiency Products and Strategies
Santa Rosa Utilities Greenhouse Gas Study 161

Appendix G: Emerging End Use Efficiency Products and Strategies
Santa Rosa Utilities Greenhouse Gas Study 162
Toronto Healthy House This is perhaps the best example of residential water efficiency in North America: A four-story home on a small urban lot (22.5’ x 80’) devoid of water or wastewater utility services, inhabited continuously for more than ten years (currently with a family of four), with net water use averaging only 8 gl/person-day. The home features high efficiency fixtures and appliances, rainwater harvesting with filtration and disinfection, tertiary treatment and disinfection of all wastewater for multiple indoor reuse for all except potable uses, and finally, discharge for onsite irrigation/percolation in an area smaller than 110 ft2. The history of this project may coincide with the City of Toronto’s leadership as the first governmental entity in the world to adopt a greenhouse gas reduction target. This, occurring in 1989, helped inspire the first formal municipal program for climate protection, the Urban CO2 Reduction Project, launched in 1991 by the International Council for Local Environmental Initiatives (ICLEI). Today, the City of Santa Rosa is a member of ICLEI’s successor program, the International Cities for Climate Protection Campaign. The Toronto Healthy House project came about as a result of a nation-wide competition initiated by Canada Mortgage and Housing Corporation, the Healthy Housing Design Competition. The goal of the competition was, in broad terms, to design healthy and environmentally sensitive dwellings suitable for the next century. With respect to wastewater, the guidelines emphasized reducing or eliminating water consumption and therefore waste water production, minimizing the use of chlorine or other additives, and using passive and low energy methods wherever possible. The schematic for its design, which was driven to emphasize indoor reuse by the extremely small volume of wastewater that could be percolated onsite, is provided on the following page.11 Design team member and subsequent home occupant Rolf Paloheimo reports the system continues to perform essentially as designed. He also offered that rainwater “Tastes great!” and that his family would prefer to shower with potable water.12 Ongoing R&D by project developer Creative Communities Research, Inc., has focused on simplifying the onsite wastewater treatment system so that it will operate passively as a below-ground unit outside the home, require maintenance at five year intervals or less, and become the first system offering advanced treatment that is cost-competitive with septic tanks. A separate disinfection system, featuring a corona discharge ozone system (less energy and maintenance than UV disinfection), will be available for those desiring to reuse water. The treatment system, in 2007, features the following elements:
• A perforated drum, rotated passively, within which solids will be separated from raw wastewater for aerobic decomposition with assistance of worms. A pilot version, serving a family of four (including kitchen waste) for two years, has accumulated only 1 ft3 of solids;
11 Source: http://mha-net.org/msb/html/papers-n/palo01/wastewa.htm 12 Telephone communication, Ned Orrett with Rolf Paloheimo, March 21, 2007
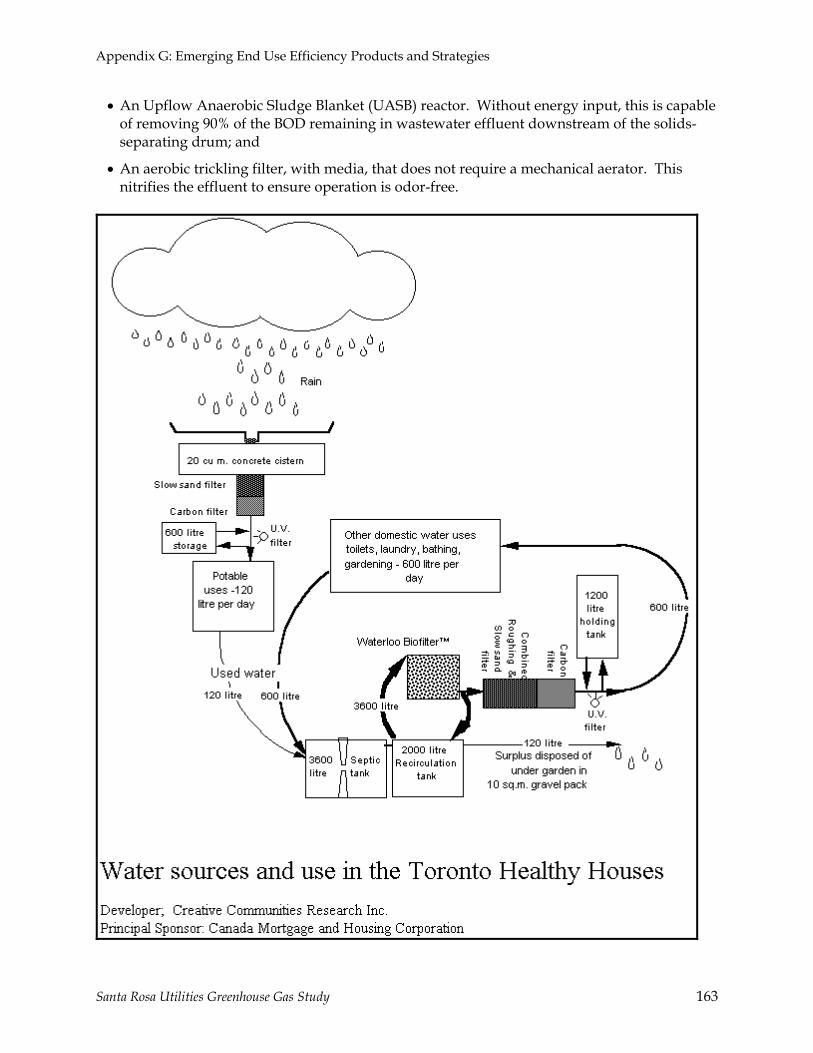
Appendix G: Emerging End Use Efficiency Products and Strategies
Santa Rosa Utilities Greenhouse Gas Study 163
• An Upflow Anaerobic Sludge Blanket (UASB) reactor. Without energy input, this is capable of removing 90% of the BOD remaining in wastewater effluent downstream of the solids-separating drum; and
• An aerobic trickling filter, with media, that does not require a mechanical aerator. This nitrifies the effluent to ensure operation is odor-free.

Appendix G: Emerging End Use Efficiency Products and Strategies
Santa Rosa Utilities Greenhouse Gas Study 164
Rainwater Harvesting
The City of Santa Rosa provides its customers with water harvested from rainfall, albeit from extensive areas of the Eel and Russian River watersheds. To the extent rainfall may be harvested at the location it is used, there will be a concomitant decline in the need for remote storage and delivery infrastructure and the related watershed impacts. Stormwater runoff will also decline at the point of use, as will the related costs for storm drain infrastructure if its design is integrated with that of rainwater harvesting within the immediate drainage area. Utility-related energy use will decline, probably by more than it will increase on site to provide for disinfection and pressurization. A rainwater harvesting system will typically include a rooftop collection system (with leaf screens and first flush diverter), storage tank; filtration, disinfection, and pressurization systems; and related plumbing. Its drought performance is related to the demand served and size of components. The Toronto Healthy Home, outlined above, illustrates how the combination of high efficiency fixtures and a high level of indoor (and outdoor) reuse enables the scale of rainwater harvesting infrastructure – as in the rooftop area and storage – to be reduced ten-fold. This level of design integration enables a dependable volume of water for indoor uses to be collected from roofs of small homes, even during droughts.
Commercial Buildings Resource efficient strategies are emerging for not only for the residential applications described above, but for all sectors. Commercial buildings, and increasingly high-rise buildings, constitute the second most important water-using sector in Santa Rosa. Two examples of water-efficient designs follow.
The Solaire at Battery Park City, NY13
The wastewater treatment and reuse system at the 27-story, 357,000 ft2 The Solaire is the first on-site water recycling system in America built inside a multi-family residential building.
Project Profile • Initial Service Date: 2003 • Gallons Per Day: 25,000 • Population Served: 750 • Wastewater treatment in basement of high-rent building • “The First Green Apartment Complex in the World,” as cited
by New York Governor Pataki • Side stream to treat 25,000 GPD
13 http://www.appliedwater.com/awpr1/commercial_services/applied%20_water_management/ case_studies/page3049.html
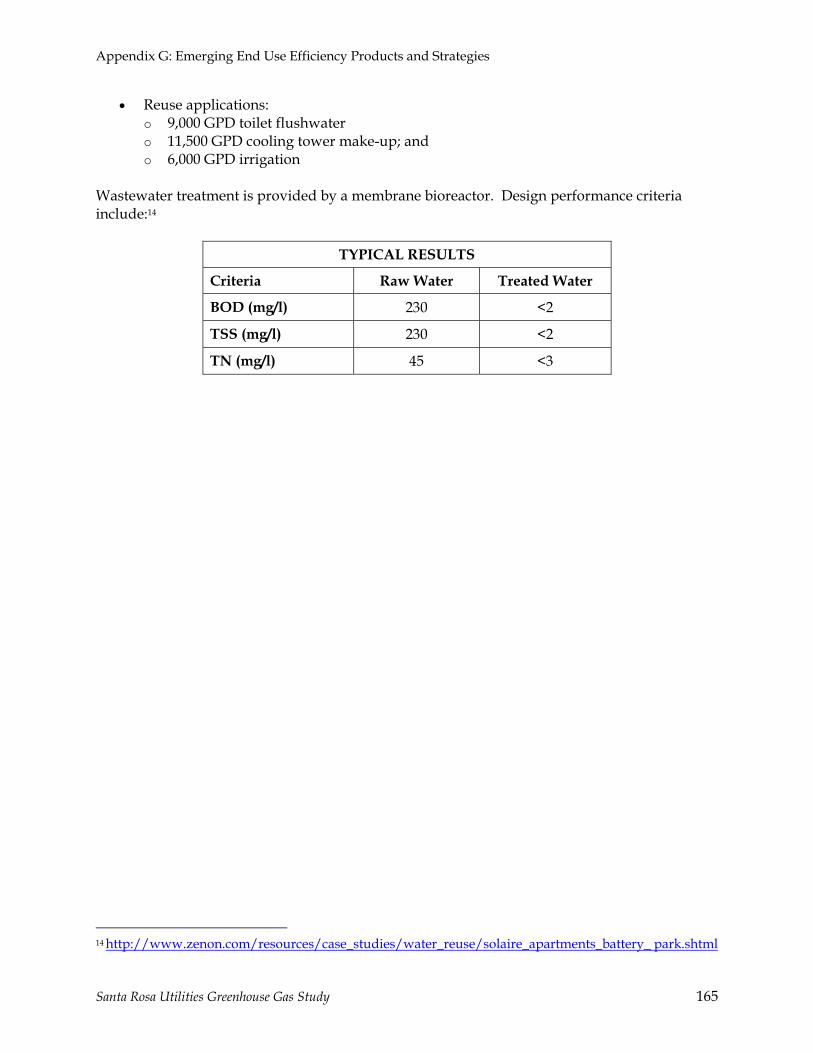
Appendix G: Emerging End Use Efficiency Products and Strategies
Santa Rosa Utilities Greenhouse Gas Study 165
• Reuse applications: o 9,000 GPD toilet flushwater o 11,500 GPD cooling tower make-up; and o 6,000 GPD irrigation
Wastewater treatment is provided by a membrane bioreactor. Design performance criteria include:14
TYPICAL RESULTS
Criteria Raw Water Treated Water
BOD (mg/l) 230 <2
TSS (mg/l) 230 <2
TN (mg/l) 45 <3
14 http://www.zenon.com/resources/case_studies/water_reuse/solaire_apartments_battery_ park.shtml

Appendix G: Emerging End Use Efficiency Products and Strategies
Santa Rosa Utilities Greenhouse Gas Study 166
New York City
Bank of America Tower at One Bryant Park15
Environmental Factsheet
Project • The Bank of America Tower at One Bryant Park
Developers • The Durst Organization, which has been at the
forefront of the environmental movement since its founding in 1915 and in 1999 completed 4 Times Square, recognized as the first “green” high-rise office building in the United States
• Bank of America, a founding financial institution sponsor of the United States Green Building Council known for its environmental stewardship, including its commitment to reduce greenhouse emissions by 7% by the year 2008
Architect • Cook+ Fox Architects, New York
Green Features • Building on The Durst Organization’s and
Cook+Fox’s commitment to environmentally responsible architecture, the Bank of America Tower will incorporate innovative, high-performance environmental technologies to promote the health and productivity of tenants, reduce waste and assure environmental sustainability
• Higher ceilings and translucent insulating glass in floor-to-ceiling windows permit maximum daylight in interior spaces, optimal views and energy efficiency
• Advanced double-wall technology provides remarkable views in and out of building, while dissipating the sun’s heat
• Pioneering filtered under-floor displacement air ventilation system and floor-by-floor air handling units allow for individual floor control and more even, efficient, and healthy heating and cooling
• Carbon dioxide monitors automatically adjust the amount of fresh air when necessary • Gray-water system captures and re-uses all rainwater and wastewater, saving millions
of gallons of water annually • Waterless urinals, low-flow fixtures, etc. decrease the use of precious resources
15 http://www.durst.org/i_bp_env.asp

Appendix G: Emerging End Use Efficiency Products and Strategies
Santa Rosa Utilities Greenhouse Gas Study 167
• Thermal storage system at cellar level, produces ice in the evening when electricity rates are lowest to reduce peak daytime demand loads on the city
• Daylight dimming and LED lights reduce electric usage • Recyclable and renewable building materials (steel, blast furnace, drywall) • Green roofs reduce urban heat island effect • State-of-the-art onsite 5.1-megawatt co-generation plant provides a clean, efficient power
source for the building’s energy requirements • 95% air filtration
Environmental Goals • World’s most environmentally responsible high-rise office building, focusing on
sustainable sites, water efficiency, indoor environmental quality, and energy and atmosphere
• First high-rise to strive for U.S. Green Building Council’s Leadership in Energy & Environmental Design “Platinum” designation
• Reduce energy consumption by a minimum of 50% • Reduce potable water consumption by 50% • Reduce storm water contribution by 95% • Utilize 50% recycled material in building construction • Obtain 50% of building material within 500 miles of site
Collaborators • The Natural Resources Defense Council (NRDC), which has guided the project in the
creation of a net zero-carbon dioxide building and the integration of a co-generation plant into the city infrastructure
• The Rocky Mountain Institute (RMI), which led a charrette on reducing power consumption in the trading and data-center environments
• The New York State Energy Resource Development Authority (NYSERDA), which helped sponsor the RMI charrette and will contribute almost $1 million for energy modeling, engineering and energy saving equipment
• New York State, which through its Green Building Tax Credit, will potentially contribute almost $7 million for the project
• United States Department of Energy (DOE), which is offering training in support of their latest energy modeling software, Energy Plus.