greenhouse gas observations from space: results from esa‘s ... · greenhouse gas observations...
TRANSCRIPT
Michael Buchwitz Institute of Environmental Physics (IUP)
ESA Earth Observation Summer School, ESRIN, 4-14 August 2014
Greenhouse gas observations from space: Results from ESA‘s GHG-CCI project
1 www.iup.uni-bremen.de
Greenhouse gas observations from space 1. Why and how ?
2. Results from ESA‘s GHG-CCI project
3. Proposed future mission CarbonSat
Overview Talks 1 - 3
2
Greenhouse gas observations from space: Results from ESA‘s GHG-CCI project
• Project overview:
• GHG-CCI: A project to deliver the Essential Climate Variable „Greenhouse Gases“ (short)
• CO2 and CH4 sources & sinks:
• What has already been learned using satellite data ? (focus)
Overview Talk 2
3
Important note for ESA
4
This is NOT the public version of this talk !
Contains unpublished material submitted to peer-reviewed journals
with „press embargo“ and related restrictions prior to publication
A public version pdf file can be made available on request
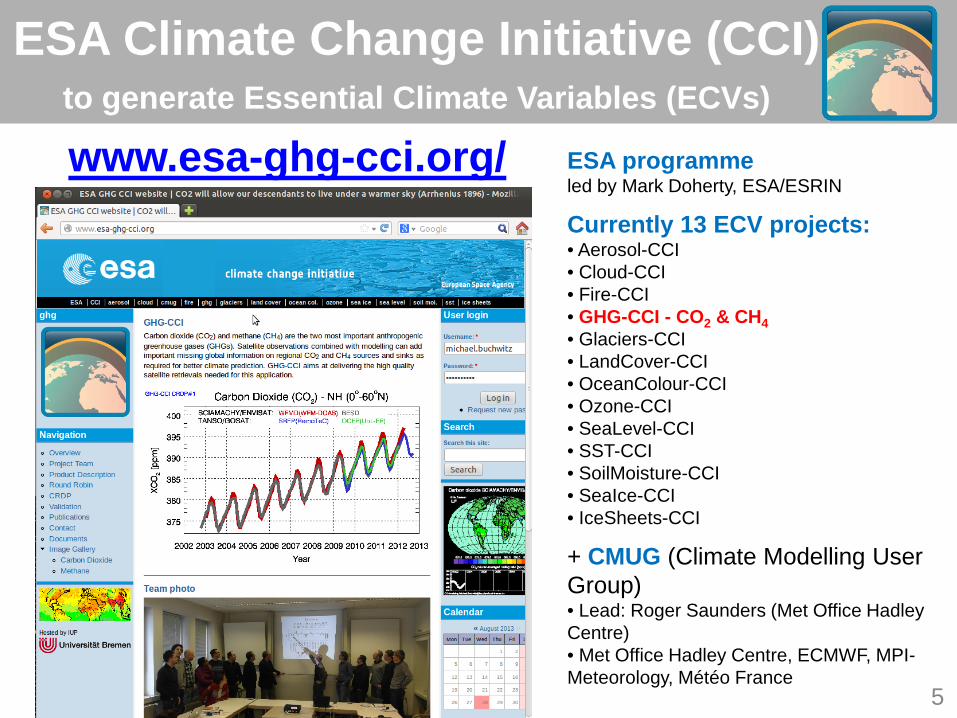
ESA Climate Change Initiative (CCI) to generate Essential Climate Variables (ECVs)
www.esa-ghg-cci.org/ ESA programme led by Mark Doherty, ESA/ESRIN
Currently 13 ECV projects: • Aerosol-CCI • Cloud-CCI • Fire-CCI • GHG-CCI - CO2 & CH4 • Glaciers-CCI • LandCover-CCI • OceanColour-CCI • Ozone-CCI • SeaLevel-CCI • SST-CCI • SoilMoisture-CCI • SeaIce-CCI • IceSheets-CCI
+ CMUG (Climate Modelling User Group) • Lead: Roger Saunders (Met Office Hadley Centre) • Met Office Hadley Centre, ECMWF, MPI-Meteorology, Météo France
5
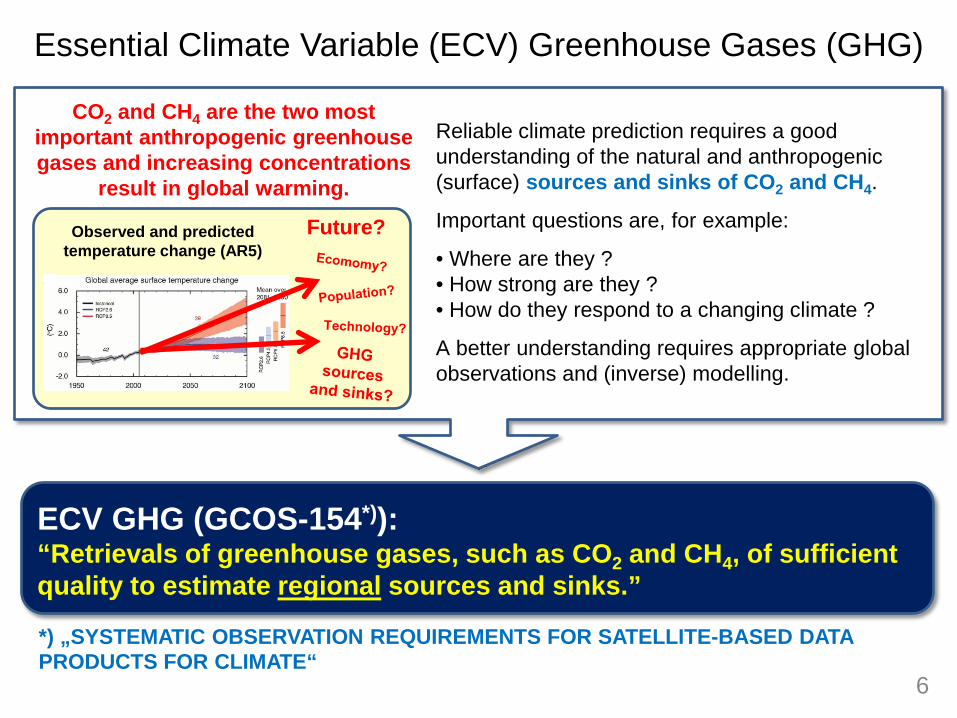
Essential Climate Variable (ECV) Greenhouse Gases (GHG)
6
ECV GHG (GCOS-154*)): “Retrievals of greenhouse gases, such as CO2 and CH4, of sufficient quality to estimate regional sources and sinks.”
*) „SYSTEMATIC OBSERVATION REQUIREMENTS FOR SATELLITE-BASED DATA PRODUCTS FOR CLIMATE“
Reliable climate prediction requires a good understanding of the natural and anthropogenic (surface) sources and sinks of CO2 and CH4.
Important questions are, for example:
• Where are they ? • How strong are they ? • How do they respond to a changing climate ?
A better understanding requires appropriate global observations and (inverse) modelling.
CO2 and CH4 are the two most important anthropogenic greenhouse gases and increasing concentrations
result in global warming.
Observed and predicted temperature change (AR5)
Future?
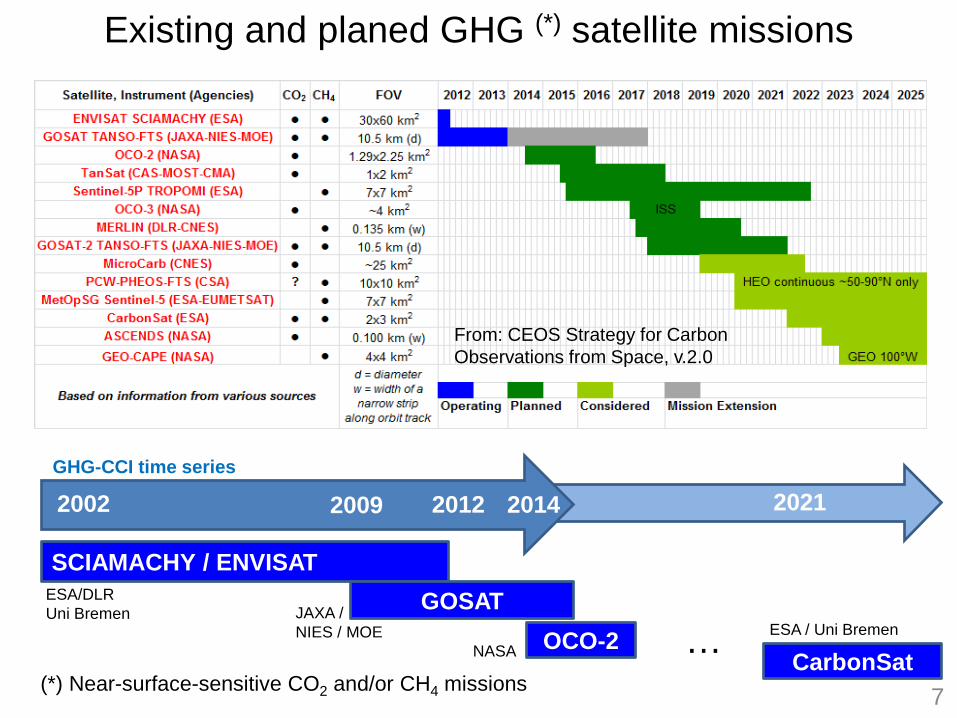
Existing and planed GHG (*) satellite missions
From: CEOS Strategy for Carbon Observations from Space, v.2.0
2016 GHG-CCI time series
2002 2012 2014 2021 2009
SCIAMACHY / ENVISAT ESA/DLR Uni Bremen
CarbonSat ESA / Uni Bremen
GOSAT JAXA / NIES / MOE OCO-2 NASA
(*) Near-surface-sensitive CO2 and/or CH4 missions 7
…
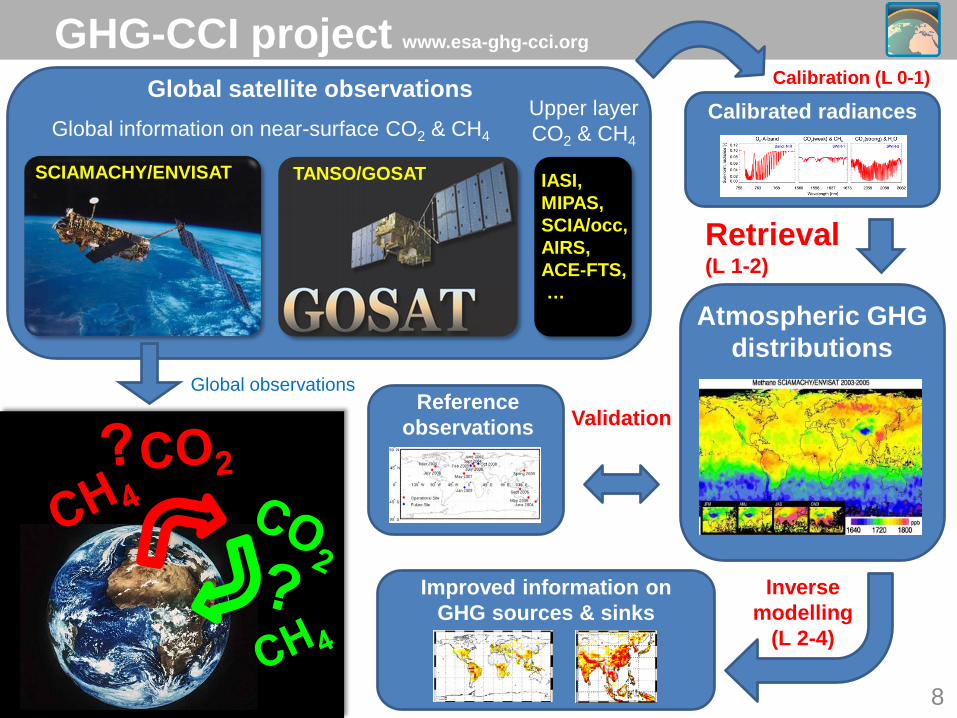
GHG-CCI project www.esa-ghg-cci.org
SCIAMACHY/ENVISAT
Global satellite observations Global information on near-surface CO2 & CH4
TANSO/GOSAT
Upper layer CO2 & CH4
IASI, MIPAS, SCIA/occ, AIRS, ACE-FTS, …
Global observations
Calibrated radiances Calibration (L 0-1)
Reference observations Validation
Inverse modelling
(L 2-4)
Improved information on GHG sources & sinks
Atmospheric GHG distributions
Retrieval (L 1-2)
8
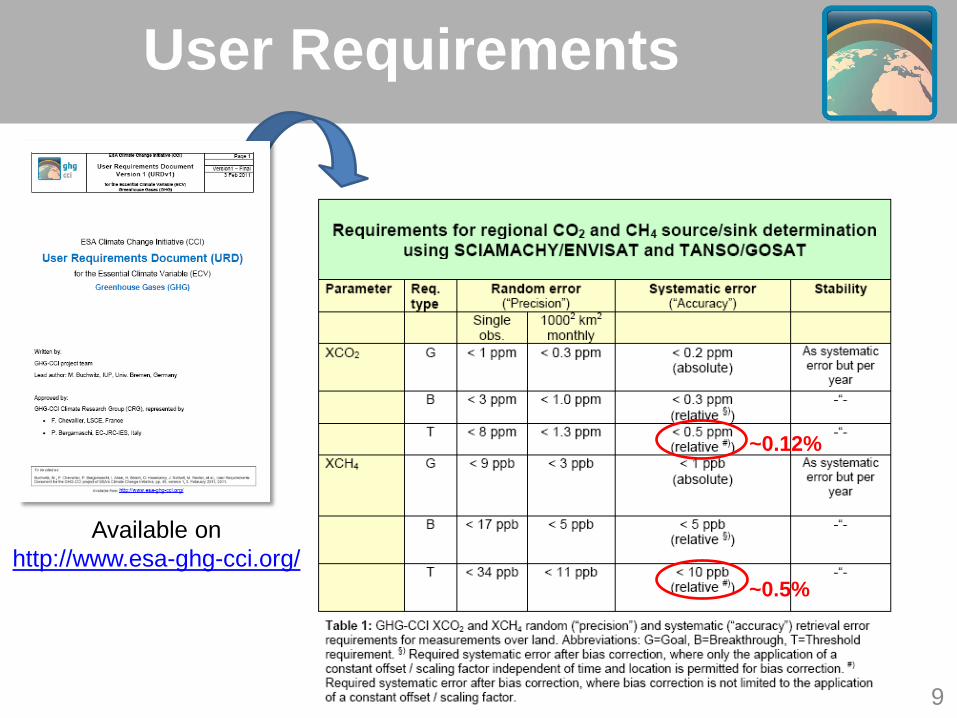
User Requirements
~0.12%
~0.5%
Available on http://www.esa-ghg-cci.org/
9
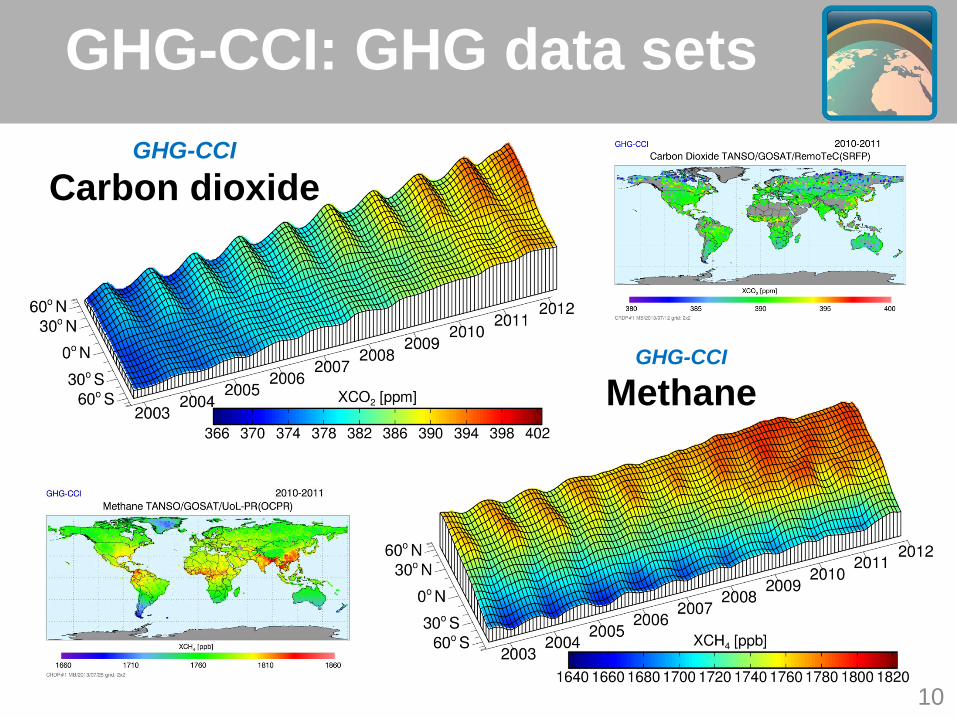
GHG-CCI Carbon dioxide
GHG-CCI Methane
10
GHG-CCI: GHG data sets
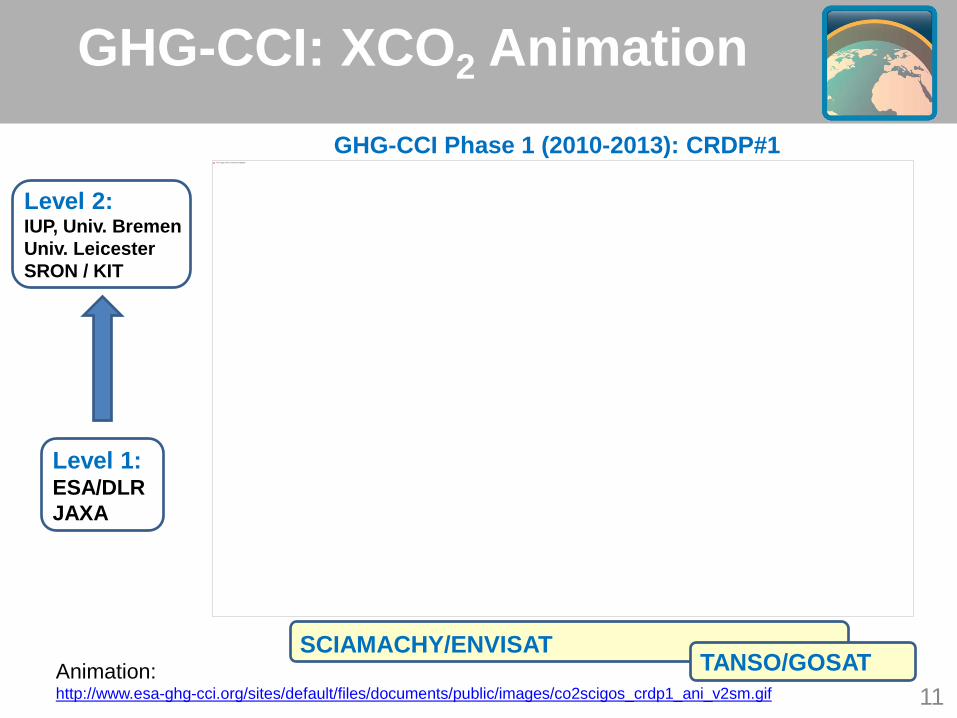
GHG-CCI: XCO2 Animation
11
SCIAMACHY/ENVISAT TANSO/GOSAT
GHG-CCI Phase 1 (2010-2013): CRDP#1
Level 1: ESA/DLR JAXA
Level 2: IUP, Univ. Bremen Univ. Leicester SRON / KIT
This image cannot currently be displayed.
Animation: http://www.esa-ghg-cci.org/sites/default/files/documents/public/images/co2scigos_crdp1_ani_v2sm.gif
http://www.bookperhead.com/images/articles/round-robin-parlays.jpg
Round Robin
Algo 1
12
GHG-CCI: Overview incl. RR
13 Link to this & more: www.esa-ghg-cci.org -> Publications
CCI Integration Meeting, ECMWF, 14-16 March 2011
URD DARD
AIECAR
ASR
PSD
PVASR
RREP
PVIR
CAR
SPD
SRD
ATBD
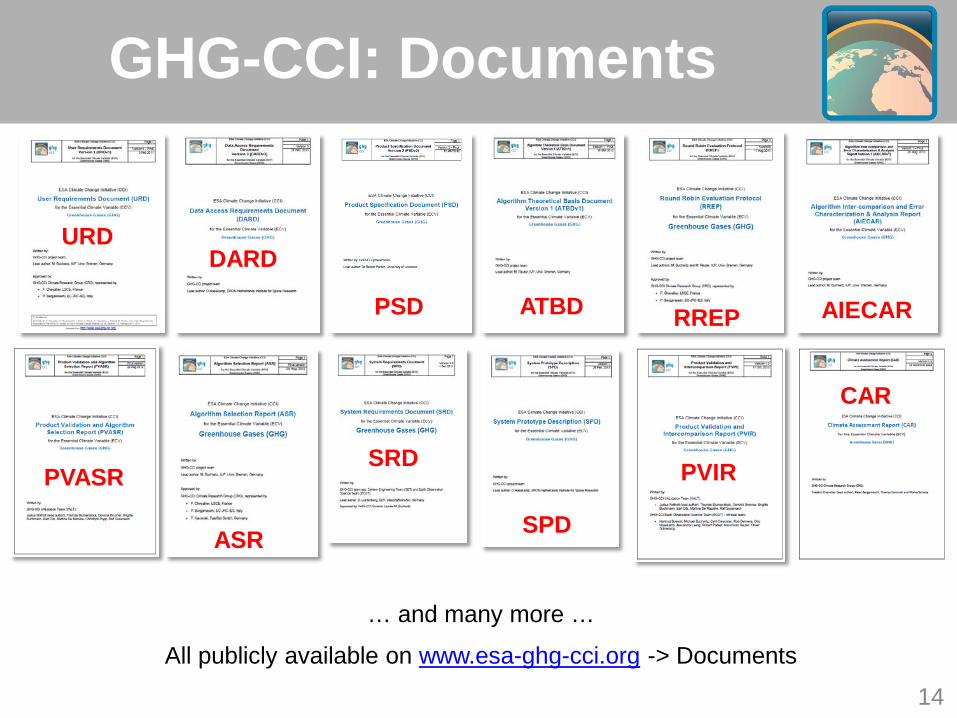
… and many more …
All publicly available on www.esa-ghg-cci.org -> Documents
14
GHG-CCI: Documents
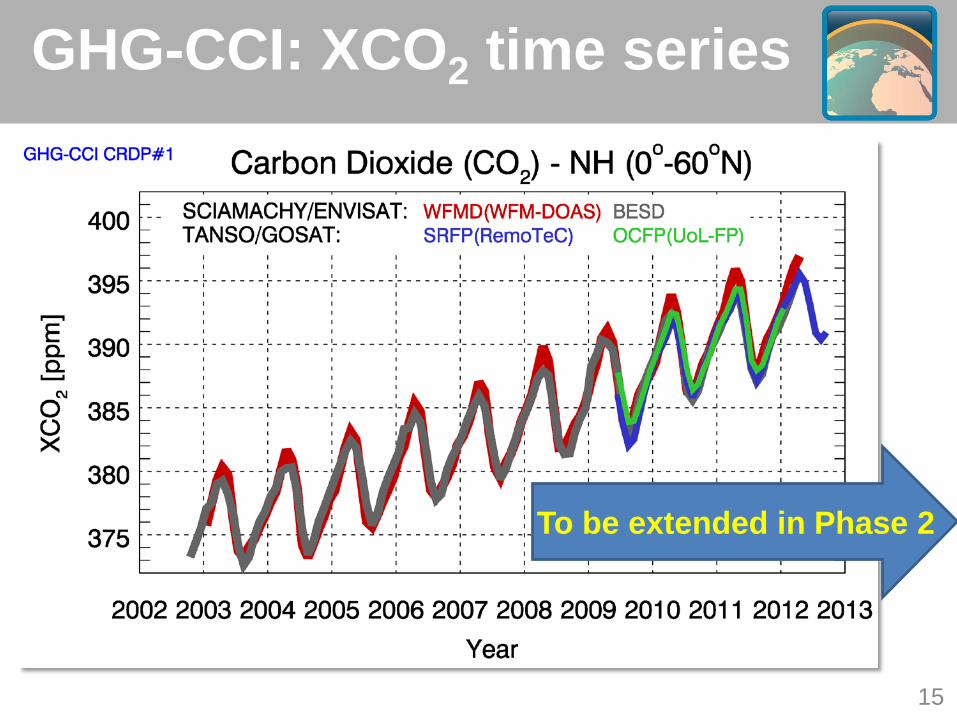
GHG-CCI: XCO2 time series
15
To be extended in Phase 2

http://www.northpacificmusic.com/ensemble.east.west.jpg
Ensemble: Key to success
16
• Multiple satellite algorithms / products
• Multiple models / inverse models
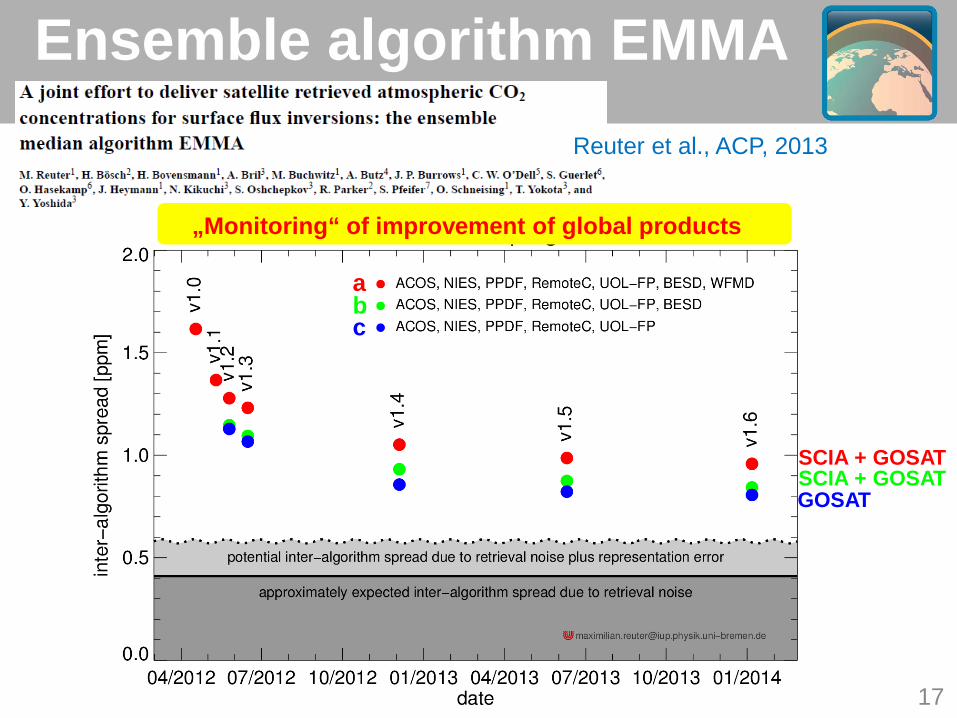
Ensemble algorithm EMMA
17
„Monitoring“ of improvement of global products
GOSAT
SCIA + GOSAT SCIA + GOSAT
Reuter et al., ACP, 2013
a b c
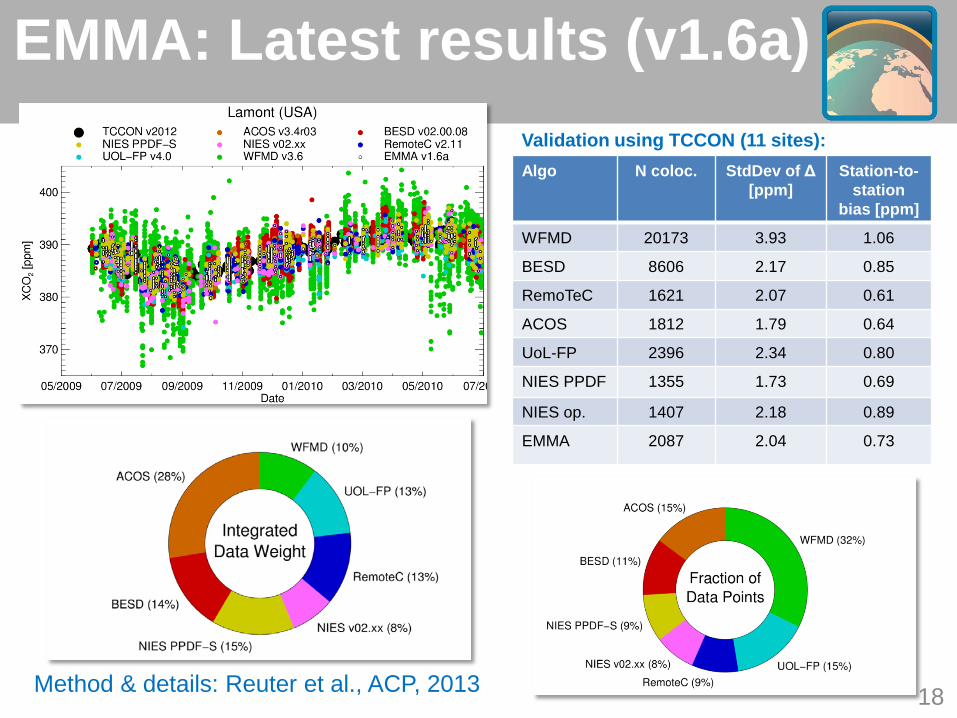
EMMA: Latest results (v1.6a)
18
Algo N coloc. StdDev of Δ [ppm]
Station-to-station
bias [ppm]
WFMD 20173 3.93 1.06
BESD 8606 2.17 0.85
RemoTeC 1621 2.07 0.61
ACOS 1812 1.79 0.64
UoL-FP 2396 2.34 0.80
NIES PPDF 1355 1.73 0.69
NIES op. 1407 2.18 0.89
EMMA 2087 2.04 0.73
Validation using TCCON (11 sites):
Method & details: Reuter et al., ACP, 2013

19
XCO2: Ensemble results: Seasonal cycle amplitude
Buchwitz et al., RSE, 2013
SCIAMACHY CO2
De-trended CO2 time series
Peak-to-peak amplitude
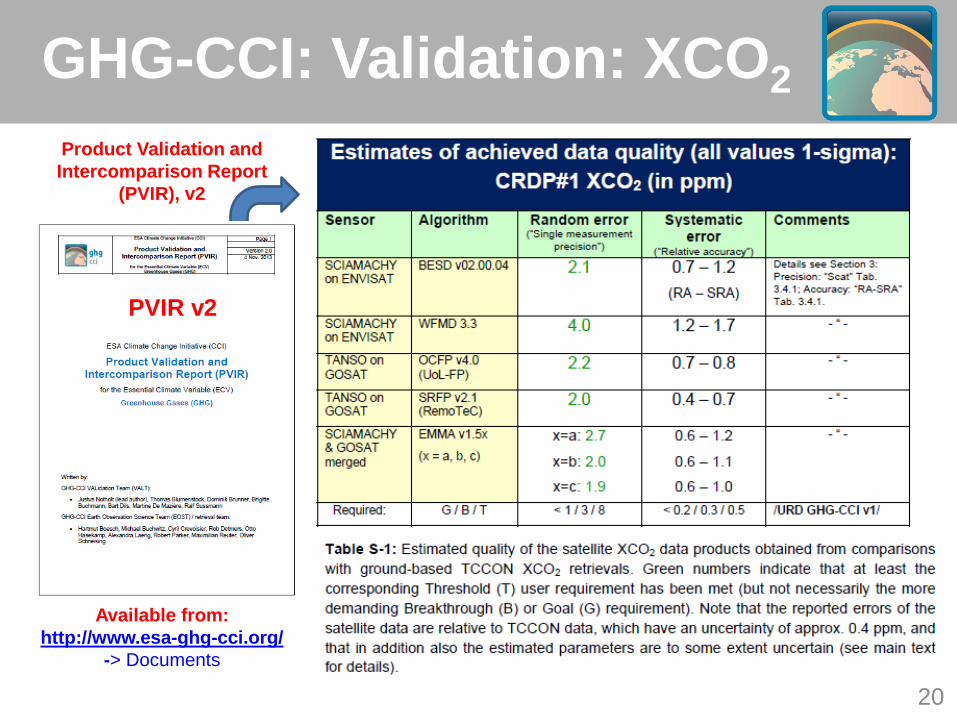
GHG-CCI: Validation: XCO2 Product Validation and Intercomparison Report
(PVIR), v2
Available from: http://www.esa-ghg-cci.org/
-> Documents
PVIR v2
20
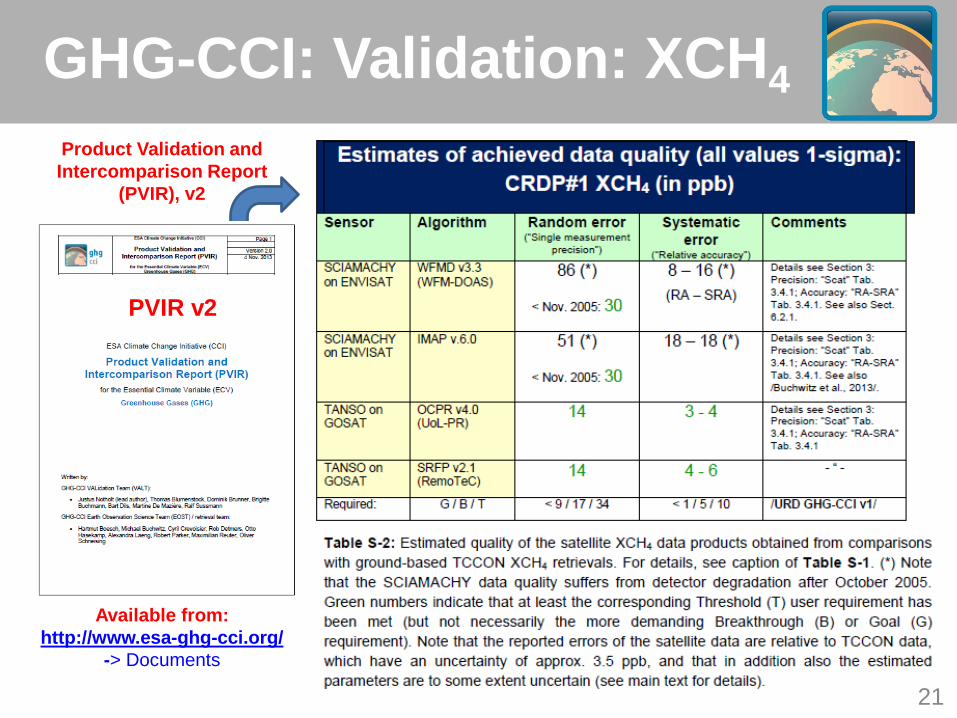
GHG-CCI: Validation: XCH4 Product Validation and Intercomparison Report
(PVIR), v2
Available from: http://www.esa-ghg-cci.org/
-> Documents
PVIR v2
21
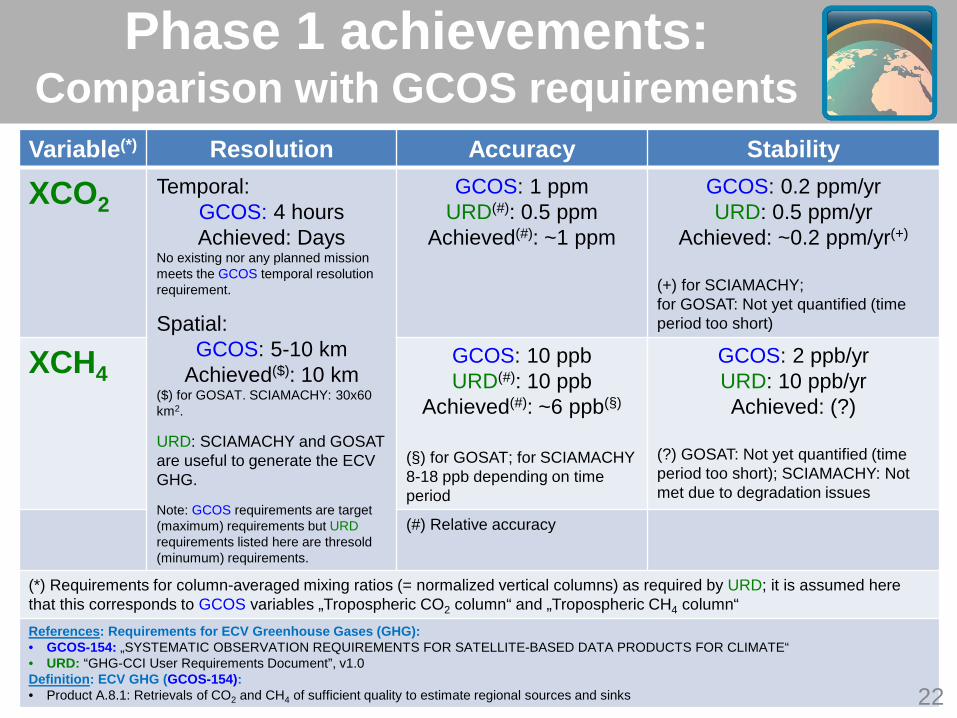
Variable(*) Resolution Accuracy Stability
XCO2 Temporal:
GCOS: 4 hours Achieved: Days
No existing nor any planned mission meets the GCOS temporal resolution requirement.
Spatial: GCOS: 5-10 km
Achieved($): 10 km ($) for GOSAT. SCIAMACHY: 30x60 km2.
URD: SCIAMACHY and GOSAT are useful to generate the ECV GHG. Note: GCOS requirements are target (maximum) requirements but URD requirements listed here are thresold (minumum) requirements.
GCOS: 1 ppm URD(#): 0.5 ppm
Achieved(#): ~1 ppm
GCOS: 0.2 ppm/yr URD: 0.5 ppm/yr
Achieved: ~0.2 ppm/yr(+)
(+) for SCIAMACHY; for GOSAT: Not yet quantified (time period too short)
XCH4 GCOS: 10 ppb URD(#): 10 ppb
Achieved(#): ~6 ppb(§)
(§) for GOSAT; for SCIAMACHY 8-18 ppb depending on time period
GCOS: 2 ppb/yr URD: 10 ppb/yr Achieved: (?)
(?) GOSAT: Not yet quantified (time period too short); SCIAMACHY: Not met due to degradation issues
(#) Relative accuracy
(*) Requirements for column-averaged mixing ratios (= normalized vertical columns) as required by URD; it is assumed here that this corresponds to GCOS variables „Tropospheric CO2 column“ and „Tropospheric CH4 column“ References: Requirements for ECV Greenhouse Gases (GHG): • GCOS-154: „SYSTEMATIC OBSERVATION REQUIREMENTS FOR SATELLITE-BASED DATA PRODUCTS FOR CLIMATE“ • URD: “GHG-CCI User Requirements Document”, v1.0 Definition: ECV GHG (GCOS-154): • Product A.8.1: Retrievals of CO2 and CH4 of sufficient quality to estimate regional sources and sinks
Phase 1 achievements: Comparison with GCOS requirements
22
Results
23
Satellite-derived GHG source/sink-related results:
Carbon dioxide
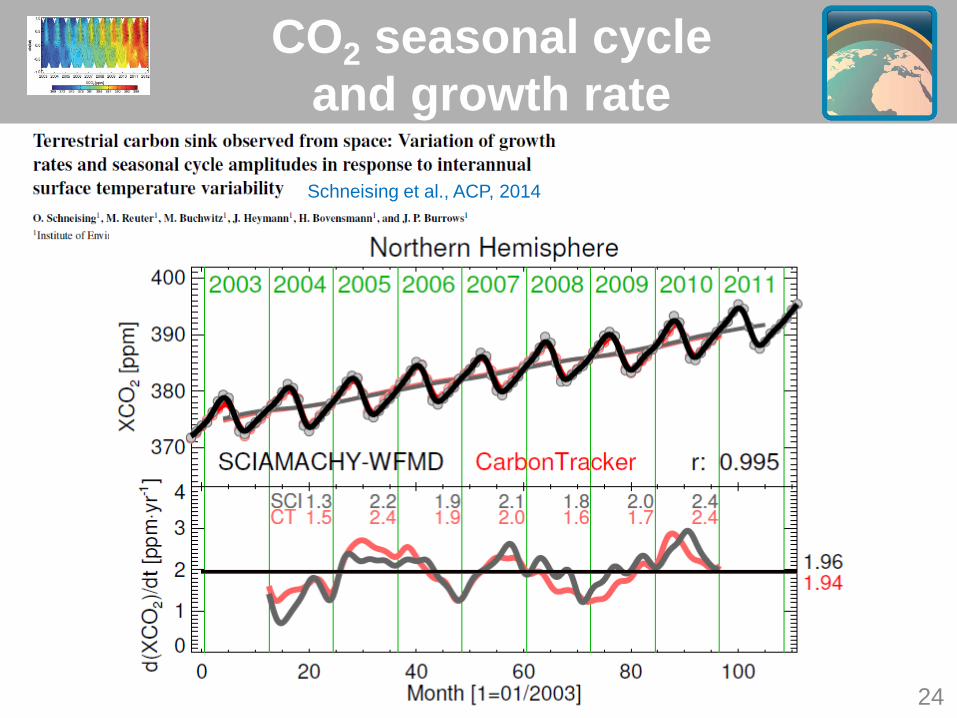
CO2 seasonal cycle and growth rate
Schneising et al., ACP, 2014
24
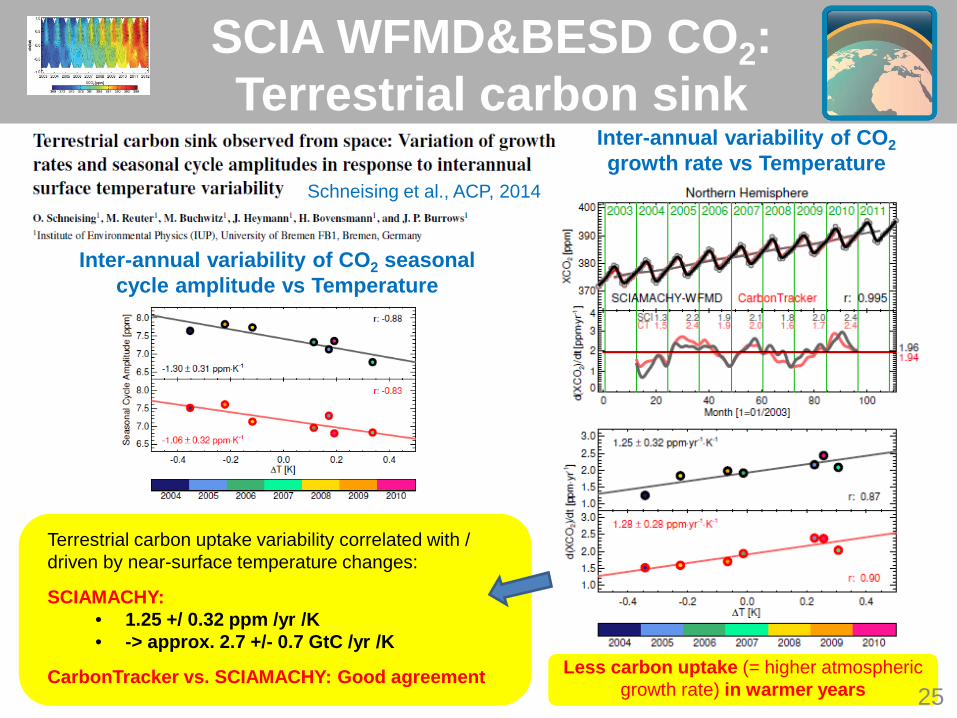
SCIA WFMD&BESD CO2: Terrestrial carbon sink
Inter-annual variability of CO2 growth rate vs Temperature
Inter-annual variability of CO2 seasonal cycle amplitude vs Temperature
Terrestrial carbon uptake variability correlated with / driven by near-surface temperature changes:
SCIAMACHY: • 1.25 +/ 0.32 ppm /yr /K • -> approx. 2.7 +/- 0.7 GtC /yr /K
CarbonTracker vs. SCIAMACHY: Good agreement
Schneising et al., ACP, 2014
Less carbon uptake (= higher atmospheric growth rate) in warmer years 25
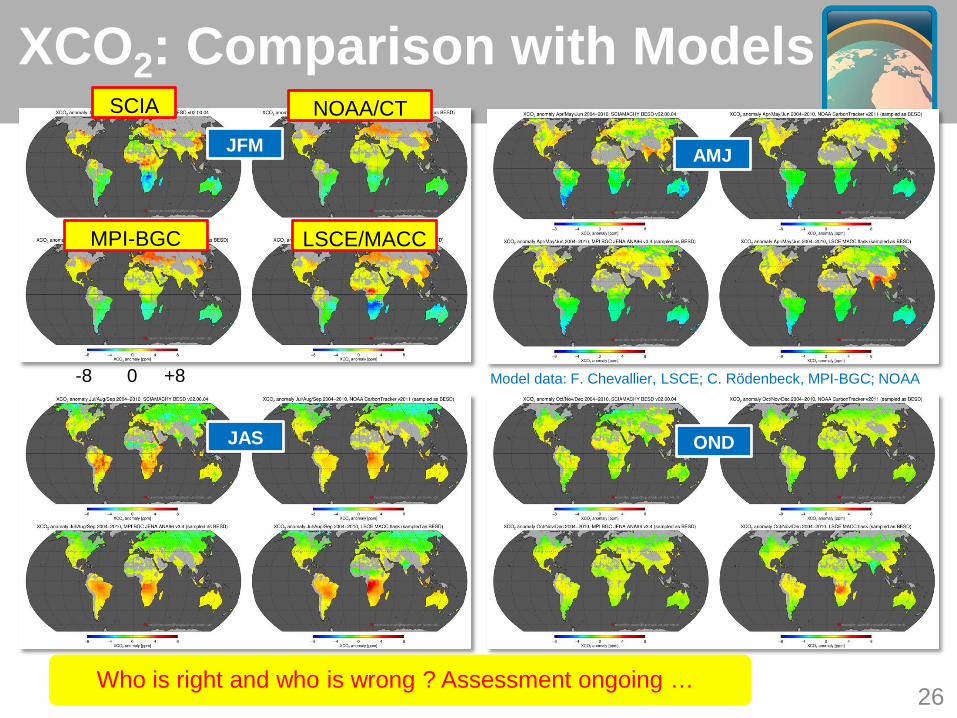
XCO2: Comparison with Models
JFM AMJ
JAS OND
NOAA/CT
LSCE/MACC MPI-BGC
-8 +8 0 Model data: F. Chevallier, LSCE; C. Rödenbeck, MPI-BGC; NOAA
SCIA
26 Who is right and who is wrong ? Assessment ongoing …
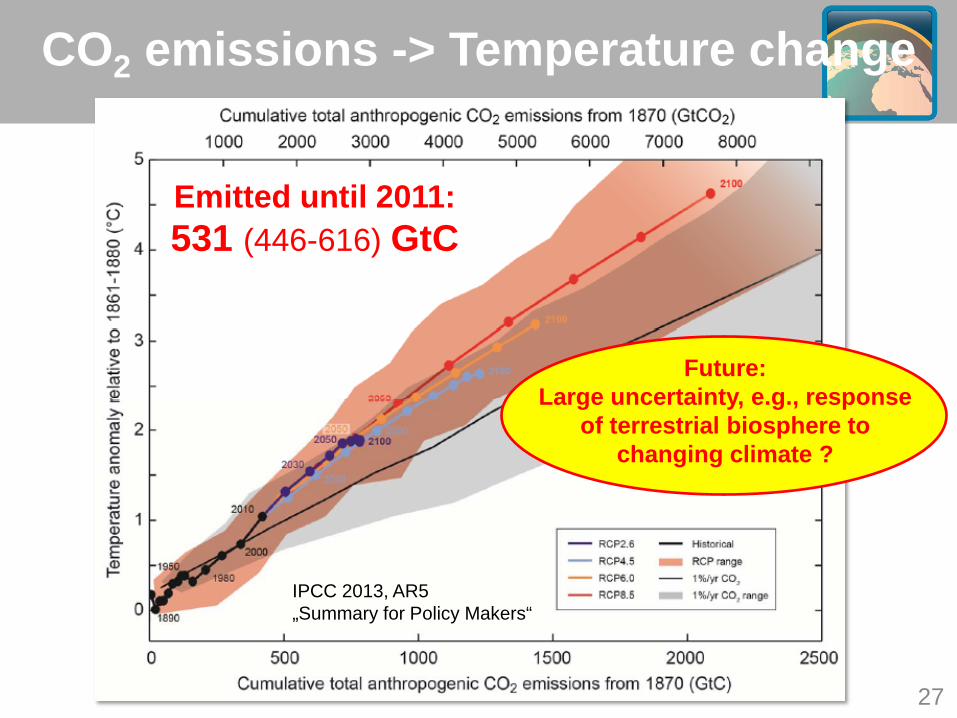
CO2 emissions -> Temperature change
Emitted until 2011: 531 (446-616) GtC
IPCC 2013, AR5 „Summary for Policy Makers“
27
Future: Large uncertainty, e.g., response
of terrestrial biosphere to changing climate ?
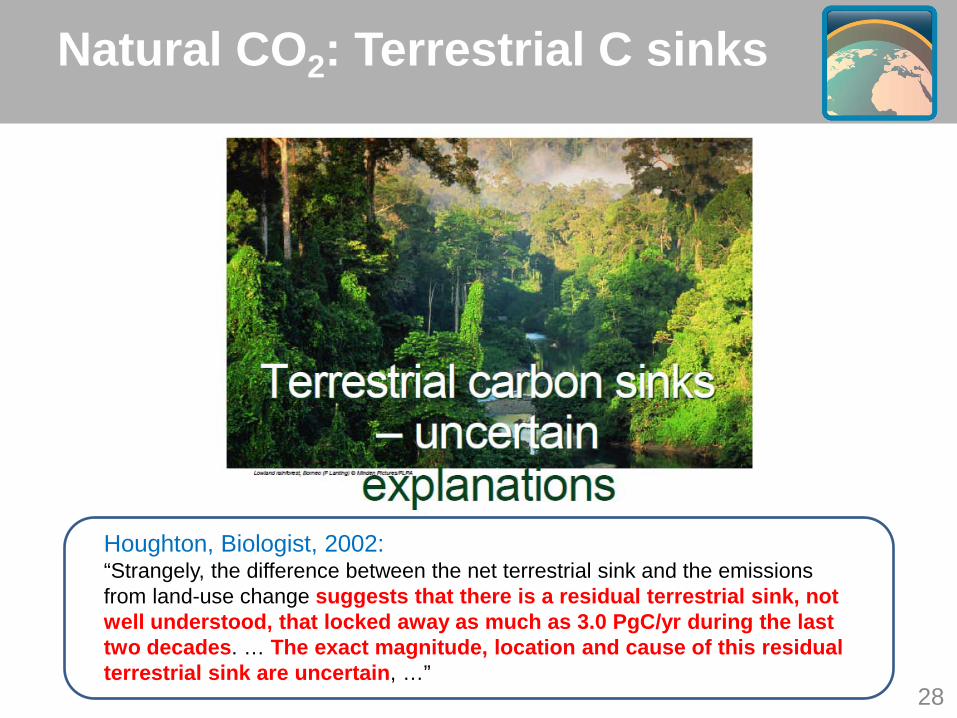
Natural CO2: Terrestrial C sinks
28
Houghton, Biologist, 2002: “Strangely, the difference between the net terrestrial sink and the emissions from land-use change suggests that there is a residual terrestrial sink, not well understood, that locked away as much as 3.0 PgC/yr during the last two decades. … The exact magnitude, location and cause of this residual terrestrial sink are uncertain, …”
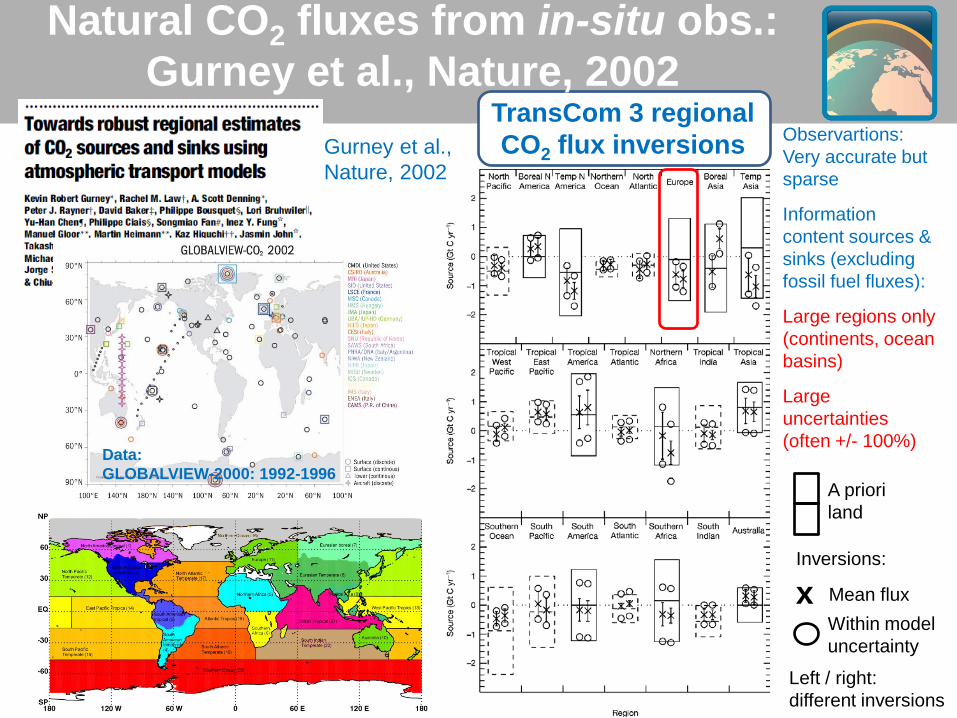
Natural CO2 fluxes from in-situ obs.: Gurney et al., Nature, 2002
Gurney et al., Nature, 2002
TransCom 3 regional CO2 flux inversions Observartions:
Very accurate but sparse
Information content sources & sinks (excluding fossil fuel fluxes):
Large regions only (continents, ocean basins)
Large uncertainties (often +/- 100%)
A priori land
Within model uncertainty
Inversions:
Left / right: different inversions
Mean flux x
Data: GLOBALVIEW-2000: 1992-1996
30
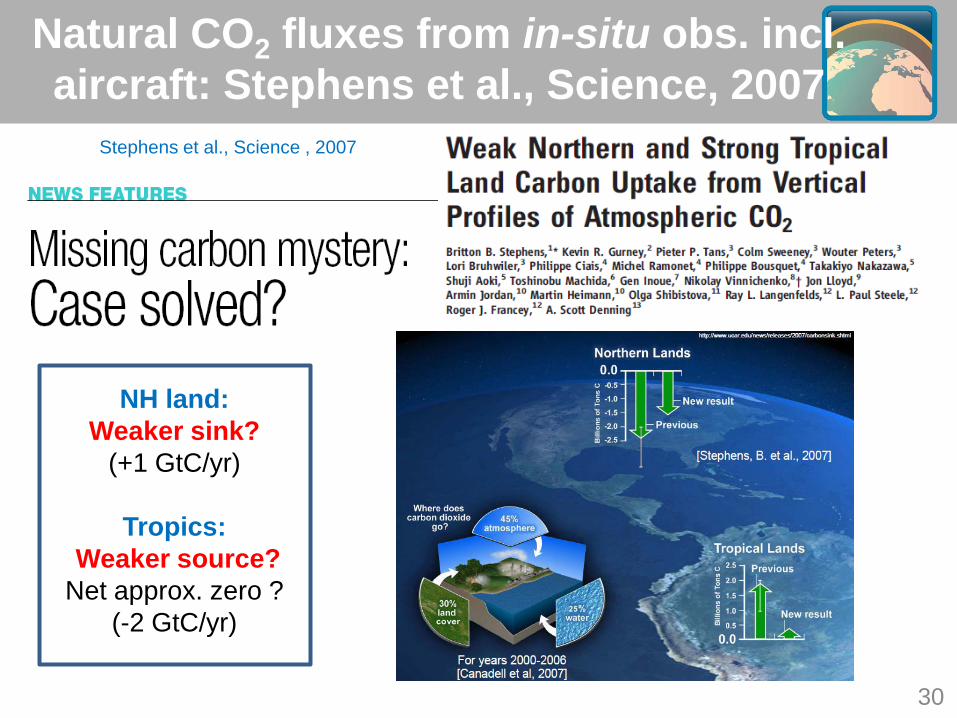
NH land: Weaker sink?
(+1 GtC/yr)
Tropics: Weaker source? Net approx. zero ?
(-2 GtC/yr)
Stephens et al., Science , 2007
Natural CO2 fluxes from in-situ obs. incl. aircraft: Stephens et al., Science, 2007
31
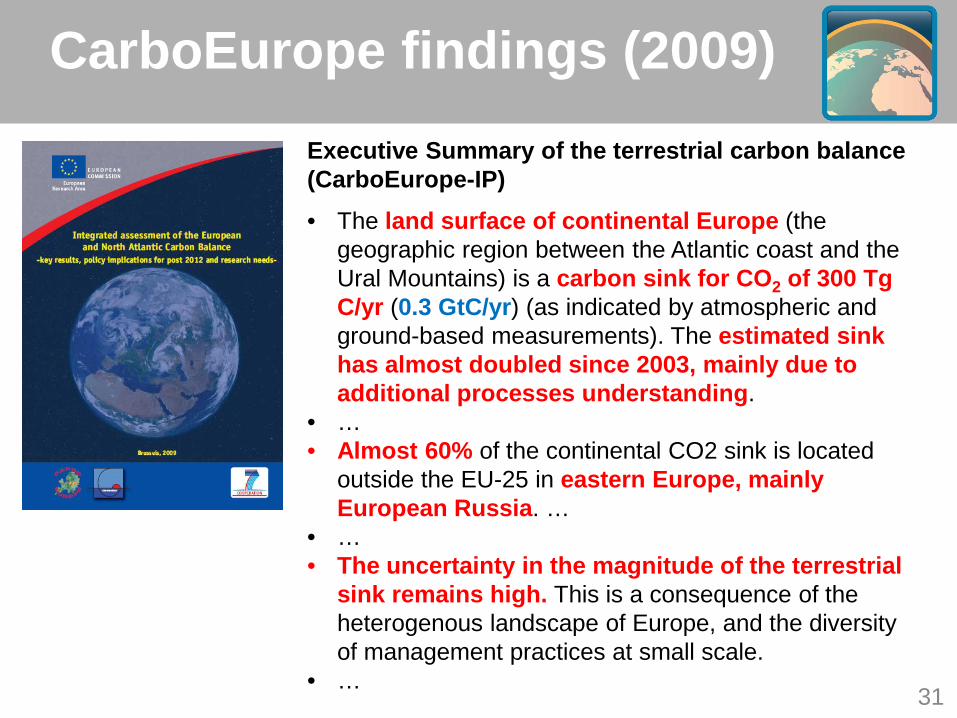
CarboEurope findings (2009) Executive Summary of the terrestrial carbon balance (CarboEurope-IP)
• The land surface of continental Europe (the geographic region between the Atlantic coast and the Ural Mountains) is a carbon sink for CO2 of 300 Tg C/yr (0.3 GtC/yr) (as indicated by atmospheric and ground-based measurements). The estimated sink has almost doubled since 2003, mainly due to additional processes understanding.
• … • Almost 60% of the continental CO2 sink is located
outside the EU-25 in eastern Europe, mainly European Russia. …
• … • The uncertainty in the magnitude of the terrestrial
sink remains high. This is a consequence of the heterogenous landscape of Europe, and the diversity of management practices at small scale.
• …
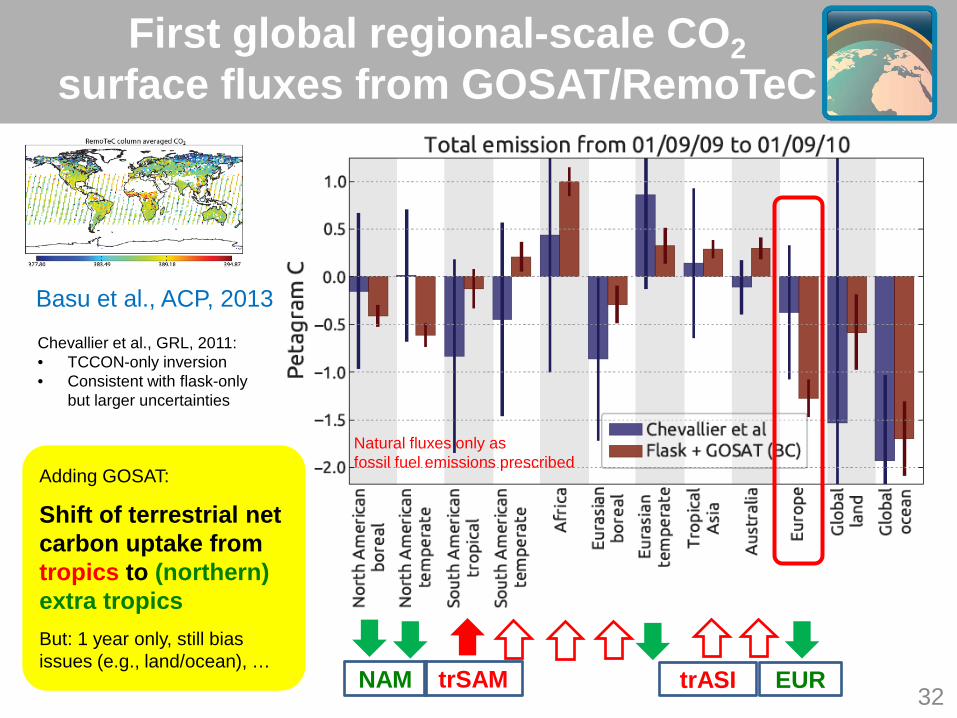
First global regional-scale CO2 surface fluxes from GOSAT/RemoTeC
Basu et al., ACP, 2013
Chevallier et al., GRL, 2011: • TCCON-only inversion • Consistent with flask-only
but larger uncertainties
Adding GOSAT:
Shift of terrestrial net carbon uptake from tropics to (northern) extra tropics
But: 1 year only, still bias issues (e.g., land/ocean), …
Natural fluxes only as fossil fuel emissions prescribed
32 NAM EUR trASI trSAM
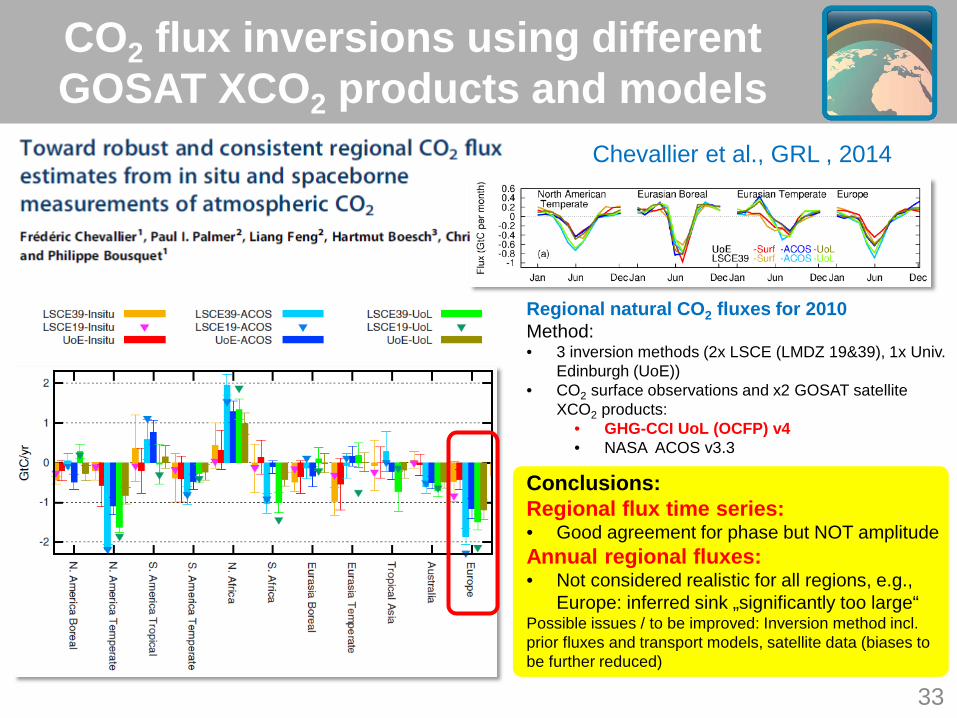
CO2 flux inversions using different GOSAT XCO2 products and models
Regional natural CO2 fluxes for 2010 Method: • 3 inversion methods (2x LSCE (LMDZ 19&39), 1x Univ.
Edinburgh (UoE)) • CO2 surface observations and x2 GOSAT satellite
XCO2 products: • GHG-CCI UoL (OCFP) v4 • NASA ACOS v3.3
Conclusions: Regional flux time series: • Good agreement for phase but NOT amplitude Annual regional fluxes: • Not considered realistic for all regions, e.g.,
Europe: inferred sink „significantly too large“ Possible issues / to be improved: Inversion method incl. prior fluxes and transport models, satellite data (biases to be further reduced)
33
Chevallier et al., GRL , 2014
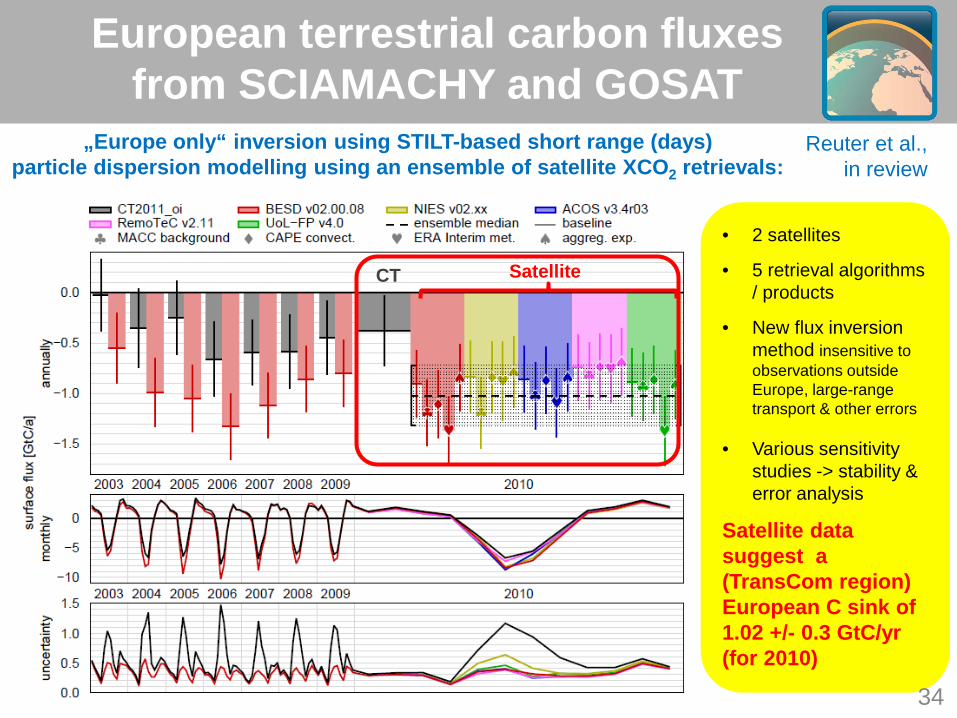
European terrestrial carbon fluxes from SCIAMACHY and GOSAT
Reuter et al., in review
„Europe only“ inversion using STILT-based short range (days) particle dispersion modelling using an ensemble of satellite XCO2 retrievals:
• 2 satellites
• 5 retrieval algorithms / products
• New flux inversion method insensitive to observations outside Europe, large-range transport & other errors
• Various sensitivity studies -> stability & error analysis
Satellite data suggest a (TransCom region) European C sink of 1.02 +/- 0.3 GtC/yr (for 2010)
34
Satellite CT
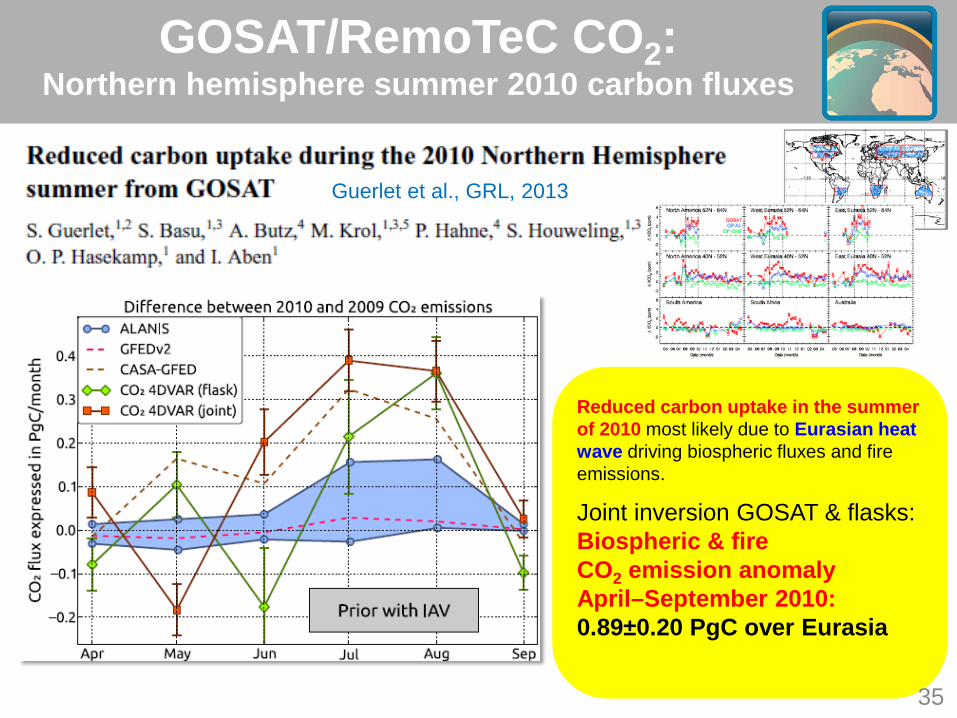
Reduced carbon uptake in the summer of 2010 most likely due to Eurasian heat wave driving biospheric fluxes and fire emissions.
Joint inversion GOSAT & flasks: Biospheric & fire CO2 emission anomaly April–September 2010: 0.89±0.20 PgC over Eurasia
35
GOSAT/RemoTeC CO2: Northern hemisphere summer 2010 carbon fluxes
Guerlet et al., GRL, 2013
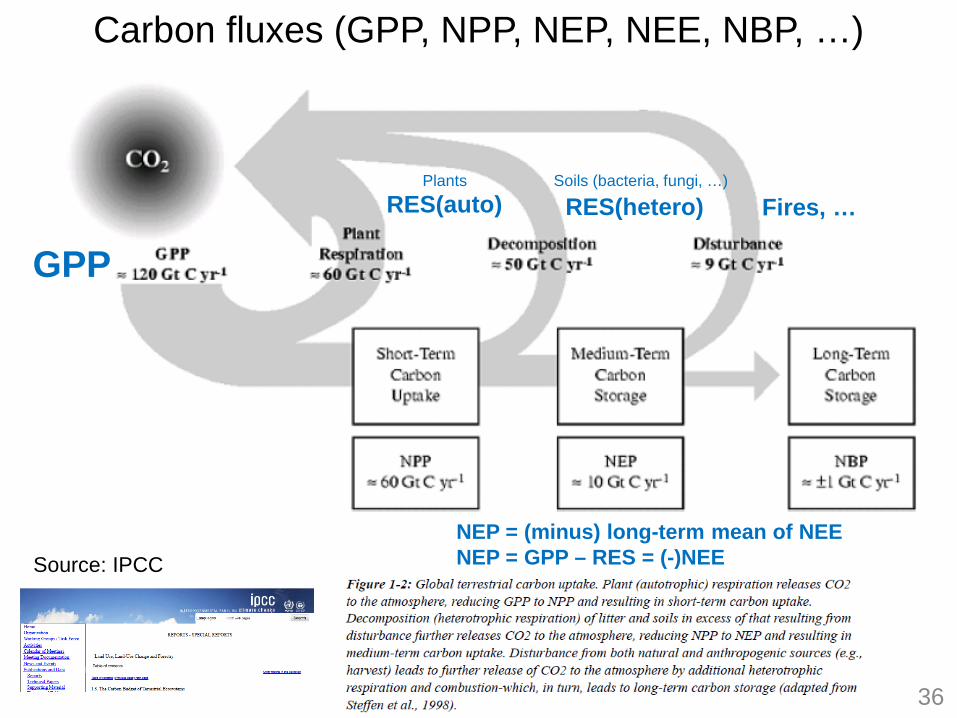
Carbon fluxes (GPP, NPP, NEP, NEE, NBP, …)
Source: IPCC
GPP RES(auto) RES(hetero) Fires, …
NEP = (minus) long-term mean of NEE NEP = GPP – RES = (-)NEE
Plants Soils (bacteria, fungi, …)
36
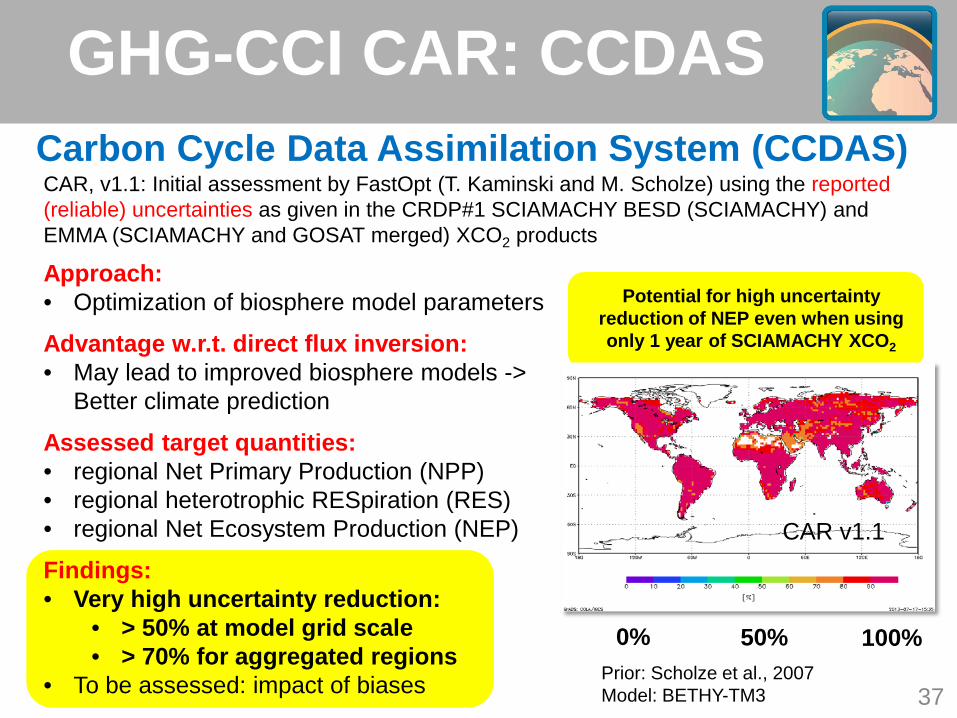
GHG-CCI CAR: CCDAS Carbon Cycle Data Assimilation System (CCDAS)
37
CAR, v1.1: Initial assessment by FastOpt (T. Kaminski and M. Scholze) using the reported (reliable) uncertainties as given in the CRDP#1 SCIAMACHY BESD (SCIAMACHY) and EMMA (SCIAMACHY and GOSAT merged) XCO2 products
Approach: • Optimization of biosphere model parameters
Advantage w.r.t. direct flux inversion: • May lead to improved biosphere models ->
Better climate prediction
Assessed target quantities: • regional Net Primary Production (NPP) • regional heterotrophic RESpiration (RES) • regional Net Ecosystem Production (NEP)
Findings: • Very high uncertainty reduction:
• > 50% at model grid scale • > 70% for aggregated regions
• To be assessed: impact of biases
Potential for high uncertainty reduction of NEP even when using only 1 year of SCIAMACHY XCO2
0% 50% 100%
CAR v1.1
Prior: Scholze et al., 2007 Model: BETHY-TM3
38
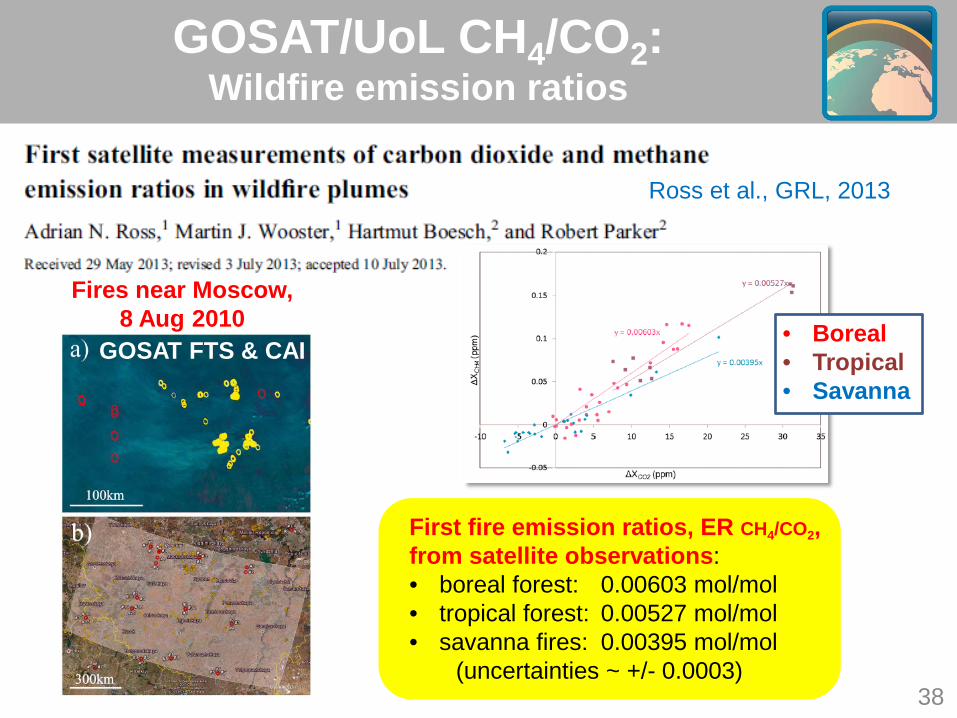
GOSAT/UoL CH4/CO2: Wildfire emission ratios
First fire emission ratios, ER CH4/CO2, from satellite observations: • boreal forest: 0.00603 mol/mol • tropical forest: 0.00527 mol/mol • savanna fires: 0.00395 mol/mol (uncertainties ~ +/- 0.0003)
Ross et al., GRL, 2013
Fires near Moscow, 8 Aug 2010
GOSAT FTS & CAI • Boreal • Tropical • Savanna
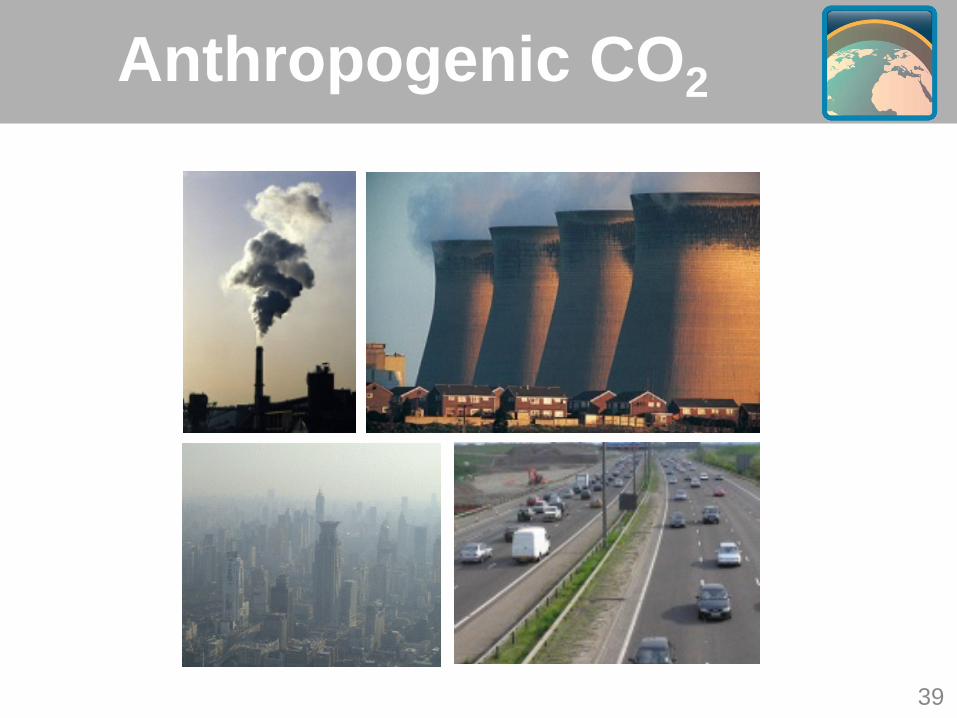
Anthropogenic CO2
39
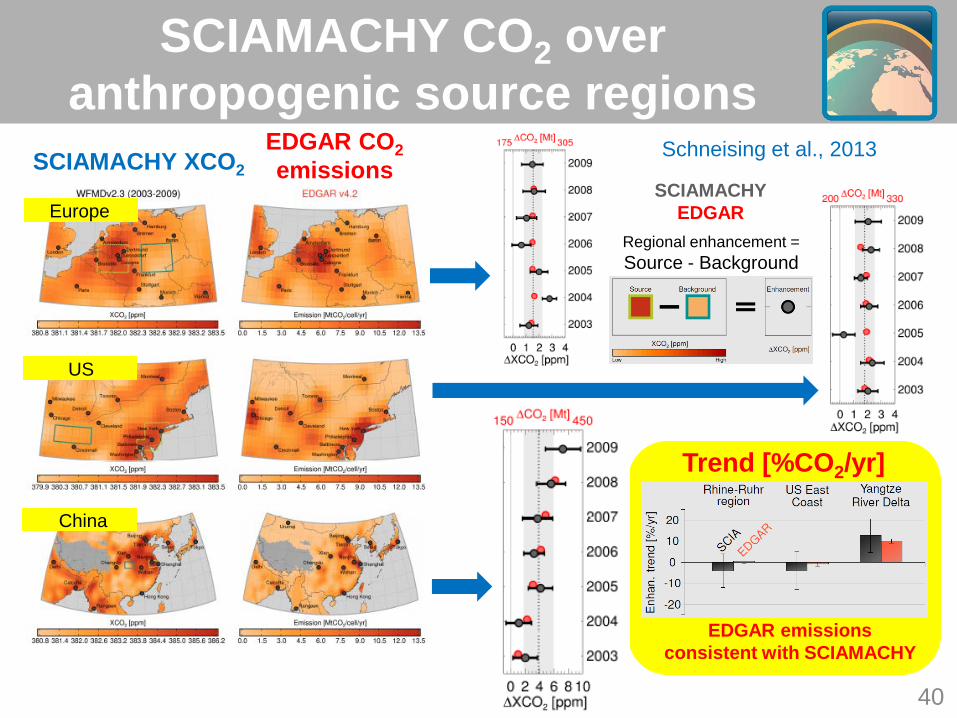
SCIAMACHY XCO2 EDGAR CO2 emissions
Schneising et al., 2013
Europe
China
US
Trend [%CO2/yr]
EDGAR emissions consistent with SCIAMACHY
Regional enhancement = Source - Background
SCIAMACHY EDGAR
SCIAMACHY CO2 over anthropogenic source regions
40
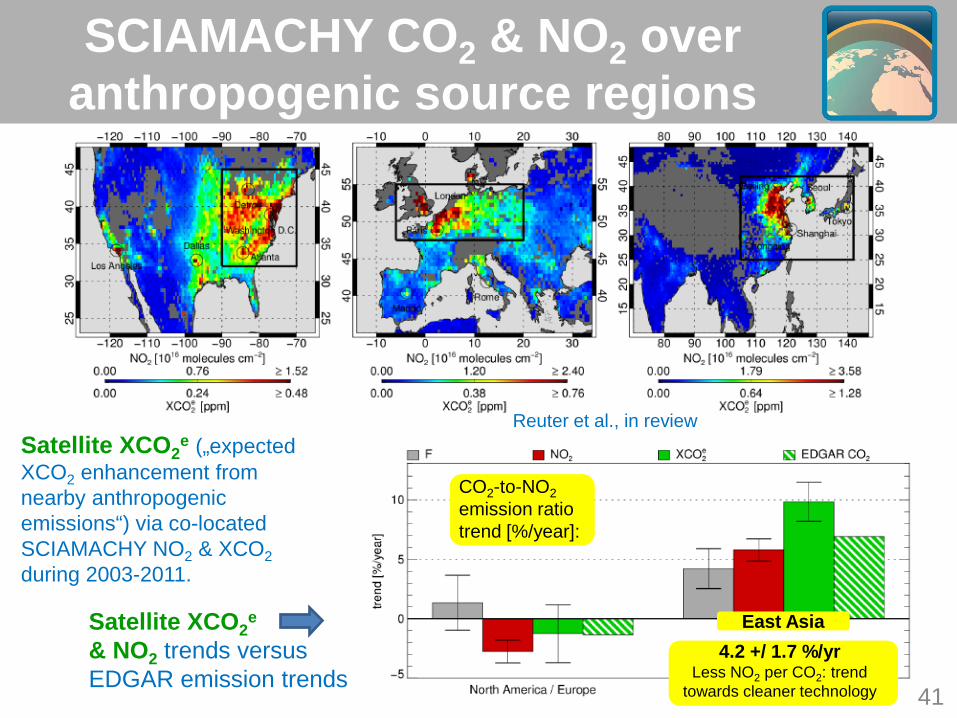
SCIAMACHY CO2 & NO2 over anthropogenic source regions
Satellite XCO2e („expected
XCO2 enhancement from nearby anthropogenic emissions“) via co-located SCIAMACHY NO2 & XCO2 during 2003-2011.
Satellite XCO2e
& NO2 trends versus EDGAR emission trends
CO2-to-NO2 emission ratio trend [%/year]:
4.2 +/ 1.7 %/yr Less NO2 per CO2: trend
towards cleaner technology
East Asia
Reuter et al., in review
41
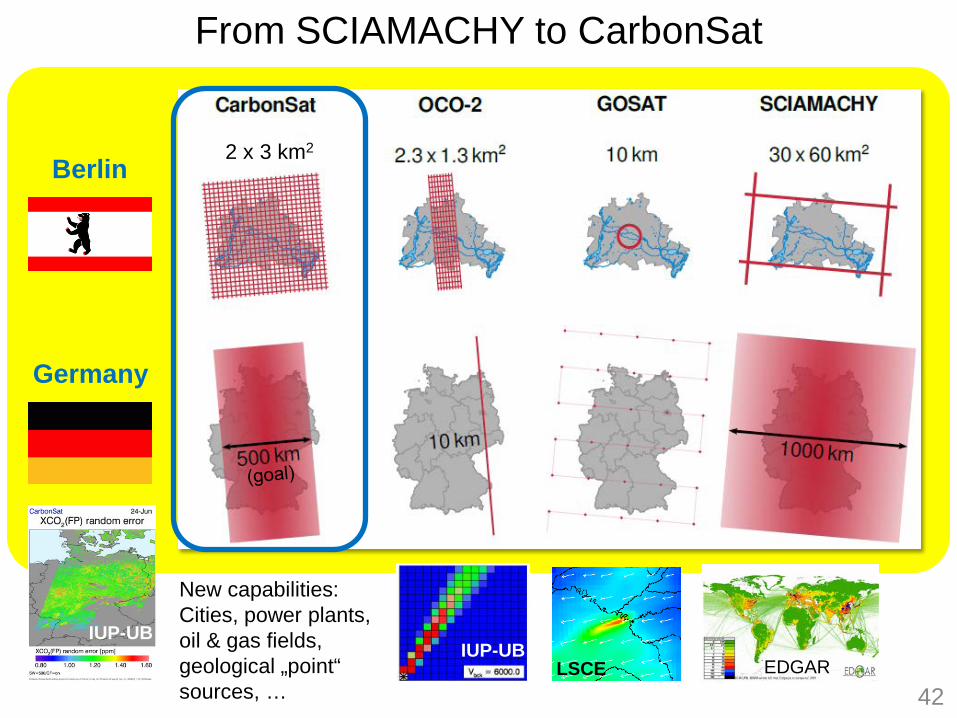
From SCIAMACHY to CarbonSat
Berlin
Germany
New capabilities: Cities, power plants, oil & gas fields, geological „point“ sources, … 42
LSCE EDGAR IUP-UB
IUP-UB
2 x 3 km2
Results
43
Satellite-derived GHG source/sink-related results:
Methane
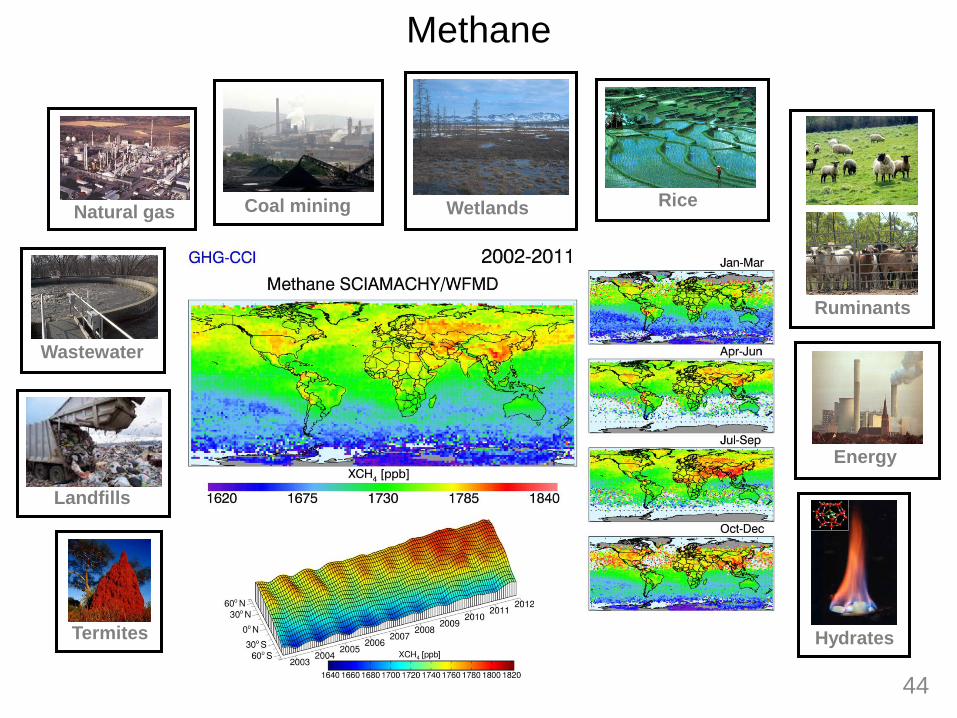
Methane
44
Coal mining
Landfills
Termites
Wastewater
Wetlands Rice
Ruminants
Hydrates
Natural gas
Energy
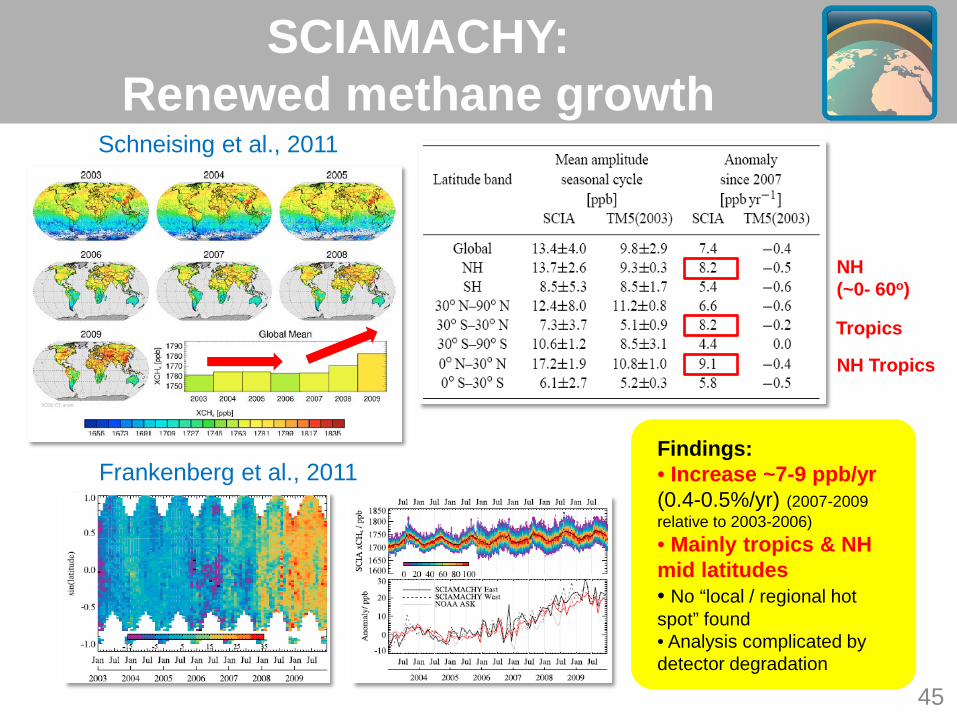
Findings: • Increase ~7-9 ppb/yr (0.4-0.5%/yr) (2007-2009 relative to 2003-2006) • Mainly tropics & NH mid latitudes • No “local / regional hot spot” found • Analysis complicated by detector degradation
45
SCIAMACHY: Renewed methane growth
Schneising et al., 2011
Frankenberg et al., 2011
Tropics
NH Tropics
NH (~0- 60o)
46
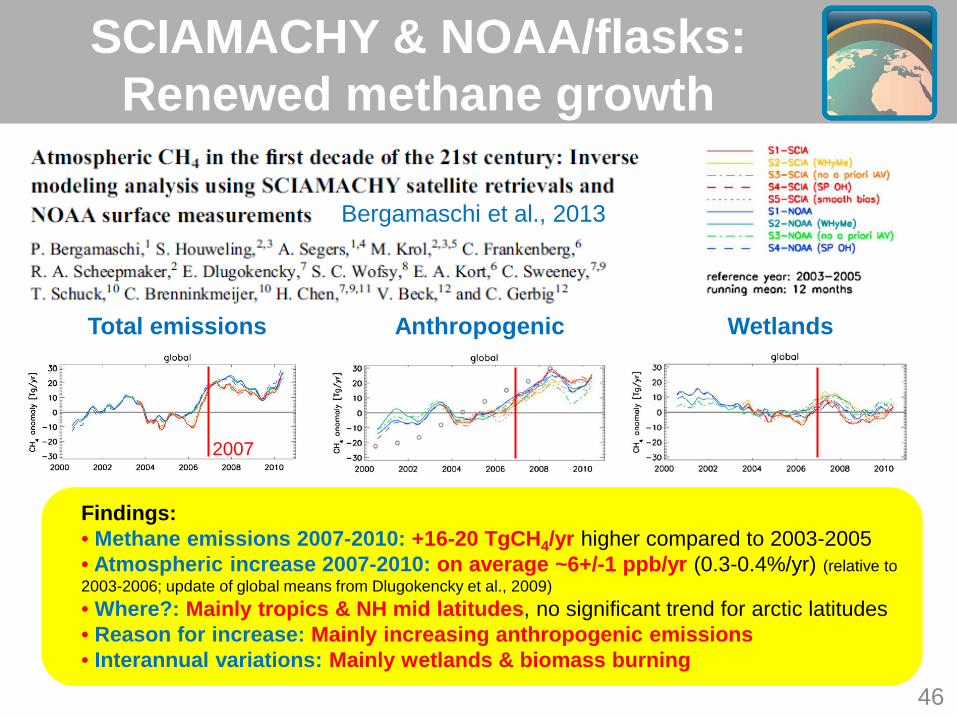
SCIAMACHY & NOAA/flasks: Renewed methane growth
Findings: • Methane emissions 2007-2010: +16-20 TgCH4/yr higher compared to 2003-2005 • Atmospheric increase 2007-2010: on average ~6+/-1 ppb/yr (0.3-0.4%/yr) (relative to 2003-2006; update of global means from Dlugokencky et al., 2009) • Where?: Mainly tropics & NH mid latitudes, no significant trend for arctic latitudes • Reason for increase: Mainly increasing anthropogenic emissions • Interannual variations: Mainly wetlands & biomass burning
Bergamaschi et al., 2013
Total emissions Anthropogenic Wetlands
2007
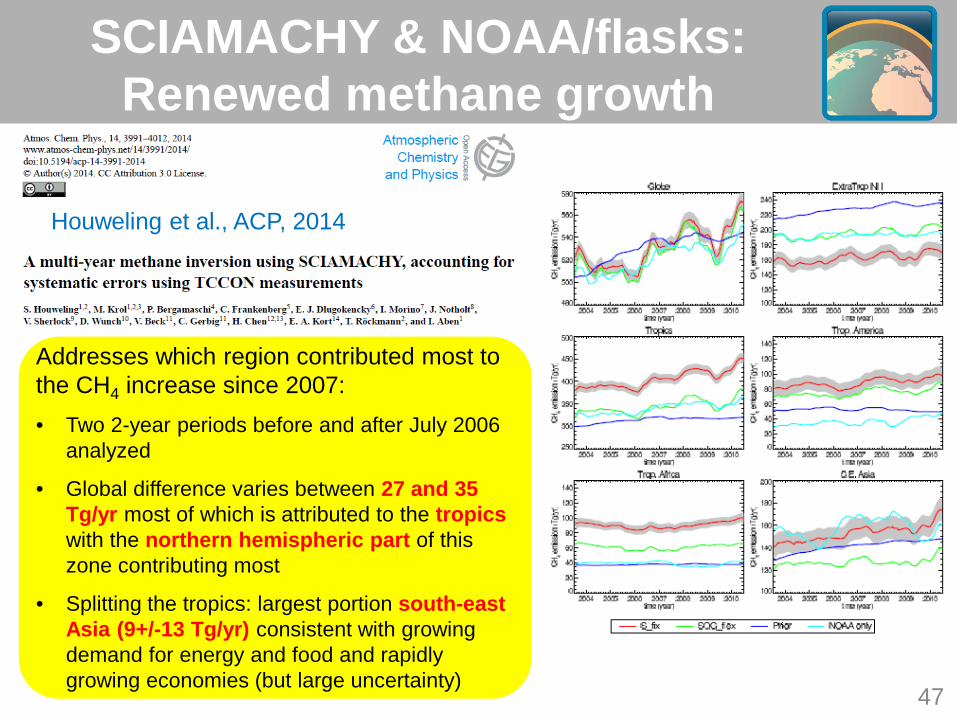
SCIAMACHY & NOAA/flasks: Renewed methane growth
Houweling et al., ACP, 2014
47
Addresses which region contributed most to the CH4 increase since 2007:
• Two 2-year periods before and after July 2006 analyzed
• Global difference varies between 27 and 35 Tg/yr most of which is attributed to the tropics with the northern hemispheric part of this zone contributing most
• Splitting the tropics: largest portion south-east Asia (9+/-13 Tg/yr) consistent with growing demand for energy and food and rapidly growing economies (but large uncertainty)
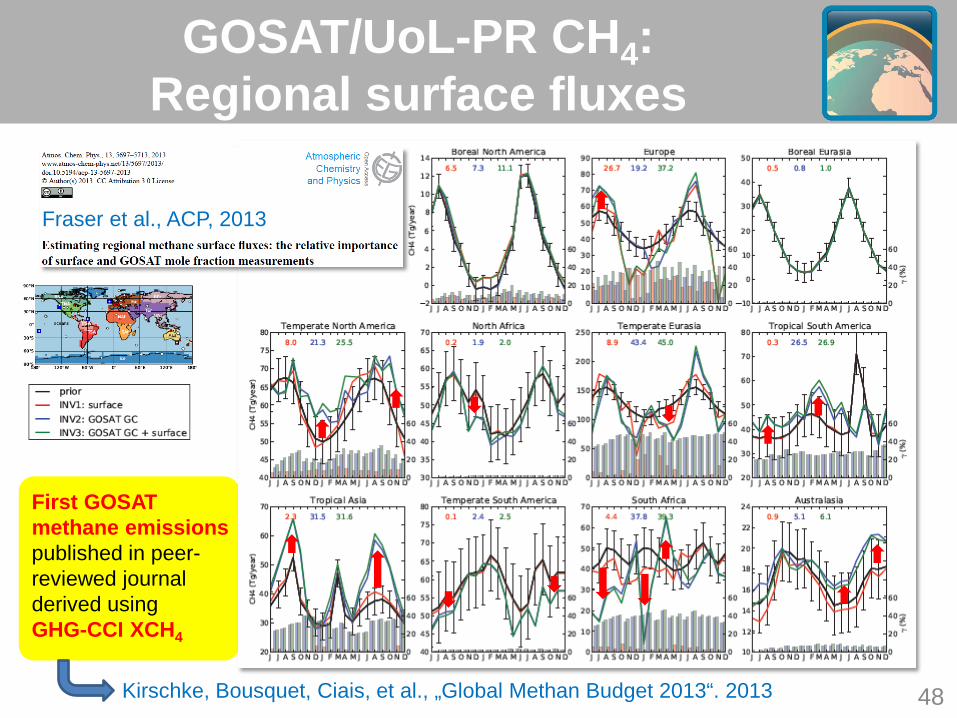
Fraser et al., ACP, 2013
First GOSAT methane emissions published in peer-reviewed journal derived using GHG-CCI XCH4
48
GOSAT/UoL-PR CH4: Regional surface fluxes
Kirschke, Bousquet, Ciais, et al., „Global Methan Budget 2013“. 2013
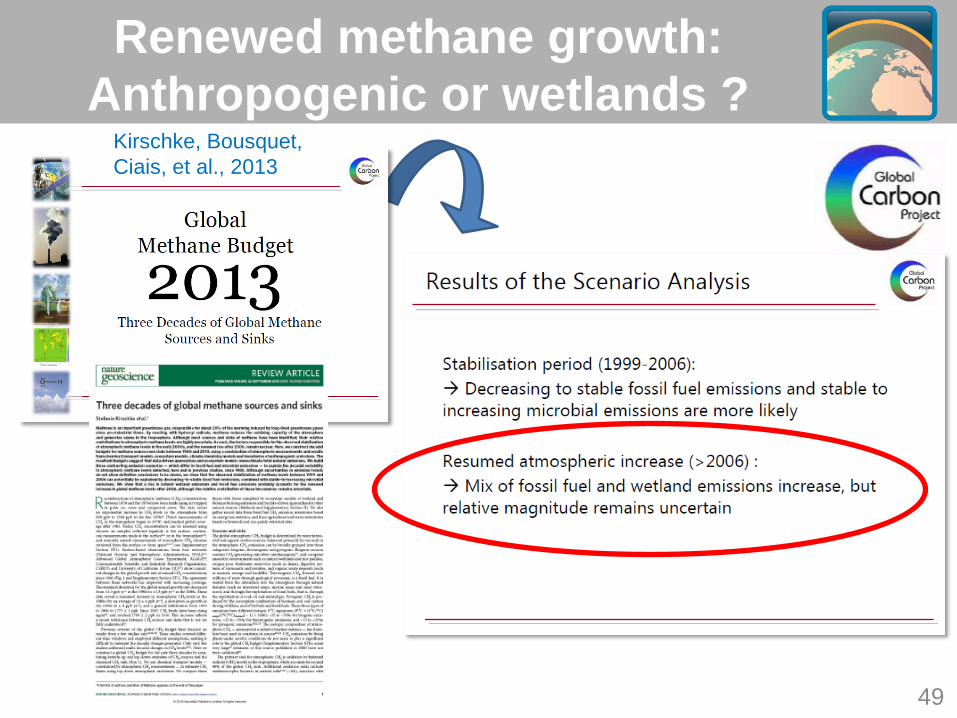
Renewed methane growth: Anthropogenic or wetlands ?
Kirschke, Bousquet, Ciais, et al., 2013
49
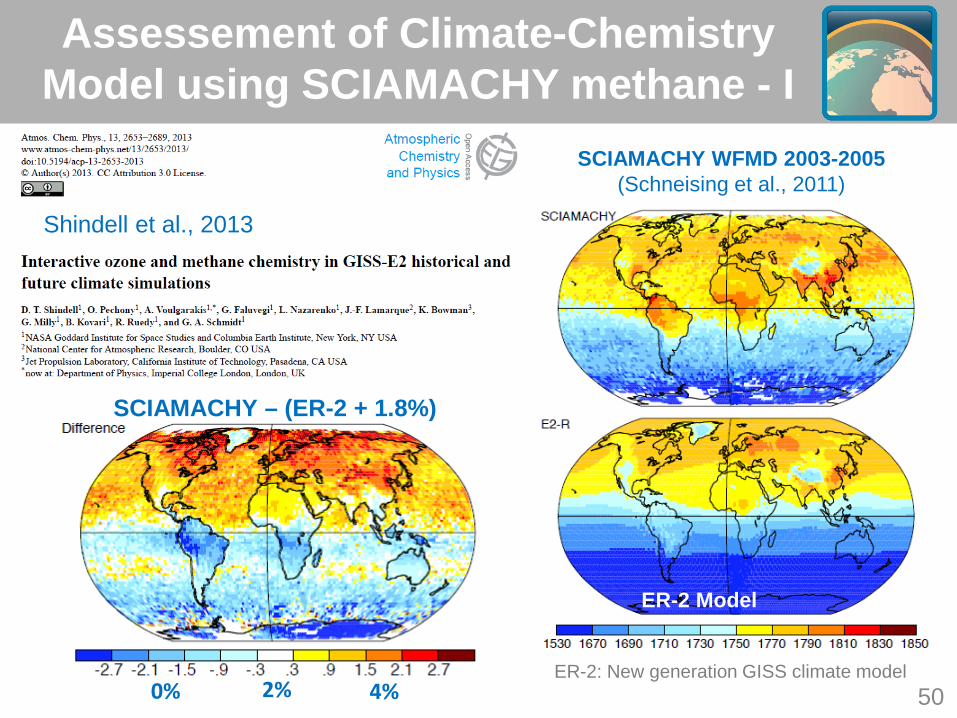
Assessement of Climate-Chemistry Model using SCIAMACHY methane - I
Shindell et al., 2013
SCIAMACHY – (ER-2 + 1.8%)
0% 2% 4%
SCIAMACHY WFMD 2003-2005 (Schneising et al., 2011)
ER-2 Model
50 ER-2: New generation GISS climate model
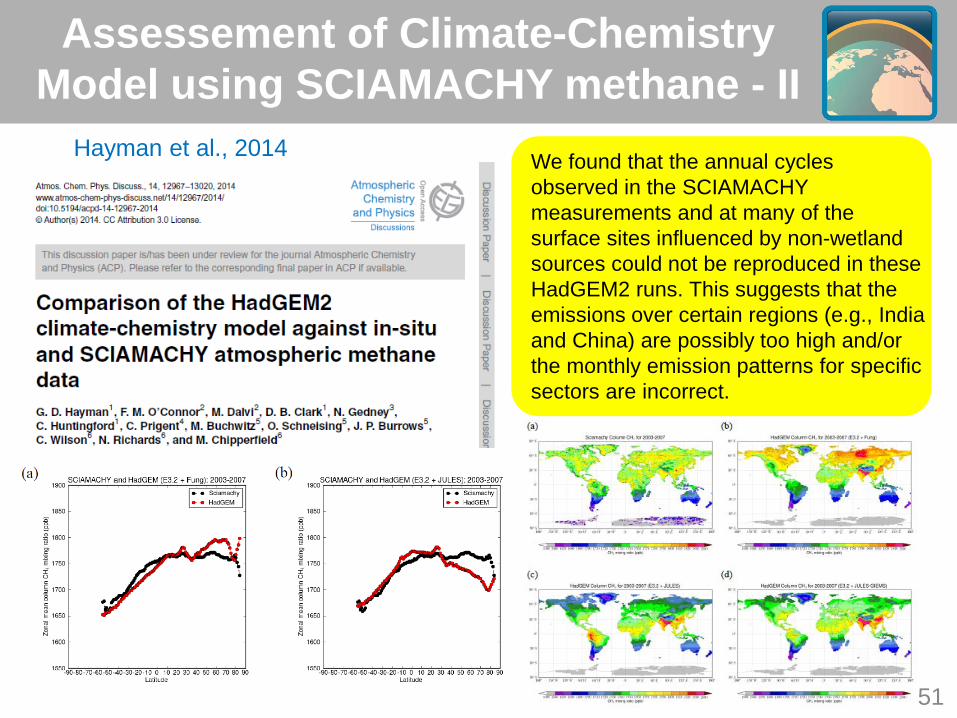
Hayman et al., 2014 We found that the annual cycles observed in the SCIAMACHY measurements and at many of the surface sites influenced by non-wetland sources could not be reproduced in these HadGEM2 runs. This suggests that the emissions over certain regions (e.g., India and China) are possibly too high and/or the monthly emission patterns for specific sectors are incorrect.
Assessement of Climate-Chemistry Model using SCIAMACHY methane - II
51
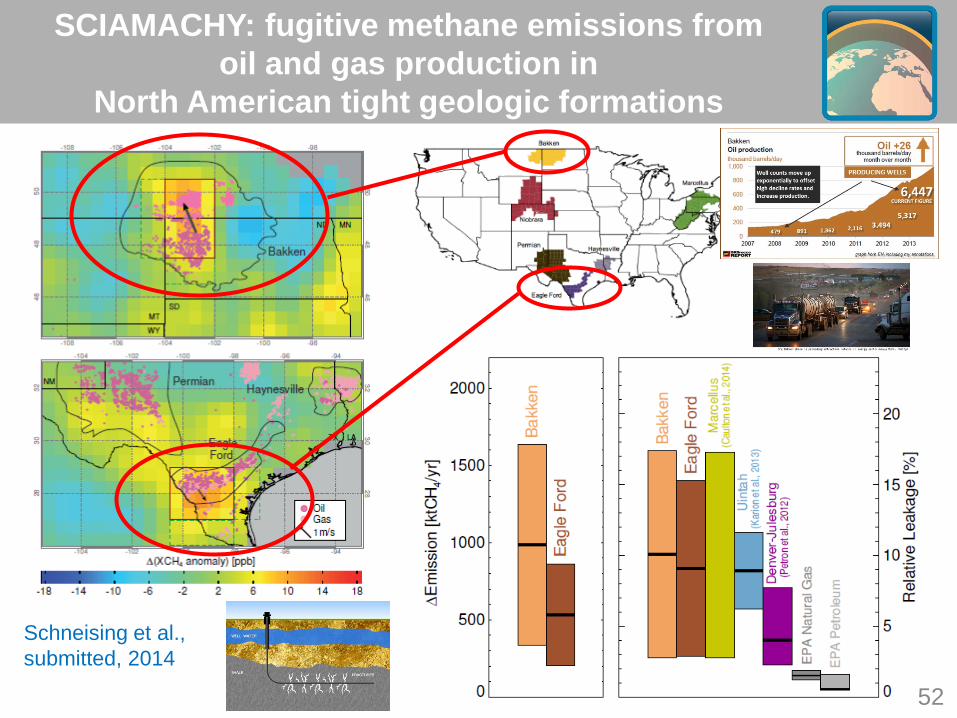
SCIAMACHY: fugitive methane emissions from oil and gas production in
North American tight geologic formations
52
Schneising et al., submitted, 2014
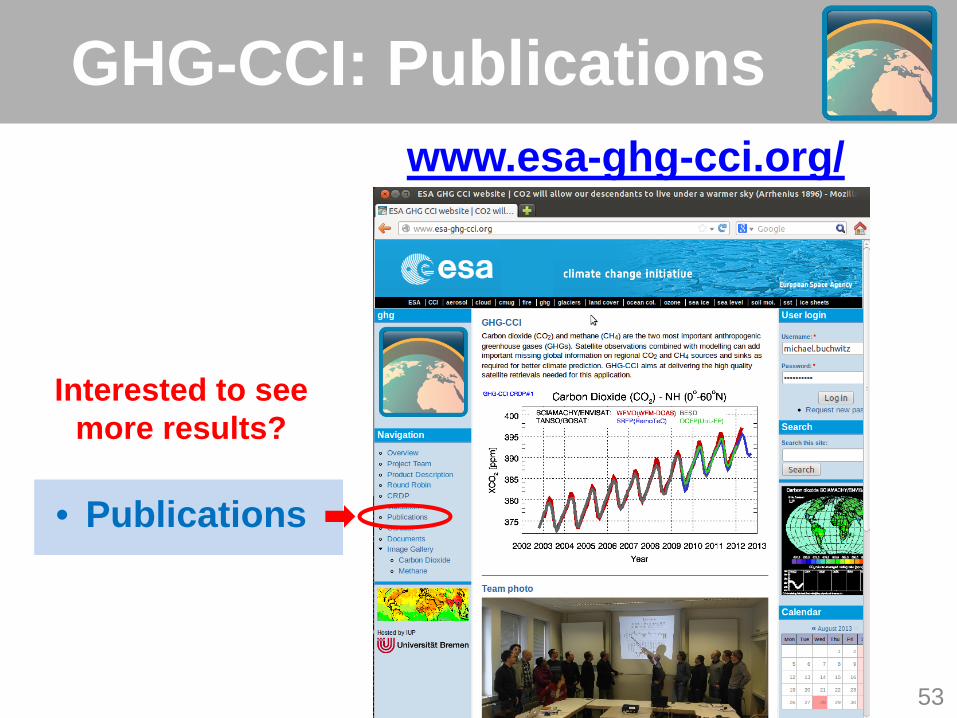
GHG-CCI: Publications www.esa-ghg-cci.org/
Interested to see more results?
• Publications
53

Many thanks for your attention !
54