greening government ict & digital services: 2019-2020
TRANSCRIPT

1
Greening Government ICT: ICT and Digital Services Annual Report 2019-2020 June 2021

2
© Crown copyright 2021
You may re-use this information (excluding logos) free of charge in any format or medium, under the terms of the Open Government Licence v.3. To view this licence visit www.nationalarchives.gov.uk/doc/open-government-licence/version/3/ or email [email protected]
This publication is available at www.gov.uk/government/publications
Any enquiries regarding this publication should be sent to us at
PB14679
www.gov.uk/defra

3
Table of contents
Foreword ............................................................................................................................ 5
Executive summary ............................................................................................................ 8
Performance highlights; ............................................................................................... 8
Introduction ...................................................................................................................... 10
ICT & digital services footprint .......................................................................................... 14
Case study 1 – HMRC net zero and ICT .......................................................................
Footprint data summary ................................................................................................ 19
Industry hosting ............................................................................................................ 19
Home workers ............................................................................................................... 19
The legacy estate ......................................................................................................... 19
Case study 2 - ICT within MoD climate change plan ......................................................
Legacy transformation and technical debt ..................................................................... 20
Case study 3 - The Insolvency Service sustainability transformation .............................
Waste (resources)......................................................................................................... 21
Case study 4 - Defra circular ICT commitments ............................................................
Travel............................................................................................................................ 24
Best practices – an overview ........................................................................................ 25
Best and least performing best practices ...................................................................... 27
Departmental strategy statements ................................................................................ 29
Case study 5 – Cabinet Office sustainability targets in transformation ...........................
Paper reductions ........................................................................................................... 30
Case study 6 – CPS paper reduction plans for courts ...................................................
Supporting government agendas and commitments. .................................................... 31
Case study 7 - Met Office digital to meet net zero goals ................................................

4
Climate adaption and resilience .................................................................................... 32
Case study 8 – NHS D climate adaptation and resilience ..............................................
Our metrics for success ................................................................................................ 34
Report conclusions and recommendations ................................................................... 35
Moving forwards ........................................................................................................... 35
Annex A – A list of identified best practices ................................................................... 38
Annex B – Strategy statements ........................................................................................ 44
Figure 1 - Report Summary Infographic ............................................................................ 13
Figure 2 - Breakdown of Energy Consumption ................................................................. 15
Figure 3 - Digitisation and Consumption ........................................................................... 17
Figure 4 - Hosting KWhrs Consumption............................................................................ 18
Figure 5 - E-Waste Results & Progression ....................................................................... 22
Figure 6 - Percentage to Landfill and Weight .................................................................... 24
Figure 7 - Web Conferences Uptake ................................................................................ 25
Figure 8 - Best Practice Delivery ...................................................................................... 26
Figure 9 - Best Practice Maturity ...................................................................................... 26
Figure 10 - Departmental Best Practice Scores ................................................................ 27
Figure 11 - Bottom 5 Performing Best Practices ............................................................... 28
Figure 12 - Top 5 Performing Best Practices .................................................................... 28
Figure 13 - Strategy Statement Completion ...................................................................... 29
Figure 14 - Participation Graphic ...................................................................................... 38

5
Foreword This annual report marks the ten-year anniversary of Greening Government ICT. It is worth reflecting on what has been achieved, what we have discovered, and where the information gaps still are.
Our successes are many:
• Just 0.023% of our ICT waste was disposed of to landfill, all but meeting our target of Zero waste to landfill by 2020, through large increases in reuse and recycling”
• Key government departments reached the committed maturity level 3 by 2015 (practiced) – maintained through an annual growth in best practices, embedding sustainable ICT as business as usual across the DDaT profession
• We have more accurately recorded and reported the carbon footprint of our digital services, not just on our estates but also the services we consume, including public cloud. In our cloud work we have been leading globally on the transparency agenda.
• We have increased buy-in across all government so that for the first time, all departments, agencies and bodies are represented and reporting
During this period government’s ICT and digital services have largely been considered as getting ‘greener by default’ as we adopt new technology and services that are smaller, lighter and more energy efficient. In addition, our annual reporting initially showed a decrease in carbon footprint. However the truth behind these figures is that our footprint and impact were being offshored to our suppliers and service providers and increasing.
We addressed this in the 2018 strategy by widening the scope of our footprint reporting to include scope 3 emissions (from the services we consume). I am pleased that many providers have joined us on this journey and are now sharing service specific carbon data for the first time. This is something we are leading on globally.
With the fourth industrial revolution (4IR) will come an increasing use of ICT devices and data which could easily lead to increased waste, energy use and rare earth element mining required to build and maintain these services. The 4IR also brings new advances such as Artificial Intelligence (AI), blockchain and Internet of Things (IOT) which have been touted as providing a huge carbon benefit.
In terms of Policy, for the first time, we have included sustainable ICT within the update of the Greening Government Commitments 2021-2025 (GGC), and the annual reports and accounting process (ARA). In addition, all ICT and digital projects and programmes subject to the spend controls process will be obligated to include sustainable ICT, as part of an updated Technology Code of Conduct measured in order to progress with the Government Digital Service (GDS).

6
The Greening Government Commitment data is presented below in terms of key reductions since 2010. The reductions have been enabled through the digitisation of government operations. It has been shown that ICT and digital services produced increased CO2e (carbon dioxide emissions) this year but arguably saved many multiples of this amount annually. In total the ICT footprint represents less than 20% of current estates total which does not factor in the huge carbon savings from reduced business travel and paper consumption.
GGC Topic Baseline Current Change Enabling ICT Best Practice
Domestic flights
171000 flights
123000 flights
-28% Digital First Travel Policy
E-conferencing
Estates Carbon Footprint
3,052,553 MT CO2e
1,641,131MT CO2e
-46.2% Closure of on-premise data centres and introduction of more energy efficient and mobile end user devices.
Paper consumption
8.2 Million reams
3.4 Million reams
-59% Digitisation, automation, better suited end user devices, collaboration tools etc
ICT Footprint (inc services)
182,923 MT CO2e
306,443 MT CO2e
+67.5% Working with all hosting/cloud suppliers to share service-based data.
We are supported in our work by agencies, academia, charities, technology industry and professional bodies. We have engaged with UK devolved administrations and the wider public sector, including the NHS, and many county councils, to help green their operations. At a European level we have engaged in the widely influential EURECA (say what this is) project as well as development of the EU Green Public Procurement criteria. Post Brexit our opportunities are expanding, and we are joining a new international coalition on green ICT called CFIT (Circular and Fair ICT Pact) led by the Dutch government as well as co-leading Green ICT as part of the hugely influential Digital Nations workstream with the Canadian government. We are working of course, to ensure the narrative is addressed at COP26 as well as the G7 and G20.
This year’s report brings the story up to date. We have been able, with the support of the cloud industry, to collect service-based cloud carbon data for the first time from public cloud providers. This builds on our knowledge from private cloud and existing hosting data.

7
The opportunities are huge for further improvements and efficiencies across the government hosting estate, but we must ensure our move to more efficient operations is coupled with the data and KPI’s to support our sustainability objectives and wider government policy.
The role of Data and Digital is explored and will be developed through the work of the two new National Data and Digital Strategies led by DCMS. Through the STAR we will help ensure that both Data and Digital help us understand and hopefully mitigate the climate crisis. This will be especially apparent in the 2020/21 annual report as it will capture the year that digital services replaced office working, commuting and business travel.
My thanks must go to many industrious thought leaders on sustainable ICT that formed and pushed this group and its work into the mainstream. We have been proud to be at the vanguard of this increasingly crucial topic and look forward to engaging internationally to ensure that ICT and Digital services are part of the solution, and not part of the problem.
Chris Howes
Defra CDIO

8
Executive summary As the lead government department for sustainable information and communications technology (ICT), Defra recognises that the carbon footprint of ICT worldwide is on par with the aviation industry and is expected to increase. ICT waste is also a growing worldwide issue and supply chains are under increased scrutiny for their use of modern slavery, conflict minerals and rare earth elements, as well as their contribution to, and impacts from, climate change.
The HMG Sustainable Technology Advice & Reporting (STAR) team ensures that government ICT services are designed, delivered and operated with sustainable principles at their core. This includes our procurement choices (which cover not just the origin of the kit we buy but how it’s transported, the packaging in which it’s delivered and whether or not it can be reused or recycled when no longer required), how our ICT is used (ranging from kit which uses less energy to technology which reduces the need for travel) and disposal (including repair, reuse and recycling).
These sustainable practices help to improve business resilience and end user experience. They also help guarantee that ICT services deliver real and tangible benefits which support delivery of the wider government strategies and commitments such as the 25 Year Environment Plan (25YEP), Net Zero and the UN Sustainable Development Goals (UN SDG’s).
The ICT estate on government property has become more energy efficient as departments have moved into service provisions driven by Cloud First and Digital Policies. Therefore, the energy impact of government ICT has moved from not just government estates, but to those of our service providers. This is also true when you consider the ICT waste and social impacts from the service provisions.
The Sustainable Technology Strategy 2020 was published in December 2018 to meet the challenge of measuring governments ICT impacts and benefits in a services world. It provides best practices and guidance to support the delivery of Sustainable ICT within government spend control processes. Furthermore it challenges departments to focus on areas for improvement through the delivery of a departmental sustainable technology strategy statement.
Performance highlights;
• Progress towards net zero ICT and digital services: Increased availability of data about footprint, cloud hosting, and green energy mix.
• Increasing participation: For the first time every department has provided a return. At least 25 departments, agencies and bodies provided returns up from 21 the previous year. The majority also set strategy statements.

9
• Increasing maturity of our operations, More departments engaging and 36/63 (58%) of the identified and updated best practices have already been delivered or are in delivery
• Global leading action to identify our carbon footprint in the cloud. We asked data centre and cloud hosting suppliers formally for energy consumption data relating to the services we have consumed with data provided for many departments.
• Focussing on the circular economy: Just 0.023% of ICT resources went to landfill an improvement from 0.8% in 18/19 and moving towards our zero to landfill target and a more circular model of consumption. Increases in reuse and recycling have also been recorded.
• Generating income: In excess of £1m income from reuse/sale.
• Digital first travel policies: At least of 18.3 million e-conferences were held across government helping minimise the need to travel. An increase from 3.5 million recorded in 18/19.
• Setting direction: Strategy statements setting out proactive sustainable ICT projects and programmes received from majority of contributors and signed by departmental CDIO’s.
• Evidence towards a net gain provided by digital services. The ICT and digital services carbon footprint has increased but has enabled much larger reductions in carbon from business travel and estates.

10
Introduction During 2019/20 departments continued their journey towards using more sustainable digital services, technologies and best practices, in line with the 2018- 2020 Greening Government; Sustainable Technology Strategy. This follows on from the change in reporting in 2015/16 towards the delivery of best practices and therefore tangible outputs. This enhances the building blocks of policy, strategy, skills resource and processes that constituted the previous maturity models.
This year is the second and final year of reporting against the 2018 strategy. Updating the Greening Government: ICT Strategy 2011 the strategy commits departments to a continuation of calculation of their ICT energy footprint (including services consumed), ICT waste reporting and delivery of best practices until 2020.
The Sustainable Technology Strategy set out three key challenges. Our progress against each is outlined below:
Challenge Progress
1. To describe how government best procures and exploits ICT services for sustainability through the provision of published guidance setting minimum sustainability standards for our service providers.
Using reporting data from the current strategy our new Greening Government: ICT and Digital Services Strategy 2020-2025 sets out six key tech industry endorsed business rules aligned to key policy goals such as net zero, circular economy, modern slavery and social value. The business rules are designed to be placed into new and existing contracts.
2. To provide evidence that delivery of Sustainable ICT is a key enabler to government transformation programmes, plans and commitments and wider government imperatives supporting the transparency agenda
Our reporting has improved through increased engagement and transparency with our delivery partners across government. From 2021-2025 Sustainable ICT will be embedded for the first time, within the Greening Government Commitments (GGC) to show how digitisations has helped enable reductions in travel, energy use and waste. GGC data is also shown as a comparison in this report.
3. To provide a guiding view of how government can meet the sustainability challenges and opportunities provided by digital technologies and digitalisation
The GGC: ICT and Digital Services strategy defines what is required from Digital, Data and Technology (DDaT) professionals, as well as the wider procurement community to meet sustainable ICT challenges and opportunities. In addition, we are producing a number of guides on circular ICT, modern slavery and cloud.

11
All the materials are published on gov.uk through the Technology Code of Practice (TCoP) and/or a government wide collaborative shared working area
This change in approach to contracting ICT services requires the STAR to shift its focus from aiding departmental procurements to also working with Crown Commercial Services (CCS) and centralising controls processes such as those managed by GDS/CDDO, to deliver more sustainable ICT services.
This report:
• Conveys department’s assessments of progress against the strategy for the sustainability benefits and impacts of their digital services and technologies.
• Details the work done by the STAR throughout 2019/2020 and since our work began in 2010.
• Identifies areas where departments remained challenged in adopting best practices to reduce the sustainability impacts of their technology services.
• Sets out broadly the direction for the next 5 years.
In total 25 Departments/Agencies have been engaged in this process up from 21 in the previous year and 14 the year before. All contributors provided returns for best practices, ICT energy footprints and ICT waste figures. A majority were also able to provide a strategy statement signed by their CDIO’s. The variation can be accounted for by the number of different stakeholders across departments that need to be contacted in order to complete returns. In some organisations this can be a single point of contact, while in other larger departments this can be more of a challenge across multiple tiers, industry providers and agencies.
A summary of the results is provided in the infographic figure 1. The following results are presented.
• 25 Departments/Agencies provided returns – an increase of 4 from last year showing improved collaboration across 474,550 members of staff.
• 37/63 (59%) of the identified & updated best practices have already been delivered or are in delivery
• A minimum of 18 million e-conferences were held across government helping minimise the need to travel. Up from 3.5 million in 2018/19
• Only 0.023% ICT Waste to landfill an improvement from 0.8% in 18/19 and 2.09% in 17/18 and moving towards our zero to landfill target and a more circular model of consumption.
• Generated in excess of £1m income from reuse • A more accurate ICT energy consumption figure was achieved through
amending and simplifying reporting processes.

12
• All hosting suppliers, including cloud, formally asked to provide energy consumption/carbon data relating to the services we are consuming.
• Strategy Statements endorsed by CDIO’s, setting out proactive sustainable ICT projects and programmes received from majority of departments.

13
Figure 1 - Report Summary Infographic

14
ICT and digital services footprint This is the ninth year that the STAR has gathered figures for the IT operational energy footprint. This is the assessment, if not measurement, of the energy and carbon taken to run our IT and digital services. The STAR again used the tool developed with the Joint Information Systems Committee for Higher Education (JISC) but this was supplemented with single data requests from building management systems, and hosting providers, where possible, to achieve more accurate hosting data. We asked that returns also included data from externally hosted data and cloud providers in order to gain as true a picture as possible. Finally, where known, we asked for energy mix breakdown data. The results as presented are based on the individual departmental returns.
Key highlights
• 23 departments/organisations refreshed their footprint figures, an increase of 5 from last year.
• The assessment covered a similar number of staff to last year.
• An increased and more accurate footprint of 2783kWh/staff has been recorded compared to a previous figure of 2571kWh/staff. Carbon has also increased, but at a lower percentage rate.
• Power consumption of server rooms represents 35% of the total footprint figures. If you also add in the network equipment, the figure is 61%.
• Returns from two departments have been carried forward to provide a comparable assessment to last years.
• Carbon conversion factors have been updated to the latest figures.
A view often levied at Sustainable ICT work is that we are “getting greener by default” and while the statement does hold some truth it certainly does not tell the entire picture. “Cloud first” and digital agendas, policies and strategies have led to the closure of legacy and often inefficient, on-premise data centres and into often more efficient cloud, private cloud or co-located datacentres. Prior to 2018, our reports showed energy from server rooms dropping significantly as a proportion of the energy use per member of staff across the civil service from over 50% to around 30%. The push this year for more accurate returns has yielded a combined figure of 61% power use for server rooms and network equipment. This leaves 39% for end user devices, peripherals, printers, AV and telephony.
Therefore, the impact and opportunity for sustainability benefits are firmly in the infrastructure arena and can be seen in Figure 2 where power consumption of server rooms represents 35% of the total figures. If you also add in the network equipment, the

15
total figure is 61%. This also indicates that areas for focussed activity should heavily be in the procurement space i.e. with whom we do business and how much kit we are buying and using, and less so in perhaps measuring the energy consumption of the equipment we are purchasing/leasing. Get it right up front.
Figure 2 - Breakdown of Energy Consumption

16
By understanding their digital footprints departments are able to base transformation decisions on this data and link departmental sustainability objectives to this. HMRC provide the following example.
Figure 3 demonstrates how digitisation has increased total energy consumption. This should not be a surprise and is widely reported across the industry. The period 2016-2020 is presented with annual increases in cost, carbon and energy use. The “greening of the grid” from a vastly increased percentage of renewable energy produced by the UK, coupled with the efforts to decarbonise the data centre industry mean that the 300% increase in energy consumption has only led to an 80% increase in carbon during the four year period.
Case study 1 – HMRC net zero and ICT
This GGC ICT work will help HMRC comply with the Greening Government Commitments, Government Buying Standards, the government's Cloud First policy and the WEEE Directive. We have highlighted through our annual reporting that we would benefit from further focus on our sustainable procurement activities, printing activities and further embedding into our business as usual processes. We are leading this work from our Chief Digital Information Office working closely with stakeholders across the department.
By 2022 we plan that IT contributes to HMRC's target to reduce their office's energy consumption by 38%. Through energy efficient IT, removal of old redundant kit, rollout of modern IT equipment and to move onsite datacentres to Cloud.100% HMRC datacentres are to close by 2022

17
2016 2017 2018 2019 Change
Energy Use (kWh/y) 395774692 451662825.1 866348706.3 1198919598 803144905.7Energy Cost (£/y) 38390145 43811294.03 121288818.9 167848743.7 129458598.7CO2 emissions (kg/y) 182923105 208754041.1 245237328.3 306,443,849 123520744.2
0
200000000
400000000
600000000
800000000
1E+09
1.2E+09
1.4E+09
Energy Use, Cost and CO2
Energy Use (kWh/y) Energy Cost (£/y) CO2 emissions (kg/y)
Figure 3 - Digitisation and Consumption

18
Data availability for hosting has been variable. In many cases a carbon figure was supplied rather than a consumption figure. Furthermore, the workings behind that carbon figure were not always clear. Figure 4 represents the makeup of our hosting estates and services. The opportunity to decarbonise the government ICT and digital footprint is represented by the blue box in figure 4a and the bar chart in 4b. Across government in 2019/20 and the services we consume, local office based servers consumed 4 Million kWhrs, our services based in the cloud consumed 64 million kWhrs, our traditional hosting and colo consumed 122 million kWhrs and our hosting on government estates consumed 287 Million kWhrs.
The digital services footprint is based on the data available. This is a mixture of fact (i.e. data from building management systems and from contracts) and assumptions, i.e. cloud data from public cloud providers where assumptions have had to, by necessity, be made on usage in the cloud model.
Figure 5b - Hosting kWhrs Consumption Data
286768018.4
122767319.2
6426523.317
4144263
0 100000000 200000000 300000000
On-premise Server room/Datacentre (GovernmentEstate)
Off premise Data Centre or Hosting facility (Non-Government Estate)
Other Cloud
Other Servers i.e Local Application Servers (LOAPS)
KWhrs
Host
ing
Type
ENERGY CONSUMPTION
Figure 4a - Hosting kWhrs Consumption Image

19
Footprint data summary There are some large disparities in the data across departments. We altered the reporting in 2018 to try and improve accuracy but the results are ultimately reliant on departments providing accurate and complete returns. The importance of this data in informing government Policy requires a more formal approach and we will be seeking independent auditing of the returns from 2021.
Industry hosting A formal request to all government hosting/cloud service providers was issued this year for carbon data for the service consumed, and not the organisation figures many would already be reporting. This was as part of the annual reporting by each individual department for the second year. In previous years we had run this as a best endeavours exercise only. The “carbon in the cloud” data has been provided for the first time, but due to non-disclosure agreements we have amalgamated all government cloud data. We hope in future reports to extract out departmental and hosting provider footprints. We are continuing to work with suppliers, industry, academia and professional bodies to develop advice and guidance on how best to account for our footprint in the services we consume. It is vital that we can accurately demonstrate how ICT is enabling wider sustainability goals and in order to do that we need an accurate service-based footprint.
Home workers To better calculate an accurate footprint for civil servants wherever they are working, we asked all contributors to provide data relating to the number of full time equivalent (FTE) homeworkers. Unfortunately, again this year, the data was not available consistently enough to include it within this report. We will endeavour to refine the question and provide a more accurate figure in next year’s report as this will be vital to ensure we provide as accurate a figure of our footprint as we can.
The legacy estate Several departments have reported larger energy/carbon footprints on their estates this year. These results have been highlighted by the change in recording, but they have also highlighted the size of the legacy footprint that exists in addition to our cloud and industry hosting footprint. This area will be further investigated in next year’s report.

20
Legacy transformation and technical debt Data from this report, and its predecessors has fed into policy decisions of legacy transformation and technical debt such as the cloud first policy led by Cabinet Office. Many departments utilise this data to make their own decisions on legacy transformation, demonstrated in Case Study 1 from HMRC, 2 from MoD and 3 from The Insolvency Service.
Case study 3 - The Insolvency Service sustainability transformation
We've moved to a new organisational model within our Digital Technology Services Directorate, with a change in leadership as well as a more commercial and governance driven approach to the delivery of technology services across the Insolvency Service. As well as modernising the way we do things, we've moved a Service Integration and Management (SIAM) model, with an increased focus on contract management and service delivery through a number of providers. We've also started a programme of work to address technical debt, with a view to not only improve the effectiveness and efficiency of our technology landscape (specifically our line of business applications), but also to ensure greener and more sustainability conscious direction overall.
Case study 2 - ICT within MoD climate change plan
MOD must mitigate the environmental and socio-economic risks in its digital estate whilst seizing opportunities to improve sustainability through new digital services. This will be achieved through the Sustainable Digital Technology and Services (SDTS) Strategy and its companion Delivery Plan.
MOD is currently baselining its carbon footprint as part of the MOD Climate Change and Sustainability Plan. This work is building on the data provided in STAR reporting in 2019

21
Waste (resources) The STAR conducts annual reporting on the ICT waste collected across government and how it is handled and ultimately disposed. It goes above and beyond the Greening Government Commitments ICT waste reporting in that it identifies waste types and breaks down in finer detail how each element is extracted.
Key highlights for 19/20 are;
• 25 departments/organisations submitted statistics, 4 more than last year.
• Only 0.023% to landfill an improvement from 0.8% in 18/19 and 2.09% in 17/18 and moving towards our zero to landfill target.
• Generated in excess of £1m income from reuse
• Total items collected in 19/20 increased to 1.84m Kg from by 1.79m Kg in 18/19.
The approach by departments to dealing with its end of life ICT varies across government. All departments contract out the responsibility. Many pay for recycling services then receive a rebate on value reclaimed from the raw materials and rare earth elements, some allow the waste to be taken for free leaving the contractor to reclaim any costs through resale, and some others offer a mixture of the two. What is clear is that there isn’t a consistent view, or process, or guidance/policy and with the amount of waste approaching two million kilograms there is an opportunity for government to adopt a smarter, coordinated, ethical and perhaps more lucrative approach to managing its ICT lifecycle.
Examining the data a little further, Figure 5 reveals the largest amount of ICT waste recorded to date in 2019/20. This reflects government ICT transformation programmes towards smarter working and cloud provision for data hosting as we move to mobile devices and hosting services, removing our legacy infrastructure. The reuse figures for sale/charity are from just four departments. We will be seeking to share this best practice across the remaining departments. A circular model of ownership would reduce waste figures from a government estates perspective. We are rapidly moving towards our zero to landfill target and simultaneously increasing the amounts we recycle and more importantly reuse. Only 0.023% ended up in landfill an improvement from 0.8% in 18/19 and 2.09% in 17/18 and a figure close to 6 percent when reporting began in 2011. Figure 6 best demonstrates this progression with the blue downwards trend line. The amount of e-waste continues to increase from a figure of 1 Million Kg to 1.8 Million Kg today. Case Study 4 from Defra demonstrates a best practice approach for resource management.

22
Figure 6 - E-Waste Results & Progression
0.00
200,000.00
400,000.00
600,000.00
800,000.00
1,000,000.00
1,200,000.00
1,400,000.00
1,600,000.00
1,800,000.00
2,000,000.00
Items Reused Items Recycled Items Recovered Items to landfill Total
Was
te T
otal
s in
Kg
Waste Treatement and Year
ICT Treatement at End of Life
2015/16 2016/17 2017/18 2018/19 2019/20

23
0.00
0.50
1.00
1.50
2.00
2.50
3.00
3.50
4.00
4.50
0
5000
10000
15000
20000
25000
30000
35000
40000
45000
2015/16 2016/17 2017/18 2018/19 2019/20
Perc
enta
ge to
Lan
dfill
Kg to
Lan
dfill
Year
Landfill Weight & Percentage

24
Figure 7 - Percentage to Landfill and Weight
Travel Data is now freely available from e-conferencing providers on volume and location of calls there is another clear opportunity here for cost savings from travel budgets and provision of equipment suitable for more flexible working. Our strategy commitment to increase usage of web-conferencing has been successful. Figure 7 demonstrates the vast number of this type of communications across government with an increase from under 400,000 last year to 1.8 Million today. This is also likely an underreporting as Google were unable to provide usage data this year. These figures have also been reported in the GGC annual report. It is expected in the 2020/21 report that figures will again increase due largely to the Covid pandemic. This enforced change has helped also change longstanding cultures and attitudes to remote working. Our data will help departments and government make important decisions on “building back better”.
Case study 4 - Defra circular ICT commitments
By 2025 -We will deliver approaches to reducing ICT waste through the waste hierarchy and product hierarchy by ensuring that materials are kept in productive use for longer, design and purchase sustainable products and services and reduce consumption of resources.
Seeking 100% reuse through (reuse internally, donations and remarketing) and recycling for reuse to build new components

25
Best practices – an overview Departments continue to strive for the most efficient and effective ways of implementing best practices and use of technology across the three sustainability pillars. Best practices have also been widely accepted for benchmarking and represent outcomes of repeated and contextual actions.
Key Highlights;
• 25 Departments/Agencies provided best practice returns – an increase of 4 from last year
Figure 8 - Web Conferences Uptake

26
• 38/63 (58%) of the identified updated best practices have already been delivered or in delivery.
Overall the adoption of best practices has seen a year on year improvement since 2016 with departments delivering an increasing number of sustainable ICT actions and activities that are providing real benefits. This year a total 63 best practices have been identified and can be viewed in
Annex A and Annex B. Best practices achieved by all contributors in 17/18 were again removed from this year’s list Looking across government in Figure 8, 58% of best practices have already been delivered or are in progress.
Figure 10 - Best Practice Maturity
In Figure 9, Energy remains the most delivered best practice category (36%) and Sustainable Procurement the least (17%). The types of activities recorded as delivered have been focussed on the delivery of the technology. These include actions on reducing the legacy data centre estates and rolling out managed print. Less focus seems to have been placed on activities that could be classed as outside ICT delivery scope, for example, sustainable procurement. The scores are allocated for the delivery of best practices with higher scores allocated for complete availability to all users. It is worth noting that the number of activities is not equal for each category, it is however true to say that several
Figure 9 - Best Practice Delivery

27
departments did report a lower percentage completion of best practices against Waste, Travel and Sustainable Procurement.
Delivery of these best practices varies across departments and organisations but there is also a lot of consistency across delivery of individual best practices. Figure 10 demonstrates overall performance for each department with scores remaining largely unchanged for the last 12 months. Departmental performance is between DWP at the lowest end with a score of 55 and Defra at the top with a score of 163 out of 200.
Figure 11 - Departmental Best Practice Scores
Best and least performing best practices Figures 11 and 12 display the top five and bottom five best practices in terms of uptake. It is here we start to see a key theme of the results emerging. The top five are technologies that when delivered, should result in sustainability benefits such as low power modes and global print options. The bottom 5 are almost all additional activities to ensure any sustainability benefits from delivering technology are achieved such as paper free days or providing CO2 savings to meeting hosts. A full chart of best practice performance is included in Annex B.
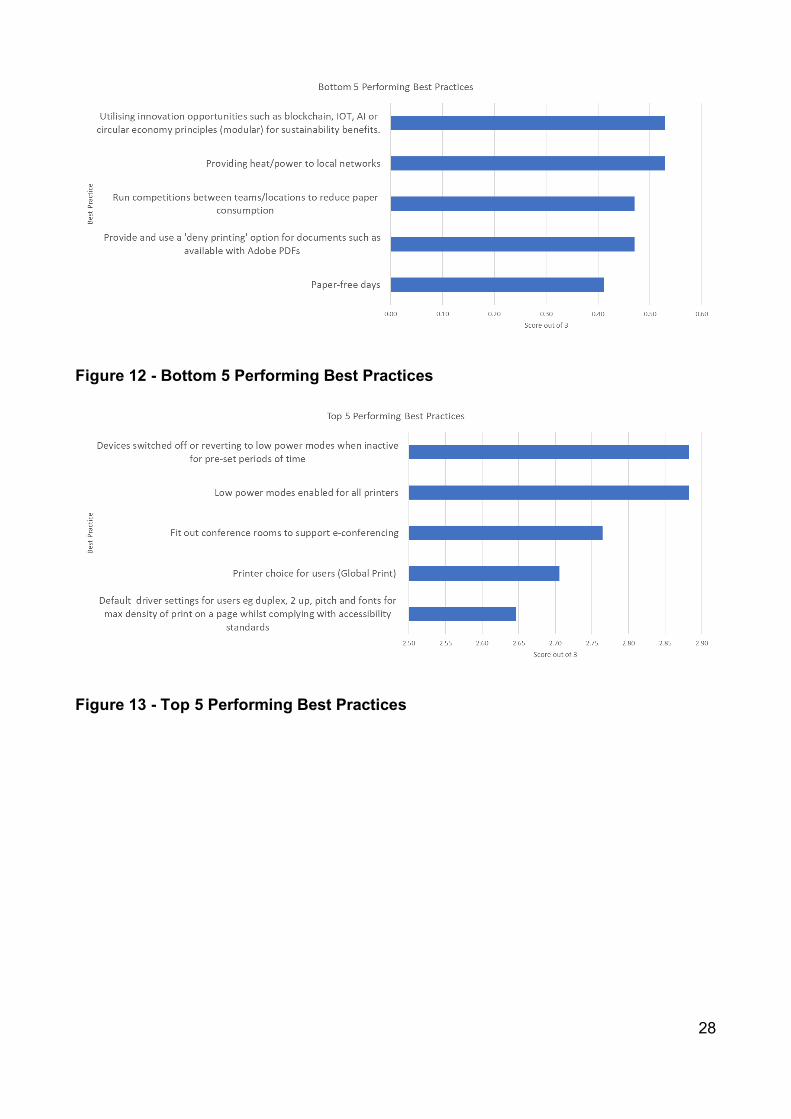
28
Figure 12 - Bottom 5 Performing Best Practices
Figure 13 - Top 5 Performing Best Practices

29
Departmental strategy statements This is our second year of producing strategy statements and responses have been received by most departments (some are merged). Signed off by members of the Technology and Digital Leaders Network (TDLN, government CDIO/CTO’s) they set out proactive departmental intentions for delivering ICT in line with sustainable outcomes. Progress against these aims and objectives have been included in the case studies scattered throughout this report. Furthermore, the statements will be used as part of the GDS Spend Controls Process to monitor progress. The statements are presented in full in Annex B. Figure 13 presents an increase from 8 last year to 15 in 2019/20.
Case study 5 – Cabinet Office sustainability targets in transformation
Our Cabinet Office Enterprise Technology Strategy 2020-2025 has reset our approach to technology in a transformational way. To date we have had inflexible and outdated technology and have been tied to lengthy, inflexible contract with single IT providers. The Strategy standardises and champions dynamic flexible systems, including coherency over end-user device refresh models to reduce waste. The Strategy also aims to bring the best technology services to the department, taking advantage of the improvements and cost savings which come from using commodity cloud-delivered services. Key targets:
1. Migration to public cloud seeking 90% energy reduction.
2. 75% reduction in network activity moving away from “always on” VPN.
3. Automation seeking reduction of 50% in routine support and management tasks.
Figure 14 - Strategy Statement Completion

30
Paper reductions Many departments contuse to utilise digital to reduce the use of paper. Paper reduction targets, in line with the Greening Government Commitments form part of the majority of departmental strategy statements. The following case study from the Crown Prosecution Service is a great example.
Case study 6 – CPS paper reduction plans for courts
We are introducing digital trial bundles for CPS staff in court, meaning that CPS staff no longer require printouts of case information in court. CPS are also looking to introduce Digital Jury bundles. This will mean that we no longer need 12 x copies of all case information for trials with a jury, although this aspect is a long-term aim.

31
Supporting government agendas and commitments. The GGC data is presented below in terms of key reductions since 2010. This was enabled through the digitisation of government operations. IT and Digital services produced 306,443MT CO2e this year but arguably saved many multiples of this amount annually and makes up less than 20% of current estates total. In addition, this doesn’t take account of carbon savings from business travel.
GGC Topic Baseline Current Change Enabling ICT Best Practice
Domestic flights
171000 flights
123000 flights
-28% Digital First Travel Policy
E-conferencing
Estates Carbon Footprint
3,052,553 MT CO2e
1,641,131MT CO2e
-46.2% Closure of on-prem data centres and introduction of more energy efficient and mobile end user devices.
Paper consumption
8.2 Million reams
3.4 Million reams
-59% Digitisation, automation, better suited end user devices, collaboration tools etc
ICT Footprint (inc services)
182,923 MT CO2e
306,443 MT CO2e
+67.5% Working with all hosting/cloud suppliers to share service-based data.
Departments, agencies and bodies are committing to Net Zero objectives in advance of the 2050 date enshrined in law. Here is how the Met Office are taking forward their work.
Case study 7 - Met Office digital to meet net zero goals
We have highlighted through our annual reporting that we would benefit from further more detailed focus on a number of sustainable activities. We are leading this work from our Senior Management Team, working closely with our AD Governance Risk and Assurance, Environmental Adviser and Property Management. This work is being taken forward by a Net Zero project.

32
Climate adaption and resilience This topic is a key measure in the new strategy published Sept 2020. The best practice reporting contains two that ask if departments are aware and monitoring locations of their ICT ecosystem and supply chains. The average score was just above 1 out of 3. An example of an organisation that is proactively working on this is provided in the following NHS Digital Case study.

33
Case study 8 – NHS D climate adaptation and resilience
Adapting our services to be resilient in the context of a changing global climate requires both short term business continuity planning as well as a longer term strategic focus on resilience.
Business continuity processes at NHS Digital ensure that our contracted data centres have flood and heatwave risk management measures in place. However, our new site in Leeds, which we move into in 2021, is directly next to a river that has flooded in recent history. Appropriate mitigation measures will be required to manage this risk, although we will not host our data centres in this building.
Climate breakdown will adversely affect the NHS and we will take a precautionary approach, ourselves – how can NHS Digital services be resilient to the impacts of climate breakdown while also bringing resilience to the health service?
The global COVID-19 pandemic has involved huge amounts of resilience planning and learning. The pandemic mirrors one of the forecast public health impacts from climate breakdown – rises in infectious diseases. It is a dress rehearsal for the coming decades.
As part of formalising our climate change risk assessment during 20/21 we will investigate processes like the Climate Related Financial Risk Disclosure to quantify operational delivery risk and we will contribute to the health service strand of the UK Climate Change Commissions National Adaptation Plan.

34
Our metrics for success The following list details our targets for 2018-2020 and our progress and successes.
• ICT Waste – Zero to Landfill and an increase in re-use. A target we have arguably met, with reuse is on the increase with tangible benefits with a return income to HMG.
• A reduction in our ICT carbon footprint from moving to more efficient products and services. We have increased buy-in and simplified reporting to allow for a more accurate footprint. ICT will have a footprint and we are working with our suppliers to establish just how best to record and report that.
• E-conferencing services adopted as preferred meeting technique working towards 40% of government meetings conducted without attendee travel required – We have reported 18 million e-conferences in this year’s report, an increase from 3.5 million the year before, and we are confident that this number is underreported.
• All services risk assessed, at procurement and through life for climate, geopolitical and sustainability risks, including social such as modern slavery. Sustainable Procurement is underutilised and needs maturing. This has been addressed in the 2020-2025 strategy with the establishment of new business rules.
• Aligned to the Greening Government Commitments The 2021-2025 now include a requirement for departments to report on progress against the GGC: ICT and Digital Services Strategy 2020-25. This report and results are aligned directly to the GGC’s to show how ICT is enabling the meeting of these government commitments.
Other key non-monetised benefits which have been tackled in the 2020-2025 strategy include
• Increased user satisfaction from cleaner, greener products and services
• Increased resilience through using renewable energy and removing waste from the system/resources
• Opportunities provided by new and existing digital and technology services, including data, are fully exploited to achieve a net gain for the environment and society.

35
Report conclusions and recommendations There are some key themes that emerge throughout this report.
1. Increased consumption – ICT footprint and waste totals have increased, recognising the digitisation of our operations.
2. Increased supplier engagement – We have increased our knowledge of our digital footprint. There is a need for closer engagement with our suppliers and upskilling in the procurement area to ensure we reduce waste from the system and maximise our assets, especially in areas such as cloud data and resource management.
3. Improved resource management – Our zero to landfill target has arguably been met, and we continue to improve reuse and recycling figures. However, there is an opportunity for government to adopt a smarter, coordinated and potentially more lucrative approach to managing its ICT lifecycle especially at end of life
4. Data gaps – The importance of the STAR data to drive and inform government policy requires a more formal approach to ensure the data collected is as valid and representative as possible. There is a need to focus the approach and target information gaps such as cloud data, waste “recycling” data and yearly variations in returns.
5. Sustainable procurement - Sustainable procurement is not well adopted and requires urgent focus across government to best manage risks, ensure business resilience and deliver sustainable outcomes. We are actively working across government to improve this.
Moving forwards The STAR will continue to support departments in improving the sustainability of their technology through to 2025 and beyond. As well as sharing assessments and case studies, the group has met four times during the year and have published the new Greening Government: ICT and Digital Services Strategy 2020-2025. This supports central government programmes providing clear guidance and tools to departments on how to reduce the sustainability impacts of their digital services and technologies
With the efficiency agenda impacting the whole public sector, the STAR will continue to reach out to engage with the wider Public Sector to enable other organisations to reduce their sustainability impacts and achieve improved efficiency through use of ICT and digital services. It will look to pass on its skills and experience to help other public sector staff improve their awareness of the sustainability and efficiency opportunities from using

36
Technology and Digital services – exploiting further their legacy estate as well as moving to use new digital, more sustainable services.
Our new strategy aligns directly with the work the GGC’s 2021-2025. This is how it works:
1. We’ve set clear targets and KPIs relating to our key sustainability Policy objectives and commitments across government.
• For Net Zero by 2050 (or earlier)
• For the resources and waste strategy (circular economy) and the 25 year environment plan (YEP)
• For the modern slavery commitments and wider social value pillar obligations
2. We are increasing accountability and visibility
• To ensure this strategy doesn’t become shelf ware we have included the principles within the update of the greening government commitments, and the annual reports and accounting process.
• In addition, all ICT and digital projects and programmes subject to the spend controls process will be obligated to include sustainable ICT, as part of an updated Technology Code of Conduct measured in order to progress with the Government Digital Service (GDS).
• To allow departments to meet these wider targets balanced against their own policy objectives, we promote flexibility through the production of Chief Digital Information Officer (CDIO) signed strategy statements. Each department will commit to actions and measured aligned to the strategy and will report on progress through the annual reporting run by the STAR. Furthermore, the data will be made public and open.
3. We are building partnerships and expertise across government
• We can only achieve these goals through partnership and collaboration with our main and SME suppliers and teams across government. The STAR will continue to support all government departments, the wider public sector and industry on the delivery of this strategy.
We thank government departments, agencies and bodies for their insight and endorsement of this report, in particular: Figure 14 represents participating departments, agencies, bodies and supporters.
• HM Treasury • Department Health and Social Care • Cabinet Office

37
• Ministry of Hosuing Communities and Local Government • Department of Business, Energy and Industrial Strategy • Ministry of Defence • Crown Commercial Service • Department of Environment Food and Rural Affairs • HM Revenue and Customs • Crown Prosecution Service • Department of Culture Media and Support • NHS Digital • Home Office • Met Office • Highways England • Ministry of Justice • Department of Education • The Coal Authroity • The Environment Agnecy • Natural England • The Insolvency Service • The Climate Change Committee • Government Digital Service • Marine Management Organisation • Civil Nuclear Constabulary
With support from:
• IEMA • BCS • Carbon Trust • TCO • Universities of East London, Kings College London and Oxford • Tech UK

38
Figure 15 - Participation Graphic
Annex A – A list of identified best practices
Reducing energy consumption
End user services
Low power modes enabled by design for all end user devices and accessories
Devices allocated/chosen based on user needs minimising device proliferation - i.e. a single best device policy
Print services Low power modes enabled for all printers
Server/comms rooms
Raise server room temperature to highest permitted by devices installed
Participant in EU Code of Conduct for energy efficient data centres/ compliance with Cenelec standard CLC/TR 50600-99-1(lists same best practices as the CoC )
Virtualisation of applications

39
Regular engagement with DC managers to maximise benefits and hosting opportunities
Consolidation programme to maximise use of capacity
Connectivity WIFI enabled buildings to support hot desking inc GOV.Wifi
Agnostic office gateways to enable multi-organisation occupancy
Gateway for home ISP connections
Able to work outside the office and home using other WIFI networks
Removal of PABX and hand-sets as result of e.g. Unified comms/VOIP programmes
Network suppliers are participant in EU CoC for energy efficient Broadband
Changes to the Way We Work
Move from having own desk to hot desking across organisation's offices
Use of collaboration tools for sharing and working on content such as SharePoint online, Google docs with internal staff
Use of collaboration tools for sharing and working on content such as SharePoint online, Google docs with suppliers and external stakeholders
Guidance/advice/best practice available to support staff working at home
General good practice
Devices switched off or reverting to low power modes when inactive for pre-set periods of time
Devices no longer in use are disconnected and reutilised
Reducing travel
Make all types (audio, web and video) available to staff

40
E-Conferencing
Fit out conference rooms to support e-conferencing
Provide audio and video services on end user devices
Use the same system for end user devices and room based e-conferencing
Provide training and guidance on chairing and attending e-conferences
Behaviour Change
Feedback statistics to build booker, attendee and chairperson awareness of the carbon and energy footprints for different types of meeting, including the GHG emission comparison between Face to Face and e-conference meetings
Build Supplier use of e-conferencing in preference to face to face meetings through contract provisions, and include provision of statistics on supplier employee travel distance and modes, and consequential GHG emissions
Communicate sustainability benefits (cost, flexibility, carbon reduction) to staff from adopting collaboration tooling
Policy or Guidance on the use of VTC/e-conference as a preference to travel
Reducing consumption of paper
Managed Print Services
Printer choice for users (Global Print)
Proximity PIN printing for pulling prints down at the printer
Print statistics by location/by organisation/team/ individual
Deployments regularly matched and flexed to meet demand
Default driver settings for users e.g. duplex, pitch and fonts for max density of print on a page whilst complying with accessibility standards

41
Process for managing paper provision across locations and teams to avoid over-stocking
Behaviour change
Provide training/guidance on working without paper
Provide and use a 'deny printing' option for documents such as available with Adobe PDFs
Feedback paper consumption statistics at location or team levels respecting Data protection provisions, to raise awareness using real life comparators e.g. number of trees felled, volume of water used to produce the paper consumed
Run competitions between teams/locations to reduce paper consumption
Paper-free days
Push Digital by default for internal services e.g. T&S claims, as part of a Digital Transformation programme or as a separate initiative tracking paper reductions achieved
Push Digital by default for external customer services, as part of a Digital Transformation programme or as a separate initiative tracking paper reductions achieved
Reducing waste
Procurement Buy services rather than assets, enabling suppliers to re-use and share assets across their customers
Sweat the asset until lifecycle impacts for new outweigh continuing with old assets
Buy/deploy assets with high percentage of recycled material /components (in-line with GBS, or EU GPP)

42
Buy/ deploy recycled consumables (ensuring sufficient quality of print for accessibility requirements and no deterioration in printer performance) e.g. toner, cartridges, drums
Buy/deploy assets that are recyclable either partly or wholly (in-line with GBS, or EU GPP)
Recycling and Disposal
Follow Waste hierarchy when disposing of assets and require suppliers to do likewise
Provide statistics on e-waste tracking by weight and item for each level in the Waste Hierarchy
Work with suppliers to maximise end of life value and return £ to departments/gov from e-waste or reuse
Track E-Waste location ensuring responsible disposal/reuse at end of life
Sustainable Procurement
Assets (Purchased or Deployed)
Conduct a Sustainability Impact Assessment for all service/assets being procured
Adopt relevant government / EU/International/UK Government Buying Standards and accreditations where available and appropriate for type of ICT asset, covering as much of the lifecycle as possible
Build Sustainability KPI's into commercial contracts, for example the production of a quarterly/annual report, meetings set targets for reductions, highlighting ICT input and supply chain transparency
Community Sustainability
Community use of spare capacities eg WIFI, webinar services, processor/storage space
Providing heat/power to local networks
Require supplier support/help desks to be staffed with fair shift patterns and working conditions

43
Utilise Social Value Act in ICT procurements
Addressing other Sustainability impacts
Conduct an assessment of ICT service component locations as regards risk of severe weather events, including Service support team and data centre locations
Conduct an assessment of ICT service component locations as regards risk of material security, conflict minerals, geopolitical risks, including Service support team and data centre locations
Involvement in joint industry/government Sustainable Procurement boards to manage risks and promote good practice
Work with, or request compliance with industry bodies and groups such as Electronic Watch to responsibilities to protect the labour rights and safety of workers in our electronics supply chains.
Utilising innovation opportunities such as block chain, IOT, AI or circular economy principles (modular) for sustainability benefits.

44
Annex B – Strategy statements
UK HM Greening Government Assessment Workbook 2020
Department Name: HMRC Number FTE: 62008
Outcome (Vision statement from your departmental sustainability Strategy)
By 2025 we will have the working environment and experiences that support our ambitions to be a world class organisation. We will deploy ICT that enables alternative ways of working which will reduce the need for travel, minimise paper use and lower our energy consumption. We will seek digital solutions to the environmental, social and economic sustainability challenges that the department faces.
Scope and Rationale
The scope covers core HMRC and sustainable technology work is managed by the Chief Operating Office for CDIO.
This strategy will help HMRC comply with the Greening Government Commitments, Government Buying Standards, the Government's Cloud First policy and the WEEE Directive. We have highlighted through our annual reporting that we would benefit from further focus on our sustainable procurement activities, printing activities and further embedding into our business as usual processes. We are leading this work from our Chief Digital Information Office working closely with stakeholders across the department.
Objective CSF Action KPI Target

45
By 2022 improved IT contributes to HMRC's target to reduce their office's energy consumption by 38%
Energy efficient IT Regional centres open on schedule
Removal of old redundant kit Rollout of modern IT equipment Move onsite datacentres to Cloud Implement IT energy efficiency comms to staff
% of staff using PullPrint No. of HMRC datacentres No. of comms messages issued
100% of staff using PullPrint by spring 2022 when the last of the regional centres opens 100% HMRC datacentres close by 2022 x 2 comms messages issued annually
All new IT procured meets or exceeds the current Government Buying Standards (GBSs)
Government Buying Standards published
Review IT products procured in 2020-21 to check compliance with current GBSs Ensure all new IT procured meets or exceeds current GBSs
% of IT products procured in 2020-21 meets or exceeds current GBSs % of new IT procured meets or exceeds current GBSs
100% of IT products procured in 2020-21 meets or exceeds current GBSs 100% of new IT procured meets or exceeds current GBSs

46
Deploy new IT to support HMRC's commitment to reduce the need for travel in line with the Greening Government Commitments
New Greening Government Commitments published Regional centres open on schedule
Rollout of online meeting options to all users Training provided to all users on utilising online meeting software Data to meet KPIs is built into contracts
% of staff able to use online meetings No. of training opportunities available each month % of contracts, relevant to online meetings, that include robust data reporting on usage
Reduction in miles travelled, which supports Greening Government Commitments
Reduce Consumption of Paper in line with Greening Government Commitments
New Greening Government Commitments published Regional centres open on schedule
Rollout of PullPrint Rollout of Office 365 to allow use of digital storage instead of printing
% of staff using PullPrint
Reduction in sheets printed, which supports Greening Government Commitments
No IT waste sent to landfill and increase reuse in line with the waste hierarchy
IT can be reused Compliance with contract with EOL
Volume (tonnes) of IT waste sent to landfill Volume (tonnes)
No IT waste sent to landfill Increase % of IT waste reused/recycled in line with the waste hierarchy

47
of IT waste reused/recycled
Please record progress towards objectives and outcomes. 95% of staff using Surface Pros by end of June 2019 We have rolled out new technology to enhance our online meeting options – Skype and Team, meaning less need for travel to meetings and the use of online capability instead. PullPrint availability in 26 of 61 buildings has helped to reduce our printing by 44 million sheets in 2019-20 compared with the previous year No IT waste is sent to landfill
Signed….Anthony Collard TDLN Member
UK HM Greening Government Assessment Worksbook 2020
Department Name: MOJ Number FTE: 77000
Outcome (Vision statement from your departmental sustainability Strategy)

48
By the end of 2021 our aim in MOJ Digital And Technology is to build on our existing strategic goal of fixing the basics, by adding an explicit layer of sustainable reporting. We will ensure that our technology programs, our hosting platforms and our service design build in the ability to report on their sustainability impact and to use this to increase transparency and drive best practises.
Scope and Rationale
Sustainability work is handled in a number of places within D&T. Firstly we have our technology services team, responsible for end user compute, printing and private data centres. We have a separate hosting team that is focused on cloud hosting. Finally we have teams focused on service design, and digital transformation.
The rationale for the measures below is to embed the measures, reporting and behaviours into our department. There is good practise already in a number of areas, the focus in these set of objectives is to surface these and to build the processes so that we can have a consistent view across a set of sustainability objectives.
Objective CSF Action KPI Target
Establish clear ownership for the differing areas of sustainability we focus on.
Named individuals for cloud, technology, procurement who are responsible for delivering on a sustainability agenda.
Assign these responsibilites within the department N/A Clear ownership model for
next years report

49
Engage with hosting suppliers to ensure we have an understanding of the power consumption consumed and sources used by our digital services.
Regular updates from suppliers to enable us to understand the impact. The measure may supplier dependant.
Start engagement with suppliers
100% of suppliers can provide a power consumption update
All hosting providers can provide an report on power consumption.
Rationalise the hosting footprint, reducing the power usage of our combined estate.
Migrate services to public cloud, as per the MOJ digital strategy, and in doing so reduce the number of servers, and the associated power consumption. Additionally look to manage the cloud estate efficiently driving greater power savings.
Baseline the existing power usage so that comparisons can be made as migrations are delivered.
No specified KPI here.
Reduction in overall power usage

50
Ensure old kit is recycled, repurposed or sold
As we transition to a new EUCS program, we will ensure that older devices are recovered, and disposed of in a sustainable way
Continue with the great programs will already have in flight, for example our work with https://www.tier1.com/services/it-recycling-social-value/. Looking to see where they can be expanded if appropriate.
Still in baselining phase here.
Established programs for the dealing with older devices
Paper management metrics
Provision of usage metrics to agencies to drive reduction. MOJ D&T does not own business processes, but we can drive efficiency through transparency of use.
Continued sharing of metrics, baseline the existing usage
In baselining phase Clear picture of current usage.
Video conferencing for meetings
Rollout of video conferencing kit to reduce need for in person meetings
Post COVID working patterns to be worked out and ensure offices support remote working, reducing travel.
TBD post COVID TBD post COVID

51
Ensure settings on all kit conform to best practise
We are commencing a roll out of new tech across our estate. We will ensure these new devices conform to best practise.
Define device spec.
100% of devices rolled out from the new program have best practise power settings.
All devices in the new rollout have best practise power saving settings.
Progress
Please record progress towards objectives and outcomes.
Signed……………………………… TDLN Member
UK HM Greening Government Assessment Worksbook 2020
Department Name: Home Office Number FTE: 34000
Outcome (Vision statement from your departmental sustainability Strategy)
By 2020 measured improvement in the environmental, societal and economic impacts of Digital and Technology services and assets with deployment of a repository of best practices with identifiable/ measured contributions to wider Greening Government commitments and to improved more sustainable ways of working for staff, organisation and customers
Scope and Rationale

52
The Home Office has an End User Compute and Collaboration (EUC&C) Department within DDaT that works closely with a variety of internal technical teams, ensuring the solutions and services we provide are in alignment with the needs of the various departments within the Business. The team is also responsible for the day to day management of several key supplier contracts to ensure the continual development, management and support the variety of services we offer in order to sustain the various day to day operations.
In order to reduce waste the Home Office have established key metrics to ensure it tracks how many End User Devices (Laptops, Smartphones, Tablets and Desktops) are being repaired and repurposed in preference to consistently buying new. There is also an IT Policy in place that only permits a single type of device per user, reporting has recently been introduced to track the device per user ratio within each area of the business and a project is planned to take place before the end of the Financial year to recover and repurpose any surplus devices. Lastly, accelerated by the pandemic, the Home Office has recognised a need to work with the various departments to establish their specific device requirements and as a result of this exercise new measures have been implemented to help prevent deploying devices that are surplus to requirement e.g. Field Based Teams are only being issued smartphones due to the nature of their roles and unless there is a specific Assisted Technology (AT) or Operational requirement the remaining office or home userbase are now expected to utilise Skype for Business or Teams (once fully deployed) as their primary method of communication with other staff.
Objective CSF Action KPI Target
Reducing Dependency on Smartphones
Reducing the amount of Smartphones out on the estate.
Due to the huge increase in using SKYPE for business to communicate within the Home Office, efforts will be made to return devices not needed
Smartphone Usage
Reduce Smartphone Estate by recovering handsets and distributing to users with a critical need or disposing EOL if not needed.

53
Reducing the Device per User ratio on the estate back in alignment with the Home Office IT Policy (due to COVID-19 BCP requirements).
Reduce the amount of Desktops out on the estate
Due to the pandemic 95% of HO staff are now using Laptop's to carry out their work from home, this has seen a increase in excess desktops that will no longer be needed. Activity will be put in place to recover and recycle or dispose of excess devices
Desktop Usage
Recovering and recycling 95% of Desktops on our fleet by next FY. Ensuring Critical areas with genuine need for desktops, remain in place.
Progress
Please record progress towards objectives and outcomes.
Signed……………………………… TDLN Member
UK HM Greening Government Assessment Worksbook 2020
Department Name: HM Treasury Number FTE: 2208.45
Outcome (Vision statement from your departmental sustainability Strategy)
By 2020 measured improvement in the environmental, societal and economic impacts of Digital and Technology services and assets with deployment of a repository of best practices with identifiable/ measured contributions to wider Greening Government commitments and to improved more sustainable ways of working for staff, organisation and customers

54
Scope and Rationale
Please input from where the sustainable technology work is managed in your department, I,e, Service Design Architecture, ICT Strategy, Sustainable Business, Estates
Please input why you have set the objectives you have detailed below...For example - We have highlighted through our annual reporting that we would benefit from further focus on our sustainable procurement activities. We are leading this work from our Strategy team working closely with stakeholders across the department. or.....Our department is looking unlikely to meet the 50% paper reduction target for the GGC's by 2020. Working within the Architecture team we are rolling out a managed print solution across the department.
Objective CSF Action KPI Target
Reduce paper consumption
Reduce paper purchased and increase digital working
Manage a closed loop paper contract; introduction of system default options (B&W/A4 instead of Colour/A3); encourage behavioural change to reduce printing volumes through targeted comms
Paper usage 33% lower printing volumes by March 2021
Increased digital working
Microsoft Teams routinely used for internal and external meetings
Run a campaign on the use of MS Teams
Number of internal meetings using Skype for Business & Measuring travel figures
100% availability by 2020 and 40% reduction in travel costs for internal meetings and events

55
Increased digital working
Exploring an option to move to a Mobile First policy for staff
Remove desk phones and providing mobiles for all or a Unified Comms solution
Reduction in PoE desk phones
80% reduction in desk phones
Progress
Please record progress towards objectives and outcomes.
Signed Dan Tippell TDLN Member Head of IT Service Management
UK HM Greening Government Assessment Worksbook 2020
Department Name: Met Office Number FTE: 1946
Outcome (Vision statement from your departmental sustainability Strategy)
By 2020 measured improvement in the environmental, societal and economic impacts of Digital and Technology services and assets with deployment of a repository of best practices with identifiable/ measured contributions to wider Greening Government commitments and to improved more sustainable ways of working for staff, organisation and customers
Scope and Rationale

56
Sustainable technology work is managed through all areas of our business, in particular Service Design Architecture, ICT Strategy, Sustainable Business and Property Management
We have highlighted through our annual reporting that we would benefit from further more detailed focus on a number of sustainable activities. We are leading this work from our Senior Management Team, working closely with our AD Governance Risk and Assurance, Environmental Adviser and Property Management. This work is being taken forward by a Net Zero project.
Objective CSF Action KPI Target
Sustain digital ways of working Detailed reporting of on-line tools
Promote the use of the opportunities that on-line tools provide
Measured by month by month reporting on usage of Teams and Skype for Business
When there is a return to on-site working continue to set challenging targets and not return to previous levels
Increased knowledge and training on digital working
Detailed reporting of on-line tools and look at other ways of gathering reports on usage
Run training courses and produce helpful guides
Continue to measure usage and review the variety of reporting available with the on-line tools.
Check staff have completed the relevant training in order to exploit the on-line capabilities

57
Sustain the reduction in consumption of paper
Detailed reporting of paper usage
The current working from home has significantly reduced printing and staff have became used to on-line working
Measured by month by month reporting on paper usage
When there is a return to on-site working continue to set challenging targets and not return to previous levels
Progress
Please record progress towards objectives and outcomes.
Signed……………………………… TDLN Member: Alan Mackay
UK HM Greening Government Assessment Worksbook 2020
Department Name: CDIO Technology Number FTE: 231
Outcome (Vision statement from your departmental sustainability Strategy)

58
Through 2020-2025 (subject to Comprehensive Spending Review 2020) the OFFICIAL IT platforms managed by the CDIO Technology Pillar for approximately 12,000 staff across the Cabinet Office will be migrated to modernised efficient infrastructure using hyperscale cloud technologies. CDIO Technology will minimise on-premise technical facilities (such as in-building and data centre facilities), reduce on-site services such as printing /telephony, and issue more efficient end-user compute devices over time (such as laptops and smartphones). Through a Technology Refresh Programme, the CDIO Technology Pillar will deliver a cloud-first architecture that will reduce consumptions even further, and enable new dynamic ways of working for staff.
Scope and Rationale
Cabinet Office Enterprise Technology Strategy 2020-2025; Technical Architects; formal "Technology Refresh" programme (platform re-design)
Our Cabinet Office Enterprise Technology Strategy 2020-2025 has reset our approach to technology in a transformational way. To date we have had inflexible and outdated technology and have been tied to lengthy, inflexible contract with single IT providers. The Strategy standardises and champions dynamic flexible systems, including coherency over end-user device refresh models to reduce waste. The Strategy also aims to bring the best technology services to the department, taking advantage of the improvements and cost savings which come from using commodity cloud-delivered services. We are also creating a simpler operating model to control IT spending and re-designing the technology platform so it is simpler to manage and support.
Objective CSF Action KPI Target
Migrate the physical Data Centres utilisation that underpin the OFFICIAL IT platforms to the public cloud
All physical data centres decommissioned and shut down by December 2021
Migrate all technology infrastructure services and components to the public cloud, utilising modern efficient practices
Closure of current data centre infrastructure contracts and migration from physical appliances
Reduction of >90% against the baseline by December 2021

59
and methods where applicable
Refresh the OFFICIAL IT platforms away from consolidated infrastructure service reliance
Re-design of the technology platform to make large-scale use of commodity services from the public cloud without consolidated infrastructure requirements
Re-architecture of OFFICIAL IT platform
Decentralised architecture for end-user devices connecting to cloud services and tools
>75% of end-user device network activity is not reliant on an Always-on VPN by December 2025
Reduced complexity to manage and support the technology platform
Reduced complexity and effort to manage and support the technology platform
Large-scale automation of high repetition/low value tasks
Number of routine support and management tasks automated
>50% of routine support and management tasks automated by December 2025
Other
Progress
Please record progress towards objectives and outcomes.
Signed…Paul Collman…… TDLN Member

60
UK HM Greening Government Assessment Worksbook 2019
Department Name: MOD Number FTE: 217,611
Outcome (Vision statement from your departmental sustainability Strategy)
The environmental footprint of MOD’s digital technology is continually reduced, and its digital services promote beneficial sustainability outcomes.
Scope and Rationale
The Sustainable Digital Technology and Services Strategy and programme are managed from the Strategy branch of MOD CIO's Directorate for Miltary Digitisation.
MOD’s energy footprint for office ICT alone makes up 36% of total ICT energy consumption across Government. In order to meet the Greening Government Commitments and Net Zero 2050 mandate, a new approach is required. MOD must mitigate the environmental and socio-economic risks in its digital estate whilst seizing opportunities to improve sustainability through new digital services. This will be achieved through the Sustainable Digital Technology and Services (SDTS) Strategy and its companion Delivery Plan.

61
The Delivery Plan tasks, measures and timescales are currently under development.
Progress

62
MOD is currently baselining its carbon footprint as part of the MOD Climate Change and Sustainability Plan. This work is building on the data provided in STAR reporting in 2019 and 2020. Progress against the SDTS Delivery Plan will be assessed at regular intervals.
Signed……………………………… TDLN Member
UK HM Greening Government Assessment Worksbook 2020
Department Name: Highways England Number FTE: 4948
Outcome (Vision statement from your departmental sustainability Strategy)
By 2021 measured improvement in the environmental, societal and economic impacts of Digital and Technology services and assets with deployment of a repository of best practices with identifiable/ measured contributions to wider Greening Government commitments and to improved more sustainable ways of working for staff, organisation and customers
Scope and Rationale
Highways England (Information and Technology directorate) is currently prototyping capability to reduce energy usage in terms of the signs and signals deployed within the strategic road network. The opportunity to explore renewable energy by deploying solar capability is currently being tested at NTLC (National Technology and Logistics Centre), the results from which will be published in 2021. In addition Highways England will undertake a small wind turbine project to operate alongside this pilot.
Objective CSF Action KPI Target
Reduce energy consumption by providing renewable energy capability for signs and signals on the strategic road network
Use of sourced and renewable energy eg solar energy and potential small wind turbine
Test this within the NTLC test environment for signs and signals
Reduction in electrical energy consumption
Currently in test phase so performance target to be determined

63
Increased digital working due to the installation of Microsoft Surface Hubs across all key Highways England sites
Microsoft teams routinely used in internal meetings and available for use with external suppliers
Training in the use of Surface Hubs has been rolled out across the organisation , together with the establishment of new "Kanban" areas in Leeds, Bristol and Birmingham offices.
Reduction in miles travelled in support of the HE business
100% availability by 2020 and 2021 90% reduction in travel costs for internal meetings and events (in particular during the Covid 19 pandemic).
Progress
Please record progress towards objectives and outcomes.
Completed by: Tony Staniforth | Head of Service Management | IT. Highways England | Lateral | 8 City Walk | Leeds | LS11 9AT Signed by Vicky Higgin | Chief Information Officer / Executive Director | IT Highways England | The Cube | 199 Wharfside Street | Birmingham | B1 1RN
TDLN Member Relevant Leadership Team Member

64
UK HM Greening Government Assessment Worksbook 2020
Department Name: Insolvency Service Number FTE: 1697
Outcome (Vision statement from your departmental sustainability Strategy)
By 2020 measured improvement in the environmental, societal and economic impacts of Digital and Technology services and assets with deployment of a repository of best practices with identifiable/ measured contributions to wider Greening Government commitments and to improved more sustainable ways of working for staff, organisation and customers
Scope and Rationale
Digital Technology Services Directorate leads sustainable technology work within the Insolvency Service. This encompasses Service Governance, Architecture and ICT Strategy. Estates and Commercial teams also feed into the sustainable technology work.
We are keen to ensure that Government standards around sustainable technology usage are embedded within our ways of working. Any areas highlighted through our annual reporting that would benefit from further focus around sustainability are logged and progressed, with a cross-Agency effort to ensure all key stakeholders are engaged, involved and working collaboratively to maximum effect.
Objective CSF Action KPI Target
Reduce paper consumption
Reduce paper purchased and increase digital working
Increased availability and capability of digital services, making information more readily available online to citizens.
Paper usage Reduction of 50% against the 2010 baseline by 2020

65
Increased digital working Reduce paper purchased and increase efficiency
Increase use and capability of technology / automation internally
Paper usage 100% availability by 2020 and 40% reduction in travel costs for internal meetings and events
Smarter Working
Reduce number of devices per user and amount of time and money spent on travelling
Introduce Teams and Zoom across the organisation. Asset review and new user-centric guidance on device management/usage. User education around VFM and best use of tech.
Reduced T&S spend, Asset management/inventory and
Under development
Progress
We've moved to a new organisational model within our Digital Technology Services Directorate, with a change in leadership as well as a more commercial and governance driven approach to the delivery of technology services across the Insolvency Service. As well as modernising the way we do things, we've moved a Service Integration and Management (SIAM) model, with an increased focus on contract management and service delivery through a number of Providers. We've also started a programme of work to address technical debt, with a view to not only improve the effectiveness and efficiency of our technology landscape (specifically our line of business applications), but also to ensure greener and more sustainability conscious direction overall.
Signed: Ranuka Jagpal TDLN Member
66
UK HM Greening Government Assessment Worksbook 2020
Department Name: BEIS Number FTE: Approx 5000
Outcome (Vision statement from your departmental sustainability Strategy)
By 2020 measured improvement in the environmental, societal and economic impacts of Digital and Technology services and assets with deployment of a repository of best practices with identifiable/ measured contributions to wider Greening Government commitments and to improved more sustainable ways of working for staff, organisation and customers
Scope and Rationale
Please input from where the sustainable technology work is managed in your department, I,e, Service Design Architecture, ICT Strategy, Sustainable Business, Estates
Please input why you have set the objectives you have detailed below...For example - We have highlighted through our annual reporting that we would benefit from further focus on our sustainable procurement acticities. We are leading this work from our Strategy team working closely with stakeholders across the department. or.....Our department is looking unlikely to meet the 50% paper reduction target for the GGC's by 2020. Working within the Architecture team we are rolling out a managed print solution across the department.
Objective CSF Action KPI Target
Example - Reduce paper consumption
Reduce paper purchased and increase digital working
Raise staff and directorates awareness of their printing habits.
Reduction in colour printing as well as printing as a whole.
Reduction of 30% against the 2017 baseline by 2021

67
Increased digital working Use of unified comms tools
Promote usage of these tools. Provide workshops on how to use these tools to reduce travel.
Number of internal meetings using unified comms tools
Current figure for 2019/2020 is 10,558 hosted meetings using unified comms tools. We aim to increase this figure by 50% using the recent introduction of MS Teams.
Progress
Please record progress towards objectives and outcomes.
Signed…Ahad Nujurally…... TDLN Member
UK HM Greening Government Assessment Worksbook 2020
Department Name: Defra Number FTE: 24478
Outcome (Vision statement from your departmental sustainability Strategy)
By 2025 -We will deliver approaches to reducing ICT waste through the waste hierarchy and product hierarchy by ensuring that materials are kept in productive use for longer, design and purchase sustainable products and services and reduce consumption of resources. We will innovate to promote sustainable and efficient use of resources. We will continue to achieve zero to landfill annually like we have for the past 3 years.
Scope and Rationale
Right across Defra Group

68
We would like to show departments and the world that this can be achieved through innovative solutions and partnership with industry
Objective CSF Action KPI Target
100% reuse through (reuse internally, donations and remarketing) and recycling for reuse build new components
Increased reuse annually until we achieve 100%
Strong measurable KPI's for suppliers
100% reuse (internal, donations, dismantle for rebuilding (articulating all materials in KG's
100% reuse through (reuse internally, donations and remarketing) and recycling for reuse build new components
Progress
Please record progress towards objectives and outcomes.
Signed……………………………… TDLN Member
UK HM Greening Government Assessment Worksbook 2019

69
Department Name: Department for Education Number FTE: 7006.4
Outcome (Vision statement from your departmental sustainability Strategy)
By 2020 measured improvement in the environmental, societal and economic impacts of Digital and Technology services and assets with deployment of a repository of best practices with identifiable/ measured contributions to wider Greening Government commitments and to improved more sustainable ways of working for staff, organisation and customers
Scope and Rationale
Scope - From a DDaT perspective, the work on sustainable technology is led by Technology, Digital and EdTech Directorate. Our Technology Services division which includes End User Compute (including all technology hardware - laptops, mobiles, printers etc.) and our Cloud Infrastructure division which includes hosting are the areas leading on this vital initiative. Our DDaT teams work closely with Estates team to provision the right technology on desks (screens, keyboards etc.) and in meeting rooms.
Rationale - Presently, we align with the wider Govt. vision on sustainability. Therefore, we want to contribute towards lower carbon economy by encouraging our staff to adopt more digital ways of working and reduce travel. We want to become 'cloud first' organisation so that we can reduce the energy consumption that results from on-premise data centres and servers.
Objective CSF Action KPI Target
Increased digital working
Microsoft Teams routinely used for meetings in readiness for 'switching off skype for business' in October 2020.
Delivered Microsoft Teams training recorded and virtual in April/May 2020. Delivered series of comms to staff and bespoke
Number of internal meetings using MS teams and measuring travel figures
100% availability by 2020 and 40% reduction in travel costs for internal meetings and events

70
intranet page for promoting MS teams and bespoke SCS training and focussed on increasing capability of teams lives.
Reduce on premise data centre KWhr energy consumption
Reduced on premise data centre foot print
Reduce number of servers in on premise data centres
Number of servers in on premise data centres
Reduce servers from 50 to 30 in 2020/2021. Target 100%.
Progress
Please record progress towards objectives and outcomes.
Signed……………………………… TDLN Member
UK HM Greening Government Assessment Worksbook 2020

71
Department Name: Coal Authority Number FTE: 265
Outcome (Vision statement from your departmental sustainability Strategy)
By 2020 measured improvement in the environmental, societal and economic impacts of Digital and Technology services and assets with deployment of a repository of best practices with identifiable/ measured contributions to wider Greening Government commitments and to improved more sustainable ways of working for staff, organisation and customers
Scope and Rationale
Sustainable technology is managed within the ICT department, with support on sustainable procurement from our procurement team and on general sustainability issues by our sustainability manager. Our sustainability manager works across the whole organisation ensuring sustainability is embedded in all we do, including technology.
Our sustainability strategy is currently being developed, taking into account previous work carried out on sustainability in the organisation and the commitments of and to government as a whole. Our sustainability strategy focusses on four main areas: Climate Change; Nature; Waste and Resources; and People. We have a target of net zero carbon by 2030, which these initial objectives are focussed on. We are also developing plans for further reduction of waste and better use of natural resources. These objectives are preliminary as we enhance our baseline and strategy, but in line with GGC for ICT.
Objective CSF Action KPI Target
Reduce our greenhouse gas emissions in line with 2030 net zero target
Reduced carbon footprint for organisation as a whole through ICT supported behavioural change. Reduced ICT
a) Use technology/digital first as the key policy driver to reduce travel/energy and waste b)Work with supply
Annual carbon reporting against baseline
Carbon Net Zero by 2030 for organisation

72
carbon footprint on services and products
chain and procurement to reduce Scope 3 carbon on all new services and products
Continued zero ICT waste to landfill
Monitoring and annual reporting of ICT waste disposal route
Continue to monitor and plan for ICT waste removal and re-purposingto ensure zero waste to landfill
Zero ICT waste to landfill Waste plan for ICT department to be reviewed annually
Zero ICT waste to landfill with majority re-purposed in line with waste hierarchy - ongoing as target achieved but review by end 2021 as part of sustainability strategy work as part of continuous improvement.
Sustainability included as metric in all ICT procurement
Annual reporting of sustainability metrics in ICT procurement, lessons learned and impact made.
Develop process to embed sustainability metrics into ICT procurement and lessons learned from process.
Recording in procurement process how sustainable procurement principles have been included and influenced process
All ICT procurement includes sustainable procurement embedded in process with lessons learned to fed into future procurement - Review by end of 2021 as part of continuous improvement.
Other
Progress
Please record progress towards objectives and outcomes.

73
Signed……Peter Thorn TDLN Member
UK HM Greening Government Assessment Works book 2019
Department Name:
NHS Digital Number FTE: 2568 + 420 Temps
Outcome (Vision statement from your departmental sustainability Strategy)
By 2020 measured improvement in the environmental, societal and economic impacts of Digital and Technology services and assets with deployment of a repository of best practices with identifiable/ measured contributions to wider Greening Government commitments and to improved more sustainable ways of working for staff, organisation and customers
Scope and Rationale
Please input from where the sustainable technology work is managed in your department, I.e., Service Design Architecture, ICT Strategy, Sustainable Business, Estates
Sustainability and associated workloads/strategies are discussed across all areas of NHS Digital (ICT Sustainability Strategy, Commercial, Estates, Finance etc.). A wide ranging group of sustainability champion/volunteers (Green Digits) from across the organisation help run regular events and raise awareness of environmental/sustainability issues. A steering group comprising of ley stakeholders across the organisation meets on a quarterly basis, charied by a Director of NHS Digital as initiatives and strategies are formulated (including technology requests which feed into the Green ICT Strategy)
Objective CSF Action KPI Target

74
Increase digital and hybrid working
Microsoft Teams routinely used in internal meetings and available for use
Work with Sustainability team to attempt to measure the carbon and energy footprints for different types of meeting, including the GHG emission comparison between Face to Face and e-conference meetings. Promote Teams, Zoom and Convene (for bridging) for all external and internal meetings at NHS Digital Put on dedicated training and upskilling courses on new cloud technologies, to understand benefits and support infrastructure including reminding staff of the Travel and Subsistence policy for SMART meetings first.
Number of internal meetings using Teams and Zoom
Aim to increase baseline figure of 8,000 Skype for Business meetings per month using Teams instead of Skype for Business.
Increased digital working
Teams routinely used in internal meetings and available for use
Run a campaign on the best practice of Teams
Number of internal meetings using Teams for Business & Measuring travel figures
100% availability by 2020 and 40% reduction in travel costs for internal meetings and events

75
Refreshed Devices
Lower refresh rate with newer, more energy efficient devices
End user device procurement / commercial exercise included weighted scores for sustainability with ethical considerations to be included next time
Monitor new numbers of virtual desktops hosted in the cloud via a new service to provide nationwide service to GP's
Consider implementing a balanced /reviewed refresh process
Commercial Review of Green Procurement Contracts
A partnership between the Procurement and Commercial teams
Engage with the Knowledge Hub Commercial Groups and other Central Government Agencies to share best practices, recommendations and initiatives Consider producing criteria for end user device procurements to lower environmental footprint (not just power kind component kind for full modular repair or as high a recycle rate possible)
Adopt clearer green procurement processes
Aim to adopt the most appropriate accreditation schemes to require supplier compliance. Engage with suppliers in partnership with the Commercial Team to explore green initiatives and establish supplier accreditation requirements.

76
Building footprint consolidation by co-locating with HMRC at a new government Hub
Reduction in printing, network/server footprint and access to shared services
Fewer buildings result in fewer printers and less physical equipment/power consumption via consolidation. Shared services e.g. room booking result in a single supplier/solution across multiple organisations. Removal of physical telephony handsets and considerable infrastructure which results in a reduction of power to devices and consolidation of switches which were used to power VOIP
Promoting collaborative technologies and remote working practices to see a reduction in paper consumption Report on shared capability of infrastructure requirements Ensure supplier reports on printing monthly and senior management engage with organisation campaign to further reduce volumes. Review managed service contract for efficiencies and savings
Aim to Reduce printing by 10% corporately and run fewer MFD's on the estate across the year Implement and report on any recommendations Invest in further resilience/redundancy
Promotion of Green ICT
Collaborative working between Sustainability, IT, Green Digits, Smart Working, and Training Teams
Production of Green ICT Strategy document, supporting the Corporate Sustainability/Smart Working overarching Strategy. Run TechHub (supported by live Teams meeting/view on demand) sessions on collaborative working IT technology with best practice.
Monthly campaigns/Engagement/Success Reviews Review trends for travel vs printing vs Skype for Business Meetings
Production of (and reporting against) Green ICT Strategy Aims Regular attendance (increasing) at TechHub sessions/viewing of on demand video material

77
Migration to Cloud
Plan to migrate all remaining ICT systems, services and infrastructure into hosted data centre or cloud (cloud preference) unless not possible
Review and promote Crown Hosting & HMLR monthly power usage reports and printing usage to show reductions and efficiencies realized. Decommission on premise servers supporting old/redundant infrastructure. Review IT Services to identify which can be migrated to the cloud. Work with commercial/procurement to consider future cloud platform selection process in light of carbon footprints when at large/full scale (identify low carbon clud providers)
Power reduction, increased resilience, reduced infrastructure and physical server hosts
Migration of ICT away from two remaining data centre presences (aimed for Dec 2021) Ensure 50% of End User Compute (Internal) Services are cloud hosted by 2020, 75% by 2021 and 100% by 2022

78
Toolset Review
Define Collaboration Strategy and End User Support services
Review and recommend rationalised collaboration tools Replace ZenWorks infrastructure with Intune and Autopilot Replace QUMU with Microsoft Stream
Ensure collaboration tools are appropriate to use cases with valid business cases, all cloud based and integrated wherever possible Remove Physical ZenWorks and QUMU Infrastructure and use cloud hosted solutions
New Collaboration Toolset strategy by 2021 Removal of ZenWorks/Migration to Intune and Autopilot 2020 Removal of QUMU Infrastructure, migration of content to Stream/Teams Live Broadcasts (and Integration with other Office Applications/managed service elements) by 2021 Ensure solutions are Accessible

79
Buyback Service
Enable staff to buy back devices at a fair price instead of returning to O2 for recycling
Review Mobile Device Buy Back Pilot Move into BAU if successful Consider expansion of service to include tablet/laptop devices
Ensure recycling/disposal processes are adhered to where staff do not want to buy back or the devices are not usable Consider other options prior to recycling/disposal where appropriate e.g. selling device to other staff or donating to charity Review depreciation of assets with Finance and communicate 'depreciation of assets' across the organisation
Offer sale all mobile devices across the origination by 2021 Offer sale of all tablet/laptop devices by 2022
Progress
We have enabled our entire workforce to work remotely and are consolidating estate footprints in 2021, moving into a fully hot desk environment. Our key areas of focus this year will include: Continued work to migrate from four existing data centres down to two as we focusing on our cloud first strategy Increasing devices which staff can buy back at the end of their warantee/usable life Increasing recycling of all components to minimise landfill Work closely with our commercial team to embed sustainability into procurement exercises Work closely with our estates team to ensure best practices are in place for our new building Rationalise/reduce printing footprint in the new building Work with data centre partners to produce meaningful power consumption reports
Signed: M. S. Edwards
TDLN Member

80
Department Name: CPS Number FTE: 6500
Outcome (Vision statement from your departmental sustainability Strategy)
By 2020 measured improvement in the environmental, societal and economic impacts of Digital and Technology services and assets with deployment of a repository of best practices with identifiable/ measured contributions to wider Greening Government commitments and to improved more sustainable ways of working for staff, organisation and customers
Scope and Rationale
We are looking to introduce digital trial bundles for CPS staff in court, meaning that CPS staff no longer require printouts of case information in court. We are also looking to introduce Digital Jury bundles sometime in 2021. This will mean that we no longer need 12 x copies of all case information for trials with a jury, although this aspect may not deliver in 2020/21. We are also looking to make further use of the HMCTS Court Video systems for remote courtrooms, meaning we will be able to reduce the number of temporary videoconferencing installations made for court staff and witnesses to attend court remotely.
Objective CSF Action KPI Target
Reduce paper consumption in court-rooms
Reduce paper purchased and increase digital working
Introduce Digital Jury Bundles, to reduce printout of court packs
Paper usage Reduction of 50% against the 2010 baseline by 2020
Increased digital working
Microsoft Teams routinely used in internal meetings and availble for use
Run a campaign on the use of Microsoft Teams, having decommissioned VOIP phones
Number of internal meetings using Skype for Business & Measuring travel figues
100% availability by 2020 and 40% reduction in travel costs for internal meetings and events

81
Reduce number of specific temporary Videoconferencing installations, using standard technology where possible
Use Court Video where possible, as long as it is of sufficient quality for witnesses attending court
CVP currently cannot adequately stream pre-recorded video/audio to witnesses. As this improves, stop using alternative methods of delivery
Number of temporary videoconferencing installations away from regular sites
Reduction against the 2020 baseline.
Progress
Please record progress towards objectives and outcomes.
Signed……………………………… TDLN Member