grey, clark, shih and associates, limited · grey, clark, shih and associates, limited (gcs) has...
TRANSCRIPT
571 Blair Road, Ottawa, Ontario Canada K1J 7M3 Tel: (613) 238-7743 Fax: (613) 238-0368 www.greyclark.com
Grey, Clark, Shih and Associates, Limited
- Public Affairs - International Trade -
CONGRESS THUMBS ITS NOSE AT WTO AND THE DOHA ROUND
U.S. FEDERAL AND STATE SUBSIDIES TO AGRICULTURE
STUDY PREPARED FOR
DAIRY FARMERS OF CANADA
by
Grey, Clark, Shih and Associates, Limited Ottawa, Ontario, Canada
This document is the Property of Dairy Farmers of Canada
© Grey, Clark, Shih and Associates, Limited (2018)

Executive Summary
- 1 -
Executive Summary:
Grey, Clark, Shih and Associates, Limited (GCS) has been analyzing U.S. farm subsidy
programs for Dairy Farmers of Canada since 1990. This report is the latest update, which
focuses on changes introduced by the 2014 Farm Bill.1 We have updated and expanded on our
earlier studies and commented on the implications of the changes.
It is not our purpose to criticize the benefits and support which the U.S. provides to its farmers
and ranchers. However, this support is clearly trade and production distorting. We hope that this
report will help farmers and ranchers in Canada and other countries better understand how the
U.S. farmers, ranchers and food processors benefit, directly and indirectly, from government
support. This is particularly important when comparing risk management programs between
countries which are more frequently the vehicle for delivering support programs to address the
uncertainties and unforeseen events.
This report will also provide information to governments to assist in negotiations with the United
States be it in the WTO or in U.S. efforts to re-balance NAFTA. Demands for improved access
to the Canadian dairy market ignore the extent of subsidies to the U.S. dairy industry.
In this uncertain environment, governments in Canada need to know what could be done to
ensure farmers and ranchers are able to continue satisfying arguably the most important of basic
human needs; the U.S. recognized basic human right to food.
The U.S. continues to provide massive (sometimes underreported to the WTO) support to U.S.
agriculture at the federal, state and local levels of government. Over the years since the Uruguay
Round was concluded, U.S. dairy producers have been among the principal beneficiaries of this
support through a complex web of direct support and indirect support and measures. Indirect
support to U.S. dairy production comes through the massive infrastructure subsidies such as low
priced irrigation water, services and general program benefits including export credits, nutrition
programs, food aid and loan and guaranteed and low interest loan programs. In addition, there
1 The Agricultural Act of 2014 (H.R. 2642; Pub.L. 113–79)

Executive Summary
- 2 -
are very substantial pass through benefits from feed grain production to livestock that benefit
dairy cattle and dairy production.
Not all support is direct “cash in the jeans” support. Government expenditures for things done to
benefit dairy farmers is a cost to U.S. taxpayers which is related to their dairy and food
purchases. Irrigation expenditures benefit dairy farmers as do ever increasing disbursements for
nutrition programs.
Our analysis is based on USDA and other U.S. Government data. GCS submits there is no better
data available.
Below is a chart which illustrates the levels of support/government expenditures:
Summary of U.S. Subsidies to Dairy (2015)
Per cwt Per hl US$ C$ US$ C$ Federal 10.70 13.68 24.29 31.05 State/Local 1.36 1.74 3.09 3.97 Total 12.06 15.42 27.38 35.02
Converting the U.S. dollar support into metric equivalents, we estimate that this support
represented C$35.02/hl in 2015. Our study after the previous Farm Bill (2008) based on benefits
for FY 2009; estimated support on this basis was C$31.11/hl.
The approach is comprehensive as it would be in a trade remedies (anti-dumping/anti-subsidy)
complaint.
The estimated US$12.06/cwt support to U.S. dairy production in 2015 was equivalent to 45% of
U.S. cost of production of milk or 71% of the market returns for milk as reported by USDA.

Executive Summary
- 3 -
In recent years, U.S. milk production has outstripped growth in consumption. Surplus
production began in 2006 and has increased substantially over the past decade. USDA projects
that U.S. milk production will grow over the next decade by 20% to 260 billion pounds – this is
50 billion pounds of growth.2
2 Farm Bureau, Market Intel, June 9, 2017, www.fb.org

Executive Summary
- 4 -
The U.S. became a net exporter of dairy products in 2006. Mexico and Canada are its largest
export markets. The USDA growth projections over the next decade reported above, include
16 billion pounds of additional exports – or 42% growth in exports – much greater than expected
growth in production and consumption.3
The low prices of milk in the USA not only encourage exports, it limits growth in imports
3 “NAFTA and the Implications for U.S. Dairy”, Dairy Herd Management, June 12, 2017

Executive Summary
- 5 -
Notwithstanding claims from U.S. dairy industry lobbyists, U.S. dairy exports to Canada have
been increasing very substantially as demonstrated by the following chart:
The following graph shows the costs of production,4 farm gate returns and losses per
hundredweight sold as reported by USDA on a national basis from 2005 to 2016. Data and
graphs for individual states are included in the text of the report. We have measured revenue
from sales of milk against fully absorbed cost of production because this standard was
established by the WTO DSU in Canada – Dairy.
4 See USDA Report, “Milk production costs and returns per hundredweight (cwt) sold, by State”. Cost of Production (COP) includes: Operating Costs: Feed (Purchased feed, Homegrown harvested feed; Grazed feed) and Other (Veterinary and medicine, Bedding and litter, Marketing, Custom services, Fuel, lube, and electricity, Repairs, Other operating costs, Interest on operating capital) and Hired labor. The latter factor is classified below the line by USDA. We consider that direct labour is a variable cost that is properly part of cash costs.

Executive Summary
- 6 -
The data of net loss per cwt for some of the more important dairy states is summarized in this
table below:
Cost of Production – Minus Farm Gate Price Source: USDA, ERS, Milk Cost of Production Estimates
National New York California Wisconsin Michigan Vermont 2005 3.23 6.69 0.17 3.88 3.03 4.53 2006 6.04 10.99 3.03 5.53 6.24 8.17 2007 1.62 5.26 +1.12 0.52 1.68 2.27 2008 5.56 8.92 4.65 4.25 5.53 6.13 2009 9.47 12.27 6.53 9.24 10.52 9.68 2010 4.56 6.37 2.06 7.79 3.64 10.32 2011 4.21 5.66 2.77 6.51 2.98 10.19 2012 6.75 9.11 4.38 10.09 7.61 13.31 2013 7.48 10.72 4.57 13.97 7.76 14.18 2014 3.85 8.25 2.46 7.40 3.61 9.15 2015 9.98 14.65 10.36 10.16 10.94 17.40 2016 10.16 16.34 10.14 10.07 11.00 17.38

Executive Summary
- 7 -
As noted, these data are sourced from the USDA Economic Research Service. These are official
U.S. Government data. The very significant delta between the farm gate price and COP raises
serious questions about how the U.S. dairy industry is evolving and its dependence on
government support.
It is relevant that the farm gate price is a blended price which reflects proceeds from all classes
of milk. Under Federal Milk Marketing Orders, Classes III and IV are priced significantly below
Class I table milk. However, all classes begin with the same cost of production. Thus, losses on
Classes III and IV would be significantly greater than shown in the table above.
The 2014 Farm Bill
The 2014 Farm Bill was signed into law on February 7, 2014. The Act authorizes nutrition and
agriculture programs in the United States until September 30, 2018. According to estimates
made by the Congressional Budget Office in early 2014, projected expenditures under the Bill
amount to US$489 billion during 2014-2018.
The 2014 Farm Bill transformed many of the agricultural programs from the 2008 Farm Bill.
The new law altered many of the commodity (Title I) programs that were tied to historical acres
and yields. For example, the 2008 Title I programs included a direct payment program which
paid constant amounts regardless of economic conditions. This program was introduced in the
1996 Farm Bill. The 2014 Farm Bill eliminated this type of direct payment so that programs are
more reflective of market conditions (for example, not providing a payment when prices and
producer revenue are high).
In total, the value of U.S. Department of Agriculture programs to the U.S. agriculture industry at
US$210.7 billion in 2015.5 Based on dairy’s roughly 10.54%6 share of U.S. agricultural sales,
results in benefits of some US$22.2 billion to U.S. dairy farmers. These estimates include
5 FY 2017 Budget Summary, U.S. Department of Agriculture, pg 111 6 All U.S. agricultural commodities in 2015 were valued at US$376.3 billion at the farm gate, while the total value of cash receipts from the sale of all U.S. dairy production in 2015 was US$35.7 billion.

Executive Summary
- 8 -
estimated costs of irrigation programs and where appropriate the costs to administer and deliver
the programs – which is a cost to taxpayers and a benefit to farmers. This study was not
developed with a trade remedies complaint in mind. Rather, it is designed to assess the
generosity of U.S. support to agriculture, with a focus on dairy farming.
U.S. direct and indirect expenditures benefiting U.S. dairy producers are equivalent to about 73%
of revenue from the market place. This generous support, as well as the growth of cooperatives
and mega farms, are important factors which enable U.S. producers to sell below their reported
fully absorbed cost of production, by insulating them from the need to earn a profit from the
market. Low domestic prices also insulate U.S. dairy production from international price
pressures.
The subsidies also helped American dairy producers to survive the devastating market conditions
of recent very difficult years – including the disastrous experience of 2009. The Department of
Commerce, U.S. Census Bureau, Foreign Trade Statistics, said that in 2009, there was a decline
in the value of milk production of 13% from 2008.
It is important to understand that the way Congress structures support, actual budgeted dollars
may have a multiple effect on spending. One example is marketing loans which are made and
repaid within the fiscal year. These do not show as expenditures because they are repaid in the
period.
Describing programs such as SNAP (food stamps) and subsidized school meals as welfare is
misleading. While these programs arguably benefit agribusiness firms most, ensuring better
nutrition to the working poor, students or through the Women, Infants and Children special
supplement (WIC) nutrition programs, they create massive supportive demand funded by U.S.
taxpayers.

Executive Summary
- 9 -
Some of the largest agribusiness companies in the U.S. have not only lobbied against cuts to any
food subsidy programs, but they have also opposed any changes to these subsidies that could
encourage more healthful eating habits.7
A study by the U.S. House of Representatives Agriculture Committee tracked expenditures on
different food types included in SNAP as follows:8
These data demonstrate that more than the 10.54 % we allocated to dairy is accounted for by
dairy expenditures under SNAP, assuming ice cream is included in the frozen dessert category.
The 2014 Farm Bill introduced major changes to the system of support to agricultural producers.
Direct payments, a cornerstone of U.S. policy towards crop production since 1996, were
eliminated. The Counter-Cyclical Payments (CCP) Program and the Average Crop Revenue
Election (ACRE) Program were also terminated, at least that was the claim. In fact, CCP’s were
7 “Annual Farm Subsidies to Reach 10-Year High”, Food & Agriculture, by Leon Kane, April 15, 2016 8 Past, Present, & Future of SNAP, House Agriculture Committee Report, December 7, 2016, pg 54 http://agriculture.house.gov/uploadedfiles/snap_report_2016.pdf

Executive Summary
- 10 -
reborn and enriched in the risk management program Price Loss Coverage (PLC). Furthermore,
the Bill replaced market price support for dairy products but replaced it with a margin protection
program for dairy farmers; modified and refunded disaster aid programs for livestock producers;
and sought to rationalize conservation programs. Federal crop insurance programs have been
expanded. Is the objective risk management or eliminating risk?
The principal new features of the 2014 Farm Bill are: the Price Loss Coverage (PLC) program,
which provides payments on a share of historical base acres and yields when commodity prices
fall below reference price levels for covered crops; the Agricultural Risk Coverage (ARC)
program, which provides payments on a share of historical base acres and yields when revenue at
the county or farm level for covered commodities falls below a county-based or individual
benchmark guarantee for covered commodities; the Supplemental Coverage Option (SCO), an
area-based insurance policy requiring, and taking on the characteristics, of the underlying policy;
the Stacked Income Protection Plan (STAX), a subsidized supplemental insurance plan for
producers of upland cotton; and the Margin Protection Program for Dairy Producers (MPP). In
addition, many other programs established under earlier legislation have been continued
unaltered or in modified form.
Dairy programs
As noted above, the 2014 Farm Bill eliminated the Dairy Product Price Support Program,
deficiency payments for dairy producers (the Milk Income Loss Contract or MILC Program),
and dairy export subsidies (Dairy Export Incentive Program). Instead, it introduced a Margin
Protection Program for milk producers (MPP) and a Dairy Product Donation Program, which
authorizes the Commodity Credit Corporation (CCC) to purchase dairy products at prevailing
market prices when milk margins are depressed. The purchased quantities are subsequently
distributed to low income households.
The MPP insures milk farmers against falling margins, calculated as the difference between the
national “all-milk” price and average feed costs. The production margin is calculated for
consecutive two-month periods (January/February, March/April, etc.). If the margin remains

Executive Summary
- 11 -
below insured levels (US$4-US$8 per hundredweight) for any of these two-month periods,
enrolled producers receive a payment based on their chosen coverage.
The Dairy Product Donation Program (DPDP) is administered by the FSA and the Food and
Nutrition Service (FNS) and funded by the Commodity Credit Corporation. DPDP purchases are
triggered if the FSA determines that the national production margin has fallen below US$4 (per
cwt) for two consecutive months. The purchased goods are donated to public and private non-
profit organizations that provide nutrition assistance to low-income households. FSA and FNS
determine the type and quantity of dairy products to be acquired in consultation with the non-
profit organizations and eligible state and local agencies. Products are purchased for immediate
distribution and may not be stored or resold in commercial markets.
Federal Milk Marketing Orders provide classified pricing and price pooling. The system, which
dates back to the 1930s, has been maintained without change. The 2014 Farm Act also extends
the Dairy Forward Pricing Program, the Dairy Indemnity Program, and the Dairy Promotion and
Research Program through 2018.
State and Local Subsidies are Significant
State and local expenditures on agriculture in 2015 were estimated to be US$7 billion. U.S. state
and local government support in 2015 to dairy production amounted to US$2.85 billion or about
US$1.36/cwt.
Irrigation
In addition, state and local governments provide very extensive and important support through
irrigation subsidies in the form of below-market and below-cost price water and electrical power
provided for agricultural use although it appears to be at less than 27% of commercial rates, to
operate the irrigation systems.

Executive Summary
- 12 -
The subsidy exists in the form of water for irrigation provided to producers at prices below the
prevailing market price. The value of the subsidy is the difference between price charged to
agricultural producers and the price charged to other users such as industrial or residential
consumers.
A University of California, Davis presentation explained, if U.S. consumers want food there will
be a price in terms of water and land for producing the agricultural products used to produce our
food. Agriculture cannot compete economically with the urban/industrial sector for water
because it uses a large amount of water per unit of production.9
Support provided through irrigation subsidies is direct but non-dairy-specific support which is
also allocated on the basis of dairy’s share of the total value of state agricultural production for
those states which are the principal beneficiaries of the irrigation programs. We have in this
report determined that support to dairy through subsidies to alfalfa, hay, irrigated pastureland and
feed grain is more than our normal 10.54% allocation.
The provision of low-cost water to producers by state and local governments also constitutes a
subsidy for purposes of the WTO Agreement on Subsidies and Countervailing Measures and the
WTO Agreement on Agriculture and should be included in the U.S. AMS. But while the U.S
reports cost of irrigation infrastructure, the U.S. does not report water benefits. Nor does it
report the benefits of low-priced electricity to pump the water.
We estimate that the total direct and indirect benefit to U.S. dairy production through U.S.
federal, state and local programs in fiscal year 2015 was US$12.06 per hundred weight (cwt) of
milk produced or C$35.02 per hectolitre. That includes aggregate of the U.S. Department of
Agriculture Program Levels, irrigation infrastructure support and undeclared below market
price/cost water and power for irrigation systems.
9 Irrigation of Agricultural Crops in California, Department of Land, Air and Water Resources, University of California, Davis, Blaine Hanson
Executive Summary
- 13 -
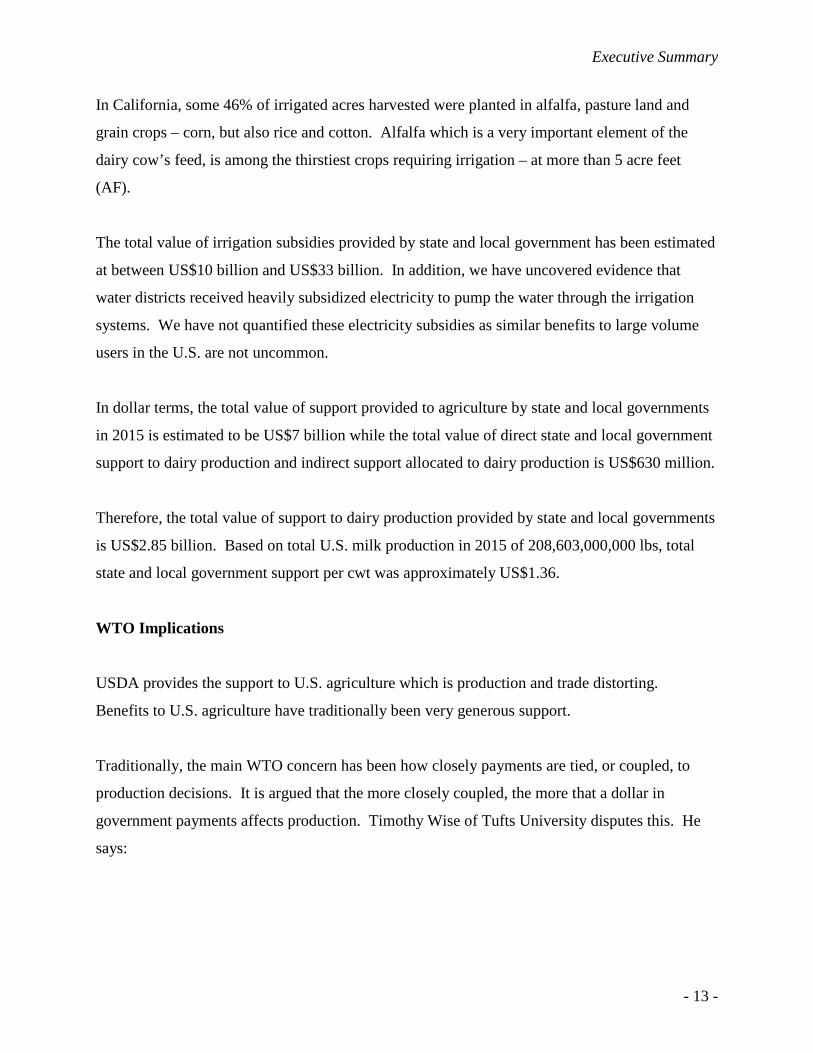
In California, some 46% of irrigated acres harvested were planted in alfalfa, pasture land and
grain crops – corn, but also rice and cotton. Alfalfa which is a very important element of the
dairy cow’s feed, is among the thirstiest crops requiring irrigation – at more than 5 acre feet
(AF).
The total value of irrigation subsidies provided by state and local government has been estimated
at between US$10 billion and US$33 billion. In addition, we have uncovered evidence that
water districts received heavily subsidized electricity to pump the water through the irrigation
systems. We have not quantified these electricity subsidies as similar benefits to large volume
users in the U.S. are not uncommon.
In dollar terms, the total value of support provided to agriculture by state and local governments
in 2015 is estimated to be US$7 billion while the total value of direct state and local government
support to dairy production and indirect support allocated to dairy production is US$630 million.
Therefore, the total value of support to dairy production provided by state and local governments
is US$2.85 billion. Based on total U.S. milk production in 2015 of 208,603,000,000 lbs, total
state and local government support per cwt was approximately US$1.36.
WTO Implications
USDA provides the support to U.S. agriculture which is production and trade distorting.
Benefits to U.S. agriculture have traditionally been very generous support.
Traditionally, the main WTO concern has been how closely payments are tied, or coupled, to
production decisions. It is argued that the more closely coupled, the more that a dollar in
government payments affects production. Timothy Wise of Tufts University disputes this. He
says:

Executive Summary
- 14 -
“A producer may not only change production to receive subsidies, but also may have different attitudes towards risk and different budget constraints. As a result, the total dollar amounts are not the only determinant of acreage shifts”.10
Professor Wise describes the 2014 Farm Bill as:
“decidedly more trade-distorting than its predecessor. It eliminates direct payments to producers, which were considered less trade-distorting than price or production-based programs. It replaces them with production and price-based programs that offer producers of supported commodities a choice between payments to compensate for low prices (price loss coverage or PLC) or payments to compensate for revenues lower than the recent five-year revenue average (agricultural risk coverage or ARC). On top of that, producers get subsidized crop insurance from the federal government, and special or different programs support dairy, cotton and other crops.”11
He concludes that:
“the 2014 U.S. Farm Bill is one of the main reasons the U.S. government is walking away from the post-Bali agriculture negotiations. Studies show that the U.S. is likely to exceed the subsidy limits agreed in Doha negotiations in 2008, and it will probably exceed even current WTO limits.” 12
Analysis of the 2014 programs indicates that:
“virtually none of the U.S. support under these new programs would fall in the Green Box, exempted from limits based on the assumption that they are minimally trade distorting. Both programs are, indeed, tied to specific crops, prices, or levels of production, so they will be disciplined as Amber Box support subject to reductions under the current WTO agreement.”13
The Tufts study notes that under the proposed Doha agreement (we are using this as a
benchmark, we do not hold out much hope that these will be realized in the near future), based
on the texts agreed in 2008, the new programs will likely fall in the Blue Box, which will be
subject to new caps. The U.S. limit will be $4.7 billion. They will also contribute to the new
limits on overall trade distorting support (OTDS), which for the U.S. will be $14.5 billion. And
with the so-called de minimis exemption reduced from 5% to 2.5% of the value of each crop,
10 “Destruction of U.S. Credibility at WTO”, Tufts University, by Timothy A. Wise and Biraj Patnaik, September 8, 2015 11 Ibid. 12 Ibid. 13 Ibid.

Executive Summary
- 15 -
more of that trade-distorting support will count against the U.S. limits. But Professor Wise well
notes the 2014 Farm Bill adds a new layer of hypocrisy to U.S. claims.
Professor Wise raises important questions about why other WTO members should need to
restructure and rationalize their farm sectors because of the effects of disruptive and devastating
U.S. subsidies, competitive currency devaluations or its non-tariff protection like U.S.
Mandatory Country of Origin Labelling (M-COOL). The real need is to discipline the “beggar
thy neighbor” policies which lead to massive disruptive U.S. (and E.U.) farm subsidies which
drive prices down in world markets.
World Trade Organization rules have not been effectively enforced. Nor do the WTO
Agreements take account of the very fundamental, subsistence nature of agriculture in many
developing countries. Small farmers in these countries are totally vulnerable to cheap import
competition. Small farmers in developing countries cannot be treated the same way as the
agribusiness and corporate farmers which dominate agriculture in the USA.
The level of this trade-distorting U.S. farm support will no doubt make it difficult for other
countries to engage in meaningful market access negotiations unless and until the production
distorting U.S. Farm Bill programs are brought under control.

i
U.S. AGRICULTURAL SUBSIDIES STUDY
CONTENTS LIST
EXECUTIVE SUMMARY
INTRODUCTION .................................................................................................................... 1 PART I – U.S. FEDERAL GOVERNMENT PROGRAMS I. Overview – Part I – Federal Subsidies ............................................................................. 58
A. U.S. Federal Support to Dairy Farmers ............................................................... 69 B. Analysis of U.S. Federal Government Support ................................................... 71
1. Total Value of U.S. Federal Government Support in 2015 ..................... 71 2. Direct and Indirect Support ...................................................................... 74 3. Subsidies, Support and Tariffs ................................................................. 74
C. U.S. Federal Agricultural Support Programs ....................................................... 78 1. Programs that Directly Support Dairy Production ................................... 79 2. Domestic Support Programs .................................................................... 83 3. Export Subsidy Programs ........................................................................ 86 4. De Facto and Article 9.1(c) Export Subsidies ......................................... 87 5. Domestic and International Food Aid ...................................................... 93 6. Irrigation Programs .................................................................................. 93
D. Conclusions .......................................................................................................... 94 E. Summary of Program Benefits........................................................................... 100
II. Domestic Support........................................................................................................... 104
A. Farm Loan and Grant Programs ................................................. 106 A.1 Farm Operating and Ownership Loans ....................................... 107 A.2 Emergency Disaster Loans ......................................................... 114 A.3 State Mediation Grants ............................................................... 116 B. Commodity Programs ................................................................. 118 C. Price Loss Coverage / Agricultural Risk Coverage .................... 122 D. Non-Recourse Marketing Assistance Loans and Loan
Deficiency Payments .................................................................. 125 E. Price Support Marketing Assistance Loans and
Related Stabilization Programs .................................................. 133 F. Disaster Payments ....................................................................... 135 G. Margin Protection Program (MPP) ............................................. 137 H. Noninsured Assistance Payments (NAP) ................................... 140 I. Farm Storage and Sugar Storage Facility Loans ........................ 143 J. Dairy Indemnity Payment Program ............................................ 146
III. Export Subsidies ............................................................................................................ 148
A. Foreign Agricultural Service ........................................................ 148 B. Export Credit Guarantee Programs ............................................... 150 C. Facilities Financing Guarantees .................................................... 155

ii
D. Market Access Program ................................................................ 158 E. Foreign Market Development (Cooperator) Program .................. 161 F. Emerging Market Program ........................................................... 164 G. Quality Samples Program ............................................................. 169 H. Trade Adjustment Assistance for Farmers ................................... 171
IV. International Food Assistance ........................................................................................ 174
A. Food for Peace Act (P.L. 480) ...................................................... 176 B. Bill Emerson Humanitarian Trust ................................................. 181 C. Food for Progress .......................................................................... 183 D. McGovern-Dole International Food for Education
and Child Nutrition Program ...................................................... 186 E. Section 416(b) Donations ............................................................. 188
V. Agricultural Marketing Services .................................................................................... 190
A. Marketing Services ....................................................................... 191 B. Payments to States ........................................................................ 193 C. Section 32 Funds (Funds for Strengthening Markets,
Income and Supply) .................................................................... 195 D. Perishable Agricultural Commodities Act .................................... 197 E. Commodity Grading Services ...................................................... 199 F. Milk Market Orders Assessment Fund ......................................... 201
VI. Conservation Programs .................................................................................................. 203
A. Conservation Reserve Program (CRP) ........................................ 205 B. Emergency Conservation Program .............................................. 207 C. Environmental Quality Incentives Program ................................. 209 D. Conservation Operations .............................................................. 211 E. Conservation Reserve Program Technical Assistance ................ 213 F. Agricultural Management Assistance .......................................... 214 G. Conservation Security Program / Conservation Stewardship
Program ........................................................................................ 216 H. Agricultural Conservation Easement Program (ACEP) .............. 218 I. Resource Conservation and Development ................................... 223 J. Watershed and Flood Prevention Operations .............................. 224 K. Watershed Rehabilitation Program .............................................. 227 L. Regional Conservation Partnership Program (RCPP) ................. 229
VII. Crop Insurance ............................................................................................................... 232
A. Federal Crop Insurance Program .................................................. 233 B. Livestock Gross Margin Insurance for Cattle ............................... 236 C. Livestock Gross Margin for Dairy Cattle Insurance Policy ......... 237 D. Livestock Gross Margin for Swine Insurance Policy ................... 238 E. Livestock Risk Protection Feeder Cattle Insurance ...................... 240 F. Livestock Risk Protection Lamb Insurance Policy ...................... 242

iii
VIII. Rural Development ........................................................................................................ 244 A. Rural Business – Cooperative Service .......................................... 248 A.1 Business and Industry (B&I) Loan Guarantees ............................ 248 A.2 Rural Housing Service .................................................................. 250 A.3 Rural Utilities Service ................................................................... 252
IX. Animal and Plant Health Inspection Services ................................................................ 254
A. Agricultural Quarantine Inspection Fees ...................................... 256 B. Plant and Animal Health Monitoring ........................................... 258 C. Pest and Disease Management Programs ..................................... 261 D. Animal Welfare ............................................................................ 263 E. Safe Trade and International Technical Assistance ...................... 265
X. Food Safety and Inspection ............................................................................................ 267
A. Federal Food Safety and Inspection ............................................. 269 B. State Food Safety and Inspection ................................................. 271 C. International Food Safety and Inspection ..................................... 273 D. Codex Alimentarius Commission ................................................. 275
XI. Food and Nutrition Services .......................................................................................... 277
A. Supplemental Nutrition Assistance Program (SNAP) .................. 279 B. Child Nutrition Programs ............................................................. 282 C. Special Supplemental Food Program for Women,
Infants, and Children (WIC) ....................................................... 285 D. Commodity Assistance Program .................................................. 287
XII. Grain Inspection, Packers and Stockyard Administration (GIPSA) .............................. 289 XIII. Forest Service ................................................................................................................ 291
A. Forest and Rangeland Research .................................................... 292 B. State and Private Forestry ............................................................. 294 C. Land Acquisition .......................................................................... 296
XIV. Research, Education and Economics ............................................................................. 298
A. Agricultural Research Service ...................................................... 299 B. National Institute of Food and Agriculture ................................... 301 C. Economic Research Service ......................................................... 303 D. National Agricultural Statistics Service ....................................... 305
XV. Irrigation Infrastructure .................................................................................................. 307
iv
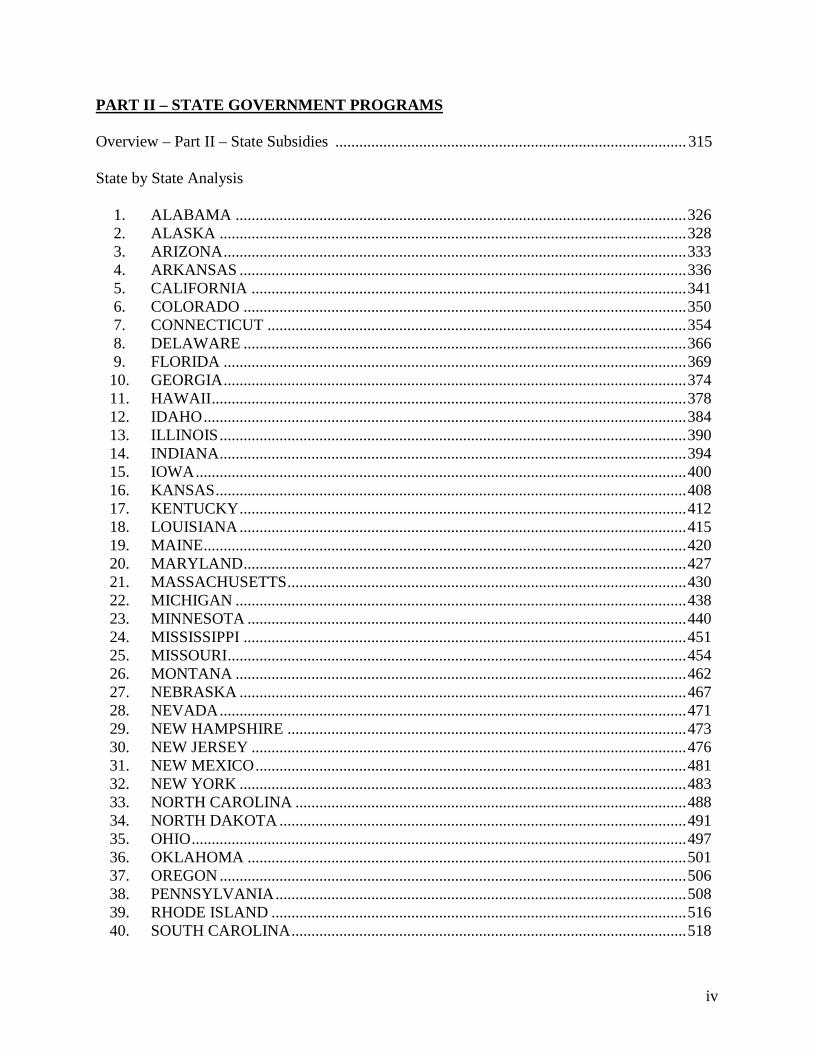
PART II – STATE GOVERNMENT PROGRAMS Overview – Part II – State Subsidies ........................................................................................ 315 State by State Analysis
1. ALABAMA ................................................................................................................. 326 2. ALASKA ..................................................................................................................... 328 3. ARIZONA .................................................................................................................... 333 4. ARKANSAS ................................................................................................................ 336 5. CALIFORNIA ............................................................................................................. 341 6. COLORADO ............................................................................................................... 350 7. CONNECTICUT ......................................................................................................... 354 8. DELAWARE ............................................................................................................... 366 9. FLORIDA .................................................................................................................... 369 10. GEORGIA .................................................................................................................... 374 11. HAWAII ....................................................................................................................... 378 12. IDAHO ......................................................................................................................... 384 13. ILLINOIS ..................................................................................................................... 390 14. INDIANA ..................................................................................................................... 394 15. IOWA ........................................................................................................................... 400 16. KANSAS ...................................................................................................................... 408 17. KENTUCKY ................................................................................................................ 412 18. LOUISIANA ................................................................................................................ 415 19. MAINE ......................................................................................................................... 420 20. MARYLAND ............................................................................................................... 427 21. MASSACHUSETTS .................................................................................................... 430 22. MICHIGAN ................................................................................................................. 438 23. MINNESOTA .............................................................................................................. 440 24. MISSISSIPPI ............................................................................................................... 451 25. MISSOURI ................................................................................................................... 454 26. MONTANA ................................................................................................................. 462 27. NEBRASKA ................................................................................................................ 467 28. NEVADA ..................................................................................................................... 471 29. NEW HAMPSHIRE .................................................................................................... 473 30. NEW JERSEY ............................................................................................................. 476 31. NEW MEXICO ............................................................................................................ 481 32. NEW YORK ................................................................................................................ 483 33. NORTH CAROLINA .................................................................................................. 488 34. NORTH DAKOTA ...................................................................................................... 491 35. OHIO ............................................................................................................................ 497 36. OKLAHOMA .............................................................................................................. 501 37. OREGON ..................................................................................................................... 506 38. PENNSYLVANIA ....................................................................................................... 508 39. RHODE ISLAND ........................................................................................................ 516 40. SOUTH CAROLINA ................................................................................................... 518

v
41. SOUTH DAKOTA ...................................................................................................... 520 42. TENNESSEE ............................................................................................................... 527 43. TEXAS ......................................................................................................................... 530 44. UTAH ........................................................................................................................... 534 45. VERMONT .................................................................................................................. 538 46. VIRGINIA ................................................................................................................... 542 47. WASHINGTON ........................................................................................................... 544 48. WEST VIRGINIA ........................................................................................................ 547 49. WISCONSIN ............................................................................................................... 549 50. WYOMING ................................................................................................................. 556 51. IRRIGATION SUBSIDIES ......................................................................................... 558

PART I
1
‘I want to write a Farm Bill that’s good for Agriculture. If someone wants to sue us, we’ve got a lot of lawyers in Washington.’ 1
Representative Collin C. Peterson, Chair of the Agriculture Committee of the U.S. House of Representatives
INTRODUCTION
Grey, Clark, Shih and Associates, Limited (GCS) was retained by the Dairy Farmers of Canada
(DFC) to quantify and analyze, from publicly available information, all support provided to U.S.
agriculture and dairy producers by federal, state and local governments.
This study updates and expands upon the previous studies of support to U.S. agriculture prepared
by GCS in 1990, 1998, 2003, 2005 and 2010.2 We have reviewed all government support
provided directly and indirectly to the full range of agricultural production and processing in the
USA, from inputs at the farm or ranch level to the point of sale to retailers. However, while the
complete range of direct and indirect measures was reviewed, not all benefits flowing from state
and federal programs were included in our calculations of benefits, either because we did not
have adequate information to estimate particular program benefits or because we considered the
benefits to be too removed from dairy farming.
1 “Farm Bill divides lawmakers, President Bush”, Associated Press, by Libby Quaid, January 14, 2007 2 In 1990, GCS prepared a study entitled Subsidies to the Dairy Farming and Processing Industries in the USA. In this study, GCS identified and quantified all subsidies and benefits available to dairy farmers and processors in the U.S. states at the federal, state and local government level from inputs utilized in milk production to point of sale to the retailer. In 1998, GCS prepared a follow-up 1998 study also entitled Subsidies to the Dairy Farming and Processing Industries in the USA. In this study, GCS updated the information set out in the 1990 study, in the context of the 1996 Farm Bill and revised programs. The 2003 report was entitled WTO Consistency of U.S. and New Zealand Agricultural Practices, the 2005 report was entitled U.S. Federal and State Agricultural Support, and the 2010 report was entitled Farming the Mailbox: U.S. Federal and State Subsidies to Agriculture.

PART I
2
Total Value of U.S. support for Dairy Production
The Dairy Farmers of Canada asked GCS to calculate the value of total direct and indirect U.S.
support to dairy producers per hectolitre of milk produced in the United States. We have made
separate calculations in Parts I and II of the report and provided aggregate estimates in the
summary section. In previous reports GCS calculated the total value of U.S. support to dairy per
hundredweight of milk produced. To ensure continuity of analysis, the total value of U.S.
support to the dairy sector in 2015 has been calculated per hectolitre and per hundredweight
(cwt).
The support provided to U.S. agriculture and to dairy production is comprised of direct support
and indirect support. Indirect support includes support to U.S. dairy production through
infrastructure, services, and general program benefits including export credits, nutrition, food aid
and loan and granted loan programs. In addition, the very substantial benefits to feed grain
production and to livestock producers also benefit dairy cattle and dairy production.
We have applied the same methodology in past studies to determine the benefits to U.S. dairy
producers. Unless otherwise stated, quantified benefits at the federal level have been allocated to
dairy in the same proportion that dairy represents in the total value of U.S. farm production. In
the 1998 study, 1997 program budgets were multiplied by 10.32% (0.1032), dairy’s percentage
of total agricultural receipts. For 2009, we used 10.7% and in this report, for 2015, we use
10.54%. Because precise data on actual benefits to dairy is not available, this methodology may
overstate or understate actual benefits to dairy for a particular program, but it appears to be a
reasonable method.
The USDA Economic Research Service reported the total value of cash receipts from the sale of
all U.S. dairy production in 2015 as $35.7 billion and the total value of cash receipts from the
sale of all U.S. agricultural commodities as $376.3 billion.3 Based on these figures, we have
determined that U.S. dairy represents approximately 10.54% of total U.S. agricultural
production.
3 Economic Research Service (ERS); Farm Income and Wealth Statistics, November 30, 2016

PART I
3
Who Benefits?
The Environmental Working Group (EWG) reports according to the 2007 Census 91% of farms
in California received no subsidies. However, USDA does not report subsidized irrigation as
subsidies.
Contrast this with Wisconsin where 60.5% of farmers received subsidies, and New York, where
some 11,000 farms or 29.2% of farms received subsidies.
EWG reports that producers of meat, fruits and vegetables have traditionally been left almost
completely out of the subsidy game (they can apply for both subsidized crop insurance and for
disaster payments).
We estimate that the total value of U.S. Federal support for U.S. dairy in 2015 to be the sum of
the total value of support provided under dairy specific programs less the value of selected
programs that offer no direct or indirect support to U.S. dairy production plus 10.54% of the total
of the remaining USDA program level expenditures for 2015 plus 10.54% of total budgetary
resources available for water management programs of the Department of Interior, Bureau of
Reclamation.
We did not estimate the price/income support benefits under any programs. This understates
benefits to U.S. agriculture and to dairy producers but we do not have precise data on such
supports.
Former U.S. Agriculture Secretary, Dan Glickman, told the N.Y. Times farming has “become
largely an income transfer program,”4 with the government underwriting rural businesses and
requiring very little in return.
4 “Failing Farmers Learn to Profit from Federal Aid”, The New York Times, December 24, 2000
PART I
4
Secretary Glickman went on to explain:
“There seems to be a gradual realization in farm country that federal subsidies in the United States -- like those in much of Europe -- are not so much about food supply anymore as they are about keeping the least-populated parts of the country afloat. So while he criticizes the size of some of the handouts, Mr. Glickman says that without the government, thousands of farmers and the businesses that depend on them would go bankrupt within a year or two.” 5
USDA money helps to maintain the infrastructure in small town rural America, but it has made
farmers too dependent on subsidies because, Mr. Glickman notes:
“Essentially, the government’s role in requiring the farmer to do something in return has been largely eliminated by Congress.”
He added:
“It’s important enough for this country to keep rural communities going. And while I don’t like the large payments going to some farmers -- that’s an outright embarrassment -- many of these payments are keeping large sections of rural America from folding up and going down.”6
He explained further why support had been increasing instead of declining (as might have been
expected from the alleged reforms built into the Uruguay Round Agreement on Agriculture):
“‘Nobody talked about this during the presidential election. And you rarely hear it spoken in Congress. But these farm payments have become truly rural support payments.”7
How did U.S. Farm Policy become such a burden to the rest of the world? Reviewing the New
York Times since 2000 is enlightening:
What has happened in rural counties …. completes a full circle, from the creation of farms by government incentive through the Enlarged Homestead Act of 1909 to a period
5 Ibid. 6 Ibid. 7 Ibid.

PART I
5
of prosperity and independence in the 1950’s and 60’s, to the present where government is the only thing keeping people on the old bison grounds of half of Montana. The homesteads have become sources of export crops. Nearly 90 percent of the wheat grown in Montana is sent overseas. But it faces global competition and a glut. Even countries like Pakistan, once seen as a relief target, are now exporting grain. If the Montana growers [of grain] were to try and get by in the free market, they would lose about $2 on every bushel of wheat they grow.8
As the New York Times reported before the 2002 Bill became law:
“… one thing that the people who grow the food and the people who write the checks agree on is that if the government were to suddenly disengage itself from its monumental entanglement with rural America, upwards of half of the 1.6 million farmers in the United States who now receive some form of federal assistance would go out of business.”9 (emphasis added)
“…the big harvest of government checks usually happens in the fall -- $40,000 for just being a farmer, another $40,000 for emergencies like bad market conditions, more than $100,000 for not making any money on what is grown, and $50,000 for taking other land out of production. Good crops or bad, high yields or low -- it hardly matters, the checks roll in from the federal government, the biggest payroll in farm country. By the end of the year, some farmers can receive up to $280,000 simply by having another miserable year of failure.”10
Little had changed by the time of the most recent Farm Bill. After the 2008 Bill was passed, a
Times Editorial explained:
“Last year’s terrible farm bill left the old subsidy system essentially intact.”11 … The Times’s editorial page called the bill “disgraceful.” My former colleagues at The Wall Street Journal’s editorial page ripped it as a “scam.” Yet such is the logic of collective action….
The growers of nearly every crop will get more money. Farmers in the top 1 percent of earners qualify for federal payments. Under the legislation, the government one will buy
8 Ibid. 9 Ibid. 10 Ibid. 11 “Fixing Agriculture”, The New York Times (Editorial), December 19, 2008

PART I
6
sugar for roughly twice the world price and then resell it at an 80 percent loss. Parts of the bill that would have protected wetlands and wildlife habitat were deleted or shrunk. Senator John McCain declared: “It would be hard to find any single bill that better sums up why so many Americans in both parties are so disappointed in the conduct of their government, and at times so disgusted by it.”12
The Wall Street Journal refers to the 2008 Farm Bill as “The No Farmers Left Behind Act”:
“Total farm income is expected to leap by 44% to $73 billion this year, according to the USDA. The average income of full-time farmers hit $81,420 last year, with large corporate farms earning in the millions of dollars. Meanwhile, farmland prices in the past five years have increased by $200 billion a year, or an average asset gain of $100,000 per year per full-time farmer. And yet Congress is writing another five-year farm bill as if this were 1936 and the Okies roamed the plains.”
The Times provided some very useful insights from the legislators:
• “Senator Saxby Chambliss of Georgia, the senior Republican on the agriculture committee. “Given the amount of investments in the many critical areas to all Americans in this bill, it is actually inaccurate to simply call this a farm bill.”…
• “Representative Ron Kind, Democrat of Wisconsin, “You need a few members of Congress here to stand up today and say the emperor has no clothes… The president is right. We ought not be giving taxpayer subsidies to wealthy individuals at a time of record-high commodity prices in the marketplace.”
• Representative Jeff Flake, Republican of Arizona, “Sometimes here in Washington, we tend to drink our own bath water and believe our own press releases. And to hear some of the debate here, you would think this is the best bill in the world and that everybody out there has just got to support it.”
• Ken Cook, the president of Environmental Working Group, an advocacy group that is
a fierce critic of farm subsidies, said the status quo was exactly what taxpayers got in the bill. “If you are not going to make these changes now, when on earth are you going to make them?” Mr. Cook asked. “It really is shocking that they did so little.” He added, “It’s a measure of the pressure this bill can put on people. If you are from subsidy country, you are expected to bring home the bacon.”13
12 “Talking Versus Doing”, By David Books, The New York Times, May 20, 2008 13 “Reaching Well Beyond the Farm”, By David M. Herszenhorn, The New York Times, May 20, 2008

PART I
7
We have charted the USDA data on farm gate subsidies and a) cash costs and b) fully absorbed
costs.
To the extent that dairy processors purchasing Class II, Class III and Class IV milk for their
operations, they are receiving substantial benefits from the system.
We estimate that the total benefit to U.S. dairy production provided through U.S. Federal, State
and local programs in FY 2015 was US$12.06 per cwt or $35.02CAD14 per hl. Total value of
U.S. Federal Government subsidies and support to agriculture is the aggregate of the USDA.
Since our last study, support in Canadian dollars per hl15 through U.S. Federal and State
subsidies have increased from $31.11CAD per hectolitre in FY 2009 following the 2008 Farm
Bill16 to $35.02 CAD17 in 2015 under the 2014 Farm Bill.18 Post 2014 Farm Bill benefits are
summarized below:
Summary of U.S. Subsidies to Dairy (2015)
Per cwt Per hl US$ CAD$ US$ CAD$ Federal 10.70 13.68 24.29 31.05 State/Local 1.36 1.74 3.09 3.97 Total 12.06 15.42 27.38 35.02
Program Levels, irrigation infrastructure support and undeclared below market price/cost water.
These values were calculated as follows:
• In 2015, the estimated total value of USDA programs was US$210,703,000,000.19 The allocation to dairy products $22,208,096,200 or $10.65 cwt. To this must be
14 Unless otherwise indicated all values are in U.S. dollars. 15 Using the Bank of Canada average exchange rate for 2015 (1.27871080) 16 Food, Conservation and Energy Act of 2008 (2008 Farm Bill) 17 Using the Bank of Canada average exchange rate for 2015 (1.2787) 18 The Agricultural Act of 2014 (2014 U.S. Farm Bill) 19 FY 2017 Budget Summary, U.S. Department of Agriculture, pg 111

PART I
8
added benefits from the dairy’s share for irrigation infrastructure approved by the Department of the Interior budget.20
• The value of support to irrigation infrastructure provided by the Department of the Interior was $892,000,000 of which $94,016,800 was allocated to dairy. This is equivalent to $0.05 per cwt.
• State and local government support, including irrigation water subsidies is US$27,049,918,596 of which US$2,851,061,420 was allocated to dairy. This represents US$1.36 per cwt
In 2015, total U.S. production of milk was 208,603,000,000 lbs.21 or 2,086,030,000 cwt. The
estimated value of support was divided by this volume to develop per cwt values. The per cwt
values were converted to per hectolitre (hl) by multiplying by 2.27.
We employed a conservative methodology to determine the total value of federal support to be
allocated to dairy production in 2015. We believe that our estimates may understate benefits to
the dairy sector because:
• We did not estimate price support benefits.
• Our allocation methodology was based on dairy’s share of gross farm receipts without adjusting for the 50% of U.S. agriculture which does not benefit from subsidies.
• We did not include in our analysis of export subsidies benefits of de facto Article 9.1(c) export subsidies in order to avoid double counting.
In order to understand the dynamics and pervasive influence of undisciplined domestic support,
we have compared it to costs of production and the farm gate prices for milk in the USA.
20 FY 2017 Appendix Budget, U.S. Department of the Interior, pg 665 21 Using the Bank of Canada average exchange rate for 2015 (1.27871080)
PART I
9
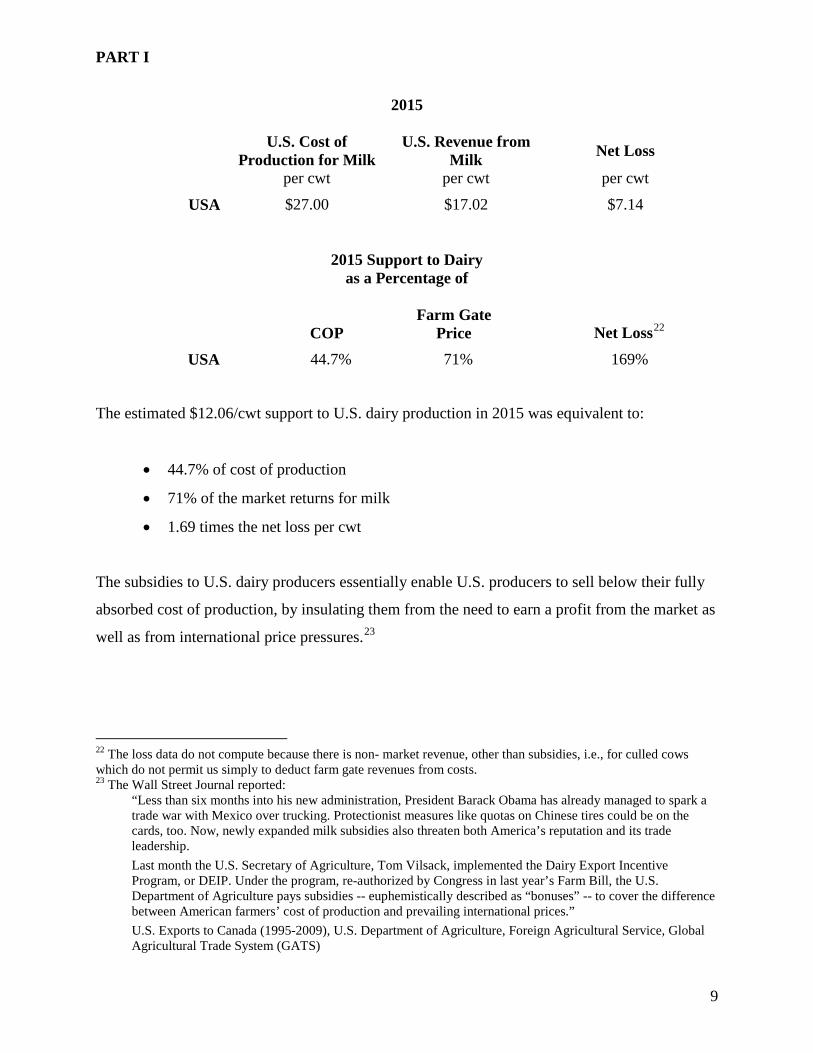
2015
U.S. Cost of Production for Milk
U.S. Revenue from Milk Net Loss
per cwt per cwt per cwt
USA $27.00 $17.02 $7.14
2015 Support to Dairy as a Percentage of
COP Farm Gate
Price
Net Loss22
USA 44.7% 71% 169%
The estimated $12.06/cwt support to U.S. dairy production in 2015 was equivalent to:
• 44.7% of cost of production
• 71% of the market returns for milk
• 1.69 times the net loss per cwt
The subsidies to U.S. dairy producers essentially enable U.S. producers to sell below their fully
absorbed cost of production, by insulating them from the need to earn a profit from the market as
well as from international price pressures.23
22 The loss data do not compute because there is non- market revenue, other than subsidies, i.e., for culled cows which do not permit us simply to deduct farm gate revenues from costs. 23 The Wall Street Journal reported:
“Less than six months into his new administration, President Barack Obama has already managed to spark a trade war with Mexico over trucking. Protectionist measures like quotas on Chinese tires could be on the cards, too. Now, newly expanded milk subsidies also threaten both America’s reputation and its trade leadership. Last month the U.S. Secretary of Agriculture, Tom Vilsack, implemented the Dairy Export Incentive Program, or DEIP. Under the program, re-authorized by Congress in last year’s Farm Bill, the U.S. Department of Agriculture pays subsidies -- euphemistically described as “bonuses” -- to cover the difference between American farmers’ cost of production and prevailing international prices.” U.S. Exports to Canada (1995-2009), U.S. Department of Agriculture, Foreign Agricultural Service, Global Agricultural Trade System (GATS)

PART I
10
Ostensibly domestic subsidies to the U.S. dairy sector benefit U.S. milk exports because they
permit exports at below fully absorbed cost of production. U.S. dairy exports have increased by
322% from $1,628,928,000 in 2005 to 5,240,047,000 in 2015.24 U.S. exports of dairy products
to Canada increased from $221,155,000 in 2005 to $553,702,000 in 2015, or by 250%.25
Subsidies allow the U.S. dairy producers to survive until market conditions improve.
These substantial subsidies have resulted in increased production and exports. The U.S. has
changed from being a net importer of dairy products to a net exporter- a development which we
link to the increased activity by Cooperatives Working Together in subsidizing exports - largely
of cheese and butter.
24 U.S. Exports to Canada (1995-2017), U.S. Department of Agriculture, Foreign Agricultural Service, Global Agricultural Trade System (GATS) 25 Ibid.

PART I
11

PART I
12
USDA data shows that farm gate prices for milk over the last 12 years have been less than fully
absorbed costs. The following graph shows the year to year losses which benefit U.S. dairy
processors and stimulate U.S. dairy exports, not to mention frustrating imports of dairy products

PART I
13
Fixed costs are sunk costs, but the following chart shows that in the last 10 years U.S. dairy
farmers on the whole did not cover cash costs in 5 years.

PART I
14
California is the largest dairy producing state. The steady losses from full cost and sharp losses
in 2015-16 explain California producer lobbying to join the Federal Milk Marketing Order.

PART I
15

PART I
16
Wisconsin is the largest cheese producing state. And home of the Mega (5000 cow plus) dairy
State producers on average have not covered their fully absorbed costs in at least 12 years. Cash
Costs were covered in five of the last 12 years.

PART I
17
PART I
18
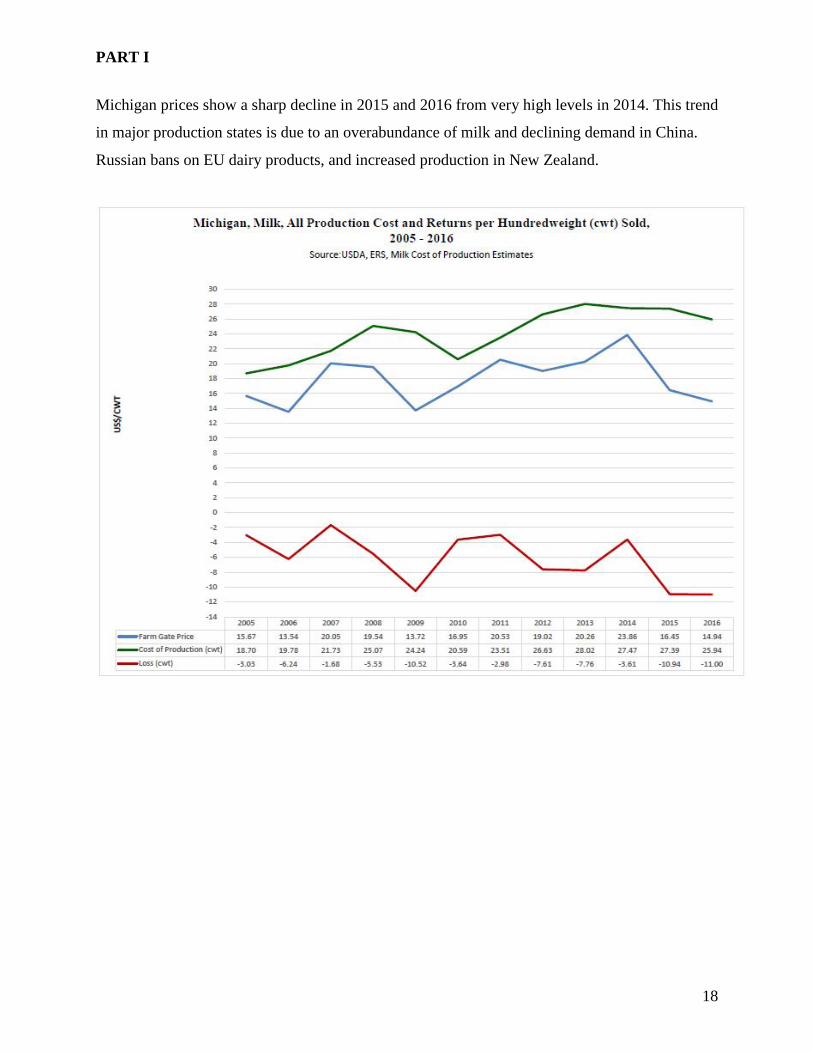
Michigan prices show a sharp decline in 2015 and 2016 from very high levels in 2014. This trend
in major production states is due to an overabundance of milk and declining demand in China.
Russian bans on EU dairy products, and increased production in New Zealand.

PART I
19

PART I
20
New York data is significantly worse than the national average. The loss over fully absorbed cost
in 2016 was U.S. 16.34 /cwt.

PART I
21
PART I
22
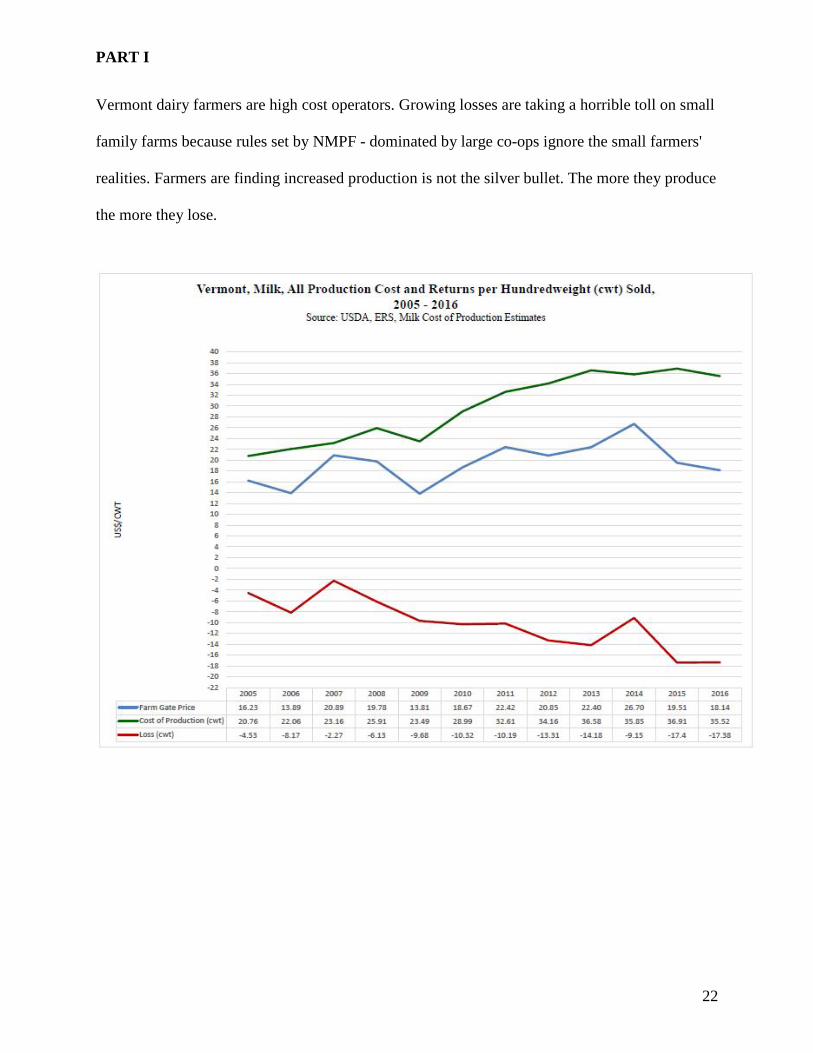
Vermont dairy farmers are high cost operators. Growing losses are taking a horrible toll on small
family farms because rules set by NMPF - dominated by large co-ops ignore the small farmers'
realities. Farmers are finding increased production is not the silver bullet. The more they produce
the more they lose.

PART I
23
These comparisons show the following national deficits, i.e., costs exceed farm gate prices.
National New York California Wisconsin Michigan Vermont 2005 3.23 6.69 0.17 3.88 3.03 4.53 2006 6.04 10.99 3.03 5.53 6.24 8.17 2007 1.62 5.26 +1.12 0.52 1.68 2.27 2008 5.56 8.92 4.65 4.25 5.53 6.13 2009 9.47 12.27 6.53 9.24 10.52 9.68 2010 4.56 6.37 2.06 7.79 3.64 10.32 2011 4.21 5.66 2.77 6.51 2.98 10.19 2012 6.75 9.11 4.38 10.09 7.61 13.31 2013 7.48 10.72 4.57 13.97 7.76 14.18 2014 3.85 8.25 2.46 7.40 3.61 9.15 2015 9.98 14.65 10.36 10.16 10.94 17.40 2016 10.16 16.34 10.14 10.07 11.00 17.38

PART I
24
Methodology
This study is comprised of two Parts. In Part I, we review support provided under U.S. Federal
Government agricultural programs and Federal-State government shared cost programs. In Part
II of this study, support under U.S. State and local government agricultural programs is
reviewed. Other sub-national government support is also captured in Part II.
This study analyzes and quantifies all publicly available information on federal and state
programs that directly or indirectly support U.S. agriculture. These include domestic support
programs, export subsidy programs, conservation programs, crop and livestock gross margin,
insurance programs, risk management programs, disaster relief assistance programs, loan
programs, crop insurance and livestock support programs as well as renewable fuels incentives
and subsidies and irrigation programs.
For each reviewed program or support activity, this study provides the following:
(a) a brief description of the program;
(b) an assessment of the WTO compatibility of the program
(c) expenditures made or support provided under the program; and
(d) the portion of such support allocated to U.S. dairy production.
The objective of this study is to determine:
(a) the total value of current and projected support;
(b) the total amount of support and subsidies directly and indirectly related to dairy production;
(c) the estimated benefits of such support per hectolitre of milk produced in the USA; and
(d) the relationship between internal support and subsidies and import tariffs. Overall, USDA data suggests that the support available to the U.S. dairy industry is both
production and trade distorting. Similar benefits are available to much of U.S. agriculture and

PART I
25
Farm Bills have traditionally provided very generous support. However, our objective is to
analyze the direct and indirect benefits to U.S. dairy producers.
Part I of this study, which reviews all agricultural support programs maintained by the U.S.
Federal Government, is divided into the following Sections:
I. Overview
II. Domestic Support
III. Export Subsidies
IV. International Food Assistance
V. Agricultural Marketing Services
VI. Conservation Programs
VII. Crop Insurance
VIII. Rural Development
IX. Animal and Plant Health Inspection Services (APHIS)
X. Food Safety and Inspection
XI. Food and Nutrition Services
XII. Grain Inspection, Packers and Stockyard Administration (GIPSA)
XIII. Forest Service
XIV. Research, Education and Economics
XV. Irrigation Infrastructure
We have addressed the major programs and many but have not discussed all of the component
parts, i.e., in Part I in the case of the Commodity Credit Corporation we reviewed major
programs but not all of the grant and loan problems which the CCC administers. We have not
analyzed certain benefits specific to cotton and peanuts as they are too remote to dairy.
Arguably, we could have included these programs because our allocation methodology was
based on average participation, but our desire to pursue a conservative approach argued that we
should not. In some other cases, where the interest and benefits to the dairy sector are indirect,
we have listed the various programs administered by a sub agency with their budget codes and
analyzed the overall program. We have reviewed all activities, but in some cases we did not

PART I
26
specifically analyze or address each of the component parts. This was done to avoid repetition
and to try to make a very complex report more reader-friendly.
The decision to divide Part I of this study into a number of Sections, including specific sections
on Domestic Support and Export Subsidies, should not be taken as an indication that support
provided to U.S. agriculture considered in other sections of this study are not subsidies. All of
the programs reviewed provide subsidies or support of some kind. The decision to sub-divide
the study, and to select individual programs for analysis, as noted above, was taken to try to
make the study more reader-friendly and not to indicate that programs not selected or designated
are outside the scope of the sections on Domestic Support and Export Subsidies or that they do
not provide important support and subsidies to U.S. agriculture.
Use of the phrase subsidies and support means the full range of all programs and activities
related to financial and other support undertaken or provided by governments in the USA.
De Minimis (DM) Exemptions
DM exemptions are amber box outlays that, when measured as a share of a defined total output
measure (total or product-specific), are sufficiently small (i.e., less than 5%) as to be deemed
benign. DM exemptions are identified as either product- or non-product-specific.
Product-Specific DM Exemptions
Product-specific amber box outlays have included payments made under the following programs:
the sugar program, Dairy Product Price Support (DPPS) program, Milk Income Loss Contract
(MILC) program, Countercyclical (CCP) payments, Marketing Loan (MLP) program, Average
Crop Election (ACRE) payments, Supplemental Crop Revenue Assurance (SURE) program,
crop insurance subsidies, farm storage facility loans, and commodity loan interest subsidies. U.S.
product-specific DM exemptions averaged $361 million annually during 1995-2011, including a
low of $29 million in 1999 and a high of $1.6 billion in 2002. Every program commodity, with
the exception of dairy and sugar, has claimed product-specific DM at some point during the past

PART I
27
17 years. In 2012, with the inclusion of crop insurance premiums, product-specific DM
exemptions jumped to $5.0 billion, up from $0.5 billion in 2011.
Non-Product-Specific DM Exemptions
The non-product-specific exemption is the largest and most favorable in terms of its more
generous spending limit—5% of the value of total agricultural output, inclusive of all crops and
livestock products. Since 1995, U.S. agricultural production has ranged in total value from
$184.7 billion in 1999 to a high of $396.6 billion in 2012. As a result, the U.S. non-product-
specific DM exemption upper limit has ranged from a low of $9.2 billion in 1999 to a high of
$19.8 billion in 2012.
During the first 17 years of U.S. notifications of domestic spending to the WTO (i.e., 1995 to
2011), non-product-specific DM outlays averaged $4.9 billion, including a high of $9.2 billion in
2011—all well within the DM limit. This category of U.S. program outlays saw considerable
growth through 2011, driven largely by growth in U.S. crop insurance premium subsidies, which
accounted for $7.5 billion of the $9.2 billion in non-product-specific DM outlays in 2011. This
changed in 2012.
Crop Insurance Reclassification: Non-Product- to Product-Specific Support
Through 2011, U.S. crop insurance premium subsidies were notified as non-product-specific
amber box outlays. As a result, despite their large size and importance as a share of domestic
support outlays, premium subsidies were routinely exempted from counting against the U.S.
amber box limit under the relatively high DM threshold for non-product-specific spending.
Furthermore, this notification strategy by the United States has never been challenged despite the
fact that individual policies are purchased for coverage of a specific commodity—for example, a
corn revenue policy or a soybean yield policy.
In its most recent notification (2012), the United States changed its notification status for crop
insurance premium subsidies to product-specific amber support. As such, any product-specific

PART I
28
support is first evaluated against 5% of the value of that specific commodity. When a product-
specific subsidy is in excess of its 5% product-specific DM exemption threshold, then the entire
amount of subsidies for that commodity must be counted against the $19.1 billion amber box
limit. As a result, instead of exempting the entire $7 billion in premium subsidies in 2012 under
the non-product-specific DM exemption, $5 billion were exempted under product-specific DM
exemptions. The remaining $2 billion in product-specific premium subsidies exceeded the
individual product DM thresholds (for wheat, cotton, sorghum, canola, dry beans, dry peas, and
flaxseed) and thus counted against the aggregate amber box limit of $19.1 billion.2658
For example, in 2011 the United States was able to exclude $7.5 billion of crop insurance
premium subsidies and $1.4 billion of SURE payments from counting against its $19.1 billion
amber box limit under the non-product-specific DM exemption. In contrast, in its 2012
notification crop insurance premium subsidies were reclassified as product-specific support. As a
result, the United States excluded a much-reduced $0.3 billion of potential amber box outlays
under the non-product-specific DM exemption. Non-product-specific DM exemptions are likely
to remain insubstantial going forward. In contrast, the product-specific DM exemption rose to
$5.0 billion in 2012 after averaging under $0.4 billion annually since 1995.2759
Other Non-Product-Specific Support Is Minimal
Apart from crop insurance premium subsidies, other U.S. farm programs that have been notified
as non-product-specific DM outlays in the past have included CCP payments, irrigation and
grazing subsidies, payments under the Supplemental Crop Revenue Assurance (SURE) program,
and payments made under two bioenergy programs—the Rural Energy for America Program
(REAP) and the Biomass Crop Assistance Program (BCAP).28 Both the SURE and CCP
programs no longer exist, while the REAP and BCAP programs are relatively small in terms of
26 This appears to be a strategy designed to facilitate compliance under a future successful Doha-Round-like agreement. For a related discussion, see CRS Report RS22927, WTO Doha Round: Implications for U.S. Agriculture. 27 This notification change is visible as the decline in the red bar between 2011 and 2012 in Figure 1 and the concomitant increase in the yellow bar for those same years. 28 REAP was originally classified as green box; however, in its 2011 notification to the WTO, USDA reclassified REAP payments as non-product-specific amber box spending.

PART I
29
potential outlays.29 Federal irrigation and grazing subsidies have been small (relative to crop
insurance subsidies) and unvarying since 2008, at $200 million and $45 million per year,
respectively.
Subsidies to Agribusiness30
David Dayen in an analysis in New Republic explained the continuing bank-rolling of
agribusiness. The politicians patting themselves on the back for repealing subsidies to farmers
have found a surreptitious way to deposit these savings right back in the pocket of agribusiness.
That’s because the farm bill will expand subsidies for crop insurance, which looks like a private-
sector program but which actually hands over virtually the same amount of taxpayer money to
farmers, mostly wealthy ones, as the old direct payment program. What’s more, the shift from
direct payments to crop insurance ensures that those handouts can be distributed in a hidden, more
politically palatable way, making it more difficult to ever dislodge them.31
Federally subsidized crop insurance programs pay almost two-thirds of a farmer’s premium, as
well as most of the insurance claims, guaranteeing revenue regardless of crop failure or even price
swings. The current farm bill expands the program to cost the government $90 billion over ten
years, an increase of $7 billion. But that’s just an estimate, which may be low. Farmers received
$16 billion in crop insurance payments alone during last year’s Midwest drought, most of it paid
by the federal government. Despite the poor conditions, net agriculture income increased 15
percent last year, a tribute to the relative pointlessness of the subsidies.32
There have traditionally been no limits to premium support, meaning the richest businesses reap
the most benefits. A provision from Senator Tom Coburn to reduce payouts for farmers with over
$750,000 in income was stripped from the final bill, despite passing the Senate twice. The
29 Under the 2014 farm bill, mandatory funding of $50 million per year and discretionary funding of $20 million per year were authorized for REAP, while BCAP funding was limited to mandatory funding of $20 million per year for FY2014-FY2018. 30 “The Farm Bill Still Gives Wads of Cash to Agribusiness. It's Just Sneakier About It.”, New Republic Magazine, by David Dayen, February 4, 2014 31 “The Farm Bill Still Gives Wads of Cash to Agribusiness. It's Just Sneakier About It.”, New Republic Magazine, by David Dayen, February 4, 2014 32 Ibid.

PART I
30
Environmental Working Group, a critic of crop insurance, estimates that 10,000 policyholders
receive over $100,000 a year in subsidies annually, with some receiving over $1 million, while
the bottom 80 percent of farmers, the mom-and-pop operations, collect only $5,000 annually.33
The generosity of the program also leads insurers to cover outsized risk, with farmers planting in
low-yield areas, knowing they will get rewarded either way.34
Under Price Loss Coverage (PLC), farmers receive payments if prices for corn, soybeans and 12
other crops dive below a certain level. But the bill raises that floor price in ways that almost
guarantee payouts for some crops, particularly rice and cotton, which are coincidentally the crops
for which farmers pre-2014 Farm Bill, most frequently received direct payments. There already
exists a perfectly good check on crop price swings, known as the commodity futures markets,
where producers can lock in rates and guard against forthcoming instability. Price Loss Coverage
is duplicative and forces taxpayers to guarantee revenue for private businesses.35
Another program, called Agriculture Risk Coverage (ARC), would cover “shallow losses” which
are not covered under crop insurance deductibles. In other words, if a farmer experienced a 15
percent loss and his crop insurance carried a 25 percent deductible, Agriculture Risk Coverage
would cover the gap. But this makes the deductible irrelevant and ensures that farmers get
compensated for virtually any loss. Overall, of the $40 billion in projected savings over ten years
from ending direct payments, $27 billion go right back into these insurance programs.36
As Scott Faber of EWG put it, “We’re replacing a discredited subsidy with a soon-to-be
discredited subsidy.”37
Suzanne Mettler, Professor at Cornell University calls it “the submerged state.” So many federal
social programs lurk underneath the surface that the public cannot get a good handle on who
benefits from government largesse. “Appearing to emanate from the private sector, such policies 33 Ibid. 34 Ibid. 35 Ibid. 36 Ibid. 37 Ibid.

PART I
31
obscure the role of the government and exaggerate that of the market,” Mettler says. And the vast
majority of these programs benefit the wealthy, refuting the conceit that the rich boldly succeed
without a government safety net protecting them.38
It’s easier to denounce a farmer getting paid not to plant their field than to decry an overly
generous insurance payout. Congress, particularly a Senate that over-represents rural agricultural
states, knows well how to hide the ball in this fashion, keeping the focus on undeserving food
stamp recipients rather than undeserving agribusinesses.39
Doha Round Implications
A consideration for U.S. policymakers is the potential for expanded domestic support programs
to sidetrack or delay progress in multilateral trade negotiations.40 From the U.S. perspective, a
successful Doha agreement (under the current negotiating text) would significantly lower
allowable spending limits for certain types of U.S. domestic support and eliminate export
subsidies, while allowing U.S. agricultural products wider access to foreign markets. Key
proposals with respect to new or revised disciplines on farm programs under the comatose 2008
Doha Round texts include two objectives.41
First, spending limits (total and product-specific) for the amber box and the two DM exemptions
would be reduced substantially, while a limit would be established on the otherwise unbounded
blue box.
• The total limit for U.S. amber box spending would be reduced to $7.6 billion (down from
the current $19.1 billion limit), while new product-specific limits would be established at
the average annual support received during the 1995-2000 period.
38 Ibid. 39 Ibid. 40 For a full discussion of this issue, see CRS Report RS22927, WTO Doha Round: Implications for U.S. Agriculture. 41 Although not formally approved by the entire WTO membership, the negotiating texts represent agreement among the three countries with the largest domestic support programs—the United States, the European Union, and Japan.

PART I
32
• DM exemption limits for non-product-specific outlays would be set at $4.85 billion (as
compared to the current variable limit based on total U.S. production, which has averaged
$16 to $20 billion), and for product-specific outlays at 2.5% of the average annual
production value during the 1995-2000 period, thus establishing a historical base at a
level substantially below current production values.
• Blue box limits would be established for non-product-specific outlays at $4.85 billion,
and for product-specific outlays at 110% or 120% of the annual average during the 2002-
2007 period.
Second, a global spending limit—referred to as the overall trade-distorting domestic support
(OTDS)—encompassing the four categories of the amber box, the two DM exclusions, and the
blue box would be established at a level substantially smaller than the sum of their individual
limits. Finally, the criteria for exemption status in the green box would be tightened.
Potential program spending under the new suite of domestic support programs authorized by the
2014 farm bill might exceed the tighter spending limits proposed under the Doha Round draft
modalities. For example, the proposed limits for amber box outlays of $7.6 billion are well below
USDA’s May 2014 projections for PLC and ARC outlays of $10.1 billion in crop year 2015 and
$10.9 billion in 2016.42
U.S. Farm Bill Policies
Clearly, it is Government support and not market forces which influence production decisions
and farm income in the USA. And this is not likely to change. After Congress rejected the
President’s efforts to bring some discipline to the system because of the record high prices for
many farm products, the New York Times explained:
42 “Final Rule: Agriculture Risk Coverage and Price Loss Coverage Programs,” Federal Register, vol. 79, no. 187, September 26, 2014.

PART I
33
“Few pieces of legislation generate the level of public scorn consistently heaped upon the farm bill. Presidents and agriculture secretaries denounce it. Editorial boards rail against it. Good-government groups mock it. Global trading partners formally protest it. Even farmers gripe about it. But as Congress proved again last week, few pieces of major legislation also get such overwhelming bipartisan support – enough, in the case of the current farm bill, to override the veto expected by President Bush any day now….43
One must wonder how U.S. subsidies to agriculture continue on such a massive, obscene scale.
Over the 25 years we have been analyzing U.S. Farm Bills we have reviewed hundreds of
editorials in the U.S. press, most of them critical of past and current Farm Bills and subsidies.
Farm Bill
The Congressional Budget Office (CBO) estimates that payments disbursed by the Commodity
Credit Corp., the entity that distributes agricultural subsidies, will surge to approximately $10.2
billion in 2017 — almost $3 billion more than during the 2015-2016 fiscal year.44
Farm subsidy programs in total cost American taxpayers about $20 billion a year. When adding
programs such as SNAP (food stamps) and subsidized school meals, which arguably benefit big
agribusiness firms more than the working poor or students and the Women, Infants and Children
special supplement (WIC) nutrition programs, that total climbs even higher. Some of the largest
companies in the U.S. have not only lobbied against cuts to any food subsidy programs, but they
have also opposed any changes to these subsidies that could encourage more healthful eating
habits.45
43 “Reaching Well Beyond the Farm”, By David M. Herszenhorn, The New York Times, May 20, 2008 44 “Annual Farm Subsidies to Reach 10-Year High”, Food & Agriculture, by Leon Kane, April 15, 2016 45 Ibid.

PART I
34
A study by the House Agriculture Committee tracked expenditures on different food types as
follows:46
These data demonstrate that more than out 10.54 % dairy factor is accounted for by dairy
expenditures, assuming (ice cream is a frozen dessert).
Farmers who raise crops such as corn, soy or wheat cannot get any subsidies if they grow fruits
or vegetables on that same land. And while subsidizing the cultivation of berries and greens
would be a fool’s game, access to crop insurance would help encourage crops far more
healthful.47
46 Past, Present, & Future of SNAP, House Agriculture Committee Report, December 7, 2016, pg 54 http://agriculture.house.gov/uploadedfiles/snap_report_2016.pdf 47 “Annual Farm Subsidies to Reach 10-Year High”, Food & Agriculture, by Leon Kane, April 15, 2016

PART I
35
SUMMARY OF DAIRY TITLE PROVISIONS48
The U.S. dairy program underwent dramatic changes in the 2014 Farm Bill—the Dairy Product
Price Support (DPPS) program, the Milk Income Loss Contract (MILC) program, and the Dairy
Export Incentive Program were all eliminated.
Notifications for DPPS averaged $4.2 billion annually during the 1995-2011 period (primarily
the result of tariff rate quota protection), making it the single largest component of U.S. product-
specific amber box notifications, even though federal outlays averaged only $443 million over
the same period.49 MILC program outlays were much smaller, due to their counter-cyclical
design and a strict per-farm cap on payments, averaging about $287 million per year during the
1995-2011 period.50 Repeal of the DPPS and MILC programs frees up substantial space for new
program spending under the $19.1-billion U.S. amber box limit.
The repealed dairy programs have been replaced with a new insurance-like margin deficiency
payment program—the Dairy Margin Protection Program (DMPP)—that makes payments to
participating dairy producers when the national milk margin (calculated as the average farm
price of milk minus a formula-based average feed ration) falls below $4.00 per hundredweight
(cwt), with coverage at higher margin levels up to $8.00/cwt available for purchase.51 Under this
DMPP program design, payments are coupled to current market prices and recent historical
farm-level production (i.e., the maximum annual output during 2011-2013), with no payment
limit or cap on potential outlays at either the farm or national level.
48 2014 Farm Bill – Summary of Dairy Title Provisions, February 7, 2014 http://www.nmpf.org/files/file/Farm-Bill-Dairy-Title-Summary-012814.pdf 49 A modification to the DPPS program in the 2008 farm bill—switching the focus away from supporting the fluid milk price and to directly supporting dairy product prices—had lowered the annual notification to an average of $2.8 billion during 2008-2011. 50 MILC outlays ranged from a low of $0 in 2001 to a high of $1.8 billion in 2002. 51 For program details, see CRS Report R43465, Dairy Provisions in the 2014 Farm Bill (P.L. 113-79).
PART I
36
Milk Margin Protection Program
The main feature of the new Farm Bill Dairy Title is the Dairy Producer Margin Protection
Program. The Margin Protection Program is a new and unique safety net program that will
provide dairy producers with indemnity payments when actual dairy margins are below the
margin coverage levels the producer chooses on an annual basis. Its focus is to protect farm
equity by guarding against destructively low margins, not to guarantee a profit to individual
producers. The Farm Bill requires the Margin Protection Program to be established no later than
September 1, 2014.52
The program supports producer margins, not prices and is designed to address both catastrophic
conditions as well as prolonged periods of low margins. Under this program, the “margin” will
be calculated monthly by USDA and is simply defined as the all-milk price minus the average
feed cost. Average feed cost is determined using a feed ration that has been developed to more
realistically reflect those costs associated with feeding the entire dairy farm enterprise consisting
of milking cows, heifers, and other related cost elements.53
Margin Protection Program details are as follows:54
1. All dairy operations will be eligible to participate in the program. If one or more dairy
producers participate in the production and marketing of milk on a single operation, all
producers will be treated as a single dairy operation. If a dairy producer operates two or
more operations, each operation will be required to register separately to participate in
the program.
2. In the first year of the Margin Protection Program, coverage will be limited solely to
the volume of milk equivalent to the producer’s production history. Production history
is defined as the highest level of annual milk production during 2011, 2012 or 2013. In
52 2014 Farm Bill – Summary of Dairy Title Provisions, February 7, 2014 http://www.nmpf.org/files/file/Farm-Bill-Dairy-Title-Summary-012814.pdf 53 Ibid. 54 Ibid.

PART I
37
subsequent years, annual adjustments to the producer’s production history will be made
based on the national average growth in overall US milk production as estimated by
USDA. Any growth beyond the national average increase will not be protected by the
program.
3. In 5 percent increments, producers will be able to protect from 25 percent up to 90
percent of their production history.
4. Producers will be able to select margin protection coverage at 50 cent increments
beginning at $4 per cwt. through $8 per cwt. Premiums will be fixed for 5 years
(through 2018) and are as follows:
Marketings Under 4 Million Pounds Marketings Over 4 Million Pounds Coverage Level Premiums* Coverage Level Premiums
$4.00 None $4.00 None $4.50 $.01 $4.50 $.02 $5.00 $.025 $5.00 $.04 $5.50 $.04 $5.50 $.10 $6.00 $.055 $6.00 $.155 $6.50 $.09 $6.50 $.29 $7.00 $.217 $7.00 $.83 $7.50 $.30 $7.50 $1.06 $8.00 $.475 $8.00 $1.36
*Except for the premium at the $8.00 level, these premiums will be reduced by 25 percent for each of calendar years 2014 and 2015 and only for marketings under 4 million pounds.
5. Payments will be made to producers based on the percentage of their production history
they have chosen to protect (25-90 percent) and the level of margin coverage they have
selected ($4.50 to $8 per cwt). Payments will be distributed when margins fall below $4
(or below the selected level of coverage if a producer has selected a level above $4),
averaged over any of these consecutive two-month periods: Jan-Feb, Mar-Apr, May-
Jun, Jul- Aug, Sep-Oct, Nov-Dec.
6. Farmers will pay an annual administrative fee of $100 in order to access the new
Margin Protection Program.
PART I
38
7. Should conditions warrant, the MILC payments will be temporarily available for dairy
producers until the implementation of the Margin Protection Program or September 1,
2014 – whichever occurs first.
Some economists have argued that the proposed margin program fails to follow sound insurance
principles: (1) premiums do not reflect the anticipated risk environment in milk and feed
markets; and (2) the proposed margin insurance program does not use a rating method to update
premiums—instead, premiums are fixed for the life of the Farm Bill.55 Another factor in
determining WTO compliance and the degree of potential market distortion is the share of the
premium paid by the federal government.56 The lower the statutorily fixed premiums are relative
to the expected indemnity (i.e., the less actuarially sound) or the higher the share of the premium
paid by the federal government, the greater will be the incentive to increase milk production
transmitted to producers by the program.
When the program was introduced, it was estimated that had it been in effect during the 2008
Farm Bill it would have paid dairy farmers $1 billion more than MILC.57
According to one economic analysis, if milk margins fall to levels that activate indemnity
payments, then a weakened feedback process between producers and market price signals could
(1) prevent normal market adjustment to milk production, prices, and margins (in other words,
producers will not get the necessary market signal to cut back on production) and (2) result in
persistent oversupply, lower margins, lower farm incomes, and larger federal expenditures than
would have occurred under the previous suite of dairy price and income support programs.58 The
same study found that the program design—the provision that producers may purchase coverage
55 John Newton and Cam Thraen, “The Dairy Safety Net Debate of 2013 Part I: Questions and Answers,” farmdocdaily.com, Department of Agricultural and Consumer Economics, University of Illinois at Urbana-Champaign, December 17, 2013. 56 The fixed nature of the DMPP premium implies that the federal subsidy share is both indirect and varies with the underlying risk conditions. 57 Dairy Margin Protection Program – USDA, https://www.fsa.usda.gov/programs-and-services/Dairy-MPP/index 58 C. F. Nicholson and M. W. Stephenson, “Dynamic Market Impacts of the Dairy Margin Protection Program of the Agricultural Act of 2014,” Program on Dairy Markets and Policy Working Paper Series, Working Paper No. WP14-03, May 2014.

PART I
39
on as much as 90% of their recent historical maximum output; and the $8.00/cwt maximum
coverage option, which represents 93% of the national average milk margin during the 15-year
period preceding DMPP implementation—could result in annual outlays of as much as $5 billion
during low-margin periods, as experienced during 2009 and 2012.59 However, current market
analysis suggests that DMPP payments are unlikely to be triggered, due to strong dairy product
prices and weak feed prices.60
In the initial sign-up for DMPP for 2015, over 50% of U.S. dairy farms elected to participate.61
Of these, 55% elected to purchase coverage at levels above the $4 minimum margin. Since the
first year of coverage, 2015, is still ongoing, final market conditions and program costs (and
potential market distortions) are still uncertain.
Dairy Product Donation Program
The new Farm Bill also creates a new Dairy Product Donation Program that would be triggered
in the event of extremely low operating margins for dairy farmers and would also provide
nutrition assistance to individuals in low income groups by requiring USDA to purchase dairy
products for donation to food banks and other feeding programs.62
The new program would only activate if margins fall below $4.00 for two consecutive months
and would require USDA to purchase dairy products for three consecutive months, or until
margins rebound above $4.00. The program would trigger out if US prices exceed international
prices by more than 5%. Under this provision USDA would purchase a variety of dairy products
to distribute to food banks or related non-profit organizations. USDA is required to distribute,
not store, these products.63
59 In contrast, the CBO April 2014 baseline projects DMPP net outlays of about $84 million per year through 2024. 60 Using CBO April 2014 baseline projections for the price of all-milk compared with the feed ration cost generated using the FAPRI November 2014 price projections, CRS estimates that the annual average margin stays above $8.00 through 2018. Actual margin payments are based on a moving two-month average, not the annual average. 61 “USDA Provides Additional Data on Dairy Farms Enrolled in Margin Protection Program,” news release, January 16, 2015, National Milk Producers Federation, http://www.nmpf.org. 62 2014 Farm Bill – Summary of Dairy Title Provisions, February 7, 2014 http://www.nmpf.org/files/file/Farm-Bill-Dairy-Title-Summary-012814.pdf 63 2014 Farm Bill – Summary of Dairy Title Provisions, February 7, 2014 http://www.nmpf.org/files/file/Farm-Bill-Dairy-Title-Summary-012814.pdf

PART I
40
Organizations receiving USDA purchased dairy products would be prohibited from selling the
products back into commercial markets.64
Programs That Were Renewed
Three existing dairy programs will be renewed under provisions of the new Farm Bill: the Dairy
Promotion and Research Program (“checkoff”), the Dairy Indemnity Program, and the Dairy
Forward Pricing Program. The authority for all three programs is extended through 2018.65
Does the DMPP Work? Clearly Not for All Farmers
Here is a sampling of farmer concerns. These farmers are generally not members of the large co-
ops which dominate the National Milk Producers Federation (NMPF).
The USDA should “take action to protect all of our nation’s dairy farmers from further crisis and
to aid in the expansion and maintenance of domestic markets” in a letter sent to Vilsack
Thursday.66
The problem is that prices on dairy products are dropping, but milk production in the U.S. isn’t
slowing down. Milk prices dropped 40 percent since 2014, the letter says, and “the nation’s
cheese stocks were recorded at their highest level since the data was first recorded in 1917,” the
letter says. The national cheese stockpile reached 1.19 billion pounds in May.67
“The dairy market will continue to struggle with depressed prices,” putting at risk jobs and farms
across the country, the senators and representatives argue.68
64 Ibid. 65 Ibid. 66 “Congress Asks USDA To Bail Out Dairy Industry”, The Daily Caller News Foundation, by Thomas Phippen, July 29, 2016 67 Ibid. 68 Ibid.

PART I
41
Milk production in Maine… is up 8.2 percent this year, even though the uncharacteristically
warm summer brought that number down a bit. “There is a need to help our dairy farmers,”
Alicyn Smart, executive director of the Maine Farm Bureau Association and doctor of plant
medicine, told The Daily Caller News Foundation.69
USDA to “use its secretarial authority” to help milk producers. The USDA is authorized under
the Agricultural Adjustment Act of 1935 to aid farmers “through loans, purchases, payments, and
other operations.”70
The last time the USDA assisted dairy farmers outside the standard subsidy programs was in
December 2009, at the beginning of Vilsack’s tenure as Agriculture Secretary. That action came
in the form of a 2010 Agricultural Appropriations Bill, which made $290 million available to
dairy farmers as direct payments to offset losses.71
The 2014 Farm Bill eliminated direct subsidies for milk, and started a form of crop insurance.
The dairy industry is still adjusting, adjusting poorly some suggest to the Margin Protection
Program for Dairy, enacted by the 2014 Farm Bill, which replaced subsidies. Dairy margin
insurance “provides financial assistance to participating dairy producers when the margin – the
difference between the price of milk and feed costs – falls below the coverage level selected by
the producer,” according to the USDA.72
“It’s a new program, it’s different from the previous safety net program. It’s our second year in,
and 80 percent of milk is enrolled in the program.” John Newton, director of market intelligence
at the American Farm Bureau told The Daily Caller News Foundation.73
69 Ibid. 70 Ibid. 71 Ibid. 72 Ibid. 73 Ibid.

PART I
42
Despite help, Maine dairy farmers are still hurting74
“We want a chance to have our input into what the new Farm Bill looks like and how to write
something that sustains our dairy farmers, that doesn’t make it impossible for you to compete but
helps you get through the difficult times.”75
Prices paid to dairy farmers nationwide for liquid milk have fallen by about 40 percent since
2014, driven down by a glut of product, changing export markets and the use of more milk for
cheese, yogurt and other products. Last summer’s drought also drove up the cost of feed. As a
result, the price stabilization program run by the Maine Milk Commission has paid out roughly
$32 million since 2015 to help farmers cover the difference between their production costs and
the amount they receive.76
And dairy policy-making is often rife with regional political tensions pitting states where
smaller-scale dairy farms are more common, such as New England, against midwestern or
western states with massive dairy operations.77
Others called for additional federal intervention to make sure farmers are paid their due from the
cash register receipts. That has been a persistent complaint among farmers who accuse milk
processors and retailers of pocketing all of the profits while milk producers are forced to go into
debt, sell equipment or sell the farm during lean times.78
“But I’d rather get my milk check out of the marketplace. If you look at what consumers are
paying for dairy products, it’s there. It’s just not getting back to the farm. The consumer is
paying enough that the retailer, the processor and the farmer should all be running in the
black.”79
74 “Despite help, Maine dairy farmers are still hurting”, Portland Press Herald, by Kevin Miller, December 16, 2016 / Updated December 16, 2016 75 Ibid. 76 Ibid. 77 Ibid. 78 Ibid. 79 Ibid.

PART I
43
U.S. Farm Economy: How Globalization Soured Milk Market for American Dairy
Farmers80
For much of the past decade, the international dairy market did right by Tim Leary, creating
opportunity for his farm in southern Maine by linking his fortunes with ever-wealthier Asian
milk drinkers. But the downside of this globalizing dairy market revealed itself this month, when
Leary watched a livestock hauler whisk away 21 of his cows, destined to be milked the next
morning at someone else’s facility.81
There is, dairy farmers are finding, no hiding from the global free market once you embrace it,
which U.S. dairy producers did over the past decade after 50 years defined largely by a mixture
of government subsidies and protected markets. Slowing growth in China, plentiful production in
New Zealand, trade sanctions imposed by Russia and the end of European production restraints
have driven down the price of milk that farmers like Leary receive.82
For the past 10 years -- and for the first peacetime period since the modern agriculture policy
kicked in during the Great Depression -- growth for U.S. dairy farmers came mainly from
exports, which accounted for about only 4 percent of production 10 years ago. By 2014, after
growing 17 percent per year for a decade, exports made up 14 percent of total production,
according to the export council. Brisk growth in Asia, above all in China, underpinned strong
global demand for well-known dairy products like cheese, butter and yogurt but also items that
seldom appear on grocery shelves, such as whey protein and specialized milk powder.83
Through July, U.S. dairy exports were down 33 percent by value compared with a year ago, and
13 percent by volume, according to the council. The price of whole milk powder, which peaked
in February 2014 at over $5,000 per metric ton, hasn’t been above $3,000 for nearly a year, and
in mid-September stood at $2,175, according the U.S. Department of Agriculture.84
80 “U.S. Farm Economy: How Globalization Soured Milk Market for American Dairy Farmers”, International Business Times, by Carter Dougherty, September 29, 2015 81 Ibid. 82 Ibid. 83 Ibid. 84 Ibid.

PART I
44
When U.S. dairy farms threw themselves wholeheartedly into overseas markets, they changed
the rules of the game in bad times as well as good ones, largely because milk can become a
multitude of products. And cows produce it every single day, whether it’s wanted or not.85
That business model died -- and with it Saco’s last dairy farm -- in early September, as the
smallest producers felt the effects of softening demand. In the last 18 months, Maine lost about
60 dairy farms, leaving 253 in the state today.86
The proximate event for Leary’s decision wasn’t actually a new low in the price of milk. It was
the loss of his hauler, who drove a large milk truck to the Leary farm each day. He abandoned
the run because the decline in dairy farming in southern Maine meant a truck that can haul
65,000 pounds of milk carried only about 13,000 from the remaining five farms in the area,
Leary said. Transport costs alone made the route a loser.87
In the United States and Europe, dairy farmers have traditionally turned to the government for
help, resulting in lakes of milk and mountains of butter stockpiled to boost prices, or taxpayer
outlays to ease financial pain. That’s not panning out during the first downturn for a newly
globalized U.S. industry.88
Dairy farmers helped fight for, and won in the 2014 federal farm bill, a government system for
insulating against downturns, known as the Margin Protection Program. Essentially an insurance
scheme, the program compensates farmers when their costs exceed their income, and the
Department of Agriculture exhorted farmers to enroll in it for this crop year. Most did.89
85 Ibid. 86 Ibid. 87 Ibid. 88 Ibid. 89 Ibid.

PART I
45
Krysta Harden, the deputy secretary of agriculture, said during a visit to southern Maine that
dairy farms “need to be running their own numbers” and figuring out whether the program
makes sense for them.90
“It will never make anybody completely whole,” Harden told the Portland Press Herald. “That’s
not the purpose of it. It is to help them to continue to survive throughout the producing season
and year so they can continue to stay on their dairy farms.”91
Maine farmers pay more for feed than, say, farmers in Nebraska because grain isn’t as available
locally. Costs “just aren’t being calculated accurately for farmers in some states,” Pingree said in
an email.92
Despite Low Milk Prices, New Insurance Program Isn’t Helping Farmers 93
Deputy Secretary of Agriculture Diane Bothfeld says for what farmers are now receiving for
milk – around $16.50 per hundredweight – they’re either barely meeting their costs or losing
money.94
“We talk about a range somewhere between $16 to $20, if not higher, for the cost of production.
At $16.50 it’s very tight for many farms,” she says.95
Despite the situation, Bothfeld says no Vermont farmers have been able to take advantage of the
MPP benefits. That’s because it pays out based on the cost of production, using not just milk
prices, but comparing them with feed prices.96
90 Ibid. 91 Ibid. 92 Ibid. 93 “Despite Low Milk Prices, New Insurance Program Isn’t Helping Farmers”, Vermont Public Radio, by Steve Zind, July 10, 2015 94 Ibid. 95 Ibid. 96 Ibid.

PART I
46
Despite the situation, Deputy Secretary of Agriculture Diane Bothfeld says no farmers have been
able to take advantage of the MPP benefits.97
The basic, most affordable, policy is pegged to a $4 difference.98
If the difference between the price of milk and the price of feed is under $4 — in other words,
feed costs are basically cancelling out a big chunk of what the farmer is getting for milk — the
insurance kicks in. At this level, it’s considered catastrophic coverage.99
Bothfeld says so far, the margin between feed and milk prices hasn’t been close enough to
trigger coverage other than for the highest priced policies, which no one in Vermont purchased.
Yet at today’s prices, farmers could use the help.100
So far, the margin between feed and milk prices hasn't been close enough to trigger even the best
coverage, which no one in Vermont purchased. Yet at today's prices, farmers could use the
help.101
The feed price calculation is based on how much alfalfa, soy and corn it takes to produce 100
pounds of milk. The insurance is based on a national feed price, and feed is more expensive in
the Northeast, so the margin on paper doesn’t reflect the actual margin for Vermont farmers.102
97 Ibid. 98 Ibid. 99 Ibid. 100 Ibid. 101 Ibid. 102 Ibid.
PART I
47
Letter dated July 28, 2016 to Hon. Tom Vilsack, Secretary of Agriculture, from a bipartisan
coalition of both the Senate and House103
Our dairy farmers have been hit extremely hard by low farm milk prices that have resulted in sharply reduced incomes, which is placing our nation’s dairy industry in an extremely vulnerable position. A number of factors have contributed to this crisis. U.S. milk production has increased almost two percent above last year’s level, while global milk production is up significantly, partly as a result of the European Union’s decision to remove its milk production quotas and the loss of their export market to Russia. Furthermore, we are seeing an increase in production in other major milk-producing countries that have led to these depressed prices globally. All of this comes as our dairy farmers are still adjusting to the new Farm Bill, and the many changes that were made to our dairy support programs. We are deeply concerned that U.S. dairy farmers, who are a key part of our agriculture community and agriculture economy, are in greater need of stability and support as they face these significantly lower prices, which for many are below their actual cost of production. As this industry is reeling from low prices, a glut of imports, challenges in our export markets, and poor economic growth projections we urge the USDA to use its secretarial authority under the Commodity Credit Corporation Charter Act (15 U.S.C. 714c), Section 32 of the Agricultural Adjustment Act of 1935 (7 U.S.C. 612c), and look to past precedent for how to take action to protect all of our nation’s dairy farmers from further crisis and to aid in the expansion and maintenance of domestic markets. We encourage USDA to take any and all actions available in order to make an immediate market injection and offer financial assistance that will directly support U.S. dairy farmers equally, while being cautious to not stimulate overproduction further. The family business of dairy farming has long been woven into our nation’s agricultural history. Across the country, in all 50 states, dairy farms large and small are economic drivers providing local jobs and local products. During the 2009 dairy collapse, we saw far too many families have to sell off their cows and close the doors for good. Through the support of USDA, we can hopefully prevent many farms from needing to make that same difficult decision today and we hope you will work to support all of our dairy farmers across the country.
The shapes of the program may change but the deliveries of cash to beneficiaries have not
declined.
103 Letter dated July 28, 2016 to Hon. Tom Vilsack, Secretary of Agriculture, from a bipartisan coalition of both the Senate and House, https://www.leahy.senate.gov/imo/media/doc/072816%20Dairy%20Support%20Letter%20to%20USDA.pdf

PART I
48
Potential WTO Issues
Assessments of the potential effect of the new domestic support programs authorized by the 2014
farm bill (P.L. 113-79), and their compliance with WTO restrictions, are very preliminary at this
time. Many of the new programs have yet to be fully implemented, producer participation is
uncertain, and program outlays hinge on future market conditions. For example, under a
relatively high price environment, as existed during the 2010-2013 period, U.S. program outlays
would fall within proposed Doha Round limits with no or only modest changes. However, if
market prices were to decline substantially below support levels for an extended period, then
outlays could escalate and potentially exceed the proposed spending limits.
All of the new farm safety net programs—Price Loss Coverage (PLC), Agricultural Risk
Coverage (ARC), Supplemental Coverage Option (SCO), Stacked Income Protection Plan
(STAX), and Dairy Margin Protection Program (DMPP)—might be notified as amber box,
although PLC, ARC, and SCO could be notified as non-product-specific amber box.
Alternatively, PLC and ARC-CO might be notified as blue box. USDA is responsible for making
this determination.
Of all the price and income support programs, Marketing Loan Program (MLP) benefits alone
are fully coupled to producer behavior, while PLC and ARC are paid on a portion of historical
plantings and thus are decoupled from producer planting decisions, making them less vulnerable
to WTO challenge. However, because both PLC and ARC would make payments when current
market prices are low relative to historical market prices, both programs reduce producer risk
associated with price variability and thus likely result in greater acreage and production than
would occur in their absence. The new shallow-loss programs—SCO and STAX—could prove
more problematic. Both programs provide revenue (or potentially yield in the case of STAX)
guarantees that are very near to the market averages, in addition to reducing farm-level risk by
protecting revenues when market prices are low. Accordingly, they may incentivize greater
acreage and production than would occur in their absence.

PART I
49
Most studies suggest that, for U.S. program spending to exceed the $19.1-billion amber-box
limit, a combination of worst-case events would have to occur, for example, low market prices
generating large simultaneous outlays across multiple programs, in addition to the $1.4 billion of
implicit costs associated with the sugar program. Such a scenario is unlikely, although not
impossible, particularly since outlays under several of the programs (including the new dairy
program, SCO, STAX, and crop insurance) are not subject to any per-farm subsidy limit.
Perhaps more relevant to U.S. agricultural trade is the concern that—because the United States
plays such a prominent role in most international markets for agricultural products—any
distortion resulting from U.S. policy would be both visible and vulnerable to challenge under
WTO rules. Furthermore, projected outlays under the new 2014 farm bill’s shallow-loss and
counter-cyclical price support programs may make it difficult for the United States to agree to
future reductions in allowable caps on domestic support expenditures and related DM exclusions
as envisioned in ongoing WTO multilateral trade negotiations.
U.S. Domestic Support frustrates WTO Reform and Trade Liberalization
The WTO Agreement on Agriculture was supposed to result in the phase out of subsidies so that
markets could be opened to free and open (some say fair) competition. Where is the fairness in
other countries with much smaller budgets opening markets to competition from such heavily
subsidized producers? Notwithstanding subsidy reduction obligations, financial support in the
heaviest subsidizing countries has not declined. Rather, the old subsidies have been dressed up
differently and reported to the WTO on a colour blind basis or as green, with little regard for
their real effects on production and trade. And many subsidies go unreported. Jacques Berthelot
of Solidarité lists “cheating” by the U.S. and E.U. as including the following:
“The U.S. has largely under-notified or not notified many amber box subsidies
• The subsidies on agricultural insurances: the CRS report shows that the average subsidies on agricultural insurances have been of $3.080 bn from 2002 to 2006, and that the amounts notified for 1996 to 2001 are much lower than the actual amounts registered by the U.S. Budget…

PART I
50
• Other NPS AMS subsidies not notified to WTO but notified to OECD up to 2005:
- The grazing subsidies notified to WTO up to 2001: $57 million yearly
- The subsidies never notified to WTO but notified to OECD as the energy subsidies (tax exemption on agricultural fuel) for $2.385 bn every year from 1995 to 200514;
- The subsidies under-notified to WTO in comparison with the levels notified to OECD, those on agricultural loans: $610 million yearly against $48.8 million notified at WTO (same OECD source);
- The subsidies clearly under-notified to WTO as to OECD, those on irrigation: $300 million notified for 2001 when the truth is rather ten times given that some evaluations go up to $10bn15…”104
And University of California Professor Daniel Sumner explains:
“The cotton case has clarified the proper classification of U.S. farm subsidies into the “green” and “amber” boxes of the WTO Agriculture Agreement. The upshot of that clarification is that the United States has likely been exceeding the $19.1 billion cap on trade-distorting, amber-box subsidies that it agreed to abide by under the Agriculture Agreement. According to the calculations described in this paper, total U.S. amber-box subsidies to be included under the cap amounted to $29.1 billion in 2000 and $25.3 billion in 2001 and will likely total about $26.3 billion in 2006—all far in excess of the $19.1 billion limit.”19
Berthelot adds:
For the dairy and sugar market price supports we have extended the notifications made for 2001 ($5.515 bn) up to 2005, as D. Sumner has done, which is highly conservative since, according to the USDA “Dairy has accounted for about $5 billion annually and sugar another $1 billion”, and the EU estimates “market support for dairy and sugar at $5.8 billion and predicted to slightly increase”.
There are interlinkages between subsides and tariffs. Massive U.S. domestic support encourages
excess production and exports. These seemingly perpetual surpluses must be exported, often at
less than cost of production. This domestic support is de facto an export subsidy. These
subsidies unilaterally and without consultation offset and negate statutory tariff protection in
104 “To unlock the agricultural negotiations the U.S. must first comply with the WTO rules”, Jacques Berthelot, Solidarité, February 8, 2007

PART I
51
other WTO members’ markets. The U.S. (and the E.U.) may not intend to beggar their
neighbors but this has been the real effect of its unrestrained largess to U.S. (and E.U.)105
agricultural producers.
Other countries should not need restructure and rationalize their farm sectors because of the
disruptive and devastating effects of U.S. subsidies, competitive currency devaluations or its
veiled protectionism delivered through non-tariff measures like COOL. The real need is to
discipline the “beggar thy neighbor” policies which led to massive disruptive U.S. (and E.U.)
farm subsidies which drive prices down in world markets.
There are differences in size and relative affluence between countries which exacerbate the
impact on their farm economies of subsidies. These differences mean that a “one size” or
universal negotiating modality in the current WTO negotiations is not suitable for all. Then
Minister Argrimsson of Iceland told the Ministerial Conference at Cancun that “the
harmonization proposal of tariff capping falsely presumes that one size really does fit all”.106
Meantime, the United States has challenged Chinese grain tariff rate quota for rice, wheat and
corn.107 Senate House Agriculture Committee Ranking Member Collin Peterson said,
“An equal playing field is vital for America’s farmers to compete in a global marketplace. It is imperative that the United States take this action to hold China accountable for failing to meet WTO commitments.”108
The 2014 Farm Bill did not reduce funding.109
“Actually, many opponents of government subsidies saw this coming. “Cynics like me fully expected this to work out the way it has,” says Bruce Babcock, an agricultural economist at Iowa State University. “Farm policy isn't really about policy. It's about farmers getting their money. And the agriculture committees in Congress are there to make sure that farmers get their money.””
105 We monitor E.U. subsidies because while we were retained to measure support to U.S. agriculture, it would be unfair to leave the impression that the other major subsidizer is less guilty of disrupting world trade in agriculture. 106 WT/MIN(03/ST/36, September 11, 2003 107 U.S. Agribusiness and the U.S. Government 108 https://ustr.gov/about-us/policy-offices/press-office/press-releases/2016/december/united-states-challenges-chinese 109 “Farmers Get Just as Much Money Under New Farm Bill”, The Salt, February 1, 2016

PART I
52
How does Domestic Support Frustrate Trade Liberalization?
Some countries came out of the Uruguay Round with very limited ability to provide financial
support to their farmers. The Canadian government accelerated subsidy reductions in part to
meet budgetary concerns but primarily because the government lives up to its obligations no
matter how difficult this may be. Most developing countries did not have the resources to support
their millions of subsistence level small farmers even before the Uruguay Round.
The WTO rules simply did not take account of the very fundamental, subsistence nature of
agriculture in many developing countries. Small farmers in these countries are totally vulnerable
to cheap import competition. Small farmers in developing countries cannot be treated the same
way as the agribusiness and corporate farmers which dominate agriculture in North America and
will do so increasingly in Europe.
Developing countries opened their markets – either because the World Bank forced them in the
1980’s to eliminate quotas which could have been converted into TRQs – or because their
negotiators took on obligations they could not live with.
In addition to challenging China, the U.S. has criticized Indian support to its millions of
subsistence farmers.
Undisciplined domestic support is the most serious cancer in the system and it must be excised –
the sooner the better. Such support:
• stimulates surplus production;
• this production must be dumped in world markets;
• there is no need for the subsidized farmers to recover their cost of production;
• the subsidies insulate the beneficiaries from import competition – they can urge market access concessions on others because they will be able to offset tariff reductions through domestic or income support.

PART I
53
It is now recognized that a major failing of Agricultural Framework proposed was the “cookie-
cutter” approach – and placed the same demands on all parties no matter what their ability to
accept, implement or adjust to the results. This approach could not lead to an equitable result
because there are very few similarities among WTO members. Indeed, there are vast differences
in their agricultural policies.
These differences can be caused, inter alia, by:
• size;
• relative GNP;
• resources;
• crop/product mix;
• geography/climate.
These differences are real; they are not imagined – they are natural, they are not contrived. The
WTO negotiations on Agriculture were at least initially influenced by those with the deepest
pockets – or the lowest costs. However, it became clear to those who lacked the financial
resources and/or advantages that it was unacceptable to be penalized or punished simply because
they are and must be different.
We have been writing about the evils of undisciplined domestic support and its impact on the
prospects for Doha success since the 2002 Farm Bill. Trade and production distorting domestic
support is a concern in the global trading system which needs to be excised. This is our most
recent report on Farm Bill largess. There are no improvements since the 2002 Farm Bill.
In the Lead-Up to the 2014 Farm Bill
House Agriculture Committee Chair Collin Peterson publicly signaled he was interested in
creating a system that focuses on ensuring revenue for U.S. farmers through risk management,
possibly through enhanced crop insurance and conservation programs.110 He also pointed out
that a new farm bill will have to contend with the fact that there will be less money available due 110 “Peterson Presses Ahead On New Farm Bill, Senate and Administration Defer”, Inside U.S. Trade – May 7, 2010

PART I
54
to efforts to reduce the budget deficit. Our concern was that too often for Congress risk
management means risk elimination. The concern has proven to be valid.
In recent years there has been considerable focus on the real problems posed by U.S. and E.U.
domestic support.
Our analysis strongly suggests that:
- the WTO’s single undertaking or “one size fits all” approach, urged by the biggest subsidizer, is far from suitable for all countries.
- wealthier countries can through generous subsidies and other forms of support insulate their farm sectors from Market Access liberalization.
- there are interlinkages between subsidies and tariff /quota protection which cannot be ignored. Failure to take these linkages into account will result in perpetuating and exacerbating imbalances in the WTO rules and conditions of competition relating to agricultural trade.
- the use of green or de minimis domestic support tends to be very production and trade distorting. In this connection, we refer the reader to:
- assertions about WTO consistency of specific programs are at times self-serving, misleading and do not stand up to challenges. This has been confirmed by the panels in E.C. – Sugar and U.S. – Cotton. China is challenged support to U.S. feed grains as an actionable subsidy in its CVD investigation of U.S. poultry.
- WTO Dispute settlement, including “gap-filling” by the Appellate Body, has, altered the balance of negotiated rights and obligations.
- because the WTO is not a self-policing organization, non-conforming and unreported subsidies provided by the USA should be challenged under WTO Dispute Settlement procedures. However, we do not expect that WTO members will be prepared to cede additional power or authority.
As anyone who was in Geneva in July 2008 knows, many developing countries had their own
concerns about domestic support:
“China refused to cut its 40% import duty on cotton to help the Americans. “We have a political problem, 10 million cotton farmers, mostly in the western province of Xinjiang.” China also declined to give more access for wheat and corn. In the

PART I
55
industrial area, China said substantial cuts had already been made during the WTO accession process: “We cannot go back now and say, ‘we will make further tariff cuts”...”111
Others, former Doha Round boosters who now accept and analyzing the reasons for the deeply
comatose state of the negotiations, share these views:
Former HK representative to the WTO and Chair of the Agriculture Negotiating Group, Stuart
Harbinson addressed the need for change:
The case against the WTO is that it has achieved little or nothing of substance since the late 1990s. As the Consultative Board to Director-General Supachai Panitchpakdi put it in 2004:
“In recent years the impression has often been given of a vehicle with a proliferation of backseat drivers, each seeking a different destination, with no map and no intention of asking the way.”112
That U.S. and E.U. domestic support was not disciplined clearly has been the major problem.
Roderick Abbott, a former WTO Deputy Director, notes:
“A similar problem of measurement presented itself in seeking the reduction of domestic subsidy payments in agriculture.”113
The impact of the obscene domestic support on developing countries to U.S. and E.U. to farmers
was also taken up by War on Want. This NGO concluded:
“The WTO could have focused its energies on brokering a deal to stop the dumping of E.U. and U.S. farm produce on developing country markets, one of the very worst abuses of the international trading system. But this did not happen. Instead of a development agenda, the talks degenerated into an unapologetic market access agenda.”114
111 “How to revive Doha with some chance of success”, Roderick Abbott, Senior Trade Adviser at ECIPE, No. 04/2009 112 The “Sutherland Report”, WTO, 2004 113 “How to revive Doha with some chance of success”, Roderick Abbott, Senior Trade Adviser at ECIPE, No. 04/2009 114 J. Hilary, Director of policy at War on Want, July 2008. Quoted by Euractive in “Pros and Cons of reviving Doha”

PART I
56
Crop insurance programs under the World Trade Organization are considered non-product
specific trade-distorting farm subsidies classified in the amber box. That box allows countries to
shield these programs from the cuts that are otherwise imposed on amber box subsidies as so-
called de minimis exemptions, so long as those exemptions do not exceed 5% of a member’s
total agricultural production. For the U.S., this amounts to roughly $5 billion.
Then House Agriculture Committee Chair Peterson told the North American Agricultural
Journalists (NAAJ) that commodity groups were beginning to work on possible program changes
in their area, with the dairy industry ahead of everyone else. Cotton subsidies remain nearly 10
years later. U.S Upland Cotton sent signals about the need for change, the terms have been
largely unchanged.
He said wheat growers have put together a working group to look at their programs, as have
soybean producers and corn growers, who were at the forefront in the last farm bill by proposing
a revenue-based program that ultimately resulted in the ACRE program in the 2008 farm bill.
ACRE has been replaced by very generous crop and margin insurance.
Farmers around the world recognize that the problem is excess supply – and that fair policies
promote over-production – and only a little over-production is enough to cause prices to crash.
U.S. farmers continue to lobby Congress for a better dairy policy.115 There are proposals for
radical reform of dairy policy to address the most dramatic reversal in U.S. dairy farm fortunes in
memory but does not seem disposed to make immediate changes.
Evolution of WTO Rights and Obligations through Domestic Settlement
The WTO is a much different type of Agreement than the GATT was. The U.S. never ratified
the GATT to give it Treaty Status, but the WTO is a Treaty. The words of the WTO Agreements
mean what they say (they should mean no more than what they say but experience with dispute
115 “Congress hears pleas for more U.S. dairy farmer help”, Dairy Markets, May 12, 2010

PART I
57
settlement has established that sometimes they do). The Appellate Body has in some cases filled
in “gaps” in the negotiated texts – thus creating obligations where none previously existed.
The most egregious case of gap filling in agriculture involving Canada was in Canada – Dairy.
Canada’s concerns about the introduction of a cost of production benchmark and disciplines on
cross-subsidization into Agreement on Agriculture (AoA) Article 9.1(c) are well known. These
concerns have since been shared by European Communities because of the application of this
approach to its exports of unsubsidized “C” quota sugar. And, if challenges of U.S. subsides in
the grains and oilseeds sector were pursued, they too would become familiar with condemnation
for cross subsidization – a concept which is conspicuous by its absence in the WTO AoA and
SCM Agreements.
The U.S. too has concerns about “gap-filling” by panels which change the expectations of
negotiators and legislators. According to them House Agriculture Committee Chairman Bob
Goodlatte (at a meeting with former WTO Director-General Supachai Panitchpak):
“The recent ruling by the WTO Appellate Body regarding the case brought by Brazil against the U.S. may hold significant ramifications for agricultural programs in the U.S. Chairman Goodlatte noted the problematic nature of employing “constructive ambiguity” during WTO negotiations. “In the WTO, countries seem to reach decisions in the course of negotiations or in other matters that reflect a general, yet ambiguous, consensus. Later, these general agreements come under scrutiny and are found to violate WTO rules, such as the recent decision by the WTO Appellate Body in the case brought by Brazil against the U.S. The Appellate Body’s decisions concerning export credit guarantees, declaring them to be export subsidies, and domestic support for cotton, declaring them to suppress world prices and thereby requiring the removal of the subsidy or the adverse effect of the subsidy, take the common understanding of the Uruguay Round and turn it on its head. This seems to me to be a classic case of bait and switch,” said the Chairman.”116
Trump Administration USTR Robert Lighthizer is an unrelenting critic of over-reaching by the
WTO Dispute Settlement System.117
116 http://www.agriculture.house.gov, Goodlatte Says Ag Negotiations in Trouble, March 9, 2005 117 “Trump picks Lighthizer to serve as U.S. trade representative”, By Mathew Korade, Adam Behsudi and Louis Nelson, Politico, January 3, 2017

PART I
58
We have considered the WTO consistency (or inconsistency) of each of the reviewed programs.
We address U.S. compliance with its obligations under the WTO in a specific and aggregate
sense, we have made limited but specific supporting references to relevant WTO dispute
settlement decisions, indicating E.C. – Sugar,118 Canada – Dairy119 and USA – Upland
Cotton.120 The primary purpose of this study was not to establish a basis for WTO complaints or
challenges against any of the reviewed programs. Nor is it a shopping list for countervailing
duty complaint. Rather, as noted above, the purpose of this study is to identify and review the
full scope of support and support activities provided to U.S. agriculture.
We do recognize that some U.S. programs meet the definitions for exemption from AMS
reductions in AoA Annex 2.121 Many do not. Others share our concerns about the inadequacy of
WTO monitoring and oversight of subsidy designations by the U.S. and E.U.122
118 WT/DS 265/R, October 15, 2004 119 The Panels and Appellate Body consider Canada – Measures Affecting the Importation of Milk and Exportation of Dairy Products reported between May 17, 1999 and December 20, 2002 and included six distinct proceedings: Report of the Panel (WT/DS103/R, WT/DS113/R – 17May 1999), Report of the Appellate Body (WT/DS103/AB/R, WT/DS113/AB/R – 13 October 1999), Recourse to Article 21.5 of the DSU by New Zealand and the United States, Report of the Panel (WT/DS103/RW, WT/DS113/RW – 11 July 2001), Recourse to Article 21.5 of the DSU by New Zealand and the United States, Report of the Appellate Body (WT/DS103/AB/RW, WT/DS113/AB/RW – 3 December 2001), Second Recourse to Article 21.5 of the DSU by New Zealand and the United States, Report of the Panel (WT/DS103/RW2, WT/DS113/RW2 – 26 July 2002) and Second Recourse to Article 21.5 of the DSU by New Zealand and the United States, Report of the Appellate Body (WT/DS103/AB/RW2, WT/DS113/AB/RW2 – 20 December 2002). These Reports are referred to as relevant. 120 WT/DS 267/R, September 8, 2004 and WT/DS 267/AB/R, March 3, 2005 121 “Green Box Mythology: The Decoupling Fraud” Grey, Clark, Shih and Associates, Limited, June 2006 122 “To unlock the agricultural negotiations the U.S. must first comply with the WTO rules”, Jacques Berthelot, Solidarité, February 8, 2007; “The huge lies in the US notification of its agricultural trade-distorting domestic supports from 2002 to 2005”, Jacques Berthelot, Solidarité, January 3, 2008; “The king is naked: the impossible U.S. promise to slash its agricultural supports”, Jacques Berthelot, Solidarité, November 12, 2005

PART I
59
OVERVIEW: PART I – FEDERAL SUBSIDIES
This study updates and expands on the 1990, 1998, 2003, 2005 and 2010 Studies on Subsidies to
U.S. agricultural and dairy interests which we prepared for the Dairy Farmers of Canada (DFC).
The scope of this study like the previous studies123 is a review of the full range of subsidies and
support provided directly and indirectly by the Federal and State Governments in the United
States to all agricultural producers and processors.
In 1998, we noted that the United States had taken some steps in the 1996 Farm Bill to amend its
agricultural support programs to make them more consistent with WTO rules. At that time, we
concluded that some of these changes simply gave the appearance of de-coupling the provision
of support from production decisions. But even the halfhearted attempts were not embraced by
U.S. agriculture or Congress.
Since our 1998 study, the U.S. introduced Farm Bills in 2002, 2008 and 2014 which made many
changes in the form and nature of support provided to U.S. Agriculture. None of these changes
have significantly reduced or diluted federal support. The 2002 Farm Bill ended some of the
reforms of the 1996 Farm Bill by reversing 1996 attempts to ensure WTO compliance in the
Freedom to Farm legislation. The 2002 Bill also exacerbated the severity of the effects of U.S.
“domestic” support on world markets. The 2008 Farm Bill tries at least in terms of appearances
to create a more WTO-consistent system, but as we note, generally falls short.
The 2014 Farm Bill terminated direct payments and introduced a series of risk crop insurance
and margin insurance programs.
The U.S. Federal Government continues to provide very generous subsidies and other support to
U.S. agricultural producers and processors. We remain concerned about the impact of these
subsidies; indeed, our concern is even deeper, that the high level of domestic support provided to
123 www.greyclark.com

PART I
60
U.S. producers provides de facto export subsidies to support and facilitate exports of U.S.
agricultural products.
Since our 2003 and 2005 reports Canada124 and Brazil125 have both sought WTO Dispute
Settlement with respect to U.S. domestic support. However, the panels have, in effect, been
placed in limbo – they are on hold with no apparent intention to re-open them.126 Justice delayed
has never been so much justice denied. Based on our findings and on U.S. readiness to challenge
India and China, among others, it would seem to be timely to consider updating and renewing the
challenge.
The massive domestic support provided by USDA results in overproduction of commodities year
after year that must be sold into the world market at depressed prices often below cost of
production.
Rather than refer to the domestic support as providing de facto export subsidies, some observers
refer to the resulting below cost exports of U.S. commodities as “dumping”.127 No matter how it
is described, the result is the same. The “deep pockets” support provided to U.S. agricultural
producers stimulates production year after year that is well in excess of U.S. domestic demand.
The resulting surpluses are then sold onto world markets at prices below cost of production and
below fair market value.
In addition, based on the WTO dispute settlement decisions in Canada – Dairy128 and E.C. –
Sugar,129 it is clear that U.S. exports are also supported by substantial WTO Agreement on
124 WTO DS/357 125 WTO DS/357 126 Discussions with Canadian officials 127 Dumping without Borders: How US Agricultural Policies are Destroying the Livelihoods of Mexican Corn Farmers, Oxfam Briefing Paper 50, August 2003, pg 25 128 The Panels and Appellate Body consider Canada – Measures Affecting the Importation of Milk and Exportation of Dairy Products reported between May 17, 1999 and December 20, 2002 and included six distinct proceedings: Report of the Panel (WT/DS103/R, WT/DS113/R – 17May 1999), Report of the Appellate Body (WT/DS103/AB/R, WT/DS113/AB/R – 13 October 1999), Recourse to Article 21.5 of the DSU by New Zealand and the United States, Report of the Panel (WT/DS103/RW, WT/DS113/RW – 11 July 2001), Recourse to Article 21.5 of the DSU by New Zealand and the United States, Report of the Appellate Body (WT/DS103/AB/RW, WT/DS113/AB/RW – 3 December 2001), Second Recourse to Article 21.5 of the DSU by New Zealand and the United States, Report of the Panel (WT/DS103/RW2, WT/DS113/RW2 – 26 July 2002) and Second Recourse to Article 21.5 of the DSU by New

PART I
61
Agriculture (AoA) Article 9.1(c) export subsidies which are provided by U.S. producers on the
export sale of their products.
The sheer magnitude of U.S. farm subsidies is mindboggling to most other WTO members. U.S.
agricultural budgets are not likely to become, part of the solution to imbalances in agricultural
trade; they will continue to be a very significant part of the problem. For example, in its
Recovery Act, the Obama Administration provided an additional $28 billion of funding which
supported some $52 billion in additional spending.
In 2002, the House of Representatives Budget Committee described the Agriculture function as
follows:
“The Agriculture function includes funds for direct assistance and loans to food and fiber producers, export assistance, market information, inspection services, and agricultural research. Farm policy is driven by the Farm Security and Rural Investment Act of 2002, which provides producers with continued planting flexibility while protecting them against unique uncertainties such as poor weather conditions and unfavourable market conditions.
Then the Committee explained:
“The Agriculture Committee has sole jurisdiction over programs in this function. The mandatory figures are CBO baseline levels. Any changes in these levels that may result from reconciliation directives (described in the Reconciliation discussion in this report) and the savings indicated under Function 920 will be determined by [policies] developed by the Agriculture Committee.”130
There is no “big picture”, national intent oversight. For reasons explained in the introduction,
there does not seem to be any real hope of bringing U.S. support to Agriculture under discipline
which will result and control through meaningful reductions.
Zealand and the United States, Report of the Appellate Body (WT/DS103/AB/RW2, WT/DS113/AB/RW2 – 20 December 2002). These Reports are referred to as relevant. 129 WT/DS 265/R, October 15, 2004 130 Report of the Committee on the Budget House of Representatives, Concurrent Resolution on the Budget – Fiscal Year 2006, Report 109-17, March 11, 2005, pg 26

PART I
62
The 2008 Farm Bill131 was developed and introduced during a period of very strong commodity
prices. Media comment underlines its excesses. The Pittsburgh Post-Gazette explained:
“Americans are in sticker-shock over grocery prices, while people in developing countries are rioting over food shortages. And across the U.S. heartland, American farmers are enjoying record incomes, but losing sleep over rising expenses and turbulence in the commodity futures markets. Here on Capitol Hill, though, it is pretty much farm politics as usual. As Congress works toward final passage of the farm bill, it is poised to continue most of the existing farmer subsidy programs, including about $5.2 billion a year in so-called “direct payments” that will be disbursed even as net farm income is projected to hit a historic high in 2008. The farm bill, which comes along roughly once every five years and will cost upward of $300 billion, in fact will do little to address many of the most pressing concerns. It will not change biofuel mandates that are directing more corn to ethanol and contributing to a global run-up in food prices. In other words, Congress seems oblivious. And long-standing critics of U.S. policy are piling on. “It really is astounding,” said Rep. Ron Kind, D-Wis., who has pushed for broad changes in farm subsidy programs. “It’s as if this farm bill is being negotiated in a vacuum.”“132
The New Orleans Times-Picayune reported the Farm Bill Pork Barrel is geared to local interests
of southern Sugar growers.
“An environmental group said the farm bill “fans the flames of global warming.” A taxpayers group complained it allows “millionaire farm households to receive handouts from taxpayers.” And President Bush decried that Congress failed to “better target subsidies.” But in two days of voting, the House and Senate this week passed the five-year, $307 billion farm bill by bipartisan, veto-proof margins. The bill passed the Senate 81-15 Thursday, one day after it passed the House 318-106.”133
131 Food Conservation and Energy Act of 2008 132 “It’s as if this Farm Bill is being Negotiated in a Vacuum”, By David M Herszenhorn, Pittsburgh Post-Gazette, April 24, 2008 133 “Congress plows past farm bill critics; Aid to sugar farmers wins fans in state”, By Bruce Alpert, Times-Picayune, May 16, 2008

PART I
63
The United States is in a serious budgetary deficit situation – which requires drastic efforts to
control spending. There were suggestions that Agriculture will also face reductions. Indeed,
President Obama tried to reduce Farm Bill spending – and to reduce payments to wealthy
farmers. He failed in 2009. In 2010, while he had not given up on his quest, Congress was not
inclined to risk the wrath of farmers.134 Clearly the rest of the world should not expect an
imminent and substantial reduction in U.S. financial farm support.
Canada is highly vulnerable to the adverse effects of U.S. subsidies. NAFTA created an open
border and U.S. prices plus or minus freight from/to the basing point, depending on supply
conditions are routinely imported into Canada. In a wide range of agricultural sectors these have
set market clearing prices for Canadian farmers, particularly grains and oilseeds producers. The
impact of these subsidies given without regard for the impact on farmers in other countries are,
for global agriculture, the equivalent of the “beggar thy neighbour” tariff policies of the 1930s.
U.S. farmers do not have the same concerns as their Canadian neighbours about market forces,
like supply and demand. USDA provides a safety net which are even more generous as prices go
down and as we found in 2009 “stimulus spending provides even greater support”.135
At the Cancun Ministerial, Uruguay Foreign Minister H.E. Dr. Didier Opertti Badan, called for
abolition of domestic support and export subsidies at the Cancun Ministerial meeting. He said,
“This reform is no longer the wish or demand of a more or less broad group of countries. It has grown to an international outcry, impossible to ignore or to sidestep any more.”136
The largest provider of domestic support is the United States – through green box, amber box
and de minimis programs.
The G-20 and other countries have targeted U.S. domestic support for reduction and control.
134 “Is President Obama’s Honeymoon with Ag Over?”, Corn and Soybean Digest, March 2, 2009 135 Congressional Research Service, Agriculture and Food Provisions in the 2009 Economic Stimulus Package, Report # R40160, January 23, 2009 136 WT/MIN(03)/ST/25

PART I
64
Brazil, India and other developing countries said Tuesday that the 2008 U.S. Farm Bill will be an
obstacle to global trade talks aimed at lifting millions worldwide out of poverty. They claimed
that the “new bill heads agriculture policies in the wrong direction at a decisive juncture of the
WTO Doha Round.”137
The impact of U.S. subsidies to cotton production has been condemned through dispute
settlement, but little in the way of concrete measures has been done to remedy the situation. The
cotton dispute underlines that the application and enforcement of WTO rules is not a game of
right or wrong. It is a game of big and little.
Measuring U.S. Support
Budget documents published by the U.S. government distinguish between program funding
levels, which are a reflection of the budgetary authority (or the total amount of budgetary
resources required to operate the Department and to fund all programs for the year), and outlays
(which describes the total expenditures of the Department less administrative costs and after
revenues are taken into consideration).
The U.S. Department of Agriculture (USDA) explains that the Program Level
“represents the gross value of all financial assistance USDA provides to the public. This assistance may be in the form of grants, guaranteed or direct loans, cost-sharing, professional services such as research or technical assistance activities or in-kind benefits such as commodities.”138
We were asked to conduct a comprehensive analysis. In determining the total value of support to
U.S. agriculture, we have relied on program funding levels as the most appropriate indicator of
the total value of support to U.S. agriculture. Program levels reflect the gross financial
assistance in support of agriculture in a particular period. It is these program expenditures which
support and distort U.S. agricultural production and trade.
137 “Emerging economies slam new US farm bill at WTO”, By Eliane Engeler, Associated Press, June 3, 2008 138 FY 2011 Budget Summary, U.S. Department of Agriculture, pg iii

PART I
65
USDA and OMB (Office of Management and Budget) accounting practices and reporting are not
always consistent or identical. Those who attempt to add up the parts to arrive at the overall
program level numbers may be frustrated because of these differences.139 But for our purposes
the most important measurement of support is the overall program level.
The USDA Budget Summary explains:
“The Budget is described in budget authority measures in most instances. However, there are some cases when other measures are used and the reader should take care to note which measure is being used.” 140
An underlying principle of our overall analysis is that cash is fungible and all support from
Government influences production and marketing decisions no matter how indirect this support
may be. Aggregate benefits are determined based on aggregate program levels. We have also
addressed many parts of these programs, and calculated benefits to dairy in the aggregate, as well
as benefits for each of the parts specifically addressed. As we explain below, it would be wrong
and misleading to try to relate the allocations for selected parts analyzed to the whole.
We did not attempt to estimate the benefits of loans by calculating differences in benchmark and
actual interest rates. Our objective is not to estimate the value of subsidies for a countervailing
duty (CVD) investigation. We could not make assumptions about the availability of commercial
credit to all borrowers under a program, nor about the credit-worthiness of the borrowers,
individually or collectively. To rely on commercial rates as benchmarks, the borrower must be
eligible to receive a loan from a commercial lending institution. We were not prepared to
assume that all farm borrowers could or could not meet such commercial criteria.
139 It is not our intent to criticize U.S. budgetary accounting practices. Revenue collection is a legitimate offset in the overall cost to the Treasury. But it does not reduce actual benefits to producers and processors. For example, Commodity Credit Corporation reports repaid loans as an offsetting collection listed as USD $9.065 billion as actual repayment in 2009. (We do not know which period these relate to and there is no record of defaults which will never be collected.) Although this is an appropriate measure for budgetary accounting purposes, the offset simply understates the actual support provided for U.S. agriculture by the U.S. Department of Agriculture (USDA) over the course of the year. 140 FY 2017 Budget Summary, U.S. Department of Agriculture, pg iii

PART I
66
Some USDA program criteria indicate that loans are provided to producers who would otherwise
not qualify to borrow from commercial lending institutions. In these circumstances, the benefit
and value of the support provided by the Government is not simply the value of the reduced
interest rate or guarantee, but is the value of the loan, i.e., having the use of working capital to
operate the farm or plant a crop, or undertake other activities which would not otherwise be
possible. The magnitude of the benefit is that the realized losses of the CCC from 1933 to 2009
inclusive were $466.19 billion. These losses were covered by special appropriations.141
The USDA also makes subsidized or guaranteed loans to producers who could qualify for loans
from commercial lending institutions; indeed, it is a stated requirement for some programs that
the borrowers be creditworthy or able to repay. In these cases, we have also considered the total
value of the loans to be the value of support provided by the U.S. Government. Producers have
access to these loans, which may supplement their normal credit lines, and rely on them to enable
and support their production decisions.
While USDA does provide the subsidy value of concessional loans and guaranteed loan
activities, such measurements do not capture the full value of the support provided to
uncreditworthy farmers and ranchers. Whether or not loans are ultimately repaid (and
experience tells us that often they are not or will not be), U.S. producers and processors have the
benefit of loans which are de facto, subsidized working and infrastructure capital in excess of $9
billion. These loans may supplement conventional lines of credit and borrowing ability, at
significantly less cost and risk to the borrower. They provide significant benefits to U.S.
agriculture and must be included in the scope of our calculations.
Our methodology is designed to capture the full value of financial support by the U.S. Federal
Government under all programs. The fact that the USDA may recover revenue from past
expenditures and loans through the course of the year, may reduce the actual net cost to the U.S.
Treasury, this does not change the fact that total support in the period is significantly greater than
this net amount.
141 UDSA Budget Appendix for 2011, pg 115

PART I
67
On the other side of the ledger we did not attempt to calculate the benefits of income support
programs or price supports because we did not have the information available to do so. Our
decision to exclude such benefits from our analysis understates the amount of benefits in the
aggregate to both U.S. agriculture and to the dairy sector.
Program levels for USDA are reported in the FY 2017 Budget Summary as follows142:
2015 (Enacted) $210,703,000,000
2016 (Estimate) $230,735,000,000
2017 (Budget) $227,031,000,000
In addition, the United States provides support to agricultural producers through irrigation
programs operated by state and local governments. This undeclared irrigation support takes the
form of subsidized water and electricity rates to operate the systems.
The U.S. Federal Government provides support through these programs in the form of support
for irrigation infrastructure.
The United States notifies irrigation infrastructure support provided through the Department of
Interior to the WTO. The most current notification, filed on January 19, 2017, covers the 2014
marketing year. And the U.S. underreported it at $140,063,000.143 Some commentators
consider these reported data to be seriously underreported.
State and local government provide much greater irrigation benefits to agriculture in the form of
subsidized water and electricity. These benefits are not reported to the WTO. We estimate for
purposes of this report that such benefits are worth about $20 billion annually.
Finally, the U.S. Federal Government has provided indirect support to agricultural producers
through biomass energy tax incentive programs that encourage the production of feed grains and
142 FY 2017 Budget Summary, U.S. Department of Agriculture, pg 111 143 WTO, Committee on Agriculture, Notification, 19 January 2017, pg 28

PART I
68
oilseeds used in processing ethanol and, to a lesser extent, biodiesel. As the total value of tax
incentives are not set out in the budget. By 2015 the programs had been emended to change
incentivized feed stocks – which are now rather remote from dairy. Therefore, we decided not to
include any biomass subsidy benefits for 2015.
State and Local Support
To determine the value of support and subsidies to agricultural production provided by U.S. State
and Local Government, GCS reviewed the total value of support as reported in the available
budgets of state Departments of Agriculture. In addition, we estimated the total value of support
provided through subsidized water for irrigation programs in the states benefiting from these
programs. We have not been able to add the benefits of subsidized electricity rates used to
operate the irrigation systems.
Through the federal Freedom of Information Act, EWG obtained U.S. Bureau of Reclamation
documents that enabled us to determine that for the first time the rate paid by CVP
agribusinesses and the very significant size of their power subsidy. (We will be trying to obtain
information on power subsides in other districts.)
EWG found:
• In 2002 and 2003 CVP agribusinesses paid only about 1 cent per kilowatt-hour (kWh) for electricity used to transport irrigation water.
• CVP power rates were 10 to 15 times lower than PG&E’s industrial, agricultural, and residential power rates during this time period.
• In 2002 and 2003 CVP agribusinesses received power subsidies worth $115 and $105 million, respectively, when compared to PG&E’s agricultural electricity rates.
• The power that the Bureau of Reclamation sells to CVP agribusinesses for the storage and transportation of Project water is essentially unregulated. No government agency, other than the Bureau itself, oversees its rates.
• One CVP water district gets more power subsidies than all others combined: Westlands Water District, which is dominated by a handful of large cotton growers in

PART I
69
Fresno and Kings counties. In 2002 alone Westlands’ power subsidies were worth more than $71 million, an average of $165,000 per farm.
The Bureau often downplays the amount of energy it takes to run the CVP, pointing to the fact
that the Project’s hydroelectric plants generate about five and a half billion kWh each year
compared to the approximately 1 billion kWh required to pump irrigation water around the
system. Yet this argument ignores the fact that while millions of municipal and industrial users
benefit from the “left over” power, fewer than 7,000 private agribusinesses benefit from the
power used for pumping.
And while Congress intended to subsidize agricultural water to some degree when it authorized
the construction of federal water projects in the early 1900’s, the current situation in the CVP is
radically different than what the lawmakers envisioned. Congress specified that water subsidies
should only be given to small family farms, yet today corporate agribusinesses thousands of
acres in size are receiving federal subsidies. The original purpose of the subsidies - to help settle
the then sparsely populated Western U.S. – is also clearly obsolete.
Moreover, many CVP agribusinesses are enjoying not just one kind of government subsidy, but
several. In addition to federal energy subsidies, Department of Agriculture data show that from
1995 to 2004, CVP agribusinesses received more than $890 million in direct commodity
payments, mostly for cotton and rice. An earlier EWG investigation conservatively estimated the
value of CVP water subsidies at $416 million in 2002. In total, federal subsidies to the CVP
easily top more than half a billion dollars a year and could well reach $1 billion all at taxpayers’
expense.
The 2015 percentage share of dairy in farm receipts in individual states’ total farm receipts was
used to calculate budgetary allocations to the dairy sector. We generally have not been able to
adjust state allocations to reflect dairy specific programs that were directly beneficial to dairy
producers because of a lack of detail in state budgets.

PART I
70
The total value of support for 2015 reported in state level Agriculture Department budgets is
$7,049,918,596. We believe this estimate significantly understates the total value of actual
support provided to agricultural producers by U.S. State and Local Governments.
We have added $20 billion to the estimated state benefits to reflect the estimated value of
subsidized water provided for irrigation of agricultural land. This brings the state and local
government total to $27,049,918,596 and the allocation to the dairy sector to $2,851,061,420.
A. U.S. Federal Support to Dairy Farmers
Some 20 years after the U.S. took on WTO obligations to reduce farm support, U.S. financial
support provided to U.S. dairy producers remains very high. Based on the review in this study,
we have identified a total of $25,663,654,420 in direct and indirect federal subsidies and support
for American dairy farmers in 2015. Expressed in terms of estimated 2015 U.S. milk production,
this was equivalent to US$12.06 per cwt of milk produced. Expressed in Canadian dollars by
using the Bank of Canada 2015 exchange rate average (1.27871080), the U.S. federal and state
support to dairy was $15.42CAD per cwt or $35.02CAD per hectolitre.
In considering the total budget of U.S. federal support to agriculture, it is essential to include the
value of irrigation infrastructure provided by the Department of the Interior. Irrigation is an
integral part of the Farm subsidy framework. The Los Angeles Times reported:
“Cheap irrigation water is part of the equation, but there is another common denominator. It’s a massive federal legislation package passed every five years known as the farm bill.”144
The serious delays in reporting to the WTO make such reports a resource of only the most
marginal utility. Such serious reporting lags and under-reporting make it virtually impossible to
access current information on actual expenditures and in turn to properly assess compliance with
WTO obligations.
144 “We’ll reap what we sow; The farm bill is loaded with pork and environmentally disastrous provisions”, By Daniel Imhoff, Los Angeles Times, April 10, 2008

PART I
71
The principal focus of our analysis is recent and current support, not what an unpredictable
Congress might do in the future. As noted earlier, President Obama has tried to reduce
expenditures on agriculture (while vastly increasing funding of nutrition programs):
“President Obama‘s budget calls for an end to direct payments to “large agribusinesses that don’t need them” but the proposal is likely to meet fierce opposition from farm-state lawmakers, particularly from the South…. In 2006, for instance, the top 1 percent of farmers received 20 percent of all payments, according to the Environmental Working Group, a nonprofit advocacy group that maintains a database of farm subsidies. Among the largest recipients are rice and cotton farmers. Lawmakers from the South, Texas and California have historically fought hard against payment limits.”145
“Why should we be sending millions of dollars to the largest corporate farms in the country? That’s not what a safety net is for,” said Senator Byron Dorgan, North Dakota Democrat, who has long championed a cap on payments. The issue pits corporate farms against small operations, and farmers and lawmakers from the corn and soybean Midwest against those in the south who rely on cotton and rice. And it may pry open the 2008 Farm Bill for revisions.”146
In FY 2009, Congress disagreed. Congress won and then again in 2010. Reaction to proposed
FY 2011 cuts aimed primarily at capping payments to the wealthiest farmers did not appear to be
any more likely to succeed, particularly, given the uncertain mid-term election situation.147
USDA appears to be immune to serious budget cutting. Therefore, for purposes of this study we
rely on data from the FY 2017 Budget proposal documents.
145 “Drilling Down on the Budget – Agriculture”, By Andrew Martin, The New York Times, February 27, 2009 146 “Obama reignites fight over U.S. farm subsidies”, By Roberta Rampton, Reuters News, February 25, 2009 147 “Campaign enters home stretch”, WCF Courier, September 7, 2010

PART I
72
B. Analysis of U.S. Federal Government Support
1. Total Value of U.S. Federal Government Support in 2015
The total value of support to agriculture provided by the United States in 2015 is the sum of all
USDA expenditures on account of all programs and Department activity, $210,703,000,000, and
the total value of all irrigation-related support provided by the Department of Interior, Bureau of
Reclamation, that is; $892,000,000.148 Therefore, GCS has estimated the total value of U.S.
federal support for agriculture for 2015 for purposes of our analysis to be $211,595,000,000.
Overview of U.S. dairy industry
• Milk has a farm value of production second only to beef among livestock industries and equal to corn.
• Dairy farms, overwhelmingly family-owned and managed regardless of size, are
generally members of producer cooperatives.
• Dairy products range from cheese, fluid milks, yogurt, butter, and ice cream to dry or condensed milk and whey products, used mostly as ingredients in processed foods.
• Cheese and fluid milk products now use most of the milk supply.
• Government traditionally has regulated both sanitary and market aspects of the dairy
industry.
• Historically, international trade in dairy products has only occasionally been important for the U.S. dairy industry. In coming years, however, international trade may have a greater impact on the domestic industry.149
Farm Milk Production
Major trends in milk production in the United States include: 1) a fairly steady slow increase in
production as gains in milk production per cow outweigh declines in the number of cows; and 2)
148 There is considerably more irrigation support provided at the level of sub-national governments. This support is addressed in Part II of the study. 149 www.usda.gov

PART I
73
a consistent decline in the number of dairy operations, matched by a continual rise in the number
of cows per operation.
Since 1970, milk production has risen by almost half, even though milk cow numbers have
declined by about a fourth (from about 12 million to roughly 9.3 million in 2015). Milk
production per cow has more than doubled from 9,700 pounds per year to 22,567 pounds150 in
2015. Similarly, the number of dairy operations declined from about 650,000 in 1970 to roughly
60,000 in early 2012, while over the same period the average herd size increased sevenfold from
about 20 cows to 153 cows.
Milk is produced in all 50 States. The top 10 producing States in 2015151 were:
- California
- Wisconsin
- Idaho
- New York
- Pennsylvania
- Texas
- Michigan
- Minnesota
- New Mexico
- Washington
As this list indicates, the major milk-producing States are in the West and North. The relative
importance of the western regions has grown, while other regions have declined or remained
steady. Western areas have had lower average costs of milk production for a variety of
organizational and climatic reasons.
150 www.statista.com, projected milk production per cow 2015-2025 151 https://www.statista.com/statistics/194968/top-10-us-states-by-milk-production/

PART I
74
Most dairy cows in the United States are Holsteins, a breed that tends to produce more milk per
cow than other breeds. The composition of Holstein milk in approximate terms is 87.7% water,
3.7% milkfat, and 8.6% skim solids.
In the United States, the decision to produce has milk largely seated in the hands of individuals
or families. Many of these farmers belong to producer-owned cooperatives. The cooperatives
assemble members’ milk and move it to processors and manufacturers. Some cooperatives
operate their own processing and manufacturing plants. Initially local, many of today’s dairy
cooperatives are national, with members scattered across the country.
In recent years there has been a trend to mega operations with more than 5,000 cows. Production
has increased well beyond demand. The resulting low prices have forced many smaller family
farms out of the industry.
Dairy Trade
International dairy trade absorbs only about 5% of the cow’s milk produced globally. The trade
is primarily in major manufactured dairy products—butter, cheese, and dry milk powders—with
some trade in fluid milk products, ice cream, yogurt, and dry whey products.
U.S. exports of dairy products have grown rapidly in recent years. Exports have increased from
$1,628,928,000 in 2005 to $5,240,047,000 in 2015. This 322% increase would appear to
coincide with the creation of Co-operatives Working Together (CWT) has not been a major
exporter of dairy products on a sustained basis. There have been sporadic unsubsidized exports
of butter and nonfat dry milk powder over time, but more often some subsidy has been required.
In 2007-08, the United States was able to take advantage of significant export opportunities due
to tighter global stocks, drought-induced production declines in Oceania, rising demand in
foreign countries and the weaker dollar in 2007. The United States is an important importer of
relatively large (although mostly fixed) amounts of cheese.

PART I
75
Prior to the conclusion of the Uruguay Round Agreement on Agriculture, the United States
employed explicit dairy product import quotas to shield the domestic dairy industry and Federal
price support programs from international dairy markets. As a member of the World Trade
Organization (WTO), the United States, along with many other dairy-producing countries,
established tariff rate quotas (TRQs) for dairy products. The TRQs allow imports at very low
tariffs up to fixed amounts. Any additional imports are subject to very high tariffs. Many of the
individual TRQs are administered through licenses for imports of specific products from specific
countries or regions.
Dairy Policy
Dairy policy in the United States includes both Federal and State programs. The major Federal
dairy programs are the system of Federal milk marketing orders. The price support program
delivered through a variety of programs was terminated by the 2014 Farm Bill. It was replaced
in part by the Milk Margin Protection Program. Government programs designed to assist
international trade and provide domestic and international food aid also affect the dairy industry.
2. Direct and Indirect Support.
Financial support to agriculture in the U.S. must be examined in the aggregate to obtain a full
and proper appreciation of its extent and depth. While we have estimated the values of direct
and indirect support, we have not been able to estimate the benefits from price and income
supports which supplement program support, nor tax exemptions because this information is not
readily available. Because our calculations do not include all support; our estimates tend to
understate actual benefits to U.S. agriculture, of all things done by the U.S. federal government.
3. Subsidies, Support and Tariffs
There is a direct competitive relationship (inter-linkage) between subsidies and support, on the
one hand, and tariff protection, on the other. Tariffs on imported products supplement financial
support to producers and processors. Subsidies both permit exporters to offset tariffs in

PART I
76
importing countries, and supplement tariff protection in preserving farm incomes which would
otherwise be reduced by import competition. Tariffs cannot be viewed in isolation. Nor can
Market Access negotiations ignore the effects of domestic support on the ability of recipients to
compete.
Many countries, including the United States, impose tariffs on imported products in order to
restrict or regulate imports by increasing prices of such imports in order to protect or insulate its
domestic producers and processors from import competition. This protection is particularly
important in the case of sensitive products subject to tariff rate quotas (TRQ) which tend to be
subject to highly subsidized import competition.
The subsidies and financial support provided by the United States benefit U.S. producers and
processors by establishing, maintaining and increasing their competitive advantage152 over
imported agricultural products (which are often sold at very low subsidized prices which skew
world markets). Because this competitive advantage is generally expressed in terms of lower
prices for domestic agricultural products as compared to imports, the only effective means of
competing with import competition in commodity-type products is to introduce border measures
(tariffs) which make imports more expensive, or to provide income/price support to compensate
for import pricing pressures.
U.S. producers and processors may retain some of the value of the subsidies and support
provided by the U.S. federal government rather than relying on the entire value of the subsidy
and support to reduce prices. It is not possible from the information available to us to determine
to what extent this is occurring. (In the case of many commodity products, such as feed grains,
the price is set by supply and demand, meaning that subsidy-driven over production forces prices
down, often triggering payment of even more support.) Our research and analysis demonstrates
that U.S. producers are relying on the subsidies and support provided by government to sell at
below their cost of production both at home and in export markets.
152 This is not necessarily a natural advantage – government intervention makes it a seized advantage.

PART I
77
While the mechanisms have changed and risk management (risk elimination) insurance based
programs are more prevalent, the effect is the same. Margin and price protection programs
permit the continued sale of commodities and other products at less than full cost.
This conclusion is supported by the Institute for Agriculture and Trade Policy (ITAP), which in
its February 2004 Update of its Report, “United States Dumping on World Agricultural
Markets”, observed:
“The latest numbers available show a continued trend of widespread agricultural dumping from U.S.-based global food companies. In 2002, exports continued to be sold well below the cost of production:
• Wheat was exported at an average price of 43 percent below cost of production; • Soybeans were exported at an average price of 25 percent below cost of
production; • Corn was exported at an average price of 13 percent below cost of production; • Cotton was exported at an average price of 61 percent below cost of production; • Rice was exported at an average price of 35 percent below cost of production.
While the 2002 data indicate an increase in dumping for cotton and rice, a decline for corn and soybeans, and a constant level for wheat, they are consistent with the trend of high levels of dumping for all five commodities over the last decade.”153
Although the ITAP addressed dumping with respect to exports, the same price pressures apply to
domestic sales by U.S. producers and processors. The “dumping” found by the ITAP is
underwritten through U.S. subsidies and support, the same mechanisms that support154 domestic
production and sale of agricultural products. Thus, these subsidies are arguably import
replacement subsidies, which are prohibited by Article 3(1)(b) of the WTO Agreement on
Subsidies and Countervailing Measures.155 Some examples are blatantly clear – such as
Senator Grassley’s recently tabled bill on biodiesel tax credit reform designed to deny benefits to
imported biodiesel.156
153 United States Dumping on World Agricultural Markets, February 2004 Update, Cancun Series Paper No. 1, pg 3 154 In fact, these subsidies encourage production, drive production down and increase exports. 155 http://www.wto.org/english/docs_e/legal/24-scm.pdf 156 https://www.grassley.senate.gov/news/news-releases/grassley-cantwell-lead-group-14-senators-bolster-renewable-fuels-biodiesel-tax
PART I
78
Thus, there is a relationship, an interlinkage, between subsidies and support and tariffs in terms
of their effect on the competitive relationship between U.S. produced agricultural commodities
and imports. Subsidies and support seize a competitive advantage for U.S. agricultural products
by allowing them to be sold at lower prices in both export and domestic markets, including at
prices significantly below cost of production.
While some agricultural products are not subject to high tariffs at the border, they benefit from
safety net or income support measures which insulate them from international competition.
These subsidies enable producers to “farm the mailbox” for their income, de-linking planting
decisions from market conditions. Insulating planting and harvesting decisions from supply,
demand and market forces results in surpluses sold on world markets at prices which need not
and do not cover costs of production.
This process is not likely to end any time soon. A respected U.S. research institute projects:
“The U.S. corn market share increases from 64 to 73 percent over the projection period”. (2004-2014).157
And these activities supported by U.S. subsidies directly impact farmers in Canada and other
markets.
In a 2005 investigation of dumped and subsidized imports of grain corn from the USA, the
Canada Border Services Agency determined that the following programs and incentives offered
by the U.S. Government provide actionable subsidies:
• Direct158 and Counter-cyclical Payment Program (formerly Marketing Loss
Assistance Payments)
• Nonrecourse Marketing Assistance Loans and Loan Deficiency Payments
• Federal Crop Insurance Program
157 Ascribe newswire, March 16, 2005, http://newswire.ascribe.org/cgi-bin, Agricultural Policy Research Institute Projects Rebounding U.S. Wheat Exports, Soybeans Concentration 158 Direct Payments were repealed by 2014 Farm Bill and replaced with enhanced crop insurance and programs where most of the premiums are subsidized by the U.S. tax payer.

PART I
79
The CBSA estimated that the amount of subsidy for the CBSA’s entire period of investigation
was 18% of the export price of the subject goods shipped to Canada or US$0.45 per bushel. The
CBSA stated that the amount of subsidy after a finding of injury would be US$0.87 per
bushel.159
In the absence of evidence to the contrary, the CBSA assumed that 100% of the subject goods
imported into Canada have benefited from the actionable subsidies.
The effect of these very large subsidies on many commodities around the world has been an
important inhibitor to progress of the Doha Development Agenda (DDA) negotiations on Market
Access. The Doha Declaration calls for improved market access (lower tariffs and larger tariff-
free import quotas) for agricultural products traded internationally. It also envisages substantial
reductions and eventual elimination of trade/production distorting domestic support. There is
considerable doubt about the reality of expecting the U.S. to do this.160
Clearly, these U.S. subsidy programs stimulate production, create surpluses which must be
exported, drive down prices, and force unsubsidized producers out of business. Absent real
reductions in such subsidies, improving market access to importing countries poses serious risks
for WTO members whose budgets do not permit such “deep pockets” support of their own
agriculture sectors.
C. U.S. Federal Agricultural Support Programs
The U.S. Department of Agriculture (USDA) provides support through a vast array of programs
ranging from Departmental administration and regulation, through inspection and grading
services to economic analysis and education, resource management, insurance, loans and grants,
direct payments and support, support for export sales and international and domestic food aid as
a means of intervening in the market and eliminating surpluses. While some of its activities may
159 Subsidies were increasing because of falling market prices. 160 “To unlock the agricultural negotiations the U.S. must first comply with the WTO rules”, Jacques Berthelot, Solidarité, February 8, 2007

PART I
80
appear ordinary day-to-day operations of government, USDA’s pockets are very deep and the
extent of U.S. support underscores the pervasive role government plays in the U.S. agriculture
sector.
The federal subsidies and support examined and estimated in Part I of this report do not include
State subsidies, and the generous support in the form of below-market price water provided
through state and local irrigation projects. Including subsidies and support provided by state and
local levels of government in our calculations, demonstrates more clearly that U.S. producers
will retain a significant competitive advantage notwithstanding any domestic support
concessions which may be made at some time in the future by the U.S. in WTO negotiations;
either of a revived Doha Round or some future multilateral initiative at a more favourable time.
1. Programs that Directly Support Dairy Production
Programs Recently Discontinued
• Milk Income Loss Contract (MILC) Program
• Dairy Product Price Support Program (DPPSP)
• Dairy Export Incentive Program (DEIP)
New Programs Established by the Agricultural Act of 2014
• Margin Protection Program for Dairy (MPP-Dairy)
• Dairy Product Donation Program (DPDP)
U.S. dairy policy has evolved over many years. The recent Agricultural Act of 2014 has brought
about substantial changes in protections for dairy farmers. Milk marketing orders continue to
play an important role.

PART I
81
Programs Repealed in 2014 Agricultural Act
The Milk Income Loss Contract (MILC) Program was repealed by the Agricultural Act of
2014. As authorized by the 2002 Farm Bill, payments were made to dairy operations based on
their milk marketed when the Class I price in Boston (Federal Milk Marketing Order 1) fell
below $16.94 per cwt. Payments were capped at 2.4 million pounds of production per fiscal year
per operation. With the 2008 Farm Bill, a mechanism was added to account for feed prices; when
a specified measure of feed price rose above a target level, the target milk price was raised by a
percentage of the difference in the feed price and the target feed-price level. The payment cap
was raised to 2.985 million pounds per fiscal year.
The Dairy Product Price Support Program (DPPSP) was repealed by the Agricultural Act of
2014. A purchase program for supporting farm milk prices started with the Agricultural Act of
1949 and was amended several times since then.
The Food, Conservation, and Energy Act of 2008 (2008 Farm Act) fundamentally changed the
milk support purchase program by specifying support prices of purchased manufactured products
instead of the price of milk. At the time the program was repealed, the Commodity Credit
Corporation (CCC) stood ready to buy bulk quantities of butter, cheddar cheese, and nonfat dry
milk that met specifications at the following wholesale prices:
− $1.05 per pound for butter,
− $1.13 per pound for cheese in blocks,
− $1.10 per pound for cheese in barrels, and
− $0.80 per pound for nonfat dry milk.
Market prices have exceeded support prices in recent years. Therefore, no price support
purchases occurred after 2009.
The Dairy Export Incentive Program (DEIP) was repealed by the Agricultural Act of 2014.
DEIP paid cash bonuses to exporters, allowing them to buy at U.S. prices and sell abroad at
prevailing (lower) international prices. DEIP removed nonfat dry milk, butterfat, and certain
PART I
82
cheeses from the domestic market and helped develop export markets. The DEIP was announced
by USDA on May 15, 1985. DEIP quantities and dollar amounts were subject to World Trade
Organization (WTO) restrictions under the Uruguay Round Agreement on Agriculture. Because
U.S. market prices have been competitive with international prices in recent years, no DEIP
bonuses occurred after 2010.
Milk Marketing Orders
The Agricultural Marketing Agreement Act of 1937 authorized Federal milk marketing orders,
which have been modified many times since then, to help establish orderly marketing conditions
for the benefit of both dairy farmers and dairy product consumers. A classified pricing
system and revenue pooling are two key elements of milk marketing orders. Milk marketing
orders set minimum prices paid by milk processors for milk used in fluid beverage purposes and
manufactured dairy products. These minimum milk prices are set by formulas and change each
month with changes in prices of major dairy commodities. Minimum prices of milk used for
fluid beverage purposes differ according to a geographic price structure. While most U.S. milk
is marketed through Federal milk marketing orders, some milk is marketed through similar State
programs (the largest being California’s). The rest of the milk is not included in either the
Federal or a State program.
The 1996 Farm Act called for several changes in milk marketing orders, including consolidation
of the then existing 31 orders. In 2009, there are 10 Federal milk marketing orders. The elements
of the 2008 Farm Act related to Federal milk marketing orders focus on processes under the
system’s regulations and on evaluation of effects—not on major program changes.
In 2014, the USDA budget for administration of the FMMOs was $47 million; it was expected to
increase to $49 million in 2015 and further increase to $51 million in 2016. The number of
employees also is expected to increase from the current 348 to 359 in 2015, according to budget
estimates.

PART I
83
In addition, for 2016, $20 million will be used to finance USDA oversight activities for all
marketing agreements and orders at the national level. These funds come from the U.S. Treasury
and are in addition to the industry-funded FMMO assessments.
New Programs Established by the Agricultural Act of 2014
The Margin Protection Program for Dairy (MPP-Dairy) offers dairy operations insurance
based on the average national dairy production margin (the difference between the U.S. all-milk
price and average feed cost). Benefits apply to a participating operation’s production history,
adjusted annually to reflect national average milk production increases. All dairy farm operations
are eligible to participate, and pay only the administrative fee ($100) if they select protection at
the minimum margin level ($4.00 per hundredweight (cwt) of milk). Higher levels of protection
are available, for which dairy farmers must pay both the administrative fee and a premium.
A participating dairy operation will pay a premium based on the level of coverage elected.
Premiums will be calculated by multiplying the coverage percentage selected (from 25% to 90%)
multiplied by the production history of the dairy operation to obtain the covered milk
marketings. The covered milk marketings are multiplied by the premium per cwt applicable for
the coverage level selected. Premiums will be calculated from Tier 1 for covered production
history up to 4 million pounds and from Tier 2 for covered production history exceeding 4
million pounds. For calendar years 2014 and 2015, the premium rate will be reduced by 25% for
production under the Tier 1 premium schedule, except at the $8.00 per cwt margin level.

PART I
84
Coverage level (margin)
Tier 1 premium for 2014–20151
Tier 1 premium for 2016–20182
Tier 2 premium for 2014–20183
4.00 None None None
4.50 0.008 0.010 0.020
5.00 0.019 0.025 0.040
5.50 0.030 0.040 0.100
6.00 0.041 0.055 0.155
6.50 0.068 0.090 0.290
7.00 0.163 0.217 0.830
7.50 0.225 0.300 1.060
8.00 0.475 0.475 1.360 1Covered production history less than 4 million lb with 25% reduction. 2Covered production history less than 4 million lb. 3Covered production history less than 4 million lb. Source: USDA, Farm Service Agency.
Premiums for Margin Protection Program – Dairy ($/cwt)
The Dairy Product Donation Program (DPDP) requires the Secretary of Agriculture to
purchase dairy products for donation to low-income groups when dairy margins, as determined
under the MPP-Dairy, fall below $4.00 per cwt the two prior months. The program remains in
effect until specified margin or product price levels are met or until purchases have been made
for three consecutive months. Dairy products will be purchased at prevailing market prices in
consultation with public and private nonprofit organizations serving the nutrition needs of low-
income populations, which will distribute the donations through food banks and other feeding
programs.
2. Domestic Support Programs
The U.S. domestic support system has been revamped and strengthened through successive Farm
Bills.

PART I
85
Government support to U.S. agricultural producers goes far beyond commodity and income
support or “safety-net” programs to include grants and loans and disaster assistance. The 2014
U.S. Farm Bill goes well beyond risk management. Its focus is risk elimination.
The Agriculture Act of 2014 (2014 farm bill) transformed many of the agricultural
programs from the Food, Conservation and Energy Act of 2008 (2008 farm bill). The
new law altered many of the commodity (Title I) programs that are tied to historical acres
and yields. For example, the 2008 Title I programs included the direct payment program
which paid constant amounts regardless of economic conditions. This program came
about with the Freedom to Farm Act (aka 1996 Farm Bill). The 2014 farm bill eliminated
this type of payment so that programs are more reflective of market conditions (for
example, not providing a payment when prices and producer revenue are high).
While the end of the 2014 farm bill in 2018 seems far off, it is likely debate will begin
sooner than later. Considering conditions today and looking at different farm bill options
from the 2008 and 2014 legislation will provide useful information to inform that debate.
To evaluate changes to land use and government costs, we start by using the FAPRI
model to evaluate what would happen with no farm programs at all. We then consider
Title I programs and Title XI (crop insurance) programs as well as the conservation
reserve program. To isolate the effects of those programs under the two different farm
bill vintages, we start by allowing Title I programs, followed by then allowing Title XI
programs and finish by allowing CRP enrollment and payments.
The 2014 farm bill eliminated all of the 2008 programs except marketing loans. Instead,
producers had to choose between Price Loss Coverage (PLC) and Agriculture Risk
Coverage (ARC) for each commodity on a farm. PLC operates like the CCP program
except with higher levels of price protection. While ARC has some similarities to ACRE,
it has some fundamental differences. Payments are not tied to actual plantings and the
version chosen by most producers protects revenue at the county level which has no

PART I
86
farm-level loss criteria. If a producer did not choose ARC for a commodity and purchases
crop insurance for it, the crop is eligible for the new Supplemental Coverage Option
(SCO) crop insurance program. Upland cotton is no longer a program crop but is still
eligible for marketing loans. Instead, upland cotton producers have an additional crop
insurance program available to them, the Stacked Income Protection Plan (STAX).161
The 2017 USDA Budget Summary indicating total budgetary allocations for the Commodity
Credit Corporation are $4,682,000,000 for 2015; 8,214,000,000 for 2016 and $11,300,000,000
for 2017.162 The support provided through the Commodity Credit Corporation alone would
constitute a significant portion of the $211billion referred to above; indeed, funding of support
through CCC activities, will exceed this by a significant margin.
CCC net outlays have declined from a record high of $32.3 billion in 2000 to $4.7 billion in
2015, reflecting higher prices for most commodities resulting from increased demand for
bioenergy production and strong export demand.
The FY 2017USDA Budget shows the following CCC net outlays:163
2015 (Enacted) $4,682,000,000
2016 (Estimate) $8,214,000,000
2017 (Budget) $11,300,000,000
The domestic support programs benefit a broad range of U.S. producers, including U.S. dairy
producers. Dairy production, according to USDA is just behind beef and equal to corn in terms
of benefits.
161 “Now that it’s 2016, Let’s Compare 2014 Farm Bill Programs to the 2008 Farm Bill, FarmDocDaily, University of Illinois at Urbana-Champaign, July 8, 2016 162 FY 2017 Budget Summary, U.S. Department of Agriculture, pg 24 163 Ibid.

PART I
87
3. Export Subsidy Programs
The United States provides substantial support to its agricultural exporters through Export
Credit Guarantee Programs (GSM-102 and the Facility Guarantee Program (FGP)).
These programs provide low-cost (and below cost) export credit guarantees to support the export
sale of U.S. agricultural products. The Panel in United States – Upland Cotton164 determined that
these programs provide export subsidies in violation of U.S. obligations. The Panel findings
were confirmed by the Appellate Body.165 The programs remain in force, are more generous and
the U.S. has still not properly implemented the Upland Cotton findings.
These now condemned export subsidy programs provide support that is vital to the continued
export sale of U.S. agricultural products. Expenditures under these programs provide significant
support to U.S. agriculture, and must be calculated in determining U.S. compliance with its
WTO export subsidy commitments.
Market Development Programs – FAS administers a number of programs, in partnership with
private sector cooperator organizations, which support the development, maintenance, and
expansion of commercial export markets for U.S. agricultural commodities and products. In
2015, almost 1,000 U.S. companies and organizations participated in 21 USDA endorsed trade
shows in 16 countries. On-site sales totaled an estimated $421 million and the total value of
agricultural exports resulting from participation in foreign food and agricultural trade shows in
2015 was $1.52 billion. 166
In addition to these programs, the United States maintains a number of international food aid
programs. The abuse of international food aid can be an export subsidy. Article 10(4) of the
Agreement on Agriculture permits provision of international food aid that is not tied, directly or
indirectly, to commercial exports of agricultural products; that is carried out in accordance with
164 World Trade Organization (WTO), United States—Subsidies on Upland Cotton; Report to the Panel (WT/DS267/R), 8 September, 2004 165 WT/DS267/AB/R, March 3, 2005, para 763(e) 166 FY 2017 Budget Summary, U.S. Department of Agriculture, pg 31

PART I
88
FAO Principles of Surplus Disposal and Consultative Obligations and which is provided to the
extent possible in fully grant form or on terms no less concessional than those set out in the Food
Aid Convention. The USA can and does donate foods under its programs in a manner that does
violate its WTO obligations. In the past, the United States has relied on these programs to
support domestic producers by disposing of surplus commodities on the international market and
could do so in future. Any such provision of international food aid outside the bounds of AoA
Article 10(4) would constitute an export subsidy that must be included in calculating U.S. export
subsidy commitments.
4. De Facto and Article 9.1(c) Export Subsidies
It is important to analyze de facto export subsidy effects of U.S. domestic support (see Article
9.1(c)) when assessing overall U.S. support of agriculture, and the extent of adverse effects of
massive U.S. domestic support in world markets.
By de facto export subsidies we mean the use of what appear to be domestic subsidies and
support which stimulate overproduction of important commodities such as corn, other feed
grains, cotton and soybeans that have historically been sold on export markets. Traditional U.S.
domestic support programs have stimulated production of these commodities to levels well in
excess of domestic requirements. While available supplies of feed grains were very tight, in
view of the renewable fuel programs, the subsidies continued. The “domestic” support provided
to farmers to grow these commodities effectively stimulates surpluses and supports export sales.
The value of these export subsidies is substantial and pursuant to recent WTO dispute settlement
decisions, must be counted against United States’ export subsidy commitments.
WTO Agreement on Agriculture Article 9.1(c) export subsidies are payments financed by virtue
of governmental action that are made on the export of agricultural products and include
payments by producers in the form of sales made at less than cost. Based on WTO DSU
interpretations, U.S. producers arguably provide very generous Article 9.1(c) export subsidies to
support export sales of many commodities. These export subsidies should be counted against
U.S. export subsidy commitments. We recognize that these export subsidies result from the

PART I
89
existence of U.S. domestic support programs, which stimulate surpluses and permit export sales
below average cost of production. We should not logically count the same support as both
domestic and export subsidies. We have not included these subsidies in our overall estimate of
U.S. federal support for the reasons explained above.
To assist in understanding the WTO status of these subsidies, we refer to the following extract
from the Panel report on European Communities – Export Subsidies on Sugar. The Sugar Panel
recognized the impact of domestic support on world market markets.
“7.307 Important by-products of this production support are structural surpluses, with EC sugar production substantially in excess of consumption. Consumption averages around 12.5 million tonnes, whereas production ranges between 15-18 million tonnes. In addition to sugar manufactured from domestically harvested beet or cane, a further 1.8 million tonnes of sugar is manufactured from raw cane sugar imported mainly from ACP countries. The regime ensures that domestic production surplus to consumption is disposed of on export markets. Approximately 20 percent of all sugar produced is exported.”
The Appellate Body (AB) in its decision in Canada – Dairy introduced the concept of cross-
subsidization into the WTO AoA. They explained:
“Canada also objects that this reasoning brings “cross-subsidization” under Article 9.1(c) of the Agreement on Agriculture. We have explained that the text of Article 9.1(c) applies to any “governmental action” which “finances” export “payments”. The text does not exclude from the scope of the provision any particular governmental action, such as regulation of domestic markets, to the extent that this action may become an instrument for granting export subsidies. Nor does the text exclude any particular form of financing, such as “cross-subsidization”. Moreover, the text focuses on the consequences of governmental action (“by virtue of which”) and not the intent of government. Thus, the provision applies to governmental action that finances export payments, even if this result is not intended. As stated in our Report in the first Article 21.5 proceedings, this reading of Article 9.1(c) serves to preserve the legal “distinction between the domestic support and export subsidies disciplines of the Agreement on Agriculture”. Subsidies may be granted in both the domestic and export markets, provided that the disciplines imposed by the Agreement on the levels of subsidization are respected. If governmental action in support of the domestic market could be applied to subsidize export sales, without respecting the commitments Members made to limit the level of export subsidies, the value of these commitments would be undermined. Article 9.1(c) addresses this possibility by bringing, in some circumstances, governmental action in the domestic market within the scope of the “export subsidies” disciplines of Article 3.3.”

PART I
90
The Appellate Body in Canada – Dairy established that contrary to the understanding of many
WTO members, there were previously unrecognized obligations which can result in export
subsidies, where none were believed to exist. There have been similar findings against E.U.
policies and based on the Appellate Body’s logic, a number of U.S. programs are also at risk.
According to AB in E.C. – Sugar relying on Canada – Dairy Panel, there is no need for
“payments” to be financed by a government mandate or direction.
“7.324 The Panel recalls that the “demonstrable link” and clear “nexus” between the “financing of payments” and the “governmental action” must be established in order to qualify as a payment “by virtue of governmental action”. In Canada – Dairy (Article 21.5 – New Zealand and U.S. II), the Appellate Body stated that “Article 9.1(c) embraces the full-range’ of activities by which governments ‘ ‘regulate’, ‘control’ or ‘supervise’ individuals’. In particular, it said that governmental action ‘regulating the supply and price of milk in the domestic market’ might be relevant ‘action’ under Article 9.1(c). It added that “Article 9.1(c) does not require that payments be financed by virtue of government ‘mandate’, or other ‘direction’. Although the word ‘action’ certainly covers situations where government mandates or directs that payments be made, it also covers other situations where no such compulsion is involved. 7.325 Of particular relevance in the present dispute is the Appellate Body’s discussion of the word “financed” (by virtue of governmental action) which refers to the “mechanism or process” put in place by the government: “The word refers generally to the mechanism or process by which financial resources are provided to enable ‘payments’ to be made”.”
In our de facto export subsidy analysis, we have focused on sales at less than cost of production,
as the decisions in Canada – Dairy requires us to do so – as did the Panel in E.C. – Sugar.
“7.297 The Panel acknowledges, as was stated by the Appellate Body in Canada – Dairy (Article 21.5 – New Zealand and U.S.), that normal economic operators must cover their total costs of production and if they do not, this may be evidence that they receive an advantage of some sort: “For any economic operator, the production of goods or services involves an investment of economic resources. In the case of milk producer, production requires an investment in fixed assets, such as land, cattle and milking facilities, and an outlay to meet variable costs, such as labor, animal feed and health-care, power and administration. These fixed and variable costs are the total amount which the producer must spend in order to

PART I
91
produce the milk and the total amount it must recoup, in the long-term, to avoid making losses. To the extent that the producer charges prices that do not recoup the total cost of production, over time, it sustains a loss which must be financed from some other source, possibly “by virtue of governmental action”.
7.298 The Panel recalls that in the ordinary course of business, a private business or economic operator would make the decision to produce and sell a product, not only to recover the total cost of production, but also with the objective of making profits. The Panel is of the view that export sales below total cost of production cannot be sustained unless they are financed from some other source, possibly “by virtue of governmental action”. 7.299 The Panel recalls that the Appellate Body in Canada – Dairy (Article 21.5 – New Zealand and U.S.) determined that the appropriate “benchmark” to assess the proper value of the subject good, considering the facts and circumstances of the dispute, was the average total cost of production of the CEM milk. In determining the proper value to the producer, a payment analysis “requires a comparison between the price actually charged by the provider of the goods or services … and some objective standard or benchmark which reflects the proper value of the goods or services to their provider…”. In that dispute the Appellate Body, in search of an objective standard that would establish the proper value of milk to the milk producer, found that the average total cost of production took best into account the “motivations of the independent economic operator who is making the alleged ‘payments’” and the value of milk to it. The Appellate Body used this benchmark as it answered the “crucial question, namely, whether Canadian export production has been given an advantage”.” (emphasis added)
There are important domestic support programs in the U.S. which result in un-notified AoA
Article 9.1(c) subsidies, on the basis that in the words of the Appellate Body:
“If governmental action in support of the domestic market could be applied to subsidize export sales without respecting the commitments (on exports), the value of these commitments would be undermined.” (emphasis added)
Based on the WTO DSU decision in Canada – Dairy, benefits may be calculated based on the
exports made at prices not reflecting full average cost of production. However, preparing such
calculations was beyond the scope of this study. As noted earlier, in preparing our estimates, we
recognized that the de facto export subsidies at issue are, in fact, the result of misused and
misguided domestic support programs that are already counted in the overall domestic subsidy
estimate. Therefore, we have not separately calculated for inclusion in our estimate of support
and subsidies deemed to be de facto export subsidies.

PART I
92
However, we have provided illustrations of the significant gap between cost of production and
farm gate prices. When viewed in the context of increased U.S. exports of dairy products, the
pricing of milk appears to be subsidized in accordance with Article 9.1 (c) of the WTO
Agreement.
In light of the total value of support provided through de facto export subsidies and Article 9.1(c)
export subsidies, we conclude that the United States has exceeded and will likely continue to
exceed, its Uruguay Round export subsidy commitments.
“A potential issue is that, unless designed appropriately, margin insurance may guarantee a profit
to some of the largest farms due to their lower production costs. This would distort the structure
of production among farms of differing sizes.”167
Five crops have traditionally received the lion’s share of U.S. domestic support - wheat, corn,
soybeans, rice and cotton. These crops are produced in substantial volumes, well in excess of
domestic needs. The resulting surpluses must be sold on export markets and U.S. programs
permit such sales below average cost of production.
Soybeans and corn are prime examples of commodities that are highly subsidized in the United
States, resulting in significant over-production that must be sold onto the world market. (It is
also relevant that both corn and soybeans are used in feeding dairy cattle providing benefits to
dairy farmers through reduced feed costs.)
Year after year the United States produces far more corn and soybeans and other commodities
than it can possibly use and the excess must be exported. This is not simply a matter of bumper
crops that resulted from favorable planting, weather conditions and yields.168 Rather, planting
decisions are made based on expected returns, which in the U.S. include “safety net” support
167 Political Economy of the 2014 Farm Bill, American Journal of Agricultural Economics, 97(5), By David Orden and Carl Zulauf, June 11, 2015 168 Above normal yields can exacerbate over-production as did occur in the U.S., for example, in 2004

PART I
93
received from government which insulates producers from market conditions, including supply
and demand.
Record U.S. soybean production in 2016 reached 4.31 billion bushels, up 10% from 2015. Corn
production in 2016 was 15.1 billion bushels, up 11% from 2015.169
Would the United States supply nearly 40% of the world corn market if Government did not
provide such generous support to its corn producers permitting them to sell year after year at less
than cost of production? In the absence of this support, and if the actual cost of growing corn
and obtaining all revenue from the marketplace were real disciplines, it is far more likely that
U.S. corn producers would make different planting decisions. The level of U.S. corn exports
would be determined by market forces rather than be driven by government support or risk
elimination programs. Therefore, the decision to provide support year after year that results in
perpetual over-production and surpluses that must be exported, should be considered de facto
export subsidies. The value of this support should be counted against U.S. export subsidy
commitments.
As previously discussed, these subsidies which distort production and exports, particularly
exports at less than cost of production have been found to be export subsidies in Canada – Dairy
and E.C. – Sugar. Clearly, Article 9.1(c) of the Agreement on Agriculture should be applied to
U.S. exports benefiting from domestic support which enables them to be sold on world markets
at less than fully absorbed cost of production.
Because these subsidies have been reported as domestic support we have not reported them as
export subsidies in order to avoid double counting. This additional analysis underlines the
serious production and trade distorting effects of U.S. domestic support.
169 “Corn and Soybean Production up in 2016”, USDA NASS, January 12, 2017

PART I
94
5. Domestic and International Food Aid
The United States Federal Government provides domestic and international food aid through a
number of programs which provide significant support to U.S. agriculture. Such support can be
provided without violating WTO obligations (if aid is provided in a manner that is fully
consistent with Annex 2(4) to the Agreement on Agriculture with respect to domestic food aid
and Article 10(4) of the Agreement on Agriculture with respect to international food aid).
Whether or not this support is exempt from U.S. domestic and export subsidy obligations (and
we consider that it is not consistent), these programs allow the U.S. Federal Government to
intervene in the market with the result that prices are supported to the benefit of U.S.
producers.170
6. Irrigation Programs
The United States provides extensive support to agricultural producers through the provision of
low-cost water for irrigation. There are approximately 130 irrigation projects in 11 western
states that promote and support U.S. agriculture. By far the major portion of support to U.S.
agricultural producers through these programs comes from the provision of subsidized water and
electricity by state and local governments which is addressed in Part II of this study.
The OECD reports that:
“A 2014 study by the U.S. Government Accountability Office (“Availability of Information on Repayment of Water Project Costs Could Be Better Promoted”) evaluated irrigation district repayment for 130 federal water projects in the Western U.S. At Grand Coulee Dam, the Columbia Basin Project pumps uphill 3.3 million acre-feet of river water for delivery to 670,000 acres across the Columbia Plateau. This massive project cost $2.4 billion to construct. (In today’s dollars, the cost would be enormously higher.) Of that, $685 million was allocated to irrigated agriculture. But $495 million – nearly 75 percent – has been written off for payment by Bonneville Power Administration ratepayers, socializing the costs to millions of people paying their utility bills.
170 In our calculations, we include only the cost of the food aid programs to government. We have not calculated or estimated any price support effect.

PART I
95
As reported by the GAO, of the $190 million left to be repaid by the irrigators, only $60 million has been paid, with payments stretched over 50 years at zero interest. On balance, irrigators have paid less than 5 percent of their share. The Yakima Project stores and diverts 1.2 million acre-feet of water from five reservoirs in the Cascade Mountains, serving irrigation districts in Kittitas, Yakima and Benton counties. Here, construction costs total $286 million, with $149 million allocated to irrigators. The GAO reports slightly better repayment. Still, Yakima Valley irrigators have paid less than 10 percent of the total costs. Crops grown in these federal projects don’t pay for the existing water supply infrastructure, loudly signaling that expanding these irrigation projects won’t cover costs either. Nonetheless, the U.S. Bureau of Reclamation has partnered with Washington’s Office of the Columbia River to pursue multibillion dollar expansions of both the Columbia Basin and Yakima projects.”171
The U.S. Federal Government, through the Department of the Interior, Bureau of Reclamation, is
responsible for developing and maintaining the irrigation infrastructure. The Department notifies
an amount on account of irrigation infrastructure as non-product specific support to the WTO.
However, expenditures on water resources by the Department provides additional indirect
support for U.S. agriculture and U.S. dairy producers.
D. Conclusions
U.S. Federal Government program level support and subsidy programs on agriculture have been
increasing since 1998. Attempts to reduce Farm Bill spending in FY 2009 and FY 2010 were
defeated by Congress and a similar fate is expected to await in 2018 Farm Bill on both sides of
Congress suggests that even these modest proposals will be frustrated.
Although the WTO Members (at U.S. insistence during the Uruguay Round) segregated
subsidies into different categories (colored boxes) on the basis of their presumed impact on trade,
the money provided through these programs is fungible and clearly encourages and permits
increased production and distorts trade. The fungibility view is gaining increased support among
less affluent WTO members. 171 “Guest opinion: Public can’t afford to subsidize new water projects”, By John Osborn And Ken Hammond, The Spokesman-Review, January. 4, 2015
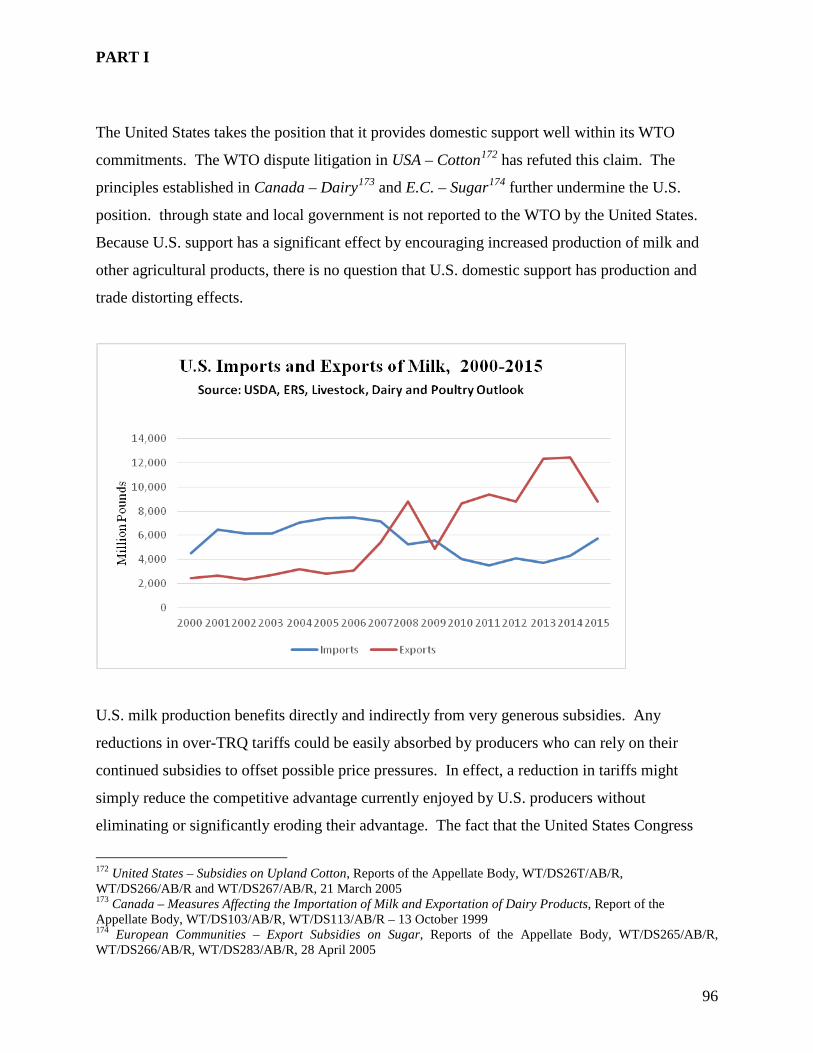
PART I
96
The United States takes the position that it provides domestic support well within its WTO
commitments. The WTO dispute litigation in USA – Cotton172 has refuted this claim. The
principles established in Canada – Dairy173 and E.C. – Sugar174 further undermine the U.S.
position. through state and local government is not reported to the WTO by the United States.
Because U.S. support has a significant effect by encouraging increased production of milk and
other agricultural products, there is no question that U.S. domestic support has production and
trade distorting effects.
U.S. milk production benefits directly and indirectly from very generous subsidies. Any
reductions in over-TRQ tariffs could be easily absorbed by producers who can rely on their
continued subsidies to offset possible price pressures. In effect, a reduction in tariffs might
simply reduce the competitive advantage currently enjoyed by U.S. producers without
eliminating or significantly eroding their advantage. The fact that the United States Congress
172 United States – Subsidies on Upland Cotton, Reports of the Appellate Body, WT/DS26T/AB/R, WT/DS266/AB/R and WT/DS267/AB/R, 21 March 2005 173 Canada – Measures Affecting the Importation of Milk and Exportation of Dairy Products, Report of the Appellate Body, WT/DS103/AB/R, WT/DS113/AB/R – 13 October 1999 174 European Communities – Export Subsidies on Sugar, Reports of the Appellate Body, WT/DS265/AB/R, WT/DS266/AB/R, WT/DS283/AB/R, 28 April 2005

PART I
97
intends to continue to rely on generous domestic support simply indicates that the government-
supported and seized competitive advantage currently enjoyed by U.S. dairy producers will
continue for the foreseeable future and will likely continue, whatever the outcome of the Doha
Development Round negotiations may be.
Meaningfully reduced levels of domestic support will not happen unless the full scope and value
of U.S. trade and/or production distorting domestic support is subject to meaningful negotiation
effectively disciplined. This would require that benefits provided under all Federal and State
programs, including irrigation subsidies be subject to negotiation, discipline and reduction.
In some cases, the support provided through individual USDA programs might not be included
in the U.S. AMS nor be subject to domestic support reduction commitments. In the world of
U.S. farm support, everything is viewed through green colored glasses. On an individual basis,
some programs apparently have no admitted or de facto trade or production distorting effects or
may be provided, with impunity, for one of the specific purposes set out in Annex 2(2) to the
Agreement on Agriculture.
U.S. financial support results in annual overproduction of a number of commodities, including
corn, soybeans and milk.
Surplus production of these commodities is dumped onto world markets through sales made at
below average cost of production. Transportation issues which limit movement of liquid milk
make it difficult to simply dump fluid milk onto the world market. However, the United States
disposes of further processed surplus milk production through a number of programs which are
described in this report. Whether the milk is used in domestic food aid programs or given to
livestock producers in the form of feed or exported as cheese, yogurt or milk powder surplus
production is removed from the U.S. market.

PART I
98
The WTO panel in U.S. – Upland Cotton clearly determined that certain U.S. domestic subsidies
act as import replacement subsidies.175 Such subsidies are prohibited under Article 3(1)b of the
Agreement on Subsidies and Countervailing Measures. This finding of the Panel was confirmed
by the Appellate Body.176
The impact of U.S. domestic support, and its mis-characterization under the Agreement on
Agriculture, have contributed to stagnation in Agriculture negotiations related to the Doha
Development Agenda. If this U.S. view of the WTO consistency of its domestic support was
correct, tighter scope for green subsidies, and elimination of the de minimis loophole would be
required before there would be any perceptible impact on U.S. production levels.
We recognize that there have been budgetary initiatives to limit farm support, but these are
resisted by Congress. It is reasonable to conclude that even though reduced payments to dairy
have been purported by USDA, we will see further increases in U.S. dairy production going
forward. Since we began preparing these analyses for DFC, we have send little evidence of
restraint on the part of Congress in supporting U.S. farmers and ranchers.
Smaller dairies are currently complaining about the inadequacies of the MMP (Milk Margin
Protection) Programs – suggesting that the co-op driven NMFP (National Milk Producers
Federation) sold them down the river. Here are fewer new on MMPP.
“It’s a complete failure,” said Les Pike, of Keewaydin Farm in Stowe, Vermont, which has been
losing money for months. “If it doesn’t pay in a year like this, it’s completely useless.”177
Farmers say the margin protection program is not based on Northeast farmers’ feed costs but on
the national average feed cost, which is less. The chairman of the National Milk Producers
Federation testified in Washington last month that the program needs improvements. Randy
Mooney, who is also a Missouri dairy farmer, said the formula for calculating feed costs was
175 World Trade Organization (WTO), United States – Subsidies on Upland Cotton; Report of the Panel (WT/DS267/R), September 8, 2004, para 7.1088 176 WT/DS 267/AB, R, March 3, 2005, para 763(d)(i) 177 Rathke, Lisa, “Dairy farmers say safety net on milk prices is not helping”, Associated Press, June 19, 2016.

PART I
99
changed and no longer reflects the true cost of feeding a herd while insurance premiums for
farmers were not reduced.178
An oversupply of milk in the U.S. and the world has caused milk prices paid to farmers to fall
below production costs for months—hovering between $14 and $15 per hundred pounds of
milk.179
Legislation has been introduced in the U.S. House by Vermont Rep. Peter Welch, a Democrat,
New York Rep. Chris Gibson, a Republican, and Democratic Rep. Jo Courtney of Connecticut
that would amend the Farm Bill to require the Secretary of Agriculture to use data from each
state to calculate average feed costs and dairy production margins for the insurance program.180
Given the level of domestic support provided by the U.S. Federal Government, and potential
increases in that support level, it is unlikely that any negotiated reductions in tariff production or
other improvements in market access will have any real effect on access to the U.S. market.
Prices in law cost of production in the U.S. market imports. The U.S. exports of dairy products
to Canada are greater than Canadian exports to the U.S. by a factor of five. Tariff reductions by
other countries will increase their exposure to highly subsidized U.S. exports. The problems of
Mexican corn growers, or African cotton producers, are not the only results of U.S. subsidies.
These have been the most publicized.
To fully appreciate the implications and effects of U.S. domestic support on dairy producers, it is
important to consider the impact in subsidies and support in production.
178 Rathke, Lisa, “Dairy farmers say safety net on milk prices is not helping”, Associated Press, June 19, 2016 179 Ibid. 180 Ibid.

PART I
100
0
2,000
4,000
6,000
8,000
10,000
12,000
14,000
2000 2001 2002 2003 2004 2005 2006 2007 2008 2009 2010 2011 2012 2013 2014 2015
Mill
ion
Poun
ds
U.S. Imports and Exports of Milk, 2000-2015Source: US5A, ERS, Livestock, 5airy and toultry Outlook
Imports Exports

PART I
101
E. Summary of Program Benefits
The summary table is intended only to provide a guide to programs examined. It is not totaled
because of differences in reporting by agencies of the U.S. government. It is not a check on the
total program allocation to dairy products.
List of Programs Allocation to Dairy Industry (USD)
II. Domestic Support 3,827,438,823
A. Farm Loan and Grant Programs 674,770,800
A.1 Farm Operating and Ownership Loans 647,683,000
A.2 Emergency Disaster Loans 1,370,200
A.3 State Mediation Grants 316,200
B. Commodity Programs 1,008,783,400
C. Price Loss Coverage (PLC) and Agricultural Risk
Coverage (ARC)
nil
D. Non-Recourse Marketing Assistance Loans and Loan Deficiency Payments
621,310,023
E. Price Support Marketing Assistance Loans and Related Stabilization Programs
807,574,800
F. Disaster Payments 316,200
G. Dairy Margin Protection Program (MPP-Dairy) 25,000,000
H. Noninsured Assistance Payments 12,542,600
I. Farm Storage and Sugar Storage Facility Loans 26,771,600
J. Dairy Indemnity Payment Program 1,000,000
III. Export Subsidies 1,460,527,800
A. Foreign Agricultural Service 844,254,000
B. Export Credit Guarantee Programs 579,700,000
C. Facilities Financing Guarantees 10,540,000
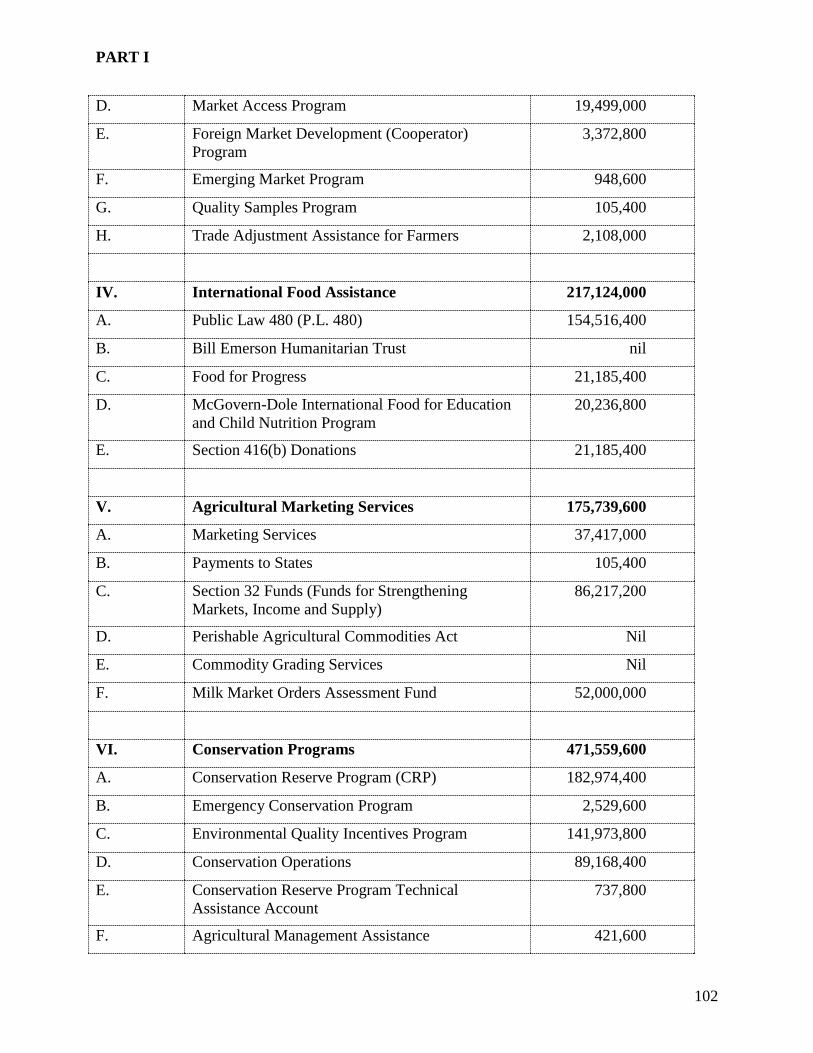
PART I
102
D. Market Access Program 19,499,000
E. Foreign Market Development (Cooperator) Program
3,372,800
F. Emerging Market Program 948,600
G. Quality Samples Program 105,400
H. Trade Adjustment Assistance for Farmers 2,108,000
IV. International Food Assistance 217,124,000
A. Public Law 480 (P.L. 480) 154,516,400
B. Bill Emerson Humanitarian Trust nil
C. Food for Progress 21,185,400
D. McGovern-Dole International Food for Education and Child Nutrition Program
20,236,800
E. Section 416(b) Donations 21,185,400
V. Agricultural Marketing Services 175,739,600
A. Marketing Services 37,417,000
B. Payments to States 105,400
C. Section 32 Funds (Funds for Strengthening Markets, Income and Supply)
86,217,200
D. Perishable Agricultural Commodities Act Nil
E. Commodity Grading Services Nil
F. Milk Market Orders Assessment Fund 52,000,000
VI. Conservation Programs 471,559,600
A. Conservation Reserve Program (CRP) 182,974,400
B. Emergency Conservation Program 2,529,600
C. Environmental Quality Incentives Program 141,973,800
D. Conservation Operations 89,168,400
E. Conservation Reserve Program Technical Assistance Account
737,800
F. Agricultural Management Assistance 421,600

PART I
103
G. Conservation Security Program 2,951,200
H. Agricultural Conservation Easement Program
(ACEP)
41,527,600
I. Resource Conservation and Development nil
J. Watershed and Flood Prevention Operations 8,010,400
K. Watershed Rehabilitation Program 1,264,800
L. Regional Conservation Partnership 9,802,200
VII. Crop Insurance 1,147,806,000
A. Livestock Gross Margin Insurance for Cattle
B. Livestock Gross Margin for Dairy Cattle Insurance Policy
C. Livestock Gross Margin for Swine Insurance Policy
D. Livestock Risk Protection Feeder Cattle Insurance
E. Livestock Risk Protection Lamb Insurance Policy
F. Supplemental Revenue Assistance Payments Program
VIII. Rural Development 4,056,846,000
A. Rural Business – Cooperative Service
A.1 Business and Industry (B&I) Loan Guarantees 128,166,400
A.2 Rural Housing Service 3,062,291,600
A.3 Rural Utilities Service 842,778,400
IX. Animal and Plant Health Inspection Services 222,921,000
A. Agricultural Quarantine Inspection Fees 17,601,800
B. Plant and Animal Health Monitoring 62,502,200
C. Pest and Disease Management Programs 17,601,800
D. Animal Care 3,056,600
E. Scientific and Technical Services 3,794,400

PART I
104
F. Emergency Fund (CCC) 106,137,800
X. Food Safety and Inspection 129,747,400
A. Federal Food Safety and Inspection 94,965,400
B. State Food Safety and Inspection 6,429,400
C. International Food Safety and Inspection 1,686,400
D. Codex Alimentarius Commission 421,600
XI. Food and Nutrition Services 11,634,052,000
A. Supplemental Nutrition Assistance Program
(SNAP)
8,624,882,000
B. Child Nutrition Programs 2,263,465,000
C. Special Supplemental Food Program for Women, Infants, and Children (WIC)
698,169,600
D. Commodity Assistance Program 31,725,400
XII. Grain Inspection, Packers and Stockyard Administration (GIPSA)
4,532,200
XIII. Forest Service 600,569,200
A. Forest and Rangeland Research 35,309,000
B. State and Private Forestry 22,977,200
C. Land Acquisition 4,743,000
XIV. Research, Education and Economics 305,765,400
A. Agricultural Research Service 127,323,200
B. National Institute of Food and Agriculture 151,354,400
C. Economic Research Service 8,959,000
D. National Agricultural Statistics Service 18,128,800
XV. Irrigation Infrastructure 94,016,800

PART I
105
II. Domestic Support
The programs used to deliver domestic support and subsidies which are reviewed in this section
are primarily delivered by the Farm Service Agency (FSA) or by the Commodity Credit
Corporation (CCC).
The Farm Services Agency was established in 1994 and administers a broad range of activities
such as farm income support programs, conservation programs, and crop insurance programs.181
The Commodity Credit Corporation provides funding for commodity programs and conservation
programs that are administered by the Farm Service Agency and the Natural Resources
Conservation Service (NRCS). The Commodity Credit Corporation also provides funding for
export programs administered by the Foreign Agricultural Service (FAS).182
The FY 2017 Budget Summary for the Department of Agriculture reports the following program
level for the Farm Service Agency:183
2015 (Enacted) $24,772,000,000
2016 (Estimate) $43,040,000,000
2017 (Budget) $36,306,000,000
The subsidies and support provided through the Farm Service Agency programs include
programs aimed exclusively at supporting dairy producers as well as programs that do not
provide support solely for the benefit of U.S. dairy producers. In 2015, expenditures under
programs intended exclusively to support dairy production amounted to $26,000,000 The full
value of the expenditures under these programs is allocated to support dairy production. The
nature of the direct support programs has changed.
181 Department of Agriculture, The Budget for Fiscal Year 2011, pg 101 182 Ibid., pg 102 183 FY 2017 Budget Summary, U.S. Department of Agriculture, pg 110

PART I
106
For the remaining expenditures, which do not exclusively support dairy producers, the total value
of the subsidies and support provided for dairy producers is determined on the basis of dairy’s
share of the value of U.S. agricultural production, in dollar terms. In 2015, dairy represented
10.54% of total U.S. agricultural production. Therefore, of the $24,772,000,000 program
funding account of programs administered by the Farm Service Agency in 2015, we estimate that
$2,610,968,800 directly or indirectly supported U.S. dairy production.

PART I
107
A. Farm Loan and Grant Programs (Budget Code 12-0600-0-1-351.4190)184
The Farm Service Agency operates a number of grant and loan programs that benefit U.S.
farmers which include:
A.1 Farm Operating and Ownership Loans
A.2 Emergency Loans
These programs, and their budgeted program levels, are set out below.
2015 (Actual) $6,402,000,000
2016 (Estimate) $6,402,000,000
2017 (Estimate) $6,657,000,000
It is important to note that in addition to the expenditures reported above, a separate
administrative expense on account of these programs is reported as follows:
These programs cannot be measured accurately by the program level because:
• repayments can be used to create additional borrowings;
• loans outstanding are many times more than the program level for a particular year, and this continuous to benefit from below market interest.
184 FY 2017 Appendix Budget, U.S. Department of Agriculture, pg 95

PART I
108
A.1 Farm Operating and Ownership Loans (Budget Code (12-1140-0-1-351-115002 and 12-1140-0-1-351-115001)185
(a) Program Description
The Farm Service Agency provides direct and guaranteed farm ownership and farm operating
loans to beginning farmers and ranchers who cannot obtain commercial credit from a bank, Farm
Credit System Institution or other lender. The U.S. Department of Commerce dunes exports in
trade remedy cases to be uncredited worthy. These loans can be used to purchase land, livestock,
equipment, feed, seed and supplies. The loans can also be used to construct buildings or to make
farm improvements. For FY 2015, this program served an estimated 28,000 farmers, about
23,000 of whom received direct loans and 5,000 of whom received guarantees. 186 For farm
ownership loans, the 2017 budget provides $1.5 billion in direct loans and $2 billion for
guaranteed loans. The 2017 levels will provide about 12,800 people with the opportunity to
either acquire their own farm or keep an existing one. About 8,300 borrowers will receive direct
loans and 4,500 will receive guaranteed loans.187
These loans are available to beginning farmers or to established farmers who have suffered
financial setbacks from natural disasters or whose resources are too limited to maintain profitable
farming operations.
Guaranteed loans provide conventional lenders with up to a 95% guarantee of the principal loan
amount so that the commercial lender can make loans to farmers and ranchers who would not
normally qualify. The Farm Services Agency can guarantee operating and ownership loans up to
$1,399,000. This amount is adjusted annually for inflation.
Direct loans are provided by the Farm Service Agency to qualifying farmers and ranchers. The
Farm Service Agency also provides direct loan customers counseling and loan supervision
service so that they have a better chance of success in their farming operation.188 The maximum
185 FY 2017 Appendix Budget, U.S. Department of Agriculture, pg 99 186 FY 2017 Budget Summary, U.S. Department of Agriculture, pg 17 187 Ibid., pg 16-17 188 Farm Loans Programs, Farm Service Agency Online

PART I
109
amount for a direct loan is $300,000.189 The maximum loan limit for Land Contract Guarantees
is $500,000.190
Repayment terms for direct loans vary according to the type of loan made, the collateral securing
the loan and the producer’s ability to repay. Operating loans are normally to be repaid within 7
years. Ownership loans may not exceed 40 years.
Interest rates on these loans may not exceed the rate charged the lender’s average farm customer.
This would be credit worthy operations. In addition, under the Interest Assistance Program, FSA
will subsidize 4% of the interest rate on loans to qualifying borrowers. Repayment terms for
guaranteed loans are negotiated between the lender and the borrower. 191
Borrowers can choose to participate in a joint financing plan where the Farm Services Agency
provides up to 50% of the amount financed and another lender provides the balance. The Farm
Services Agency may not change less than 4% interest.192
The loans must be secured. The collateral for operating loans can include chattel and real estate.
Collateral for ownership loans consists of real estate only. FSA staff determines whether the
proposed collateral is adequate.
For most guaranteed loans, the Farm Service Agency can charge a 1.5% guarantee fee on the
guaranteed portion of the loan. This fee can be waived for: (i) interest assistance loans; (ii)
loans where more than 50% of the loan funds are used to pay off direct Farm Services Agency
debt; and (iii) loans in conjunction with a Downpayment Farm Ownership Loan program for
beginning farmers or a qualifying state “beginning farmer” program.193
189 Guaranteed Farm Loans, Farm Service Agency Online 190 2014 Farm Bill Fact Sheet, Farm Loan Information Chart, USDA, Farm Service Agency, https://www.fsa.usda.gov/Internet/FSA_File/farmlnchart_current.pdf 191 Guaranteed Loan Program, Farm Service Agency Online, pg 2 of 5 192 Ibid., pg 3 of 5 193 Beginning Farmers and Ranchers Loans, Farm Service Agency Online

PART I
110
The Farm Services Agency operates a special Downpayment Farm Ownership Loan program for
beginning farmers and ranchers. The program is also used to help retiring farmers or ranchers
transfer their land. Under this program, an applicant makes a cash downpayment of at least 5%
of the purchase price for the farm or ranch, the Farm Services Agency can finance up to 45% of
the purchase price or appraised value (whichever is less), the remainder of the purchase price
must be financed by a commercial lender or a private party (eligible commercial lenders can
benefit from a Farm Services Agency guaranteed loan). The purchase price or appraised value
(whichever is lower) may not exceed $300,000.194
Interest Rates Effective as of August 1, 2016
Program Interest Rates
Farm Operating-Direct 2.250%
Farm Operating - Microloan 2.250%
Farm Ownership- Direct 3.375%
Farm Ownership - Microloan 3.375%
Farm Ownership- Direct, Joint Financing 2.500%
Farm Ownership- Down Payment 1.500%
Emergency Loan- Amount of Actual Loss 3.250%
(b) WTO Consistency
The loans and loan guarantees provided under this program would constitute a subsidy for
purposes of the WTO Agreement on Agriculture and the Agreement on Subsidies and
Countervailing Measures on the basis that the program provides a financial contribution by
government that confers a benefit on the recipient farmer or rancher that, based on their lack of
creditworthiness, are not available to them on the market.
194 Guaranteed Loan Program, Farm Service Agency Online, pg 4 of 6

PART I
111
The loans provided under this program allow farmers and ranchers to continue production or to
expand it; thus, the loans would have distorting effects on production and trade. Consequently,
the domestic support provided through these loan and loan guarantee programs must be included
in the U.S. AMS and would not be exempt from domestic support reduction commitments.
The total value of the loans and guarantees provided under this program would not be limited to
the interest rate benefit provided, but would include the total value of the conventional loans and
guaranteed loans provided under the program. The program provides operating and ownership
loans to farmers and ranchers who do not qualify for normal market based commercial credit. In
these circumstances, the benefit provided through the program is not limited to the below market
interest rates or preferential terms available from the Farm Service Agency because obtaining
any form of credit from a commercial lender is not an option. Rather, the benefit to farmers and
ranchers under this program must be the total value of the loan or loan guarantee provided by the
Farm Service Agency.
Any repayment made by loan recipients will be revenue in the hands of the U.S. Department of
Agriculture that can be used to offset the ongoing cost of this and other programs. Although any
repayment made can be properly counted as revenue and used as an offset in determining the
budgetary authority actually needed to meet ongoing program levels, it would not be appropriate
to reduce the support calculation by the amount of repayments received during the fiscal year.
This is because the impact of U.S. domestic support on agricultural production can only be
determined by considering the actual program level expenditures.
Notwithstanding such repayments, U.S. farmers and ranchers enjoy the benefit of program level
expenditures and are able to rely on that money to fund production and to develop their
businesses. In these circumstances, it is reasonable and appropriate to consider the entire
expenditure by the Farm Service Agency on account of these loan and loan guarantee programs
as a measure of the support provided to U.S. agricultural production. It is neither reasonable nor
appropriate to discount the impact of these programs by deducting from program expenditures
any repayments made during the course of a fiscal year.

PART I
112
(c) Program Level
The FY 2017 Budget reports at the program level for farm ownership and farm operating loans
separately and distinguishes between direct and guaranteed loans.
Farm Ownership direct loan program level is reported as follows:195
2015 (Actual) $1,500,000,000
2016 (Estimate) $1,500,000,000
2017 (Estimate) $1,500,000,000
Farm Operating direct loan program level is reported as follows:196
2015 (Actual) $1,252,000,000
2016 (Estimate) $1,252,000,000
2017 (Estimate) $1,460,000,000
When reporting the Guaranteed loans, the Budget reports unsubsidized farm ownership loans,
unsubsidized farm operating loans and subsidized farm operating loans.
Guaranteed unsubsidized farm ownership loan program level is reported as follows:197
2015(Actual) $2,000,000,000
2016 (Estimate) $2,000,000,000
2017 (Estimate) $2,000,000,000
Guaranteed unsubsidized farm operating loan program level is reported as follows:198
195 FY 2017 Budget Summary, U.S. Department of Agriculture, pg 16 196 Ibid. 197 Ibid. 198 Ibid.
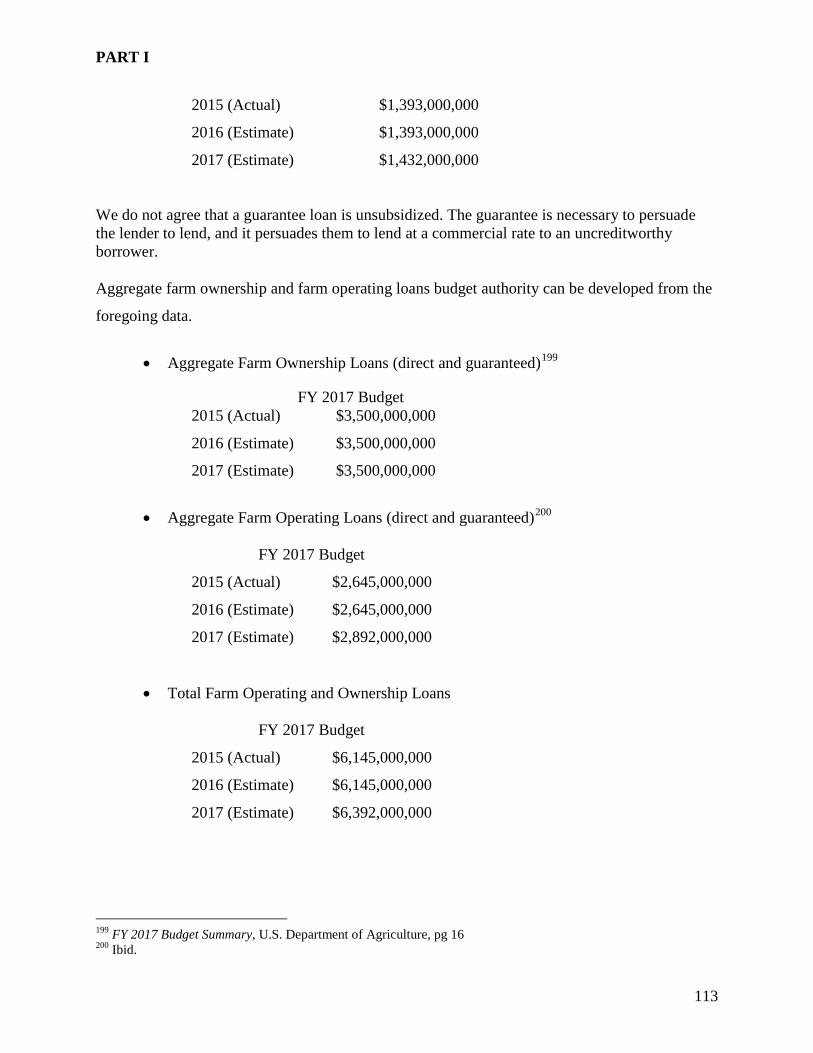
PART I
113
2015 (Actual) $1,393,000,000
2016 (Estimate) $1,393,000,000
2017 (Estimate) $1,432,000,000
We do not agree that a guarantee loan is unsubsidized. The guarantee is necessary to persuade the lender to lend, and it persuades them to lend at a commercial rate to an uncreditworthy borrower. Aggregate farm ownership and farm operating loans budget authority can be developed from the
foregoing data.
• Aggregate Farm Ownership Loans (direct and guaranteed)199
FY 2017 Budget 2015 (Actual) $3,500,000,000
2016 (Estimate) $3,500,000,000
2017 (Estimate) $3,500,000,000
• Aggregate Farm Operating Loans (direct and guaranteed)200
FY 2017 Budget
2015 (Actual) $2,645,000,000
2016 (Estimate) $2,645,000,000
2017 (Estimate) $2,892,000,000
• Total Farm Operating and Ownership Loans
FY 2017 Budget
2015 (Actual) $6,145,000,000
2016 (Estimate) $6,145,000,000
2017 (Estimate) $6,392,000,000
199 FY 2017 Budget Summary, U.S. Department of Agriculture, pg 16 200 Ibid.

PART I
114
(d) Allocation to Dairy
These programs do not provide benefits exclusively to dairy producers. Consequently, we
cannot attribute the entire value of the support provided under these programs to U.S. dairy
producers. Based on our methodology, previously discussed, the value of the subsidies and
support that benefits dairy production under these programs is allocated on the basis of dairy’s
share of the total value of U.S. agricultural production. In 2015, dairy production accounted for
10.54% of total U.S. agricultural production.
The program level funding for total farm ownership and operating loans provided under this
program in 2015 was $6,145,000,000. Therefore, the amount allocated to dairy production under
these programs is $647,683,000.
PART I
115
A.2 Emergency Disaster Loans (Budget Code 12-1140-0-1-351-115003) 201
(a) Program Description
The Farm Services Agency provides emergency loans, as direct loans, to assist farmers who
suffered losses in areas designated by the President, the Secretary of Agriculture or the
Administrator of the Farm Services Agency as disaster areas. In recent years, disaster relief
designations in the U.S. have been very extensive.
For production loss loans, applicants must demonstrate a 30% loss on a single farm or ranch.
These applicants may receive loans up to a maximum of 80% of total production losses.
Emergency loans are provided to restore or replace essential property or to pay part or all of the
production costs associated with the disaster year. The emergency loan limit is up to 80% of the
actual loss, up to a maximum of $500,000.202
(b) WTO Consistency
The emergency loans are also subsidies, but based on current WTO interpretations, would not
have to be included in reduction commitments. Pursuant to Agreement on Agriculture, Annex
2(8), these loans could be considered payments for relief from natural disasters.
201 FY 2017 Appendix Budget, U.S. Department of Agriculture, pg 99 202 Emergency Farm Loans, USDA, Farm Service Agency Online

PART I
116
(c) Program Level
The FY 2017 Budget reports funding authority for emergency disaster loans as follows:203
2015 (Actual) $13,000,000
2016 (Estimate) $75,000,000
2017 (Estimate) $47,000,000
(d) Allocation to Dairy
This program does not provide benefits exclusively to dairy producers. Consequently, we cannot
attribute the entire value of the support provided under these programs to U.S. dairy producers.
Therefore, the value of the subsidies and support that benefits dairy production under these
programs is attributed on the basis of dairy’s share of the total value of U.S. agricultural
production. In 2015, all dairy production accounted for 10.54% of total U.S. agricultural
production.
Total funding provided under this program in 2015 amounted to $13,000,000. Therefore, the
amount allocated to dairy production under this program is $1,370,200.
It should be vested that the payment by government of subsidies on the first $4 cwt as under the
the MPP is, in effect disaster insurance
203 FY 2017 Appendix Budget, U.S. Department of Agriculture, , pg 99

PART I
117
A.3 State Mediation Grants (Budget Code 12-0170-0-1-351)204
(a) Program Description
This program is used to benefit family farmers, including low-income and socially disadvantaged
farmers, to resolve credit and other issues and remain on the farm.
(b) WTO Consistency
The support provided by this program would provide important support to farmers. Since the
objective of the program is to assist farmers in ready accommodations with their creditors keep
farmers on the farm and in production, the subsidy arguably has trade or production distorting
effects. Consequently, the support provided through this program should be included in the U.S.
AMS and subject to domestic support reduction commitments.
(c) Program Level
The FY 2017 Budget reports total authority for the State Mediation Grants program as
follows:205
2015 (Actual) $3,000,000
2016 (Estimate) $3,000,000
2017 (Estimate) $3,000,000
(d) Allocation to Dairy
This program does not provide benefits exclusively to dairy producers. Consequently, we cannot
attribute the entire value of the support provided under these programs to U.S. dairy producers.
Therefore, the value of the subsidies and support that benefits dairy production under these 204 FY 2017 Appendix Budget, U.S. Department of Agriculture, pg 96 205 Ibid.

PART I
118
programs is attributed on the basis of dairy’s share of the total value of U.S. agricultural
production. In 2015, dairy production accounted for 10.54% of total U.S. agricultural
production.
Total funding provided under this program in 2015 amounted to $3,000,000. Therefore, the
amount allocated to dairy production under this program is $316,200.

PART I
119
B. Commodity Programs (Budget Code 12-4336-0-3-999.10.00)206
The Farm Services Agency provides support to commodities through the Commodity Credit
Corporation (CCC). These programs include non-recourse marketing assistance loans, direct
payments, countercyclical payments, production flexibility contracts, when CCC was also
responsible for direct payments and counter cyclical payments these commodities programs
constituted the lion’s share of domestic support included in the U.S. Aggregate Measure of
Support (AMS) and subject to U.S. Reduction Commitments under the WTO.
The Commodity Credit Corporation (CCC) provides funding for commodity programs
administered by FSA and many Farm Bill programs such as the conservation programs
administered by FSA and the Natural Resources Conservation Service (NRCS) and export
programs administered by Foreign Agricultural Service (FAS). CCC borrows funds needed to
finance these programs from the U.S. Treasury and repays the borrowings, with interest, from
receipts and from appropriations provided by Congress.
The commodity programs are critical components of the farm safety net, serving to expand
domestic market opportunities and provide risk management and financial tools to farmers and
ranchers. Net CCC expenditures for commodity payments in 2016 are significantly above the
2015 level, primarily as a result of timing differences associated with the 2014 Farm Bill
commodity programs. Prior to enactment of the 2014 Farm Bill, the 2015 commodity program
payments would have been primarily composed of 2014-crop direct payments and 2013-crop
counter-cyclical payments from the Direct and Counter-Cyclical Program (DCP), and Average
Crop Revenue Election (ACRE) payments. However, the 2014 Farm Bill terminated the DCP
and ACRE programs effective with the 2014 crop and authorized in their place the Agriculture
Risk Coverage (ARC) and Price Loss Coverage (PLC) programs. Under the terms of the 2014
Farm Bill, the 2014 crop year ARC and PLC payments could not be made until after October 1,
2015 (i.e. fiscal year 2016). As a result, the 2016 commodity program payments reflect an
increase of about $5.5 billion above the 2015 level due to this timing shift. The final Counter-
206 FY 2017 Appendix Budget, U.S. Department of Agriculture, pg 102

PART I
120
Cyclical and ACRE payments available under the 2008 Farm Bill are reflected in the 2015
commodity program payments.207
The Commodity Credit Corporation (CCC) was created to stabilize, support, and protect farm
income and prices; help maintain balanced and adequate supplies of agricultural commodities,
their products, foods, feeds, and fibers; and help in their orderly distribution. The Corporation's
capital stock of $100 million is held by the U.S. Treasury. Under present law, up to $30 billion
may be borrowed from the U.S. Treasury to finance operations. Current, indefinite appropriation
authority is requested to cover all net realized losses. Appropriations to the Corporation for net
realized losses have no effect on budget authority, as they are used to repay debt directly with the
Treasury. The Agricultural Act of 2014, the 2014 Farm Bill, P.L. 113–79, was signed by the
President on February 7, 2014. The Act repeals certain programs, continues some programs with
modifications, and authorizes several new programs. Most of these programs are authorized and
funded through 2018.208
Changes over the last decade in commodity assistance, disaster relief, and conservation programs
have dramatically changed CCC outlays. CCC net outlays have declined from a record high of
$32.3 billion in 2000 to $11.4 billion in 2008, reflecting higher prices for most commodities
resulting from increased demand for bioenergy production and strong export demand. Outlays in
2009 which included the impact of 2008 Farm Bill provisions were $11.4 billion. They reflected
reduced disaster payments offset by greater outlays for dairy support programs which are
affected by lower market prices and initiatives to enhance dairy price supports. Estimated outlays
for 2010 rose to $11.9 billion partly as a result of the newly implemented Biomass Crop
Assistance Program (BCAP).
207 FY 2017 Budget Summary, U.S. Department of Agriculture, pgs 18, 19 208 FY 2017 Appendix Budget, U.S. Department of Agriculture, pg 103

PART I
121
The FY 2017 Budget reports the following total budgetary obligations for the CCC, including
expenditures on account of export subsidy and food aid programs administered by CCC:209
2015 (Actual) $9,571,000,000
2016 (Estimate) $27,737,000,000
2017 (Estimate) $20,657,000,000
The programs supported by the Commodity Credit Corporation do not provide support
exclusively to dairy producers. 210
The Budget documents offer the following description of CCC dairy activities:
The 2014 Farm Bill authorized the Margin Protection Program for Dairy (MPP-Dairy)
replacing provisions from the Milk Income Loss Contract (MILC) Program. MPP-Dairy
offers protection to dairy producers when the difference between the all milk price, as
reported by the National Agricultural Statistics Service, and the average feed cost – “the
margin” – falls below a certain dollar amount selected by the producer. Participating
dairy operations establish their production history upon initial registration, and all
producers in the participating dairy operation must provide adequate proof of the dairy
operation’s quantity of milk marketed commercially. For existing dairy operations, the
production history was established using the highest annual milk production marketed
during the full calendar years of 2011, 2012 or 2013. Catastrophic Coverage (CAT) of $4
margin coverage level at 90 percent of the established production history requires no
premium payment, but the dairy operation must pay the $100 administrative fee. For
increased protection, dairy operations may annually select a percentage of coverage from
25 to 90 percent of the established production history in five percent increments and a
coverage level threshold from $4.50 to $8 in 50 cent increments, for an additional
premium payment. Dairy operations may only select one coverage level percentage and
coverage level threshold for the applicable calendar year.211
209 FY 2017 Appendix Budget, U.S. Department of Agriculture, pg 102 210 Ibid., pg 112 211 FY 2017 Budget Summary, U.S. Department of Agriculture, p.21

PART I
122
In addition, dairy farmers clearly benefit from various aspects of the benefits to feedgrains and
oilseeds and livestock. For purposes of this study, unless specific program levels or expenditures
can be identified, the amount of support provided to dairy producers will be determined on the
basis of dairy’s share of total U.S. agricultural production. In 2015, dairy production represented
10.54% of the total value of all U.S. agricultural production. Therefore, of the $9,571,000,000,
CCC budget $1,008,783,400 can be attributed to dairy production.
The benefits in 2016 were $27,737,000,000 and in 2017 were $20,657,000,000. There current
budgets and outlays are substantially higher them they were in 2015. The reduced funding in
2015 was due to the risk management program, PLC and ARC only coming in to force in 2016.
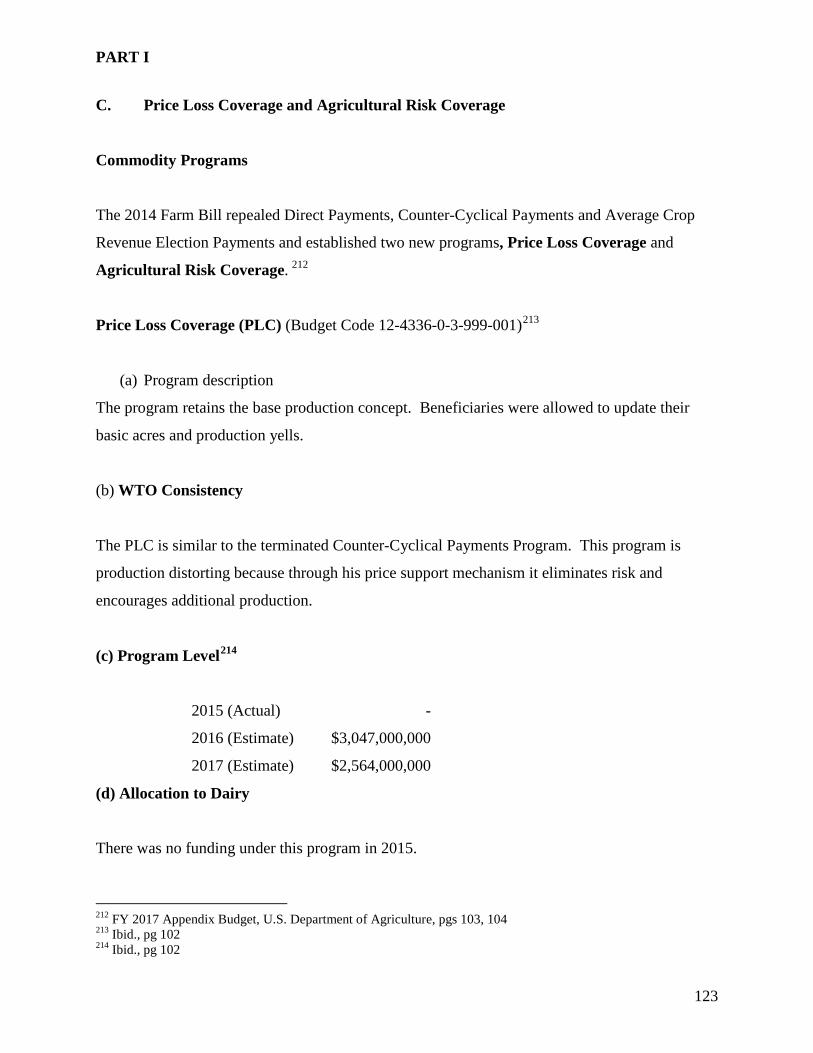
PART I
123
C. Price Loss Coverage and Agricultural Risk Coverage
Commodity Programs
The 2014 Farm Bill repealed Direct Payments, Counter-Cyclical Payments and Average Crop
Revenue Election Payments and established two new programs, Price Loss Coverage and
Agricultural Risk Coverage. 212
Price Loss Coverage (PLC) (Budget Code 12-4336-0-3-999-001)213
(a) Program description
The program retains the base production concept. Beneficiaries were allowed to update their
basic acres and production yells.
(b) WTO Consistency
The PLC is similar to the terminated Counter-Cyclical Payments Program. This program is
production distorting because through his price support mechanism it eliminates risk and
encourages additional production.
(c) Program Level214
2015 (Actual) -
2016 (Estimate) $3,047,000,000
2017 (Estimate) $2,564,000,000
(d) Allocation to Dairy
There was no funding under this program in 2015.
212 FY 2017 Appendix Budget, U.S. Department of Agriculture, pgs 103, 104 213 Ibid., pg 102 214 Ibid., pg 102

PART I
124
Agricultural Risk Coverage (ARC) (Budget Code 12-4336-0-3-999-0002)215
(a) Program Description
The ARC program is similar to the ACRE (Average Crop Revenue Election) Program.
There are two types: County ARC and Individual ARC.216
County ARC: Payments are issued when the actual county crop revenue of a covered
commodity is less than the ARC county guarantee for the covered commodity and are
based on county data, not farm data. The ARC county guarantee equals 86% of the
previous 5-year average national farm price, excluding the years with the highest and
lowest price (the ARC guarantee price), times the 5-year average county yield, excluding
the years with the highest and lowest yield (the ARC county guarantee yield). Both the
guarantee and actual revenue are computed using base acres, not planted acres. The
payment is equal to 85% of the base acres of the covered commodity times the difference
between the county guarantee and the actual county crop revenue for the covered
commodity. Payments may not exceed 10% of the benchmark county revenue (the ARC
guarantee price times the ARC county guarantee yield).
Individual ARC: Payments are issued when the actual individual crop revenues, summed
across all covered commodities on the farm, are less than ARC individual guarantees
summed across those covered commodities on the farm. The farm for individual ARC
purposes is the sum of the producer's interest in all ARC farms in the State. The farm's
ARC individual guarantee equals 86% of the farm's individual benchmark guarantee,
which is defined as the ARC guarantee price times the 5-year average individual yield,
excluding the years with the highest and lowest yields, and summing across all crops on
the farm. The actual revenue is computed in a similar fashion, with both the guarantee
and actual revenue computed using planted acreage on the farm. The individual ARC
payment equals: a) 65% of the sum of the base acres of all covered commodities on the
215 FY 2017 Appendix Budget, U.S. Department of Agriculture, pg 102 216 Ibid., pg 104

PART I
125
farm, times b) the difference between the individual guarantee revenue and the actual
individual crop revenue across all covered commodities planted on the farm. Payments
may not exceed 10% of the individual benchmark revenue.
(b) WTO Consistency
ARC falls under the same analysis as for direct and countercyclical payments.
(c) Program Level217
2015 (Actual) -
2016 (Estimate) $13,122,000,000
2017 (Estimate) $6,279,000,000
(d) Allocation to Dairy
There was no funding under this program in 2015.
217 FY 2017 Appendix Budget, U.S. Department of Agriculture, pg 102

PART I
126
D. Non-Recourse Marketing Assistance Loans and Loan Deficiency Payments218
(a) Program Description
The Agricultural Act of 2014 (2014 Farm Bill) authorizes nonrecourse marketing assistance
loans (MALs) and loan deficiency payments (LDPs) for the 2014 through 2018 crop years for
wheat, corn, grain sorghum, barley, oats, upland cotton, extra-long staple cotton, long grain rice,
medium grain rice, soybeans, other oilseeds (including sunflower seed, rapeseed, canola,
safflower, flaxseed, mustard seed, crambe and sesame seed), dry peas, lentils, small chickpeas,
large chickpeas, graded and non-graded wool, mohair, unshorn pelts, honey and peanuts.219
The non-recourse marketing assistance loans provided to covered commodities are to be made at
the following rates:
2014 – 2018220 Crop Year Wheat $2.94/bu Corn $1.95/bu Grain Sorghum $1.95/bu Barley $1.95/bu Oats $1.39/bu Upland Cotton $0.52/lb EL Staple Cotton $0.7977/lb Rice $6.50/cwt Soybeans $5.00/bu Other Oilseeds $10.09/lb Graded Wool $1.15/lb Non-Graded Wool $0.40/lb Mohair $4.20/lb Honey $0.69/lb Dry Peas $5.40/cwt Lentils $11.28/cwt Small Chickpeas $7.43/cwt Peanuts $355/ton
218 Department of Agriculture, The Budget for Fiscal Year 2011, pg 113 219 United States Department of Agriculture, Farm Service Agency, Fact Sheet, February 2016 220 Ibid.

PART I
127
Farmers may repay non-recourse farm marketing assistance loans at a rate that is the lesser of,
- the loan rate established under Section 1202 (the rates set out above), plus
interest,
or
- a rate that the Secretary determines will: (a) minimize potential loan forfeitures;
(b) minimize accumulation of stocks by the federal government; (c) minimize the
cost incurred by the federal government in storing the commodity; (d) allow the
commodity produced in the U.S. to be marketed freely and competitively, both
domestically and internationally; and (e) minimize discrepancies in marketing
loan benefits across State boundaries and across county boundaries.221 [emphasis
added]
For upland cotton and rice, producers may repay marketing assistance loans at a rate that is the
lesser of the loan rate established for the commodity under Section 1202 or the prevailing world
market price for the commodity (adjusted to USA quality and location), as determined by the
Secretary.222 For extra long staple cotton, repayment shall be at the loan rate established under
Section 1202 (the rate set out above) plus interest.223
Producers can repay these loans in one of three ways:
(i) by repaying the loan at the loan rate plus interest (the U.S. Treasury rate plus
1%),
(ii) by repaying at a lower rate, if applicable, or
(iii) by forfeiting the crop pledged as collateral to the CCC (in which case, the loan
becomes the payment price for the crop).224
221 Food, Conservation and Energy Act of 2008., Section 1204(a) 222 Food, Conservation and Energy Act of 2008., Section 1204(b) 223 Food, Conservation and Energy Act of 2008, Section 1204(c) 224 This is an attractive option when prices are below the loan rate – providing income support as opposed to price support.

PART I
128
For extra-long staple cotton, when market prices are below the loan rate, farmers are allowed to
repay their loans at a repayment rate that is lower than the loan rate.
Producers can choose to take loan deficiency payments in lieu of marketing assistance loans.
The Farm Act requires that loan deficiency payments be made available to producers on a farm
that is eligible to obtain a marketing assistance loan under Section 1201 if the producer agrees to
forego obtaining the loan in exchange for the loan deficiency payment.225 The payment rate for
loan deficiency payments is the amount by which the loan rate established under Section 1202
exceeds the rate at which a marketing assistance loan for the loan commodity may be repaid
under Section 1204.226 The amount of loan deficiency payment is determined by multiplying the
payment rate for the commodity by the quantity of the commodity produced by the producer less
any quantity for which the producer obtained a marketing assistance loan.227
(b) WTO Consistency
Although loans are ostensibly made to provide farmers with operating funds prior to the harvest
and sale of their crop, these loans are clearly provided in a manner that confers a subsidy on
producers in the form of a payment and in the form of price (or income) support. By allowing
producers to forfeit crop rather than repay the loan, the loan rates become the effective minimum
market price for the covered commodity for participating farmers. Thus, this program
establishes income support for the covered commodities and provides support to ensure that the
actual returns to the farmer does not fall below the floor established by the loan rate.
“Marketing Loan Program (MLP) The traditional non-recourse MLP was extended under the 2014 farm bill. Under the MLP, USDA supports prices of eligible crops at statutory loan rates via a nine-month nonrecourse loan program. To avoid selling at the harvest-time low price, a producer may elect to place his/her crop under a USDA marketing loan where the crop is valued at the statutory loan rate. If the market price remains below the loan rate after nine months, the producer may forfeit the crop under loan to USDA. Alternatively, the producer may opt
225 Agricultural Act of 2014, Section 1205(a) 226 Food, Conservation and Energy Act of 2008, Section 1205(b) 227 Food, Conservation and Energy Act of 2008

PART I
129
for alternate program benefits that are available whenever the posted county price, or a USDA-announced average world price (AWP) for rice or upland cotton, falls below the respective USDA loan rates. All MLP benefits are based on actual production. As a result, MLP outlays are fully coupled to market prices and planted acres. Like the PLC program, MLP does not require any producer premium or fee to participate, nor does it require any loss to receive a payment. However, it does require actual production, since payments are based directly on output. MLP operates like a price-deficiency payment. It uses statutorily fixed, commodity-specific loan rates to establish a floor price for all production of all qualifying program crops. When market prices fall below the loan rate, producers are eligible for amber box benefits, including loan deficiency payments and marketing loan gains (which pay the difference between the marketing loan rate and the local posted county price or a USDA-announced average world price in the case of rice and cotton).228
The USDA Budget for 2017 describes the marketing loan assistance programs as follows,
“One method of providing support is loans to and purchases from producers. With limited exceptions, loans made on commodities are nonrecourse. The commodities serve as collateral for the loan and on maturity the producer may deliver or forfeit such collateral to satisfy the loan obligation without further payment.”229
Consequently, USDA recognizes that the loan program provides price support. Farmers can
choose to take loan program benefits directly, as loan deficiency payments, when market prices
are lower than commodity loan rates. In this respect, the loan rate established for each
commodity becomes the floor price for that commodity.
The loan program also has trade distorting effects. The Canadian Wheat Board (CWB) has
reviewed the U.S. domestic subsidy programs and their effect on planting decisions. CWB
“In terms of acreage distortion amongst commodities, the marketing loan program is the most important given its direct ties to current acreage and yields. Many have argued that the favourable loan rate for soybeans in the 1996 Farm Bill has been largely responsible for the 10 million-acre increase (15 percent) in soybean area since 1996. Over the same time, wheat area in the United States has fallen by 15 million acres (20 percent), while corn acreage has remained relatively flat.”230
228 “2014 Farm Bill Provisions and WTO Compliance”, CRS Report R43817, April 22, 2015 229 USDA, The Budget for Fiscal Year 2011, Commodity Credit Corporation, pg 110 230 CWB, Farm Security and Rural Investment Act of 2002, May 23, 2002, at pg 3 of 7

PART I
130
The higher loan rates for most commodities set out in the Farm Bill raise the effective market
returns for farmers, thereby insulating them from market price signals. Changes in loan rate
spreads between commodities have an impact on planting decisions. Thus, readjustment of the
soybean rate is expected to result in increased corn and wheat acreage in the United States.231
The fact that the non-recourse marketing assistance program has these trade-distorting effects is
significant. The program does not simply provide market rate loans to producers and the
program does not simply provide income support by setting the effective price floor for the
covered commodities. The difference in the loan rates offered for the various commodities
creates an incentive to produce one commodity over another. As noted by the CWB (Canadian
Wheat Board), more favourable loan rates, from the perspective of producers, resulted in a shift
in production from wheat and corn to soybeans and re-adjustments to those rates could result in a
shift back.
By insulating producers from market signals, the non-recourse marketing loan program
encourages the over-production of covered commodities and stimulates production of some
agricultural products over others. Planting decisions by producers are driven by the available
government support and not by market signals. As a result, the non-recourse marketing
assistance program is clearly trade distorting because, in the absence of these loans, or if market
driven loans were the only financing available, producers would make different planting
decisions, or in some cases, decide to abandon farming.
Payment Limits under the 2014 Farm Bill
Per-operator program payment limits represent a potential tool for limiting or reducing total
amber box outlays and concomitantly mitigating potential distortions. The 2014 farm bill set a
$125,000 per-person cap on the total payments received for all covered commodities under the
PLC, ARC, and MLP programs, with the exception of peanuts, which has its own separate
$125,000-per-person limit. This represents a tightening of the per-person limit from the 2008
231 CWB, Farm Security and Rural Investment Act of 2002, May 23, 2002, at pg 3 of 7

PART I
131
farm bill, where MLP benefits were unlimited. However, the payment limit is doubled by
inclusion of the operator’s spouse as co-operator.
There is no payment limit for the SCO, STAX, and crop insurance programs. NAP payments
have an annual limit of $125,000 per person. The three livestock-related disaster assistance
programs—LIP, ELAP, and LFP—have a combined limit of $125,000 per person. TAP has its
own separate payment limit of $125,000 per person.
To qualify for any program benefits, a recipient’s total adjusted gross income (AGI) cannot
exceed $900,000 (using a three-year average). The effectiveness of program limits remains in
dispute as some have argued that they may be avoided by subdividing a farm operation among
family members.232
USDA has noted that,
“Marketing loans provide loan deficiency payments and marketing loan gains to farmers of loan commodities when market prices are low. Marketing loans also reduce revenue risk associated with price variability.”233
Consequently, Non-Recourse Marketing Assistance Loans provide a subsidy for purposes of the
Agreement on Agriculture and the Agreement on Subsidies and Countervailing Measures.
The MLP for upland cotton was found by the WTO cotton-case panel to be market-distorting whenever the market price fell below the fixed loan rate. The panel recommended setting the loan rates by formula to capture current market conditions. As a result, the 2014 farm bill included an adjustment to the loan rate for upland cotton—it was lowered from $0.52/lb to a formula-based marketing loan rate that moves within a range of $0.52/lb to $0.45/lb. All other program commodities retain their previous statutorily fixed loan rates.234 “The enacted 2014 farm bill (P.L. 113-79) could result in potential compliance issues for U.S. farm policy with the rules and spending limits for domestic support programs that the United States agreed to as part of the World Trade Organization’s (WTO's) Uruguay Round Agreement on Agriculture. In general, the act’s new farm safety net shifts support away from classification under the WTO’s green/amber boxes and toward the blue/amber
232 CRS, 2014 Farm Bill and WTO Compliance –page 22 233 The 2002 Farm Act: Provisions and Implications for Commodity Markets, USDA Agriculture Information Bulletin Number 778, November 2002, pg 5 234 “2014 Farm Bill Provisions and WTO Compliance”, CRS Report R43817, April 22, 2015

PART I
132
boxes, indicating a potentially more market-distorting U.S. farm policy regime. The most notable safety net change is the elimination of the $5-billion-per-year direct payment program, which was decoupled from producer planting decisions and was notified as a minimally trade-distorting green box outlay. Direct payments were replaced by programs that are partially coupled (PLC and ARC) or fully coupled (Supplemental Coverage Option and Stacked Income Protection Plan), meaning that they could potentially have a significant impact on producer planting decisions, depending on market conditions. Because the United States plays such a prominent role in most international markets for agricultural products, any distortion resulting from U.S. policy would be both visible and vulnerable to challenge under WTO rules.”235
The non-recourse marketing assistance loans provide price support and are trade-distorting. As
the loans effectively establish a floor price for the covered commodities (including feedgrains
and oilseeds which may be used by dairy producers), they provide income support to the level of
that loan rate. As the relative loan rates can provide an incentive to produce one commodity over
another, they are also production and trade-distorting. As these programs have production and
price supporting and trade-distorting effects, they may not be excluded from the U.S. AMS under
Article 6 and Annex 2 of the Agreement on Agriculture.
(c) Program Level
Total obligations for this program are estimated at:
FY 2015 $5,894,782,000
FY 2016 $6,757,069,000
FY 2017 $8,024,319,000 236
The benefits tend to be understated, as the 9 month loan cycle results in repayment within the
crop for fiscal year. Program levels are, therefore, understated and misleading.
235 CRS, Farm Safety Net: Background and Issues, Aug 2015, pg 20 236 10.051 Commodity Loans and Loan Deficiency Payments, The Catalog of Federal Domestic Assistance, pg 3 of 4

PART I
133
(d) Allocation to Dairy
This program does not provide benefits exclusively to dairy producers. Consequently, we cannot
attribute the entire value of the support provided under these programs to U.S. dairy producers.
Therefore, the value of the subsidies and support that benefits dairy production under these
programs is attributed on the basis of dairy’s share of the total value of U.S. agricultural
production. In 2015, all dairy production accounted for 10.54% of total U.S. agricultural
production.
Total obligations under this program in 2015 were estimated at $5,894,782,000. Therefore, the
amount allocated to dairy production under this program is $621,310,023.

PART I
134
E. Price Support Marketing Assistance Loans and Related Stabilization Programs237
(a) Program Description
The Corporation conducts programs to support farm income and prices and stabilize the market
for agricultural commodities. Price support is provided to producers of agricultural commodities
through loans, purchases, payments, and other means. This is done mainly under the Commodity
Credit Corporation Charter Act, as amended, the Agricultural Act of 1949 (1949 Act), as
amended, the Farm Security and Rural Investment Act of 2002 (2002 Farm Bill), and the Food,
Conservation and Energy Act of 2008 (2008 Farm Bill) and the Agricultural Act of 2014 (2014
Farm Bill). Price support is mandatory for sugar and dairy products. Marketing assistance loans
are mandatory for wheat, feed grains, oilseeds, upland cotton, peanuts, rice, and pulse crops.
Loans are also required to be made for sugar, honey, wool, mohair, and extra long staple
cotton.238
(b) WTO Consistency
These are price support programs which are by definition “yellow” box and subject to AMS
reduction.
(c) Program Level
FY 2015 (Enacted) $7,662,000,000
FY 2016 (Estimate) $7,962,000,000239
237 Department of Agriculture, The Budget for Fiscal Year 2017, pg 103 238 Ibid. 239 2016 Explanatory Notes, FSA, pg 24-111

PART I
135
(d) Allocation to Dairy
Total obligations under this program in 2015 were $7,662,000,000. Therefore, the amount
allocated to dairy production under this program is $807,574,800.

PART I
136
F. Disaster Payments
(a) Program Description
The following four disaster programs were authorized by the 2008 Farm Bill under the USDA
Supplemental Disaster Assistance program. These programs were re-authorized under CCC and
extended indefinitely (beyond the horizon of the 2014 Farm Bill). Producers are no longer
required to purchase crop insurance or NAP (Noninsured Crop Disaster Assistance Program)
coverage to be eligible for these programs (the risk management purchase requirement) as
mandated by the 2008 Farm Bill.
Livestock Forage Disaster Program (LFP).—LFP provides compensation to eligible livestock
producers that have suffered grazing losses due to drought or fire on land that is native or
improved pastureland with permanent vegetative cover or that is planted specifically for grazing.
LFP payments for drought are equal to 60% of the monthly feed cost for up to 5 months,
depending upon the severity of the drought. LFP payments for fire on federally managed
rangeland are equal to 50% of the monthly feed cost for the number of days the producer is
prohibited from grazing the managed rangeland, not to exceed 180 calendar days.
Livestock Indemnity Program (LIP).—LIP provides benefits to livestock producers for livestock
deaths in excess of normal mortality caused by adverse weather or by attacks by animals
reintroduced into the wild by the Federal Government. LIP payments are equal to 75% of the
average fair market value of the livestock.
Emergency Assistance for Livestock, Honey Bees, and Farm-Raised Fish (ELAP).—ELAP
provides emergency assistance to eligible producers of livestock, honeybees and farm-raised fish
for losses due to disease (including cattle tick fever), adverse weather, or other conditions, such
as blizzards and wildfires, not covered by LFP and LIP. Total payments are capped at $20
million in a fiscal year.

PART I
137
Tree Assistance Program (TAP).—TAP provides financial assistance to qualifying orchardists
and nursery tree growers to replant or rehabilitate eligible trees, bushes, and vines damaged by
natural disasters.240
(b) WTO Consistency
Bona fide disaster relief programs are not subject to AMS reduction if they meet the criteria set
out in Annex 2(8) of the agreement on agriculture.
(c) Program Level
2015 (Enacted) $2,626,000,000
2016 (Estimate) $636,000,000
2017 (Budget) $482,000,000241
(d) Allocation to Dairy
Total obligations under this program in 2015 were $2,626,000,000. Therefore, the amount
allocated to dairy production under this program in 2015 is $276,780,400
240 FY 2017 Appendix Budget, U.S. Department of Agriculture, pg 105 241 Ibid., pg 23

PART I
138
G. Dairy Margin Protection Program (MPP)242
(a) Program Description
The Milk Income Loss Contract (MILC) program was eliminated by the current (2014) Farm
Bill. As of September 10, 2014, approximately $212 million was disbursed for FY 2013
payments.243 The Dairy Margin Protection Program replaced the Milk Income Loss Contract
program will be in effect from September 1, 2014, through December 31, 2018. The margin
protection program offers dairy producers: (1) catastrophic coverage, at no cost to the producer,
other than an annual $100 administrative fee; and (2) various levels of buy-up coverage.
Catastrophic coverage provides payments to participating producers when the national dairy
production margin is less than $4.00 per hundredweight (cwt). The national dairy production
margin is the difference between the all-milk price and average feed costs. Producers may
purchase buy-up coverage that provides payments when margins are between $4.00 and $8.00
per cwt. To participate in buy-up coverage, a producer must pay a premium that varies with the
level of protection the producer elects. In addition, the 2014 Farm Bill creates the Dairy Product
Donation Program. This program is triggered in times of low operating margins for dairy
producers, and requires USDA to purchase dairy products for donation to food banks and other
feeding programs.244
(b) WTO Consistency
The repealed dairy programs are replaced with a new insurance-like margin deficiency payment
program – the Dairy Margin Protection Program (DMPP) – that makes payments to participating
dairy producers when the national milk margin (calculated as the average farm price of milk
minus a formula-based average feed ration) falls below $4.00 per hundredweight (cwt), with
coverage at higher margin levels up to $8.00/cwt available for subsidized purchase.245 Under this
DMPP program design, payments are coupled to current market prices and recent historical
242 Department of Agriculture, The Budget for Fiscal Year 2010, pg 115 243 2016 Explanatory Notes Farm Service Agency, pg 24-110 244 FY 2017 Appendix Budget, U.S. Department of Agriculture, pg 105 245 For program details, see CRS Report R43465, Dairy Provisions in the 2014 Farm Bill (P.L. 113-79)

PART I
139
farm-level production (i.e., the maximum annual output during 2011-2013), with no payment
limit or cap on potential outlays at either the farm or national level.
Some economists have argued that the proposed margin program fails to follow sound insurance
principles: (1) premiums do not reflect the anticipated risk environment in milk and feed
markets; and (2) the proposed margin insurance program does not use a rating method to update
premiums – instead, premiums are fixed for the life of the farm bill.246 Another factor in
determining WTO compliance and the degree of potential market distortion is the share of the
premium paid by the federal government.247 The lower the statutorily fixed premiums are
relative to the expected indemnity (i.e., the less actuarially sound) or the higher the share of the
premium paid by the federal government, the greater will be the incentive to increase milk
production transmitted to producers by the program.
According to one economic analysis, if milk margins fall to levels that activate indemnity
payments, then a weakened feedback process between producers and market price signals could
(1) prevent normal market adjustment to milk production, prices, and margins (in other words,
producers will not get the necessary market signal to cut back on production) and (2) result in
persistent oversupply, lower margins, lower farm incomes, and larger federal expenditures than
would have occurred under the previous suite of dairy price and income support programs.248
The same study found that the program design—the provision that producers may purchase
coverage on as much as 90% of their recent historical maximum output; and the $8.00/cwt
maximum coverage option, which represents 93% of the national average milk margin during the
15-year period preceding DMPP implementation—could result in annual outlays of as much as
$5 billion during low-margin periods, as experienced during 2009 and 2012
246 John Newton and Cam Thraen, “The Dairy Safety Net Debate of 2013 Part I: Questions and Answers,” farmdocdaily.com, Department of Agricultural and Consumer Economics, University of Illinois at Urbana-Champaign, December 17, 2013 247 The fixed nature of the DMPP premium implies that the federal subsidy share is both indirect and varies with the underlying risk conditions. 248 C. F. Nicholson and M. W. Stephenson, “Dynamic Market Impacts of the Dairy Margin Protection Program of the Agricultural Act of 2014,” Program on Dairy Markets and Policy Working Paper Series, Working Paper No. WP14-03, May 2014

PART I
140
(c) Program Level
The total net outlays for this program are estimated at
FY 2015 $25,000,000 249
FY 2016 $104,000,000 250
FY 2017 $180,000,000 251
(d) Allocation to Dairy
The Dairy Margin Production Program is intended to support dairy production. Therefore, 100%
of the program funding, or $25,000,000 for 2015, should be allocated to dairy production.
However, it has been estimated by proponents of this program over the period 2009-2014, it
would have been $1 billion more generous than MILC. Further it has been estimated that in low
margin years the benefits could be $5 billion per year – and all of it would be allocated to dairy.
249 FY 2015 Budget Summary, U.S. Department of Agriculture, pg 20 250 FY 2016 Budget Summary, U.S. Department of Agriculture, pg 22 251 FY 2017 Budget Summary, U.S. Department of Agriculture, pg 19

PART I
141
H. Non-insured Assistance Program (NAP) (Budget Code 12-4336-0-3-999.00.23)252
(a) Program Description
The Non-insured Crop Disaster Assistance Program (NAP), reauthorized by the 2014 Farm Bill
and administered by the U.S. Department of Agriculture (USDA) Farm Service Agency (FSA),
provides financial assistance to producers of non-insurable crops to protect against natural
disasters that result in lower yields or crop losses, or prevents crop planting.253
Eligible crops include all non-insurable crops and agricultural commodities that are not eligible
for catastrophic risk protection insurance.
NAP is available for:
Commercial crops or agricultural commodities (not livestock) - produced for food or fiber – for
which crop insurance coverage is not available. This includes: floricultural, high tunnel and field
grown fruits and vegetables, seed crops, forage crops, honey, maple sap, mushrooms, ornamental
nursery, Christmas trees, aquaculture, and turf grass sod.254
To be eligible, producers must pay the required service fee 30 days prior to the coverage period.
The service fee is the lesser of $250 per crop or $750 per producer per administrative county, not
to exceed a total of $1,875 for a producer with farming interests in multiple counties. 255
The natural disaster must occur before or during harvest and must directly affect the eligible
crop.
252 Non-insured Crop Disaster Assistance Program, USDA Fact Sheet, March 2016 253 USDA, FSA Fact Sheet, Non-insured Crop Disaster Assistance Program, March 2016, pg 1 254 https://www.fsa.usda.gov/Internet/FSA_File/nap.pdf 255 Non-insured Crop Disaster Assistance Program, USDA Fact Sheet, March 2016

PART I
142
(b) WTO Consistency
The 2014 farm bill added an option for expanded coverage up to 65% under the Non-insured
Crop Disaster Assistance Program (NAP). NAP payments are notified as green box since they
involve crop losses of at least 50% and are reimbursed at just 55% of the market price. The
additional coverage option will not change NAP’s green box status. NAP payments also have an
annual payment limit of $125,000 per person. The CRS (Congressional Research Service)
claims none of the current suite of farm price and income support programs and shallow-loss
crop insurance programs—MLP (Marketing Loan Program) , PLC (Price Loss Coverage), ARC
(Agriculture Risk Coverage), SCO (Supplemental Coverage Option), STAX (Stacked Income
Protected Plan), DMPP (Dairy Margin Protection Program), and the sugar program—would
qualify for the green box, because they are coupled, partially or fully, to current prices and/or
plantings, or receive additional TRQ protection from imports (as is the case for U.S. dairy and
sugar producers).256
Green box outlays are unlimited, thus additional NAP would have no WTO effect; however, it
remains to be seen if “buy-up” coverage is notified as amber box or green box.257
However, we consider the support provided under this program constitutes a subsidy for
purposes of the Agreement on Agriculture and the Agreement on Subsidies and Countervailing
Measures. However, these payments would not be included in the U.S. AMS or be subject to
reduction commitments. Annex 2(8) to the Agreement on Agriculture exempts payments for
relief from natural disasters. The payments at issue, which are tied to natural disasters that occur
before or during harvest and which directly affect the eligible crop, are clearly intended to
provide relief from those natural disasters.
256 FN - CRS, 2014 Farm Bill and WTO Consistency, pg 11 257 CRS, 2014 Farm Bill and WTO Consistency, pg 40

PART I
143
(c) Program Level
The FY 2017 Budget for the Department of Agriculture reports the following obligations for this
program:258
2015 (Actual) $119,000,000
2016 (Estimate) $165,000,000
2017 (Estimate) $165,000,000
(d) Allocation to Dairy
This program does not provide benefits exclusively to dairy producers. Consequently, we cannot
attribute the entire value of the support provided under these programs to U.S. dairy producers.
Therefore, the value of the subsidies and support that benefits dairy production under these
programs is attributed on the basis of dairy’s share of the total value of U.S. agricultural
production. In 2015, all dairy production accounted for 10.54% of total U.S. agricultural
production.
Total obligations under this program in 2015 were estimated at $119,000,000. Therefore, the
amount allocated to dairy production under this program is $12,542,600
258 Department of Agriculture, The Budget for Fiscal Year 2017, pg 102
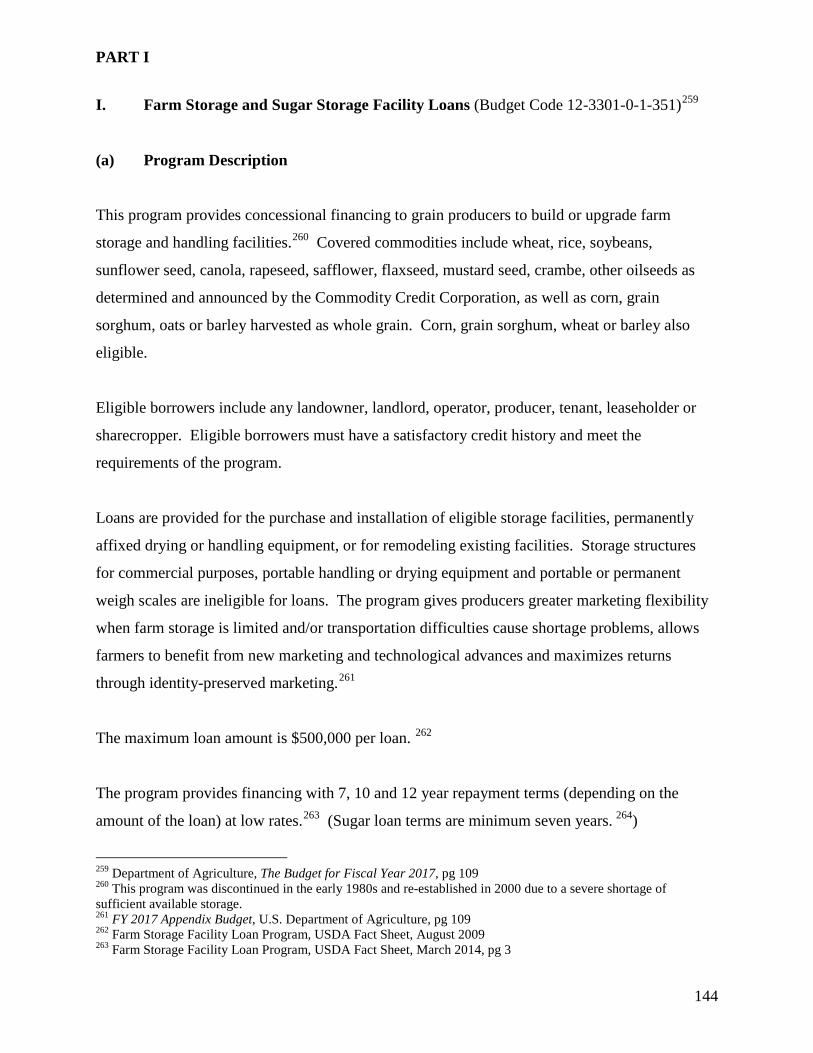
PART I
144
I. Farm Storage and Sugar Storage Facility Loans (Budget Code 12-3301-0-1-351)259
(a) Program Description
This program provides concessional financing to grain producers to build or upgrade farm
storage and handling facilities.260 Covered commodities include wheat, rice, soybeans,
sunflower seed, canola, rapeseed, safflower, flaxseed, mustard seed, crambe, other oilseeds as
determined and announced by the Commodity Credit Corporation, as well as corn, grain
sorghum, oats or barley harvested as whole grain. Corn, grain sorghum, wheat or barley also
eligible.
Eligible borrowers include any landowner, landlord, operator, producer, tenant, leaseholder or
sharecropper. Eligible borrowers must have a satisfactory credit history and meet the
requirements of the program.
Loans are provided for the purchase and installation of eligible storage facilities, permanently
affixed drying or handling equipment, or for remodeling existing facilities. Storage structures
for commercial purposes, portable handling or drying equipment and portable or permanent
weigh scales are ineligible for loans. The program gives producers greater marketing flexibility
when farm storage is limited and/or transportation difficulties cause shortage problems, allows
farmers to benefit from new marketing and technological advances and maximizes returns
through identity-preserved marketing.261
The maximum loan amount is $500,000 per loan. 262
The program provides financing with 7, 10 and 12 year repayment terms (depending on the
amount of the loan) at low rates.263 (Sugar loan terms are minimum seven years. 264)
259 Department of Agriculture, The Budget for Fiscal Year 2017, pg 109 260 This program was discontinued in the early 1980s and re-established in 2000 due to a severe shortage of sufficient available storage. 261 FY 2017 Appendix Budget, U.S. Department of Agriculture, pg 109 262 Farm Storage Facility Loan Program, USDA Fact Sheet, August 2009 263 Farm Storage Facility Loan Program, USDA Fact Sheet, March 2014, pg 3

PART I
145
Interest is charged at a rate equivalent to the rate of interest charged on U.S. Treasury securities
of comparable maturity on the date the loan is approved. The interest rate for each loan will
remain in effect for the term of the loan.
(b) WTO Consistency
As the loans at issue are provided at U.S. Treasury security rates and the financing is described
as commercial – which means not available on the market – in these circumstances, the program
would provide a subsidy for purposes of the Agreement on Agriculture and the Agreement on
Subsidies and Countervailing Measures.
The program does not appear to fit any of the exclusions from AMS reduction in Annex 2 of the
Agreement on Agriculture. Annex 2(1) of the Agreement on Agriculture provides that domestic
support measures for which exemption from reduction commitments is claimed shall meet the
fundamental requirement that they have no, or at most, minimal trade-distorting effects or effects
on production. Unfortunately, there is no definition much less an agreed definition of “minimal”
in this connection.
Absent subsidized storage, it is quite likely these products could not be marketed or would be
more expensive if they were stored in private commercial facilities, so we would argue that the
program encourages harvest (production) and sale of these commodities.
264 FY 2017 Appendix Budget, U.S. Department of Agriculture, pg 109

PART I
146
(c) Program Level
The FY 2017 Budget for the Department of Agriculture reports the following budget authority
for the program:
2015 (Actual) $254,000,000
2016 (Estimate) $417,000,000
2017 (Estimate) $395,000,000
(d) Allocation to Dairy
This program does not provide benefits exclusively to dairy producers, but we note that it may
provide assistance to storage for feedgrains used by dairy producers. Consequently, we cannot
attribute the entire value of the support provided under these programs to U.S. dairy producers.
Therefore, the value of the subsidies and support that benefits dairy production under these
programs is attributed on the basis of dairy’s share of the total value of U.S. agricultural
production. In 2015, all dairy production accounted for 10.54% of total U.S. agricultural
production.
Total obligations under this program in 2015 were estimated at $254,000,000. Therefore, the
amount allocated to dairy production under this program is $26,771,600.
PART I
147
J. Dairy Indemnity Program
(a) Program Description
This program provides indemnity payments to dairy producers who have been directed to
remove raw milk from the commercial market because it has been contaminated with pesticides,
nuclear radiation or fallout, or toxic substances or chemicals other than pesticides.
Payments are made to manufacturers of dairy products only for products removed from the
market because of pesticide contamination. 265
The indemnity payment to dairy producers is calculated using the following formula.
- the number of cows milked; times
- the number of days milk is off the market; times
- base production in terms of pounds per cow per day; times
- farm price for milk with the same butterfat content
- less handling and promotion fees received by the producer
The base period for the payment is the calendar month two biweekly pay periods immediately
before the milk is removed from the market.
The indemnity payment to manufacturers of dairy products is calculated by multiplying the fair
market value of the product by the amount of product removed from the market less any salvage
value for the product.
265 Farm Service Agency Programs, USDA Farm Service Agency Fact Sheet, July 2015

PART I
148
(b) WTO Consistency
This program provides subsidies to producers, but because the subsidies are not tied to
production would not likely have a trade distorting effect. They may be “green”. These
payments may constitute domestic support that need not be included in the U.S. AMS and is not
subject to reduction commitments.
(c) Program Level
2015 (Actual) $1,000,000
2016 (Estimate) $1,000,000
2017 (Estimate) $1,000,000
Obligations under this program were estimated to be $1,000,000 for FY 2015 and FY 2016.266
(d) Allocation to Dairy
This program is dedicated to supporting dairy production; therefore 100% of the obligations
under this program, estimated at $1,000,000 for FY 2015 and FY 2016, should be allocated to
dairy production.
266 FY 2017 Appendix Budget, U.S. Department of Agriculture, pg 99
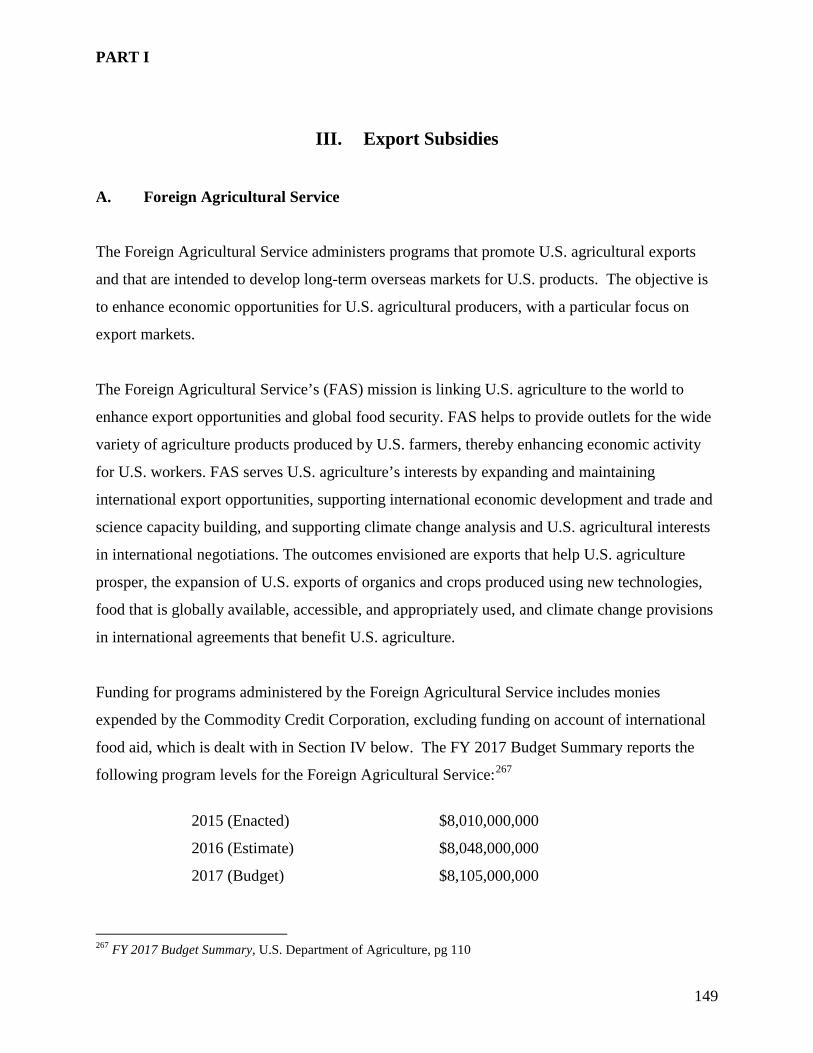
PART I
149
III. Export Subsidies
A. Foreign Agricultural Service
The Foreign Agricultural Service administers programs that promote U.S. agricultural exports
and that are intended to develop long-term overseas markets for U.S. products. The objective is
to enhance economic opportunities for U.S. agricultural producers, with a particular focus on
export markets.
The Foreign Agricultural Service’s (FAS) mission is linking U.S. agriculture to the world to
enhance export opportunities and global food security. FAS helps to provide outlets for the wide
variety of agriculture products produced by U.S. farmers, thereby enhancing economic activity
for U.S. workers. FAS serves U.S. agriculture’s interests by expanding and maintaining
international export opportunities, supporting international economic development and trade and
science capacity building, and supporting climate change analysis and U.S. agricultural interests
in international negotiations. The outcomes envisioned are exports that help U.S. agriculture
prosper, the expansion of U.S. exports of organics and crops produced using new technologies,
food that is globally available, accessible, and appropriately used, and climate change provisions
in international agreements that benefit U.S. agriculture.
Funding for programs administered by the Foreign Agricultural Service includes monies
expended by the Commodity Credit Corporation, excluding funding on account of international
food aid, which is dealt with in Section IV below. The FY 2017 Budget Summary reports the
following program levels for the Foreign Agricultural Service:267
2015 (Enacted) $8,010,000,000
2016 (Estimate) $8,048,000,000
2017 (Budget) $8,105,000,000
267 FY 2017 Budget Summary, U.S. Department of Agriculture, pg 110

PART I
150
The Dairy Export Incentive Program was repealed by the 2014 Farm Bill. In addition to general
benefits, Dairy exports have expanded significantly under a program known as Co-operatives
Working Together (CWT). While farmer funded – in 2015, 37% of U.S. cheese exports, 92% of
U.S. butter exports and 45% of WMP exports representing 23.8 million pounds (10,818 tonnes),
28.1 million pounds (12,772 tonnes) and 22.3 million pounds (10,136 tonnes) were assisted by
CWT.268
“ This is an export subsidy the U.S. funds thought CWT to help keep their prices competitive for
world markets. CWT is extended until December 31, 2018 comes at a time of increasing U.S.
milk production, declining world dairy market prices and increase global competition due to the
removal of E.U. milk quotas and increasing supply in New Zealand.” 269
Assisting CWT members through the Export Assistance Program in the long term help member
co-operatives gain and maintain market share thus expanding the demand for U.S. dairy products
and the U.S. farm milk that produces them.270
In 2015, the amount of support provided to dairy through these program level allocations can be
determined on the basis of dairy’s proportionate share of total U.S. agricultural production. In
2015, dairy production represented 10.54% of the total value of U.S. agricultural production.
Therefore, of the $8,010,000,000 expended in 2015, $844,254,000 can be allocated to dairy
production.
268 “U.S. to Extend CWT/Dairy Export Programme”, Irish Farmer Journal, 28 October 2015 269 “CWT continuous to offer export assistance to U.S. farmers until 2018, Irish Farmer Journal”, 11 June 2015 270 “CWT Assist More Cheese and Butter Export Sales, AgricHQ, 19 January 2017

PART I
151
B. Export Credit Guarantee Programs (Budget Code 12-1336-0-1-351-215999)271
(a) Program Descriptions
The Commodity Credit Corporation provides payment guarantees under the Export Credit
Guarantee programs for the financing of U.S. agricultural exports. These programs are used in
countries where the ability to offer and provide credit is necessary to maintain or increase U.S.
export sales, but where the financing may not be commercially available without guarantees.
Short-Term Guarantees (GSM 102); Intermediate-Term Guarantees (GSM 103); Supplier Credit Guarantees
The Commodity Credit Corporation may use export credit guarantees for any or all of the
following purposes:
- to increase exports of U.S. agricultural commodities;
- to compete against foreign agricultural exports;
- to assist countries, particularly developing countries, meet their food and fiber
needs;
- for such other purposes as the Secretary of Agriculture determines.272
GSM-102 and GSM-103 guarantees underwrite the credit extended by the private banking sector
to approved foreign banks using dollar-denominated, irrevocable letters of credit to pay for food
and agricultural products sold to foreign buyers. The Export Credit Guarantee Program (GSM-
102) offers credit for 90 days to 3 years. The Intermediate Export Credit Guarantee Program
(GSM-102) offers credit for 3 to 10 years.
Under these programs, the CCC guarantees payments due from foreign banks, which permit the
U.S. financial institution to offer competitive credit terms to the foreign banks, usually with the
interest rates based on the London Inter-Bank Offered Rate (LIBOR). 271 Department of Agriculture, The Budget for Fiscal Year 2017, pg 107 272 Subpart A – Restrictions and Criteria for Export Credit Guarantee Programs
PART I
152
“Interested parties”, including U.S. exporters, foreign buyers and banks, may request that the
CCC establish a GSM-102 or GSM-103 program for a country or region. CCC will determine
the ability of each country and foreign bank to service CCC-guaranteed debt.
CCC is authorized to promote the export of U.S. agricultural commodities through sales,
payments, export credits and other related activities.273 The program is open to exports of all
U.S. agricultural products. CCC selects agricultural products and commodities according to
market potential.274 Eligible commodities are limited to those that are produced entirely in the
United States, including dairy products.275
The Supplier Credit Guarantee Program is used by USDA to encourage exports to countries
where extending credit is necessary to maintain or increase U.S. sales but where financing may
not be available without CCC guarantees. Under this program, CCC guarantees a portion of
payments due from importers under short-term financing (up to 180 days) that exporters have
extended directly to importers for the purchase of U.S. agricultural products. These direct credits
must be secured by promissory notes signed by the importers.276
This program offers alternative credit options. USDA considers that the Supplier Credit
Guarantee Program may be helpful in countries where GSM-102 financing is limited because
CCC has reached its exposure limits for private foreign banks.
USDA also considers that this program may work well for commodities and products that
normally trade on short-term open-account financing.
273 Fact Sheet: Commodity Credit Corporation, October 2015 274 Fact Sheet: CCC Export Credit Guarantee Program, November 2009 275 Fact Sheet: Supplier Credit Guarantee Program, March 2006 276 Ibid.

PART I
153
(b) WTO Consistency
GSM-102, GSM-103 and the Supplier Credit Guarantee Program were considered by the Panel
in United States – Upland Cotton. 277 Brazil argued that these programs violated Articles 10.1
and 8 of the Agreement on Agriculture278 (see para 7.767). Brazil relied on item (j) of the
Illustrative List of Export Subsidies in Annex I of the SCM Agreement to argue that the export
credit guarantee programs fall within Article 10 of the Agreement on Agriculture on the basis
that the premium rates charged are inadequate to cover the long term operating costs and losses
of the program. (see Panel Report para 7.768)
The United States, relying on Article 10.2 of the Agreement on Agriculture, argued that export
credit guarantees are not export subsidies and are not subject to the export subsidy disciplines of
the Agreement on Agriculture. (see para 7.770) The U.S. also argued that even if the SCM
Agreement applied, the export credits guarantee programs do not confer a benefit because
identical instruments are available in the marketplace in the form of “forfeiting” and private
insurance. (para 7.773) The U.S. also noted that it is permitted to provide export subsidies that
comply with its scheduled quantitative reduction commitments and, in this respect, relied on the
“mandatory/discretionary” analysis to ask whether the provisions establishing the export credit
guarantee programs were in a breach of any WTO obligation. (see para 7.774)
The Panel noted that WTO and GATT practice considered that export credit guarantees may
generally be considered to constitute export subsidies. (see para 7.806) The Panel considered
these programs, their operations, costs and premiums collected and determined that per se they
constitute an export subsidy within the meaning of item (j) of the Illustrative List of Export
Subsidies. (see para 7.869)
Having determined that these programs are per se export subsidies, the Panel then turned to the
issue of whether the export credits were applied in a manner that threatened to circumvent U.S.
export subsidy commitments.
277 World Trade Organization (WTO), United States—Subsidies on Upland Cotton; Report to the Panel (WT/DS267/R), 8 September, 2004, pgs 192, 193, 194, 200, 217 278 Ibid., para 7.67

PART I
154
The Panel considered the application of these programs and determined that, with respect to
upland cotton and other unscheduled agricultural products supported under the program, and in
respect of one scheduled product (rice), the export credit guarantee programs were applied in a
manner which resulted in circumvention of U.S. export subsidy commitments, in violation of
Article 10.1 of the Agreement on Agriculture and, therefore, the programs are inconsistent with
Article 8 of the Agreement on Agriculture. In addition, the Panel determined that the export
credit guarantee programs are not protected by the Peace Clause in Article 13 of the Agreement
on Agriculture and that as the guarantees are provided at premium rates that are inadequate to
cover long-term operating costs and losses, the programs constitute export subsidies prohibited
by Article 3.1(a) and 3.2 of the Agreement on Subsidies and Countervailing Measures. (see para
8.1(d)(i))
However, with respect to unscheduled agricultural products not supported by these programs,
and other scheduled agricultural products, the Panel found that these export credit guarantee
programs did not violate Articles 10.1 and 8 of the Agreement on Agriculture. In addition, the
Panel determined that Brazil failed to establish a prima facie case that the programs do not
conform fully to Part V of the Agreement on Agriculture. Consequently, the Panel considered
that it must treat these programs as if they were protected by the Peace Clause. (see para
8.1(d)(ii))
These credits provided under these export credit guarantee programs are export subsidies for
purposes of the Agreement on Agriculture and the Agreement on Subsidies and Countervailing
Measures. Thus, these export subsidies will be prohibited if they are provided to support
unscheduled agricultural products (products for which the U.S. does not have the ability to
provide any export subsidy support) or if they are provided to support scheduled agricultural
products in excess of the bound export subsidy commitments for that specific product.

PART I
155
(c) Program Level
The FY 2017 Budget for the Department of Agriculture reports the following program level for
this program:279
2015 (Actual) $5,500,000,000
2016 (Estimate) $5,500,000,000
2017 (Estimate) $5,500,000,000
(d) Allocation to Dairy
This program does not provide benefits exclusively to dairy producers. Consequently, we cannot
attribute the entire value of the support provided under these programs to U.S. dairy producers.
Therefore, the value of the subsidies and support that benefits dairy production under these
programs is attributed on the basis of dairy’s share of the total value of U.S. agricultural
production. In 2015, all dairy production accounted for 10.54% of total U.S. agricultural
production.
Total program level provided for this program in 2015 amounted to $5,500,000,000. Therefore,
the amount allocated to dairy production under this program is $579,700,000.
279 FY 2017 Budget Summary, Department of Agriculture, pg 30

PART I
156
C. Facilities Financing Guarantees280
(a) Program Description
The U.S. Department of Agriculture’s Facility Guarantee Program (FGP) is designed to expand
sales of U.S. agricultural products to emerging markets where inadequate storage, processing, or
handling capacity limit trade potential. The program provides payment guarantees to finance
commercial exports of U.S. manufactured goods and services that will be used to improve
agriculture-related facilities.
Emerging markets often lack the infrastructure to support increased trade volume. Export sales of
U.S. equipment or expertise to improve ports, loading and unloading capacity, refrigerated
storage, warehouse and distribution systems, and other related facilities may qualify for facility
guarantees, as long as these improvements are expected to increase opportunities for U.S.
agricultural exports.
Under this program, USDA’s Commodity Credit Corporation (CCC) guarantees payments due
from approved foreign banks to exporters or financial institutions in the United States. USDA’s
Foreign Agricultural Service (FAS) administers this program on behalf of the CCC. The
financing must be obtained through normal commercial sources. Typically, a guarantee covers
95% of principal and a portion of interest. FGP regulations are found in the Code of Federal
Regulations 7 CFR 1493.
Qualified Projects The Secretary of Agriculture must determine that the project will primarily
promote the export of U.S. agricultural commodities or products to emerging markets.
Emerging Market An emerging market is a country that the Secretary of Agriculture
determines: (1) is taking steps toward a market-oriented economy through the food, agricultural,
or rural business sectors; and (2) has the potential to provide a viable and significant market for
U.S. agricultural products.
280 Facility Guarantee Program, FACT Sheet, FAS Online, March 2017

PART I
157
U.S. Content Only U.S. goods and services are eligible under the program. The CCC will
consider projects only where the combined value of the foreign components in U.S. goods and
services approved by the CCC represents less than 50% of the eligible sales transaction.
Initial Payment An initial payment representing at least 15% of the value of the sales
transaction must be provided by the importer to the exporter.
Payment Terms Payment terms may range from 1 to 10 years, with semi-annual installments on
principal and interest. The applicable program announcement will specify actual payment terms.
Payment Mechanism Payment must be made to the exporter in U.S. dollars on deferred
payment terms under an irrevocable foreign bank letter of credit.
Coverage The CCC determines the rate of coverage (currently 95%) that will apply to the value
of the transaction, excluding the minimum 15-percent initial payment. The CCC also covers a
portion of interest on a variable rate basis. The CCC agrees to pay exporters or their assignee
financial institutions in the event a foreign bank fails to make payment pursuant to the terms of
the letter of credit. The FGP does not cover the risk of defaults on credits or loans extended by
foreign banks to importers or owners of facilities.
(b) WTO Consistency
The export credit guarantees provided under this program likely constitute subsidies on the basis
that they provide a benefit to recipients. The benefit is in the form of credit guarantees provided
at rates that are not available to the borrower on the commercial market. In addition, it is likely
that the premiums charged for these credit guarantees do not cover the long term operating costs
of the program.

PART I
158
If the program provides a subsidy, it is a subsidy that is contingent on the export of U.S.
equipment or expertise. This is evident from the fact that the program is not available to support
domestic infrastructure projects.
As the program supports exports of equipment and expertise, and not agricultural products, the
export subsidies are not subject to the Agreement on Agriculture, but would be subject to the
Agreement on Subsidies and Countervailing Measures.
Article 3.1(a) of the SCM Agreement prohibits export subsidies. With respect to Agriculture,
such subsidies are permitted up to the levels inscribed in individual countries bound export
subsidy commitments.
Therefore, as the program provides export subsidies, the export credit guarantees are provided in
violation of SCM Article 3.1(a).
(c) Program Level
The FY 2017 Budget Summary for the Department of Agriculture reports the following program
levels for this program:281
2015 (Enacted) 100,000,000
2016 (Estimate) $100,000,000
2017 (Budget) $500,000,000
(e) Allocation to Dairy
There was $100,000,000 budgeted for 2015. The allocation to dairy at 10.54 percent is
$10,540,000.
281 FY 2017 Budget Summary, U.S. Department of Agriculture, pg 30
PART I
159
D. Market Access Program (Budget Code 12-4336-0-3-999.0016)282
(a) Program Description
The Market Access Program (MAP) uses funds from the U.S. Department of Agriculture’s
(USDA) Commodity Credit Corporation (CCC) to aid in the creation, expansion, and
maintenance of foreign markets for U.S. agricultural products. The MAP is authorized by
Section 203 of the Agricultural Trade Act of 1978, and is administered by USDA’s Foreign
Agricultural Service (FAS).283
The MAP forms a partnership between non-profit U.S. agricultural trade associations, non-profit
U.S. agricultural cooperatives, non-profit state-regional trade groups, small U.S. businesses, and
USDA’s CCC to share the costs of overseas marketing and promotional activities, such as trade
shows, market research, consumer promotions for retail products, technical capacity building,
and seminars to educate overseas customers.284
Participation in MAP is also not restricted to non-commercial entities. Although non-profit
organizations and regional trade groups may receive MAP assistance, support can also be given
to a “small-sized USA commercial entity (other than a cooperative or producer association).”
The fact that MAP is available to corporations is made clear in the MAP announcements for
2015 which include $932,734 of the $200 million being allocated to Welch’s Food.285
(b) WTO Consistency
The Market Access Program provides subsidies to support U.S. agricultural product exports.
The allocations made under this program, which are financial contributions by government,
confer a benefit on the recipient. Thus, allocations made under MAP are subsidies for purposes
of the Agreement on Agriculture and the Agreement on Subsidies and Countervailing Measures.
282 Department of Agriculture, The Budget for Fiscal Year 2017, pg 102 283 USDA Factsheet: Common Credit Corporation, October 2015 284 Ibid. 285 USDA, FAS, Map Funding Allocations, FY 2015

PART I
160
These subsidies are provided to support exports and, thus, are made contingent on actual or
anticipated export performance.
On this basis, the subsidies provided by MAP are export subsidies. Export subsidies are
prohibited under the Article 3(1)a of the Agreement on Subsidies and Countervailing Measures
but are permitted by the Agreement on Agriculture so long as they are made within U.S. export
subsidy bindings. Thus, to the extent that MAP support is provided within U.S. export subsidy
bindings, the subsidies are not prohibited. However, should MAP be used to support the export
sale of non-scheduled U.S. agricultural products or are provided in excess of U.S. export subsidy
bindings, the provision of MAP subsidies would violate the United States WTO obligations.
(c) Program Level
The FY 2017 Budget for the Department of Agriculture reports the following funding for this
program:286
2015 (Actual) $185,000,000
2016 (Estimate) $200,000,000
2017 (Estimate) $200,000,000
(d) Allocation to Dairy
This program does not provide benefits exclusively to dairy producers. Consequently, we cannot
attribute the entire value of the support provided under these programs to U.S. dairy producers.
Therefore, the value of the subsidies and support that benefits dairy production under these
programs is attributed on the basis of dairy’s share of the total value of U.S. agricultural
production. In 2015, all dairy production accounted for 10.54% of total U.S. agricultural
production.
286 Department of Agriculture, The Budget for the Fiscal Year 2017, pg 102
PART I
161
Total funding provided under this program in 2015 amounted to $185,000,000. Therefore, the
amount allocated to dairy production under this program is $19,499,000.

PART I
162
E. Foreign Market Development (Cooperator) Program (Budget Code 12-4336-0-3-999.
00.21)287
(a) Program Description
The Foreign Market Development Program (also referred to as the Cooperator or Cooperative
Program) is a program operated by the Commodity Credit Corporation to support the creation,
expansion and maintenance of long-term export markets for U.S. agricultural products. The
program has fostered a promotion partnership between USDA and U.S. agricultural producers
and processors (represented by nonprofit commodity or trade associations called “Cooperators”).
The program assists U.S. farmers, processors and exporters by assisting their organizations to
develop new foreign markets and to increase market share in existing markets. The program
supports generic U.S. commodities rather than brand-name products.
The program uses CCC funds to partially reimburse Cooperators conducted approved overseas
promotional activities. Preference is given to non-profit U.S. agricultural and trade groups that
represent an entire industry or that are nationwide in membership and scope.
The total allocation for FY 2015 is $32 million288, which has been apportioned among the
following groups:289
Cooperator FY 2015
Allocation
Almond Board of California $275,000 American Hardwood Export Council, APA – The Engineered Wood Association, Softwood Export Council, and Southern Forest Products Association
$3,447,510
American Peanut Council $158,309 American Seed Trade Association $246,304 American Sheep Industry Association $148,193 American Soybean Association $7,251,691 Cotton Council International $3,505,097
287 FY 2017 Appendix Budget, U.S. Department of Agriculture, pg 102 288 Ibid. 289 USDA Fact Sheet: Foreign Market Development Program

PART I
163
Cranberry Marketing Committee $182,665 Leather Industries of America $228,882 Mohair Council of America $17,996 National Renderers Association $284,960 National Sunflower Association $244,481 North American Millers Association $24,537 U.S. Dry Bean Council $118,816 U.S. Grains Council $2,238,847 U.S. Hide, Skin and Leather Association $132,075 U.S. Livestock Genetics Export, Inc. $555,292 U.S. Meat Export Federation $1,370,126 U.S. Wheat Associates $3,576,245 USA Dry Pea and Lentil Council $162,503 USA Poultry and Egg Export Council $1,299,338 USA Rice Federation $1,266,286 Total $26,735,153
(b) WTO Consistency
The Foreign Market Development Program provides subsidies to support the sale of U.S.
agricultural products. The program provides a subsidy for purposes of the Agreement on
Agriculture and the Agreement on Subsidies and Countervailing Measures by making a financial
contribution that confers a benefit on the recipient. Because this subsidy is made contingent on
actual or anticipated export earnings, it is an export subsidy.
Export subsidies are prohibited by the Agreement on Subsidies and Countervailing Measures but
are permitted by the Agreement on Agriculture so long as they are not provided in excess of U.S.
export subsidy bindings. Therefore, if export subsidies under this program are provided to
support the export sale of unscheduled U.S. agricultural products or are provided in excess of
U.S. export subsidy bindings, the support provided will violate U.S. WTO obligations.

PART I
164
(c) Program Level
The FY 2017 Budget reports the following funding on account of this program:290
2015 (Actual) $32,000,000
2016 (Estimate) $35,000,000
2017 (Estimate) $35,000,000
(d) Allocation to Dairy
This program does not provide benefits exclusively to dairy producers. The 2015allocation for
the Dairy Export Counsel was $3,203,172. Dairy farmers may also have benefited from grants to
Meat and Livestock export groups.
Total funding provided under this program in 2015 amounted to $32,000,000. For conversion of
allocation methodology the amount allocated to dairy production under this program is
$3,372,800 which represents 10.54% of the program level.
290 Department of Agriculture, The Budget of Fiscal Year 2017, pg 102

PART I
165
F. Emerging Market Program291
(a) Program Description
The Emerging Markets Program is a market access program that provides funding for technical
assistance activities intended to promote exports of U.S. agricultural commodities and products
to emerging markets in all geographic regions, consistent with U.S. foreign policy. The program
is authorized by the Food, Agriculture, Conservation, and Trade Act of 1990, as amended. The
EMP regulations appear at 7 CFR part 1486. Funding is set at $10 million each fiscal year from
the Commodity Credit Corporation from now through the end of the current Farm Bill.292
The Emerging Markets Program is a generic program. Its resources may be used to support
exports of U.S. agricultural commodities and products only through activities relating to products
generically, i.e., pork or milk. Projects that endorse or promote branded products are not eligible
for the Program.
Funding is provided through three channels: (1) the Central Fund, the principal means of
funding, made available through a public announcement; (2) the Technical Issues Resolution
Fund, to address technical barriers to exports; and (3) the Quick Response Marketing Fund, to
assist in resolving short-term time-sensitive market access issues.293
What is an Emerging Market? The legislation defines an emerging market as any country that
“is taking steps toward a market-oriented economy through the food, agriculture, or rural
business sectors of the economy of the country,” and “has the potential to provide a viable and
significant market for United States commodities or products of United States agricultural
commodities.”
291 2008 Emerging Markets Program, Fact Sheet, FAS Online, October 2015 292 FY 2017 Budget Summary, U.S. Department of Agriculture, pg 31 293 Electronic Code of Federal Regulations, Title 7, Subtitle B, Chapter XIV, Subchapter C, Part 1486, Emerging Marketing Program

PART I
166
There is no fixed list of “emerging market” countries. Because funds are limited and the range of
emerging markets is worldwide, the Program uses certain administrative criteria, in addition to
the legal definition above, to determine whether a country is considered an emerging market:
1) Per capita income of less than $12,476, the current ceiling on upper middle income
economies as determined by the World Bank.294
2) Population greater than 1 million (the program may encompass regional groupings,
such as the islands of the Caribbean Basin).295
Guidance on qualified emerging markets is provided each year in the Program’s application
announcement.
Program Priorities. The principal purpose of the program is to assist U.S. organizations, public
and private, to improve market access by developing, maintaining, or enhancing U.S. exports to
low- and middle-income countries which have or are developing market-oriented economies, and
which can be viable markets for these products. The underlying premise is that emerging
agricultural markets have distinctive characteristics that benefit from U.S. governmental
assistance before the private sector moves to develop these markets through normal trade
promotional activities. All agricultural commodities except tobacco are eligible for
consideration.
Cost-sharing, the funding U.S. private organizations are willing to commit from their own
resources to seek export business in an emerging market, is one of the requirements needed in an
application in order to qualify for funding assistance under the Emerging Markets Program.
Justification for federal funding is also required.296Such cost sharing increases the marketing
development funds available to export as agricultural products
294 The World Bank Country and Lending Groups. https://datahelpdesk.worldbank.org/knowledgebase/articles/906519-world-bank-country-and-lending-groups 295 Electronic Code of Federal Regulations, Title 7, Subtitle B, Chapter XIV, Subchapter C, Part 1486, Emerging Marketing Program 296 Federal Register, A Notice by the Commodity Credit Corporation, Notice of Funds Availability: Inviting Applications for the Emerging Markets Program, April 4, 2016

PART I
167
Types of Projects and Activities. Funding is on a project-by-project basis. Many types of
technical assistance activities that promote markets for U.S. agricultural products may be eligible
for funding. Examples include feasibility studies, market research, sectorial assessments,
orientation visits, specialized training, and business workshops. The program is not intended for
projects targeted at end-user consumers. Ineligible activities include in-store promotions;
restaurant promotions; branded product promotions (including labelling and supplementing
normal company sales activities designed to increase awareness and stimulate sales of branded
products); equipment purchases; costs of new product development; administrative and
operational expenses for trade shows; advertising; preparation and printing of brochures, flyers,
posters, etc., except in connection with specific technical assistance activities such as training
seminars; and design of development of Internet Web sites.
The program complements other FAS marketing programs. Once a market access issue has been
addressed by the Emerging Markets Program, further market development activities may be
considered under other FAS programs.297
Eligible Organizations. Any U. S. agricultural or agribusiness organization, university, state
department of agriculture, or USDA agency (or other federal agency involved in agricultural
issues) is eligible to participate in the Emerging Markets Program. Preference will be given to
proposals indicating significant support and involvement by private industry. Proposals will be
considered from research and consulting organizations only as long as they can demonstrate
evidence of substantial participation by U.S. industry. For-profit entities are also eligible, but
may not use program funds to conduct private business, promote private self-interests,
supplement the costs of normal sales activities, or promote their own products or services beyond
specific uses approved for a given project. USDA market development cooperators may seek
funding to address priority, market-specific issues or to undertake activities not already serviced
by or unsuitable for funding under other FAS marketing programs, such as the Foreign Market
Development Program and Market Access Program.
297 Federal Register, A Notice by the Commodity Credit Corporation, Notice of Funds Availability: Inviting Applications for the Emerging Markets Program, April 4, 2016

PART I
168
The opportunity for applying to the Emerging Markets Program during the annual open
solicitation period is announced in the Federal Register and on the FAS Internet Web site.298
Advisory Committee on Emerging Markets. A private sector advisory committee provides
information and advice to help USDA develop strategies for providing technical assistance and
enhancing markets for U.S. agricultural products in developing market economies. More
specifically, Committee members review from a business perspective qualified proposals
submitted to the Program for funding assistance.299
(b) WTO Consistency
The support provided under this program is a subsidy for purposes of the Agreement on
Agriculture and the Agreement on Subsidies and Countervailing Measures. As the subsidy is
contingent on export performance, it is an export subsidy.
Export subsidies were prohibited by the WTO Agreement on Subsidies and Countervailing
Measures but were permitted by the Agreement on Agriculture so long as they are provided
within U.S. export subsidy bindings. Under the Ministerial decision on export competition on 19
December 2015 exports subsidies are to be phased out and eliminated. The Declaration is
binding but as it does not amend the WTO Agreement it is arguable and enforceable by the DSU.
Well “naming and shaming” be enough?
Arguably and unanimously adopted ministerial declaration constitutes an “internationally agreed
discipline” as envisaged in articles 10.2 of the Agreement on Agriculture.
298 Federal Register, A Notice by the Commodity Credit Corporation, Notice of Funds Availability: Inviting Applications for the Emerging Markets Program, April 4, 2016 299 Federal Register, A Notice by the Commodity Credit Corporation, Notice of Funds Availability: Inviting Applications for the Emerging Markets Program, April 4, 2016

PART I
169
While the new WTO rules an agricultural exports subsidies (and other export competition) may
not be enforceable there are provisions in the SCM Agreement – rules on exports credits are
similar but not identical – which can be.
(c) Program Level
The FY 2017 Budget reports the following funding on account of this program: 300
2015 (Actual) $9,000,000
2016 (Estimate) $9,000,000
2017 (Estimate) $10,000,000
(d) Allocation to Dairy
This program neither provides benefits exclusively to dairy producers nor excludes them.
Consequently, we cannot attribute the entire value of the support provided under these programs
to U.S. dairy producers. Therefore, the value of the subsidies and support that benefits dairy
production under these programs is attributed on the basis of dairy’s share of the total value of
U.S. agricultural production. In 2015, all dairy production accounted for 10.54% of total U.S.
agricultural production.
Total funding provided under this program in 2015 amounted to $9,000,000. Therefore, the
amount allocated to dairy production under this program is $948,600.
300 FY 2017 Budget Summary, U.S. Department of Agriculture, pg 29

PART I
170
G. Quality Samples Program (Budget Code 12-4336-0-3-999.00.22)301
(a) Program Description
This program encourages the development and expansion of export markets for U.S. agricultural
commodities by assisting U.S. entities provide commodity samples to potential foreign
importers. The program objective is to demonstrate the high quality of U.S. agricultural
commodities and products. Participants will procure samples, export the samples, provide any
technical assistance necessary to facilitate the successful use of samples. Participants may be
reimbursed for the cost of the sample purchase price and the cost of transporting the sample from
the U.S. to the foreign port (further transportation costs are not reimbursable). For 2017,
$2.5 million is available for funding under this program.302
(b) WTO Consistency
The program reduces the cost relating to promotion and development of new export markets for
U.S. products and, on that basis, provides support to U.S. agricultural exports. Arguably, as the
program would constitute general marketing and promotion services for purposes of Annex
2(2)(f) to the Agreement on Agriculture, expenditures under this program would not constitute
part of the U.S. AMS and would not be subject to U.S. reduction commitments. However, this is
an export subsidy and Annex 2(2)(f) may not be relevant.
Under the Ministerial decision on export competition on 19 December 2015 exports subsidies are
to be phased out and eliminated. The Declaration is binding but as it does not amend the WTO
Agreement it is arguable and enforceable by the DSU. Well “naming and shaming” be enough?
Arguably and unanimously adopted ministerial declaration constitutes an “internationally agreed
discipline” as envisaged in articles 10.2 of the Agreement on Agriculture.
301 Department of Agriculture, The Budget for Fiscal Year 2017, pg 102 302 FY 2017 Budget Summary, U.S. Department of Agriculture, pg 31

PART I
171
While the new WTO rules an agricultural exports subsidies (and other export competition) may
not be enforceable there are provisions in the SCM Agreement – rules on exports credits are
similar but not identical – which can be.
(c) Program Level
The FY 2017 Budget reports the following funding on account of this program:303
2015 (Actual) $1,000,000
2016 (Estimate) $3,000,000
2017 (Estimate) $3,000,000
(d) Allocation to Dairy
This program does not provide benefits exclusively to dairy producers. Consequently, we cannot
attribute the entire value of the support provided under these programs to U.S. dairy producers.
Therefore, the value of the subsidies and support that benefits dairy production under these
programs is attributed on the basis of dairy’s share of the total value of U.S. agricultural
production. In 2015, all dairy production accounted for 10.54% of total U.S. agricultural
production.
Total funding provided under this program for 2015 was set at $1,000,000. Therefore, the
amount allocated to dairy production under this program is $105,400.
303 FY 2017 Budget Summary, U.S. Department of Agriculture, pg 29

PART I
172
H. Trade Adjustment Assistance for Farmers (Budget Code 12-1406-0-1-351)304
(a) Program Description305
The American Recovery and Reinvestment Act (ARRA) of 2009 reauthorized and modified
the Trade Adjustment Assistance (TAA) for Farmers program. The TAA for Farmers program
helps producers of raw agricultural commodities and fishermen adjust to a changing economic
environment associated with import competition through technical assistance and cash benefits.
If you are a producer of a commodity who has recently suffered a greater than 15% decrease in
the national average price, the quantity of production, value of production, or cash receipts
compared to the average of the three preceding marketing years, and imports contributed
importantly to this decline, then you may be eligible to receive free information, technical
assistance, and cash payments to develop and implement Business Adjustment Plans from the
TAA for Farmers program.
(b) WTO Consistency
This is a domestic support program that provides technical assistance and direct payments to
producers who have been adversely affected by import competition, as defined by the Secretary
of Agriculture. While the support provided would constitute a domestic subsidy, it is not clear
that the support would be included in the U.S. AMS.
The program provides two distinct types of support. The free technical assistance would likely
be excluded from the U.S. AMS on the basis that it falls within the class of General Services
excluded from the AMS and reduction commitments pursuant to Annex 2(2) of the Agreement
on Agriculture. However, it is necessary to consider these programs on a case-by-case basis.
The cash benefits would constitute direct payments to producers and would not be excluded from
the U.S. AMS. Annex 2(5) to the Agreement on Agriculture provides that direct payments can
304 FY 2017 Appendix Budget, U.S. Department of Agriculture, pg 152 305 Congressional Research Service (CRS), Trade Adjustment Assistance for Farmers, August 1, 2016 (R40206)

PART I
173
be exempt from reduction commitments if they meet the requirements of Annex 2(1) and Annex
2(6). Annex 2(1) allows domestic support that has little or no trade distorting effects or effects
on production to be exempted from reduction commitments.
Annex 2(6), which sets out the qualifications for decoupled income support, allows direct
payments to be made on the basis of clearly-defined criteria such as income, status as a producer
or landowner, factor use or production level in a defined and fixed base period. However, Annex
2(6)(c) provides that the amount of payments shall not be related to or based on international or
domestic prices. In fact, none of the criteria set out in Annex 2(6) appear to permit the U.S. to
exempt direct payments made to counteract the effect of import competition. Nor does the
program appear to fit Annex 2(9) or Annex 2(10), but Annex 2(11) could be examined. Indeed,
these might be considered to be import replacement subsidies which are prohibited under Article
3.1(b) of the Subsidies and Countervailing Measures Agreement.
Therefore, whether or not the payments at issue would have trade or production effects, Annex
2(6) would not allow them to be exempted from the U.S. AMS and domestic support reduction
commitments.
(c) Program Level
The FY 2017 Budget reports actual and estimated expenditures as follows:306
2015 (Actual) $20,000,000
2016 (Estimate) ---307
2017(Budget) ---
306 FY 2017 Appendix Budget, U.S. Department of Agriculture, pg 152 307 The 2016 and 2017 Budget did not request funding for the program.

PART I
174
(d) Allocation to Dairy
This program does not provide benefits exclusively to dairy producers. Consequently, we cannot
attribute the entire value of the support provided under these programs to U.S. dairy producers.
Therefore, the value of the subsidies and support that benefits dairy production under these
programs is attributed on the basis of dairy’s share of the total value of U.S. agricultural
production. In 2015, all dairy production accounted for 10.54% of total U.S. agricultural
production.
Trade and Adjustment Assistance (TAA) for Farmers was reauthorized and modified by the
American Recovery and Reinvestment Act of 2009 as established by Subtitle C of Title I of the
Trade Act of 2002, which amended the Trade Act of 1974. The FY 2017 Appendix Budget does
not request funding for the program.308
Total expenditures under this program were $20,000,000 in 2015. Based on dairy’s share of total
U.S. agricultural production, the allocation to dairy is $2,108,000.
308 FY 2017 Appendix Budget, U.S. Department of Agriculture, pg 152

PART I
175
IV. International Food Assistance
The United States provides international food assistance under a number of programs
administered by the Foreign Agricultural Service and supported by the Commodity Credit
Corporation. Although he United States describes these as donation programs, in fact they have
been used to remove surplus product from the U.S. market and as a means of supporting U.S.
producers and prices.
The FY 2017Budget Summary for the U.S. Department of Agriculture reports the following
program level expenditures on account of U.S. international Foreign Food Assistance:309
2009 (Enacted) $2,056,000,000
2010 (Budget) $2,064,000,000
2011 (Budget) $2,097,000,000 310
U.S. Foreign Food Assistance provides important support to U.S. agricultural producers. This
support is not provided exclusively to dairy producers, therefore, the amount of support to dairy
provided through these expenditures is determined on the basis of dairy’s share of total U.S.
agricultural production.
We note however that USDA specifically mentioned in the FY 2017 Budget:
“The CCC Charter Act also authorizes the sale of agricultural commodities to other government agencies and to foreign governments and the donation of food to domestic, foreign, or international relief agencies. In addition, CCC assists in the development of new domestic and foreign markets and marketing facilities for agricultural commodities.”311
In 2015, dairy represented 10.54% of the total value of U.S. agricultural production. Therefore,
of the $2,056,000,000 expended on Foreign Food Assistance in 2015, $216,702,400 is allocated 309 FY 2017 Budget Summary, U.S. Department of Agriculture, pg 107 310 Ibid., pg 110 311 United States Department of Agriculture, Farm Service Agency, Fact Sheet, Commodity Credit Corporation, October 2015, pg 1

PART I
176
to support to dairy production. However, it is likely that because dairy products are an important
CCC commodity, this methodology may understate the benefits to dairy producers.

PART I
177
A. Public Law 480 (P.L. 480) also known as Food for Peace Act312
(a) Program Description
U.S. support for overseas food aid was formalized in the Agricultural Trade Development and
assistance Act of 1954, also known as P.L. 480 Food for Peace.313 P.L. 480 was developed in
line with the U.S. Policy of using its agricultural productivity to enhance the food security of
developing countries and the determination of the importing country’s capacity of improving its
food security.
P.L. 480 consists of three food aid titles:
Title I provides for sales of U.S. agricultural commodities on concessional credit terms to
governments and private entities in developing countries. In allocating assistance under
the Title I program, priority is given to agreements that provide for the export of U.S.
agricultural commodities to those developing countries which have demonstrated the
potential to become commercial markets, are undertaking measures to improve their food
security and agricultural development, and demonstrate the greatest need for food. Under
Title I, the U.S. Agriculture Secretary determines the value allocated to partner-countries
of the U.S., and with the recipient government, the commodity involved. Payment for the
commodities is expected over 30 years with a grace period of five years.314 The U.S.
Department of Agriculture (USDA) administers Title I.
Title II involves donations to governments, through public or private agencies, to meet
humanitarian food needs of recipient governments. The majority of assistance is provided
through private voluntary organizations, cooperatives, or international organizations,
primarily the World Food Program of the United Nations. In the case of donations made
in response to emergency needs, Title II assistance can also be provided through
312 Department of Agriculture, The Budget for Fiscal Year 2017, pg 152 313 Ibid., pg 152 314 Ibid., pg 32

PART I
178
government-to-government agreements. The Foreign Agricultural Service (FAS), under
the U.S. Agency for International Development (USAID), administers Title II.
Title III involves government-to-government grants aimed at supporting economic
development needs of least developed countries. The Foreign Agricultural Service (FAS),
under the U.S. Agency for International Development (USAID), administers Title III.
In recent years, this title has been inactive.315
(b) WTO Consistency
International food aid is generally provided in the form of a grant or at below market prices. The
provision of international food aid fully in grant form or on terms no less concessional than those
provided for in the Food Aid Convention is specifically addressed in Article 10(4)(c) of the
Agreement on Agriculture. Pursuant to Article 10(4), so long as donors of international food aid
ensure that the food aid is not tied directly or indirectly to commercial exports, is carried out in
accordance with the Food and Agriculture Organization’s (FAO) “Principles of Surplus Disposal
and Consultative Obligations” or, if appropriate, the Usual Marketing Requirements, and if the
support is provided in grant form or on concessional terms, the provision of international food
aid does not circumvent export subsidy commitments. However, if food aid does not meet these
conditions, it will constitute an export subsidy for purposes of the Agreement on Subsidies and
Countervailing Measures and the Agreement on Agriculture.
Consequently, it is possible to provide food aid in a manner that either violates or conforms to
WTO obligations. Indeed, U.S. food aid practices have been criticized by a number of
participants in the WTO Doha Development Round negotiations.316 Whether the provision of
international food aid violates the export subsidy commitments in the Agreement on Agriculture
must be determined on a case-by-case basis. 315 www.fas.usda.gov/sites/default/files/2017-01/8229000_59_fy_15_ifar.pdf 316 Inside U.S. Trade, May 21, 2004, “Commodity Groups Wrestling with Terms for Export Credits, Food Aid” Inside U.S. Trade, June 18, 2004, “Grassley Goodlatte Sound Warnings on Food Aid Restrictions” Inside U.S. Trade, July 2, 2004, “U.S. Officials Signal Food Aid Safe For Now in WTO Talks”. Inside U.S. Trade, July 23, 2004, “U.S. Looking to Change WTO Draft as Language Threatens U.S. Food Aid”

PART I
179
The WTO Ministerial decision on Export Competition of 19 December 2015 spells out
obligations as follows:
22. Members reaffirm their commitment to maintain an adequate level of international food aid, to take account of the interests of food aid recipients and to ensure that the disciplines contained hereafter do not unintentionally impede the delivery of food aid provided to deal with emergency situations. To meet the objective of preventing or minimizing commercial displacement, Members shall ensure that international food aid is provided in full conformity with the disciplines specified in paragraphs 23 to 32, thereby contributing to the objective of preventing commercial displacement. 23. Members shall ensure that all international food aid is:
a. needs-driven; b. in fully grant form; c. not tied directly or indirectly to commercial exports of agricultural products or other goods and services; d. not linked to the market development objectives of donor Members; and that e. agricultural products provided as international food aid shall not be re-exported in
any form, except where the agricultural products were not permitted entry into the recipient country, the agricultural products were determined inappropriate or no longer needed for the purpose for which they were received in the recipient country, or re-exportation is necessary for logistical reasons to expedite the provision of food aid for another country in an emergency situation. Any re-exportation in accordance with this subparagraph shall be conducted in a manner that does not unduly impact established, functioning commercial markets of agricultural commodities in the countries to which the food aid is re-exported.
24. The provision of food aid shall take into account local market conditions of the same or substitute products. Members shall refrain from providing in-kind international food aid in situations where this would be reasonably foreseen to cause an adverse effect on local13 or regional production of the same or substitute products. In addition, Members shall ensure that international food aid does not unduly impact established, functioning commercial markets of agricultural commodities. 25. Where Members provide exclusively cash-based food aid, they are encouraged to continue to do so. Other Members are encouraged to provide cash-based or in-kind international food aid in emergency situations, protracted crises (as defined by the FAO), or non-emergency development/capacity building food assistance environments where recipient countries or recognized international humanitarian/food entities, such as the United Nations, have requested food assistance.

PART I
180
26. Members are also encouraged to seek to increasingly procure international food aid from local or regional sources to the extent possible, provided that the availability and prices of basic foodstuffs in these markets are not unduly compromised. 27. Members shall monetize international food aid only where there is a demonstrable need for monetization for the purpose of transport and delivery of the food assistance, or the monetization of international food aid is used to redress short and/or long term food deficit requirements or insufficient agricultural production situations which give rise to chronic hunger and malnutrition in least-developed and net food-importing developing countries. 28. Local or regional market analysis shall be completed before monetization occurs for all monetized international food aid, including consideration of the recipient country’s nutritional needs, local United Nations Agencies' market data and normal import and consumption levels of the commodity to be monetized, and consistent with Food Assistance Convention reporting. Independent third party commercial or non-profit entities will be employed to monetize in-kind international food aid to ensure open market competition for the sale of in-kind international food aid. 29. In employing these independent third party commercial or non-profit entities for the purposes of the preceding paragraph, Members shall ensure that such entities minimize or eliminate disruptions to the local or regional markets, which may include impacts on production, when international food aid is monetized. They shall ensure that the sale of commodities for food assistance purposes is conducted in a transparent, competitive and open process and through a public tender. 30. Members commit to allowing maximum flexibility to provide for all types of international food aid in order to maintain needed levels while making efforts to move toward more untied cash-based international food aid in accordance with the Food Assistance Convention. 31. Members recognize the role of government in decision-making on international food aid in their jurisdictions. Members recognize that the government of a recipient country of international food aid can opt out of the usage of monetized international food aid. 32. Members agree to review the provisions on international food aid contained in the preceding paragraphs within the regular Committee on Agriculture monitoring of the implementation of the Marrakesh Ministerial Decision of April 1994 on Measures Concerning the Possible Negative Effects of the Reform Programme on Least-developed and net food-importing developing countries.
It is not clear that this new undertaking will in fact discipline U.S. food aid practices. Recipients
of food aid are generally driven by the need to feed their populations. Paragraph 24 is very
important, it remains to be seem if it will be respected.
PART I
181
(c) Program Level
The FY 2017 Budget reports the following program level for P.L. 480 Title I Credits and Title II
Grants:317
2015 (Actual) $1,466,000,000
2016 (Estimate) $1,716,000,000
2017 (Estimate) $1,350,000,000 318
(d) Allocation to Dairy
This program does not provide benefits exclusively to dairy producers but nonfat dry milk is an
important component of CCC inventory. Consequently, we cannot attribute the entire value of
the support provided under these programs to U.S. dairy producers. Therefore, the value of the
subsidies and support that benefits dairy production under these programs is attributed on the
basis of dairy’s share of the total value of U.S. agricultural production. In 2015, all dairy
production accounted for 10.54% of total U.S. agricultural production.
The total program levels under this program were $1,466,000,000 in 2015. Based on dairy’s
share of total U.S. agricultural production, the allocation to dairy is $154,516,400.
317 Department of Agriculture, The Budget for Fiscal Year 2017, pg 152 318 Ibid., pg 152

PART I
182
B. Bill Emerson Humanitarian Trust
(a) Program Description
The Bill Emerson Humanitarian Trust is a commodity reserve designed to ensure that the United
States can meet its international food aid commitments.
(b) WTO Consistency
International food aid is generally provided in the form of a grant or at below market prices. The
provision of international food aid fully in grant form or on terms no less concessional than those
provided for in the Food Aid Convention is specifically addressed in Article 10(4)(c) of the
Agreement on Agriculture. Pursuant to Article 10(4), so long as donors of international food aid
ensure that the food aid is not tied directly or indirectly to commercial exports, is carried out in
accordance with the Food and Agriculture Organization’s “Principles of Surplus Disposal and
Consultative Obligations” or, if appropriate, the Usual Marketing Requirements, and if the
support is provided in grant form or on concessional terms, the provision of international food
aid does not circumvent export subsidy commitments. Unless food aid meets these conditions, it
will constitute an export subsidy for purposes of the Agreement on Subsidies and Countervailing
Measures and the Agreement on Agriculture.
Consequently, it is possible to provide food aid in a manner that violates or conforms to WTO
obligations. Indeed, U.S. food aid practices have been criticized by a number of participants in
the WTO Doha Development Round negotiations. Whether the provision of international food
aid violates the export subsidy commitments in the Agreement on Agriculture must be
determined on a case-by-case basis.

PART I
183
(c) Program Level
The FY 2017 Budget reports the following obligations on account of this program:319
2015 (Actual) ---
2016 (Estimate) $20,000,000
2017 (Estimate) ---
d) Allocation to Dairy
This program does not provide benefits exclusively to dairy producers. As dairy products are not
specifically included, the benefits to dairy farmers can only be indirect. Consequently, we
cannot attribute the entire value of the support provided under these programs to U.S. dairy
producers. Therefore, the value of the subsidies and support that benefits dairy production under
these programs is attributed on the basis of dairy’s share of the total value of U.S. agricultural
production. In 2009, dairy production accounted for 10.54% of total U.S. agricultural
production.
No assistance has been provided using the Trust’s authority in 2015 or to date in 2016. As of
December 31, 2015, the Trust held $261 million of cash and no commodities. In 2016,
$20 million was appropriated to reimburse CCC for the release of eligible commodities from the
Bill Emerson Humanitarian Trust.320
319 Department of Agriculture, The Budget for Fiscal Year 2017, pg 152 320 FY 2017 Budget Summary, U.S. Department of Agriculture, pg 33

PART I
184
C. Food for Progress
(a) Program Description
The Food for Progress Act of 1985 authorizes U.S. agricultural commodities to be provided to
developing countries and emerging democracies that have made commitments to introduce and
expand free enterprise in their agricultural economies. Food for Progress agreements can be
entered into with foreign governments, private voluntary organizations, nonprofit agricultural
organizations, cooperatives, or intergovernmental organizations. Agreements currently provide
for the commodities to be supplied on grant terms.
The Food for Progress authorizing statute provides for the use of CCC funding for commodity
procurement, transportation, and associated non-commodity costs for the program. The 2017
Budget assumes that $174 million of CCC funding will be used to support the Food for Progress
program, which is expected to support approximately 263,000 metric tons of commodity
assistance.321
321 Department of Agriculture, The Budget for Fiscal Year 2017, pg 33

PART I
185
(b) WTO Consistency
International food aid is generally provided in the form of a grant or at below market prices. The
provision of international food aid fully in grant form or on terms no less concessional than those
provided for in the Food Aid Convention is specifically addressed in Article 10(4)(c) of the
Agreement on Agriculture. Pursuant to Article 10(4), so long as donors of international food aid
ensure that the food aid is not tied directly or indirectly to commercial exports, is carried out in
accordance with the Food and Agriculture Organization’s “Principles of Surplus Disposal and
Consultative Obligations” or, if appropriate, the Usual Marketing Requirements, and if the
support is provided in grant form or on concessional terms, the provision of international food
aid does not circumvent export subsidy commitments. Unless food aid meets these conditions, it
will constitute an export subsidy for purposes of the Agreement on Subsidies and Countervailing
Measures and the Agreement on Agriculture.
Consequently, it is possible to provide food aid in a manner that violates or conforms to WTO
obligations. Indeed, U.S. food aid practices have been criticized by a number of participants in
the WTO Doha Development Round negotiations. Whether the provision of international food
aid violates the export subsidy commitments in the Agreement on Agriculture must be
determined on a case-by-case basis.
(c) Program Level
The FY 2017 Budget reports the following program levels for the Food for Progress Program
funded by P.L. 480 Title I and by the Commodity Credit Corporation:
2015 (Actual) $201,000,000
2016 (Estimate) $157,000,000
2017 (Estimate) $159,000,000322
(d) Allocation to Dairy
322 Ibid., pg 152
PART I
186
While nonfat dry milk is an important inventory commodity for the CCC, this program does not
provide benefits exclusively to dairy producers. Consequently, we cannot attribute the entire
value of the support provided under these programs to U.S. dairy producers. Therefore, the
value of the subsidies and support that benefits dairy production under these programs is
attributed on the basis of dairy’s share of the total value of U.S. agricultural production. In 2015,
all dairy production accounted for 10.54 % of total U.S. agricultural production.
The total program level under this program is $201,000,000 in 2015. Based on dairy’s share of
total U.S. agricultural production, the allocation to dairy is $21,185,400.

PART I
187
D. McGovern-Dole International Food for Education and Child Nutrition Program
(a) Program Description
The Farm Security and Rural Investment Act of 2002 authorizes the new McGovern-Dole
International Food for Education and Child Nutrition Program (IFEP).323 This program facilitates
the donation of U.S. agricultural commodities and associated financial and technical assistance to
carry out preschool and school feeding programs. Maternal, infant, and child nutrition programs
are also authorized under the program. The main objective of the IFEP is to improve food
security, reduce the incidence of hunger and malnutrition, and improve literacy and primary
education. The program is administered by FAS.
(b) WTO Consistency
International food aid is generally provided in the form of a grant or at below market prices. The
provision of international food aid fully in grant form or on terms no less concessional than those
provided for in the Food Aid Convention is specifically addressed in Article 10(4)(c) of the
Agreement on Agriculture. Pursuant to Article 10(4), so long as donors of international food aid
ensure that the food aid is not tied directly or indirectly to commercial exports, is carried out in
accordance with the Food and Agriculture Organization’s “Principles of Surplus Disposal and
Consultative Obligations” or, if appropriate, the Usual Marketing Requirements, and if the
support is provided in grant form or on concessional terms, the provision of international food
aid does not circumvent export subsidy commitments. Unless food aid meets these conditions, it
will constitute an export subsidy for purposes of the Agreement on Subsidies and Countervailing
Measures and the Agreement on Agriculture.
Consequently, it is possible to provide food aid in a manner that violates or conforms to WTO
obligations. Indeed, as noted earlier in this report, U.S. food aid activities have been criticized
by a number of participants in the WTO Doha Development Round negotiations. Whether the
323 FY 2017 Appendix Budget, U.S. Department of Agriculture, pg 153
PART I
188
provision of international food aid violates the export subsidy commitments in the Agreement on
Agriculture must be determined on a case-by-case basis.
(c) Program Level
The FY 2017 Budget reports the following as total budgetary authority for this program:
2015 (Actual) $192,000,000 324
2016 (Estimate) $202,000,000 325
2017 (Estimate) $182,000,000 326
(d) Allocation to Dairy
This program does not provide benefits exclusively to dairy producers. Consequently, we cannot
attribute the entire value of the support provided under these programs to U.S. dairy producers.
Therefore, the value of the subsidies and support that benefits dairy production under these
programs is attributed on the basis of dairy’s share of the total value of U.S. agricultural
production. In 2015, dairy production accounted for 10.54% of total U.S. agricultural
production.
Total program level was $192,000,000in 2015. Based on dairy’s share of total U.S. agricultural
production, the allocation to dairy is $20,236,800.
324 Ibid., pg 152 325 Ibid. 326 Ibid.

PART I
189
E. Section 416(b) Donations
(a) Program Description
Section 416(b) of the Agricultural Act of 1949 authorizes the donation of surplus CCC-owned
commodities in order to carry out programs of assistance in developing and friendly countries.
Commodities that are eligible for donation include those in inventory that have been acquired by
CCC through price support operations, or are otherwise acquired by CCC in the normal course of
its operations and which are surplus to domestic program requirements. The commodities are
made available for donation through agreements with foreign governments, private voluntary
organizations and cooperatives, and the World Food Program.327
The budget assumes that commodities acquired by CCC in the normal course of its domestic
support operations will be available for donation under section 416(b) authority. The section
416(b) program is currently not active as there are no CCC-owned commodities available at this
time.
(b) WTO Consistency
International food aid is generally provided in the form of a grant or at below market prices. The
provision of international food aid fully in grant form or on terms no less concessional than those
provided for in the Food Aid Convention is specifically addressed in Article 10(4)(c) of the
Agreement on Agriculture. Pursuant to Article 10(4), so long as donors of international food aid
ensure that the food aid is not tied directly or indirectly to commercial exports, is carried out in
accordance with the Food and Agriculture Organization’s “Principles of Surplus Disposal and
Consultative Obligations” or, if appropriate, the Usual Marketing Requirements, and if the
support is provided in grant form or on concessional terms, the provision of international food
aid does not circumvent export subsidy commitments. If food aid does not meet these
conditions, it will constitute an export subsidy for purposes of the Agreement on Subsidies and
Countervailing Measures and the Agreement on Agriculture.
327 FAS: www.fas.usda.gov/Internet/FSA_file/ftap.pdf
PART I
190
Consequently, it is possible to provide food aid in a manner that violates or conforms to WTO
obligations. Indeed, as noted earlier in this report, U.S. food aid activities have been criticized
by a number of participants in the WTO Doha Development Round negotiations. Whether the
provision of international food aid violates the export subsidy commitments in the Agreement on
Agriculture must be determined on a case-by-case basis.
(c) Program Level
The FY 2017 reports the following program levels for this program:
2015 (Actual) $201,000,000 328
2016 (Estimate) $157,000,000 329
2017 (Estimate) $159,000,000 330
(d) Allocation to Dairy
Based on the total program level, 201,000,000, dairy’s share based on it share of total U.S.
agricultural production is $21,185,400.
328 Department of Agriculture, The Budget for Fiscal Year 2017, pg 102 329 Ibid. 330 Ibid.

PART I
191
V. Agricultural Marketing Service
The Agricultural Marketing Service programs are used to support the sale of U.S. agricultural
products in domestic and international markets. Programs administered by the Agricultural
Marketing Service are delivered by the Service alone and in cooperation with state governments
and include:
(i) Marketing Services
(ii) Payments to States
(iii) Section 32 Fund Programs
(iv) Regulation of Perishable Commodity Marketing
(v) Commodity Grading Services331
These are discussed individually in the following sections.
The FY 2017 Budget Summary reports the following as the program levels for Agricultural
Marketing Service programs:
2105 (Enacted) $1,173,000,000 332
2016 (Budget) $1,202,000,000 333
2017 (Budget) $1,209,000,000 334
The amount of support provided to dairy through these expenditures can be determined on the
basis of dairy’s proportionate share of total U.S. agricultural production. In 2015, dairy
production represented 10.54% of the total value of U.S. agricultural production. Therefore, of
the $1,173,000,000expended in 2015, $123,634,200 can be allocated as to dairy production.
331 FY 2017 Budget Summary, U.S. Department of Agriculture, pg 81 332 Ibid. 333 Ibid. 334 Ibid.

PART I
192
A. Marketing Services (Budget Code 12-2500-0-1-352)335
(a) Program Description
Agricultural Marketing Service activities assist producers and handlers of agricultural
commodities by providing a variety of marketing-related services. These services include:
Market news service. – The market news program provides the agricultural community with
information pertaining to the movement of agricultural products. This nationwide service
provides daily reports on the supply, demand, and price of over 700 commodities on domestic
and foreign markets.336
Inspection, grading and standardization. – Nationally uniform standards of quality for
agricultural products are established and applied to specific lots of products to: promote
confidence between buyers and sellers; reduce hazards in marketing due to misunderstandings
and disputes arising from the use of nonstandard descriptions; and encourage better preparation
of uniform quality products for market. Grading services are provided on request for cotton and
tobacco.
Quarterly inspection of egg handlers and hatcheries is conducted to ensure the proper disposition
of shell eggs unfit for human consumption.337
(b) WTO Consistency
The marketing services administered by the Agricultural Marketing Service provide important
support to U.S. agricultural producers. Arguably the U.S. could claim the support would not be
included in the U.S. AMS and would be exempt from reduction commitments on the basis that
these are general government services pursuant to Annex 2(2) to the Agreement on Agriculture.
However, the support does promote exports and is trade distorting. It takes on expenses for the
farm sector which would fall to business in other sectors.
335 FY 2017 Appendix Budget, U.S Department of Agriculture, pg 86 336 Ibid., pg 86 337 Ibid., pg 87

PART I
193
(c) Program Level
The FY 2017 Budget Summary reports the following resources available for the marketing
services provided by the Agriculture Marketing Service:
2015 (Actual) $355,000,000 338
2016 (Budget) $357,000,000 339
2017 (Budget) $367,000,000 340
(d) Allocation to Dairy
This program does not provide benefits exclusively to dairy producers. Therefore, we cannot
attribute the entire value of the support provided under these programs to U.S. dairy producers.
Therefore, the value of the subsidies and support that benefits dairy production under these
programs is attributed on the basis of dairy’s share of the total value of U.S. agricultural
production. In 2015, all dairy production accounted for 10.54% of total U.S. agricultural
production.
Total resources available under this program were $355,000,000 in 2015. Based on dairy’s share
of total U.S. agricultural production, the allocation to dairy is $37,417,000.
338 FY 2017 Budget Summary, U.S. Department of Agriculture, pg 111 339 FY 2017 Budget Summary, U.S. Department of Agriculture 340 Ibid.

PART I
194
B. Payments to States (Budget Code 12-2501-0-1-352)341
(a) Program Description
Under this program, the Agricultural Marketing Service assists governments of states and
possessions on a matching funds basis in the planning and design of marketing facilities,
processes, and methods in cooperation with State and local governments, universities, farmer
groups, and other segments of the U.S. food industry.342
Grants are made on a matching fund basis to State departments of agriculture to carry out
specifically approved value-added programs designed to spotlight local marketing initiatives and
enhance marketing efficiency. Under this activity, specialists work with farmers, marketing
firms, and other agencies in solving marketing problems and in using research results.343
(b) WTO Consistency
This program provides support to U.S. agricultural producers through state administered
programs. The support provided through these payments would constitute domestic support, but
would not be included in the U.S. AMS and would be exempt from reduction commitments
because these would be likely deemed to be general government services, which is permissible
funding pursuant to Annex 2(2) to the Agreement on Agriculture.
341 Department of Agriculture, The Budget for Fiscal Year 2017, pg 87 342 FY 2017 Budget Summary, U.S. Department of Agriculture, pg 83 343 FY 2017 Appendix Budget, U.S. Department of Agriculture, pg 88

PART I
195
(c) Program Level
The FY 2017 Budget reports the following as the program level for the Payments to States
program:344
2015 (Enacted) $1,000,000
2016 (Budget) $1,000,000
2017 (Budget) $1,000,000
(d) Allocation to Dairy
This program does not provide benefits exclusively to dairy producers. Therefore, we cannot
attribute the entire value of the support provided under these programs to U.S. dairy producers.
Therefore, the value of the subsidies and support that benefits dairy production under these
programs is attributed on the basis of dairy’s share of the total value of U.S. agricultural
production. In 2015, all dairy production accounted for 10.54% of total U.S. agricultural
production.
Total activity under this program is $1,000,000 in 2015. Based on dairy’s share of total U.S.
agricultural production, the allocation to dairy is $105,400.
344 FY 2017 Budget Summary, U.S. Department of Agriculture, pg 88

PART I
196
C. Section 32 Funds (Funds for Strengthening Markets, Income and Supply)
(Budget Code 12-5209-0-2-605)345
(a) Program Description
Section 32 is a permanent appropriation that, since 1935, has earmarked the equivalent of 30% of
annual customs receipts to support the U.S. agriculture sector.
The purpose of the Section 32 program is three-fold: to encourage the exportation of agricultural
commodities and products, to encourage domestic consumption of agricultural products by
diverting them, and to re-establish farmers’ purchasing power by making payments in connection
with the normal production of any agricultural commodity for domestic consumption.346
(b) WTO Consistency
The Section 32 program is described as a price support program for the benefit of U.S.
agricultural producers.347 Thus, the payments provided under this program would constitute
domestic support that is not exempt from reduction commitments. Pursuant to Annex 2(1)(b) of
the WTO Agreement on Agriculture, domestic support that has the effect of providing price
support is to be included in domestic support and be subject to reduction commitments. Thus,
the support provided under this program should be included in the U.S. AMS and be subject to
reduction commitments.
345 FY 2017 Appendix Budget, U.S. Department of Agriculture, pg 89 346 FY 2017 Budget Summary, U.S. Department of Agriculture, pg 83 347 FY 2005 Budget Summary, U.S. Department of Agriculture, pg 85

PART I
197
(c) Program Level
The FY 2017 Budget Summary reports the following as total program levels for the Section 32
Funds program:
2015 (Enacted) $818,000,000 348
2016 (Budget) $845,000,000 349
2017 (Budget) $1,153,000,000 350
(d) Allocation to Dairy
This program does not provide benefits exclusively to dairy producers. Therefore, we cannot
attribute the entire value of the support provided under these programs to U.S. dairy producers.
Therefore, the value of the subsidies and support that benefits dairy production under these
programs is attributed on the basis of dairy’s share of the total value of U.S. agricultural
production. In 2015, all dairy production accounted for 10.54% of total U.S. agricultural
production.
The program level under this program was $818,000,000 in 2015. Based on dairy’s share of
total U.S. agricultural production, the allocation to dairy is $86,217,200
348 FY 2017 Appendix Budget, U.S. Department of Agriculture, pg 89 349 Ibid. 350 Ibid.

PART I
198
D. Perishable Agricultural Commodities Act (Budget Code 12-5070-0-2-352)351
(a) Program Description
The Perishable Agricultural Commodities Act (PACA) is concerned with trading practices in the
marketing of fresh and frozen fruits and vegetables and prohibits unfair and fraudulent practices
and provides a means of enforcing contracts. Anyone buying or selling commercial quantities of
fruit and vegetables must be licensed by the U.S. Department of Agriculture. Through this
program, USDA seeks to regulate the interstate and foreign sale of fruits and vegetables.352
(b) WTO Consistency
This program provides market support to U.S. agricultural producers. While this program
provides domestic support, it would not likely be included in the U.S. AMS and would be
exempt from reduction commitments because the services provided are general government
services which are exempt pursuant to Annex 2(2) to the Agreement on Agriculture.
(c) Program Level
The FY 2017 Budget Summary reports the following as program levels for the Perishable
Agricultural Commodities Act Program:353
2015(Estimate) $11,000,000
2016 (Estimate) $11,000,000
2017 (Estimate) $11,000,000
This program is funded by user fees.
351 Department of Agriculture, The Budget for Fiscal Year 2017, pg 88 352 www.ams.usda.gov, February 13, 2017 353 FY 2017 Budget Summary, U.S. Department of Agriculture, pg 81

PART I
199
(d) Allocation to Dairy
This program by definition does not provide benefits to dairy producers and there is no net cost
to government. Therefore, there are no benefits to be allocated to dairy products.

PART I
200
E. Commodity Grading Services (Budget Code 12-8015-0-7-352)354
(a) Program Description
Commodity inspection and grading is provided through a cooperative agreement between the
U.S. Department of Agriculture and the Department of Agriculture of individual states. Covered
commodities include dairy products, fresh and processed fruits and vegetables, meat and meat
products, poultry, eggs, tobacco and cotton.
Fruit, vegetable, and peanut grading and inspection services are provided at shipping point,
receiving locations, and terminal markets to specify grade, count, weight, and other factors
important in quality determination.355 Products are also inspected and certified at export
warehouses for international shipments. The Inspection Service works with producers, brokers,
receivers, food processors, export marketers, and other related avenues of product movement to
inspect and certify the quality and cleanliness as the product moves through normal marketing
channels. AMS recovers the cost of these services through user fees. Based on information
available to us, there does not appear to be a net cost to the U.S. Treasury.
(b) WTO Consistency
The grading program provides support to U.S. agricultural producers, including dairy products.
However, since this program is funded by user fees, it is not a subsidy and WTO consistency is
not an issue.
354 Department of Agriculture, The Budget for Fiscal Year 2017, pg 91 355 agriculture.sc.gov/divisions/agricultural-services/grading-inspection, February 13, 2017

PART I
201
(c) Program Level
The FY 2017 Budget Summary reports the following program levels for the Commodity Grading
Service program: 356
2015 (Enacted) $154,000,000
2016 (Estimate) $155,000,000
2017 (Estimate) $157,000,000
These services were largely or wholly by user fees. Therefore, we have that estimated there is no
net cost to government.
(d) Allocation to Dairy
While this program, by its coverage, is specifically directed, inter alia, at dairy products, there
are no benefits to be allocated as this program is funded by user fees.
356 FY 2017 Budget Summary, U.S. Department of Agriculture, pg 81

PART I
202
F. Milk Market Orders Assessment Fund (Budget Code 12-8412-0-8-351)357
(a) Program Description
The Secretary of Agriculture issues Federal Milk Marketing Orders to establishing the minimum
prices that handlers are required to pay for milk purchased from producers. There are currently
10 federally-sanctioned milk market orders in operation.358
(b) WTO Consistency
Milk Marketing Orders are issued to establish minimum prices for milk purchased by handlers
from producers. Consequently, as these orders result in producer price support, the funds
expended to administer this program should be included in domestic support and be subject to
reduction commitments. We make no estimate of the price support effects as there is no
information available.
(c) Program Level
The FY 2017 Budget reports the following as the new (gross) budget authorities to support this
program:359
2015 (Actual) $52,000,000
2016 (Estimate) $59,000,000
2017 (Estimate) $60,000,000
357 Department of Agriculture, The Budget for Fiscal Year 2017, pg 91 358 Ibid. 359 Ibid.

PART I
203
(d) Allocation to Dairy
The Milk Marketing Orders program is intended to benefit U.S. dairy producers. Accordingly,
100% of the $52,000,000 in budget authority for administering this program in 2015 are
allocated to dairy production.
As noted above, we do not have the information necessary to calculate any price support benefits
which may be included in AMS Pursuant to Annex 3(8) of the Agreement on Agriculture.
Therefore the allocation of benefits to dairy producers under this program appears to be
understated but is unmeasurable based on information available to us.
PART I
204
VI. Conservation Programs
Conservation programs administered by FSA and NRCS are funded through the CCC. These
programs help farmers adopt and maintain conservation systems that protect water and air
quality reduce soil erosion, protect and enhance wildlife habitat and wetlands, conserve water,
and sequester carbon.360
The United States Department of Agriculture Farm Service Agency (FSA) oversees a number of
voluntary conservation-related programs. These programs work to address a large number of
farming and ranching related conservation issues including:
• Drinking water protection
• Reducing soil erosion
• Wildlife habitat preservation
• Preservation and restoration of forests and wetlands
• Aiding farmers whose farms are damaged by natural disasters
FSA accomplishes these goals through the conservation programs listed below:361
• Conservation Reserve Program
• Conservation Reserve Enhancement Program
• Emergency Conservation Program
• Emergency Forest Restoration Program
• Farmable Wetlands Program
• Grassland Reserve Program
• Source Water Protection Program
360 USDA, Natural Resources Conservation Service, Programs https://www.nrcs.usda.gov/wps/portal/nrcs/main/national/programs/ 361 USDA, Farm Service Agency, Conservation Programs https://www.fsa.usda.gov/programs-and-services/conservation-programs/index

PART I
205
The FY 2017 Budget Summary reports the following as total program level for all programs
administered by the Natural Resources Conservation Service, including programs funded by the
Commodity Credit Corporation:362
2015 (Enacted) $4,125,000,000
2016 (Budget) $4,126,000,000
2017 (Budget) $4,745,000,000
The support provided through these programs is not provided exclusively for the benefit of dairy
producers, therefore, the total value of these programs to dairy producers is determined on the
basis of dairy’s share of total U.S. agricultural production. In 2015 dairy represented 10.54% of
the total value of U.S. agricultural production. Therefore, of the $4,125,000,000 expended on
conservation programs administered by the Natural Resources Conservation Service in 2015,
$434,775,000can be allocated as support for dairy production.
362 FY 2017 Budget Summary, U.S. Department of Agriculture, pg 108

PART I
206
A. Conservation Reserve Program (CRP) (Budget Code 12-4336-0-3-999.0036)363
(a) Program Description
The Conservation Reserve Program is USDA’s largest conservation/environmental program.
The purpose of the Conservation Reserve Program is to assist farm owners and operators in
conserving and improving soil, water, air, and wildlife resources by retiring environmentally
sensitive land from agricultural production and keeping it under long-term resource-conserving
cover. Participants enroll acreage for periods of 10 to 15 years in return for annual rental
payments and cost-share and technical assistance for installing approved conservation practices.
The 2014 Farm Bill reauthorized CRP through September 30, 2018, and replaced the previous
32 million acre enrollment cap with caps declining to 24 million acres in 2017 and 2018.
(b) WTO Consistency
The Conservation Reserve Program provides support to dairy producers. However, because it
appears that it has little or no trade-distorting effect, pursuant to the exclusions in Annex 2(1) to
the Agreement on Agriculture and on the basis that it is a structural adjustment program designed
to take land out of agricultural production, this support need not be included in the U.S. AMS.
(c) Program Level
The FY 2017 Summary reports the following as total budgetary authority available to support the
obligations under this program:364
2015 (Enacted) $1,736,000,000
2016 (Estimate) $1,836,000,000
2017 (Budget) $1,917,000,000
363 Department of Agriculture, The Budget for Fiscal Year 2017, pg 102 364 FY 2017 Budget Summary, U.S. Department of Agriculture, pg 24

PART I
207
(d) Allocation to Dairy
This program does not provide benefits exclusively to dairy producers. Consequently, we cannot
attribute the entire value of the support provided under these programs to U.S. dairy producers.
Therefore, the value of the subsidies and support that benefits dairy production under these
programs is attributed on the basis of dairy’s share of the total value of U.S. agricultural
production. In 2015, all dairy production accounted for 10.54% of total U.S. agricultural
production.
Total obligations under this program were $1,736,000,000 in 2015. Based on dairy’s share of
total U.S. agricultural production, the allocation to dairy is $182,974,400. Please note that this
sub-account is included in the Commodity Credit Corporation Account (Budget Code 12-4336-
0-3-999.00.37)

PART I
208
B. Emergency Conservation Program365 (Budget Code 12-3316-0-1-453)366
(a) Program Description
The Emergency Conservation Program provides emergency funding to restore farmland
damaged by natural disaster and in carrying out emergency water conservation measures during
periods of severe drought. The objective is to restore farmland to productive use. In particular,
the program is intended to address problems that, if left untreated, would impair or endanger
land, materially affect its productive capacity and would require Federal assistance for
rehabilitation.
(b) WTO Consistency
This program clearly benefits U.S. farmers, including dairy farmers. However, support provided
under the Emergency Conservation Program arguably should not be included in the U.S. AMS
and should be exempt from domestic support reduction commitments on the basis that these are
payments by government for relief from natural disasters as envisaged in Annex 2(8) to the
Agreement on Agriculture.
(c) Program Level
The FY 2017 Budget reports the following as total budgetary authority available to support the
obligations under this program:367
2015 (Actual) $24,000,000
2016 (Estimate) $54,000,000
2017 (Estimate) $31,000,000
(d) Allocation to Dairy 365 USDA Fact Sheet, Release No. fs0199.04, pg 2 of 7 366 Department of Agriculture, The Budget for Fiscal Year 2017, pg 97 367 Ibid.

PART I
209
While this program is exempt from AMS, it nonetheless provides support to farmers in the U.S.
It does not provide benefits that could be claimed to be exclusive to dairy producers.
Consequently, we cannot attribute the entire value of the support provided under these programs
to U.S. dairy producers. Therefore, the value of the subsidies and support that benefits dairy
production under these programs is attributed on the basis of dairy’s share of the total value of
U.S. agricultural production. In 2015, all dairy production accounted for 10.54% of total U.S.
agricultural production.
The budgetary authority under this program was $24,000,000 in 2015. Based on dairy’s share of
total U.S. agricultural production, the allocation to dairy is $2,529,600.

PART I
210
C. Environmental Quality Incentives Program368 (Budget Code 12-1004-0-1-
302.00.02)369
(a) Program Description
Environmental Quality Incentives Program (EQIP) – EQIP provides assistance to landowners
who face serious natural resource challenges (such as soil erosion, air quality, water quality and
quantity, and the sustainability of fish and wildlife habitat) that impact soil, water and related
natural resources, including grazing lands, wetlands, and wildlife habitat. EQIP implementation
will continue to be targeted to acres with the highest conservation benefit. The 2014 Farm Bill
re-authorized this program through 2018. In addition, the 2014 Farm Bill moved under EQIP the
activities of the Wildlife Habitat Incentive Program, a program that provided financial and
technical assistance to eligible participants to develop habitats for upland and wetland wildlife,
threatened and endangered species, fish, and other types of wildlife. The Agricultural Water
Enhancement Program, which was operated under EQIP, was repealed by the 2014 Farm Bill,
and its functions were moved to the Regional Conservation Partnership Program.
EQIP, along with the Agricultural Conservation Easement Program, has been critical for the
success of key landscape scale initiatives.370
(b) WTO Consistency
It may be argued that support provided under the Environmental Quality Incentives Program
(EQIP) should not be included in the U.S. AMS and should be exempt from domestic support
reduction commitments on the basis that these are payments by government made under an
environmental program for purposes of Annex 2(12) to the Agreement on Agriculture.
However, each case must be judged on its own merits. Annex 2(12)b provides that the
contributions should be limited to costs of compliance with government programs. This criterion
would not appear to be met if the initiatives are voluntary.
368 USDA Fact Sheet, Release No. fs0199.04, pg 3 of 7 369 Department of Agriculture, The Budget for Fiscal Year 2017, pg 144 370 FY 2017 Budget Summary, U.S. Department of Agriculture, pg 66

PART I
211
(c) Program Level
The FY 2017 Budget Summary reports the following as total program level for EQIP:371
2015 (Enacted) $1,347,000,000
2016 (Estimate) $1,329,000,000
2017 (Estimate) $1,650,000,000
(d) Allocation to Dairy
This program does not provide benefits exclusively to dairy producers. Consequently, we cannot
attribute the entire value of the support provided under these programs to U.S. dairy producers.
Therefore, the value of the subsidies and support that benefits dairy production under these
programs is attributed on the basis of dairy’s share of the total value of U.S. agricultural
production. In 2015, all dairy production accounted for 10.54% of total U.S. agricultural
production.
The program level in FY 2015 was $1,347,000,000 for this program. Based on dairy’s share of
total U.S. agricultural production, the allocation to dairy is $141,973,800. Given the focus of
this program on animal waste, irrigation water management (cows consume a lot of water) and
conservation of grazing land, this would appear to be a very conservative allocation.
371 FY 2017Budget Summary, U.S. Department of Agriculture, pg 63

PART I
212
D. Conservation Operations (Budget Code 12-1000-0-1-302)372
(a) Program Description
Conservation Operations which includes Conservation Technical Assistance Program, assists
locally-led voluntary conservation, improve and sustain natural resources. Technical assistance
is for planning and implementing natural resource solutions to reduce erosion, improve soil
health, improve water quantity and quality, improve and conserve wetlands, enhance fish and
wildlife habitat, improve air quality, improve pasture and range health, reduce upstream
flooding, improve woodlands, and address other natural resource issues. A primary objective of
the Program is to maintain agricultural productivity and water quality.
Conservation Technical Assistance comprises the largest portion of the Conservation Operations
program, accounting for $748 million of the $876 million budget for FY 2017.373
(b) WTO Consistency
It may be argued that support provided under Conservation Operations should not be included in
the U.S. AMS and should be exempt from domestic support reduction commitments on the basis
that these are payments by government to support conservation efforts for purposes of Annex
2(12) to the Agreement on Agriculture. However, Annex 2(12)b provides that such funding
must be related to and not exceed the cost of compliance with government programs. This
exclusion does not appear to extend to voluntary conservation which arguably are not required to
“comply” with any government program.
372 Department of Agriculture, The Budget for Fiscal Year 2017, pg 112 373 FY 2017 Budget Summary, U.S. Department of Agriculture, pg 63

PART I
213
(c) Program Level
The FY 2017 Budget reports the following as total budgetary authority available to support the
obligations under this program:374
2015 (Enacted) $846,000,000
2016 (Estimate) $851,000,000
2017 (Estimate) $1,894,000,000
(d) Allocation to Dairy
This program does not provide benefits exclusively to dairy producers. Consequently, we cannot
attribute the entire value of the support provided under these programs to U.S. dairy producers.
Therefore, the value of the subsidies and support that benefits dairy production under these
programs is attributed on the basis of dairy’s share of the total value of U.S. agricultural
production. In 2015, all dairy production accounted for 10.54% of total U.S. agricultural
production.
The budgetary authority under this program is $846,000,000 in 2015. Based on dairy’s share of
total U.S. agricultural production, the allocation to dairy is $89,168,400.
374 Department of Agriculture, The Budget for Fiscal Year 2017, pg 113
PART I
214
E. Conservation Reserve Program Technical Assistance (CRP) (Budget 12-4336-0-
3-999.00.52)375
(a) Program Description
The NRCS provides technical support including land eligibility determinations, conservation
planning and practice implementation for the Conservation Reserve Program (CRP). The 2017
budget assumes $50 million in technical assistance for NRCS support of CRP.376
(b) WTO Consistency
Support provided under the CRP should not be included in the U.S. AMS and should be exempt
from domestic support reduction commitments on the basis that these are payments by
government on account of environmental programs for purposes of Annex 2(12) to the
Agreement on Agriculture.
(c) Program Level and Allocation to Dairy
The FY 2017Budget reports the 2015 program level for the Conservation Reserve Program
Technical Assistance as $7,000,000.377
Assuming that dairy’s share of the total value of U.S. agricultural production remains constant, it
would be possible to determine the portion of support provided to this program that should be
allocated to dairy producers. In 2015 dairy production represented 10.54% of the total value of
U.S. agricultural production. If this proportion remains constant, then of the $7,000,000
budgeted program level, $737,800 would be allocated to dairy production.
375 Ibid., pg 109 376 FY 2017 Appendix Budget, U.S. Department of Agriculture, pg 115 377 Department of Agriculture, The Budget for Fiscal Year 2017, pg 102

PART I
215
F. Agricultural Management Assistance (AMA) (Budget Code 12-1004-0-1-302.00.10)378
(a) Program Description
This program provides cost-shared assistance to agricultural producers to address risk
management concerns linked to water management, water quality and erosion control issues.
Support is available in not less than ten and not more than 16 states where participation in the
Federal Crop Insurance program is historically low (Connecticut, Delaware, Hawaii, Maine,
Maryland, Massachusetts, Nevada, New Hampshire, New Jersey, New York, Pennsylvania,
Rhode Island, Utah, Vermont, West Virginia and Wyoming).379
This program is authorized by Section 524(b) of the Federal Crop Insurance Act (7 U.S.C.
1524(b)), as amended. It authorizes $10 million annually for the program, of which NRCS is to
receive 50 percent. This program is implemented by NRCS, the Agricultural Marketing Service,
and the Risk Management Agency. The NRCS AMA activities are carried out in 16 states in
which participation in the Federal Crop Insurance Program is historically low.
The program provides assistance to producers to mitigate financial risk by using conservation to
reduce soil erosion and improve water quality. 380
(b) WTO Consistency
Support provided under the Agricultural Management Assistance Program should be exempt
from the U.S. AMS and domestic support reduction commitments. The Agricultural
Management Assistance program is an environmental program that, pursuant to Annex 2(12) to
the Agreement on Agriculture, appears to provide support which is exempt from domestic
support reduction commitments.
378 Ibid., pg 115 379 USDA, Natural Resources Conservation Service, Agriculture Management Assistance, Introduction 380 FY 2017 Appendix Budget, U.S. Department of Agriculture, pg115
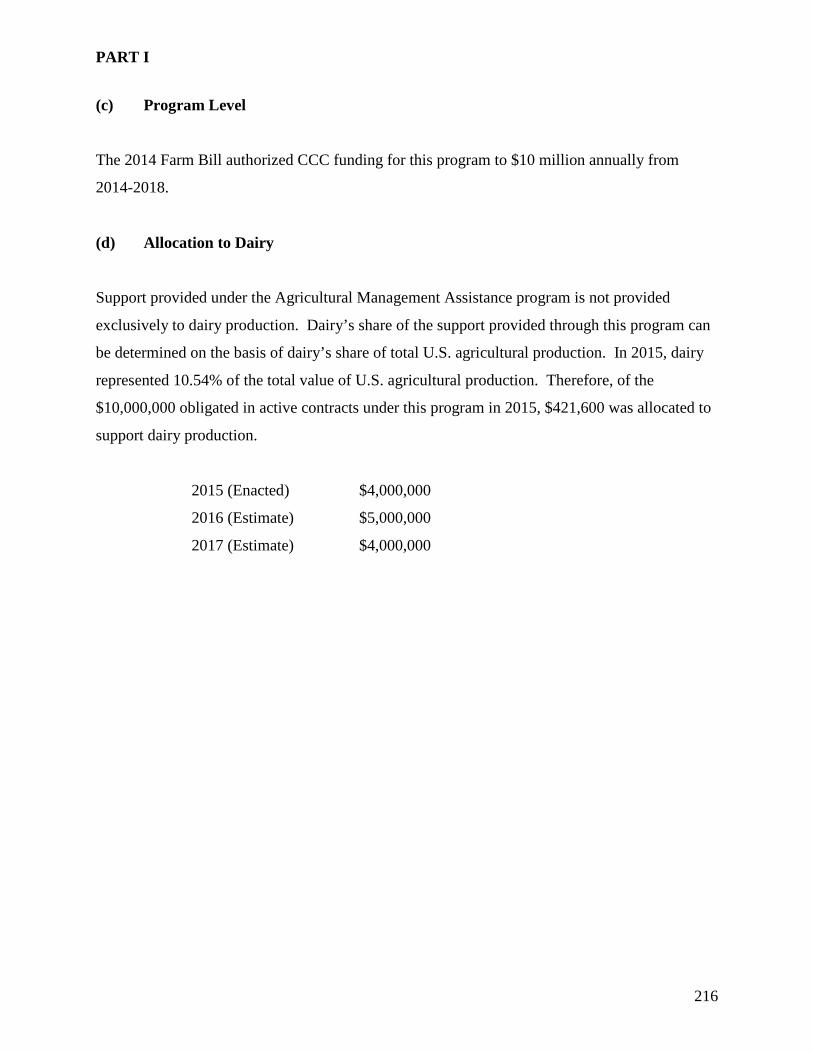
PART I
216
(c) Program Level
The 2014 Farm Bill authorized CCC funding for this program to $10 million annually from
2014-2018.
(d) Allocation to Dairy
Support provided under the Agricultural Management Assistance program is not provided
exclusively to dairy production. Dairy’s share of the support provided through this program can
be determined on the basis of dairy’s share of total U.S. agricultural production. In 2015, dairy
represented 10.54% of the total value of U.S. agricultural production. Therefore, of the
$10,000,000 obligated in active contracts under this program in 2015, $421,600 was allocated to
support dairy production.
2015 (Enacted) $4,000,000
2016 (Estimate) $5,000,000
2017 (Estimate) $4,000,000

PART I
217
G. Conservation Security Program - (Budget Code 12-1004-0-1-302-00.07)381
Conservation Stewardship Program - (Budget code 00.09 respectfully)382
(a) Program Description
Conservation Stewardship Program – This program is authorized by Section 1238D of the
Food Security Act of 1985, as amended. The Agricultural Act of 2014 reauthorized the program
through 2018, and the 2017 Budget assumes that the program extends beyond that date in the
baseline for scorekeeping purposes. The program encourages producers to address resource
concerns in a comprehensive manner by undertaking additional conservation activities and
improving, maintaining and managing existing conservation activities. The 2017 Budget
proposes to fund the program at the authorized level of $1.56 billion to enroll 10,000,000 acres.
This program is the successor to the Conservation Security Program, which was not continued in
the Food, Conservation and Energy Act of 2008 except as necessary to support contracts entered
into before September 30, 2008. The 2017 Budget proposes $5 million for the Conservation
Security Program.383
(b) WTO Consistency
It may be argued that support provided to producers through this program should be exempt from
the U.S. AMS and domestic support reduction commitments on the basis that these are payments
made under a conservation program for purposes of Annex 2(12) to the Agreement on
Agriculture. However, Annex 2(12)b limits the exemption to the cost of compliance with
government programs. This program involves voluntary initiatives.
381 Ibid., pg 115 382 Ibid. 383 FY 2017 Budget Summary, U.S. Department of Agriculture, pg 115

PART I
218
(c) Program Level
The FY 2017 Budget Summary reports the total program levels for the Conservation Security
Program and Conservation Stewardship Program as follows:384
Conservation Security Program
Conservation Stewardship
Program 2015 (Enacted) $28,000,000 (Enacted) $1,164,000,000
2016 (Estimate) $5,000,000 (Estimate) $1,225,000,000
2017 (Budget) $5,000,000 (Budget) $1,561,000,000
(d) Allocation to Dairy
The support provided through this program may not exclusively be attributed to dairy producers.
The support provided to dairy producers through this program can be allocated on the basis of
dairy’s share of total U.S. agricultural production.
In 2015, dairy production represented 10.54% of the total value of U.S. agricultural production.
Assuming that dairy’s value share of total U.S. agricultural production remains constant, dairy’s
portion of the $28,000,000 budgeted program level for FY 2015 would amount to $2,951,200 of
the Conservation Security Program. As per the Conservation Stewardship Program, dairy’s
portion of the $1,164,000,000 Budgeted program level for FY 2105 would amount to
$122,685,600.
384 Ibid., pg 63

PART I
219
H. Agricultural Conservation Easement Program (ACEP) (Budget Code 012-1004-0-1-
302)385
(a) Program Description
Agricultural land easement - under which NRCS assists eligible entities to protect agricultural
land by limiting non-agricultural uses; and wetland reserve easement - under which NRCS
provides technical and financial assistance to landowners to restore, protect and enhance
wetlands through the purchase of wetlands reserve easements. NRCS continues to maintain
existing easements and contracts formed under the previous programs.
ACEP contributes to USDA’s Strategic Goal to ensure that the Nation’s forests and private
working lands are conserved, restored, and made more resilient to climate change. ACEP’s land
easement component helps farmers and ranchers keep their land in agriculture while protecting
grazing uses and related conservation values by conserving grassland, including rangeland,
pastureland and shrubland. The wetland easement component supports habitat for fish and
wildlife, including threatened and endangered species, reducing flooding, protecting biological
diversity and providing opportunities for educational, scientific and limited recreational
activities. The program fosters public-private partnerships with landowners, Indian Tribes, State
and local governments, and nongovernmental organizations through the use of cooperative
agreements (land easements) and long term easements or 30-year contracts (wetland
easements).386
385 Department of Agriculture, The Budget for Fiscal Year 2017, pg 114 386 FY 2017 Budget Summary, Department of Agriculture, pg 67

PART I
220
ACEP consists of two components:
1) an agricultural land easement component under which NRCS assists eligible entities to
protect agricultural land by limiting non-agricultural uses of that land through the
purchase of agricultural land easements; and
2) a wetland reserve easement component under which NRCS provides financial and
technical assistance directly to landowners to restore, protect and enhance wetlands
through the purchase of wetlands reserve easements.
The program is authorized through 2018 by the Agricultural Act of 2014 as a Title XII program
under the Food Security Act of 1985. The 2017 Budget assumes that the program extends
beyond 2018 in the baseline for scorekeeping purposes. For 2017, the authorized level of funding
for ACEP is $500 million.387
The ACEP provides financial and technical assistance to help conserve agricultural lands and
wetlands and their related benefits. Under the Agricultural Land Easements component, NRCS
helps American Indian tribes, state and local governments and non-governmental organizations
protect working agricultural lands and limit non-agricultural uses of the land. Under the
Wetlands Reserve Easements component, NRCS helps to restore, protect and enhance enrolled
wetlands.
Benefits
Agricultural Land Easements protect the long-term viability of the nation’s food supply by
preventing conversion of productive working lands to non-agricultural uses. Land protected by
agricultural land easements provides additional public benefits, including environmental quality,
historic preservation, wildlife habitat and protection of open space.
387 FY 2017 Appendix Budget, U.S. Department of Agriculture, pg 115

PART I
221
Wetland Reserve Easements provide habitat for fish and wildlife, including threatened and
endangered species, improve water quality by filtering sediments and chemicals, reduce
flooding, recharge groundwater, protect biological diversity and provide opportunities for
educational, scientific and limited recreational activities.
NRCS provides financial assistance to eligible partners for purchasing Agricultural Land
Easements that protect the agricultural use and conservation values of eligible land. In the case of
working farms, the program helps farmers and ranchers keep their land in agriculture. The
program also protects grazing uses and related conservation values by conserving grassland,
including rangeland, pastureland and shrubland. Eligible partners include American Indian
tribes, state and local governments and non-governmental organizations that have farmland,
rangeland or grassland protection programs.
Under the Agricultural Land component, NRCS may contribute up to 50 percent of the fair
market value of the agricultural land easement. Where NRCS determines that grasslands of
special environmental significance will be protected, NRCS may contribute up to 75 percent of
the fair market value of the agricultural land easement.
Wetland Reserve Easements
NRCS also provides technical and financial assistance directly to private landowners and Indian
tribes to restore, protect, and enhance wetlands through the purchase of a wetland reserve
easement. For acreage owned by an Indian tribe, there is an additional enrollment option of a 30-
year contract.388
(b) WTO Consistency
Although the Agricultural Conservation Easement Program (ACEP) is described as a
conservation program intended to protect agricultural land from urban sprawl, support provided
388 USDA, Natural Resources Conservation Service, Agricultural Conservation Easement Program https://www.nrcs.usda.gov/wps/portal/nrcs/main/national/programs/easements/acep/

PART I
222
under this program should be included in the U.S. AMS and be subject to domestic support
reduction commitments.
Under this program, qualifying farmers and ranchers can assign an easement to USDA and its
partners in exchange for payment. The easement does not interfere with their use and enjoyment
of the property with the exception that it prohibits their right to convert the land to non-
agricultural use. In a very real sense, this program provides a one-time payment to producers to
ensure that they will continue to be active producers.
Domestic support programs can be exempt from inclusion in the AMS and domestic support
reduction commitments if they have minimal or no trade distorting effects or effects on
production and meet any of the specific exemptions set out in Annex 2 to the Agreement on
Agriculture.
In this case, payments preclude producers from taking the agricultural land at issue out of
production. Thus, the payment made to keep the farm or ranch land in production is a payment
intended to affect (maintain) production where there are at least potentially more economic uses
for the land. Therefore, the program has trade and production distorting effects and the support
provided under this program must be included in the U.S. AMS and is subject to domestic
support reduction commitments.
(c) Program Level
Funding for the Agricultural Conservation Easement Program is provided through the
Commodity Credit Corporation.
Also, $500 million in funding is provided to preserve land in agriculture and support habitat for
fish and wildlife through the Agricultural Conservation Easement Program (ACEP). ACEP
fosters public-private partnerships with landowners, Indian Tribes, State and local governments,
and nongovernmental organizations through the use of cooperative agreements or contracts for
easements.

PART I
223
The USDA FY 2017 Budget Summary reports the following program levels for this program:389
2015 (Actual) $394,000,000
2016 (Estimate) $419,000,000
2017 (Estimate) $500,000,000
(d) Allocation to Dairy
This program does not provide benefits exclusively to dairy producers. Consequently, we cannot
attribute the entire value of the support provided under these programs to U.S. dairy producers.
Therefore, the value of the subsidies and support that benefits dairy production under these
programs is attributed on the basis of dairy’s share of the total value of U.S. agricultural
production. In 2015, all dairy production accounted for 10.54% of total U.S. agricultural
production. Total expenditures under this program were $394,000,000 in 2015. Based on dairy’s
share of total U.S. agricultural production, the allocation to dairy is $41,527,600.
389 FY 2017 Budget Summary, U.S. Department of Agriculture, pg 63

PART I
224
I. Resource Conservation and Development (RC&D) (Budget Code 12-1010-0-1-302)390
(a) Program Description
“The Resource Conservation and Development (RC&D) Program was developed under the Soil Conservation and Domestic Allotment Act (16 U.S.C. 590a-590f); the Bankhead-Jones Farm Tenant Act (16 U.S.C. 1010 and 1011); and the Food and Agricultural Act of 1962 (P.L. 87–703). It is authorized under subtitle H, title XV of the Agricultural and Food Act of 1981 (16 U.S.C. 3451–3461), as amended. The program was permanently authorized by the Farm Security and Rural Investment Act of 2002 and further amended by the Food, Conservation, and Energy Act of 2008 (P.L. 110–246).
(b) WTO Consistency
The Resource Conservation and Development program is not a conservation program in the
truest sense because its objective is to support development and exploitation of resources. Thus,
to the extent that this program is used to increase agricultural production, it would appear to
provide a subsidy with trade and/or production distorting effects. Consequently, the support
provided through this program must be included in the U.S. AMS and is subject to domestic
support reduction commitments.
(c) Program Level
No funding was appropriated for the RC&D Program in 2016 and no funding is requested in the
2017 Budget. After decades of Federal assistance, many RC&D Councils supported by the
program have developed sufficiently strong State and local ties and are now able to secure
funding for their continued operation without the need for ongoing Federal assistance
(d) Allocation to Dairy
No funds were used for this program in 2015.
390 Department of Agriculture, The Budget for Fiscal Year 2011, pg 128

PART I
225
J. Watershed and Flood Prevention Operations (Budget Code 12-1072-0-1-301)391
(a) Program Description
NRCS watershed programs provide for cooperative actions between the Federal Government and
States and their political subdivisions to reduce damage from floodwater, sediment, and erosion;
for the conservation, development, utilization, and disposal of water; and for the conservation
and proper utilization of land. Funds in Watershed and Flood Prevention Operations can be used
for either flood prevention projects or flood damage rehabilitation efforts, depending upon the
needs and opportunities.392
Watershed and Flood Prevention Operations Program
The Watershed and Flood Prevention Operations (WFPO) Program (Watershed Operations)
includes the Flood Prevention Operations Program authorized by the Flood Control Act of 1944
(P.L. 78-534) and the provisions of the Watershed Protection and Flood Prevention Act of 1954
(P.L. 83-566). The Flood Control Act originally authorizes the Secretary of Agriculture to install
watershed improvement measures in 11 watersheds, also known as pilot watersheds, to reduce
flood, sedimentation, and erosion damage; improve the conservation, development, utilization,
and disposal of water; and advance the conservation and proper utilization of land. The
Watershed Protection and Flood Prevention Act provides for cooperation between the Federal
government and the States and their political subdivisions in a program to prevent erosion,
floodwater, and sediment damage; to further the conservation, development, utilization, and
disposal of water; and to further the conservation and proper utilization of land in authorized
watersheds.393
There are over 1,300 active or completed watershed projects. Assistance may be provided in
authorized watershed projects to install conservation practices and project measures (works of
improvement) throughout the watershed project area. The planned works of improvement are
391 Department of Agriculture, The Budget for Fiscal Year 2017, pg 116 392 FY 2017 Appendix Budget, U.S. Department of Agriculture, pg 116 393 https://www.nrcs.usda.gov/wps/portal/nrcs/main/national/programs/landscape/wfpo/

PART I
226
described in watershed project plans and are normally scheduled to be installed over multiple
years. All works of improvement, including floodwater retarding dams and reservoirs, are owned
and operated by the sponsoring local organizations and participating individuals.
The Watershed and Flood Prevention Operations (WFPO) Program provides technical and
financial assistance to States, local governments and Tribes (project sponsors) to plan and
implement authorized watershed project plans for the purpose of:
− watershed protection
− flood mitigation
− water quality improvements
− soil erosion reduction
− rural, municipal and industrial water supply
− irrigation
− water management
− sediment control
− fish and wildlife enhancement
− hydropower
Under the Watershed Program NRCS cooperates with States and local agencies to carry out
works of improvement for soil conservation and for other purposes including flood prevention;
conservation, development, utilization and disposal of water; and conservation and proper
utilization of land.
(b) WTO Consistency
Program expenditures on account of Watershed and Flood Prevention Operations appear to be
exempt from inclusion in the U.S. AMS and from domestic support reduction commitments on
the basis that these payments are in support of a conservation program as envisaged in Annex
2(12) to the Agreement on Agriculture.
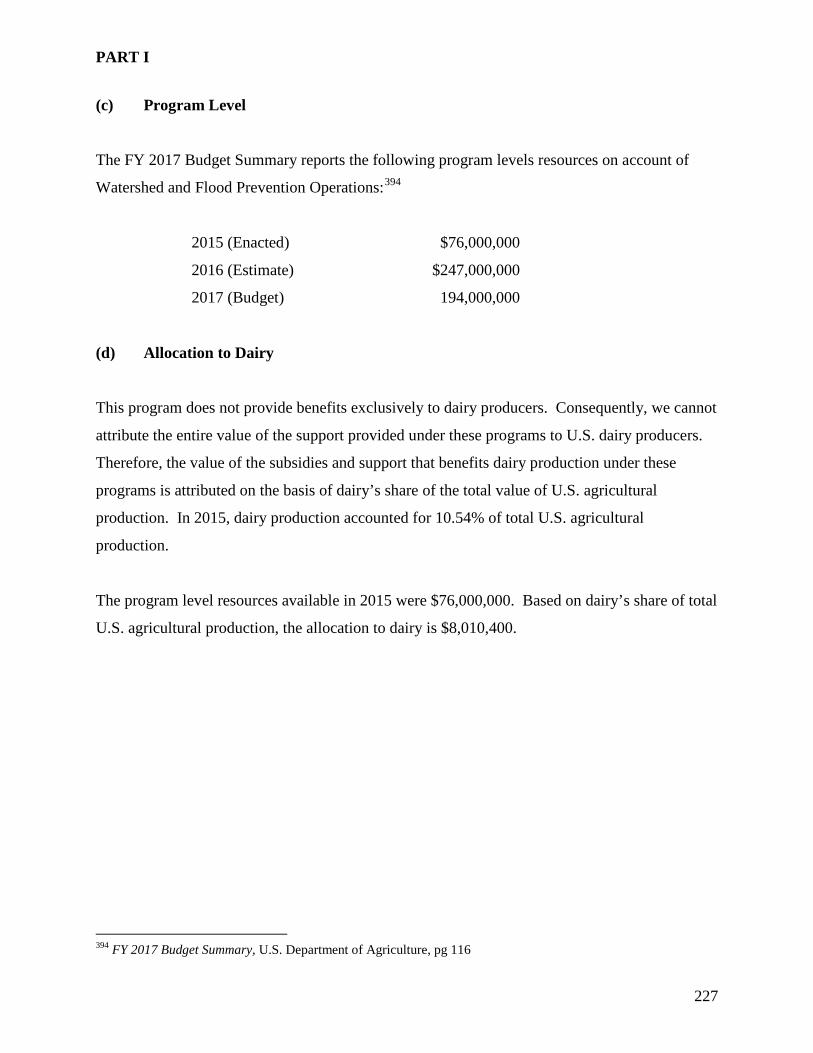
PART I
227
(c) Program Level
The FY 2017 Budget Summary reports the following program levels resources on account of
Watershed and Flood Prevention Operations:394
2015 (Enacted) $76,000,000
2016 (Estimate) $247,000,000
2017 (Budget) …...194,000,000
(d) Allocation to Dairy
This program does not provide benefits exclusively to dairy producers. Consequently, we cannot
attribute the entire value of the support provided under these programs to U.S. dairy producers.
Therefore, the value of the subsidies and support that benefits dairy production under these
programs is attributed on the basis of dairy’s share of the total value of U.S. agricultural
production. In 2015, dairy production accounted for 10.54% of total U.S. agricultural
production.
The program level resources available in 2015 were $76,000,000. Based on dairy’s share of total
U.S. agricultural production, the allocation to dairy is $8,010,400.
394 FY 2017 Budget Summary, U.S. Department of Agriculture, pg 116

PART I
228
K. Watershed Rehabilitation Program (Budget Code 12-1002-0-1-301.00.01)395
(a) Program Description
To provide technical and financial assistance to rehabilitate dams originally constructed with
assistance of USDA Watershed Programs. Rehabilitation must extend the life of the dam and
meet applicable safety and performance standards. Priority is given to dams that could result in
loss of life if the dam should fail.396
(b) WTO Consistency
This is a normal function of government delivered through USDA. Program expenditures on
account of the Watershed Rehabilitation Program should be exempt from inclusion in the U.S.
AMS and from domestic support reduction commitments on the basis that these payments are in
support of a conservation program for purposes of Annex 2(12) to the Agreement on Agriculture.
(c) Program Level
The FY 2017 Budget Summary reports the following program levels for the Watershed
Rehabilitation Program:397
2015 (Enacted) $12,000,000
2106 (Estimate) $12,000,000
2017 (Budget) ---
395 Department of Agriculture, The Budget for Fiscal Year 2011, pg 127 396 Catalogue of Federal Domestic Assistance- Watershed Rehabilitation Program www.cfda.gov/index?s=program&mode=form&tab=step1&id=d693c8121dc2af24a772b1a22ff5c6d3; January 20, 2010 397 FY 2017 Budget Summary, U.S. Department of Agriculture, pg 63

PART I
229
(d) Allocation to Dairy
This program does not provide benefits exclusively to dairy producers. Consequently, we cannot
attribute the entire value of the support provided under these programs to U.S. dairy producers.
Therefore, the value of the subsidies and support that benefits dairy production under these
programs is attributed on the basis of dairy’s share of the total value of U.S. agricultural
production. In 2015, dairy production accounted for 10.54% of total U.S. agricultural
production.
The program level under this program was $12,000,000 in 2015. Based on dairy’s share of total
U.S. agricultural production, the allocation to dairy is $1,264,800.

PART I
230
L. Regional Conservation Partnership Program (RCPP) (Budget Code 012-1004-0-1-
302)398
(a) Program Description
With authorities from the 2014 Farm Bill, NRCS has been able to more effectively deliver
conservation on a broader scale, providing additional opportunities for diverse partners to work
with NRCS to implement innovative and cooperative conservation projects. In 2015, NRCS
announced the new Regional Conservation Partnership Program (RCPP). It has so far worked to
empower local communities and private landowners to take control and identify the resource
conservation needs in their own backyards. NRCS claims that bringing new resources, new
partners and new ideas to the table, resulting in conservation outcomes that could not have been
realized without these partnerships. There are 115 RCPP projects currently being funded in all 50
States and Puerto Rico, addressing issues ranging from water quality to soil health. Together,
USDA investments and partner contributions have brought the total conservation investment
through RCPP to almost $800 million. With participating partners investing along with the
Department, USDA’s $1.2 billion investment in RCPP over the next five years can leverage an
additional $1.2 billion.399
RCPP facilitates the delivery of conservation on a broader scale, while providing additional
opportunities for diverse partners to implement innovative and cooperative conservation projects.
RCPP leverages private and public funds to implement projects across the country to improve the
Nation’s water quality, support wildlife and enhance the environment. Through RCPP, USDA
has leveraged $800 million to support 115 high-impact conservation projects across the Nation
that will improve the Nation’s water quality, support wildlife habitat and enhance the
environment.400
RCPP promotes the implementation of conservation activities by providing support for
agreements between producers and partner groups. Producers receive technical and financial
398 FY 2017 Appendix Budget, U.S. Department of Agriculture, pg 114 399 FY 2017 Budget Summary, U.S. Department of Agriculture, pg 64 400 Ibid., pg 7

PART I
231
assistance through RCPP while NRCS and its partners help producers install and maintain
conservation activities. These projects may focus on water quality and quantity, soil erosion,
wildlife habitat, drought mitigation, flood control, and other regional priorities. Partners include
producer associations, State or local governments, Indian Tribes, non-governmental
organizations, and institutions of higher education.
Under RCPP, 35 percent of the funds and acres are reserved for eight, regional-scale Critical
Conservation Areas (CCA) selected by the Secretary of Agriculture. Each of the CCAs has an
overarching goal to address priority natural resource concerns common to the CCA. Competitive
proposals CCA project selection were based on the degree to which they include multiple States
with significant agricultural production, were covered by an existing agreement or would benefit
from water quality and quantity improvement. The region’s producers need for assistance was
also considered. The CCAs include the Chesapeake Bay Watershed, Great Lakes Region,
Mississippi River Basin, Colorado River Basin, Longleaf Pine Range, Columbia River Basin,
Prairie Grasslands Region, and California Bay Delta. Of the remaining funds and acres under
RCPP, 40 percent supports projects selected through a national competitive process and 25
percent supports projects selected through a State competitive process. 401
RCPP promotes the implementation of conservation activities through agreements between
NRCS and partners and through conservation program contracts and easements with producers
and landowners. The program is authorized through 2018 by the Agricultural Act of 2014 as a
Title XII program under the Food Security Act of 1985. Through agreements between partners
and conservation program contracts or easements directly with producers and landowners, RCPP
helps implement conservation projects that may focus on water quality and quantity, soil erosion,
wildlife habitat, drought mitigation, and flood control, or other regional priorities. The 2017
Budget assumes that the program extends beyond 2018 in the baseline for scorekeeping
purposes. The authorized level of funding for RCPP is $100 million.
In addition, seven percent of the funds and acres in covered programs (ACEP, EQIP, CSP, and
HFRP) are reserved to ensure additional resources are available to carry out this program (funds
401 FY 2017 Budget Summary, U.S. Department of Agriculture, pg 67

PART I
232
and acres not committed by April 1 of each year revert back to the original program for use
under that program). 402
(b) WTO Consistency
Program expenditures under the RCPP appear to support a normal function of government. Such
program expenditures should be exempt from inclusion in the U.S. AMS and from domestic
support reduction commitments on the basis that these payments are in support of a conservation
program for purposes of Annex 2(12) to the Agreement on Agriculture.
(c) Program Level
The FY Budget Summary reports the following program levels for the Regional Conservation
Partnership Program:403
FY 2015 (Enacted) $93,000,000
FY 2016 (Estimate) $93,000,000
FY 2017(Estimate) $100,000,000
(d) Allocation to Dairy
This program does not provide benefits exclusively to dairy producers. Consequently, we cannot
attribute the entire value of the support provided under these programs to U.S. dairy producers.
Therefore, the value of the subsidies and support that benefits dairy production under these
programs is attributed on the basis of dairy’s share of the total value of U.S. agricultural
production. In 2015, all dairy production accounted for 10.54% of total U.S. agricultural
production. Total expenditures under this program were $93,000,000 in 2015. Based on dairy’s
share of total U.S. agricultural production, the allocation to dairy is $9,802,200.
402 FY 2017 Appendix Budget, U.S. Department of Agriculture, pg 115 403 FY 2017 Budget Summary, U.S. Department of Agriculture, pg 64

PART I
233
VII. Crop Insurance
Federal crop insurance is delivered to producers through private insurance companies that share
in the risk of loss and opportunity for gain. The companies are reimbursed for their delivery
expenses and receive underwriting gains in years of favorable loss experience. The costs
associated with the Federal crop insurance programs include premium subsidies, indemnity
payments (in excess of producer paid premiums), underwriting gains paid to private companies,
reimbursements to private companies for delivery expenses and other authorized expenditures.
The performance of the Federal crop insurance program is tracked on a crop year basis, which
spans multiple fiscal years. As a result, the table above reflects certain assumptions about which
fiscal year the costs or revenues fall. However, aggregate crop insurance data is available to the
public on a crop year basis, which is generally defined as the year in which a crop is harvested.
A key performance measure for the Federal crop insurance program is the normalized value of
risk protection provided by Federal Crop Insurance Corporation (FCIC) sponsored insurance –on
a crop year basis. The value of FCIC risk protection is the actual dollar insurance liability for a
given crop year. However, this value is strongly influenced by commodity price swings or
trends. The normalized value of risk protection uses a five-year baseline to smooth variations
caused by these trends. The baseline model uses the most recent crop insurance data, together
with other USDA data on market conditions, to develop normalized value projections for major
crops. 404
404 Department of Agriculture, The Budget Summary for Fiscal Year 2017, pg 27

PART I
234
A. Federal Crop Insurance Program (Budget Code 12-4085-0-3-351)405
(a) Program Description
The Federal Crop Insurance Program provides an important safety net that protects producers
from a wide range of risks caused by natural disasters, as well as the risk of price fluctuations. In
recent years, an increasing proportion of risk protection has been provided by revenue insurance
which protects against both a loss of yield and price declines. The Federal Crop Insurance
Program is a critical component of the farm safety net.
In 2009, about 70% of the liabilities were covered under revenue products which provide
protection against both a loss of yield and a decline in commodity prices.
Participation in the Federal Crop Insurance Program by producers is voluntary; however,
participation is encouraged through premium subsidies. In addition, participation in the Federal
Crop Insurance Program is required in order to participate in the supplemental agricultural
disaster assistance programs authorized in the 2008 Farm Bill.
(b) WTO Consistency
The Federal Crop Insurance plays a very important role in supporting U.S. agriculture. The
FY 2017 Appendix Budget describes the program as follows:
“The Federal crop insurance program includes products providing crop yield and revenue insurance, pasture, rangeland forage, and livestock insurance, as well as other educational and risk mitigation initiatives/tools. The Federal crop insurance program provides farmers with a risk management program that protects against agricultural production losses due to unavoidable causes such as drought, excessive moisture, hail, wind, lightning, and insects. In addition to these causes, revenue insurance programs are available to protect against loss of revenue. Federal crop insurance is available for more than 350 different commodities in over 3,066 counties covering all 50 states, and Puerto Rico.”406
405 Department of Agriculture, The Budget for Fiscal Year 2017, pg 92 406 FY 2017 Appendix Budget, U.S. Department of Agriculture, pg 93

PART I
235
As part of the safety net provided by U.S. support programs, the Federal Crop Insurance Program
provides U.S. agricultural producers with insurance subsidized at below market rate premiums
and, more importantly at rates below the cost of the insurance to the U.S. Government. This is
evident from the Premium and Subsidy and Net Income or Loss Tables set out in the FY 2017
Budget.
The Premium and Subsidy entry lists total shows premiums and total indemnities as follows:407
Producer Premium
Premium Subsidies
Total Premiums
Indemnities
2015 (Estimate) 3,645,000,000 6,016,000,000 9,661,000,000 7,245,000,000
2016 (Estimate) 3,837,000,000 6,265,000,000 10,102,000,000 10,102,000,000
2017 (Estimate) 3,998,000,000 6,507,000,000 10,505,000,000 10,505,000,000
Thus, although producers who choose to participate in this program pay premiums, the premiums
collected are not sufficient to cover all of the costs of the program. Indeed, the subsidy
significantly exceeds the premiums actually paid. As a result, the program operates at a loss, and
this loss constitutes a subsidy.
The provision of below-market rate crop insurance provides a benefit to domestic producers and,
on that basis, constitutes a domestic subsidy. The issue for consideration is whether the subsidy
provided through this program is to be included in the U.S. AMS. Government participation in
an insurance program is addressed in Annex 2(7) to the Agreement on Agriculture. Absent clear
proof the Federal Crop Insurance Program meets the requirements of Annex 2(7), the value of
the domestic subsidy provided to U.S. producers through this program would not be exempt from
U.S. domestic support reduction commitments.
(c) Program Level
407 Department of Agriculture, The Budget for Fiscal Year 2017, pg 93

PART I
236
The amount of the subsidy/benefit is the premium subsidy. This is well established by U.S. and
Canadian countervailing duty administration.
The Premium Subsidies entry lists total shows premiums as follows:408
Premium Subsidies
2015 (Estimate) 6,016,000,000
2016 (Estimate) 6,265,000,000
2017 (Estimate) 6,507,000,000
(d) Allocation to Dairy
This program does not provide benefits exclusively to dairy producers. Consequently, we cannot
attribute the entire value of the support provided under these programs to U.S. dairy producers.
Therefore, the value of the subsidies and support that benefit dairy production under these
programs is attributed on the basis of dairy’s share of the total value of U.S. agricultural
production.
Several programs with the RMA of interest to dairy and livestock producers are:
408 Department of Agriculture, The Budget for Fiscal Year 2017, pg 93

PART I
237
B. Livestock Gross Margin Insurance for Cattle
(a) Program Description
The Livestock Gross Margin for Cattle (LGM for Cattle) insurance policy provides protection
against the loss of gross margin (market value of livestock minus feeder cattle and feed costs) on
cattle. The indemnity at the end of the 11-month insurance period is the difference, if positive,
between the gross margin guarantee and the actual gross margin. The LGM for Cattle insurance
policy uses futures prices to determine the expected gross margin and the actual gross margin.
Adjustments to futures prices are state- and month-specific basis levels. The price the producer
receives at the local market is not used in these calculations.
Any producer who owns cattle in the states of Colorado, Illinois, Indiana, Iowa, Kansas,
Michigan, Minnesota, Missouri, Montana, Nebraska, Nevada, North Dakota, Ohio, Oklahoma,
South Dakota, Texas, Utah, West Virginia, Wisconsin and Wyoming is eligible for LGM for
Cattle insurance coverage.
Only cattle sold for commercial or private slaughter primarily intended for human consumption
and fed in Colorado, Illinois, Indiana, Iowa, Kansas, Michigan, Minnesota, Missouri, Montana,
Nebraska, Nevada, North Dakota, Ohio, Oklahoma, South Dakota, Texas, Utah, West Virginia,
Wisconsin and Wyoming are eligible for coverage under the LGM for Cattle insurance policy.409
There are no benefits to dairy farmers under this program.
409 www.rma.usda.gov/livestock

PART I
238
C. Livestock Gross Margin for Dairy Cattle Insurance Policy
(a) Program Description
The Livestock Gross Margin Insurance Plan for Dairy Cattle (LGM-Dairy) provides protection when feed costs rise or milk prices drop and can be tailored to any size farm. Gross margin is the market value of milk minus feed costs. LGM-Dairy uses futures prices for corn, soybean meal, and milk to determine the expected gross margin and the actual gross margin. LGM-Dairy is similar to buying both a call option to limit higher feed costs and a put option to set a floor on milk prices. Only milk sold for commercial or private sale and primarily intended for final human consumption from dairy cattle fed in the states listed below is eligible for coverage. There is no minimum number of hundredweights you can insure. The maximum amount of milk that can be insured is 24 million pounds per crop year. Prices for LGM-Dairy are based on simple averages of Chicago Mercantile Exchange Group futures contract daily settlement prices, and are not based on the prices you receive at the market. A premium subsidy is available for those policies that insure multiple months during the insurance period. The subsidy amount is determined by a dollar deductible choose (ranges from $0—$2 in $0.10 increments). If a $0 deductible is choose the producer will receive a lower premium subsidy (18 percent) and if the producer chooses the highest deductible of $2 he receives a higher premium subsidy (50 percent). The premium is due at the end of the coverage period. LGM premiums depend on your marketing plan, coverage you choose, deductible level, and futures and price volatility. LGM-Dairy is available to any producer who owns dairy cattle in the 48 contiguous states. Producers enrolled in the Farm Service Agency Margin Protection Program for Dairy (MPP-Dairy) are prohibited by law from participating in the LGM-Dairy program at the same time. The producers can sign up for LGM-Dairy 12 times each year and insure all of the milk production that he expects to market over a rolling 11-month insurance period. LGM-Dairy is sold on the last business Friday of each month.410
410 USDA, RMA, Livestock Gross Margin Insurance for Cattle, October 2015 https://www.rma.usda.gov/pubs/rme/lgmdairy.pdf

PART I
239
D. Livestock Gross Margin for Swine Insurance Policy
(a) Program Description
The Livestock Gross Margin for Swine (LGM for Swine) insurance policy provides protection
against the loss of gross margin (market value of livestock minus feed costs) on swine. The
indemnity at the end of the 6-month insurance period is the difference, if positive, between the
gross margin guarantee and the actual gross margin. The LGM for Swine insurance policy uses
futures prices to determine the expected gross margin and the actual gross margin. The price the
producer receives at the local market is not used in these calculations.
Any producer who owns swine in the 48 contiguous states is eligible for LGM for Swine
insurance coverage.
Only swine sold for commercial or private slaughter primarily intended for human consumption
and fed in the 48 contiguous states are eligible for coverage under the LGM for Swine Insurance
Policy.
LGM for Swine has two advantages features.
− Producers can sign up for LGM for Swine twelve times per year and insure all of the
swine they expect to market over a rolling 6-month insurance period. The producer does
not have to decide on the mix of options to purchase, the strike price of the options, or the
date of entry.
− The LGM for Swine policy can be tailored to any size farm. Options cover fixed amounts
of commodities and those amounts may be too large to be used in the risk management
portfolio of some farms.
PART I
240
LGM for Swine is different from traditional options in that LGM for Swine is a bundled option
that covers the cost of feed. This bundle of options effectively insures the producer’s gross
margin (swine price minus feed costs) over the insurance period.
The LGM for Swine policy can be tailored to any size farm. Options cover fixed amounts of
commodities and those amounts may be too large to be used in the risk management portfolio of
some farms.411
This program provides no benefits to dairy farmers.
411 www.rma.usda.gov/livestock

PART I
241
E. Livestock Risk Protection Feeder Cattle Insurance
Program Description
The Livestock Risk Protection Insurance Plan for Feeder Cattle (LRP-Feeder Cattle) is designed
to insure against declining market prices. The producer may choose from a variety of coverage
levels and insurance periods that match the time the feeder cattle would normally be marketed. In
some cases the ownership may be retained.
The producer may buy LRP-Feeder Cattle insurance throughout the year from Risk Management
Agency (RMA)- approved livestock insurance agents. Premium rates, coverage prices, and actual
ending values are posted online daily. The producer may choose coverage prices ranging from 70
to 100 percent of the expected ending value. At the end of the insurance period, if the actual
ending value is below the coverage price, the producer will be paid an indemnity for the
difference between the coverage price and actual ending value.
Once the application is accepted, the producer can buy specific coverage endorsements
throughout the year for up to 1,000 head of feeder cattle that are expected to weigh up to 900
pounds at the end of the insurance period.
The annual limit for LRP-Feeder Cattle is 2,000 head per producer per year (July 1 to June 30).
All insured calves and cattle must be located in a state approved for LRP-Feeder Cattle at the
time that the insurance was bought.
The length of insurance coverage available for each specific coverage endorsement is 13, 17, 21,
26, 30, 34, 39, 43, 47, or 52 weeks.
Coverage is available for:
• Calves;
• Steers;
• Heifers;

PART I
242
• Predominantly Brahman cattle; and
• Predominantly dairy cattle.
The producer may also choose from two weight ranges - under 600 pounds and 600-900 pounds.
LRP-Feeder Cattle insurance is available in: Alabama, Arizona, Arkansas, California, Colorado,
Florida, Georgia, Hawaii, Idaho, Illinois, Indiana, Iowa, Kansas, Kentucky, Louisiana, Michigan,
Minnesota, Mississippi, Missouri, Montana, Nebraska, Nevada, New Mexico, North Carolina,
North Dakota, Ohio, Oklahoma, Oregon, South Carolina, South Dakota, Tennessee, Texas, Utah,
Virginia, Washington, West Virginia, Wisconsin, and Wyoming.412
412 USDA, RMA, Livestock Risk Protection Feeder Cattle Revised, May 2014. https://www.rma.usda.gov/pubs/rme/lrp-feedercattle.pdf

PART I
243
F. Livestock Risk Protection Lamb Insurance Policy
(a) Program Description
The LRP-Lamb Insurance Policy provides protection against unexpected declines in the national
average price of slaughter lambs. An economic model is used to predict the expected price of
slaughter lambs each week. An indemnity is paid if the weekly settlement value is less than the
expected price for a specific coverage level. The weekly settlement value is a five-week average
(current week and previous four weeks) of actual national weekly average slaughter lamb prices
using weekly "calculated formula live prices”. The price that the producer actually receives for
their own lambs is not part of the calculations.
Note: The weekly "Calculated Formula Live Price" is formula prices established for previously
slaughtered lambs (carcass basis) multiplied by the weighted average dressing percent. The
weekly price data are posted by USDA's Agriculture Marketing Service (AMS) each Friday at:
http://www.ams.usda.gov/mnreports/lm_lm352.txt.
Any producer who owns lambs in the following 28 states: Arizona, California, Colorado, Iowa,
Idaho, Illinois, Indiana, Kansas, Michigan, Minnesota, Missouri, Montana, Nebraska, New
Mexico, Nevada, North Dakota, Ohio, Oklahoma, Oregon, Pennsylvania, South Dakota, Texas,
Utah, Virginia, Washington, West Virginia, Wisconsin and Wyoming, is eligible for LRP-Lamb
coverage.
Lamb provides producers and feeders of lambs with the opportunity to insure the lambs they own
against an unexpected decline in price. The LRP-Lamb Coverage Price is calculated based on a
mathematical model. Producers and feeders may continue to market their own lambs through
their own market channels and at the maximum price they can negotiate, however the actual
price received by a producer is not used with respect to the insurance.
LRP-Lamb will be offered for sale each week following the posting of rates Monday morning
through 7:00 PM central time. When Monday falls on a federal holiday, LRP-Lamb will be
offered on Tuesday during the same hours. Producers can choose between three endorsement

PART I
244
periods (13, 26, or 39 weeks) to best suit their own production and feeding systems. LRP-Lamb
insurance coverage prices and rate estimates may be available for review beginning on the
previous Friday evening. However, rates and coverage values may be modified prior to sales
beginning on Monday morning. Therefore, final rates and coverage values may differ somewhat
from the previously posted estimates.
LRP-Lamb is available through a crop insurance agent authorized to sell livestock insurance. Q:
How much coverage of the LRP-Lamb expected price can be purchased? A: Producers can
purchase as little as 80-percent coverage and as much as 95- percent coverage of the price in 5-
percent increments. Coverage prices will be listed for each coverage level for each of the
endorsements (13, 26, or 39 weeks) during the sales period each week.413
This program does not provide benefits to dairy farmers directly or indirectly.
413 www.rma.usda.gov/livestock, March 6, 2015 Livestock Risk Protection – Lamb

PART I
245
VIII. Rural Development
The Rural Development (Budget Code 12-0403-0-1-452)414 programs administered by the U.S.
Department of Agriculture provide financial and technical assistance to rural residents,
businesses and private and public entities for a variety of purposes. These include infrastructure
projects required to meet basic needs, such as drinking water and electricity. The objective of
these programs is to improve the economic opportunities and quality of life in rural America.
The Rural Development programs operated by USDA include:
I) Rural Development
(a) Rural Community Advancement Program (Budget Code 12-0400-0-1-452)
II) Rural Business – Cooperative Service
The Rural Business-Cooperative Service administers:
(a) Rural Cooperative Development Grants (Budget Code 12-1900-0-1-452)
(b) Rural Economic Development Grants (Budget Code 12-3105-0-1-452)
(c) Rural Microenterprise Investment Program Account (Budget Code 12-1955-0-1-452)
(d) Rural Business and Industry Direct Loans Financing (Budget Code 12-4223-0-3-452)
(e) Rural Business and Industry Guaranteed Loan Financing Account (Budget Code 12-4227-0-3-452)
(f) Rural Development Loan Fund Program Account (Budget Code 12-2069-0-1-452)
(g) Intermediary Relending Program Fund Account (Budget Code 12-4219-0-3-452)
(h) Rural Development Loan Fund Liquidating Account (Budget Code 12-4233-0-3-452)
414 Department of Agriculture, The Budget for Fiscal Year 2017, pg 119

PART I
246
(i) Rural Economic Development Loans Program Account (Budget Code 12-3108-0-1-452)
(j) Rural Economic Development Direct Loan Financing Account (Budget Code 12-4176-0-3-452)
(k) Rural Business Investment Programs Account (Budget Code 12-1907-0-1-452)
(l) Rural Energy for America Program (Budget Code 12-1908-0-1-451)
III) Rural Utilities Service
The Rural Utilities Service administers:
(a) High Energy Cost Grants (Budget Code 12-2042-0-1-452)
(b) Rural Water and Waste Disposal Direct Loans Financing Account (Budget Code 12-4226-0-3-452)
(c) Rural Water and Waste Water Disposal Guaranteed Loans Financing Account (Budget Code 12-4218-0-3-452)
(d) Rural Electrification and Telecommunications Loans Program (Budget Code 12-1230-0-1-271)
(e) Rural Electrification and Telecommunications Direct Loan Financing Account (Budget Code 12-4208-0-3-271)
(f) Rural Electrification and Telecommunications Guaranteed Loans Financing Account (Budget Code 12-4209-0-3-271)
(g) Rural Electrification and Telecommunications Liquidating Account (Budget Code 12-4230-0-3-999)
(h) Rural Telephone Bank Account Program (Budget Code 12-1231-0-1-452)
(i) Rural Telephone Bank Direct Loan Financing Account (Budget Code 12-4210-0-3-452)
(j) Distance Learning Telemedicine and Broadband Program (Budget Code 12-1232-0-1-452)
(k) Distance Learning, Telemedicine and Broadband Direct Loan Financing Account (Budget Code 12-4146-0-3-452)
(l) Rural Development Insurance Fund Liquidating Account (Budget Code 12-4155-0-3-452)

PART I
247
IV) Rural Housing Service
The Rural Housing Service administers:
(a) Rural Housing Assistance Grants (Budget Code 12-1953-0-1-604)
(b) Rental Assistance Program (Budget Code 12-0137-0-1-604)
(c) Multi-Family Housing Revitalization Program (Budget Code 12-2002-0-1-604)
(d) Mutual and Self Help Housing Grants (Budget Code 12-2006-0-1-604)
(e) Rural Community Facility Direct Loans Financing Account (Budget Code 12-4225-0-3-452)
(f) Rural Community Facility Guaranteed Loans Financing Account (Budget Code 12-4228-0-3-452)
(g) Rural Housing Insurance Fund Program Account (Budget Code 12-2081-0-1-371)
(h) Rural Housing Insurance Fund Direct Loan Financing Account (Budget Code 12-4215-0-3-371)
(i) Rural Housing Insurance Fund Guaranteed Loan Financing Account (Budget Code 12-4216-0-3-371)
(j) Rural Housing Insurance Fund Liquidating Account (Budget Code 12-4141-0-3-371)
The overall program levels for Rural Development programs, as reported in the FY 2017 Budget
Summary, are as follows415:
2015 (Enacted) $38,490,000,000
2016 (Estimate) $39,890,000,000
2017 (Budget) $39,785,000,000
The monies expended on account of the Rural Development programs provide indirect support to
U.S. agricultural producers. As this support is not provided exclusively to dairy producers, the
amount of support provided on account of dairy production is allocated on the basis of dairy’s
share of total U.S. agricultural production. In 2015, dairy represented 10.54% of the total value
415 FY 2017 Budget Summary, Department of Agriculture, pg 110

PART I
248
of U.S. agricultural production. Therefore, of the $38,490,000,000 expended on account of
Rural Development programs in 2015, $4,056,846,000 is allocated to dairy producers.
PART I
249
A. Rural Business – Cooperative Service
A.1 Rural Business and Industry (RB&I) Guarantee Loans (Budget Code12-4227-0-3-452)416
(a) Program Description
The Rural Business and Industry (RB&I) Guaranteed Loan Program, with the largest program
level of the RBS programs, provides protection against loan losses so that lenders are willing to
extend credit to establish, expand, or modernize rural businesses. The B&I program is
particularly important for startup businesses like local and regional food producers where
commercial lenders are new to the sector. The 2017 Budget supports a program level of $892
million in B&I loan guarantees. The total level of B&I funding will create or save 11,674 jobs.
Funding for the B&I program will focus on supporting high priority areas of the Administration
such as providing start-up capital and financing business expansion in rural areas for local and
regional food systems, biobased businesses, and renewable energy development.417
The loan guarantee may be used for business and industrial acquisitions, construction,
conversion, expansion, repair, modernization, or development costs; purchase of equipment,
machinery, or supplies; startup costs and working capital; refinancing for viable projects, under
certain conditions. The 1996 Farm Bill expanded the eligible use for RB&I Guaranteed loan
funds to the purchase of startup cooperative stock for family-sized farms where commodities are
produced to be processed by the cooperative. Ineligible loan purposes include: lines of credit,
agricultural production which is not part of an integrated business involved in processing of
agricultural products, or any project likely to transfer employment from one area to another.418
416 Department of Agriculture, The Budget for Fiscal Year 2017, pg 130 417 FY 2017 Budget Summary, U.S. Department of Agriculture, pg 38 418 www.attra.org, February 3, 2010
PART I
250
(b) WTO Consistency
The loan guarantees made under this program confer a subsidy on agricultural producers, in the
form of the loan guarantees provided at below market rates or on terms not available from
commercial lenders. The support provided through these loan guarantees may be used to
increase production and, on this basis, would not be excluded from U.S. obligations to reduce
`domestic support. Consequently, the support must be included in the U.S. AMS and be subject
to domestic support reduction commitments.
(c) Program Level
The FY 2017 Budget Summary for the Department of Agriculture reports the following
expenditures on account of this program:419
Rural Business – Cooperative Services
2015 (Enacted) $1,216,000,000
2016 (Estimate) $1,370,000,000
2017 (Estimate) $1,614,000,000
(d) Allocation to Dairy
The Rural Business Cooperative Service Loans and Grants program does not exclusively benefit
dairy producers, therefore the value of this program to dairy producers is determined on the basis
of dairy’s share of total U.S. agricultural production. In 2015, dairy accounted for 10.54% of the
total value of U.S. agricultural production. Therefore, of the $1,216,000,000 expended on
account of business and industry loan guarantees under this program, $128,166,400 is allocated
to dairy producers.
419 FY 2017 Budget Summary, U.S. Department of Agriculture, pg 110

PART I
251
A.2 Rural Housing Service (Budget Code 12-1953-0-1-604)420
(a) Program Description
Through the Rural Housing Service, the USDA provides funds, primarily in the form of loans, to
support the construction of housing for low-income families, rental assistance, community
facility programs which support the construction of fire halls, libraries and other public
buildings. Since 2009, the Rural Housing Service has financed approximately 1.1 million
homes.421
(b) WTO Consistency
These programs provide indirect support to dairy producers, but would likely not have either
trade or production distorting effects. Therefore, support provided through these programs
should not be included in the U.S. AMS or be subject to domestic support reduction
commitments.
(c) Program Level
The FY 2107 Budget Summary reports the following program levels for the account of Rural
Housing Service programs:422
2015 (Enacted) $29,054,000,000
2016 (Budget) $29,465,000,000
2017 (Budget) $29,409,000,000
420 Department of Agriculture, The Budget for Fiscal Year 2011, pg 132 421 FY 2017 Budget Summary, U.S. Department of Agriculture, pg 6 422 Ibid., pg 110

PART I
252
(d) Allocation to Dairy
The programs administered by the Rural Housing Service provide important indirect support to
dairy producers. This support is not provided exclusively to dairy producers, therefore the total
value of support to dairy producers is determined on the basis of dairy’s share of total U.S.
agricultural production. In 2015 dairy represented 10.54% of the total value of U.S. agricultural
production. Therefore, of the $29,054,000,000 expended on account of Rural Housing Service
programs in 2015, $3,062,291,600 can be attributed to support of dairy production.

PART I
253
A.3 Rural Utilities Service (Budget Code 12-2042-0-1-452)423
(a) Program Description
Through the Rural Utilities Service, USDA supports a number of rural programs including:
telecommunications; broadband internet; distance learning; telemedicine and waste and water
disposal.
(b) WTO Consistency
These programs provide indirect support to dairy producers, but would not likely have either
trade or production distorting effects. Therefore, support provided through these programs
should not be included in the U.S. AMS or be subject to domestic support reduction
commitments.
(c) Program Level
The FY 2017 Budget Summary reports the following program levels on account of Rural
Utilities Service Loans and Grants programs:424
2015 (Enacted) $7,996,000,000
2016 (Estimate) $8,829,000,000
2017 (Budget) $8,531,000,000
423 Department of Agriculture, The Budget for Fiscal Year 2017, pg 142 424 FY 2017 Budget Summary, U.S. Department of Agriculture, pg 110

PART I
254
(d) Allocation to Dairy
The programs administered by the Rural Housing Service provide important indirect support to
dairy producers. This support is not provided exclusively to dairy producers, therefore the total
value of support to dairy producers is determined on the basis of dairy’s share of total U.S.
agricultural production. In 2015, dairy represented 10.54% of the total value of U.S. agricultural
production. Therefore, of the $7,996,000,000 expended on account of Rural Housing Service
programs in 2015, $842,778,400 can be attributed to support for dairy production.

PART I
255
IX. Animal and Plant Health Inspection Services
The Animal and Plant Health Inspection Service (APHIS) (Budget Code 12-1600-0-1-352) 425
enhances the safety and protection of U.S. agriculture and of the U.S. food supply. APHIS also
enhances economic opportunities for agricultural producers. APHIS provides:
(i) inspection and quarantine services;
(ii) surveillance and monitoring of plant and animal diseases;
(iii) administration of control and eradication programs to combat plant and animal
disease outbreaks;
(iv) protection from emerging animal and plant pests and diseases from entry into U.S.426;
(v) inspection for human care and handling of animals used in research, exhibits or the
wholesale pet trade.
The major APHIS programs are:
(a) Agricultural Quarantine Inspection
(b) Plant and Animal Health Monitoring
(c) Pest and Disease Management Programs
(d) Animal Welfare
(e) Safe Trade and International Technical Assistance
425 Department of Agriculture, The Budget for Fiscal Year2017, pg 79 426 FY 2017 Appendix Budget, U.S. Department of Agriculture, pg 80

PART I
256
Program Level
The total program levels for programs administered by the Animal and Plant Health Inspection
Service are reported as follows:427
2015 (Enacted) $2,115,000,000 *
2016 (Estimate) $2,178,000,000
2017 (Budget) $1,196,000,000
(* In 2015 there was $1,007,000,000 in Emergency Funding (CCC).428)
The support provided through APHIS programs provides direct support to U.S. agricultural
production. As this support is not directed exclusively at dairy production, the amount allocated
to dairy is in proportion to dairy’s share of total U.S. agricultural production. In 2015, dairy
production accounted for 10.54% of total U.S. dairy production. Therefore, of the
$2,115,000,000 budgetary resources available for Animal and Plant Health Inspection Service
programs in 2015, $222,921,000 is allocated as support of U.S. dairy production.
427 FY 2017 Budget Summary, U.S. Department of Agriculture, pg 109 428 Ibid., pg 77

PART I
257
A. Agricultural Quarantine Inspection Fees (Budget Code 12-1600-0-1-352.00.11)429
(a) Program Description
USDA is responsible for ensuring that passengers and cargoes traveling from Hawaii and Puerto
Rico comply with specified regulations to protect the health of the agricultural sector on the
Mainland. Further, USDA retains the responsibility of promulgating regulations related to entry
of passengers and commodities into the United States. The remainder of responsibility for this
program has been transferred to Homeland Security.
(b) WTO Consistency
Expenditures by the Animal and Plant Health Inspection Service clearly provide significant
benefits to U.S. agriculture in controlling risks which could reduce agricultural production. As
these services are provided at no cost, they could constitute domestic support. However,
expenditures under these programs are a normal function of government. Such expenditures
clearly exempted from U.S. domestic support reduction commitments pursuant to Annex 2(2) to
the Agreement on Agriculture.
(c) Program Level
The FY 2017 Budget Summary reports the following program levels for the Agricultural
Quarantine Inspection Fees program:430
2015 (Enacted) $167,000,000
2016 (Estimate) $207,000,000
2017 (Budget) $219,000,000
429 Department of Agriculture, The Budget for Fiscal Year 2017, pg 79 430 FY 2017 Budget Summary, U.S. Department of Agriculture, pg 77

PART I
258
In addition to discretionary funding, APHIS collects user fees to cover costs related to
agricultural quarantine and inspections that occur at ports of entry. A portion of these collections
are provided to the Department of Homeland Security’s Customs and Border Protection (CBP) to
conduct front line inspections at points of entry. With retained funding, APHIS supports
international trade by assessing the plant and animal health risks associated with such trade.
APHIS also develops regulations to protect agricultural health; inspects and quarantines
imported plant propagative materials; trains agricultural inspectors and detector dog teams; and
provides the scientific support necessary to carry out these activities and those carried out by
CBP. 431
(d) Allocation to Dairy
The Agricultural Quarantine Inspection program provides important support to U.S. dairy
producers, but this support is not provided exclusively to dairy production. Therefore, the
support provided to dairy producers under this program is determined on the basis of dairy’s
share of total U.S. agricultural production. In 2015, dairy production represented 10.54% of the
total value of U.S. agricultural production. Therefore, of the $167,000,000 program level on
account of this program in 2015, $17,601,800 can be attributed to dairy production.
431 FY 2017 Budget Summary, U.S. Department of Agriculture, pg 80

PART I
259
B. Plant and Animal Health Monitoring (Budget Code 12-1600-0-1-352.00.01 and 02)432
(a) Program Description
APHIS is responsible for detecting and responding to agricultural health risks. APHIS works
cooperatively with other Federal, State, Tribal and industry partners to conduct animal and plant
health monitoring programs to rapidly diagnose them and determine if there is a need to establish
new pest or disease management programs
(b) WTO Consistency
Expenditures by the Animal and Plant Health Inspection Service clearly provide significant
benefits to U.S. agriculture. As these services are provided at no cost, they would constitute
domestic support. Commercial operations in the industrial sector are responsible for their own
quality central systems and the cost of running them. However, expenditures under these
programs are clearly exempted from U.S. and AMS domestic support reduction commitments
pursuant to Annex 2(2) to the Agreement on Agriculture, which envisages “Green” status for:
General services Policies in this category involve expenditures (or revenue foregone) in relation to programmes which provide services or benefits to agriculture or the rural community. They shall not involve direct payments to producers or processors. Such programmes, which include but are not restricted to the following list, shall meet the general criteria in paragraph 1 above and policy-specific conditions where set out below:
(a) research, including general research, research in connection with environmental programmes, and research programmes relating to particular products;
(b) pest and disease control, including general and product-specific pest and
disease control measures, such as early-warning systems, quarantine and eradication;
(c) training services, including both general and specialist training facilities;
432 Department of Agriculture, The Budget for Fiscal Year 2017, pg 79

PART I
260
(d) extension and advisory services, including the provision of means to facilitate the transfer of information and the results of research to producers and consumers;
(e) inspection services, including general inspection services and the
inspection of particular products for health, safety, grading or standardization purposes;
(f) marketing and promotion services, including market information, advice
and promotion relating to particular products but excluding expenditure for unspecified purposes that could be used by sellers to reduce their selling price or confer a direct economic benefit to purchasers; and
(g) infrastructural services, including: electricity reticulation, roads and other
means of transport, market and port facilities, water supply facilities, dams and drainage schemes, and infrastructural works associated with environmental programmes. In all cases the expenditure shall be directed to the provision or construction of capital works only, and shall exclude the subsidized provision of on-farm facilities other than for the reticulation of generally available public utilities. It shall not include subsidies to inputs or operating costs, or preferential user charges.
(c) Program Level
The FY 2017 Budget Summary reports the following as Total program levels for the Plant and
Animal Health Monitoring program:433
Animal Health Plant Health Total
2015 (Enacted) $288,000,000 $305,000,000 $593,000,000
2016 (Estimate) $296,000,000 $314,000,000 $610,000,000
2017 (Budget) $305,000,000 $288,000,000 $593,000,000
433 FY 2017 Budget Summary, U.S. Department of Agriculture, pg 76

PART I
261
(d) Allocation to Dairy
The Plant and Animal Health Monitoring program provides support to U.S. dairy producers, but
this support is not provided exclusively to dairy production. Therefore, the support provided to
dairy producers under this program is determined on the basis of dairy’s share of total U.S.
agricultural production. In 2015, dairy production represented 10.54% of the total value of U.S.
agricultural production. Therefore, of the $593,000,000 program level on account of this
program in 2015, $62,502,000 can be attributed to dairy production.

PART I
262
C. Pest and Disease Management Programs (Budget Code 12-1600-0-1-352.00.03)434
(a) Program Description
APHIS provides technical and financial support to help control or eradicate a variety of
agricultural threats.
(b) WTO Consistency
Expenditures by the Animal and Plant Health Inspection Service clearly provide significant
benefits to U.S. agriculture by controlling and eradicating pests which could destroy or seriously
damage agricultural crops. This is a type of prevention risk management. As these services are
provided at no cost, they could constitute domestic support. However, expenditures under these
programs are clearly exempted from U.S. domestic support reduction commitments pursuant to
Annex 2(2)(b) to the Agreement on Agriculture, because they involve pest and disease control.
(c) Program Level
The FY 2017 Budget Summary reports the following as the program levels on account of the
Pest and Disease Management program:435
Wildlife Services Pest and Disease M.P. Total
2015 (Enacted) $109,000,000 $58,000,000 $167,000,000
2016 (Estimate) $120,000,000 $58,000,000 $178,000,000
2017 (Budget) $105,000,000 $58,000,000 $163,000,000
434 Department of Agriculture, The Budget for Fiscal Year 2017, pg 79 435 FY 2011 Budget Summary, U.S. Department of Agriculture, pg 76 and 77

PART I
263
(d) Allocation to Dairy
The Pest and Disease Management program does not provide support exclusively to dairy
production. Therefore, the support provided to dairy producers under this program is determined
on the basis of dairy’s share of total U.S. agricultural production. In 2015, dairy production
represented 10.54% of the total value of U.S. agricultural production. Therefore, of the
$167,000,000 program level on account of this program in 2015, $17,601,800 can be attributed
to dairy production.

PART I
264
D. Animal Welfare (Budget Code 12-1600-0-1-352.00.07)436
(a) Program Description
The Agency conducts regulatory activities to ensure the humane care and treatment of animals,
including horses, as required by the Animal Welfare Act of 1966 as amended (7 U.S.C. 2131–
2159), and the Horse Protection Act of 1970 as amended (15 U.S.C. 1821–1831). These
activities include inspection of certain establishments that handle animals intended for research,
exhibition, and sale as pets, and monitoring of certain horse shows.437
(b) WTO Consistency
Expenditures by the Animal and Plant Health Inspection Service clearly provide significant
benefits to U.S. agriculture. As these services are provided at no cost, they could constitute
domestic support. However, expenditures under these programs are clearly exempted from U.S.
domestic support reduction commitments pursuant to Annex 2(2)(b) to the Agreement on
Agriculture because they are pest and disease control programs.
(c) Program Level
The FY 2017 Budget Summary reports the following program levels on account of the Animal
Care program:438
2017 (Enacted) $29,000,000
2016 (Estimate) $29,000,000
2017 (Budget) $29,000,000
436 Department of Agriculture, The Budget for Fiscal Year 2017, pg 79 437 Ibid., pg 80 438 FY 2017 Budget Summary, U.S. Department of Agriculture, pg 77

PART I
265
(d) Allocation to Dairy
The Animal Care program provides support to U.S. dairy producers, but this support is not
provided exclusively to dairy production. While it is likely that dairy producers benefit by more
than dairy’s 2015 10.54% share of total U.S. agricultural production, but as we have noted
elsewhere in the report, where we cannot determine specific benefits, we will use the 10.54%
factor. Therefore, of the $29,000,000 program level on account of this program in 2015,
$3,056,600 can be attributed to dairy production.

PART I
266
E. Safe Trade and International Technical Assistance (Budget Code 12-1600-0-1-
352.00.06)439
(a) Program Description
Sanitary (animal) and phytosanitary (plant) (SPS) regulations can have a significant impact on
market access for the United States as an exporter of agricultural products. APHIS plays a central
role in resolving technical trade issues to ensure the smooth and safe movement of agricultural
commodities into and out of the United States. APHIS helps to protect the United States
from emerging animal and plant pests and diseases while meeting obligations under the World
Trade Organization's SPS agreement by assisting developing countries in improving their
safeguarding systems. APHIS develops and implements programs designed to identify and
reduce agricultural pest and disease threats while they are still outside of U.S. borders, to
enhance safe agricultural trade, and to strengthen emergency response preparedness.
(b) WTO Consistency
Expenditures by the Animal and Plant Health Inspection Service clearly provide significant
benefits to U.S. agriculture. As these services are provided at no cost, they could constitute
domestic support. However, expenditures under these programs would appear to be exempted
from U.S. domestic support reduction commitments pursuant to Annex 2(2) to the Agreement on
Agriculture.
439 Department of Agriculture, The Budget for Fiscal Year 2017, pg 79

PART I
267
(c) Program Level
The FY 2017 Budget Summary reports the following program levels for Scientific and Technical
Services:440
2015 (Enacted) $36,000,000
2016 (Estimate) $37,000,000
2017 (Budget) $42,000,000
(d) Allocation to Dairy
The Scientific and Technical Services program provides important support to U.S. dairy
producers, but this support is not provided exclusively to dairy production. Therefore, the
support provided to dairy producers under this program is determined on the basis of dairy’s
share of total U.S. agricultural production. In 2015, dairy production represented 10.54% of the
total value of U.S. agricultural production. Therefore, of the $36,000,000 program level on
account of this program in 2015, $3,794,400 can be attributed to dairy production.
440 FY 2017 Budget Summary, U.S. Department of Agriculture, pg 77

PART I
268
X. Food Safety and Inspection
The Food Safety and Inspection Service (FSIS) (Budget Code 12-3700-0-1-554)441 is responsible
for domestic and international public health and safety issues related to meat, poultry and egg
products regulated by the FSIS and under the general oversight of the Office of the U.S. Manager
of the Codex Alimentarius Commission. FSIS also responds to meat, poultry and egg
emergencies and coordinates policies and program development with other departments,
international organizations, other countries, and State and local governments.
FSIS also provides in-plant inspection to all domestic establishments preparing meat, poultry and
processed egg products for sale or distribution into interstate commerce and reviews and
approves foreign inspection systems and plants exporting these products to the U.S.
The FSIS program responsibilities include:
(i) Federal Food Safety and Inspection
(ii) State Food Safety and Inspection
(iii) International Food Safety and Inspection
(iv) Public Health Data Communication Infrastructure System
(v) Code Alimentarius Commission
(vi) Existing User Fees and Trust Funds
Arguably, consumers are among the principal beneficiaries of this program; other elements of the
program clearly benefit U.S. agriculture by establishing favourable international standards.
441 Department of Agriculture, The Budget for Fiscal Year 2017, pg 82
PART I
269
The FY 2017 USDA Budget reports obligations for the Food Safety and Inspection programs as
follows:442
2015 (Actual) $1,231,000,000
2016 (Estimate) $1,206,000,000
2017 (Budget) $1,221,000,000
Food Safety and Inspection provides direct support to U.S. agriculture. As this support is not
directed exclusively at dairy production, the amount allocated to dairy is in proportion to dairy’s
share of total U.S. agricultural production. In 2015, dairy production accounted for 10.54% of
total U.S. dairy production. Therefore, of the $1,231,000,000 program funding account of Food
Safety and Inspection programs, $129,747,400 is allocated to support U.S. dairy production.
442 Ibid., pg 80

PART I
270
A. Federal Food Safety and Inspection
(a) Program Description
FSIS inspects all carcasses in slaughter plants for disease and other abnormalities, and samples
for the presence of chemical residues and microbiological contaminants. Meat and poultry
processing operations are inspected by FSIS at a minimum on a daily basis. FSIS provides
mandatory, continuous in-plant inspection to egg product processing plants. FSIS operates three
laboratories to perform scientific testing in support of inspection operations. Other
responsibilities ensure that establishments develop and implement acceptable HACCP plans,
sanitation standard operating procedures, and humane methods of slaughter.
(b) WTO Consistency
Expenditures by the Food and Safety Inspection Service clearly provide significant benefits to
U.S. agriculture by ensuring consumer confidence safety of U.S. food. As these services are
provided at no cost, they could constitute domestic support. However, expenditures under these
programs are clearly exempted from U.S. domestic support reduction commitments pursuant to
Annex 2(2)(e) to the Agreement on Agriculture, which provides exemption from reduction for
“inspection” including general inspection services and the inspection of particular products for
health safety, grading or standardization purposes.
(c) Program Level
The FY 2017 Budget Summary for the Department of Agriculture reports the following program
levels for the Federal Food Safety and Inspection program:443
2015 (Enacted) $901,000.000
2016 (Estimate) $899,000,000
2017 (Budget) $914,000,000
443 FY 2017 Budget Summary, U.S. Department of Agriculture, pg 64

PART I
271
(d) Allocation to Dairy
The Federal Food Safety and Inspection program does not provide support exclusively to dairy
production. Indeed, it could be argued that its focus is meat, poultry and eggs; therefore, benefits
to dairy are indirect (dairy cattle are slaughtered in federally inspected plants). Therefore,
support to dairy production under this program must be determined on the basis of dairy’s share
of total U.S. agricultural production. In 2015, the value of dairy production constituted 10.54%
of total U.S. agricultural production. Therefore, of the $901,000,000 program level for this
program, $94,965,400 is attributable to dairy.

PART I
272
B. State Food Safety and Inspection
(a) Program Description
FSIS has the authority to approve State meat and poultry inspection programs for products
traveling in intrastate commerce. FSIS reviews State inspection programs to assure that
standards, at least equal to Federal standards, are applied to meat and poultry plants under State
jurisdiction. For State inspection programs, USDA contributes, through the Grants to States
Program, up to 50% of each State’s costs.
(b) WTO Consistency
Expenditures by the Food and Safety Inspection Service clearly provide significant benefits to
U.S. agriculture in ensuring the public accepts the safety of U.S. food. As these services are
provided at no cost, they could constitute domestic support. However, expenditures under these
programs are clearly exempted from U.S. domestic support reduction commitments pursuant to
Annex 2(2)(e) to the Agreement on Agriculture.
(c) Program Level
The FY 2017Budget Summary for the Department of Agriculture reports the following program
levels for the State Food Safety and Inspection program:444
2015 (Actual) $61,000,000
2016 (Estimate) $61,000,000
2017 (Budget) $61,000,000
444 Ibid.

PART I
273
(d) Allocation to Dairy
The program level expenditures made on account of the State Food Safety and Inspection
program do not provide support exclusively to dairy production. Therefore, support to dairy
production under this program must be determined on the basis of dairy’s share of total U.S.
agricultural production. In 2015, the value of dairy production constituted 10.54% of total U.S.
agricultural production. Therefore, of the $61,000,000 program level in 2015 for this program,
$6,429,400 is attributable to dairy.

PART I
274
C. International Food Safety and Inspection
(a) Program Description
FSIS reviews and approves inspection systems in countries exporting meat, poultry and egg
products to the U.S. and inspects imported products at ports-of-entry.
(b) WTO Consistency
Expenditures by the Food and Safety Inspection Service clearly provide significant benefits to
U.S. agriculture in ensuring that imported products must meet U.S. standards. As these services
are provided at no cost, they could constitute domestic support. However, expenditures under
these programs are exempted from U.S. domestic support reduction commitments pursuant to
Annex 2(2)(e) to the Agreement on Agriculture.
(c) Program Level
The FY 2017 Budget Summary for the Department of Agriculture reports the following program
levels for the International Food Safety and Inspection program:445
2015 (Enacted) $16,000,000
2016 (Budget) $17,000,000
2017 (Budget) $17,000,000
(d) Allocation to Dairy
The International Food Safety and Inspection program does not provide benefits exclusively to
dairy production. Therefore, support to dairy production under this program must be determined
on the basis of dairy’s share of total U.S. agricultural production. In 2015, the value of dairy
production constituted 10.54% of total U.S. agricultural production. Therefore, of the
445 Ibid., pg 59

PART I
275
$16,000,000 program level for this program in FY 2015, $1,686,400 is allocated to dairy
products.

PART I
276
D. Codex Alimentarius Commission
(a) Program Description
FSIS coordinates U.S. participation in and informs the public of the sanitary and phytosanitary
standard setting activities of the Codex Alimentarius Commission.
(b) WTO Consistency
Expenditures by the Food and Safety Inspection Service clearly provide significant benefits to
U.S. agriculture as U.S. participation in CODEX and co-ordination with other countries in the
region helps establish standards which are favourable to U.S. farmers and ranchers. As these
services are provided at no cost, they could constitute domestic support. However, expenditures
under these programs are exempted from U.S. domestic support reduction commitments pursuant
to Annex 2(2)(e) to the Agreement on Agriculture.
(c) Program Level
The FY 2017 Budget Summary for the Department of Agriculture reports the following program
levels for the Codex Alimentarius program:446
2015 (Enacted) $4,000,000
2016 (Estimate) $4,000,000
2017 (Budget) $4,000,000
446 Ibid., pg 59

PART I
277
(d) Allocation to Dairy
The expenditures made on account of the Codex Alimentarius program do not provide support
exclusively to dairy production. Therefore, support to dairy production under this program will
be determined on the basis of dairy’s share of total U.S. agricultural production. In 2015, the
value of dairy production constituted 10.54% of total U.S. agricultural production. Therefore, of
the $4,000,000 program level for this program in 2015, $421,600 is allocated to dairy products.

PART I
278
XI. Food and Nutrition Service
The Food and Nutrition Service (Budget Code 12-3508-0-1-605)447 administers USDA’s
domestic nutrition programs. The objective of the program is to promote good nutrition and
health by providing children and low-income people better access to a healthy diet and physical
activity behaviours. The Food and Nutrition Service achieves this program objective by
promotion and direct nutrition assistance through the following programs:
(i) Supplemental Nutrition Assistance Program (SNAP)
(ii) Child Nutrition Programs
(iii) Special Supplemental Nutritional Program for Women, Infants and Children
(WIC)
(iv) Commodity Assistance Program
The FY 2011 USDA Budget Summary reports program levels for the Food and Nutrition Service
programs as follows:448
2015 (Enacted) $110,380,000,000
2016 (Estimate) $110,004,000,000
2017 (Budget) $112,138,000,000
Food aid programs were originally established for surplus removal purposes. The domestic food
aid provided through the Food and Nutrition Service programs provides direct support to U.S.
agricultural production. As this support is not directed exclusively at dairy production, the
amount allocated to dairy is in proportion to dairy’s share of total U.S. agricultural production.
In 2015, dairy production accounted for 10.54% of total U.S. dairy production. Therefore, of the
$110,380,000,000 program level for Food and Nutrition Service programs, $11,634,052,000 is
447 Department of Agriculture, The Budget for Fiscal Year 2017, pg 157 448 FY 2017 Budget Summary, U.S. Department of Agriculture, pg 110

PART I
279
allocated to U.S. dairy production. Given the limited range of products covered by the FNS, we
consider that this methodology understates benefits to dairy.

PART I
280
A. Supplemental Nutrition Assistance Program (SNAP) (Budget Code 12-3505-0-1-
605)449
(a) Program Description
The Supplemental Nutrition Assistance Program (formerly the Food Stamp Program) attempts to
alleviate hunger and malnutrition among low-income persons by increasing their food
purchasing power. Eligible households receive electronic cards which are used like ATM cards
so they can purchase food through regular retail stores.
SNAP is currently in operation in all 50 States, the District of Columbia, the Virgin Islands,
Guam and Puerto Rico. Participating households receive food benefits, the value of which is
determined by household size and income. The Federal Government pays the cost of the benefits.
As required by law, the Food and Nutrition Service annually revises household allotments to
reflect changes in the cost of the (thrifty) food plan.
All direct and indirect administrative costs incurred for certification of households, issuance of
food credit, quality control, outreach, and fair hearing efforts are shared by the Federal
Government and the States on a 50-50 basis.
449 Department of Agriculture, The Budget for Fiscal Year 2017, pg 158

PART I
281
450
(b) WTO Consistency
Through these domestic food aid programs, the USDA has the ability to support U.S. agricultural
producers by procuring, or supporting the procurement, of commodities to be used in these
programs. By participating in the market to this degree, it is almost certain that these programs
have significant price supporting effect.451 On that basis, we consider that these programs
constitute domestic support programs.
However, Annex 2(4) to the Agreement on Agriculture452 makes it very clear that expenditures
on account of domestic food aid programs are exempt from domestic support reduction
commitments so long as eligibility to receive food aid is subject to clearly-defined criteria related
450 Past, Present, & Future of SNAP, House Agriculture Committee Report, December 7, 2016, pg 54 http://agriculture.house.gov/uploadedfiles/snap_report_2016.pdf 451 See Berthelot, Jacques; Solidarité 452 Annex 2(4) Domestic food aid Expenditures (or revenue foregone) in relation to the provision of domestic food aid to sections of the population in need. Eligibility to receive the food aid shall be subject to clearly-defined criteria related to nutritional objectives. Such aid shall be in the form of direct provision of food to those concerned or the provision of means to allow eligible recipients to buy food either at market or at subsidized prices. Food purchases by the government shall be made at current market prices and the financing and administration of the aid shall be transparent.

PART I
282
to nutritional objectives. On this basis, the support provided to U.S. agriculture through these
programs has not been included in the U.S. AMS.
(c) Program Level
The FY 2017 Budget reports the Budget Authority available for this program as follows:453
2015 (Actual) $81,830,000,000
2016 (Estimate) $80,839,000,000
2017 (Estimate) $81,709,000,000
(d) Allocation to Dairy
This program does not provide benefits exclusively to dairy producers but would appear to
benefit dairy more than other nutrition programs. Consequently, we cannot attribute the entire
value of the support provided under these programs to U.S. dairy producers. Therefore, the
value of the subsidies and support that benefits dairy production under these programs is
attributed on the basis of dairy’s share of the total value of U.S. agricultural production. In 2015,
all dairy production accounted for 10.54% of total U.S. agricultural production.
Total resources available under this program were $81,830,000,000 in 2015. Based on dairy’s
share of total U.S. agricultural production, the allocation to dairy was $8,624,882,000.
453 Department of Agriculture, The Budget for Fiscal Year 2017, pg 158

PART I
283
B. Child Nutrition Programs (Budget Code 12-3539-0-1)454
(a) Program Description
The Supplemental Nutrition Assistance Program (SNAP) is the primary source of nutrition
assistance for low-income Americans. Through subsidies for meals that meet nutritional
standards, the National School Lunch Program (NSLP), School Breakfast Program (SBP),
Summer Food Service (SFSP), and Child and Adult Care Food Program (CACFP) assist State
and local governments, and private non-profit organizations in ensuring that children in schools
and child care – and adults in adult day care programs – receive meals that meet their nutritional
needs, foster healthy eating habits, reduce the number of overweight and obese children, and
safeguard their health.455
The National School Lunch Program is a federally assisted meal program operating in public and
nonprofit private schools and residential child care institutions. It provides nutritionally
balanced, low-cost or free lunches to children each school day. The program was established
under the National School Lunch Act, signed by President Harry Truman in 1946.456
The main driver for the expected participation increase in school meals is the community
eligibility provision (CEP) that provides an alternative to household applications for free and
reduced price meals and reduces the burden of collecting funds and maintaining accounts for the
students who pay for school meals. The provision improves access to nutritious meals for low-
income students while reducing administrative burdens for households and schools.457
(b) WTO Consistency
Through these domestic food aid programs, the USDA has the ability to support U.S. agricultural
producers by procuring, or supporting the procurement, of commodities to be used in these
454 Ibid., pg 159 455 FY 2017 Budget Summary, U.S. Department of Agriculture, pg 53 456 https://www.fns.usda.gov/nslp/national-school-lunch-program-nslp , February 12, 2017 457 FY 2017 Budget Summary, U.S. Department of Agriculture, pg 53

PART I
284
programs. By participating in the market to this degree, it is almost certain that these programs
have, at a minimum, a significant price supporting effect.
However, Annex 2(4) to the Agreement on Agriculture makes it very clear that expenditures on
account of domestic food aid programs are exempt from domestic support reduction
commitments so long as eligibility to receive food aid is subject to clearly defined criteria related
to nutritional objectives. On this basis, the support provided to U.S. agriculture through these
programs has not been included in the U.S. AMS.
(c) Program Level
The FY 2017 Budget reports the total Budget Authority available to fund obligations under this
program as follows:458
2015 (Actual) $21,475,000,000
2016 (Estimate) $22,344,000,000
2017 (Estimate) $23,419,000,000
(d) Allocation to Dairy
While dairy products are a very significant part of this program, it does not provide benefits
exclusively to dairy producers. Consequently, we cannot attribute the entire value of the support
provided under these programs to U.S. dairy producers. Because of the importance of dairy to
basic nutrition, using dairy’s share in the total U.S. production will understate the benefits of this
program to dairy producers. However, for purposes of consistency the value of the subsidies and
support that benefits dairy production under these programs is attributed on the basis of dairy’s
share of the total value of U.S. agricultural production. In 2015, all dairy production accounted
for 10.54% of total U.S. agricultural production.
458 Department of Agriculture, The Budget for Fiscal Year 2017, pg 160
PART I
285
Total resources available under this program were $21,475,000,000 in 2015. Based on dairy’s
share of total U.S. agricultural production, the allocation to dairy is $2,263,465,000.

PART I
286
C. Special Supplemental Nutrition Program for Women, Infants, and Children (WIC)
(Budget Code 12-3510-0-1-605)459
(a) Program Description
WIC provides monthly food packages specifically tailored to meet the dietary needs of program
participants who must be either a pregnant, postpartum, or breastfeeding woman, or a child under
the age of five. To be eligible on the basis of income, applicants’ gross income (i.e., before taxes
are withheld) must fall at or below 185% of the U.S. Poverty Income Guidelines.460
(b) WTO Consistency
Through these domestic food aid programs, the USDA has the ability to support U.S. agricultural
producers by procuring, or supporting the procurement, of commodities to be used in these
programs. By participating in the market to this degree, it is almost certain that these programs
have, at a minimum, a price supporting effect. On that basis, it is likely that these programs
constitute domestic support programs.
However, Annex 2(4) to the Agreement on Agriculture makes it very clear that expenditures on
account of domestic food aid programs are exempt from domestic support reduction
commitments so long as eligibility to receive food aid is subject to clearly-defined criteria related
to nutritional objectives. On this basis, the support provided to U.S. agriculture through these
programs has not been included in the U.S. AMS.
459 Ibid. 460 www.fns.usda.gov/wic/women-infants-and-children-wic, February 12, 2017

PART I
287
(c) Program Level
The FY 2017 Budget reports the Budget Authority available to meet the obligations under this
program as follows:461
2015 (Actual) $6,624,000,000
2016 (Estimate) $6,351,000,000
2017 (Estimate) $6,351,000,000
(d) Allocation to Dairy
This program does not provide benefits exclusively to dairy producers. Consequently, we cannot
attribute the entire value of the support provided under these programs to U.S. dairy producers.
Therefore, the value of the subsidies and support that benefits dairy production under these
programs is attributed on the basis of dairy’s share of the total value of U.S. agricultural
production. In 2015, all dairy production accounted for 10.54% of total U.S. agricultural
production.
Total resources available for this program in 2015 were $6,624,000,000. Based on dairy’s share
of total U.S. agricultural production, the allocation to dairy was $698,169,600.
461 Department of Agriculture, The Budget for Fiscal Year 2017, pg 161

PART I
288
D. Commodity Assistance Program (Budget Code 12-3507-0-1-605)462
(a) Program Description
The Commodity Assistance Program provides commodities distributed through several programs
including the Emergency Food Assistance Program (TEFAP) and the Commodity Supplemental
Food Program (CSFP) which provides USDA donated commodities to food banks, church
pantries, soup kitchens and emergency shelters for distribution to low-income people.
The Commodity Program also supports the Senior Farmers’ Market Nutrition Program and the
Farmers’ Market Nutrition Program which gives low-income individuals access to produce and
other commodities.
(b) WTO Consistency
Through these domestic food aid programs, the USDA has the ability to support U.S. agricultural
producers by procuring, or supporting the procurement, of commodities to be used in these
programs. By participating in the market to this degree, it is almost certain that these programs
have, at a minimum, a price supporting effect. On that basis, it is likely that these programs
constitute domestic support programs.
However, Annex 2(4) to the Agreement on Agriculture would appear to exempt expenditures on
account of domestic food aid programs from domestic support reduction commitments so long as
eligibility to receive food aid is subject to clearly-defined criteria related to nutritional objectives.
On this basis, the support provided to U.S. agriculture through these programs is arguably not
included in the U.S. AMS.
462 Ibid.

PART I
289
(c) Program Level
The FY 2017 Budget reports the total budget authority for this program as follows:463
2015 (Actual) $301,000,000
2016 (Estimate) $318,000,000
2017 (Estimate) $334,000,000
(d) Allocation to Dairy
This program does not provide benefits exclusively to dairy producers. Consequently, we cannot
attribute the entire value of the support provided under these programs to U.S. dairy producers.
Therefore, the value of the subsidies and support that benefits dairy production under these
programs is attributed on the basis of dairy’s share of the total value of U.S. agricultural
production. In 2015, all dairy production accounted for 10.54% of total U.S. agricultural
production.
The budget authority under this program in 2015 was $301,000,000. Based on dairy’s share of
total U.S. agricultural production, the allocation to dairy is $31,725,400.
463 Ibid., pg 162

PART I
290
XII. Grain Inspection, Packers and Stockyards Administration (GIPSA)
(a) Program Description
The United States Department of Agriculture’s (USDA) Grain Inspection, Packers and
Stockyards Administration (GIPSA) (Budget Code 12-2400-0-1-352)464 facilitates the marketing
of livestock, poultry, meat, cereals, oilseeds, and related agricultural products, and promotes fair
and competitive trading practices for the overall benefit of consumers and American agriculture.
GIPSA sets the official U.S. standards for grain, conducts official weighing and grain inspection
activities, and grades rice, dry beans and peas, processed grain products, and hops.
The agency is involved in regulating and monitoring the activities of dealers, market agencies,
stockyard owners, live poultry dealers, packer buyers, packers, and swine contractors in order to
detect prohibited unfair, unjust discriminatory or deceptive, and anti-competitive practices in the
livestock, meat and poultry industries. The agency also reviews the financial records of these
entities to promote the financial integrity of the livestock, meat, and poultry industries.
(b) WTO Consistency
Expenditures by the Grain Inspection, Packers and Stockyards Administration clearly provide
significant benefits to U.S. agriculture. As these services are provided at no cost, they could
constitute domestic support. However, expenditures under these programs are exempted from
U.S. domestic support reduction commitments pursuant to Annex 2(2)(e) to the Agreement on
Agriculture.
464 FY 2017 Appendix Budget, U.S. Department of Agriculture, p 84

PART I
291
(c) Program Level
The FY 2017 Budget reports the total Budget Authority available for the obligations under this
program as follows:465
2015 (Actual) $43,000,000
2016 (Estimate) $43,000,000
2017 (Estimate) $43,000,000
(d) Allocation to Dairy
This program does not provide benefits exclusively to dairy producers. Consequently, we cannot
attribute the entire value of the support provided under these programs to U.S. dairy producers.
Therefore, the value of the subsidies and support that benefits dairy production under these
programs is attributed on the basis of dairy’s share of the total value of U.S. agricultural
production. In 2015, all dairy production accounted for 10.54% of total U.S. agricultural
production.
The budget resources available for this program were $43,000,000 in 2015. Based on dairy’s
share of total U.S. agricultural production, the allocation to dairy is $4,532,200.
465 Ibid.

PART I
292
XIII. Forest Service
The Forest Service (Budget Code 12-1106-0-1-302),466 the largest employer in USDA, is
responsible for protecting and enhancing the natural resource base and environment. The Forest
Service is responsible for the following major programs:
(i) Forest and Rangeland Research
(ii) State and Private Forestry
(iii) National Forest System
(iv) Capital Improvement and Maintenance
(v) Wildland Fire Management
The FY 2017 Budget Summary for the Department of Agriculture report the following program
levels for the Forest Service:467
2015 (Enacted) $5,698,000,000
2016 (Estimate) $7,025,000,000
2017 (Estimate) $5,530,000,000
The Forest Service provides indirect support to U.S. agriculture, including dairy producers. The
amount of indirect support provided to dairy can be allocated on the basis of dairy’s share of
total U.S. agricultural production. In 2015, dairy represented 10.54% of all U.S. agricultural
production. Therefore, of the $5,698,000,000 expended on account of all Forest Service
programs in 2015, $600,569,200 can be allocated as indirect support for dairy producers.
466 Ibid., p 165 467 FY 2017 Budget Summary, U.S. Department of Agriculture, pp 68
PART I
293
A. Forest and Rangeland Research (Budget Code 12-1104-0-1-302)468
(a) Program Description
The Forest and Rangeland Research program operated by the National Forest Service is a
research program that is intended to enhance the economic and environmental value of the U.S.
forests and related industries.
(b) WTO Consistency
For the most part, the programs operated by the Forest Service would provide indirect support to
U.S. agriculture producers. The exceptions would involve the application of these programs to
rangeland and grazing land, as well as the acquisition program which could provide direct
support to U.S. agriculture if property was acquired from agriculture producers at above-market
prices.
To extent that the Forest Service provides support to U.S. agricultural production, this support
would be exempt from reduction commitments pursuant to Annex 2(2) to the Agreement on
Agriculture.
468 FY 2017 Appendix Budget, U.S. Department of Agriculture, p 163

PART I
294
(c) Program Level
The FY 2017 USDA Budget reports the total budgetary authority available for obligations under
this program as follows:469
2015 (Actual) $335,000,000
2016 (Estimate) $335,000,000
2017 (Estimate) $335,000,000
(d) Allocation to Dairy
This program does not provide benefits exclusively to dairy producers. Consequently, we cannot
attribute the entire value of the support provided under these programs to U.S. dairy producers.
Therefore, the value of the subsidies and support that benefits dairy production under these
programs is attributed on the basis of dairy’s share of the total value of U.S. agricultural
production. In 2015, all dairy production accounted for 10.54% of total U.S. agricultural
production.
Budgetary resources for this program were $335,000,000 in 2015. Based on dairy’s share of
total U.S. agricultural production, the allocation to dairy is $35,309,000.
469 Ibid.

PART I
295
B. State and Private Forestry (Budget Code 12-1105-0-1-302)470
(a) Program Description
The Forest Service makes grants and provides technical assistance to State forestry agencies and
other cooperators for protecting forest resources and improving sustainable forest management
on non-industrial private forest lands. Funding is provided for forest pest suppression on all
Federal lands and cost-share assistance is made available for pest suppression on private lands.
A Cooperative Fire Protection Program provides technical and limited financial support for State
wildfire fighting organizations. The Forest Stewardship Program provides technical assistance to
non-industrial private landowners for a variety of stewardship practices including tree planting.
Plans are also proposed to fund emerging pest and pathogen control, including response to non-
native or invasive pests or pathogens.
The Forest Legacy Program funds, though the States, the acquisition of land or interests in land
slated for conversion to non-forest uses.
With the direct cooperation of States, the Forest Stewardship Program helps forest landowners
with planning and implementation of sustainable forest management.
(b) WTO Consistency
For the most part, the programs operated by the Forest Service would provide indirect support to
U.S. agriculture producers. The exception would be the application of these programs to
rangeland and grazing land, as well as the acquisition program which could provide direct
support to U.S. agriculture if property was acquired from agriculture producers at above-market
prices.
470 Ibid., p 165

PART I
296
To extent that the Forest Service provides support to U.S. agricultural production, this support
would be exempt from reduction commitments pursuant to Annex 2(2) to the Agreement on
Agriculture.
(c) Program Level
The FY 2017 Budget reports the following as the total Budget Authority available for the
obligations under this program as follows:471
2015 (Actual) $218,000,000
2016 (Estimate) $287,000,000
2017 (Estimate) $272,000,000
(d) Allocation to Dairy
This program does not provide benefits exclusively to dairy producers. Consequently, we cannot
attribute the entire value of the support provided under these programs to U.S. dairy producers.
Therefore, the value of the subsidies and support that benefits dairy production under these
programs is attributed on the basis of dairy’s share of the total value of U.S. agricultural
production. In 2015, all dairy production accounted for 10.54% of total U.S. agricultural
production.
Budgetary resources for this program in 2015 were $218,000,000. Based on dairy’s share of
total U.S. agricultural production, the allocation to dairy is $22,977,200.
471 Ibid., p 166

PART I
297
C. Land Acquisition (Budget Code 12-9923-0-2-302)472
(a) Program Description
The Program provides for expenses necessary to carry out the provisions of the Land and Water
Conservation Fund Act of 1965 as amended. The agency is shifting its focus from acquiring new
land to investing to sustain production capacity by implementing various protection programs.
(b) WTO Consistency
For the most part, the programs operated by the Forest Service would provide indirect support to
U.S. agriculture producers. Exceptions are programs which affect rangeland, grasslands, grazing
lands, as well as the acquisition program which could provide direct support to U.S. agriculture if
property was acquired from agriculture producers at above-market prices.
To the extent that the Forest Service provides support to U.S. agricultural production, this
support would be exempt from reduction commitments pursuant to Annex 2(2) to the Agreement
on Agriculture.
(c) Program Level
The FY 2017 Budget reports the total Budget Authority available for this program as follows:473
2015 (Actual) $45,000,000
2016 (Estimate) $94,000,000
2017 (Estimate) $129,000,000
472 Ibid, p 171 473 Ibid., p 172

PART I
298
(d) Allocation to Dairy
This program does not provide benefits exclusively to dairy producers. Consequently, we cannot
attribute the entire value of the support provided under these programs to U.S. dairy producers.
Therefore, the value of the subsidies and support that benefits dairy production under these
programs is attributed on the basis of dairy’s share of the total value of U.S. agricultural
production. In 2015, all dairy production accounted for 10.54% of total U.S. agricultural
production.
Budgetary resources for this program in 2015 were $45,000,000. Based on dairy’s share of total
U.S. agricultural production, the allocation to dairy is $4,743,000.

PART I
299
XIV. Research, Education and Economics
The Research, Education and Economics program is responsible for the discovery, application
and dissemination of information and technology through agricultural research, education,
extension activities and economic and statistical analysis. The responsibility for these programs
is carried out by four agencies:
(i) Agricultural Research Service (ARS)
(ii) National Institute of Food and Agriculture (NIFA)
(iii) Economic Research Service (ERS)
(iv) National Agricultural Statistics Service (NASS)
Based on the budget authority for these individual programs, the aggregate budget authorities for
Research, Education and Economics is as follows:474
2015 (Estimate) $2,901,000,000
2016 (Estimate) $3,141,000,000
2017 (Budget) $3,438,000,000
The research, education and economics programs operated by the Department of Agriculture
provide important support to U.S. agricultural production. Such activities may be exempt from
reductions pursuant to Annex 2.2(a) or 2.2(a) of the Agreement on Agriculture.
As these programs do not provide support exclusively to dairy production, the amount allocated
to dairy programs is determined based on dairy’s share of total U.S. production. The total value
of dairy production in 2015 was 10.54% of total U.S. agricultural production. Therefore, of the
$2,901,000,000 budgeted for research, education and economics in 2015, $305,765,400 is
allocated to support dairy producers.
474 FY 2017 Budget Summary, U.S. Department of Agriculture, pg 109

PART I
300
A. Agricultural Research Service (Budget Code 12-1400-0-1-352)475
(a) Program Description
The Agricultural Research Service seeks to ensure reliable, adequate supplies of high-quality
food and other agricultural products through scientific research to solve problems in crop and
livestock production and protection, human nutrition, and the interaction of agriculture and the
environment.
(b) WTO Consistency
It is clear that U.S. agricultural producers benefit from the work undertaken by the USDA
research, education and economics services operated by the USDA. However, the services
provided by these Agencies appear to fall within the scope of general services which are exempt
from domestic support reduction commitments pursuant to Annex 2(2)(a) to the Agreement on
Agriculture.
(c) Program Level
The FY 2017 Budget Summary reports the following program levels for the Agricultural
Research Service:476
2015 (Enacted) $1,208,000,000
2016 (Estimate) $1,386,000,000
2017 (Budget) $1,286,000,000
475 Department of Agriculture, The Budget for Fiscal Year 2017, pg 69 476 FY 2017 Budget Summary, U.S. Department of Agriculture, pg 109

PART I
301
(d) Allocation to Dairy
This program does not provide benefits exclusively to dairy producers. Consequently, we cannot
attribute the entire value of the support provided under these programs to U.S. dairy producers.
Therefore, the value of the subsidies and support that benefits dairy production under these
programs is attributed on the basis of dairy’s share of the total value of U.S. agricultural
production. In 2015, all dairy production accounted for 10.54% of total U.S. agricultural
production.
Budgetary resources for this program in 2015 were $1,208,000,000. Based on dairy’s share of
total U.S. agricultural production, the allocation to dairy is $127,323,200.

PART I
302
B. National Institute of Food and Agriculture (Budget Code 12-1502-0-1-352)477
(a) Program Description
The National Institute of Food and Agriculture (NIFA) is primarily responsible for providing
linkages between federal and state components of a broad-based, national agricultural research,
extension and higher education system. NIFA is responsible for administering USDA’s primary
competitive research grants program and the Agriculture and Food Research Initiative.
(b) WTO Consistency
It is clear that U.S. agricultural producers benefit from the work undertaken by the USDA
research, education and economics services operated by the USDA. However, the services
provided by these Agencies falls within the scope of general services which are exempt from
domestic support reduction commitments pursuant to Annex 2(2)(d) to the Agreement on
Agriculture.
(c) Program Level
The FY 2017 Budget Summary report the total obligations and budgetary authority to support
this program as follows:478
2015 (Enacted) $1,436,000,000
2016 (Estimate) $1,502,000,000
2017 (Budget) $1,884,000,000
477 Department of Agriculture, The Budget for Fiscal Year 2017, pg 75 478 FY 2017 Budget Summary, U.S. Department of Agriculture, pg 93

PART I
303
(d) Allocation to Dairy
This program does not provide benefits exclusively to dairy producers. Consequently, we cannot
attribute the entire value of the support provided under these programs to U.S. dairy producers.
Therefore, the value of the subsidies and support that benefits dairy production under these
programs is attributed on the basis of dairy’s share of the total value of U.S. agricultural
production. In 2015, all dairy production accounted for 10.54% of total U.S. agricultural
production.
Total resources available under this program in 2015 were $1,436,000,000. Based on dairy’s
share of total U.S. agricultural production, the allocation to dairy is $151,354,400.
PART I
304
C. Economic Research Service (Budget Code 12-1701-0-1-352)479
(a) Program Description
The Economic Research Service provides economic research and information to inform public
and private decision-making on economic and policy issues related to agriculture, food, natural
resources, and rural America.
The Economic Research Service provides economic analysis of many critical issues facing
farmers, agribusiness, consumers, and policymakers. ERS expertise helps these stakeholders
conduct business, formulate policy, or just learn about agriculture, food, natural resources, and
rural America.
(b) WTO Consistency
It is clear that U.S. agricultural producers benefit from the work undertaken by the USDA
research, education and economics services operated by the USDA. However, the services
provided by these Agencies falls within the scope of general services which are exempt from
domestic support reduction commitments pursuant to Annex 2(2)(a) to the Agreement on
Agriculture.
(c) Program Level
The FY 2017 USDA Budget Summary reports the following program levels on account of the
Economic Research Service:480
479 Department of Agriculture, The Budget for Fiscal Year 2017, pg 66 480 FY 2017 Budget Summary, U.S. Department of Agriculture, pg 98

PART I
305
2015 (Enacted) $85,000,000
2016 (Estimate) $85,000,000
2017 (Budget) $91,000,000
(d) Allocation to Dairy
This program does not provide benefits exclusively to dairy producers. Consequently, we cannot
attribute the entire value of the support provided under these programs to U.S. dairy producers.
Therefore, the value of the subsidies and support that benefits dairy production under these
programs is attributed on the basis of dairy’s share of the total value of U.S. agricultural
production. In 2015, all dairy production accounted for 10.54% of total U.S. agricultural
production.
Total budgetary resources under this program were $85,000,000 in 2015. Based on dairy’s share
of total U.S. agricultural production, the allocation to dairy is $8,959,000.

PART I
306
D. National Agricultural Statistics Service (Budget Code 12-1801-0-1-352)481
(a) Program Description
The National Agricultural Statistics Service (NASS) is responsible for conducting surveys and
preparing official data and estimates of production, supply, prices and other information related
to agricultural production. The Service also conducts the census of agriculture, currently
compiled every five years.
(b) WTO Consistency
It is clear that U.S. agricultural producers benefit from the work undertaken by the USDA
research, education and economics services operated by the USDA. However, the services
provided by these Agencies falls within the scope of general services which are exempt from
domestic support reduction commitments pursuant to Annex 2(2)(a) to the Agreement on
Agriculture.
(c) Program Level
The FY 2017 USDA Budget Summary reports the following program levels on account of the
National Agriculture Statistics Service:482
2015 (Enacted) $172,000,000
2016 (Estimate) $168,000,000
2017 (Budget) $177,000,000
481 Department of Agriculture, The Budget for Fiscal Year 2017, pg 67 482 FY 2017 Budget Summary, U.S. Department of Agriculture, pg 109

PART I
307
(d) Allocation to Dairy
This program does not provide benefits exclusively to dairy producers. Consequently, we cannot
attribute the entire value of the support provided under these programs to U.S. dairy producers.
Therefore, the value of the subsidies and support that benefits dairy production under these
programs is attributed on the basis of dairy’s share of the total value of U.S. agricultural
production. In 2015, all dairy production accounted for 10.54% of total U.S. agricultural
production.
Total budgetary resources available under this program in 2015 were $172,000,000. Based on
dairy’s share of total U.S. agricultural production, the allocation to dairy is $18,128,800.

PART I
308
XV. Irrigation Infrastructure
The U.S. irrigation program (Budget Code 14-0680-0-1-301)483 provides substantial subsidies
that support U.S. agriculture.
There is no question that this extensive irrigation projects is vitally important to U.S. agriculture.
Irrigated agriculture, which accounts for the largest share of the Nation’s consumptive water use,
makes a significant contribution to the value of U.S. agricultural production. In 2012, irrigated
farms accounted for roughly half of the total national value of crop sales on just 17% of U.S.
cropland. Irrigated farms also support the livestock and poultry sectors through irrigated
production of animal forage and feed crops.
Roughly 56 million acres—or 7.6% of all U.S. cropland and pastureland—were irrigated in
2012. Nearly three-quarters of irrigated acres are in the 17 western-most contiguous States
(referred to as the Western States hereafter). From 2007 to 2012, irrigated acres declined by
nearly 0.8 million acres across the United States. Most of the area decline occurred in the
Western United States where drought conditions contributed to water-supply scarcity across the
region. Contractions in State-level irrigated acreage exceeded 10% in Texas, Colorado, Oregon,
New Mexico, and Oklahoma.
In recent decades, much of the expansion in irrigated acreage has occurred in the more humid
Eastern States. From 2007 to 2012 irrigated area in the East expanded by roughly 8%, with
significant acreage increases in Arkansas, Louisiana, Mississippi, and Georgia. USDA's Farm
and Ranch Irrigation Survey (FRIS) reports that in 2013, irrigated agriculture applied 91.2
million acre-feet of water nationally, with over four-fifths occurring in the West. (An acre-foot of
water is equivalent to 325,851 gallons.) The U.S. Geological Survey (USGS), which monitors
water use by economic sector, estimates that irrigated agriculture accounted for 38% of the
Nation's freshwater withdrawals in 2010. Agriculture, however, accounts for approximately 80 to
483 Department of the Interior, The Budget for Fiscal Year 2017, pg 665

PART I
309
90% of U.S. consumptive water use.484 The 2015 survey has not been published at the time of
writing.
The subsidies covered in this section are primarily provided at the state and local level in the
form of water provided at below-market rates for use in agricultural production. In addition, in
some states the electricity used to run irrigation systems is also subsidized.485 Jacques Berthelot
has suggested we might provide more detail on our methodology. Essentially, we have
multiplied the estimated volume of irrigation water used, by the difference in the cost of water to
irrigation projects and to commercial users of water.
Irrigation has allowed the U.S. to develop a very profitable agricultural sector on arid and semi-
arid land. The USDA ERS has noted the important role that irrigation plays in U.S. agriculture,
“Irrigated agriculture, which accounts for the largest share of the Nation’s consumptive water use, makes a significant contribution to the value of U.S. agricultural production. In 2012, irrigated farms accounted for roughly half of the total value of crop sales on just 17 percent of U.S. cropland. (USDA 2016)”486
Federal support for irrigation is also provided through the Department of the Interior, Bureau of
Reclamation. The U.S. has notified to the WTO the amounts expended by the Bureau to support
irrigation programs as non-product specific support to build infrastructure to the WTO. The U.S.
has not notified the value of the subsidized irrigation water and services provided to its
agricultural producers.
The federal government’s direct expenditures on irrigation are not included in the Department of
Agriculture’s budget. Funds used to support irrigation infrastructure programs are included in
the Water and Related Resources Program operated by the Bureau of Reclamation, the total
budgetary resources available to support the obligations under this program, which include
484 United States Department of Agriculture, Economic Research Service, Irrigation &Water Use, Background, How Important is Irrigation to U.S. Agriculture? 485 Farms using electricity for irrigation increased 37% from 2003-2013. USDA, Trends in U.S. Agriculture’s Consumption and Production of Energy, August 2016, pg 15 486 Aillery, Marcel and Schaible, Glenn, USDA, ERS, Irrigation and Water Use: How Important is Irrigation to U.S. Agriculture?, October 12, 2016, pg 1
PART I
310
facility operations, facility maintenance and rehabilitation, water and energy management, fish
and wildlife management and land management and development, is reported as follows:487
2015 (Actual) $892,000,000
2016 (Estimate) $1,114,000,000
2017 (Estimate) $808,000,000
(b) WTO Consistency
Without the water provided through the irrigation infrastructure, agricultural production in the
eleven western states would be severely restricted. Therefore, the provision of subsidized water
is trade and production distorting. In many cases, irrigation is the difference between production
existing and not. Without this subsidy, there would be little or no production and certainly far
less production than currently exists in these states. On this basis, the irrigation subsidy
provided, including the amounts expended on infrastructure, must be included in the U.S.
AMS.488
487 Department of the Interior, The Budget for Fiscal Year 2017, pg 665 488 WTO Consistency of U.S. and New Zealand Agricultural Practices, Grey, Clark, Shih and Associates, Limited, July 15, 2003
“Water in its natural state is neither a good nor a service and is not subject to trade obligations…. Only water drawn from its natural state is subject to the rules and obligations in the trade agreements…. Water must be extracted to convert it from a natural resource into a good or service for purposes of the WTO. Government cannot be compelled, by trade obligations, to allow water to be drawn from its natural state, but once it voluntarily allows natural resources to be extracted for commercial purposes, the resulting goods or services will enter the flow of commerce and be subject to trade disciplines. In the present case, the water at issue is a good or service for purposes of the WTO because the United States Government voluntarily decided to allow this water to be drawn from its natural state for use to support agricultural production. This decision, and the subsequent act of drawing the water from its natural state for irrigation or other commercial purpose, converted that water into a good or service for purposes of the WTO.”
PART I
311
(c) Program Level
The FY 2017 Department of the Interior Budget Summary reports the following program levels
on account of Water and Related Resources:489
2015 (Actual) $892,000,000
2016 (Estimate) $1,114,000,000
2017 (Estimate) $808,000,000
(d) Allocation to Dairy
i) Infrastructure
This program does not provide benefits exclusively to dairy producers. Consequently, we cannot
attribute the entire value of the support provided under these programs to U.S. dairy producers.
Therefore, the value of the subsidies and support that benefits dairy production under these
programs is attributed on the basis of dairy’s share of the total value of U.S. agricultural
production. In 2015, all dairy production accounted for 10.54% of total U.S. agricultural
production.
Budgetary resources for this program in 2015 were $892,000,000. Based on dairy’s share of
total U.S. agricultural production, the allocation to dairy is $94,016,800.
The irrigation subsidy provided by the U.S. Federal Government through infrastructure support
constitutes a part of the overall support provided to U.S. producers and, in fact, is the only
portion of this support that is notified to the WTO by the United States.
The irrigation infrastructure provided by the U.S. government was introduced to enable and
promote agricultural production in the western desert regions. Agricultural producers in these
489 Department of the Interior, The Budget for Fiscal Year 2017, pg 665

PART I
312
regions are heavily dependent on government financed and supported irrigation schemes.
Without these irrigation projects, agricultural production would either not exist in these regions
or would be severely curtailed.
ii) Irrigation Water
Water provided through the irrigation projects confers a significant subsidy on to U.S.
agriculture producers. This benefit is provided in the form of water provided at below-market
rates. These benefits are primary provided to producers at the local level, which makes
determining the specific value of the subsidy very difficult. However, the value of these
subsidies was previously estimated by GCS at up to $33,000,000,000490.
In 2013 the U.S. Geological Survey (USGS) and the California Department of Water Resources
(DWR) estimates water use for agricultural irrigation in California at 25.8 million acre-feet491, on
the same report, Renee Johnson and Betsy A. Cody shows on the USDA’s 2013 Farm and Ranch
Irrigation Survey reports that, nationally, California has the largest number of irrigated farmed
acres compared to other states and accounts for about one fourth of total applied acre-feet of
irrigated water in the United States.492
490 WTO Consistency of U.S. and New Zealand Agricultural Practices, Grey, Clark, Shih and Associates, Limited, July 15, 2003 491 CRS, California Agricultural Production and Irrigated Water Use, By Renee Johnson and Betsy A. Cody, June 30, 2015.pg 1 492 Ibid., pg 14

PART I
313
California Water Use, USGS Estimates
Source: CRS from USGS data: M. A. Maupin, J. F. Kenny, S. S. Hutson, J. K. Lovelace, N. L. Barber, and K. S. Linsey, “Estimated Use of Water in the United States in 2010,” U.S. Geological Survey Circular 1405 (2014), p. 15. Notes: Graph shows amount of water “withdrawn” and used for different purposes. Data are for 2010.

PART I
314
Irrigation - Estimate Water Use for Agricultural Irrigation in the U.S. 493
Acre-feet of water used
in 2013
Water Rates Benefits in
2015 acre-feet
103,200,000 $353 Total (Water Use x Water Rate) $36,451,530,000
Water Rates 2015 per Acre-
foot
Water Rates 2015 per Acre-foot
Water Rates 2015 per Acre-
foot Residential Agricultural Difference San Diego $764 $582 $182 Vaughn (Bakersfield Area) $387 $82 $306 Southern California $1,239 $901 $338 Fresno $2,771 $2,184 $587 TOTAL AVERAGE $353
Sources: San Diego: Water Rates - San Diego Water Authority, Finance & Relations, Water Rates & Charges, (Equation: Melded Untreated M&I Supply rate - Special Agricultural Water Rate Untreated) Vaughn: Vaughn Water Company, Current Water Rates, (Equation: (Residential Rates - Flat Rate for property over 32,671 square foot) Southern California: Western Municipal Water District, Water Rates, (Equation: Non-Potable Water Rates Residential - Agricultural Water Rates) Fresno: City of Fresno, Schedule of Current and Proposed Schedule of Rates, Fees and Charges for Public Water Service, (Equation: Domestic water rates - Irrigation water rates)
As noted above our conservative estimate was $20 billion in order to avoid skewing the data by
water rates driven by drought.
Based on those numbers GCS estimates that about $20,000,000,000 in benefits have been
provide to producers in 2015. The number have been rounded from the multiplication of the total
acre-feet of water used in 2013 by the difference between Residential and Agricultural Rates –
per acre-feet – in 2015 on San Diego. If taken in consideration other counties the number would 493 Acre-feet of water used in 2013 - CRS, California Agricultural Production and Irrigated Water Use, June 2015 Water Rates - San Diego Water Authority, Finance & Relations, Water Rates & Charges (Equation: Melded Untreated M&I Supply rate - Special Agricultural Water Rate Untreated) 25.8 x 4 = 013.2 2016: 103,200,000 x 182 = 18,782,400,000 x 10.54% = 1,979,664,960 2017: 103,200,000 x 189 = 19,504,800,000 x 10.54% = 2,055,805,920

PART I
315
have been much higher, $36,451,530,000, as seen on table above. But for this report just the San
Diego rate has been used in order to avoid skewing the results due to drought in this period
examined.

PART II
316
OVERVIEW: PART II – STATE SUBSIDIES
Part II reviews the agricultural support programs maintained at the sub-national level in the U.S.
on a state by state basis. While the principal source of support to U.S. Agriculture is the USDA
at the federal level, the support at the sub-national level, which includes subsidized water for
irrigation, also provides very substantial benefits to agriculture and to dairy production. Many
State programs involve local delivery of USDA programs and funding. These federal programs
were addressed in Part I. States also provide infrastructure, services and support which appear,
in many cases, to be normal functions of government. We have listed details on selected
programs under each of the individual state sections to illustrate what the state does for
agriculture.
Based on our research and analysis, we estimate that for 2015, total U.S. state and local
government support to dairy production amounted to US$2,738,053,460 or at least US$1.31/cwt.
In Canadian dollars, using the 2015 average U.S. exchange rate for the Bank of Canada, this
support is approximately $3.79/hl.
Funding of State programs requires budgetary resources over and above those examined in
Part I. Like their USDA counterparts, many of the State Governments’ programs should be
included in the U.S. AMS. These programs provide direct support to agricultural producers that
reduce their costs and promote or influence agricultural production. These programs include
those which provide: preferential financing, loan guarantees, farmland security, grants and tax
incentives. Publicly available information on such programs (which varies considerably from
state to state) is addressed in this part of the study.
State Government support to agricultural producers generally falls into the category of general
services and infrastructure support. It includes inspection services, certification and grading
services, generic market promotion services, animal health, pest management, education and
training, environmental and conservation services, as well as advisory services. Many of these
programs involve delivery at the state level of USDA funding and services, often on a cost-

PART II
317
shared basis. While the costs and benefits of some of these programs would not likely be subject
to discipline in a countervailing duty investigation, and would not be included in the U.S. AMS,
they provide support to farmers and ranchers which is important in the aggregate. Indeed, this
support is far more extensive than exists in the vast majority of WTO member countries.
Therefore, these programs have been included in the overall estimate of State support and
allocated to dairy producers based on methodology discussed below.
In addition, state and local governments provide very extensive and important support through
irrigation subsidies in the form of below-market and below-cost price water provided for
agricultural use; we have not been able to analyze the extent of benefits for subsidized electricity
– often at less than 10% of commercial rates, to operate the irrigation systems.494
(i) State and Local Government Support
We have estimated the total value of agricultural subsidies and support provided at the sub-
national level in 2015 to be $7,049,918,596.
Generally, information available for programs and budgets at the state level is much less
comprehensive and transparent than the information published by the USDA, the Department of
the Interior and the OMB. Further, the value of tax incentives, or revenue foregone, is not
included in state agricultural budgets and we were not able to estimate their value.
We consider that the information available to us does not reflect the total value of support
provided to agricultural production through various sub-national Departments and Agencies.
There are also subsides to agricultural fuel,495 electricity and water which are revenue forgone
instead of expenditures or cash transfers. Nor have we been able to address motor fuel
494 The Environmental Working Group, Taxpayers Guarantee Central Valley Farms Water Through a Subsidy Worth Up to $416 Million per Year, December 2004, http://www.ewg.org/reports/watersubsidies/references.php 495 “The huge lies in the U.S. notification of its agricultural trade-distorting domestic supports from 2002 to 2005”, Jacques Berthelot, Solidarité, January 3, 2008

PART II
318
incentives at the state level for use of E-85496 and other ethanol blends. Therefore, we believe
that our estimates of subsidy and support levels understate the total value of support provided to
agricultural producers at the subnational level. Our review of publicly available information and
analysis suggests that expenditures may not be accurately or completely reported in all states.
(ii) Irrigation Subsidies
Blaine Hanson of the University of California explained that agriculture cannot compete
economically with the urban/industrial sector for water.497
• Agriculture uses a large amount of water per unit of production
• Consumers do not pay very much for the agricultural products
Blaine Hanson explains:
“Regardless of the economics, if we want food we will have to pay the price in terms of water and land for producing the agricultural products used to produce our food. There is no other choice if we want food!”
What percentage of California’s water is used by agriculture?
• 80 %: based on the developed water supply
• 52 %: based on the total water supply of a dry year
• 29 %: based on the total water supply of a wet year
Lower-cash value crops provide a major part of consumers diet.
• Agriculture is California’s largest user of water.
• It takes a lot of water to produce a crop.
496 For example: “Several states have established incentives for stations to convert or install retail fuel dispensing equipment for ethanol blends. These incentives can be in the form of a grant, tax credit, or a loan.” (Blend Your Own, http://www.byoethanol.org/incentives/state-incentives.html) 497 Irrigation of Agricultural Crops in California, Department of Land, Air and Water Resources, University of California, Blaine Hanson

PART II
319
• The price that society has to pay for food is the water and land required to produce the
crops needed for food. There is no other choice.
• It is unlikely that increasing irrigation efficiency will have a large impact in supplying the
predicted future water needs of the urban/industrial and environmental sectors.
• Agricultural land will need to be removed from production to supply the needed water.
Water Use of California Crops
Source: Irrigation of Agricultural Crops in California, Department of Land, Air and Water Resources, University of
California, Blaine Hanson
The Presentation asks, “Are We Wasting Water Growing Alfalfa?”
Alfalfa is an important part of a dairy cow’s feed.
• Alfalfa assist in the production of ice cream, milk, cheese, yogurt, butter.
• Seasonal Evapotranspiration of alfalfa = 55 inches of water = 55 acres-inches per acre =
1,500,000 gallons per acre

PART II
320
160 acres: ET = 160 acres x 1,500,000 gallons per acre = 240,000,000 gallons of water per year
(does not included irrigation system inefficiencies)
Evaporation of selected crops
Source: Irrigation of Agricultural Crops in California, Department of Land, Air and Water Resources, University of California, Blaine Hanson
While certain expenditures on irrigation infrastructure are reported at the federal level, by far the
greatest benefits are provided at the state and local level through the provision of below-cost and
below-market priced water for irrigation purposes. The total value of irrigation subsidies
provided by state and local government has been estimated at between $10,000,000,000 and
$33,000,000,000. Selecting the mid-point in this range, the total value of support provided
through irrigation subsidies at this sub-national level is estimated to be $21,500,000,000. This is
a conservative estimate – our analysis indicates that water usage increased about 8% between
2007 and 2012.498
498 USDA – ERS – How important is irrigation to U.S. Agriculture?

PART II
321
Actual estimate for 2015 was substantially higher as seen below. However, we consider the
estimate was inflated and sculled by drought.
Based on those numbers GCS estimates that about $20,000,000,000 in benefits have been
provide to producers in 2015. The number have been rounded from the multiplication of the total
acre-feet of water used in 2013 by the difference between Residential and Agricultural Rates –
per acre-feet – in 2015 on San Diego. If taken in consideration other counties the number would
have been much higher, $36,451,530,000, as seen on table below. But for this report just the San
Diego rate has been used in order to avoid skewing the results due to droughty in this period
examined.

PART II
322
Irrigation - Estimate Water Use for Agricultural Irrigation in the U.S. 499
Acre-feet of water used
in 2013
Water Rates Benefits in
2015 acre-feet
103,200,000 $353 Total (Water Use x Water Rate) $36,451,530,000
Water Rates 2015 per Acre-
foot
Water Rates 2015 per Acre-foot
Water Rates 2015 per Acre-
foot Residential Agricultural Difference San Diego $764 $582 $182 Vaughn (Bakersfield Area) $387 $82 $306 Southern California $1,239 $901 $338 Fresno $2,771 $2,184 $587 TOTAL AVERAGE $353
Sources: San Diego: Water Rates - San Diego Water Authority, Finance & Relations, Water Rates & Charges, (Equation: Melded Untreated M&I Supply rate - Special Agricultural Water Rate Untreated) Vaughn: Vaughn Water Company, Current Water Rates, (Equation: (Residential Rates - Flat Rate for property over 32,671 square foot) Southern California: Western Municipal Water District, Water Rates, (Equation: Non-Potable Water Rates Residential - Agricultural Water Rates) Fresno: City of Fresno, Schedule of Current and Proposed Schedule of Rates, Fees and Charges for Public Water Service, (Equation: Domestic water rates - Irrigation water rates)
As noted above our conservative estimate was $20 billion in order to avoid skewing the data by
water rates driven by drought.
499 Acre-feet of water used in 2013 - CRS, California Agricultural Production and Irrigated Water Use, June 2015 Water Rates - San Diego Water Authority, Finance & Relations, Water Rates & Charges (Equation: Melded Untreated M&I Supply rate - Special Agricultural Water Rate Untreated)

PART II
323
(iii) Support to Dairy Production
We have relied, to the extent that it is available, on 2015 data to determine the value of state and
local government support to U.S. dairy producers. We selected 2015 because it provides the
most recent actual budgetary expenditure and program level information available for all states.
The total share of dairy production in total agricultural production for individual states for 2015
was used, to ensure consistency with the 2015 budgetary expenditures.
Accordingly, we estimate that the total value of support for U.S. dairy in 2015 is the sum of the
total value of support provided under dairy specific state programs plus the total value of non-
dairy specific state programs allocated to dairy on the basis of the share of individual state dairy
receipts by the total individual state farm receipts.500
The total value of support provided by state and local governments in 2015 is estimated to be
$7,049,918,596. The total value of direct state and local government support to dairy production
and indirect support allocated to dairy production is $630,053,460.
Support provided through irrigation subsidies is direct but non-dairy-specific support which is
also allocated on the basis of dairy’s share of the total value of state agricultural production for
those states which are the principal beneficiaries of the irrigation programs. In 2009, we
estimate that the total value of irrigation subsidies provided to agriculture by state and local
governments was $20,000,000,000. On this basis, the total amount of irrigation subsidies
allocated to dairy production in 2015 is $2,108,000,000.
Therefore, we estimate that the total value of support to dairy production provided by state and
local governments is $2,738,053,460 - the aggregate of support to dairy production provided by
state and local governments and through irrigation subsidies provided by state and local
governments.
500 USDA Economic Research Service, Data Sets, Top Commodities, Exports and Countries

PART II
324
In 2015, total U.S. milk production was 208,603,000,000 lbs501 or 2,086,030,000 cwt.
Therefore, total state and local government support per cwt was approximately $1.31. Using the
U.S. dollar 2015 average exchange rate to the Canadian dollar provided by the Bank of Canada,
which was $1.27871080, the U.S. federal support per hundredweight in Canadian dollars was
$1.67CAD.
Converted to hectoliters the value of the subsidies in Canadian dollars was $3.79CAD/hl.
The following table summarizes on a state by state basis, support to agriculture in 2009, and the
allocation to dairy products:
U.S. State Support to Agriculture 2015
Section State Support to Agriculture
(US$)
Allocation to Dairy
(%)
Allocation to Dairy (US$)
1 Alabama $38,267,357 0.4% $153,069 2 Alaska $2,211,100 2.0% $44,222 3 Arizona $14,310,400 18.4% $2,633,114 4 Arkansas $52,631,668 0.2% $105,263 5 California $324,606,000 13.4% $43,497,204 6 Colorado $46,274,053 9.0% $4,164,665
501 National Agricultural Statistics Service (NASS): Milk Production

PART II
325
U.S. State Support to Agriculture
2015
Section State Support to Agriculture
(US$)
Allocation to Dairy
(%)
Allocation to Dairy (US$)
7 Connecticut $31,792,000 12.8% $4,069,376 8 Delaware $12,120,700 1.3% $157,569 9 Florida $1,529,394,250 6.6% $100,940,021 10 Georgia $49,988,777 3.9% $1,949,562 11 Hawaii $50,997,083 1.4% $713,959 12 Idaho $206,050,000 31.8% $65,523,900 13 Illinois $103,442,000 2.1% $2,172,282 14 Indiana $8,647,019 6.2% $536,115 15 Iowa $131,346,568 3.0% $3,940,397 16 Kansas $44,935,487 3.4% $1,527,807 17 Kentucky $32,053,100 3.4% $1,089,805 18 Louisiana $75,112,417 1.1% $826,237 19 Maine $32,386,640 15.9% $5,149,476 20 Maryland $76,371,000 7.8% $5,956,938 21 Massachusetts $20,794,000 9.7% $2,017,018 22 Michigan $84,462,200 21.8% $18,412,760 23 Minnesota $40,553,000 10.1% $4,095,853 24 Mississippi $643,868,132 0.6% $3,863,209 25 Missouri $31,354,486 2.5% $783,862 26 al $26,115,028 1.2% $313,380 27 Nebraska $20,972,639 1.0% $1,427,132 28 Nevada $163,546,886 16.1% $26,331,049 29 New Hampshire $5,365,720 20.7% $1,110,704 30 New Jersey $19,742,000 2.1% $414,582 31 New Mexico $36,103,000 41.3% $14,910,539 32 New York $104,699,000 47.9% $50,150,821 33 North Carolina $171,844,413 1.6% $2,749,511 34 North Dakota $716,511,228 0.8% $5,732,090 35 Ohio $52,613,000 10.6% $5,576,978 36 Oklahoma $98,503,850 1.9% $1,871,573 37 Oregon $55,607,024 9.5% $5,282,667 38 Pennsylvania $338,859,000 26.7% $93,369,353 * 39 Rhode Island $107,300,000 3.7% $3,970,100 40 South Carolina $15,904,433 2.1% $333,993 41 South Dakota $46,064,709 4.7% $2,165,041

PART II
326
U.S. State Support to Agriculture
2015
Section State Support to Agriculture
(US$)
Allocation to Dairy
(%)
Allocation to Dairy (US$)
42 Tennessee $96,465,200 3.8% $3,665,678 43 Texas $629,364,745 7.7% $48,461,085 44 Utah $29,875,782 18.9% $5,646,523 45 Vermont $17,697,975 60.0% $10,618,785 46 Virginia $64,027,785 9.1% $5,826,528 47 Washington $82,804,500 11.3% $9,356,909 48 West Virginia $348,750,000 3.3% $11,508,750 49 Wisconsin $97,074,100 46.0% $44,654,086 50 Wyoming $20,137,143 1.4% $281,920 Total $7,049,918,596 $630,053,460
*Please refer to Section 38 – Pennsylvania for details on dairy allocation calculations. **Please refer to Section 49 – Wisconsin for details on dairy allocation calculations.

PART II - ALABAMA
327
1. ALABAMA
Agricultural producers in Alabama benefit from subsidies and support provided by the
Department of Agriculture and Industries, the Alabama Center Board and the Agricultural and
Conservation Development Commission. The aggregate subsidies and support provided through
these bodies is reported as follows:
FY 2015 (Actual)502 $38,267,357
FY 2016 (Budgeted)503 $37,617,829
The State of Alabama administers the following programs:
- Agricultural Development Services Program - Capital Outlay Program - Agricultural Inspection Services Program - Laboratory Analysis and Disease Control Program - Administrative Services Program
Many of these programs are state level vehicles for delivering USDA funding and services.
Federal Programs for Alabama
- Conservation Reserve Program (CRP) - Emergency Conservation Program (ECP) - Emergency Forestry Restoration Program (EFRP) - Biomass Crop Assistance Program (BCAP) - The Grassland Reserve Program (GRP) - Non-insured Assistance Program (NAP) - The Livestock Forage Program (LFP) - Livestock Indemnity Program (LIP) - Emergency Livestock Assistance Program (ELAP) - Tree Assistance Program (TAP) - Farm Storage Facility Loans - Marketing Assistance Loans - Margin Protection Program for Dairy (MPP-Dairy) - Farm Ownership Loans - Farm Operating Loans
502Budget Fact Book, FY 2015, Alabama Legislative Fiscal Office, pg 19 503 Budget Fact Book, FY 2016, Alabama Legislative Fiscal Office, pg 21

PART II - ALABAMA
328
- Microloans - Socially Disadvantaged Loans
The programs administered by these agencies do not provide support exclusively to dairy.
Therefore, the total value of the support attributable to dairy production is calculated on the basis
of dairy’s total share of state agricultural production. We recognize that this methodology will
result in the amount of support allocated to dairy being overstated in some states and understated
in others. However, this methodology has been adopted because it allows us to determine the
amount of support allocated to dairy producers by the state governments, on an aggregate basis.
Total support provided to agricultural producers by Alabama in 2015 was $38,267,357, and the
percentage allocation to dairy for Alabama in 2015 was 0.4%. Therefore, the total amount of
support and subsidies allocated to dairy production in 2015 is $153,069.

PART II - ALASKA
329
2. ALASKA
Agricultural producers in Alaska benefit from subsidies and support provided by the Division of
Agriculture of the Department of Natural Resources. The budget for the Division of Agriculture
is reported as follows:504
FY 2015(Allocations) $2,211,100
The State of Alaska administers the following programs:
- Agricultural Revolving Loan Fund (ARLF) - Agricultural Development - North Latitude Plant Material Center
Many of these programs are state level vehicles for delivering USDA funding and services. We
have selected a few for specific consideration for illustrative purposes – and in some cases to
identify supplementary support.
Federal Programs for Alaska
Farm Loan Programs - Direct Loan Programs
o Farm Ownership Loans o Farm Operating Loans o Emergency Loans o Youth Loans o Indian Tribal Land Acquisition Program o Guaranteed Loan Programs o Farm Ownership Loans o Farm Operating Loans
504 Laws of Alaska 2015, an Act making appropriations for the operations any loan program expenses of State Government, pg 31

PART II - ALASKA
330
Federal Price Support Programs Federal Conservation Programs - Conservation Reserve Program (CRP) - Conservation Reserve Enhancement Program (CREP) - Emergency Conservation Program (ECP) - Environmental and Cultural Resource Compliance - Farmable Wetlands Program - Grassland Reserve Program (GRP) - Source Water Protection Program
Disaster Assistance - Emergency Loans - Emergency Conservation Program - Noninsured Crop Disaster Program
The programs administered by the Division of Agriculture do not provide support exclusively to
dairy. Therefore, the total value of the support attributable to dairy production is calculated on
the basis of dairy’s total share of state agricultural production. We recognize that this
methodology will result in the amount of support allocated to dairy being overstated in some
states and understated in others. However, this methodology has been adopted because it allows
us to determine the amount of support allocated to dairy producers by the state governments, on
an aggregate basis.
Actual expenditures by the Division of Agriculture in 2015 were $2,211,100, and the percentage
allocation to dairy for Alaska in 2015 was 2.0%. Therefore, the total amount allocated to dairy
production for 2015 is $44,222.505
On examining the programs administered by the Department, which can involve loans to nearly
the same value as the budget, we consider that our methodology understates both total
expenditures and benefits to dairy. But this is all the information available.
505 We note that in 2007-8, there were reports of loans and grants in excess of $2 million to a single dairy in Alaska. This was highly publicized as “Dairygate” and was tied to the Administration of former Alaska Governor Sarah Palin. Source information was a number of blogs. We have not included these reports in our estimates.

PART II - ALASKA
331
Agricultural Revolving Loan Fund
(a) Program Description
The Agricultural Revolving Loan Fund is a program established to promote the development of
agriculture as an industry through moderate interest rate loans.
Individuals may borrow up to $1,000,000 to finance annual operating expenses, to purchase
equipment or livestock, to purchase and install irrigation equipment, to build and equip
processing facilities and to finance land clearing activities.506
The program describes the loans as being made at moderate interest rates. The loan terms,
including the payment terms, are made on the basis of the applicant’s ability to service the
loans.507
(b) WTO Consistency
The provision of loans at moderate rates through this program confers a subsidy on eligible
recipients. As the purpose of the loan program is to promote the development of agriculture in
Alaska, the loans are intended to have trade and/or production distorting effects. Therefore, the
value of the subsidy provided under this program should be included in the U.S. AMS.
506 “Financing for Alaska Agriculture”, Agricultural Revolving Loan Fund, Alaska Department of Natural Resources, Division of Agriculture, www.dnr.state.ak.us/ag/ag_arlf.htm 507 Ibid.

PART II - ALASKA
332
(c) Expenditures
The Allocation Detail from the FY 2015 Appropriations Act for the Department of Natural
Resources reports the following as the total allocation for the Agricultural Revolving Loan
Program Administration:508
2015 (Allocations) $2,533,800
(d) Allocation to Dairy
This program does not provide support exclusively to dairy producers. Therefore, the total value
of the support attributable to dairy production is calculated on the basis of dairy’s total share of
state agricultural production. We recognize that this methodology will result in the amount of
support allocated to dairy being overstated in some states and understated in others. As we noted
in Part I, this averaging technique ignores the fact that many U.S. producers do not benefit from
subsidies – so the averaging technique is likely to understate benefits to dairy producers.
The percentage allocation to dairy for Alaska in 2015 was 2.0%. Actual expenditures by Alaska
under this program in 2015 were $2,533,800. Therefore, the total amount allocated to dairy
production for 2015 is $50,676.
508 Laws of Alaska 2015, an Act making appropriations for the operations any loan program expenses of State Government, pg 53

PART II - ALASKA
333
Agricultural Land Management
(a) Program Description
The objective of the Agricultural Land Management Program is to make agricultural land
available for sale, lease or permits as funding allows. To achieve this objective, an inventory of
unsold lands classified for agriculture is maintained for future sales. These sales can be made
subject to development requirements and conservation plans.509
(b) WTO Consistency
Based on the information available, it appears that this program is intended to protect agricultural
land from commercial or residential development and ensure its future use in agricultural
production. Consequently, it appears that this program is intended to make this land available
for farming at below market rates (i.e., at below its value for other uses). Therefore, the
provision of land at below market rates for agricultural production confers a subsidy on the
recipient. The program will apparently reduce the recipient’s costs and will also encourage
production thereby having trade and/or production distorting effects. Therefore, the value of the
subsidies provided under this program should be included in the U.S. AMS.
(c) Expenditures and Allocation to Dairy
The budgetary information available from the State of Alaska is not sufficiently detailed to allow
us to determine total expenditures under this program or to determine an appropriate allocation to
dairy.
509 Agricultural Land & Sales Management, Department of Natural Resources, Division of Agriculture, www.dnr.state.ak.us/ag/ag_sales.htm

PART II - ARIZONA
334
3. ARIZONA
The Arizona Department of Agriculture operates a broad range of programs and provides
services that support agricultural production and producers. The Budget for the Department of
Agriculture reports the following expenditures on account of all Departmental programs: 510
2015 (Actual) $14,310,400
2016 (Estimate) $17,122,800
2017 (Estimate) $16,522,100
The State of Arizona administers the following programs:
- Agricultural Consulting and Training Trust - Agricultural Products Marketing - Aquaculture Trust - Beef Council - Citrus, Fruit and Vegetable Trust - Citrus Trust - Commercial Feed Trust - Commodity Promotion - Cotton Research and Protection Council - Dangerous Plants, Pests and Diseases Trust - Designated - Egg Inspection - Equine Inspection - Federal - Federal-State Inspection - Fertilizer Materials Trust - Grain Trust - Iceberg Lettuce Trust - IGA and ISA - Indirect Cost Recovery - Livestock and Crop Conservation - Livestock Compensation - Livestock Custody Trust - Nuclear Emergency Management - Pesticide Trust - Protected Native Plant Trust
510 FY 2017 Baseline Summary, January 2016, pg 31

PART II - ARIZONA
335
- Seed Trust
Many of these programs are state level vehicles for delivering USDA funding and services. We
have not addressed any of these programs in the body of this report due to the paucity of
information available, and in order to avoid repetition.
Federal Programs for Arizona
Price Support Programs - Farm storage facility Loans (FSFL) - Marketing Assistance Loans (MAL) and Loan Deficiency Payment (LDP) Program
Disaster and Production Programs - Non-insured Crop Disaster Assistance Program (NAP) - Margin Protection Program for Dairy (MPP- Dairy) - Livestock Indemnity Payment Program (LIP) - Emergency Assistance for Livestock, Honeybees and Farm-Raised Fish Program (ELAP)
Livestock Forage Disaster Program (LFP) Common Provisions Programs - Payment Limitation (PL) - Adjusted Gross Income (AGI)
Farm Loan Programs - Direct Farm Operating Loans and Microloans - Guaranteed Farm Loans - Youth Loans
Conservation and Special Programs - Emergency Conservation Program (ECP) - Grassland Reserve Program (GRP) - Biomass Crop Assistance Program (BCAP)
The programs administered by the Department of Agriculture do not provide support exclusively
to dairy producers. Therefore, the total value of the support attributable to dairy production is
calculated on the basis of dairy’s total share of state agricultural production. We recognize that
this methodology will result in the amount of support allocated to dairy being overstated in some
states and understated in others. However, this methodology has been adopted because it allows

PART II - ARIZONA
336
us to determine the amount of support allocated to dairy producers by the state governments, on
an aggregate basis.
Actual expenditures by the Department of Agriculture in 2015 were $14,310,400, and the
percentage allocation to dairy for Arizona in 2015 was 18.4%. Therefore, the total amount
allocated to dairy production for 2015 is $2,633,114.

PART II - ARKANSAS
337
4. ARKANSAS
Agricultural producers in Arkansas benefit from support provided through a range programs
operated by various government agencies. Appropriations for these boards are described in the
State of Arkansas Actual Expenditures Fiscal Year 2009 as follows:
2015 511
Beef Council $754,293
Catfish Promotion Board $38,210
Corn and Grain Sorghum Promotion Board $1,058,370
Soybean Promotion Board $6,457,990
Wheat Promotion Board $155,646
Agriculture Department $44,167,159
Total $52,631,668 512
The State of Arkansas administers the following programs:
Annual Programs - Arkansas Farmers Market Promotion Grant - Arkansas Farmers Market Bag Program - Farmers’ Market Vendor Guide - Grow Arkansas Booklet - Arkansas Food and Farm Magazine Alternative Fuels Development Program National Organic Program Cost Share Grain Warehouses Century Farm Program
511 State of Arkansas Actual Expenditures, Fiscal Year 2015, pg 2 512 Ibid., pg 4

PART II - ARKANSAS
338
Arkansas Homegrown by Heros Program
Many of these programs are state level vehicles for delivering USDA funding and services. We
have selected a specific consideration for illustrative purposes – and in some cases to identify
supplementary support.
Federal programs for Arkansas
Farm Loan Programs - Beginning Farmers and Ranchers Loans - Socially Disadvantaged Farmers and Ranchers - Emergency Farm Loans - Rural Youth Loans - Microloans - Farm Operating Loans - Farm Ownership Loans - Guaranteed Farm Loans Commodity Programs - Agriculture Risk Coverage (ARC) and Price Loss Coverage (PLC) Price Support - Commodity Loans (MAL) - Cotton - Facility Loan Program (FSFL) - Loan Deficiency Payment (LDP) - Loan Rates - Milk Income Loss Contract Program (MILC) Conservation - Biomass Crop Assistance Program (BCAP) - Conservation Reserve Program (CRP) - Emergency Conservation Program (ECP) - Grassland Reserve Program (GRP) Disaster Assistance Program - Livestock Forage Program (LFP) - Emergency Assistance for Livestock, Honey Bees and Farm-raised Fish (ELAP) - Livestock Indemnity Program (LIP) - Non-insured Assistance Program (NAP) - Supplemental Revenue Assistance Payments (SURE) - Tree Assistance Program (TAP)
PART II - ARKANSAS
339
The programs administered by these agencies do not provide support exclusively to dairy
producers. Therefore, the total value of the support attributable to dairy production is calculated
on the basis of dairy’s total share of state agricultural production. We recognize that this
methodology will result in the amount of support allocated to dairy being overstated in some
states and understated in others. However, this methodology has been adopted because it allows
us to determine the amount of support allocated to dairy producers by the state governments, on
an aggregate basis. In this case, much of the support is dedicated to non-dairy products. But
dairy producers will benefit from several activities.
Appropriations for programs administered by these agencies in 2015 were $52,631,668, and the
percentage allocation to dairy for Arkansas in 2015 was 0.2%. Therefore, the total amount
allocated to dairy production for 2015 is $105,263.
PART II - ARKANSAS
340
Arkansas Farmers Promotion Program
(a) Program Description
The Arkansas Farmers Market Promotion Program provide grants to established farmers market
organizations throughout the state that will help fund promotional items designed to build
awareness of farmers market locations and offerings. Applications are available until beginning
of April, grants recipients are announced in May, and funds must be utilized by December of the
that fiscal year.
Grants through the Arkansas Farmers Market Promotion Program are made available by Farm
Credit.
Any farmers market across Arkansas that meets the following criteria is eligible to apply: 1) The
farmers market location must be a place where a farmer may offer for sale the produce of his/her
farm at least weekly during the months of May, June, July, and August; and 2) The farmers
market must be governed by an organized body in freely obtainable bylaws or market guidelines;
and 3) On any given market day, the farmers market must have at least 50% farmer-vendors.
Farmers Market Promotion Grants may fund the following promotional items to build
community and regional awareness for a specific farmers market offerings: signage listing
names, seasons, times of operation, and location details; local advertising including print, radio,
and television media projects; and even social media campaigns.
Grants obtained through this program helps to connect consumers with Arkansas agricultural
producers and also increases consumer awareness of the farmers markets located in the state
help to expand market opportunities for producers while also helps to put money back into the
local economies. 513
513 https://www.organicconsumers.org/news/arkansas-farmers-market-promotion-grants-available

PART II - ARKANSAS
341
(b) WTO Consistency
It is not clear from the information available whether or not this program would meet the
requirements of Annex 2.2(f) to the WTO Agreement on Agriculture. Any grants provided to
eligible farmers under this program must be included in the U.S. AMS. These funds are intended
to program helps to connect consumers with Arkansas agricultural producers and helps to expand
market opportunities for producers. Consequently, the grants provided are intended to have
production and/or trade distorting effects.
(c) Expenditures and Allocation to Dairy
The budgetary information available from the State of Arkansas does not Provide sufficient
detail to allow us to determinate expenditures under this program.

PART II - CALIFORNIA
342
5. CALIFORNIA
Agricultural policies and programs and primarily delivered by the California Department of Food
and Agriculture. The total funding for all programs, as set out in the Governor’s
Budget/Proposed Budget Detail is reported as follows:514
2015 $324,606,000
2016 $449,062,000
2017 $439,211,000
The State of California administers the following programs:
- Avocado Inspection Program - Biological Control Program - California Citrus Program - California Organic Program - California Type Evaluation Program - Certified Farmers Market Program - Dairy Digester Research and Development Program - Device Enforcement Program - Egg Safety and Quality Management Program - Equine Medication Monitoring Program - Emergency Animal Disease Program - Exotic Pest Research Program - Fertilizer Research and Education Program - Milk and Dairy Food Safety - Milk Pooling - Motor Oil Fee Program - Organic Program, California - Pest Detection Emergency Projects - Petroleum Products Program - Pierce's Disease Control Program - Pink Bollworm Program - Plant Protection and Plant Health - Preventative Release Program - Quantity Control Program - Senior Farmers Market Nutrition Program - Small Business & Disabled Veterans Business Enterprise Program
514 California Department of Food and Agriculture Budget FY 2016-2017, pg GG 1

PART II - CALIFORNIA
343
- Specialty Crop Block Grant Program - Standardization Program - State Water Initiative and Enhancement Program - Type Evaluation Program
Many of these programs are state level vehicles for delivering USDA funding and services. We
have selected a few for specific consideration for illustrative purposes – and in some cases to
identify supplementary support.
Federal programs for California
- Agricultural Mediation Program - Beginning Farmer Downpayment Loan - Conservation Reserve Program (CRP) - Dairy Indemnity Payment Program - Direct Farm Ownership Loan - Direct Operating Loan - Economic Emergency Loan Program - Emergency Conservation Program (ECP) - Emergency Loans - Extra Long Staple Cotton Competitiveness Program - Farm Storage Facility Loan Program - Grassland Reserve Program (GRP) - Guaranteed Farm Ownership Loan - Guaranteed Operating Loan - Indian Tribal Land Acquisition Program - Non-insured Crop Disaster Assistance Program (NAP) - Non-recourse Marketing Assistance Loan and Loan Deficiency Payment (LDP) Programs - Sugar Storage Facility Loan Program - Youth Loan
While the Department of Food and Agriculture has several programs which support exclusively
to dairy producers, there is not enough information available to calculate these benefits.
Therefore, the total value of the support attributable to dairy production is calculated on the basis
of dairy’s total share of state agricultural production. We recognize that this methodology will
result in the amount of support allocated to dairy being overstated in some states and understated
in others. However, this methodology has been adopted because it allows us to determine the
amount of support allocated to dairy producers by the state governments, on an aggregate basis.

PART II - CALIFORNIA
344
Budgetary funding on account of all California food and agriculture programs in 2015 was
$324,606,000, and dairy accounted for 13.4% of the value of production for California in 2015.
Therefore, the total amount allocated to dairy production for 2015 is $43,497,204.
It is important to note that agricultural production in California is one of the major beneficiaries
of irrigation subsidies which are addressed separately.

PART II - CALIFORNIA
345
Dairy Pricing
(a) Program Description
The Dairy Marketing Branch of the Department of Food and Agriculture regulates the price of
dairy products with the result that California provides an export subsidy on the export sale of
specified dairy products.
California establishes different prices for dairy products, in part, depending on where they are
sold, including sales outside the state, outside the contiguous 48 states and outside the U.S.
Prices are calculated on the basis of five classes of milk (1, 2, 3, 4a, and 4b).
Some products are sold at different prices depending on whether or not they are sold for export.
Consequently, cottage cheese, soft fresh cheese, sour cream, light sour cream, yogurt and yogurt
drink fall under Class 4a if they are intended for export sale, otherwise they fall under Class 2. 515
(b) WTO Consistency
California’s administered price system requires that certain products be sold on the export
market at below the set domestic price. By requiring that these products be sold, for export, at a
price below the prevailing domestic price, California is providing an export subsidy for purposes
of the Agreement on Agriculture and the Agreement on Subsidies and Countervailing Measures.
A subsidy is a financial contribution by government that confers a benefit on the recipient. In this
case, purchasers of certain exported dairy products receive the benefit of purchasing those
products at a price below the prevailing domestic market price. As the Dairy Board establishes
the domestic price and export price of those products, benefit conferred on the purchaser in the
form of lower prices is conferred by government. Thus, the administered pricing confers a
515 California Department of Food and Agriculture, Dairy Prices, Minimum Class and Pool Prices from Dairy Information Bulletin

PART II - CALIFORNIA
346
subsidy. The subsidy is an export subsidy because it is only provided on the export sale of the
specific products.
The total value of the export subsidy is the difference between the domestic and export price of
the specific product multiplied by the total volume of exported products. This amount, which is
not tied to the budgetary allocation to operate the pricing mechanism, must be notified to the
WTO and counted against the U.S. obligation on total export subsidies.
(c) Expenditures and Allocation to Dairy
The total value of the export subsidy provided through the pricing program is not tied to the
budgetary allocation to operate the pricing program administration. Rather, the total value of the
export subsidy provided is the difference between the domestic and export price of the specific
product multiplied by the total volume of exported products. This amount cannot be readily
calculated from information available to us. However, the total value of this export subsidy must
be allocated to dairy producers. This amount cannot be readily calculated from information
available to us. However, the total value of this export subsidy must be allocated to dairy
producers.

PART II - CALIFORNIA
347
Direct Farm Ownership Loan
(a) Program Description
A loan made to eligible applicants to purchase, enlarge or make capital improvements to family
farms, or to promote soil and water conservation and protection. Maximum direct loan amount is
$300,000. A percentage of direct Farm Ownership loan funds are targeted for beginning farmers
and socially disadvantaged applicants.516
(b) WTO Consistency
There are similar programs in a number of states. These loans provide benefits to recipients and
are designed to promote production. Therefore, any expenditures under this program (and
similar programs delivered in other states) should be included in the U.S. AMS.
(c) Expenditures and Allocation
This program expends USDA funding which has been addressed in Part I. The information
available to us does not permit determination of administrative and program delivery costs, and
this precludes any allocation to dairy.
516 USDA, Programs, FSA Administered Programs, Direct Farm Ownership Loan

PART II - CALIFORNIA
348
Milk Producers Security Trust Fund
(a) Program Description
The Milk Producers Security Trust Fund was created by state law in 1987 to protect producers
from handler payment defaults. The Fund contains a sufficient amount of money to cover 110%
of one month’s milk purchases by the milk handler with the largest monthly producer payment
obligation.517
(b) WTO Consistency
This program arguably encourages production as the state is carrying credit risk for the producer.
Expenditures under the program should be included in the calculation of the U.S. AMS.
(c) Expenditures and Allocation to Dairy
The budgetary information available from the State of California is not sufficiently detailed to
allow us to determine total expenditures under this program which, if it could be determined,
would be allocated 100% to dairy producers.
517 Milk Producers Security Trust Fund, California Department of Food and Agriculture

PART II - CALIFORNIA
349
Dairy Marketing Branch
(a) Program Description
The Dairy Marketing Branch (DMB) promotes, fosters and encourages sound production and
marketing of milk that reflect market conditions by resolving critical policy issues such as
manufacturing cost allowances, yields, and other adjustment factors in milk pricing, market price
fluctuations, the formation of monopolies, and law enforcement. The Branch is organized into
five units, each of which concentrates on a specific area of work that contributes to
administration of the Plans. The DMB’s five units are Cost of Production, Manufacturing Cost,
Enforcement, Statistics and Economics.518
(b) WTO Consistency
This would appear to be a Government service/support function, rather than a program.
However, it does provide important support to dairy farmers in California. It would appear that
based on the information available, the activities of this Branch are intended to provide price and
income support to dairy producers. To the extent this is normal government infrastructure, it
would be difficult to argue, based on current rules that it is WTO inconsistent, or must be
included in the U.S. AMS. There is not sufficient information available to argue otherwise.
(c) Expenditures and Allocation to Dairy
The budgetary information available from the State of California is not sufficiently detailed to
allow us to determine in a specific way benefits to dairy producers resulting from these activities
and support.
518 Dairy Marketing Branch, California Department of Food and Agriculture
PART II - CALIFORNIA
350
Dairy Quality Assurance Program
(a) Program Description
The goal of this program is to develop a dairy quality assurance program for California dairies.
Three components were identified for the California Dairy Quality Assurance Program
(CDQAP): environmental stewardship, food safety, and animal care and welfare. The California
Department of Food and Agriculture provides technical assistance in all three-component areas
of the CDQAP.519
(b) WTO Consistency
This program would appear to be a normal function of government. We consider that based on
current rules and interpretations of the Agreement on Agriculture, the expenditures to implement
this program would not be part of the U.S. AMS.
(c) Expenditures and Allocation to Dairy
The budgetary information available from the State of California is not sufficiently detailed to
allow us to determine the benefits to dairy producers resulting from this Departmental technical
assistance.
519 Dairy Quality Assurance Program, California Department of Food and Agriculture

PART II - COLORADO
351
6. COLORADO
The total budgetary appropriations on behalf of Agricultural programs administered by Colorado
were reported as follows:
FY 2014-2015 (Appropriation) $44,206,921520
FY 2015-2016 (Appropriation) $46,274,053521
The State of Colorado administers the following programs:
- Advancing Colorado's Renewable Energy (ACRE) Program - Agritourism - Beginning Farmer Program - Colorado Non‐Immigrant Agricultural Seasonal W orker Program - Colorado Agricultural Value‐Added Development Board - Fruit & Vegetable Inspection - Good Agricultural Practices/Good Handling Practices Audit Verification Program - Hay Resources - Market Orders - Mobile Slaughter Units - Seal of Quality - Specialty Crop Block Grant Program - The Centennial Farm Program
Many of these programs are state level vehicles for delivering USDA funding and services. We
have selected a specific consideration for illustrative purposes – and in some cases to identify
supplementary support.
Federal programs for Colorado
- Agriculture Mediation Program - Beginning Farmer Down Payment Loan - Conservation Reserve Program (CRP) - Conservation Reserve Enhancement Program (CREP) - Direct and Counter-cyclical Payment (DCP) Program - Direct Farm Ownership Loan
520 State of Colorado Joint Budget Committee Fiscal Year 2015-16 Appropriation Report, pg 15 521 Ibid., pg 16

PART II - COLORADO
352
- Direct Operating Loan - Emergency Conservation Program (ECP) - Emergency Farm Loans - Farm Storage Facility Loan Program - Grassland Reserve Program (GRP) - Guaranteed Farm Ownership Loan - Guaranteed Operating Loan - Indian Tribal Land Acquisition Program - Margin Protection for Dairy Producers (MPP-Dairy) - Non-insured Crop Disaster Assistance Program (NAP) - Non-recourse Marketing Assistance Loan and Loan Deficiency Payment (LDP) Program - Sugar Loan Program and Sugar Marketing Allotments - Sugar Storage Facility Loan Program - Youth Loans
Colorado’s expenditures and appropriations in support of agriculture do not provide support
exclusively to dairy producers. Therefore, the total value of the support attributable to dairy
production is calculated on the basis of dairy’s total share of state agricultural production. We
recognize that this methodology will result in the amount of support allocated to dairy being
overstated in some states and understated in others. However, this methodology has been
adopted because it allows us to determine the amount of support allocated to dairy producers by
the state governments, on an aggregate basis.
Colorado’s appropriations on account of all agricultural programs in 2015 were $46,274,053, and
the percentage allocation to dairy for Colorado in 2015 was 9.0%. Therefore, the total amount
allocated to dairy production for 2015 is $4,164,665.

PART II - COLORADO
353
Value Added Processing Program
(a) Program Description
This program issues tax exempt bonds for development of agricultural processing facilities for
agricultural processors. 522
The Colorado Agricultural Value-Added Development Board (CAVADB) was created within the
Colorado Department of Agriculture by the Colorado Agricultural Development Authority Act
(CRS 35-75-201, et seq.). The CAVADB is composed of the seven members who are appointed
to the Colorado Agricultural Development Authority Board and the Commissioner of
Agriculture, who is an ex officio, non-voting member. This board serves to encourage and
promote agricultural business projects. The board has authority to make grants, loans, loan
guarantees and equity investments to any person for new or ongoing agricultural projects and
research that add value to Colorado agricultural products and aid the economy of rural Colorado
communities. Currently its focus is on the Advancing Colorado’s Renewable Energy (ACRE)
program, which promotes the development of agricultural energy efficiency and renewable
energy projects.523
(b) WTO Consistency
There is very little information on this program, but it would appear to be designed to facilitate
and encourage production. Tax exempt bonds confer benefits both on those holding the bonds,
and those whose projects benefit from much lower cost financing. Such bonds are a very
popular vehicle in the USA for encouraging development and employment. They may be used to
finance the building assets ranging from hockey arenas to auto assembly plants to dairy
processing plants.
522 Jim Rubingh, Value Added Processing Program, letter to National Council of State Agricultural Finance Programs 523 Colorado Department of Agriculture
PART II - COLORADO
354
(c) Expenditures and Allocation
The benefits of these bond issues are to those purchasing the bonds, revenue forgone by
government as the bonds are tax exempt. Farmers will benefit through lower cost investment
capital. There is insufficient information available to permit us to calculate the overall benefits
under this program or the benefits to dairy processors or producers.

PART II - CONNECTICUT
355
7. CONNECTICUT
Agricultural producers in Connecticut benefit from programs administered by the Connecticut
Department of Agriculture and the Agricultural Experiment Station. The Budget-in-Brief for the
Department of Agriculture reports the following as total funds available to the Department:524
2015 (Estimate) $19,896,000
2016 (Requested) $20,896,000
The Budget-in-Brief for the Agricultural Experiment Station reports the following as total funds
available to the Department:525
2015 (Estimate) $11,896,000
2016 (Requested) $12,313,000
The State of Connecticut administers the following programs:
- Agricultural Experiment Station - Animal Population Control Program - CT Grown Program - Environmental Assistance Program - Export Assistance Program - Farm-to-School Program - Farmland Preservation Program - Farmland Restoration Program - Farmers’ Market Nutrition Program – WIC and Senior Programs - Good Ag Practices (GAP) & Good Handling Practices (GHP) Audit Program - Risk Management Crop Insurance Program - “Second Chance” Large Animal Rehabilitation Facility - Shell Egg Processing Inspection Program - Small Poultry Processors Inspection Program - Farm Re-investment Grant - Farm State Assistance For Enhancements (SAFE) Grant - Farm Transition Grant Program
524 Governor’s Budget Plan 2016-2017, Financial Summary, pg A-34 525 Ibid., pg A-36

PART II - CONNECTICUT
356
- Farm Viability Grant - Organic Certification Cost Share Program - PA 09-229 Milk Producer (Dairy Sustainability) Grant - Specialty Crop Block Grant Program
Many of these programs are state level vehicles for delivering USDA funding and services. We
have selected a few programs or activities for specific consideration throughout this Part for
illustrative purposes – and in some cases to identify supplementary support.
Federal programs for Connecticut
- FSA Disaster Assistance Programs
- Connecticut Conservation Loan Programs
The Department of Agriculture Budget and the Agricultural Experiment Station do not provide
sufficient detail support exclusively to dairy producers. Therefore, the total value of the support
attributable to dairy production is calculated on the basis of dairy’s share of total state
agricultural production. We recognize that this methodology will result in the amount of support
allocated to dairy being overstated in some states and understated in others. However, this
methodology has been adopted because it allows us to determine the amount of support allocated
to dairy producers by the state governments, on an aggregate basis.
Total funding available to the Department of Agriculture and the Agricultural Experiment
Station in 2015 was $31,792,000, and the percentage allocation to dairy for Connecticut in 2015
was 12.8%. Of this total, therefore, the total amount allocated to dairy production for 2015 is
$4,069,376.

PART II - CONNECTICUT
357
Farmland Preservation Program
(a) Program Description
The mission of the Farmland Preservation Program is to preserve farmland soils by acquiring the
development rights on farms in farm communities.
The collective goal for the State is to preserve 130,000 acres of farmland, with 85,000 in
cropland. In 2008 and 2009, 40 farms comprised of 4,228 acres for $23,723,281 were negotiated
and approved for preservation.
As of December 2015, the program has preserved more than 41,500 acres on 315 farms. The
long-term goal is to preserve 130,000 acres.
Since inception of the Program, development rights have been acquired, or approved for
acquisition, on 268 farms totalling 35,518 acres by the State with help of the agricultural
community and private & public partner organizations.526
(b) WTO Consistency
Payments made under this program should be included in the U.S. AMS. The payments, which
are based on the notional development value of the land, ensure that the preserved agricultural
land remains in production and can be used by the producers for any purpose. The fact that the
preserved land cannot be used for non-agricultural uses indicates that it will continue to produce
agricultural products. Consequently, payments under this program represent direct payments to
producers specifically intended to ensure continued agricultural production. Thus, the payments
may not be excluded from the U.S. AMS.
526 2012 Annual Report Summary, Farmland Preservation Program, Connecticut Department of Agriculture, pg 1 of 2

PART II - CONNECTICUT
358
(c) Expenditures
Total expenditures under Farmland Preservation Program are reported as follows:527
2012 $4,094,327
2012 Annual Report Summary
Farmland Preservation Program
Preserved five farms comprised of 610 acres located in five towns, including one joint state-town
project with the Town of New Milford.
Protected three dairy support farms, including one with an emerging grape vineyard, a fruit &
vegetable farm, including orchards and small fruits, and a hay and vegetable farm.
Received a bargain sale of development rights to 184 acres in Woodstock through the generosity
of Dexter and Nancy Young.
Entered a cooperative agreement with the U.S. Department of Agriculture’s Natural Resources
Conservation Service for federal cost share dollars via the Farm & Ranch Lands Protection
Program in the amount of $4,094,327.
Farmland Restoration Program
At the Governor’s initiative, $5 million authorized by the State Bond Commission in January
2012 to increase the farm resource base. Received 63 applications on 800± acres for draining
improvements for orchards, stumping to increase pasture, and clearing invasive plant species
from fields. Total request in 2012: $800,080.
As of May 2015, the program has protected nearly 40,000 acres on more than 300 farms.
527 Ibid.

PART II - CONNECTICUT
359
Current state law gives the Commissioner of Agriculture the ability to pay up to $20,000 per
acre, subject to appraisal. However, from 2012 through 2014, the average price paid by the state
toward the purchase of easements was $6,993 per acre.
Community Investment Act (CIA) funds as follows: $100,000 for the “Connecticut Grown”
program to help brand and promote local agricultural products, $75,000 for the CT Farm Link
program to help farm seekers find farmland owners and $1 million for the Agriculture Viability
Grants Programs.528
(d) Allocation to Dairy
The Farmland Preservation Program does not provide support exclusively to dairy production.
However, supporting fluid milk production is clearly an objective of the program; as noted
above, it is intended that the preserved land base will enable Connecticut to produce at least 50%
of its fluid milk needs.
Based on the information available, we cannot determine the actual expenditures made in support
of dairy farms under this program. However, because one of the objectives of the program is to
produce at least 50% of Connecticut’s fluid milk needs on preserved land, it would be reasonable
to assume that expenditures made on account of dairy production under this program are greater
than dairy’s share of the total value of state agricultural production of 12.8% for Connecticut.
This assumption is also supported by the fact that, of the 130,000 acres that will be preserved
under this program, 85,000 acres will be cropland. In light of these figures, we believe that it is
reasonable to assume that at least 25% of the program expenditures are made on account of dairy
production. Based on this assumption, we estimate that of the $23,723,281expended in 2008 and
2009, $5,930,820.25 was provided in support of dairy production. In 2012 $4,094,327 was
expended, $1,023,581 was provided in support of dairy production.
528 Conservation Options for Connecticut Farmland

PART II - CONNECTICUT
360
Farm Reinvestment (Enhancement) Grant Program
(a) Program Description
The Farm Reinvestment (Enhancement) Grant Program provides grants to eligible producers for
capital enhancement of farms. The purpose of the program is to ensure a viable agriculture
industry. To qualify for funding, a farmer must apply for a grant, attend a one-day information
session and match or exceed the amount of the grant provided.
Any grants provided through this program must be used for projects defined as capital fixed
assets with a life expectancy of ten years or more. Grants may be used to expand existing
agricultural facilities or to diversify or expand into new production areas.529
(b) WTO Consistency
Any grants provided to eligible farmers under this program must be included in the U.S. AMS.
These funds are intended to ensure a viable agriculture industry through the development of
fixed capital assets that are directly related to existing production or to expanded production.
Consequently, the grants provided are intended to have production and/or trade distorting effects.
(c) Expenditures and Allocation to Dairy
The budgetary information available from the Government of Connecticut is not sufficiently
detailed to allow us to determine actual, estimated or budgeted expenditures on account of this
program.
529 Farm Reinvestment (Enhancement) Grant Program, Connecticut Department of Agriculture

PART II - CONNECTICUT
361
Tax Exemption for Farm Machinery
(a) Program Description
All farm machinery, except specific motor vehicles, to the value of $100,000 and any horse or
pony which is actually and exclusively used in farming, is exempt from local property taxation.
Only one exemption is allowed for each farmer, group of farmers, partnership or corporation for
each assessment year.530
Any municipality may provide an additional exemption from property tax for machinery to the
extent of an additional assessed value of $100,000.531
This is an interesting area of subsidization. In many states (indeed, in Canadian provinces)
motor vehicle fuel is tax exempt for farm use. Indeed, in the current live swine CVD
investigation by the U.S. Department of Commerce, it was alleged that the exemption in
Saskatchewan was a countervailing subsidy. We have not attempted to capture these farmer fuel
tax exemptions in this study.
(b) WTO Consistency
The support provided through the Tax Exemption program constitutes a subsidy, in the form of
foregone revenue, for purposes of Article 1.1(a)(1)(ii) of the WTO Agreement on Subsidies and
Countervailing Measures. As the apparent purpose of the tax exemption is to provide an
incentive to the purchase of farm equipment, it appears that the exemption will result in
increased production and, consequently, should have trade and/or production distorting effects.
In these circumstances, the domestic support provided through this tax exemption should be
included in the U.S. AMS.
530 Connecticut General Statutes, Sec. 12-91(a) 531 Ibid., Sec. 12-91(b)

PART II - CONNECTICUT
362
(c) Expenditures and Allocation to Dairy
Based on the information available, it is clear that the tax exemption is available to all
Connecticut farmers, including dairy farmers. However, as the program operates as a tax
exemption rather than a grant program, budgeted expenditures are not available.

PART II - CONNECTICUT
363
Dairy Farms of Distinction Program
(a) Program Description
The Dairy Farms of Distinction program was started in 1985 as a cooperative effort between the
Department of Agriculture, milk buyers and milk producers to identify and recognize
outstanding dairy farms and promote the dairy industry. The program is privately funded by
donations made by milk processors and farmer organizations. Farms are nominated in the Spring
and evaluated on their attractiveness by a judging team.
In addition to farm appearance, the quality of the milk produced must meet or exceed State and
Federal standards. This program therefore creates an incentive to dairy farmers to upkeep the
practices and appearances of their farm, in order to have recognition in the dairy community and
be reputable in the industry.532
(b) WTO Consistency
This jointly funded promotional activity does not appear to constitute a subsidy.
(c) Expenditures and Allocation to Dairy
This program involves no government outlays, therefore no expenditures can be allocated.
532 Dairy Farms of Distinction program, Connecticut Department of Agriculture

PART II - CONNECTICUT
364
Export Assistance Program
(a) Program Description
Connecticut does not focus on bulk agriculture commodities, but value-added and high value
agricultural products are important in the state. This program concentrates on the small to
medium size food and beverage companies. These efforts include:
• start up information for new export companies;
• source for detailed export information (distributors, country specific information, market
information, statistics, regulations, transportation);
• recruitment of companies for Market Access Program (MAP) in cooperation with Food
Export USA-Northeast. Connecticut is a member or this 10 state co-op officially titled
Eastern U.S. Food and Export Council (EUSAFEC), which gives matching funds to
qualified companies in promoting their products overseas and in attending food and
beverage trade shows;
• updated database listing all Connecticut based agricultural and value-added food and
beverage companies;
• recruit Connecticut companies and coordinate their participation in trade shows in U.S.
and abroad; and
• Certificates of Free Sale to conforming Connecticut based food companies.533
(b) WTO Consistency
This program appears on its face to be similar to normal export promotion activities. However,
to the extent that it involves grants which are designed to promote exports, elements of the
program would be deemed to be export subsidies. That these grants may be made at the sub-
national level does not exempt them from the U.S. Uruguay Round obligations on export
subsidies.
533 Export Assistance Program, Connecticut Department of Agriculture
PART II - CONNECTICUT
365
(c) Expenditures and Allocation
The information available from the state budget does not allow us to determine budgetary
resources for this program, nor an allocation to dairy.
PART II - CONNECTICUT
366
Sales Tax Exemption for Farmers
(a) Program Description
This program enables retail sales of tangible personal property used exclusively in agricultural
production to be exempt from sales and use taxes provided that the purchaser qualifies for an
exemption and the purchaser has been issued a Farmer Tax Exemption Permit.534
(b) WTO Consistency
Please see our earlier comments on full tax exemptions. Clearly, such tax exemptions provide
payments/benefits to farmers for revenue forgone. Whether or not such exemptions are
production distorting is difficult to determine.
(c) Expenditures and Allocation
This is a revenue forgone as opposed to an expenditure program. Information required to
calculate the extent of revenue forgone/benefits is not available.
534 Sales Tax Exemption for Farmers, Connecticut Department of Agriculture, Connecticut General Statutes – Section 12-412(63)

PART II - DELAWARE
367
8. DELAWARE
The Delaware Department of Agriculture is responsible for sustaining and promoting Delaware’s
food, fibre and agricultural industries. The 2009 Budget for the Delaware Department of
Agriculture reports the following total funding levels for the Department:535
2015 (Actual) $12,120,700
2016 (Budget) $15,965,500
2017 (Gov. Rec.) $16,183,800
The State of Delaware administers the following programs:
- Farmland Preservation Program - The Delaware Rural Irrigation Program (DRIP) - Organic Cost-Share Assistance Program - Specialty Crop Block Grant - Aglands Preservation Program - Young Farmers Loan Program - Urban Forestry Grants - Forest Landowner Cost Share Program - Nutrient Management Plan Cost-Share Assistance Program - Nutrient Management Relocation Program - New Micro Grants
Many of these programs are state level vehicles for delivering USDA funding and services. We
have selected a specific consideration for illustrative purposes – and in some cases to identify
supplementary support.
Federal programs for Delaware
- Agriculture Mediation Program - Agricultural Risk Coverage and Price Loss Coverage (ARC/PLC) - Conservation Reserve Program (CRP) - Conservation Reserve Enhancement Program (CREP) Delaware - Emergency Conservation Program (ECP) - Grassland Reserve Program (GRP)
535 Agriculture 65-00-00, FY 2017 Budget, Delaware Department of Agriculture, pg 230

PART II - DELAWARE
368
- Margin Protection Program, Dairy (MPP) - Non-insured Crop Disaster Assistance Program (NAP) - Direct Farm Ownership Loan - Direct Operating Loan - Microloans - Guaranteed Farm Loans - Emergency Farm Loans - Non-recourse Marketing Assistance Loan (MAL) and Loan Deficiency Payment (LDP)
Program - Loans for Minority and Women Farmers and Ranchers - Beginning Farmer and Ranchers (BF) Loan - Youth Loans
The programs administered by the Department of Agriculture do not provide support exclusively
to dairy producers. Therefore, the total value of the support attributable to dairy production is
calculated on the basis of dairy’s share of total state agricultural production. We recognize that
this methodology will result in the amount of support allocated to dairy being overstated in some
states and understated in others. However, this methodology has been adopted because it allows
us to determine the amount of support allocated to dairy producers by the state governments, on
an aggregate basis.
Total funding by the Department of Agriculture in 2015 was $12,120,700, and the percentage
allocation to dairy for Delaware in 2015 was 1.3%. Therefore, the total amount allocated to dairy
production for 2015 is $157,569.

PART II - DELAWARE
369
Agricultural Lands Preservation Program
(a) Program Description536
This is a voluntary agricultural land preservation program. To participate in the program,
producers must establish an Agricultural Preservation District and then place their land into the
District.
An Agricultural Preservation District must contain at least 200 contiguous acres devoted to
agricultural and related uses. If there is less than 200 usable and contiguous areas within three
miles of an established Agricultural Preservation District, this land can be enrolled as a District
Expansion.
Landowners who place their land in an Agricultural Preservation District agree not to develop
their lands for at least 10 years and to use it only for agricultural and related uses. In return, the
landowner receives tax benefits, right to farm protection and an opportunity to sell a preservation
easement that will permanently keep the land from development. 808 properties encompassing
approximately 116,000 acres have been permanently protected through the purchase of
preservation easements for $208 million.537
(b) WTO Consistency
The Agricultural Lands Preservation Program provides tax benefits to producers who enroll their
land for 10 years and direct payments based on the appraised value of the land for producers who
negotiate and sell a preservation easement. In both cases, the support provided confers a benefit
on the producer and ensures continued production by prohibiting development or other non-
agricultural use of the land. Consequently, the domestic support provided through the program
has trade and/or production distorting effects and, on that basis, would not be exempt from the
U.S. AMS.
536 Farmland Preservation in Delaware, Delaware Department of Agriculture 537 State of Delaware, FY 2017, Government Recommended Budget, pg 233

PART II - FLORIDA
370
9. FLORIDA
Agricultural producers in Florida benefit from subsidies and support provided by the Department
of Agriculture and Consumer Services. The aggregate subsidies and support provided through
the Department, which is the value of total expenditures as reported in the 2009-2010 Governor’s
Recommendations, is:538
2015-2016 Budget: $1,529,394,250
Governor’s Recommendation 2016-2017 $1,571,693,310
The State of Florida administers the following programs:
- Farm Energy and Water Efficiency Realization - Farm Renewable and Efficiency Demonstration - Natural Gas Fuel Fleet Vehicle Rebate - REET Grant Matching Program - Qualified Energy Conservation Bonds - Biofuels Infrastructure Partnership (BIP) - Farm to Fuel - Florida Renewable Energy Tax Incentives - Research and Development Bioenergy Grant Program - Mosquito Control Program - The Farmers’ Market Nutrition Program (FMNP) - Farm Energy and Water Efficiency Realization Program - Farm Renewable and Efficiency Demonstration (FRED) Program - Rural and Family Lands Protection Program - Cogongrass Treatment Cost-Share Program - Southern Pine Beetle Prevention Program - Forest Stewardship Program - Forestry and Wildlife Cost Share Programs - Longleaf Pine Private Landowner Incentive Program - Fresh Fruit and Vegetable Program - Summer Food Service Program - Farm to School Program - Dairy Inspection Program - Special Milk Program (SMP) - Antibiotics in Milk Monitoring
538 Governor’s Recommendations 2009-2010

PART II - FLORIDA
371
Many of these programs are state level vehicles for delivering USDA funding and services. We
have selected a few for specific consideration for illustrative purposes – and in some cases to
identify supplementary support.
Federal programs for Florida:
- Agriculture Mediation Program - Beginning Farmer Down Payment Loan - Conservation Reserve Program (CRP) - Conservation Reserve Enhancement Program (CREP) - Direct and Counter-cyclical Payment (DCP) Program - Direct Farm Ownership Loan - Direct Operating Loan - Emergency Conservation Program (ECP) - Emergency Farm Loans - Farm Storage Facility Loan Program - Grassland Reserve Program (GRP) - Guaranteed Farm Ownership Loan - Guaranteed Operating Loan - Indian Tribal Land Acquisition Program - Milk Income Contract Extension (MILCX) Program - Non-insured Crop Disaster Assistance Program (NAP) - Non-recourse Marketing Assistance Loan and Loan Deficiency Payment (LDP) Program - Sugar Loan Program and Sugar Marketing Allotments - Sugar Storage Facility Loan Program - Youth Loans
The programs administered by the Department of Agriculture and Consumer Services do not
provide support exclusively to dairy producers. Therefore, the total value of the support
attributable to dairy production is calculated on the basis of dairy’s share of total state
agricultural production. We recognize that this methodology will result in the amount of support
allocated to dairy being overstated in some states and understated in others. However, this
methodology has been adopted because it allows us to determine the amount of support allocated
to dairy producers by the state governments, on an aggregate basis.
Total funding by the Department of Agriculture and Consumer Services in 2015 was
$1,529,394,250, and the percentage allocation to dairy for Florida in 2015 was 6.6%. Therefore,
the total amount allocated to dairy production for 2015 is $100,940,021.

PART II - FLORIDA
372
Dairy Inspection Program
(a) Program Description
The Department of Agriculture has 12 field inspectors who are stationed from Miami to
Pensacola. They make regular visits to dairy farms and processing plants to inspect, consult, and
collect samples. In 2015, dairy inspectors performed 1,663 inspections at dairy farms and plants
in Florida. They also collected 7,926 samples of milk and milk products. They made 1,360
inspections of milk transport tankers and bulk milk haulers.539
(b) WTO Consistency
This is a normal function of government.
(c) Expenditures and Allocation
The primary purpose of this program is consumer protection.
539 Florida Department of Agriculture and Consumer Services, Florida Dairy Facts

PART II - FLORIDA
373
Antibiotics in Milk Monitoring
(a) Program Description
The industry has established a rigorous program to monitor milk for contamination with residues
of antibiotics commonly used to treat cows on dairy farms. During 2016, 41,340 transport
tankers representing more that 1.9 billion pounds of milk were checked for antibiotics in
Florida.540
(b) WTO Consistency
This is a normal function of government.
(c) Expenditures and Allocation
The primary purpose of this program is consumer protection.
540 Ibid.

PART II - FLORIDA
374
Special Milk Program (SMP)
(a) Program Description
The SMP is available to children of all schools or nonprofit child care institutions that do not
participate in the National School Lunch Program (NSLP), School Breakfast Program (SBP), the
Child and Adult Care Food Program (CACFP), or Summer Food Service Program (SFSP). This
includes nonprofit day care centers, summer camps, settlement houses and homeless shelters. An
eligible shelter's primary purpose must be to provide shelter and a minimum of one regularly
scheduled meal service per day to homeless families. The shelter cannot be a residential child
care institution.
The SMP is also available to students attending a split-session kindergarten or pre-primary
students in a school that participates in the NSL or SBP, if those students do not have access to
the lunch or breakfast programs.541
(b) WTO Consistency
This is a normal function of government.
(c) Expenditures and Allocation
The primary purpose of this program is to encourage the consumption of milk by school-age
children by providing milk at low or no cost.
541 Ibid.

PART II - GEORGIA
375
10. GEORGIA
Agricultural producers in Georgia benefit from subsidies and support provided by the
Department of Agriculture. The aggregate subsidies and support provided through the
Department, which is the value of total expenditures as reported in the Budget, is:542
2015 (Current) $49,988,777
2016 (Recommendation) $54,966,907
The State of Georgia administers the following programs:
- Georgia Grown Program - Meat Inspection - Commodity Promotion Program - Seed Commission Production Program - Plant material program - Development Authority - Farmers Market Program - Georgia Agriculture Tax Exemption program (GATE) - Dairy Program - Manufactured Food Program - Agriculture Education Program - Agricultural Experiment Station - Conservation of Soil and Water Resources Program - Conservation of Agricultural Water Supplies Program
Many of these programs are state level vehicles for delivering USDA funding and services. We
have selected a specific consideration for illustrative purposes – and in some cases to identify
supplementary support.
Federal programs for Georgia
- Insured Farm Loan
542 The Governor’s Budget Report, Fiscal Year 2016 , pg 95

PART II - GEORGIA
376
The programs administered by the Georgia Department of Agriculture do not provide support
exclusively to dairy producers. Therefore, the total value of the support attributable to dairy
production is calculated on the basis of dairy’s share of total state agricultural production. We
recognize that this methodology will result in the amount of support allocated to dairy being
overstated in some states and understated in others. However, this methodology has been
adopted because it allows us to determine the amount of support allocated to dairy producers by
the state governments, on an aggregate basis.
Expenditures by the Georgia Department of Agriculture in 2015 were $49,988,777, and the
percentage allocation to dairy for Georgia in 2015was 3.9%. Therefore, the total amount
allocated to dairy production for 2015 is $1,949,562.
PART II - GEORGIA
377
Insured Loan Programs
(a) Program Description
Georgia operates guaranteed and direct insured loan programs that benefit agricultural producers.
The insured loans are provided through the Georgia Development Authority; a body established
in 1953 to help develop opportunities for Georgia farmers. Under these programs, the Authority
insures loans for agricultural capital purposes. The loans can be made for terms as long as 20
years and at variable rates (prime plus 0.5%). Fixed rate loans are also available for terms as
long as 15 years.543
The Georgia Development Authority describes the program as follows:
“Our service is available in every county in Georgia, and banks, savings and loan associations, and retirement systems participate in our insured farm loan program. We feature top-dollar loans, fast closing services, and low closing costs with no cost to state or federal government.”544
(b) WTO Consistency
Based on the information available, it appears that the insured loans provided by the Georgia
Development Authority confer a benefit on producers (not all would qualify for the low rate)
and, on that basis, would be considered domestic support. As the program supports agricultural
capital projects, it also appears that the projects are intended to support increased agricultural
production and, on that basis, would have trade and/or production distorting effects.
Consequently, notwithstanding the state’s claim that the insurance program has no cost to the
state or federal governments, the insurance program has value that must be counted against U.S.
domestic support.
543 Insured Farm Loans, David Skinner, Georgia Development Authority 544 Georgia Development Authority

PART II - GEORGIA
378
(c) Expenditures and Allocation
The Government of Georgia does not provide detailed information on expenditures under this
program. However, it is important to note that expenditures by the Georgia Development
Authority do not appear to be included in the Budget for the Georgia Department of Agriculture.
Consequently, expenditures made on account of the insured loan program are in addition to the
total expenditures by the Georgia Department of Agriculture.
PART II - HAWAII
379
11. HAWAII
Hawaiian agricultural producers benefit from subsidies and support provided by the Department
of Agriculture. The aggregate subsidies and support provided through the Department, which is
the value of total expenditures as reported in the Budget, is:
FY 2015 $50,997,083 545
FY 2016 $48,317,744 546
The State of Hawaii administers the following programs:
- Agricultural and Aquacultural Loan Programs - Plant Pest and Disease Control Program - Rabies Quarantine Program - Animal Disease Control Program - Agricultural Resource Management Program - Quality and Price Assurance Program - Aquaculture Development Program - Agribusiness Development and Research Program - Agricultural Development and Marketing Program - Pesticides Program - Environmental Protection Program - Agricultural Park Program - Agricultural Irrigation Systems
Federal programs for Hawaii
- Farm Programs o Price Support Program
Reimbursement Transportation Cost Payment (RTCP) o Natural Disaster Programs:
Emergency Conservation Program (ECP) Noninsured Crop Disaster Assistance Program (NAP) Livestock Forage Program (LFP) Livestock Indemnity Program (LIP) Emergency Assistance for Livestock, Honey Bees, & Farm-raised Fish
(ELAP)
545 Department of Agriculture, FY 2013-2015 Budget, pg 201 546 Department of Agriculture, FY 2016-2017 Budget, pg 201

PART II - HAWAII
380
Supplemental Assistance Revenue Payment (SURE) Tree Assistance Program (TAP)
o Conservation Programs: Conservation Reserve Program (CRP) Conservation Reserve Enhancement Program (CREP) Grassland Reserve Program (GRP) Environmental Quality Incentive Program (EQIP)
- Farm Loan Program
o Microloans o Direct Farm Ownership Loans o Direct Operating Loans o Guaranteed Farm Loans o Emergency Farm Loans o Rural Youth Loans o Direct Farm Operating Loan
Many of these programs are state level vehicles for delivering USDA funding and services. We
have selected a few for specific consideration for illustrative purposes – and in some cases to
identify supplementary support.
The programs administered by the Department of Agriculture do not provide support exclusively
to dairy producers. Therefore, the total value of the support attributable to dairy production is
calculated on the basis of dairy’s share of total state agricultural production. We recognize that
this methodology will result in the amount of support allocated to dairy being overstated in some
states and understated in others. However, this methodology has been adopted because it allows
us to determine the amount of support allocated to dairy producers by the state governments, on
an aggregate basis.
Expenditures by the Department of Agriculture in 2015 were $50,997,083, and the percentage
allocation to dairy for Hawaii in 2015 was 1.4%. Therefore, the total amount allocated to dairy
production for 2015 is $713,959.

PART II - HAWAII
381
Agricultural Loan Programs
(a) Program Description
The Department of Agriculture administers the Agricultural Loan Program which is intended to
promote agriculture by providing credit at reasonable rates and terms to qualifying individuals
and entities. There are four types of loans within the Agricultural Loan Program:
- New Farmer loans,
- Qualified Farmer loans,
- Part-time Farmer loans, and
- Food Manufacturing loans.
The program has a budgeted ceiling of $5.0 million for agricultural loans.
The loans either supplement loans by private lenders or provide direct funding. The loan
program operates through a revolving fund.547
The Department of Agriculture describes the purpose and operation of the loan programs as
follows:
“Considered a “lender of last resort”, the program is not intended to compete with private sector lenders. Prospective applicants must inquire with and be denied credit from private sector lenders prior to filling an application. In addition, prospective applicants must fulfill applicable eligibility requirements.”548
The Department of Agriculture also administers an Aquaculture Loan Program that is intended to
promote development of the aquaculture industry.
In addition to making loans to producers and food manufacturers who would otherwise not
receive credit from private lenders, the terms and conditions offered by the Department of
Agriculture are preferential. For example, facility loans made to food manufacturers under the 547 Agricultural Loan Programs, Hawaii Department of Agriculture 548 Ibid.

PART II - HAWAII
382
Food Manufacturing Loan subprogram are made at interest rates fixed at 1% below prime,
clearly a concessional rate.549
(b) WTO Consistency
The loans provided by the Department of Agriculture through these programs should be included
in the U.S. AMS. The loans at issue are provided to producers and manufacturers who were not
eligible for loans from commercial lenders. Thus, the total value of the loans, and not simply the
subsidized interest portion of the loans, should be considered domestic support. As the purpose
of the loans is to increase agricultural production, the loans would have trade and/or production
distorting effects. Consequently, the total value of expenditures made by the Department of
Agriculture from the revolving fund supporting the loan program should be included in the U.S.
AMS.
(c) Expenditures and Allocation
The budgetary information available from the Government of Hawaii is not sufficiently detailed
to allow us to determine actual, estimated or budgeted expenditures on account of this program.
549 Food Manufacturing Loans Fact Sheet, Hawaii Department of Agriculture

PART II - HAWAII
383
Agricultural Parks
(a) Program Description
Under the Agriculture Park Program, through the Hawaii Department of Agriculture, lands are
set aside specifically for agriculture related activity. Hawaii currently operates ten agricultural
parks. The lessees are small farming enterprises engaged in diversified agricultural
production.550
(b) WTO Consistency
Based on the information available, it appears that the qualifying producers are given long-term
access to agricultural land at below market rates. Consequently, the Agricultural Park program
provides support to small farming enterprises. As the program is intended to support increased
agricultural production, the value of the subsidy provided through this program should be
included in the U.S. AMS. However, the program is likely de minimis.
(a) Expenditures and Allocation
The budgetary information available from the Government of Hawaii is not sufficiently detailed
to allow us to determine actual, estimated or budgeted expenditures on account of this program.
550 Agricultural Parks, Hawaii Department of Agriculture

PART II - HAWAII
384
Agricultural Irrigation Systems
(a) Program Description
According to the Hawaii Government its Irrigation System is the lifeline of the State agricultural
operation. The Hawaii Department of Agriculture, through its Agricultural Resource
Management Division manages five irrigation systems, two on Oahu, two on the island of
Hawaii, and one on Molokai. The Molokai Irrigation System alone transports 1.2 billion gallons
per year.551
(b) WTO Consistency
The provision of irrigation infrastructure and water is production distorting. Expenditures on
irrigation infrastructure and services including the providers of water at less than market rates
should be included in the U.S. AMS, whether made at the federal or state level.
(c) Expenditures and Allocation
The budget information available from the State of Hawaii does not allow us to calculate total
expenditures or benefits under this program. Therefore, we cannot estimate the benefit to dairy.
551 Agricultural Irrigation Systems, Hawaii Department of Agriculture

PART II - IDAHO
385
12. IDAHO
Idaho agricultural producers benefit from subsidies and support provided by the Department of
Agriculture. The aggregate subsidies and support provided through the Department, which is the
value of expenditures as reported in the Budget, is:552
2015 (Actual) $206,050,000
2016 (Appropriation) $213,800,000
2017 (Request) $217,750,000
The State of Idaho administers the following programs:
- Food Safety Program - Pesticide Disposal Program (PDP) - Urban Pest Management Program - Water Quality Program - Worker Protection Program - Idaho's Chemigation Program - International Trade Offices - Specialty Crop Block Grant Program - Dairy Lab - SDA’s Dairy Bureau - Organic Certification Program - Plant and insect programs
Many of these programs are state level vehicles for delivering USDA funding and services. We
have selected a few for specific consideration for illustrative purposes – and in some cases to
identify supplementary support.
Federal programs for Idaho
- Agriculture Mediation Program - Beginning Farmer Down Payment Loan - Conservation Reserve Program (CRP) - Conservation Reserve Enhancement Program (CREP) - Agriculture Risk Coverage/Price Loss Coverage
552 Idaho Legislative Budget Book for Fiscal Year 2016, pg 17

PART II - IDAHO
386
- Direct Farm Ownership Loan - Direct Operating Loan - Emergency Conservation Program (ECP) - Emergency Farm Loans - Farm Storage Facility Loan Program - Grassland Reserve Program (GRP) - Guaranteed Farm Ownership Loan - Guaranteed Operating Loan - Livestock Indemnity Program (LIP) - Livestock Forage Disaster Program (LFP) - Margin Protection Program for Dairy - Microloans - Noninsured Crop Disaster Assistance Program (NAP) - Nonrecourse Marketing Assistance Loan and Loan Deficiency Payment (LDP) Program - Sugar Loan Program and Sugar Marketing Allotments - Sugar Storage Facility Loan Program - Youth Loans
The programs administered by the Idaho Department of Agriculture do not provide support
exclusively to dairy producers. Therefore, the total value of the support attributable to dairy
production is calculated on the basis of dairy’s share of total state agricultural production. We
recognize that this methodology will result in the amount of support allocated to dairy being
overstated in some states and understated in others. However, this methodology has been
adopted because it allows us to determine the amount of support allocated to dairy producers by
the state governments, on an aggregate basis.
Expenditures by the Department of Agriculture in 2015 were $206,050,000, and the percentage
allocation to dairy for Idaho in 2015 was 31.8%. Therefore, the total amount allocated to dairy
production for 2015 is $65,523,900.

PART II - IDAHO
387
Idaho Biomass Fuel Tax Incentive
(a) Program Description
Idaho imposes a 32 cent per gallon excise tax on all motor fuel.553 Distributors are required to
pay the tax, but may deduct the number of gallons of anhydrous ethanol contained in any gasohol
they receive.554 The ethanol at issue must be produced from agricultural products.
Consequently, the program provides a 32 cent per gallon tax incentive for the production of
anhydrous ethanol made from agricultural products.
In 2015, the Idaho legislature approved an increase in the state’s gasoline tax rate, from 25 cents
per gallon to 32 cents per gallon.
Biofuel Fueling Infrastructure Tax Credit (Idaho Statutes 63-3029M) – Qualified biofuel fueling
infrastructure is eligible for a credit of up to 6% of the qualified investment against the corporate
income tax. The allowable credit cannot exceed 50% of the income tax liability of the taxpayer.
(Tax incentive; Tax credit; Intended audience: Commercial, industrial) The program was enacted
in 2007.
(b) WTO Consistency
The excise tax credit for gasohol provides a subsidy in the form of foregone revenue. As this
subsidy is intended to support ethanol produced from agricultural products, it is a domestic
subsidy. As this subsidy is tied to production of ethanol for use in gasohol, the total value of this
subsidy should be included in the U.S. AMS.
553 Idaho Statutes, Title 63-2402(2) 554 Ibid., Title 63-2405
PART II - IDAHO
388
(c) Expenditures and Allocation to Dairy
This incentive is over and above the benefits to biomass fuels discussed and estimated in Part I.
However, information on total expenditures (revenue foregone) under this program is not
available.

PART II - IDAHO
389
International Trade Offices
(a) Program Description
Idaho’s overseas trade offices assist companies in developing and expanding their
export markets. Idaho maintains overseas offices in targeted areas around the world where
significant business and diplomatic relationships exist. The state supports fully staffed offices, in
Taipei, Taiwan and Mexico City, Mexico, and operates representative offices in China and
Shanghai.
Trade office representatives are natives of the country where their office is located and serve as a
valuable resource to help Idaho firms understand the business, cultural, and political
environments of these markets.
Specific services include:
• Market research
• Market entry/expansion assistance
• Distributor/buyer searches
• Business counseling
• In-country appointments and assistance
• Representation at international trade shows
• Government/diplomatic relations
• Cultural assistance 555
(b) WTO Consistency
These activities would appear to be normal trade commission-type services. They do benefit
Idaho farmers, but they would be a normal function of government.
555 International Marketing, International Trade Offices, Idaho Department of Agriculture

PART II - IDAHO
390
(c) Expenditures and Allocation
There is no information available which would enable us to calculate the expenditures under this
program.

PART II - ILLINOIS
391
13. ILLINOIS
Illinois agricultural producers benefit from subsidies and support provided by the Department of
Agriculture. The aggregate subsidies and support provided through the Department, which is the
value of expenditures as reported in the Budget, is:556
2015 (Actual) $103,442,000
2016 (Enacted) $109,705,500
2017 (Recommended) $102,695,200
The State of Illinois administers the following programs:
- Illinois Farm Programs - Centennial/ Sesquicentennial Farm Program - Organic Cost-Share Program - Specialty Crop Grants - AgriFIRST – Value-Added Grant Program - "Illinois Products" Logo Program - Exporting Assistance Programs - Food Export Midwest's Branded Program: A Cost-Share Funding Program - Market Access Program - Environmental Programs - Partners For Conservation Program - Farmland Protection - Land & Water Resources - Livestock Management Facilities Program
Many of these programs are state level vehicles for delivering USDA funding and services. We
have selected a few for specific consideration for illustrative purposes – and in some cases to
identify supplementary support.
Federal programs for Illinois
- Conservation Reserve Program - Conservation Reserve Enhancement Program - Emergency Conservation Program
556 Illinois State Budget Fiscal Year 2017, pg 262

PART II - ILLINOIS
392
Based on the limited information available to us the programs administered by the Illinois
Department of Agriculture do not provide support exclusively to dairy producers. Therefore, the
total value of the support attributable to dairy production is calculated on the basis of dairy’s
share of total state agricultural production. We recognize that this methodology will result in the
amount of support allocated to dairy being overstated in some states and understated in others.
However, this methodology has been adopted because it allows us to determine the amount of
support allocated to dairy producers by the state governments, on an aggregate basis.
Expenditures by the Department of Agriculture during this period were $103,442,000, and the
percentage allocation to dairy for Illinois in 2015 was 2.1%. Therefore, the total amount
allocated to dairy production for 2015 is $2,172,282.

PART II - ILLINOIS
393
Illinois AgriFIRST
(a) Program Description
Illinois AgriFIRST is a grant program intended to benefit value-added agriculture. The program
provides grants to eligible persons and agribusinesses for both construction and non-construction
projects.
Grants for non-construction projects can be used to offset up to 75% of the cost of technical
assistance to develop the project, to a maximum of $25,000, and up to 50% of the cost of
feasibility studies, competitive assessments and consulting-productivity services.
Grants for construction projects may provide up to 10% of the project’s capital construction costs
to a maximum of $5 million. The grants may be used to purchase land; to purchase, construct or
refurbish buildings; to purchase or refurbish machinery or equipment; installation; repairs; labour
and working capital.557
(b) WTO Consistency
Expenditures made under the Illinois AgriFIRST program should be included in the U.S. AMS.
The funding is provided in the form of a grant to offset the cost of developing value-added
agricultural processing in Illinois. Even if this program did not impact on production in Illinois,
which is doubtful, it would have trade distorting effects by offsetting the cost of producing value-
added goods.
(c) Expenditures and Allocation
The annual funding for this program has ranged from $400,000 to $1,455,000. The budgetary
information available from the Government of Illinois is not sufficiently detailed to allow us to
determine actual, estimated or budgeted expenditures on account of this program.
557 Illinois AgriFIRST, Illinois Department of Agriculture

PART II - ILLINOIS
394
Farmland Protection
(a) Program Description
The Illinois Department of Agriculture works with other levels of government to keep
agricultural land in agricultural production. Under this program, landowners may “enroll”
agricultural land for at least 10 years (and re-enroll for 8 years). By enrolling their land,
producers receive protection from locally initiated projects that would “unreasonably restrict”
normal farming practices. Enrolled producers would also be protected from “special benefits
assessments that are not in their best interests”. In exchange for these benefits, the landowner
must keep the enrolled land in agricultural production.558
(b) WTO Consistency
Through enrollment in this program, landowners receive the benefit of exemption from local
laws that would limit their ability to farm and exemption from tax assessments. These are
important benefits that would not be enjoyed by landowners who choose to not participate in the
program. As the intention of the program is to ensure that agricultural land remains in
production, the support would have trade and/or production effects on the basis that it would
ensure continued production at lower costs. Consequently, the support provided to producers
through this program should be included in the U.S. AMS.
(c) Expenditures and Allocation
The budgetary information available from the Government of Illinois is not sufficiently detailed
to allow us to determine actual, estimated or budgeted expenditures on account of this program.
558 Farmland Protection, Illinois Department of Agriculture

PART II - INDIANA
395
14. INDIANA
Indiana agricultural producers benefit from subsidies and support provided by the Department of
Agriculture. The aggregate subsidies and support provided through the Department, which is the
value of expenditures as reported in the Budget, is:
FY 2015 $8,647,019 559
FY 2016 (Passed Budget) $9,010,430 560
FY 2017 (Passed Budget) $8,882,553 561
The State of Indiana administers the following programs:
- Indiana Agvocate - Agritourism - Indiana Grown - Certifield Livestock Producer Program - Market Reporting Program - Pollinator Habitat - Indiana Land Resources Council - INfield Advantage - Indiana's Nutrient Reduction Strategy - Conservation Cropping Systems Initiative - Conservation Reserve Enhancement Program - Clean Water Indiana
Many of these programs are state level vehicles for delivering USDA funding and services. We
have selected a few for specific consideration for illustrative purposes – and in some cases to
identify supplementary support.
Federal programs for Indiana
- Conservation Reserve Program - Conservation Reserve Enhancement Program - Emergency Conservation Program
559 List of Appropriations for the Biennium July 1, 2013 to June 30, 2015, State of Indiana, pg B-8 560 Ibid., pg B-6 561 Ibid.

PART II - INDIANA
396
- Beginning Farmer Loans - Direct Farm Loans - Guaranteed Farm Loans - Emergency Assistance for Livestock, Honey Bees, & Farm-raised Fish - Noninsured Crop Disaster Assistance Program - Commodity Loans - Loan Deficiency Payments - Facility Loan Programs - Agricultural Mediation Program
Based on the information available to us the programs administered by the Office of the
Commissioner of Agriculture do not provide support exclusively to dairy producers. Therefore,
the total value of the support attributable to dairy production is calculated on the basis of dairy’s
share of total state agricultural production. We recognize that this methodology will result in the
amount of support allocated to dairy being overstated in some states and understated in others.
However, this methodology has been adopted because it allows us to determine the amount of
support allocated to dairy producers by the state governments, on an aggregate basis.
Expenditures by the Department of Agriculture during this period were $8,647,019, and the
percentage allocation to dairy for Indiana in 2015 was 6.2%. Therefore, the total amount
allocated to dairy production for 2015 is $536,115.

PART II - INDIANA
397
Agricultural Mediation Program
(a) Program Description
The Commissioner of Agriculture provides free legal and financial counseling to financially
troubled farmers in Indiana. These services provided include:
- agricultural mediation directed towards resolving disputes between producers and USDA;
- USDA-approved borrower training seminars in financial management;
- Counselling to producers at meetings of borrowers and lenders to facilitate
communication and debt restructuring; and
- Assistance with filing loan applications and related documents.562
The U.S. Department of Agriculture’s (USDA) Agricultural Mediation Program helps
agricultural producers, their lenders, and other persons directly affected by the actions of USDA
resolve disputes. Through mediation, a trained, impartial person (mediator) helps participants
review their conflicts, identify options, and agree on solutions.
Mediation is a valuable tool for settling disputes in many different USDA program areas. These
include farm loans, farm and conservation programs, wetland determinations, rural water loan
programs, grazing on national forest system lands, and pesticides. The program, reauthorized by
the United States Grain Standards Act of 2000, is administered by USDA’s Farm Service
Agency (FSA) 563
(b) WTO Consistency
The Agricultural Mediation Program provides support to Indiana producers who find themselves
in financial difficulty. As these services are provided free of charge, they constitute a subsidy to
producers for purposes of the WTO Agreement on Subsidies and Countervailing Measures and
562 Farm Mediation/Farm Counselling, Office of the Commissioner of Agriculture 563 USDA, FSA, Fact Sheet, Agricultural Mediation Program, August 2013.
PART II - INDIANA
398
the WTO Agreement on Agriculture. Arguably, the subsidy provided through these services
should be included in the U.S. AMS on the basis that they do not appear to fall within any of the
exemptions set out in Annex 2(2) to the Agreement on Agriculture. However, these should be
seen as a normal function of government, and would in any event appear to be de minimis.
(c) Expenditures and Allocation
The budgetary information available from the Government of Indiana is not sufficiently detailed
to allow us to determine actual, estimated or budgeted expenditures on account of this program.
Some states charge mediation participants a nominal fee.
PART II - INDIANA
399
Loan Guarantee Programs
(a) Program Description
Indiana operates three loan guarantee programs that benefit agricultural producers: (i)
Agricultural Loan and Rural Development Project Guaranty Program, (ii) Capital Access
Program; and (iii) Treasurer’s Agricultural Loan Program.
The Agricultural Loan and Rural Development Project Guaranty Program can provide
guaranteed loans for value-added agricultural projects and rural development projects.
The Capital Access Program establishes a cash reserve that serves as security for lenders.
Guaranteed loans may be used to purchase equipment, livestock, buildings or other farm-related
needs and may be used as operating lines of credit.
The Treasurer’s Agricultural Loan Program offers low interest loans for agricultural production
needs. These loans are made through qualified institutions.564
(b) WTO Consistency
Based on the information available, it appears that programs provide loans and loan guarantees at
rates and conditions not available on the market and thereby confer a subsidy on eligible
recipients. The loans and loan guarantees are intended to either reduce operating costs or to fund
investment in productive capacity. Therefore, the total value of funding under this program
should be included in the U.S. AMS on the basis that it reduces costs for specific producers and
is intended to have trade and/or production distorting effects.
564 Matt Tuohy, Indiana Development Finance Authority, Letter to National Council of State Agricultural Financial Programs

PART II - INDIANA
400
(c) Expenditures and Allocation
The budgetary information available from the Government of Indiana is not sufficiently detailed
to allow us to determine actual, estimated or budgeted expenditures on account of this program.

PART II - IOWA
401
15. IOWA
Agricultural producers in Iowa benefit from subsidies and support provided by the Department
of Agriculture and Natural Resources. The subsidies and support provided to agricultural
producers through the Department, i.e., the value of expenditures as reported in the Governor’s
FY 2017 Recommendations, is:565
General Fund
FY 2015 (Actual) $43,111,995
FY 2016 (Estimated) $43,111,995
FY 2017 (Governor Recommendation) $43,111,995
Other Funds566
2015 (Actual) $88,234,573
2016 (Estimated) $90,285,921
2017 (Governor Recommendation) $90,085,921
Total Funds
2015 (Actual) $131,346,568
2016 (Estimated) $133,397,916
2017 (Governor Recommendation) $133,197,916
The State of Iowa administers the following programs:
- Century Farms Program - Conservation Reserve Enhancement Program (CREP) - European Corn Borer Program - Exotic Pest Program - Export Service Program - Farm to School Program - Farmers Market Program
565 Governor’s FY 2017 Budget Recommendations, General Fund, pg 29, 566 Ibid., Governor’s FY 2017 Budget Recommendations, Other Funds, pg 50

PART II - IOWA
402
- Farmers Market Nutrition Program - Gypsy Moth Eradication Program - Heritage Farms Program - Horse and Dog Breeders Programs - Horticulture Program - Iowa Fuel Quality Program - Iowa Renewable Fuels Infrastructure Program - Johne’s Disease Control Program - Loan Participation Program - Market Development Program - No-Interest Loans - Organic Certification Program - Organic Certification Cost Share Program - Premise Identification Program - Seed Regulatory Program - Specialty Crop Block Grant Program - Urban Conservation Program - State Revolving Loan Fund - Water Quality Protection Projects - Watershed Improvement Board - Watershed Protection Program
Many of these programs are state level vehicles for delivering USDA funding and services. We
have selected a few for specific consideration for illustrative purposes – and in some cases to
identify supplementary support.
Federal programs for Iowa
- Agriculture Mediation Program - Beginning Farmer Down Payment Loan Program - Conservation Reserve Program (CRP) - Conservation Reserve Enhancement Program (CREP) - Direct and Counter-cyclical Payment (DCP) Program - Direct Farm Ownership Loan Program - Direct Operating Loan Program - Emergency Conservation Program (ECP) - Emergency Farm Loans Program - Grassland Reserve Program (GRP) - Guaranteed Farm Ownership Loan Program - Guaranteed Operating Loan Program - Indian Tribal Land Acquisition Program - Milk Income Loss Contract Extension (MILCX) Program - Noninsured Crop Disaster Assistance Program (NAP) - Nonrecourse Marketing Assistance Loan and Loan Deficiency Payment (LDP) Program
PART II - IOWA
403
- Sugar Loan Program and Sugar Marketing Allotments - Sugar Storage Facility Loan Program - Youth Loans Program
Based on the information available to us, the programs administered by the Department of
Agriculture and Natural Resources do not provide support exclusively to dairy producers.
Therefore, the total value of the support attributable to dairy production is calculated on the basis
of dairy’s share of total state agricultural production. We recognize that this methodology will
result in the amount of support allocated to dairy being overstated in some states and understated
in others. However, this methodology has been adopted because it allows us to determine the
amount of support allocated to dairy producers by the state governments, on an aggregate basis.
Expenditures by the Department of Agriculture and Natural Resources during this period were
$131,346,568, and the percentage allocation to dairy for Iowa in 2015 was 3.0%. Therefore, the
total amount allocated to dairy production for 2015 is $3,940,397.

PART II - IOWA
404
Loan Guarantee Programs
(a) Program Description
Iowa operates three loan guarantee programs: (i) the Farm Ownership Loan Program; (ii)
Beginning Farmer Down Payment Loan Program and (iii) Operating Loan Program . These
programs are intended to support beginning farmers who do not have a substantial ownership
interest in farmland and low-income farmers who need to secure loans from participating
lenders. Iowa guarantees loans to beginning farmers with a net worth of less than $300,000.
Iowa assists eligible low-income and beginning farmers, by supplementing the borrower’s down
payment.567
(b) WTO Consistency
These programs assist producers who could not otherwise obtain financing or obtain financing at
preferential rates and, thus, confer a subsidy on the recipient. As the subsidy will reduce the
recipient producer’s overall costs and will have production and/or trade distorting effects, the
total value of support provided under this program should be included in the U.S. AMS.
(c) Expenditures and Allocation
The budgetary information available from the Government of Iowa is not sufficiently detailed to
allow us to determine actual, estimated or budgeted expenditures under this program.
567 National Council of State Agriculture Finance Programs, USDA, Farm Loan Programs

PART II - IOWA
405
Biomass Energy Program
(a) Program Description
Iowa imposes a differential excise tax on ethanol-blended gasoline, which is a motor fuel
containing at least 10% alcohol distilled from cereal grains. The differential tax is imposed on
the basis of the “distribution percentage” of ethanol-blended gasoline sold in the state (i.e., the
percentage of gasoline distributed that is represented by ethanol blended gasoline). Iowa
imposes a lower rate of tax on ethanol-blended gasoline until the “distribution percentage” is
95% or more, at which point, equal excise taxes are imposed.568
(b) WTO Consistency
The differential excise tax program confers a subsidy on ethanol-blended gasoline in the form of
foregone revenue. This preferential tax rate is tied to the use of alcohol distilled from cereal
grains; it is intended to support agricultural production. Therefore, the total value of the subsidy
provided under this program should be included in the U.S. AMS on the basis that it is domestic
support tied directly to production for use in ethanol.
(c) Expenditure and Allocation to Dairy
The value of revenue foregone under this program is not available.
568 Codes of Iowa, Section 452A.3(1)

PART II - IOWA
406
Loan Participation Program
(a) Program Description
This program assists qualified low-income farmers to more readily secure loans from
participating lenders by supplementing the borrowers’ down-payment. It also reduces lender’s
risk since the IADA provides a “last in-last out” loan participation for the financial institution.
The maximum loan for each beneficiary amount is $150,000.569
After October 1, 2013, the interest rate is 1.0% fore the first five years, then re-adjusted to the
same index for the final five years
(b) WTO Consistency
This program assists producers who could not otherwise obtain financing or obtain financing at
low rates and, thus, confers a subsidy on the recipient. As the subsidy will reduce the recipient
producer’s overall costs and will have trade and/or production distorting effects, the total value
of support provided under this program should be included in the U.S. AMS.
(c) Expenditures and Allocation
The budgetary information available from the Government of Iowa is not sufficiently detailed to
allow us to determine actual, estimated or budgeted outlays or expenditures on account of this
program.
569 Iowa Finance Authority, Loan Participation Program

PART II - IOWA
407
Market Development Program
(a) Program Description
This program assists producers in evaluating the different marketing challenges and
opportunities available to them and provides information to the producer that will assist them in
preparing their product for sale by addressing post harvest handling, packaging, labelling and
pricing considerations of the product.
A key component of the Department’s Market Development Program is the promotion of Iowa
grown food to consumers and wholesale buyers. The “Farm Fresh” directory of producers of
Iowa grown products is made available to the public to facilitate this producer-to-consumer
connection.570
(b) WTO Consistency
This program benefits Iowa farmers, but appears to fall within the terms of the Annex 2,
paragraph 2(f) exemption from AMS.
(c) Expenditures and Allocation
Total expenditures under this program are not available.
570 Market Development Program, Agricultural Diversification and Market Development Bureau

PART II - IOWA
408
No-Interest Loans
(a) Program Description
The Iowa State Legislature established the conservation practices revolving loan fund to provide
loans to eligible landowners at no interest for the construction of permanent soil conservation
practices. Eligible landowners may borrow up to $20,000 for a 10-year period. Repayment is
made in 10 annual payments equal to 10% of the initial loan amount. In the event of land
ownership transfer, payment is due immediately.571
(b) WTO Consistency
Expenditures under these programs provide financial support to Iowa producers. The soil
conservation and water quality practices supported by these programs clearly benefit agricultural
producers who rely on soil and clean water for their livelihood. Based on the information
available, it is not clear that the expenditures would be exempt from the U.S. AMS pursuant to
Annex 2.2(g). Arguably, the benefits may be de minimis.
(c) Expenditures and Allocation
The budgetary information available from the Government of Iowa is not sufficiently detailed to
allow us to determine actual, estimated or budgeted expenditures or outlays on account of this
program.
571 No-Interest Loans, Department of Agriculture and Land Stewardship

PART II - KANSAS
409
16. KANSAS
Agricultural producers in Kansas benefit from subsidies and support provided by the Department
of Agriculture and the Department of Animal Health.
The Budget for the Department of Agriculture is reported as follows:
FY 2015 (Actual) $44,935,487 572
FY 2016 (Approved Budget) $47,240,160 573
FY 2017 (Approved Budget) $43,642,966
The State of Kansas administers the following programs:
- Specialty Crop Block Grant Program - Great Plains Growers Conference Grant Program - Organic Cost Share Program - Egg Candling Unit Cost Share Program - Dairy and Feed Safety Program - Meat and Poultry Inspection Program - Dairy Inspection Program - Pesticide and Fertilizer Program - Food Safety and Lodging Inspection Program - Water Resources Cost-Share Program - Non-Point Source Pollution Control Program - Riparian and Wetland Protection Program - Governor's Water Quality Buffer Initiative Program. - Conservation Reserve Enhancement Program (CREP) - Water Transition Assistance Program - Flood Control and Lakes Program - Plant Protection and Weed Control Program - International Marketing Program - Agriculture Education Program - Taiwan Agricultural Youth Exchange Program - Brands Program
572 The Governor’s Budget Report Fiscal Year 2016, pg 424 573 The Governor’s Budget Report Fiscal Year 2017, pg 102/103

PART II - KANSAS
410
Many of these programs are state level vehicles for delivering USDA funding and services. We
have selected a few for specific consideration for illustrative purposes – and in some cases to
identify supplementary support.
Federal programs for Kansas
- Conservation Reserve Program (CRP) - Conservation Reserve Enhancement Program (CREP) - The Emergency Conservation Program (ECP) - Emergency Forest Restoration Program (EFRP) - Farmable Wetlands Program (FWP) - Grassland Reserve Program (GRP) - Source Water Protection Program - Non-Recourse Marketing Assistance Loan - Market Loss Assistance Payment Programs - Loan Deficiency Payments - Non-insured Crop Disaster Assistance Program (NAP)
The Department of Agriculture and the Animal Health Department do not provide sufficient
information to permit us to determine whether or not support is provided exclusively to dairy
producers. Inspection programs benefit consumers, not producers, except indirectly in
promoting the reliability and safety of their products. Therefore, the total value of the support
attributable to dairy production is calculated on the basis of dairy’s share of total state
agricultural production. We recognize that this methodology will result in the amount of support
allocated to dairy being overstated in some states and understated in others. However, this
methodology has been adopted because it allows us to determine the amount of support allocated
to dairy producers by the state governments, on an aggregate basis.
Expenditures by the Department of Agriculture during this period totaled $44,935,487, and the
percentage allocation to dairy for Kansas in 2015 was 3.4%. Therefore, the total amount
allocated to dairy production for 2015is $1,527,807.

PART II - KANSAS
411
Kansas Agricultural Production Loan Deposit Program
(a) Program Description
The Agricultural Production Loan Deposit Program uses “idled” treasury funds to allow Kansas
Banks and Farm Credit Associations to make loans of up to $250,000 to Kansas farmers with a
debt-to-asset ratio of 40% or greater. Loans made under this program are supported by
agricultural production linked deposits placed with the eligible institution by the Kansas Pooled
Money Investment Board. These deposits are at an interest rate set at 2.0% below market rates.
Eligible borrowers must be agricultural producers who live and farm in Kansas with a debt-to-
asset ratio of 40% or more, who have not obtained any other agricultural production loan and
who will use the loaned funds exclusively for operating expenses involved in farming.574
(b) WTO Consistency
This program provides below-market rate loans to producers who would likely not be eligible for
loans from commercial lenders and who would certainly not receive loans at comparable rates.
Therefore, the support provided through this program constitutes a subsidy. As the subsidized
loans must be used for operating expenses involved in farming, they would reduce the recipient
producer’s costs and would have trade and/or production distorting effects. Therefore, the total
value of support provided under this program should be included in the U.S. AMS.
(c) Expenditures and Allocation
The budgetary information available from the Government of Kansas is not sufficiently detailed
to allow us to determine actual, estimated or budgeted expenditures on account of this program.
574 Kansas Agricultural Production Loan Deposit Program, State of Kansas, Office of the Treasurer

PART II - KANSAS
412
Dairy Inspection Program
(a) Program Description
Inspectors with the Kansas Department of Agriculture’s dairy inspection program protect
consumers in Kansas and other states. They regulate the dairy industry, starting at the farm and
continuing as the milk and milk products are transported, processed, distributed and sold.
Activities include inspection of facilities and equipment, collection and testing of samples,
educational activities, and consumer protection.575
(b) WTO Consistency
This activity is excluded from AMS pursuant to Annex 2.2(e) to the WTO Agreement on
Agriculture.
(c) Expenditures and Allocation to Dairy
Inspection services benefit consumers and are a normal function of government. We would not
allocate any benefits from this program to dairy producers.
575 Kansas Dairy Program, Kansas Department of Agriculture

PART II - KENTUCKY
413
17. KENTUCKY
Agricultural producers in Kentucky benefit from subsidies and support provided by the
Department of Agriculture. The Budget for the Department of Agriculture is reported as
follows:576
FY 2015 (Requested) $32,053,100
FY 2016 (Requested) $33,350,500
FY 2017 (Requested) $34,802,100
The State of Kentucky administers the following programs:
- Animal Control Program - Animal Health Program - Animal Marketing Programs - Aquaculture Program - Farmers Markets Program - Bovine Program - GAP-Good Agriculture Practices Program - Ginseng Program - Grape and Wine Program - Hemp Pilot Program - Livestock and Poultry Programs - Organic Program - Plant Marketing Programs - Food Distribution Programs - Grain Licensing and Regulation Program - Pest Control Program - Agriculture Businesses - Agriculture Education Program - Agritourism Program - Trade Show Program - Linked Deposit Program - Value-Added Grants Program
576 Kentucky Department of Agriculture Budget, FY 2014-2016, Department of Agriculture, Kentucky, pg 26
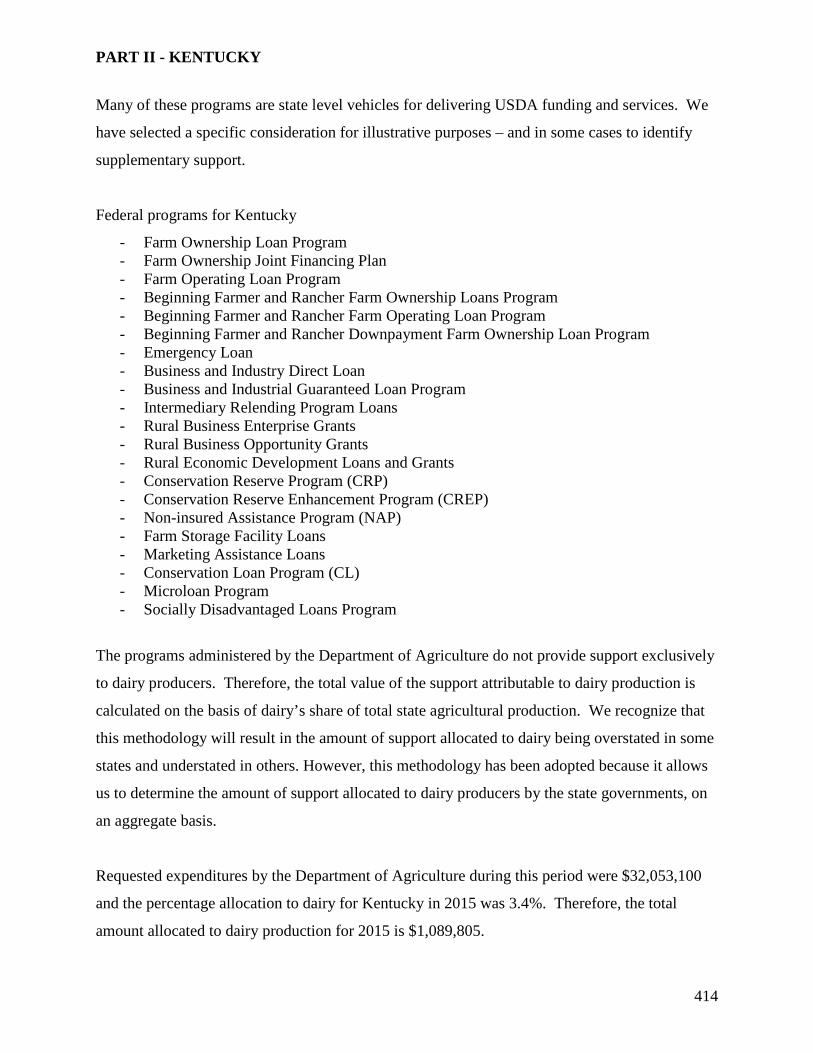
PART II - KENTUCKY
414
Many of these programs are state level vehicles for delivering USDA funding and services. We
have selected a specific consideration for illustrative purposes – and in some cases to identify
supplementary support.
Federal programs for Kentucky
- Farm Ownership Loan Program - Farm Ownership Joint Financing Plan - Farm Operating Loan Program - Beginning Farmer and Rancher Farm Ownership Loans Program - Beginning Farmer and Rancher Farm Operating Loan Program - Beginning Farmer and Rancher Downpayment Farm Ownership Loan Program - Emergency Loan - Business and Industry Direct Loan - Business and Industrial Guaranteed Loan Program - Intermediary Relending Program Loans - Rural Business Enterprise Grants - Rural Business Opportunity Grants - Rural Economic Development Loans and Grants - Conservation Reserve Program (CRP) - Conservation Reserve Enhancement Program (CREP) - Non-insured Assistance Program (NAP) - Farm Storage Facility Loans - Marketing Assistance Loans - Conservation Loan Program (CL) - Microloan Program - Socially Disadvantaged Loans Program
The programs administered by the Department of Agriculture do not provide support exclusively
to dairy producers. Therefore, the total value of the support attributable to dairy production is
calculated on the basis of dairy’s share of total state agricultural production. We recognize that
this methodology will result in the amount of support allocated to dairy being overstated in some
states and understated in others. However, this methodology has been adopted because it allows
us to determine the amount of support allocated to dairy producers by the state governments, on
an aggregate basis.
Requested expenditures by the Department of Agriculture during this period were $32,053,100
and the percentage allocation to dairy for Kentucky in 2015 was 3.4%. Therefore, the total
amount allocated to dairy production for 2015 is $1,089,805.

PART II - KENTUCKY
415
Linked Deposit Loan Program
(a) Program Description
Under this program Kentucky offers loans at “attractive rates” to farmers through participating
financial institutions. Loans can be made up to a maximum of $100,000 for agricultural
diversification, crop production, land acquisition, buildings, livestock, fish and equipment.577 In
addition, an applicant must show annual gross earnings of no more than $1 million with at least
50% of that gross income from farming.578
(b) WTO Consistency
Based on the information available, it appears that this program offers below-market rate loans to
eligible producers or, at least, offers those produces rates below the rates that they could obtain
from commercial lenders. Therefore, the loans provided confer a subsidy on eligible
participants. The loans provided under this program are intended to support agricultural
production and should be included in the U.S. AMS on the basis that they have trade and/or
production distorting effects.
(c) Expenditures and Allocation
The budgetary information available from the Government of Kentucky is not sufficiently
detailed to allow us to determine actual, estimated or budgeted expenditures on account of this
program.
577 Gene C. Royalty, Kentucky Department of Agriculture, Letter to National Council of State Agricultural Finance Programs 578 Kentucky Agriculture Finance Corporation

PART II - LOUISIANA
416
18. LOUISIANA
Agricultural producers in Louisiana benefit from subsidies and support provided by the
Department of Agriculture. The Budget for the Department of Agriculture and Forestry is
reported as follows:579
FY 2015 (Existing Operation Budget) $75,112,417
The State of Louisiana administers the following programs:
- Agricultural Chemistry Programs - Feed Program - Fertilizer Program - Agricultural Liming Program - Analytical Chemistry Laboratory Programs - Louisiana Horticulture Commission - Boll Weevil Eradication Program - Apiary Programs - Plant Pest Quarantine Programs - Pesticide Program - Environmental Programs - Water Protection Program - Structural Pest Control Programs - Meat & Poultry Inspection Program - Food Distribution Program - Livestock Brand Commission - Poultry & Egg Programs - Forestry Protection Programs - The Milk testing Program - The Milk Bonding Program - LDAF Grading and Certification program - Louisiana Dairy Producers Refundable Tax Credit Program - Commodity Promotion And Research - Louisiana Grown Real. Fresh. Logo Program - Senior Farmers Market Nutrition Program - WIC Farmers Market Nutrition Program - Specialty Crop Grant Programs
579 State Budget Fiscal Year 2016-2017, pg 71

PART II - LOUISIANA
417
Many of these programs are state level vehicles for delivering USDA funding and services. We
have selected a few for specific consideration for illustrative purposes – and in some cases to
identify supplementary support.
Federal programs for Louisiana
- Agriculture Mediation Program - Agriculture Risk Coverage (ARC) and Price Loss Coverage (PLC) programs - Beginning Farmer Down Payment Loan - Conservation Reserve Program (CRP) - Conservation Reserve Enhancement Program (CREP) - Direct Farm Ownership Loan - Direct Operating Loan - Emergency Conservation Program (ECP) - Emergency Assistance for Livestock, Honey Bees, & Farm-raised Fish (ELAP) - Emergency Farm Loans - Farm Storage Facility Loan Program - Guaranteed Farm Ownership Loan - Guaranteed Operating Loan - Indian Tribal Land Acquisition Program - Livestock Indemnity Program (LIP) - Livestock Forage Disaster Program (LFP) - Margin Protection Program for Dairy Producers (MPP-Dairy) - Non-insured Crop Disaster Assistance Program (NAP) - Nonrecourse Marketing Assistance Loan Program - Loan Deficiency Payment (LDP) Program - Sugar Loan Program - Sugar Marketing Allotments Program - Youth Loans Program
While the Department of Agriculture has several programs which appear to provide support
exclusively to dairy producers, we do not have sufficient information to determine expenditures
under these programs. Therefore, the total value of the support attributable to dairy production is
calculated on the basis of dairy’s share of total state agricultural production. We recognize that
this methodology will result in the amount of support allocated to dairy being overstated in some
states and understated in others. However, this methodology has been adopted because it allows
us to determine the amount of support allocated to dairy producers by the state governments, on
an aggregate basis.

PART II - LOUISIANA
418
The existing operating budget as of 2015is reported as $75,112,417, and the percentage
allocation to dairy for Louisiana in 2015 was 1.1%. Therefore, the total amount allocated to
dairy production for 2015is $826,237.
PART II - LOUISIANA
419
Dairy Industry Promotion Board
(a) Program Description
The Louisiana Dairy Industry Promotion Board is responsible for the development and
implementation of an advertising, promotion and education program designed to increase the
consumption of milk and other dairy products.580
(b) WTO Consistency
It is not clear from the information available whether or not this program would meet the
requirements of Annex 2.2(f) to the WTO Agreement on Agriculture. If not, its object and
purpose would be production distorting.
(c) Expenditures and Allocation
The budgetary information available from the Government of Louisiana is not sufficiently
detailed to allow us to determine actual, estimate or budgeted expenditures on account of this
program which should be allocated to dairy.
580 Dairy Industry Promotion Board, Louisiana Department of Agriculture

PART II - LOUISIANA
420
Dairy Programs
(a) Program Description
The Dairy Division includes the Dairy Stabilization Board, Milk Testing Program and the Milk
Bonding Program. These programs support and complement each other to the extent that they
regulate and/or promote stability and orderly marketing of fluid milk within the state of
Louisiana.581Given the short shelf life of fluid dairy products, orderly marketing is imperative to
both the consuming public and the milk producers. The Dairy Stabilization Board addresses
problems created in the marketplace, the Milk Testing Program addresses the raw milk
production and handling of milk from the farm to the processing plant. The Milk Bonding
Program is designed to guarantee the payment for milk sold by the farmer to the processing plant
or cooperative. 582
(b) WTO Consistency
This program appears to understate activities and takes on risks which benefit dairy farmers. The
Bonding Program would not appear to meet any of the criteria set out in Annex 2.2 to the WTO
Agreement on Agriculture. The other elements of the program suite provide income support and
guarantee receivables. These are subsidies. Arguably, the milk testing program is a normal
function of government with the object and purpose of consumer protection.
(c) Expenditures and Allocation
The budgetary information available from the Government of Louisiana is not sufficiently
detailed to allow us to determine actual, estimate or budgeted expenditures on account of this
program.
581 Dairy Division, Louisiana Department of Agriculture 582 Ibid.
PART II - MAINE
421
19. MAINE
Agricultural producers in Maine benefit from subsidies and support provided by the Department
of Agriculture. General Fund appropriations for the Department of Agriculture, Food and Rural
Resources are reported as follows:583
FY 2015-2016 $32,386,640
FY 2016-2017 $31,685,242
The Maine Department of Agriculture, Food and Rural Resources administers the following
programs:
- Federal State Market Improvement Program - Maine Farms for the Future Program - The Emergency Food Assistance Program (TEFAP) - Senior FarmShare program - Farm Labor Link Network - Farmland Protection Program - Agricultural Business and Market Development Program - Agricultural Sustainable Water Management Program - Market Promotion and Special Events Program - Agricultural Fair Program - Agricultural Development Grant - Agricultural Marketing Loan Fund - Nutrient Management Program - Maine Milk Commission - Quality Assurance Program - Maine Coastal Program - Maine Natural Areas Program - Soil & Water Conservation Program
583 State of Maine, General Fund Appropriations, 1st Regular Session, 124th Legislature, “2016-2017General Food Summary by Department”, pg 1

PART II - MAINE
422
Many of these programs are state level vehicles for delivering USDA funding and services. We
have selected a few for specific consideration for illustrative purposes – and in some cases to
identify supplementary support.
Federal programs for Maine
- Conservation Reserve Program (CRP) - Conservation Reserve Enhancement Program (CREP) - Emergency Conservation Program (ECP) - Emergency Forest Restoration Program (EFRP) - Farmable Wetlands Program (FWP) - Grassland Reserve Program (GRP) - Source Water Protection Program (SWPP) - Livestock Forage Program (LFP) - Livestock Indemnity Program (LIP): - Emergency Assistance for Livestock, Honeybees, and Farm-Raised Fish (ELAP) - Tree Assistance Program (TAP) - Emergency Loan Program - Disaster Set-Aside Program - Emergency Conservation Program (ECP) - Non-insured Disaster Assistance Program (NAP) - Direct Operating Loans Program - Microloans Program - Direct Farm Ownership Loans Program - Guaranteed Loans Program - Minority and Women Farmers and Ranchers Program - Beginning Farmers and Ranchers Program - Emergency Loans Program - Native American Tribal Loans Program
The programs administered by this agency do not appear to provide support exclusively to dairy.
Many more of them simply involve state-level delivery of USDA programs. Therefore, the total
value of the support attributable to dairy production is calculated on the basis of dairy’s share of
total state agricultural production. We recognize that this methodology will result in the amount
of support allocated to dairy being overstated in some states and understated in others. However,
this methodology has been adopted because it allows us to determine the amount of support
allocated to dairy producers by the state governments, on an aggregate basis.
Total support provided to agricultural producers by Maine in 2015 was $32,386,640.

PART II - MAINE
423
The percentage allocation to dairy for Maine in 2015 was 15.9%. Therefore, support provided to
agricultural producers by the Maine Department of Agriculture, Food and Rural Resources for
2015 was $5,149,476.

PART II - MAINE
424
Agricultural Business Loans
(a) Program Description
The Department of Agriculture, Food and Rural Resources operates two loan programs that
support capital improvements: Agricultural Marketing Loans and Potato Marketing
Improvement Fund loans.
Loans under the Agricultural Marketing Loans program fund either 75% or 90% of a capital
improvement project for the agricultural business. Interest rates are set at a “favourable” 5%.584
Loans made under this program can be up to $250,000. The program is intended to support the
use of new technologies and innovative processes. Loan funds may be used for new or
improvements to land or buildings as well as to purchase retrofit machinery and equipment that
will improve the quality and marketability of Maine’s products.585
(b) WTO Consistency
These programs provide important support to Maine’s agriculture business. As the effect of
these subsidies is to reduce costs and increase production, the support provided should be
included in the U.S. AMS.
(c) Expenditures and Allocation
The budgetary information available from the Government of Maine is not sufficiently detailed
to allow us to determine actual, estimated or budgeted expenditures on account of this program.
584 Agricultural Business Development, Maine Department of Agriculture, Food and Rural Resources 585 Division of Agricultural Resource Developments, Agricultural Market Loan Fund Program

PART II - MAINE
425
Maine Farms for the Future
(a) Program Description
Main Farms for the Future is a statewide program for established farmers who are: planning on
farming for the foreseeable future, thinking about making a major change within their business,
looking for help to transition or expand. 586
A selected farm receives a team of advisors and technical services to develop a plan that covers
management, and technical services to develop a plan that covers management, operating,
marketing and financing, and new investment to improve the farm’s bottom line and long –term
sustainability.
(b) WTO Consistency
The grants provided under this program provide direct support to producers and are intended to
ensure that agricultural land remains in production. Consequently, the grants will have trade
and/or production distorting effects. Therefore, the support provided under this program should
be included in the U.S. AMS.
(c) Expenditures and Allocation
The budgetary information available from the Government of Maine is not sufficiently detailed
to allow us to determine actual, estimated or budgeted expenditures on account of this program.
586 Maine Farms for the Future, Business planning and grants to improve economic viability of Maine Farms

PART II - MAINE
426
Nutrient Management Loan Program
(a) Program Description
This program provides low-interest direct loans, up to $450,000, for the construction of livestock
manure and milk room waste containment/handling facilities.587
(b) WTO Consistency
This program provides support that will offset nutrient management costs that would otherwise
be incurred by recipient producers. Based on the information available, it is not clear that
expenditures under this program would be exempt from the U.S. AMS.
(c) Expenditures and Allocation
The budgetary information available from the Government of Maine is not sufficiently detailed
to allow us to determine actual, estimated or budgeted expenditures on account of this program.
This is now available through FAME. These loans have an effective interest rate of 4% the first
year and 3% each year up to 20 years.
587 Mary Ellen Johnston, Division of Market and Production Development, letter to National Council of State Agricultural Finance Programs

PART II - MAINE
427
Dairy Inspection Program
(a) Program Description
The program provides Maine’s dairy processing industry with State regulated and FDA certified
inspection of their products and State certification of their analysts which allows them to sell
milk across state lines and within the State. The Dairy Inspection Program is responsible for
inspecting processors and farms to ensure the safe supply of milk for the public.588
(b) WTO Consistency
This program would appear to be exempt from AMS pursuant to Annex 2.2(e) to the WTO
Agreement on Agriculture.
(c) Expenditures and Allocation
This is local delivery of USDA programs. It is a normal function of government, which benefits
and protects consumers.
588 Dairy Inspection Program, Maine Department of Agriculture

PART II - MARYLAND
428
20. MARYLAND
Agricultural producers in Maryland benefit from subsidies and support provided by the
Department of Agriculture. The Budget for the Department of Agriculture is reported as
follows:589
2015 (Actual) $76,371,000
2016 (Working) $89,371,000
2017 (Allowance) $90,360,000
The State of Maryland administers the following programs:
- Nutrient Management Training Program - Agricultural Nutrient Management Program - Turfgrass Nutrient Management Program - Maryland Agricultural Water Quality Cost-Share Program - Cover Crop Program - Conservation Reserve Enhancement Program - Agricultural Certainty Program - Animal Waste Technology Fund Program
Many of the programs delivered by the Department of Agriculture in Maryland are state level
vehicles for delivering USDA funding and services. We have selected a specific consideration
for illustrative purposes – and in some cases to identify supplementary support.
Federal programs for Maryland
- Farm Operating Loans Program - Farm Ownership Loans Program - Emergency Farm Loans Program - Microloans Program - Minority and Women Farmers and Ranchers Program - Rural Youth Loans Program - Commodity Loans Program - Loan Deficiency Payments Program - Market Loss Assistance Payment Programs - Conservation Reserve Program (CRP)
589 FY 2011Maryland Proposed Operating Budget Detail, Volume 2

PART II - MARYLAND
429
- Conservation Reserve Enhancement Program (CREP) - Emergency Conservation Program (ECP) - Emergency Forest Restoration Program (EFRP) - Farmable Wetlands Program (FWP) - Grassland Reserve Program (GRP) - Emergency Assistance for Livestock, Honey Bees, and Farm-raised Fish (ELAP) - Emergency Forest Restoration Program (EFRP) - Livestock Forage Program (LFP) - Noninsured Crop Disaster Assistance Program (NAP) - Supplemental Revenue Assistance Payments Program (SURE) - Tree Assistance Program (TAP)
It would appear that, based on available information, the programs administered by the
Department of Agriculture do not appear to provide support exclusively to dairy producers.
Therefore, the total value of the support attributable to dairy production is calculated on the basis
of dairy’s share of total state agricultural production. We recognize that this methodology will
result in the amount of support allocated to dairy being overstated in some states and understated
in others. However, this methodology has been adopted because it allows us to determine the
amount of support allocated to dairy producers by the state governments, on an aggregate basis.
The operating budget in 2015 is $76,371,000, and the percentage allocation to dairy for
Maryland in 2015 was 7.81%. Therefore, the total amount allocated to dairy production for 2015
is $5,956,938.

PART II - MARYLAND
430
Maryland Agricultural Water Quality Cost-Share Program
(a) Program Description
Under this program, Maryland provides grants to farmers for up to 87.5% of the cost to install
best management practices to control soil erosion, manage nutrients and safeguard water quality.
The objective of the program is to protect natural resources, comply with environmental
regulations and maintain farm productivity.590
(b) WTO Consistency
Support provided through this cost-share program confers a subsidy on recipient producers. As
one of the stated objectives of the program is to maintain farm productivity, the subsidy is
intended to have trade and/or production distorting effects. Therefore, support provided through
this program should be included in the U.S. AMS.
(c) Expenditures and Allocation
The budgetary information available from the Government of Maryland is not sufficiently
detailed to allow us to determine actual, estimated or budgeted expenditures on account of this
program.
590 Maryland Agricultural Water Quality Cost-Share Program, Maryland Department of Agriculture

PART II - MASSACHUSETTS
431
21. MASSACHUSETTS
Agricultural producers in Massachusetts benefit from subsidies and support provided by the
Department of Food and Agriculture through three general programs: Department of Agriculture
Resources, Emergency Food Aid Assistance and Integrated Pest Management. The Budget for
the Department of Agriculture reports the following as appropriations for Department programs:
2015 (Summary) $20,794,000 591
2016 (Summary) $23,242,000
The State of Massachusetts administers the following programs:
- Energy Efficiency, Conservation, and Renewables Program - Underground Storage Tank (UST) Program - Pesticide Program - Rabies Control Program - Agricultural Preservation Restriction Program (APR) - Energy Efficiency, Conservation, and Renewables Program - MDAR Energy Massachusetts Farm Energy Program (MFEP) - Agricultural Composting Program - Commonwealth Quality Program - Education Program - Apiary Program - Land Protection Program - Massachusetts Farm Energy Program - Agricultural Energy Grant Program (Ag-Energy) - Agricultural Energy Special Project Grant Program (ENER-SP) - Agricultural Environmental Enhancement Program (AEEP) - Agricultural Food Safety Improvement Program (AFSIP) - APR Improvement Program (AIP) - Farm Energy Discount Program - Farm Viability Enhancement Program (FVEP) - Massachusetts Emergency Food Assistance Program (MEFAP) - Matching Enterprise Grants for Agriculture Program (MEGA) - Rollover Protective Structure (ROPS) Retrofit Program - Stewardship Assistance and Restoration on APRs (SARA) - Urban Agriculture Program
591 FY 2010 Budget – Department of Agricultural Resources General Appropriations Act

PART II - MASSACHUSETTS
432
Many of these programs are state level vehicles for delivering USDA funding and services. We
have selected a few for specific consideration for illustrative purposes – and in some cases to
identify supplementary support.
Federal programs for Massachusetts
- Direct Operating Loans Program - Microloans Program - Direct Farm Ownership Loans Program - Guaranteed Loans Program - Youth Loans Program - Minority and Women Farmers and Ranchers Program - Beginning Farmers and Ranchers Program - Emergency Loans Program - Native American Tribal Loans Program - Recourse Marketing Assistance Loan - Non-recourse Marketing Assistance Loans and Loan Deficiency Payments - Margin Protection Program for Dairy (MPP-Dairy) - Reimbursement Transportation Cost Payment Program - Farm Storage Facility Loan Program - Sugar Storage Facility Loan Program - Conservation Reserve Program (CRP) - Conservation Reserve Enhancement Program (CREP) - Emergency Conservation Program (ECP) - Emergency Forest Restoration Program (EFRP) - Farmable Wetlands Program (FWP) - Grassland Reserve Program (GRP) - Source Water Protection Program (SWPP) - Livestock Forage Program (LFP) - Livestock Indemnity Program (LIP) - Emergency Assistance for Livestock, Honeybees, and Farm-Raised Fish (ELAP) - Tree Assistance Program (TAP) - Emergency Loan Program - Disaster Set-Aside Program - Emergency Conservation Program (ECP) - Non-insured Disaster Assistance Program (NAP)
The Department of Food and Agriculture provides support exclusively to dairy producers in a
limited way which is discussed below. However, there is not sufficient information available on
cost to government under this program which is financed by farmer levies. Therefore, the total
value of the support attributable to dairy production is calculated on the basis of dairy’s share of
total state agricultural production. We recognize that this methodology will result in the amount

PART II - MASSACHUSETTS
433
of support allocated to dairy being overstated in some states and understated in others. However,
this methodology has been adopted because it allows us to determine the amount of support
allocated to dairy producers by the state governments, on an aggregate basis.
The recommended budget for programs operated by the Department of Food and Agriculture for
2015 is reported as $20,794,000, and the percentage allocation to dairy for Massachusetts in
2015 was 9.7%. Therefore, the total amount allocated to dairy production for 2015 is $2,017,018.

PART II - MASSACHUSETTS
434
Milk Producers Security Fund
(a) Program Description
The Milk Producers Security Fund was established to protect Massachusetts dairy farmers from
milk dealers who default on payments for milk that they have already received. The fund is
supported by assessments imposed on dairy farmers.592
(b) WTO Consistency
If this fund is self-financing, there would be no cost to government and this no subsidy. Based
on the limited information available, it is not clear that the program is self-financing or that
payments made under this program would be exempt from the U.S. AMS.
(c) Expenditures and Allocation
The budgetary information available from the Government of Massachusetts is not sufficiently
detailed to allow us to determine actual, estimated or budgeted expenditures on account of this
program. Indeed, based on the program description, this program appears to be funded by user
fees.
592 Producer Security Fund, Bureau of Milk Marketing, Massachusetts Department of Agricultural Resources

PART II - MASSACHUSETTS
435
Agricultural Preservation Restriction Program
(a) Program Description
This is a farmland preservation program that pays farmers and other owners of “prime” and
“state important” agricultural land the difference between the “fair market value” and
“agricultural value” of the land to ensure that the land remains in agricultural production.
Landowners apply to participate in this program. Landowners receive payments in exchange for
a permanent deed restriction that permanently precludes any use of the property that will have a
negative impact on agricultural production.593 As of 2013 the Massachusetts APR program has
permanently protected over 856 farms and a total land area of over 70,000 acres.
(b) WTO Consistency
Payments made under this program should be included in the U.S. AMS on the basis that the
support is intended to ensure continued agricultural production and, thus, would have trade
and/or production distorting effects.
(c) Expenditures and Allocation
The budgetary information available from the Government of Massachusetts is not sufficiently
detailed to allow us to determine actual, estimated or budgeted expenditures on account of this
program.
593 Agricultural Preservation Restriction Program, Massachusetts Department of Agricultural Resources

PART II - MASSACHUSETTS
436
Farm Viability Enhancement Program
(a) Program Description
The Program offers farmers environmental, technical and business planning assistance to
expand, modernize and upgrade their existing operations. Capital for the implementation of the
improvements recommended in the viability plan is available in exchange for an agricultural
covenant on the farm property for a fixed term at five or ten years. FY 2016 spending was
$650,000 in direct grants to farms and over $80,000 was spend on technical assistance costs to
consultants and business plan writers.594
(b) WTO Consistency
Grants provided under the Farm Viability Planning Program are subsidies for purposes of the
WTO Agreement on Subsidies and Countervailing Measures and WTO Agreement on
Agriculture. Based on the information available, it appears that expenditures under this program
should be included in the U.S. AMS. This is particularly the case with respect to grants provided
for seed capital on the basis that these grants are clearly intended to have trade and/or production
distorting effects.
(c) Expenditures and Allocation
As noted, FY 2016 spending was $18,321,472.
594 Farm Viability Enhancement Program, Massachusetts Department of Agricultural Resources

PART II - MASSACHUSETTS
437
Mastitis Program
(a) Program Description
The Mastitis Program offers assistance to dairy farmers by offering laboratory analysis of milk
samples to identify problem areas in their herds to reduce the overall impact of mastitis on their
herds and ultimately, on the quality of milk they produce.595
(b) WTO Consistency
This program would appear to be exempt from AMS pursuant to the criteria of Annex 2.2(e) of
the WTO Agreement on Agriculture.
(c) Expenditures and Allocation
Based on the program description, this program appears to be funded by user fees.
595 Mastitis Program, Massachusetts Department of Agricultural Resources

PART II - MASSACHUSETTS
438
Hauler-Sampler Program
(a) Program Description
The Hauler-Sampler Program establishes a training and registration program for milk hauler-
samplers. Milk haulers are required to take milk samples. These milk samples are tested for milk
component contents (i.e., butterfat, protein, and other milk solids) as well as to gather quality
information such as bacterial counts and to determine the presence of antibiotics.596
(b) WTO Consistency
This program would appear to be exempt from AMS pursuant to the criteria of Annex 2.2(e) of
the WTO Agreement on Agriculture.
(c) Expenditures and Allocation
Based on the program description, this program appears to be funded by user fees.
596 Hauler-Sampler Program, Massachusetts Department of Agricultural Resources

PART II - MICHIGAN
439
22. MICHIGAN
Agricultural producers in Michigan benefit from subsidies and support provided by the
Department of Agriculture. The Budget for the Department of Agriculture is reported as
follows:597
FY 2015 (Current Law) $84,462,200
FY 2016 (Governor’s Recommendation) $84,144,000
FY 2017 (Governor’s Recommendation) $83,644,000
The State of Michigan administers the following programs:
- Farmland Preservation - Forestry Assistance Program - Qualified Forest Program. - Michigan's Agriculture Environmental Assurance Program (MAEAP) - Pollution Prevention - Wildlife Preservation Program - Habitat Incentive Program. - International Marketing Program - MDARD Specialty Crop Block Grant Program - Food Safety Education grant program - Strategic Growth Initiative (SGI) - Value Added & Regional Food Systems Grants
Many of these programs are state level vehicles for delivering USDA funding and services.
Federal programs for Michigan
- Beginning Farmer Down Payment Loan - Biomass Crop Assistance Program (BCAP) - Conservation Reserve Program (CRP) - Conservation Reserve Enhancement Program (CREP) - Conservation Reserve Program - State Acres For Wildlife Enhancement (CRP-SAFE) - Direct Farm Ownership Loan - Direct Operating Loan - Emergency Conservation Program (ECP)
597 Executive Budget Fiscal Year 2016-2017, pg B-3

PART II - MICHIGAN
440
- Emergency Farm Loans - Farm Storage Facility Loan Program - Grassland Reserve Program (GRP) - Guaranteed Farm Ownership Loan - Guaranteed Operating Loan - Indian Tribal Land Acquisition Program - Noninsured Crop Disaster Assistance Program (NAP) - Nonrecourse Marketing Assistance Loan and Loan Deficiency Payment (LDP) Program - Sugar Loan Program and Sugar Marketing Allotments - Sugar Storage Facility Loan Program - Youth Loans
The programs administered by the Department of Agriculture do not appear to provide support
exclusively to dairy producers. Therefore, the total value of the support attributable to dairy
production is calculated on the basis of dairy’s share of total state agricultural production. We
recognize that this methodology will result in the amount of support allocated to dairy being
overstated in some states and understated in others. However, this methodology has been
adopted because it allows us to determine the amount of support allocated to dairy producers by
the state governments, on an aggregate basis.
The budget of the Department of Agriculture for 2015 was reported as $84,462,200, and the
percentage allocation to dairy for Michigan in 2015 was 21.8%. Therefore, the total amount
allocated to dairy production for 2015 is $18,412,760.
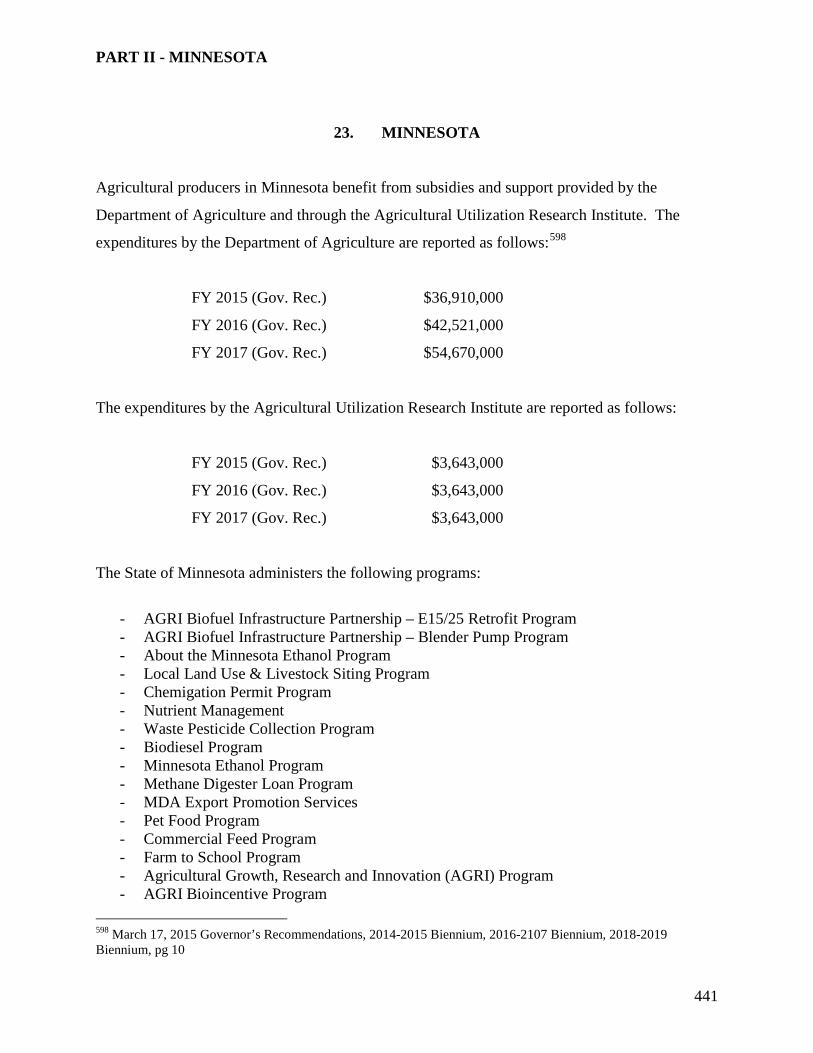
PART II - MINNESOTA
441
23. MINNESOTA
Agricultural producers in Minnesota benefit from subsidies and support provided by the
Department of Agriculture and through the Agricultural Utilization Research Institute. The
expenditures by the Department of Agriculture are reported as follows:598
FY 2015 (Gov. Rec.) $36,910,000
FY 2016 (Gov. Rec.) $42,521,000
FY 2017 (Gov. Rec.) $54,670,000
The expenditures by the Agricultural Utilization Research Institute are reported as follows:
FY 2015 (Gov. Rec.) $3,643,000
FY 2016 (Gov. Rec.) $3,643,000
FY 2017 (Gov. Rec.) $3,643,000
The State of Minnesota administers the following programs:
- AGRI Biofuel Infrastructure Partnership – E15/25 Retrofit Program - AGRI Biofuel Infrastructure Partnership – Blender Pump Program - About the Minnesota Ethanol Program - Local Land Use & Livestock Siting Program - Chemigation Permit Program - Nutrient Management - Waste Pesticide Collection Program - Biodiesel Program - Minnesota Ethanol Program - Methane Digester Loan Program - MDA Export Promotion Services - Pet Food Program - Commercial Feed Program - Farm to School Program - Agricultural Growth, Research and Innovation (AGRI) Program - AGRI Bioincentive Program
598 March 17, 2015 Governor’s Recommendations, 2014-2015 Biennium, 2016-2107 Biennium, 2018-2019 Biennium, pg 10

PART II - MINNESOTA
442
- AGRI Livestock Investment Grants - AGRI Value Added Grants - AGRI Farm to School Grants. - AGRI Good Agricultural Practices (GAP) Certification Cost Share - AGRI Minnesota Pavilion Space - AGRI Beginning Farmer Farm Business Management Scholarships - AGRI Trade Show Support Program (TSP) - AGRI Sustainable Agriculture Demonstration Grants - AGRI Crop Research Grants - AGRI Agriculture Value-Added Feasibility Study Grant (VAFSG) - AgBMP Loan - Aggie Bond Loan - Ag Improvement Loan - Beginning Farmer Loan Program - Dairy Modernization Loan - Farm Opportunity Loan Program - Livestock Expansion Loan - Livestock Equipment Loan Program - Methane Digester Loan - Pilot Agricultural Microloan Program - Restructure II LoanSeller Assisted Loan - Value-Added Agricultural Product Loan - Agricultural Growth, Research & Innovation Program
Many of these programs are state level vehicles for delivering USDA funding and services. We
have selected a few for specific consideration for illustrative purposes – and in some cases to
identify supplementary support.
Federal programs for Minnesota
- Farm Storage Facility Loans (FSFL) - Marketing Assistance Loans (MAL) - Conservation Reserve Program (CRP) - Noninsured Crop Disaster Assistance Program (NAP) - Margin Protection Program for Dairy (MPP-Dairy) - Agriculture Risk Coverage (ARC) and Price Loss Coverage Program (PLC) - Disaster Assistance Programs - Direct Farm Operating Loans - Microloans - Youth Loans - Emergency Loans

PART II - MINNESOTA
443
Minnesota is an important dairy producing state, but we do not have precise information on
dairy-specific expenditures. We have calculated the total value of the support attributable to
dairy production on the basis of dairy’s share of total state agricultural production. We recognize
that this methodology will result in the amount of support allocated to dairy being overstated in
some states and understated in others. However, this methodology has been adopted because it
allows us to determine the amount of support allocated to dairy producers by the state
governments, on an aggregate basis.
The total preliminary expenditures of the Department of Agriculture and the Agricultural
Utilization Research Institute for 2015 were $40,553,000, and the percentage allocation to dairy
for Minnesota in 2015 was 10.1%. Therefore, the total amount allocated to dairy production for
2015 is $4,095,853.

PART II - MINNESOTA
444
Agricultural Best Management Practices (BMP) Loan Program
(a) Program Description
This water quality program provides zero interest loans to local units of government who in turn
provide low interest loans to individuals for Best Management Practices that help implement
agricultural non-point source pollution priorities in local water plans.599
(b) WTO Consistency
This program provides support to producers by granting them low interest loans. Based on the
information available, it is not clear that the expenditures under this program can be excluded
from the U.S. AMS.
(c) Expenditures and Allocation
The budgetary information available from the Government of Minnesota is not sufficiently
detailed to allow us to determine actual, estimated or budgeted expenditures on account of this
program.
599 Agricultural Best Management Practices (BMP) Loan Program, Minnesota Department of Agriculture

PART II - MINNESOTA
445
Agricultural Improvement Loan Program
(a) Program Description
The Agricultural Improvement Loan Program provides financing for farm improvements,
including grain handling facilities, machine storage, erosion control, wells and manure systems.
The borrower must be a Minnesota resident, a Minnesota domestic family farm corporation or a
family farm partnership. The borrower or one of the borrowers must be the principal operator of
the farm. Eligible borrowers must not have a net worth exceeding $450,000 (indexed for
inflation). The Minnesota Rural Finance Authority may provide a loan of up to 45% of loans to
a maximum value of $400,000. This program is intended to assist eligible farmers by improving
production and efficiency and by increasing farm income.600
(b) WTO Consistency
Loans provided under this program are intended to support increased production. Therefore,
expenditures made under this program should be included in the U.S. AMS on the basis that they
are intended to have trade and/or production distorting effects.
(c) Expenditures and Allocation
The budget information available from the Government of Minnesota is not sufficiently detailed
to allow us to determine actual, estimated or budgeted expenditures on account of this program.
600 Agricultural Improvement Loan Program, Minnesota Department of Agriculture
PART II - MINNESOTA
446
Beginning Farmer Loan Program
(a) Program Description
This program assists individuals with a net worth less than $450,000 become full-time farmers.
The program offers affordable financing, a reasonable down payment and assistance in terms of
financial planning and farm management training. Commercial lenders provide loans under the
program. The Rural Finance Authority will provide up to 45% of the loan up to a maximum of
$400,000. The Rural Finance Authority will charge a reduced interest rate for its portion of the
loan.601
(b) WTO Consistency
This program provides important support to eligible producers. To the extent that this program
supports new entrants bringing new production on-line, the expenditures should be included in
the U.S. AMS because they have trade and/or production distorting effects. To the extent that
this program reduces the cost of farm ownership to new entrants, the expenditures should be
included because they have trade distorting effects.
(c) Expenditures and Allocation
The budgetary information available from the Government of Minnesota is not sufficiently
detailed to allow us to determine actual, estimated or budgeted expenditures on account of this
program.
601 Basic Farm Loan Program, Minnesota Department of Agriculture
PART II - MINNESOTA
447
Livestock Expansion Loan Program
(a) Program Description
This program “creates affordable financing” for improvements to land, buildings and other
permanent structures used for livestock production. Eligible borrowers must: (i) be actively
engaged in a livestock operation; (ii) have the ability to repay the loan; and (ii) have a net worth
not exceeding $848,000. The Rural Finance Authority will provide up to 45% of the loan
principal to a maximum of $525,000. The incentive to use this program is “an affordable fixed
interest rate for a certain period of time”.602
(b) WTO Consistency
Based on the information available, it is apparent that loans provided under this program are
intended to increase production. Therefore, expenditures made under this program should be
included in the U.S. AMS because they are intended to have trade and/or production distorting
effects.
(c) Expenditures and Allocation
The budgetary information available from the Government of Minnesota is not sufficiently
detailed to allow us to determine actual, estimated or budgeted expenditures on account of this
program.
602 Livestock Expansion Loan Program, Minnesota Department of Agriculture

PART II - MINNESOTA
448
Dairy Profitability and Enhancement Team Grant Program
(a) Program Description
The Dairy Profitability and Enhancement Team Grant project has been in existence since 1996.
The program runs as mandated in Minnesota Laws 1997, Chapter 216, Section 7, Sub-division 4
which states:
“To expand the one-on-one educational delivery team system to provide appropriate
technologies, including rotational grazing and other sustainable agriculture methods, applicable
to small and medium sized dairy farms to enhance the financial success and long-term
sustainability of dairy farms in the state. Activities of the dairy profit teams must be spread
throughout the dairy producing regions of the state. The teams must consist of farm business
management instructors, dairy extension specialists, and dairy industry partners to deliver the
information and technological services.”603
(b) WTO Consistency
This program would appear to encourage production and provide non-decoupled income support.
It should be included in the U.S. AMS.
(c) Expenditures and Allocation
The budgetary information available from the Government is not sufficiently detailed to allow us
to determine actual, estimated or budgeted expenditures on account of this program.
603 Dairy Profitability and Enhancement Team Grant, Minnesota Department of Agriculture
PART II - MINNESOTA
449
Biodiesel Program
(a) Program Description
Minnesota was the first state to mandate the use of biodiesel, establishing a B2 mandate that took
place September 29, 2005. Since then the mandate has moved to 5% (May 1, 2009) and most
recently to B10 beginning July 1, 2014. The currently higher level mandate is in effect for the
“summer” months, April through September, and reverts to B5 for the winter months. The
mandate is now scheduled to jump to B20 for the summer months in 2018 per Minnesota Statute
239.77.
Because it is made from a locally-grown, renewable resource, using biodiesel can help boost
Minnesota’s farm economy and reduce dependence on fossil fuels. It is estimated that the state’s
B10/B5 requirement will replace over 65 million gallons of diesel fuel with domestic, renewable
biodiesel—and Minnesota’s 63 million gallons of biodiesel production capacity will cover
almost all of that demand.604
(b) WTO Consistency
This program encourages production and provides price support. It should be included in the
U.S. AMS.
(c) Expenditures and Allocation
The budgetary information available from the Government of Minnesota is not sufficient detailed
to allow us to determine actual, estimated or budgeted expenditures on account of this program.
604 https://www.mda.state.mn.us/renewable/biodiesel.aspx

PART II - MINNESOTA
450
Ethanol Program
(a) Program Description
This program was introduced because the 20-cent per gallon ethanol producer payment
legislation initially provided the security required by lenders to invest in small farmer owned
ethanol facilities. In addition to opposition from the petroleum industry, bankers were concerned
that these plants could not compete in the market with large agribusiness processors. At the time,
most ethanol production occurred in large distilleries outside the state. Minnesota corn prices
were among the lowest in the country, which was an advantage for local processing.
Although these farmer-owned ventures have been successful to date, margins have been
squeezed by periods of record high corn prices and low ethanol prices. It is hoped that ten years
of payments will allow plants to retire debt, increase efficiency and develop new products and
markets so they can survive the competition and price fluctuations in agricultural and petroleum
markets. Unique aspects of the ethanol industry made these incentive payments necessary. The
Minnesota ethanol industry is projected to contribute over $2 billion in net annual benefit to the
state.
Since low farm commodity prices have been common (until recently), these new corn processing
plants were expected to represent a new strategy for the long-range profitability of farmers and
farm communities. Vertical integration from the bottom up was expected to allow farmers to
participate in the more profitable end of agriculture. Promoting farmer investments in the
processing and marketing of other crop or livestock enterprises may not require the high level of
state funding as did ethanol. It is hoped that such initiatives can reduce the need for continual
funding of farm financial crisis measures allowing farmers to make it on their own.
(b) WTO Consistency
This program encourages production, provides price support and income support. It should be
included in the U.S. AMS.

PART II - MINNESOTA
451
(c) Expenditures and Allocation
The budgetary information available from the Government of Minnesota is not sufficient detailed
to allow us to determine actual, estimated or budgeted expenditures on account of this program.

PART II - MISSISSIPPI
452
24. MISSISSIPPI
Agricultural producers in Mississippi benefit from subsidies and support provided by the
Department of Agriculture, Commerce and Economic Development. The budget for the
Department of Agriculture, Commerce and Economic Development for FY 2015 is
$643,868,132.605
The State of Mississippi administers the following programs:
- Mississippi Certified Farmers Markets Program - GAP/GHP Certification Cost-Share Program - Specialty Crop Block Grant Program - Honeybee Stewardship Program - National Organic Cost-Share Program - School Garden Grant Program - Pesticide Program - Seed Program - Mississippi Agritourism Program - Farmers Market Nutrition Program - Plant Pest Program
Many of these programs are state level vehicles for delivering USDA funding and services. We
have selected a specific consideration for illustrative purposes – and in some cases to identify
supplementary support.
Federal programs for Mississippi
- Conservation Reserve Program (CRP) - Non-insured Crop Disaster Assistance Program - Direct and Counter-Cyclical Program - Farm Storage Facility Loans - Marketing Gains and LDP - Dairy Disaster Assistance Program - Livestock Compensation Program - Emergency Conservation Program - Emergency Forestry Conservation Program - Crop Disaster Assistance
605 State of Mississippi Budget Fiscal Year 2015, pg 18
PART II - MISSISSIPPI
453
- Guaranteed Loan Program - Direct Loan Program - Beginning Farmer Loans Program
The programs administered by the Department of Agriculture, Commerce and Economic
Development do not appear to provide support exclusively to dairy producers. Therefore, the
total value of the support attributable to dairy production is calculated on the basis of dairy’s
total share of state agricultural production. We recognize that this methodology will result in the
amount of support allocated to dairy being overstated in some states and understated in others.
However, this methodology has been adopted because it allows us to determine the amount of
support allocated to dairy producers by the state governments, on an aggregate basis.
The budget of the Department of Agriculture, Commerce and Economic Development for 2015
was $643,868,132, and the percentage allocation to dairy for Mississippi in 2015 was 0.6%.
Therefore, the total amount allocated to dairy production for 2015 is $3,863,209.

PART II - MISSISSIPPI
454
Agribusiness Enterprise Loan Program
(a) Program Description
The Agribusiness Enterprise Loan Program is administered by the Mississippi Development
Authority. Loans provided under the program may be used to finance buildings and equipment
and for costs associated with the purchase of land (i.e., appraisals, title search, etc) but may not
be used to purchase land. The Mississippi Development Authority participates by providing
20% of the total project cost or $200,000, whichever is less and $700,000 or 30% for
agribusinesses that are retrofitting operations. All loans must be guaranteed by the Farm
Services Agency, the Small Business Administration or a direct lender.606 The portion of the
loan provided by the Mississippi Development Authority under this program is interest free.607
(b) WTO Consistency
Based on the information available, it is apparent that loans provided under this program are
intended to increase production. Therefore, expenditures made under this program should be
included in the U.S. AMS on the basis that they are intended to have trade and/or production
distorting effects.
(c) Expenditures and Allocation
The budgetary information available from the Government of Mississippi is not sufficiently
detailed to allow us to determine actual, estimated or budgeted expenditures on account of this
program.
606 Mississippi Development Authority, Agribusiness Enterprise Loan Program 607 Agribusiness Enterprise Loan Program, Financial Assistance Programs, Mississippi Development Authority, pg 2 of 7

PART II - MISSOURI
455
25. MISSOURI
Agricultural producers in Missouri benefit from subsidies and support provided by the
Department of Agriculture. The expenditures by the Department of Agriculture are reported as
follows:608
FY 2015 (Expenditure) $31,354,486
FY 2016 (Appropriation) $42,331,831
FY 2017 (Request) $43,623,667
The State of Missouri administers the following programs:
- Aquaculture Program - International Marketing Program - Farmers’ Market Matching Grant Program - AgriMissouri program - Animal Care Facility Program - Veterinary Care Program - Blue Ribbon Kennel Program - Pet Friendly Spay and Neuter Funding - Puppy Protection Trust Fund - Pesticide Program - Plant Pest Control Program - Fresh Fruit and Vegetable Inspection Program - Grain Inspection Services Program - Grain Regulatory Services Program - Commodity Services Program - Agricultural Mediation Program - Dairy Producer Margin Insurance Premium Assistance Program - Missouri Dairy Scholars Scholarship Program - Biofuels Infrastructure Partnership (BIP) Grant Program - Fescue Endophyte Tolerance Coupon Program - GAP/GHP Certification Cost Share Program - “Missouri Grown” Promotion Program - Farmers’ Market Promotion Matching Grant Program - Missouri Value-Added "Farm to Table" Grant Program - Missouri Value-Added Grant Program - Cover Crop Regional Conservation Partnership Program
608 Missouri Department of Agriculture Budget FY 2009-2011, Missouri, pg 6-1

PART II - MISSOURI
456
- Organic Certification Cost Share Program - Specialty Crop Block Grant Program - Agribusiness Revolving Loan Fund - Alternative Loan Program - Animal Waste Treatment System Loan Program - Beginning Farmer Loan Program - Bridge Loan Program - Eligible Facility Borrower - Livestock Feed and Crop Input Loan Guarantee Program - Missouri Value-Added Loan Guarantee Program - Single-Purpose Animal Facilities Loan Guarantee Program - Crop and Livestock Loan Guaranty Program - Agricultural Product Utilization Contributor Tax Credit - Family Farm Breeding Livestock Tax Credit Program - New Generation Cooperative Incentive Tax Credits - Qualified Beef Tax Credit Program - Wine and Grape Production Tax Credit Program - For Biofuel Producers - Missouri Biodiesel Producer Incentive Fund - Missouri Ethanol Producer Incentive Fund
Many of these programs are state level vehicles for delivering USDA funding and services. We
have selected a few for specific consideration for illustrative purposes – and in some cases to
identify supplementary support.
Federal programs for Missouri
- Burley Tobacco Program - Non-insured Crop Disaster Assistance Program (NAP), - Crop Insurance Compliance Initiative, - Livestock Assistance Program. - Appeals, Defense Programs - Dairy Indemnity Programs - Conservation Reserve Program - Stewardship Incentive Program - Emergency Conservation Program - Environmental Quality Incentives Program - Conservation Reserve Enhancement Program - Conservation Reserve Program (CRP) - Commodity Loans and Loan Deficiency Payments (LDP) - Wool, Mohair and Pelt Program - Honey Loan Program

PART II - MISSOURI
457
- Graze-Out Payment Program - Trade Adjustments Assistance - Farm Storage Facility Loan Program
There are several Missouri programs which appear to be earmarked for dairy producers. These
do not appear to be programs which require inclusion in AMS. Nor is there sufficient
information to determine expenditures under the programs. Therefore, the total value of the
support attributable to dairy production is calculated on the basis of dairy’s total share of state
agricultural production. We recognize that this methodology will result in the amount of support
allocated to dairy being overstated in some states and understated in others. However, this
methodology has been adopted because it allows us to determine the amount of support allocated
to dairy producers by the state governments, on an aggregate basis.
Appropriations for the Department of Agriculture for 2015 were $31,354,486, and the percentage
allocation to dairy for Missouri in 2015 was 2.5%. Therefore, the total amount allocated to dairy
production for 2015 is $783,862.

PART II - MISSOURI
458
Alternative Loan Program
(a) Program Description
The Missouri Department of Agriculture offers direct loans through the Agriculture
Development Fund to finance the production, processing and marketing needs of an alternative
agricultural enterprise. An agricultural alternative project has been stated as a farm operation that
is different from what traditional rural operations are currently doing.609 An example of an
alternative project would be taking a traditional enterprise and adding a related service, such as
the butchering of a farm’s own livestock and selling the meat itself, or the milling of a farm’s
own wheat and making baked goods. The maximum loan is up to $20,000, at 5.9% interest paid
on a maximum 5 year term with semi-annual payments.610
(b) WTO Consistency
Based on the information available, it appears that this program provides loans to producers at
below prevailing market rates and, on that basis, would confer a subsidy on the recipient. The
program supports increased agricultural production and reduces costs for the specific recipient
producer. Therefore, the total value of support provided through this program should be
included in the U.S. AMS.
(c) Expenditures and Allocation
The budgetary information available from the Government of Missouri is not sufficiently
detailed to allow us to determine actual, estimated or budgeted expenditures on account of this
program.
609 Alternative Loan Program, Missouri Department of Agriculture 610 Ibid.

PART II - MISSOURI
459
Agricultural Product Utilization Contributor Tax Credit Program
(a) Program Description
The Missouri Agricultural and Small Business Development Authority is authorized to grant an
Agricultural Products Utilization Contributor Tax Credit in an amount up to 100% of a
contribution from a person, partnership, corporation, trust, limited liability company or other
donor. The contribution must be made to the authority to be used for financial or technical
assistance to a rural agricultural business as approved by the authority.611
(b) WTO Consistency
The tax credit provided by the State confers a subsidy on the recipient. As the tax credit is
intended to provide financial or technical assistance to rural agricultural business concepts it
would reduce the cost of those specific businesses and is intended to increase production thereby
having trade and/or production distorting effects. Therefore, the total value of expenditures
under this program should be included in the U.S. AMS.
(c) Expenditures and Allocation
The budgetary information available from the Government of Missouri is not sufficiently
detailed to allow us to determine actual, estimated or budgeted expenditures on account of this
program.
611 Agricultural Products Utilization Contributor Tax Credit Program, Missouri Department of Agriculture

PART II - MISSOURI
460
New Generation Cooperative Incentive Tax Credit Program
(a) Program Description
The Missouri Agricultural and Small Business Development Authority provides New Generation
Cooperative Incentive Tax Credits to induce producer member investment into new generation
processing entities that will process Missouri agricultural commodities and agricultural products
into value-added goods, provide substantial benefits to Missouri’s agricultural producers, and
create jobs for Missourians. The amount of a tax credit issued to a member may be the lesser of
50% of the member’s cash investment or $15,000, except for any pro-ration of the member’s tax
credits. The tax credits may be transferred, sold, or assigned.612
(b) WTO Consistency
The tax credits provided through this program confer a subsidy on the recipient. The subsidy is
intended to increase production and, therefore, should be included in the U.S. AMS.
(c) Expenditures and Allocation
The budgetary information available from the Government of Missouri is not sufficiently
detailed to allow us to determine actual, estimated or budgeted expenditures on account of this
program.
612 New Generation Cooperative Incentive Tax Credit Program, Missouri Department of Agriculture

PART II - MISSOURI
461
Missouri Value-Added Grant Program
(a) Program Description
The Missouri Value-Added Grant Program provides grants for projects that add value to
Missouri agricultural products and aid the economy of a rural community. Grant applications
will be considered for value-added agricultural business concepts that:
- Lead to and result in development, processing and marketing of new or expanded uses or
technologies for agricultural products; and
- Foster agricultural economic development in Missouri’s rural communities.
Applications are considered for expenses related to the creation, development and operation of a
value-added agricultural business including: feasibility studies, marketing studies, marketing
and business plans and consulting.613
(b) WTO Consistency
The grants provided through this program confer a subsidy on the recipient. The subsidy will
offset the costs of the recipient producer. These subsidies are also intended to increase
agricultural production. Therefore, the total value of expenditure made on account of these
programs should be included in the U.S. AMS.
(c) Expenditures and Allocation
The budgetary information available from the Government of Missouri is not sufficiently
detailed to allow us to determine actual, estimated or budgeted expenditures on account of this
program.
613 Missouri Value-Added Grant Program, Missouri Department of Agriculture
PART II - MISSOURI
462
Missouri Value-Added Loan Guarantee Program
(a) Program Description
The Missouri Value-Added Loan Guarantee Program provides a 50% first loss guarantee to
lenders who make agricultural business development loans for the acquisition, construction,
improvement, or rehabilitation of agricultural property (i.e., land, buildings, structures,
improvements, equipment and stock) used for the purpose of processing, manufacturing,
marketing, exporting, and adding value to an agricultural product.614
(b) WTO Consistency
Based on the information available, the loan guarantees made under this program provide a
subsidy that supports greater productive capacity among recipient producers. As the intention is
to increase capacity, the total value of the expenditures under this program should be included in
the U.S. AMS on the basis that they are intended to have trade and/or production distorting
effects.
(c) Expenditures and Allocation
The budgetary information available from the Government of Missouri is not sufficiently
detailed to allow us to determine actual, estimated or budgeted expenditures on account of this
program.
614 Missouri Value-Added Loan Guarantee Program, Missouri Department of Agriculture

PART II - MONTANA
463
26. MONTANA
Agricultural producers in Montana benefit from subsidies and support provided by the
Department of Agriculture and the Department of Livestock. The Budget for the Department of
Agriculture is reported in the 2017 Biennial Budget as follows:615
FY 2015 $15,797,650
FY 2016 $17,865,893
FY 2017 $17,812,736
The Budget for the Department of Livestock is reported in the 2017 Biennial Budget as
follows:616
FY 2015 $10,317,378
FY 2016 $12,278,615
FY 2017 $12,209,029
The State of Montana administers the following programs:
- Montana Industrial Hemp Pilot Program. - Commodity Crop Development Programs
o Alfalfa Seed Program o Cherry Research & Market Development Program o Pulse Crop Research & Market Development Program o Potato Research & Market Development Program o Montana Wheat & Barley Committee (MWBC)
- Growth Through Agriculture (GTA) - Junior Agriculture Loans - Noxious Weed Trust Fund Grants - Rural Assistance Loans - Beginning Farm & Ranch Loans - State Tax Deduction for Sale of Agricultural Land - Specialty Crop Block Grants
615 Natural Resources & Transportation, 2017 Biennium Executive Budget, pg C107 616 Ibid., pg C66

PART II - MONTANA
464
- SNAP Program - WIC Program - Senior Farmers Market Nutrition programs - Montana Growth Through Agriculture Program - Montana State Small Business Credit Initiative Program - Big Sky Economic Development Trust Fund Program - Indian Country Economic Development Program - MicroBusiness Finance Program (MBFP) - Made in Montana program - Pesticide Program - Groundwater Protection and Monitoring Program - Vertebrate Pest Program - Noxious Weed Seed Free Forage Program - Beekeeping Program - Feed Program - Fertilizer Program - Agricultural Chemical Groundwater Protection Program
Many of these programs are state level vehicles for delivering USDA funding and services. We
have selected a few for specific consideration for illustrative purposes – and in some cases to
identify supplementary support.
Federal programs for Montana
- Direct Operating Loans - Microloans - Direct Farm Ownership Loans - Guaranteed Loans - Youth Loans Program - Minority and Women Farmers and Ranchers Program - Beginning Farmers and Ranchers Program - Emergency Loans Program - Native American Tribal Loans Program - Livestock Forage Program (LFP) - Livestock Indemnity Program (LIP) - Emergency Assistance for Livestock, Honeybees, and Farm-Raised Fish (ELAP) - Tree Assistance Program (TAP) - Emergency Loan Program - Disaster Set-Aside Program - Emergency Conservation Program (ECP) - Non-insured Disaster Assistance Program (NAP) - The Agriculture Risk Coverage (ARC) - Price Loss Coverage (PLC) programs - Agriculture Loss Coverage-County (ARC-CO)
PART II - MONTANA
465
- Price Loss Coverage (PLC) - Conservation Reserve Program (CRP) - Conservation Reserve Enhancement Program (CREP) - Emergency Conservation Program (ECP) - Emergency Forest Restoration Program (EFRP) - Farmable Wetlands Program (FWP) - Grassland Reserve Program (GRP) - Source Water Protection Program (SWPP) - Margin Protection Program for Dairy Producers (MPP-Dairy)
The programs administered by the Department of Agriculture and the Department of Livestock
do not appear to provide support exclusively to dairy producers. Therefore, the total value of the
support attributable to dairy production is calculated on the basis of dairy’s total share of state
agricultural production. We recognize that this methodology will result in the amount of support
allocated to dairy being overstated in some states and understated in others. However, this
methodology has been adopted because it allows us to determine the amount of support allocated
to dairy producers by the state governments, on an aggregate basis.
The total budget of the Departments of Agriculture and Livestock for 2015 is reported in the
2017 Biennial Budget as $26,115,028, and the percentage allocation to dairy for Montana in
2015 was 1.2%. The total amount allocated to dairy production for FY 2015 is $313,380.

PART II - MONTANA
466
Growth Through Agriculture Program
(a) Program Description
The Growth Through Agriculture program was established to strengthen and diversify
Montana’s agricultural industry by assisting in the development of new agricultural products and
processes. Two types of investment are available under this program: (i) a grant is an award of
money without the expectation that the fund will be repaid, and (ii) a loan is an award of money
with the expectation that all or a portion of the money will be repaid.617
(b) WTO Consistency
Based on the information available, it appears that the “investments” made under this program
confer a subsidy on the recipient. As the objective of the program is to “strengthen and
diversify” agriculture, its intention is to support increased agricultural production. Therefore, as
the program is intended to have trade and/or production distorting effects, the total value of the
expenditures under this program should be included in the U.S. AMS.
(c) Expenditures and Allocation
The budgetary information available from the Government of Montana is not sufficiently
detailed to allow us to determine actual, estimated or budgeted expenditures on account of this
program.
617 Montana Growth Through Agriculture Program, Montana Department of Agriculture

PART II - MONTANA
467
Rural Assistance Loan Program
(a) Program Description
The Rural Assistance Loan Program provides loans to producers with modest financial
investment in agriculture to assist in the economic growth and welfare of Montana agriculture.
The maximum loan amount is $75,000 per individual. Borrowers may refinance loans up to the
maximum of $75,000. Loans are made up to 80% of the value of the collateral used to secure the
loan. A 20% down payment or additional collateral may be required to meet this guideline.
Funds may be used to finance: agricultural property (i.e., livestock and machinery), agricultural
improvements, annual operating expenses and the purchase of land.618
(b) WTO Consistency
Based on the information available, it appears that this program provides low cost loans on better
terms that the eligible producers could receive from commercial lenders. Consequently, the loan
program provides a subsidy. As the subsidy is intended to allow eligible producers to increase
production and reduce costs, the total value of the expenditures under this program should be
included in the U.S. AMS.
(c) Allocation to Dairy
The budgetary information available from the Government of Montana is not sufficiently
detailed to allow us to determine actual, estimated or budgeted expenditures on account of this
program.
618 Rural Assistance Loan, Montana Department of Agriculture

PART II - NEBRASKA
468
27. NEBRASKA
Agricultural producers in Nebraska benefit from subsidies and support provided by the
Department of Agriculture. The Budget for the Department of Agriculture is reported as
follows:619
FY 2015 $17,353,371
FY 2016 $18,089,297
State Board of Agriculture:620
FY 2015 $3,619,268
FY 2016 $4,069,956
Dairy Industry Development Board:
FY 2015 $1,217,406
FY 2016 $1,337,509
The State of Nebraska administers the following programs:
- Senior Farmers' Market Nutrition Program (SFMNP) - Women, Infants, and Children Farmers' Market Nutrition Program (WIC FMNP) - Specialty Crop Block Grant Program - International Trade Program - Livestock Development Program - Cattle Feeding Program - Livestock Friendly County Program - Organic Program - Potato Development Program - Poultry & Egg Program - Specialty Crop Block Grant Program - Animal and Plant Health Protection (APHP) Program - Dairy Inspection Program - Dairy & Food Lab Program
619 State of Nebraska, Biennial Budget FY 2016, pg 77 620 State Board of Agriculture, pg 79

PART II - NEBRASKA
469
Many of these programs are state level vehicles for delivering USDA funding and services. We
have selected a specific consideration for illustrative purposes – and in some cases to identify
supplementary support.
Federal programs for Nebraska
- Direct Operating Loan - Microloan - Direct Farm Ownership Down Payment Loan - Direct Farm Ownership Loan - Emergency Farm Loans - Youth Loans - Guaranteed Farm Ownership Loan - Land Contract Guarantee Program - Farm Storage Facility Loan Program - Biomass Crop Assistance Program (BCAP) - Conservation Reserve Program (CRP) - State Acres for Wildlife Enhancement (SAFE) - Conservation Reserve Enhancement Program (CREP) - Emergency Conservation Program (ECP) - Grassland Reserve Program (GRP) - Farmable Wetland Program (FWP) - Payment Eligibility/Payment Limitation Program - Adjusted Gross Income Provisions - Agriculture Risk Coverage (ARC) Program - Price Loss Coverage (PLC) Program - Conservation Compliance – Highly Erodible Land and Wetlands - Compliance with Highly Erodible Lands Conservation (HELC) - Wetland Conservation Program (WC) - Natural Resources Conservation Service (NRCS) programs. - Nonrecourse Marketing Assistance Loan and Loan Deficiency Payment (LDP) Program - Non-insured Crop Disaster Assistance Program (NAP) - Livestock Forage Program (LFP) - Livestock Indemnity Program (LIP) - Emergency Assistance for Livestock (ELAP) - Honey Bees - Farm Raised Fish Program - Indian Tribal Land Acquisition Program - Agriculture Mediation Program
The programs administered by the Department of Agriculture do not appear to provide support
exclusively to dairy producers. Therefore, the total value of the support attributable to dairy

PART II - NEBRASKA
470
production is calculated on the basis of dairy’s total share of state agricultural production. We
recognize that this methodology will result in the amount of support allocated to dairy being
overstated in some states and understated in others. However, this methodology has been
adopted because it allows us to determine the amount of support allocated to dairy producers by
the state governments, on an aggregate basis.
Appropriated expenditures by the Department of Agriculture and State Board of Agriculture
during this period were $20,972,639, and the percentage allocation to dairy for Nebraska in
2015was 1.0%. Therefore, the total amount allocated to dairy production for 2015 is $209,726.
There were also appropriated expenditures by the Dairy Industry Development Board of
$1,217,406 and 100% of the amount is allocated to dairy.

PART II - NEBRASKA
471
Beginning Farmer Tax Credit Program
(a) Program Description
The Beginning Farmer Tax Credit program encourages established farmers and ranchers to help
beginning farmers and ranchers by agreeing to rent or lease agricultural assets for three years.
Agricultural assets include: land, livestock facilities, machinery, livestock, etc. The rent charged
under this agreement may be based on cash rent, share-crop, cow-calf shares, etc. The
established farmer will receive a refundable tax credit equal to 10% of the cash rent or 15% of
the value of the share crop rent received each year for three years.621
(b) WTO Consistency
The tax credit provided under this program confers a subsidy on established farmers and
ranchers. This subsidy can be used to offset the costs of the specific established farmers and
ranchers participating in this program. Therefore, the total value of the tax credit expenditures
made under this program should be included in the U.S. AMS.
(c) Expenditures and Allocation
The budgetary information available to us from the Government of Nebraska is not sufficiently
detailed to allow us to determine actual, estimated or budgeted expenditures on account of this
program.
621 Beginning Farmer Program, Nebraska Department of Agriculture

PART II - NEVADA
472
28. NEVADA
Agricultural producers in Nevada benefit from subsidies and support provided by the Department
of Agriculture. The Budget for the Department of Agriculture is reported as follows:
FY 2014 $161,804,116
FY 2015 $163,546,886622
FY 2016 NOT AVAILABLE
FY 2017 NOT AVAILABLE
The State of Nevada administers the following programs:
- Milk and Dairy Food Inspection - Milk and Dairy Foods Inspection Program - Dairy Nutrition Program - Animal Disease and Food Safety Laboratory Program - Livestock Identification Program - Microbiology Laboratory Program - Wildlife Program - Child Nutrition Program - Commodity Foods Program - Chemistry Program - Entomology Program - Environmental Program - Export Certification Program - Noxious Weeds Program - Nursery Programs - Organic Programs - Pest Control Program - Plant Pathology Program - Producer Certification Program - Rangeland Health Program - Seed Programs - Specialty Crop Block Grant Program - Good Agricultural Practices Program
Many of these programs are state level vehicles for delivering USDA funding and services.
622 State of Nevada, Executive Budget 2013-2015, pg I-16
PART II - NEVADA
473
Federal programs for Nevada
- Agriculture Mediation Program - Beginning Farmer Down Payment Loan - Conservation Reserve Program (CRP) - Conservation Reserve Enhancement Program (CREP) - Direct Farm Ownership Loan - Direct Operating Loan - Emergency Conservation Program (ECP) - Emergency Farm Loans - Farm Storage Facility Loan Program - Grassland Reserve Program (GRP) - Guaranteed Farm Ownership Loan - Guaranteed Operating Loan - Indian Tribal Land Acquisition Program - Milk Income Loss Contract Extension (MILCX) Program - Non-insured Crop Disaster Assistance Program (NAP) - Nonrecourse Marketing Assistance Loan and Loan Deficiency Payment (LDP) Program - Youth Loans
The programs administered by the Department of Agriculture do not appear to provide support
exclusively to dairy producers. Therefore, the total value of the support attributable to dairy
production is calculated on the basis of dairy’s total share of state agricultural production. We
recognize that this methodology will result in the amount of support allocated to dairy being
overstated in some states and understated in others. However, this methodology has been
adopted because it allows us to determine the amount of support allocated to dairy producers by
the state governments, on an aggregate basis.
Appropriated expenditures by the Nevada Department of Agriculture during this period were
$163,546,886, and the percentage allocation to dairy for Nevada in 2015 was 16.1%. Therefore,
the total amount allocated to dairy production for 2015 is $26,331,049.

PART II – NEW HAMPSHIRE
474
29. NEW HAMPSHIRE
Agricultural producers in New Hampshire benefit from subsidies and support provided by the
Department of Agriculture. The Budget for the Department of Agriculture has reported the total
estimated funds as follows:623
FY 2014 (Actual) $4,551,969
FY 2015 (Adjusted) $5,365,720
FY 2016 (Gov. Rec.) $5,917,785
FY 2017 (Gov. Rec.) $5,975,538
The State of New Hampshire administers the following programs:
- Agricultural Promotion Mini-Grant - Agritourism Planning for Farmers - Animal Disease Traceability - Animals in Disaster - Avian Flu - Crop Insurance - Exporting - Expositions and Events - GAP/GHP Certification - Integrated Pest Management Grant - Organic Certification - Poultry "Cash Buyer" Program - Seal of Quality Program - Commercial Feed Program - Commercial Fertilizer Program - Plant Pest Quarantines Program - Seed License Program - Animal Population Control Program - Integrated Pest Management Grant Program - Invasive Plants Program
623 State of New Hampshire, Governor’s Executive Budget Summary, FY 2016-17, pg 20

PART II – NEW HAMPSHIRE
475
Many of these programs are state level vehicles for delivering USDA funding and services. We
have selected a specific consideration for illustrative purposes – and in some cases to identify
supplementary support.
Federal programs for Nevada
- Agriculture Mediation Program - Beginning Farmer Down Payment Loan - Conservation Reserve Program (CRP) - Conservation Reserve Enhancement Program (CREP) - Direct Farm Ownership Loan - Direct Operating Loan - Emergency Conservation Program (ECP) - Emergency Farm Loans - Farm Storage Facility Loan Program - Grassland Reserve Program (GRP) - Guaranteed Farm Ownership Loan - Guaranteed Operating Loan - Indian Tribal Land Acquisition Program - Milk Income Loss Contract Extension (MILCX) Program - Noninsured Crop Disaster Assistance Program (NAP) - Nonrecourse Marketing Assistance Loan and Loan Deficiency Payment (LDP) Program - Youth Loans
The programs administered by the Department of Agriculture do not provide support exclusively
to dairy producers. Therefore, the total value of the support attributable to dairy production is
calculated on the basis of dairy’s total share of state agricultural production. We recognize that
this methodology will result in the amount of support allocated to dairy being overstated in some
states and understated in others. However, this methodology has been adopted because it allows
us to determine the amount of support allocated to dairy producers by the state governments, on
an aggregate basis.
Appropriated expenditures by the New Hampshire Department of Agriculture, Markets and Food
during this period were $5,365,720, and the percentage allocation to dairy for New Hampshire in
2015was 20.7%. Therefore, the total amount allocated to dairy production for 2015is
$1,110,704.

PART II – NEW HAMPSHIRE
476
Dairy Regulatory Program
(a) Program Description
The Commissioner, of the New Hampshire Department of Agriculture, Markets & Food, is
responsible for enforcing laws and rules pertaining to the weighing and purchase of milk from
the farm. Licensing is required of any person who weighs or samples milk. In addition, every
person who purchases milk or cream from producers within this state, to be either resold as milk
or cream or manufactured into other dairy products, shall first obtain a license under this
program.624
(b) WTO Consistency
This program appears to be exempt from AMS pursuant to Annex 2.2(e) to the WTO Agreement
on Agriculture.
(c) Expenditures and Allocation
This is not a subsidy program. It is a normal function of government.
624 Department of Agriculture, Market & Food, State of New Hampshire, Dairy Regulatory Program

PART II – NEW JERSEY
477
30. NEW JERSEY
Agricultural producers in New Jersey benefit from subsidies and support provided by the
Department of Agriculture. The Budget for the Department of Agriculture has reported the total
estimated funds as follows:
FY 2015 (Expended) $19,742,000 625
FY 2016 (Appropriation) $19,953,000 626
FY 2017 (Recommended) $19,953,000
The State of New Jersey administers the following programs:
- New Jersey Wine Industry Project Grants - Soil and Water Conservation Grants - EQIP Organic Initiative - Farmers Market Assistance - Garden State Dairy Alliance - New Jersey Junior Breeder Loan Fund - Value Added Producer Grants - Federal State Marketing Improvement Program (FSMIP) - Sustainable Agriculture Research and Education (SARE) - Farm Credit East (AgEnhancement) - Energy Programs - New Jersey Clean Energy Program - Green Energy - Renewable Energy Systems and Energy Efficiency Improvements Program - Biomass Research and Development Initiative Grants - New Jersey SmartStart Building - Everything Jersey Fresh program - Farm to School Program - Organic Certification Program - Grown Better in the Garden State - Farmland Preservation Program - State Acquisition - County Planning Incentive Grants - Municipal Planning Incentive Grants - Grants to Non-profits
625 State of New Jersey Budget Fiscal Year 2016, pg D-14 626 State of New Jersey Budget Fiscal Year 2017, pg 35

PART II – NEW JERSEY
478
- Pinelands Program - Eight-Year Program - Jersey Equine Program - Jersey Ag Education Program - Animal Health Diagnostic Lab Program - NJ Animal Emergency Program
Many of these programs are state level vehicles for delivering USDA funding and services. We
have selected a specific consideration for illustrative purposes – and in some cases to identify
supplementary support.
Federal programs for New Jersey
- Specialty Crop Block Grant - USDA's Rural Energy for America Program (REAP) - Agricultural Credit and Finance Program - Conservation Reserve Program (CRP) - Environmental Quality Incentive Program (EQIP) - Wetlands Reserve Program (WRP) - Wildlife Habitat Incentives Program (WHIP) - Grassland Reserve Program (GRP) - Agricultural Management Assistance (AMA) - Conservation Reserve Enhancement Program (CREP)
The programs administered by the Department of Agriculture, other than health and inspection
related programs, do not provide support exclusively to dairy producers. Therefore, the total
value of the support attributable to dairy production is calculated on the basis of dairy’s total
share of state agricultural production. We recognize that this methodology will result in the
amount of support allocated to dairy being overstated in some states and understated in others.
However, this methodology has been adopted because it allows us to determine the amount of
support allocated to dairy producers by the state governments, on an aggregate basis.
Appropriated expenditures by the New Jersey Department of Agriculture during this period were
$19,742,000, and the percentage allocation to dairy for New Jersey in 2015 was 2.1%.
Therefore, the total amount allocated to dairy production for 2015 is $414,582.

PART II – NEW JERSEY
479
Farmland Preservation Program
(a) Program Description
The Farmland Preservation Program seeks to protect farmland through the temporary or
permanent purchase of development rights over the land. The intention is that the land can
continue to be used for agricultural purposes and may not be developed or used for a non-
agricultural use. Participating producers will retain the right to continue to farm their land.
(i) State Acquisition Program
Under this sub-program, landowners can either sell the development rights to their land
and continue to own and farm the land, or sell their land outright. In both cases, the land
is permanently deed-restricted for agriculture use. The State Agriculture Development
Committee (SADC) provides counties with grants to fund 60-80% of the cost of
purchasing development rights on approved farms.627
(ii) Municipal Planning Incentive Grants
The Municipal Planning Incentive Grant (PIG) Program enables the SADC to provide
grants to eligible counties and municipalities to purchase development easements for
permanent preservation of farmland in designated project areas. 628
627 State Acquisition Program; Farmland Preservation Program, New Jersey State Agriculture Development Committee 628 Municipal Planning Incentive Grants; Farmland Preservation Program, New Jersey Department of Agriculture

PART II – NEW JERSEY
480
(iii) County Planning Incentive Grants
The County Planning Incentive Grant is a new program that encourages a comprehensive
planning process for farmland preservation at the county level. It offers several other
advantages over the traditional easement purchase program, including enabling counties
to accept to accept and process farmland preservation applications year-round, rather than
once a year; reducing the timeframe from landowner application to closing; and
rewarding counties that complete transactions in a timely manner with the potential for
additional funding.629
(iv) Pinelands Preservation Program
Under this sub-program, landowners sell a development easement over their land.
Landowners retain the land but are limited to agricultural use. The purchase price is
negotiated with the landowner subject to the recommendations of two independent
appraisers and a review by a state review appraiser. Appraisals generally reflect the
value of the Pinelands Development Credits that have been assigned to the land.630
(v) Eight-Year Program
Under this sub-program, landowners agree to voluntarily restrict development on their
land for a period of eight years in exchange for certain benefits, including soil and water
conservation cost-sharing grants and protection from nuisance complaints, emergency
fuel and water rationing, zoning changes and eminent domain actions.631
629 County Planning Incentive Grants; Farmland Preservation Program, New Jersey Department of Agriculture 630 Pinelands Preservation Program; Farmland Preservation Program, New Jersey Department of Agriculture 631 Eight-Year Program; Farmland Preservation Program, New Jersey Department of Agriculture

PART II – NEW JERSEY
481
(b) WTO Consistency
The purchase of development rights confers a subsidy on the recipient landowner. The program
ensures that land that would otherwise be developed remains in agricultural production.
Therefore, as the program is intended to have trade and/or production distorting effects, the total
value of the expenditures made under this program should be included in the U.S. AMS.
(c) Expenditures
The expenditures for this program is reported under the general fund of direct state services, and
are as follows:632
2015 (Actual) $2,069,000
(d) Allocation to Dairy
This program does not provide support exclusively to dairy producers. Because, the total value
of the support attributable to dairy production is calculated on the basis of dairy’s total share of
state agricultural production. We have not made a specific allocation to dairy for this program.
We recognize that this methodology will result in the amount of support allocated to dairy being
overstated in some states and understated in others. However, this methodology has been
adopted because it allows us to determine the amount of support allocated to dairy producers by
the state governments, on an aggregate basis.
Actual expenditures on account of the Farmland Preservation Program during this period were
$2,069,000, and the percentage allocation to dairy for New Jersey in 2015 was 2.1%. Therefore,
the total amount allocated to dairy production for 2015 is $43,449.
632 State of New Jersey Budget Fiscal Year 2009-2010, pg D-13

PART II – NEW MEXICO
482
31. NEW MEXICO
Agricultural producers in New Mexico benefit from subsidies and support provided by agencies,
including the New Mexico Livestock Board and the Renewable Energy and Energy Efficiency,
Water Resource Allocation and Interstate Stream Compact Compliance and Water Development.
The Budget for the Livestock Board is reported as follows:633
FY 2015 (Actual) $36,103,000
FY 2016 (Operating) $36,828,600
FY 2017 (Recommended) $37,636,800
The State of New Mexico administers the following programs:
- New Mexico Department of Agriculture’s (NMDA) Organic Program - Acequia and Community Ditch Fund - Noxious Weed Management - Paso del Norte Watershed Council 319 Grant - Soil and Water Conservation District Act - Rangeland and Grazing Issues - Water and Natural Resources Policy - Wildlife Programs - Cooperative Wildlife Services Program - Wildlife Species Management - Apiary Program - Commercial Feed Inspections Program - Dairy Inspections Program - Egg Inspections Program - Fertilizer and Soil Conditioner Inspection Program - Fruit and Vegetable Inspections Program - Livestock Scale Inspections Program - Nursery Inspections Program - Seed Program
Many of these programs are state level vehicles for delivering USDA funding and services.
633 New Mexico, Executive Budget Recommendation 2017, pg 17

PART II – NEW MEXICO
483
Federal programs for New Mexico
- Agriculture Mediation Program - Beginning Farmer Down Payment Loan - Conservation Reserve Program (CRP) - Conservation Reserve Enhancement Program (CREP) - Direct and Counter-cyclical Payment (DCP) Program - Direct Farm Ownership Loan - Direct Operating Loan - Emergency Conservation Program (ECP) - Emergency Farm Loans - Farm Storage Facility Loan Program - Grassland Reserve Program (GRP) - Guaranteed Farm Ownership Loan - Guaranteed Operating Loan - Indian Tribal Land Acquisition Program - Milk Income Loss Contract Extension (MILCX) Program - Non-insured Crop Disaster Assistance Program (NAP) - Non-recourse Marketing Assistance Loan and Loan Deficiency Payment (LDP) Program - Sugar Loan Program and Sugar Marketing Allotments - Sugar Storage Facility Loan Program - Youth Loans
The programs administered by these agencies do not appear to provide support exclusively to
dairy producers. Therefore, the total value of the support attributable to dairy production is
calculated on the basis of dairy’s total share of state agricultural production. We recognize that
this methodology will result in the amount of support allocated to dairy being overstated in some
states and understated in others. However, this methodology has been adopted because it allows
us to determine the amount of support allocated to dairy producers by the state governments, on
an aggregate basis.
The total budget of the New Mexico Livestock Board, Renewable Energy and Energy
Efficiency, Water Resource Allocation and Interstate Stream Compact Compliance and Water
Development for FY 2015 was $36,103,000, and the percentage allocation to dairy for New
Mexico in 2015 was 41.3%. Therefore, the total amount allocated to dairy production for 2015
is $14,910,539.
PART II – NEW YORK
484
32. NEW YORK
Agricultural producers in New York benefit from subsidies and support provided by the
Department of Agriculture and Markets. The Budget for the Department of Agriculture and
Markets has reported the appropriations as follows:634
FY 2015 (Results) $104,699,000
FY 2016 (Enacted) $108,571,000
FY 2017 (Projected) $99,244,000
The State of New York administers the following programs:
- NYS Wireless EBT Program - Farmers Market Manager Professional Certification Program - Urban Agriculture Program - WIC Vegetables and Fruits Checks Program - Agri-Business Child Development Program (Farmworker daycare) - Agricultural Environmental Management - Agricultural Producers Security Program (Farm Products Dealer Licensing) - Cattle Health Assurance Program - Crop Insurance and Risk Management Education - Dairy Farmer Resources - Egg Quality Assurance Program - Farm to College Program - Farm to Factory Program - Farm to School Program - Farm/Cuisine Trails - Farmers' Market Nutrition Program - Farmland Protection - Food and Agriculture Security Program - FreshConnect Checks Program - International Trade Program - New York State Certified High Quality Foods Program - Organic Certification Reimbursement Program - Organic Farming Development/Assistance Program - Produce Quality Assurance Program - Specialty Crop Block Grant Program - Urban Agriculture Program
634 New York State, 2016 Enacted Budget Financial Plan, pg T155
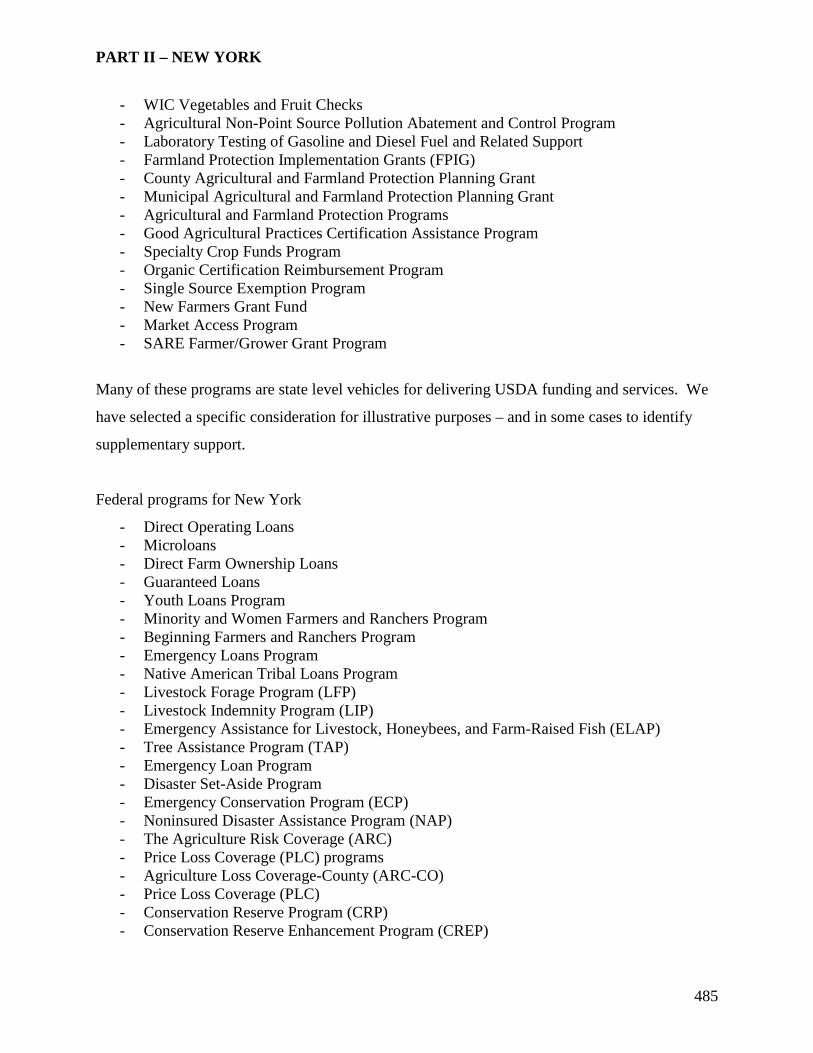
PART II – NEW YORK
485
- WIC Vegetables and Fruit Checks - Agricultural Non-Point Source Pollution Abatement and Control Program - Laboratory Testing of Gasoline and Diesel Fuel and Related Support - Farmland Protection Implementation Grants (FPIG) - County Agricultural and Farmland Protection Planning Grant - Municipal Agricultural and Farmland Protection Planning Grant - Agricultural and Farmland Protection Programs - Good Agricultural Practices Certification Assistance Program - Specialty Crop Funds Program - Organic Certification Reimbursement Program - Single Source Exemption Program - New Farmers Grant Fund - Market Access Program - SARE Farmer/Grower Grant Program
Many of these programs are state level vehicles for delivering USDA funding and services. We
have selected a specific consideration for illustrative purposes – and in some cases to identify
supplementary support.
Federal programs for New York
- Direct Operating Loans - Microloans - Direct Farm Ownership Loans - Guaranteed Loans - Youth Loans Program - Minority and Women Farmers and Ranchers Program - Beginning Farmers and Ranchers Program - Emergency Loans Program - Native American Tribal Loans Program - Livestock Forage Program (LFP) - Livestock Indemnity Program (LIP) - Emergency Assistance for Livestock, Honeybees, and Farm-Raised Fish (ELAP) - Tree Assistance Program (TAP) - Emergency Loan Program - Disaster Set-Aside Program - Emergency Conservation Program (ECP) - Noninsured Disaster Assistance Program (NAP) - The Agriculture Risk Coverage (ARC) - Price Loss Coverage (PLC) programs - Agriculture Loss Coverage-County (ARC-CO) - Price Loss Coverage (PLC) - Conservation Reserve Program (CRP) - Conservation Reserve Enhancement Program (CREP)

PART II – NEW YORK
486
- Emergency Conservation Program (ECP) - Emergency Forest Restoration Program (EFRP) - Farmable Wetlands Program (FWP) - Grassland Reserve Program (GRP) - Source Water Protection Program (SWPP) - Margin Protection Program for Dairy Producers (MPP-Dairy)
The programs administered by the Department of Agriculture and Markets do not appear to
provide support exclusively to dairy producers. Therefore, the total value of the support
attributable to dairy production is calculated on the basis of dairy’s total share of state
agricultural production. We recognize that this methodology will result in the amount of support
allocated to dairy being overstated in some states and understated in others. However, this
methodology has been adopted because it allows us to determine the amount of support allocated
to dairy producers by the state governments, on an aggregate basis.
Appropriated expenditures by the New York Department of Agriculture and Markets during this
period were $104,699,000, and the percentage allocation to dairy for New York in 2015 was
47.9%. Therefore, the total amount allocated to dairy production for 2015 is $50,150,821.

PART II – NEW YORK
487
Farmland Protection Program
(a) Program Description
New York State assistance payments are available to counties and municipalities to cover up to
75% of the total costs for implementation activities to protect viable farmland.635 Under these
programs, local government acquires the development rights to viable farmland thereby ensuring
that it can only be used for agricultural purposes.
Funding for the Farmland Protection program itself increased by $5 million in 2016 and built on
last year’s historic investment in farmland protection, including the $20 million Hudson Valley
Agricultural Enhancement Program.
The project awards by region include:636
- Central New York - $2.4 million awarded for 3 projects
- North Country - $1.8 million awarded for 1 project
- Western New York - $700,000 awarded for 2 projects
(b) WTO Consistency
The purchase of development easements confers a subsidy on landowners and ensures that land
that would otherwise be developed remains in agricultural production. As the program is
intended to have trade and/or production distorting effects, the total value of expenditures under
this program should be included in the U.S. AMS.
635 Farmland Protection Program, New York Department of Agriculture and Markets 636 New York State Release, Governor Cuomo Announces Nearly $4.9 Million Awarded to Protect Valuable and At-Risk Farmland Across the State, October 25, 2016

PART II – NEW YORK
488
(c) Expenditures and Allocation
The budgetary information available from the Government of New York is not sufficiently
detailed to allow us to determine actual, estimated or budgeted expenditures on account of this
program.

PART II – NORTH CAROLINA
489
33. NORTH CAROLINA
Agricultural producers in North Carolina benefit from subsidies and support provided by the
Department of Agriculture and Consumer Services. The Budget for the Department of
Agriculture and Consumer Services has reported the appropriations as follows:637
FY 2014-15 (Actual) $169,827,215
FY 2015-16 (Enacted) $171,844,413
FY 2016-17 (Enacted) $170,696,152
The State of North Carolina administers the following programs:
North Carolina
- Marketing Programs o Certified Roadside Farmers Markets o Farmers Markets and Ag Centers o Farm-to-School Program o Equine Marketing o Goodness Grows in North Carolina o Got To Be NC o International Marketing o Livestock Marketing o NCDA&CS General Store o N.C. Agricultural Associations o Small and Minority Farms Assistance
- Consumer Programs o Gas pump inspections o Weight and measurement accuracy o Food Safety o Red Imported Fire Ant Program o Sleep Products o Soil Testing o Termite and other pest information
- Grower Programs o Hay Alert o Bee Linked o N.C. Farm ID o Agricultural Development and Farmland Preservation Trust Fund
637 North Carolina 2015-2017 Fiscal Biennium Budget Highlights, pg 4

PART II – NORTH CAROLINA
490
o Growers Assistance and Information Network o Organic Certification Reimbursement
Many of these programs are state level vehicles for delivering USDA funding and services.
Federal programs for North Carolina
- Agricultural Risk Coverage and Price Loss Coverage (ARC/PLC) - Conservation Reserve Program (CRP) - Conservation Reserve Enhancement Program (CREP) - Emergency Conservation Program (ECP) - Emergency Forest Restoration Program (EFRP) - Farmable Wetlands Program (FWP) - Grassland Reserve Program (GRP) - Source Water Protection Program - Margin Protection Program for Dairy Producers (MPP-Dairy) - Livestock Forage Program (LFP) - Livestock Indemnity Program (LIP) - Emergency Assistance for Livestock, Honeybees, and Farm-Raised Fish (ELAP) - Tree Assistance Program (TAP) - Emergency Loan Program - Disaster Set-Aside Program - Emergency Conservation Program (ECP) - Noninsured Disaster Assistance Program (NAP) - Biofuel Infrastructure Partnership - Biomass Crop Assistance Program - Farm-to-Fleet Feedstock Program Biofuel Production Incentive (BPI) - Feedstock Flexibility Program for Bioenergy Producers - Loan Deficiency Payments - Marketing Assistance Loan - Loan Deficiency Payment (LDP) - Reimbursement Transportation Cost Payment Program - Dairy Margin Protection Payment - Dairy Indemnity Payment Program - Direct Operating Loans - Microloans - Direct Farm Ownership Loans - Guaranteed Loans - Youth Loans - Minority and Women Farmers and Ranchers - Beginning Farmers and Ranchers - Emergency Loans - Native American Tribal Loans

PART II – NORTH CAROLINA
491
The programs administered by the Department of Agriculture and Consumer Services do not
appear to provide significant measurable support exclusively to dairy producers. Therefore, the
total value of the support attributable to dairy production is calculated on the basis of dairy’s
total share of state agricultural production. We recognize that this methodology will result in the
amount of support allocated to dairy being overstated in some states and understated in others.
However, this methodology has been adopted because it allows us to determine the amount of
support allocated to dairy producers by the state governments, on an aggregate basis.
Appropriated expenditures by the North Carolina Department of Agriculture and Consumer
Services during this period were $171,844,413, and the percentage allocation to dairy for North
Carolina in 2015 was 1.6%. Therefore, the total amount allocated to dairy production for 2015 is
$2,749,511.

PART II – NORTH DAKOTA
492
34. NORTH DAKOTA
Agricultural producers in North Dakota benefit from subsidies and support provided by the
Department of Agriculture. The Budget for Agriculture and Economic Development (North
Dakota Department of Agriculture, Branch Reserve Centers, NDSU Extension Service, Northern
Crops Institute, NDSU Main Research Center, Agronomy Seed Farm, North Dakota State Fair,
State Water Commission) has reported the appropriations as follows:638
2013-15 (Appropriations) $1,091,953,490
2015-17 (Appropriations) $1,433,022,455
The State of North Dakota administers the following programs:
Animal Health
- Animal Approved Landfills - Animal Disease Traceability - Animal Health - Animal Health Diseases - Animal Importation Requirements - Biosecurity - Brand Program - Certificates of Veterinary Inspection - Emergency Preparedness & Response - Feral Swine - Livestock Medicines - Modified Live Vaccines - National Poultry Improvement Plan - ND State Board of Animal Health Members and Upcoming Meetings - Non-Traditional Livestock - Veterinarian Loan Repayment Program(s) - Veterinary Feed Directive
Feeds/Fertilizers - Anhydrous Ammonia Program - Feed Program - Fertilizer Program - Livestock Medicines
638 North Dakota Legislative Council, Comparisons of 2007-09 Appropriations and 2009-11 Appropriations
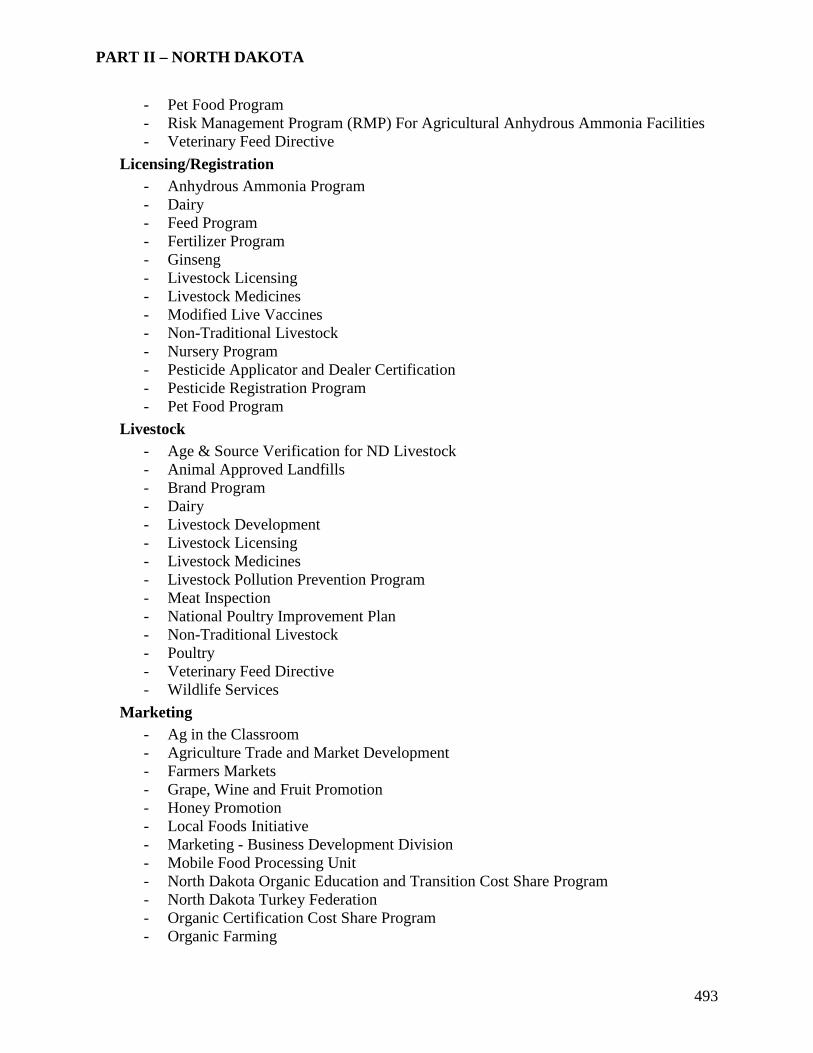
PART II – NORTH DAKOTA
493
- Pet Food Program - Risk Management Program (RMP) For Agricultural Anhydrous Ammonia Facilities - Veterinary Feed Directive
Licensing/Registration - Anhydrous Ammonia Program - Dairy - Feed Program - Fertilizer Program - Ginseng - Livestock Licensing - Livestock Medicines - Modified Live Vaccines - Non-Traditional Livestock - Nursery Program - Pesticide Applicator and Dealer Certification - Pesticide Registration Program - Pet Food Program
Livestock - Age & Source Verification for ND Livestock - Animal Approved Landfills - Brand Program - Dairy - Livestock Development - Livestock Licensing - Livestock Medicines - Livestock Pollution Prevention Program - Meat Inspection - National Poultry Improvement Plan - Non-Traditional Livestock - Poultry - Veterinary Feed Directive - Wildlife Services
Marketing - Ag in the Classroom - Agriculture Trade and Market Development - Farmers Markets - Grape, Wine and Fruit Promotion - Honey Promotion - Local Foods Initiative - Marketing - Business Development Division - Mobile Food Processing Unit - North Dakota Organic Education and Transition Cost Share Program - North Dakota Turkey Federation - Organic Certification Cost Share Program - Organic Farming

PART II – NORTH DAKOTA
494
- Pride of Dakota - Specialty Crop Block Grant Program
Meat Inspection - Meat Inspection
Mediation - Mediation Services - Pipeline Restoration and Reclamation Oversight Program
Outreach/Education - Ag in the Classroom - Compliance Assistance - Integrated Pest Management (IPM) in Schools - Research & Information
Pesticides - Endangered Species Protection - Integrated Pest Management (IPM) in Schools - North Dakota Crop Protection Product Harmonization and Registration Board
(NDCPPHRB) - North Dakota Department of Agriculture Seed Policy - Pesticide Applicator and Dealer Certification - Pesticide Compliance Assistance - Pesticide Control Board - Pesticide Enforcement Program - Pesticide Registration Program - Pesticide Sensitive Areas-North Dakota Bee Map - Pesticide Water Quality Program - Project Safe Send - Worker Protection Standard and Worker Safety
Plants/Insects - Apiary Program (Honey Bees) - Biological Control - Export Certification - Firewood - Ginseng - GIS Maps - Industrial Hemp - Noxious Weeds - Nursery Program - Pest Survey and Outreach - Waterbank Program - Weed Seed Free Forage Program

PART II – NORTH DAKOTA
495
Many of these programs are state level vehicles for delivering USDA funding and services. We
have selected a specific consideration for illustrative purposes – and in some cases to identify
supplementary support.
Federal programs for North Dakota
Conservation - Conservation Reserve Program - Conservation Reserve Enhancement Program - Emergency Conservation Program - Source Water Protection Program - Farmable Wetlands Program - Grasslands Reserve Program
Agricultural Risk Coverage/Price Loss Coverage - ARC/PLC
Disaster Assistance - Disaster Assistance Programs
Farm Loans - Beginning Farmers and Ranchers Loans - Direct Farm Loans - Emergency Farm Loans - Guaranteed Farm Loans - Socially Disadvantaged Farmers and Ranchers Loans
Price Support - Commodity Loans - Loan Deficiency Payments - Market Loss Assistance Payment Programs - Facility Loan Programs
The programs administered by the Department of Agriculture do not appear to provide
significant and measureable support exclusively to dairy producers. Therefore, the total value of
the support attributable to dairy production is calculated on the basis of dairy’s total share of
state agricultural production. We recognize that this methodology will result in the amount of
support allocated to dairy being overstated in some states and understated in others. However,
this methodology has been adopted because it allows us to determine the amount of support
allocated to dairy producers by the state governments, on an aggregate basis.

PART II – NORTH DAKOTA
496
Appropriated expenditures by the North Dakota Department of Agriculture during 2015 to 2017
were reported as $1,433,022,455, and the percentage allocation to dairy for North Dakota in
2015 was 0.8%. As this budget covers two fiscal years, one half of this amount, or $716,511,228,
is the total budget for FY 2015. Therefore, the total amount allocated to dairy production for
2015 is $5,732,090.

PART II – NORTH DAKOTA
497
AgPACE Program (Irrigation Loan)
(a) Program Description
AgPACE Program is an interest rate buy-down program available to farmers to create an on-farm
business integrated into the farm operation. The interest rate buy-down is up to 4% below yield
rate. The maximum buy-down per borrower may not exceed $20,000 per biennium with a
lifetime cap of $60,000.
The North Dakota State Water Commission (NDSWC) is charged with permitting and
monitoring for irrigation systems The NDSWC provides additional $20,000 for a total buy-down
of $40,000 for first time borrowers.639
(b) WTO Consistency
Irrigation permits production where it might not otherwise occur. It also enhances production
yields. Therefore, this program which encourages production should be included in the U.S.
AMS.
(c) Expenditures and Allocation
The budgetary information available from the Government of North Dakota is not sufficiently
detailed to allow us to determine actual, estimated or budgeted expenditures on account of this
program.
639 Funding Assistance Programs for Irrigation Development in North Dakota, Bank of North Dakota, March 2008

PART II – OHIO
498
35. OHIO
Agricultural producers in Ohio benefit from subsidies and support provided by the Department
of Agriculture. The Budget for the Department of Agriculture has reported the appropriations as
follows:640
FY 2014 (Actual) $57,696,000
FY 2015 (Estimated) $52,613,000
FY 2016 (Recommended) $57,778,000
FY 2017 (Recommended) $57,703,000
The State of Ohio administers the following programs:
- Animal Health Division - Animal Disease Program Commercial Dog Breeders Act - Animal Identification System - Dangerous Wild Animals - Livestock Care Standards - Animal Disease Diagnostic Lab - Apiary Program - Auctioneer Program - Dairy Division - National Dairy Farm Program - Emerald Ash Borer Program - Food Safety Division - Grain Warehouse Program - Gypsy Moth Program - Livestock Environmental Permitting Program - Meat Inspection Division - Pesticide and Fertilizer Regulation Program - Plant Pest Control Program - Seed Program
Many of these programs are state level vehicles for delivering USDA funding and services. We
have selected a few for specific consideration for illustrative purposes – and in some cases to
identify supplementary support. 640 State of Ohio, Department of Agriculture, Budget For FYs 2016 and 2017, pg Section E, D-32

PART II – OHIO
499
Federal programs for Ohio
- Conservation and Price Support Programs - Farm Storage Facility Loans (FSFL) - Marketing Assistance Loans (MAL) - Conservation Reserve Program (CRP) - Non-insured Crop Disaster Assistance Program (NAP) - Margin Protection Program for Dairy (MPP-Dairy) - Agriculture Risk Coverage (ARC) and Price Loss Coverage Program (PLC) - Direct Farm Operating Loans - Microloans - Youth Loans - Emergency Loans
The programs administered by the Department of Agriculture do not appear to provide support
exclusively to dairy producers. Therefore, the total value of the support attributable to dairy
production is calculated on the basis of dairy’s total share of state agricultural production. We
recognize that this methodology will result in the amount of support allocated to dairy being
overstated in some states and understated in others. However, this methodology has been
adopted because it allows us to determine the amount of support allocated to dairy producers by
the state governments, on an aggregate basis.
Appropriated expenditures by the Ohio Department of Agriculture during this period were
$52,613,000, and the percentage allocation to dairy for Ohio in 2015 was 10.6%. Therefore, the
total amount allocated to dairy production for 2015 is $5,576,978.

PART II – OHIO
500
Farmland Preservation
(a) Program Description
Farmland Preservation educates the public about the importance of saving this resource. It
assists farmers and local officials with their farmland protection efforts. The landowners will
retain ownership in the land subject to a development easement that will prohibit any use for the
land other than agricultural use.641
(b) WTO Consistency
The sale of development rights confers a subsidy on the recipient landowner. The objective of
the program is to ensure that agricultural land remains in agricultural production, thus the
program is intended to have trade and/or production distorting effects. Therefore, the total value
of expenditures under this program must be included in the U.S. AMS.
(c) Expenditures and Allocation
The budgetary information available from the State of Ohio does not allow us to determine the
actual expenditures made under this program.
641 Farmland Preservation, Ohio Department of Agriculture

PART II – OHIO
501
Dairy Program
(a) Program Description
Sanitary inspections and sampling are at the heart of the Dairy Division's functions that lead to a
safe and wholesome supply of dairy products produced and processed in Ohio. The Dairy
Division has regulatory oversight relative to milk producers, milk haulers and dairy processors.
The regulations governing the dairy industry in Ohio meet or exceed those outlined by the FDA
and USDA. In doing so, producers, haulers and processors are able to enter into interstate
commerce with a wide variety of dairy products.642
Ohio’s producers are producing at a rate of 5.4 billion lbs of milk per year, which is a record for
Ohio. This keeps Ohio as the #11 milk producing state but the #1 Swiss cheese producing state.
(b) WTO Consistency
This program is exempt from AMS pursuant to Annex 2.2(e) to the WTO Agreement on
Agriculture.
(c) Expenditures and Allocation
This program is for consumer protection. It is a normal function of government.
642 Dairy Division, Ohio Department of Agriculture

PART II – OKLAHOMA
502
36. OKLAHOMA
Agricultural producers in Oklahoma benefit from subsidies and support provided through the
Department of Agriculture, Food and Forestry, the Boll Weevil Eradication Organization, the
Conservation Commission, the Peanut Commission and the Wheat Commission. The
expenditures for these programs are reported as follows:
2014 Actual
2015 Actual
2016 Budget
Department of Agriculture, Food & Forestry643
$60,859,000 $58,058,000 $44,717,000
Boll Weevil Eradication Organization644
$574,000 $566,386 $616,383
Conservation Commission645 $35,422,000 $37,783,000 $39,050,000
Peanut Commission646 $139,000 $160,464 $---
Wheat Commission647 $2,185,000 $1,936,000 $---
Total $99,179,000 $98,503,850 $84,383,383
643 Department of Agriculture, Food and Forestry, Expenditures by Fund, FY 2017 Executive Budget, pg 22 644 Boll Weevil Eradication Organization, Expenditures by Fund, FY 2017 Executive Budget, pg 23 645 Conservation Commission, Expenditures by Fund, FY 2017 Executive Budget, pg 57 646 Peanut Commission, Expenditures by Fund, FY 2017 Executive Budget, pg 245 647 Wheat Commission, Expenditures by Fund, FY 2017 Executive Budget, pg 245

PART II – OKLAHOMA
503
The State of Oklahoma administers the following programs:
- Ag In the Classroom - Agricultural Hall of Fame - Agritourism - Aquaculture - Concentrated Animal Feeding Operations (CAFO) Program - Domestic Programs - Economic Development - Education Programs - Ethanol Program - Equine - Feed, Fertilizer & Lime Program - Fertilizer Program - Food & Dairy Program - Forest Conservation - Forest Education - Forestry Services - Fuel Alcohol Act (Ethanol) - Grant Market Dev.-Farm Diversification Grant - Grant Market Dev.-Cooperative Marketing Loan - Grant Market Dev.-Marketing and Utilization Loan - Grant Market Dev.-Basic and Applied Research Loan/Grant - Grain Warehouse - Groundwater - International Programs - Made In Oklahoma Program - Meat & Poultry Inspection Program - Pest Control Program - Pesticide Unwanted Disposal Program - Pesticide (Lab) Program - Poultry Feeding Operations (PFO) Program - Quality Assurance Program - Seed (Lab) Program - Sheep and Goats Official ID - Soil Amendment - Swine Feeding Operations Act - Urban & Community Forestry - Water & Inorganics - Warehouse and Commodity Indemnity Act - Wildlife Services Division - Wildland/Urban Interface Safety - Ag In The Classroom Program - Ag Mediation Program - Animal-Livestock-Poultry Program - Agricultural Commodities - Specialty Crop Grant

PART II – OKLAHOMA
504
- Oklahoma Viticulture and Enology Center Development Revolving Fund - Specialty Crop Multi-State Program - Agriculture Enhancement and Diversification Program - International Programs - Water Quality & Pesticides
Many of these programs are state level vehicles for delivering USDA funding and services. We
have selected a specific consideration for illustrative purposes – and in some cases to identify
supplementary support.
Federal programs for Oklahoma
Federal Programs - Agricultural Risk Coverage (ARC) / Price Loss Coverage (PLC) Compliance and Price Support Programs - Commodity Loans - Loan Deficiency Payment - Loan Rates - Price Support Initiatives - Facility Loan Program Conservation and Special Programs - Conservation Reserve Program (CRP) - Conservation Reserve Enhancement Program (CREP) - Emergency Conservation Program - CRP Transition Incentives Program (TIP) Disaster Assistance Programs - Livestock Forage Program (LFP) - Emergency Assistance for Livestock, Honey Bees and Farm-raised Fish (ELAP) - Livestock Indemnity Program (LIP) - Noninsured Assistance Program (NAP) - Tree Assistance Program (TAP) Farm Loan Programs - Beginning Farmers and Ranchers Loans - Direct Farm Loans - Emergency Farm Loans - Guaranteed Farm Loans - Minority and Women Farmers and Ranchers
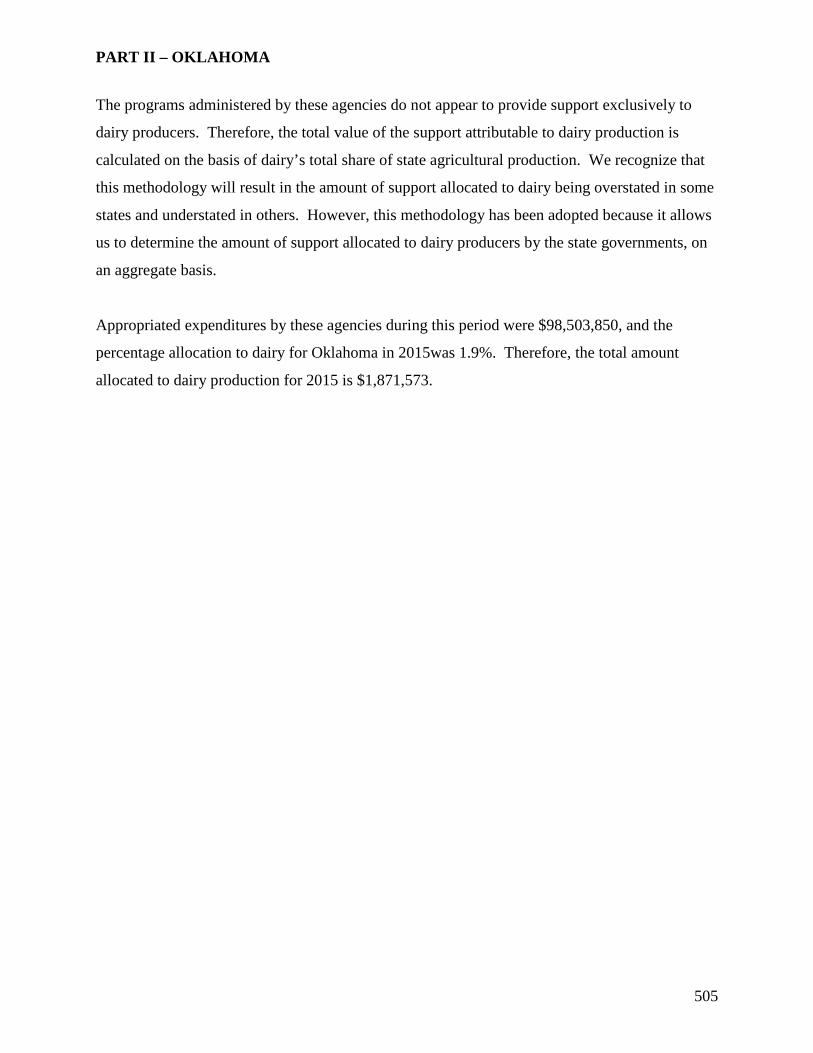
PART II – OKLAHOMA
505
The programs administered by these agencies do not appear to provide support exclusively to
dairy producers. Therefore, the total value of the support attributable to dairy production is
calculated on the basis of dairy’s total share of state agricultural production. We recognize that
this methodology will result in the amount of support allocated to dairy being overstated in some
states and understated in others. However, this methodology has been adopted because it allows
us to determine the amount of support allocated to dairy producers by the state governments, on
an aggregate basis.
Appropriated expenditures by these agencies during this period were $98,503,850, and the
percentage allocation to dairy for Oklahoma in 2015was 1.9%. Therefore, the total amount
allocated to dairy production for 2015 is $1,871,573.

PART II – OKLAHOMA
506
Agriculture Linked Deposit Program
(a) Program Description
This program allows Oklahoma lenders to make loans available to “at risk” farmers and ranchers
and alternative agricultural products at low rates. The State Treasurer makes linked deposits
with the lending institution which, in turn, allows the lending institution to make loans to eligible
recipients at 3% below the U.S. Treasury note rate.
Eligible “at risk” farmers and ranchers must have a debt to asset ratio of at least 55%. The
maximum loan amount is $350,000. The maximum loan for alternative agricultural products
under this program is $1,000,000.648
(b) WTO Consistency
By providing loans to eligible recipients at below market rates, this program confers a subsidy on
recipient producers. As the apparent purpose of this program is to increase agricultural
production, the total value of expenditures under this program should be included in the U.S.
AMS.
(c) Expenditures and Allocation
The budgetary information available from the State of Oklahoma does not allow us to determine
the level of expenditures made under this program.
648 Oklahoma Agricultural Linked Deposit Loans, Oklahoma Cooperative Extension Service, Division of Agricultural Sciences and Natural Resources

PART II – OREGON
507
37. OREGON
Agricultural producers in Oregon benefit from subsidies and support provided by the Department
of Agriculture. The total funding for agriculture programs operated by the Department of
Agriculture is reported in the Biennial Budget as follows:649
2013-15 (Actual) $86,007,396
2015-17 (Approved) $111,214,047
2017-19 (Gov. Balanced) $117,401,089
The State of Oregon administers the following programs:
Food Safety and Animal Health Programs − Animal Health, Feeds, and Livestock Identification − Food Safety Internal Service and Consumer Protection Programs. − Internal Service and Consumer Protection Market Access and Certification Programs − Market Access and Certification Plant Health − Natural Resource Programs − Natural Resources Pesticide, Fertilizer, and PARC Programs − Plant Protection and Conservation Programs − Insect Pest Prevention and Management − Nursery and Christmas Tree − Plant Conservation − Weeds and WeedMapper
Many of these programs are state level vehicles for delivering USDA funding and services.
649 Department of Agriculture, Natural Resources, 2009 – 2011 Governor’s Balanced Budget, pg 142

PART II – OREGON
508
Federal programs for Oregon
- Agriculture Risk Coverage (ARC) and Price Loss Coverage (PLC) Program - Down Payment Loan Program - Conservation Reserve Program (CRP) - Conservation Reserve Enhancement Program (CREP) - Direct Farm Ownership Loan - Direct Operating Loan - Direct MicroLoans - Emergency Conservation Program (ECP) - Emergency Farm Loans - Farm Storage Facility Loan Program - Guaranteed Farm Ownership Loan - Guaranteed Operating Loan - Indian Tribal Land Acquisition Program (ITLAP) - Oregon USDA Certified Agricultural Mediation Program - Margin Protection Program for Dairy Producers (MPP-Dairy) - Noninsured Crop Disaster Assistance Program (NAP) - Nonrecourse Marketing Assistance Loan and Loan Deficiency Payment (LDP)
Program - Youth Loans
The programs administered by the Department of Agriculture do not appear to provide support
exclusively to dairy producers. Therefore, the total value of the support attributable to dairy
production is calculated on the basis of dairy’s total share of state agricultural production. We
recognize that this methodology will result in the amount of support allocated to dairy being
overstated in some states and understated in others. However, this methodology has been
adopted because it allows us to determine the amount of support allocated to dairy producers by
the state governments, on an aggregate basis.
The total funding for the Department of Agriculture for 2015, $55,607,024, is determined by
taking half of the Biennial Budget for 2015-2017. The percentage allocation to dairy for Oregon
in 2015 was 9.5%. Therefore, the total amount allocated to dairy production for 2015is
$5,282,667.

PART II – PENNSYLVANIA
509
38. PENNSYLVANIA
Agricultural producers in Pennsylvania benefit from subsidies and support provided by the
Department of Agriculture. The total funding for agriculture programs operated by the
Department of Agriculture is reported as follows: 650
FY 2014-2015 (Actual) $290,225,000
FY 2015-2016 (Available) $338,859,000
FY 2016-2017 (Budget) $329,303,000
The State of Pennsylvania administers the following programs:
- Pennsylvania Agricultural Conservation Easement Purchase Program - Child and Adult Care Feeding Program (CACFP) - Commodity Supplemental Food Program (CSFP) - Direct Farm Sales Grant Program - Farmers & Senior Farmers Market Nutrition Program - National School Lunch Program (NSLP) - State Food Purchase Program - Summer Food Service Program (SFSP) - The Emergency Food Assistance Program (TEFAP) - Workforce Development Initiative - Career and technical education (CTE) programs. - Pennsylvania Animal Diagnostic Laboratory System (PADLS) - Keeping Pennsylvania Growing - Chronic Wasting Disease Program - Pennsylvania Animal Diagnostic Laboratory System (PADLS) - Pennsylvania Egg Quality Assurance Program (PEQAP) - Dairy and Dairy Product Manufacturing Program - Egg, Fruit and Vegetables Program - Pennsylvania Egg Quality Assurance Program - Nutrient Management and Odor Management Program - Dirt and Gravel Program (pollution prevention) - Resource Enhancement and Protection (REAP Tax Credit) Program - Leadership Development Program
650 Summary by Fund and Appropriation, 2009-10 Governor’s Executive Budget, pg E8-6

PART II – PENNSYLVANIA
510
Many of these programs are state level vehicles for delivering USDA funding and services. We
have selected a few for specific consideration for illustrative purposes – and in some cases to
identify supplementary support.
Federal programs for Pennsylvania
- Agricultural Risk Coverage (ARC) and Price Loss Coverage (PLC) Program - Agriculture Mediation Program - Beginning Farmer Down Payment Loan - Biomass Crop Assistance Program (BCAP) - Conservation Reserve Program (CRP) - Conservation Reserve Enhancement Program (CREP) - Dairy Indemnity Payment Program (DIPP) - Direct Farm Ownership Loan - Direct Operating Loan - Emergency Conservation Program (ECP) - Emergency Farm Loans (EM) - Farm Storage Facility Loan Program - Grassland Reserve Program (GRP) - Guaranteed Farm Ownership Loan - Guaranteed Operating Loan - Livestock Forage Disaster Program (LFP) - Livestock Indemnity Program (LIP) - Margin Protection Program for Dairy (MPP-Dairy) - Microloan Program - Non-insured Crop Disaster Assistance Program (NAP) - Non-recourse Marketing Assistance Loan and Loan Deficiency Payment (LDP) Program - Tree Assistance Program (TAP) - Youth Loans
While Pennsylvania does have programs which are directed specifically at dairy producers, we
do not have details of expenditures on such programs. Therefore, the total value of the support
attributable to dairy production is calculated on the basis of dairy’s total share of state
agricultural production. We recognize that this methodology will result in the amount of support
allocated to dairy being overstated in some states and understated in others. However, this
methodology has been adopted because it allows us to determine the amount of support allocated
to dairy producers by the state governments, on an aggregate basis.

PART II – PENNSYLVANIA
511
The total funding for the Department of Agriculture for 2015 was $338,859,000, and the
percentage allocation to dairy for Pennsylvania in 2015 was 26.7%. Therefore, the total amount
allocated to dairy production for the Department of Agriculture in 2015 is $90,475,353.
Pennsylvania also has a Milk Marketing Board which is separate from the Department of
Agriculture and has its own budget expenditures.
Expenditures in 2015 amount budgeted was $2,894,000 for the board, in which 100% is
allocated to dairy.
This amount has been added to the 26.7% allocation to dairy of the Department of Agriculture, to
give a total state allocation to dairy of $93,369,353.

PART II – PENNSYLVANIA
512
Agricultural Security Areas
(a) Program Description
The Agricultural Security Area program is intended to protect farmland. Farm landowners may
establish areas in which agriculture is the primary activity. Participating farmers are entitled to
special consideration from local and state government agencies.651
(b) WTO Consistency
Special consideration and protection is provided to participating farm landowners or farmers in
exchange for their agreement to continue farming would constitute support. Although the
“special consideration” is not specifically identified, it would likely result in reduced costs for
producers in the form of foregone revenue. In these circumstances, the subsidies provided to
producers would provide a direct benefit to participating producers and is intended to ensure
continued farming on the protected land. Consequently, any support provided under this
program should be included in the U.S. AMS.
(c) Expenditure and Allocation
The budgetary information available from the Government of Pennsylvania is not sufficiently
detailed to allow us to determine actual, estimated or budgeted expenditures on account of this
program.
651 Agricultural Security Areas (ASA), Pennsylvania Department of Agriculture

PART II – PENNSYLVANIA
513
Installment Purchase Program
(a) Program Description
The Installment Purchase Program is a farmland preservation program. Under this program,
farmers can apply to sell easements to the Commonwealth over their land. These easements will
restrict the covered land to agricultural use. Under this program, easements are purchased by the
Commonwealth over a 20-30 year period. The 30 year pay-out period has two advantages for
producers. First, the payments include a tax exempt interest payment. Second, any capital gains
realized on the sale can be deferred for 30 years.652
(b) WTO Consistency
Based on the information available, the Commonwealth provides subsidies to participating
landowners in the form of the payments made under this program. The landowners must
continue to use the land for agricultural purposes and can use the monies received from the
Commonwealth for any purpose, including to offset their operating costs or to make
improvements. As the purpose of the program is to maintain farmland, payments made under the
program are intended to have production and/or trade distorting effects. Consequently, the value
of the support provided through this program must be included in the U.S. AMS.
(c) Expenditure and Allocation
The budgetary information available from the Government of Pennsylvania is not sufficiently
detailed to allow us to determine actual, estimated or budgeted expenditures on account of this
program.
652 American Farmland Trust, Fact Sheet IPA

PART II – PENNSYLVANIA
514
Dairy Animal Care and Quality Assurance Program (DACQA)
(a) Program Description
Today’s competitive market place is making quality assurance an essential consideration for the
dairy industry. This program provides validation that milk, meat, and live animals from
Pennsylvania’s dairies are produced under best management practices for food safety,
biosecurity, and animal health.
DACQA is designed to protect market access for Pennsylvania’s dairies by assuring quality
standards for procedures and management, yet be flexible enough to accommodate the needs and
goals of a diverse dairy industry. In addition to the program requirements, producers may select
from a variety of options including the Milk Quality Module, Biosecurity Module, and Johne’s
Disease Module. Future modules will become available as the program continues to develop.
(b) WTO Consistency
This program would appear to be exempt from AMS pursuant to Annexes 2.2(b) and (e) to the
WTO Agreement on Agriculture.
(c) Expenditures and Allocation
The budgetary information available from the Government of Pennsylvania is not sufficiently
detailed to allow us to determine actual, estimated or budgeted expenditures on account of this
program.

PART II – PENNSYLVANIA
515
Pennsylvania Milk Marketing Board
(a) Program Description
The mission statement of the Milk Marketing Board is:
“To ensure that Pennsylvania’s dairy industry remains vital by providing a regulatory environment that facilitates a safe, adequate supply of wholesome milk while providing security for its dairy farmers and milk dealers; and for the public health and welfare of consumers.”653
Therefore by law, the board is responsible to supervise, investigate and regulate the entire milk
industry of Pennsylvania, including the production, transportation, disposal, manufacture,
processing, storage, distribution, delivery, handling, bailment, brokerage, consignment, purchase
and sale of milk and milk products, and including the establishment of reasonable trade practices,
systems of production control and marketing area.654 This Board is separate from the
Department of Agriculture.
(b) WTO Consistency
Pennsylvania’s administered price system requires that certain products be sold on the export
market at below the set domestic price. By requiring that these products be sold, for export, at a
price below the prevailing domestic price, Pennsylvania is providing an export subsidy for
purposes of the Agreement on Agriculture and the Agreement on Subsidies and Countervailing
Measures.
A subsidy is a financial contribution by government that confers a benefit on the recipient. In
this case, purchasers of certain exported dairy products receive the benefit of purchasing those
products at a price below the prevailing domestic market price. As the Milk Marketing Board
establishes the domestic price and export price of those products, benefit conferred on the
purchaser in the form of lower prices is conferred by government. Thus, the administered 653 Milk Marketing Board, Governor’s Executive Budget, 2016-17, pg E 36-1 654 Milk Marketing Law, Pennsylvania Department of Agriculture

PART II – PENNSYLVANIA
516
pricing confers a subsidy. The subsidy is an export subsidy because it is only provided on the
export sale of the specific products.
The total value of the export subsidy is the difference between the domestic and export price of
the specific product multiplied by the total volume of exported products. This amount, which is
not tied to the budgetary allocation to operate the pricing mechanism, must be notified to the
WTO and counted against the U.S. obligation on total export subsidies.
(c) Expenditures and Allocation
The Pennsylvania Governor’s Budget reports the following as the total allocation for the Milk
Marketing Board:655
2014-15 (Actual) $2,814,000
2015-16 (Available) $2,842,000
2016-17 (Budget) $2,894,000
The Milk Marketing Board is intended to benefit state dairy producers. Accordingly, 100% of
the $2,842,000for FY 2015 in actual expenditures on this program is allocated to dairy for the
years indicated. Since the Milk Marketing Board is separate from the Department of
Agriculture, this allocation to dairy is added to the 26.7% Department of Agriculture allocation
to dairy.
655 Milk Marketing Board, 2009-2010 Governor’s Executive Budget, Commonwealth of Pennsylvania, pg E29.4

PART II – RHODE ISLAND
517
39. RHODE ISLAND
Agricultural producers in Rhode Island benefit from subsidies and support provided by the
agriculture programs of the Department of Environmental Management, Bureau of Natural
Resources. The total funding for these agriculture programs is reported as follows:656
FY 2015 (Gov. Revised) $107,300,000
FY 2016 (Recommended) $93,500,000
The State of Rhode Island administers the following programs:
- Pesticide Safety & IPM Training - Obsolete Pesticides Collection Program - Livestock - Avian Influenza - Rabies - Rescues, Shelters & Carriers - Livestock Testing - Livestock Welfare and Care Standards - Farm Energy Program - Local Agriculture and Seafood Act (LASA) Grants Program - Specialty Crop Block Grant Program - CAPS Program - Nursery Licensing, Inspection, Certification Program - RI Organic Certification Program - Farmland Preservation Program - Food Export Assistance
Many of these programs are state level vehicles for delivering USDA funding and services.
Federal programs for Rhode Island
Farm Loan Programs - Beginning Farmers and Ranchers Loans - Direct Operating Loans
656 Department of Environmental Management, Rhode Island State Budget FY 2016, pg 130

PART II – RHODE ISLAND
518
- Direct Ownership Loans - Emergency Farm Loans - Guaranteed Farm Loans - Socially Disadvantaged Farmers and Rancher Loans - Youth Loans Conservation Programs - Biomass Crop Assistance Program (BCAP) - Conservation Reserve Program (CRP) - Conservation Reserve Enhancement Program (CREP) - Grassland Reserve Program (GRP) Disaster Assistance Programs Production Adjustment & Disaster Assistance Programs - Direct Counter Cyclical Program (DCP) - Emergency Conservation Program (ECP) - Non-insured Crop Assistance Program (NAP) - Supplemental Revenue Assistance Programs (SURE) - Tree Assistance Program (TAP) Price Support - Commodity Loans - Loan Deficiency Payments - Milk Income Loss Contract Program
The agriculture programs administered by the Department of Environmental Management do not
appear to provide support exclusively to dairy producers. Therefore, the total value of the
support attributable to dairy production is calculated on the basis of dairy’s total share of state
agricultural production. We recognize that this methodology will result in the amount of support
allocated to dairy being overstated in some states and understated in others. However, this
methodology has been adopted because it allows us to determine the amount of support allocated
to dairy producers by the state governments, on an aggregate basis.
The total funding for the agriculture programs administered by the Bureau of Natural Resources
for 2015 was $107,300,000, and the percentage allocation to dairy for Rhode Island in 2015 was
3.7%. Therefore, the total amount allocated to dairy production for 2009 is $3,970,100.

PART II – SOUTH CAROLINA
519
40. SOUTH CAROLINA
Agricultural producers in South Carolina benefit from subsidies and support provided by the
Department of Agriculture. The total funding for agriculture programs operated by the
Department of Agriculture is reported as follows: 657
FY 2015-2016 (Actual) $15,904,433
FY 2016-2017 (Appropriation) $16,223,167
The State of South Carolina administers the following programs:
- Agritourism and Tourist Oriented Directional Signage Program (TODS program) - Certified SC Grown program - FARM TO SCHOOL Program - Livestock Liability Law Program - SC New and Beginning Farmer Program - Farm Aid Grant Program - Specialty Crop Block Grant Program - Farmers’ Market Nutrition Program - Sheep and Goats Program
Many South Carolina programs are state level vehicles for delivering USDA funding and
services.
Federal programs for South Carolina
Conservation Programs - Conservation Reserve Program (CRP) - Conservation Reserve Enhancement Program (CREP) - Emergency Conservation Program (ECP) - Emergency Forest Restoration Program (EFRP) - Farmable Wetlands Program (FWP) - Grassland Reserve Program (GRP) - Source Water Protection Program (SWPP) Agricultural Risk Coverage Price Loss Coverage (ARC - PLC) Program
657 Executive Budget State of South Carolina FY 2016-17, pg 314

PART II – SOUTH CAROLINA
520
Disaster Assistance Programs - Livestock Forage Program (LFP) - Livestock Indemnity Program (LIP) - Emergency Assistance for Livestock, Honeybees, and Farm-Raised Fish (ELAP) - Tree Assistance Program (TAP) - Non-insured Disaster Assistance Program (NAP) Non-insured Crop Disaster Assistance Price Support and Marketing Assistance Programs Price Support Initiatives Commodity Loans Loan Deficiency Payments Market Loss Assistance Payment Programs - Reimbursement Transportation Cost Payment Program - Dairy Margin Protection Payment - Dairy Indemnity Payment Program - Facility Loan Programs Tobacco Transition Payment Program (TTPP)
The programs administered by the Department of Agriculture do not appear to provide support
exclusively to dairy producers. Therefore, the total value of the support attributable to dairy
production is calculated on the basis of dairy’s total share of state agricultural production. We
recognize that this methodology will result in the amount of support allocated to dairy being
overstated in some states and understated in others. However, this methodology has been
adopted because it allows us to determine the amount of support allocated to dairy producers by
the state governments, on an aggregate basis.
The total funding for the Department of Agriculture for 2015-2016 was $15,904,433, and the
percentage allocation to dairy for South Carolina in 2015was 2.1%. Therefore, the total amount
allocated to dairy production for 2015 is $333,993.

PART II – SOUTH DAKOTA
521
41. SOUTH DAKOTA
Agricultural producers in South Dakota benefit from subsidies and support provided by the
Department of Agriculture. The total funding for agriculture programs operated by the
Department of Agriculture is reported as follows: 658
FY 2015 (Budgeted) $46,064,709
FY 2106 (Requested) $45,410,950
The State of South Dakota administers the following programs:
- Build Our South Dakota Rural Communities Grants Programs - Community Forestry Challenge Grants Programs - Coordinated Natural Resources Conservation Grants Programs - Mountain Pine Beetle Landowner Cost-Share Program - National Organic Program Certification Cost Share Grant Program - Specialty Crop Block Grant Program (SCBGP) - Weed and Pest Grants Programs - Wildland Fire Training Grants Programs - Dairy Retention and Enhancement Program - South Dakota Farm and Ranch Recognition Program - County Site Analysis Program - Agribusiness Bond Program - Beginning Farmer Bond Program - Livestock Nutrient Management Bond Program - Value Added Agribusiness Relending Program - Value Added Sub Fund Program - Conservation Tillage Loan Program - Beginning Farmer Down Payment Guaranty Program - Livestock Loan Participation Program - Rural Development Agricultural Loan Participation Program - Value Added Livestock Underwriting (VALU) Guaranty Program - Bridge Loan Program - Educational Programs - Forest Legacy Program - Forest Stewardship Program - Conservation Revolving Loan - International Trade Program - Nursery Program
658 State of South Dakota, Budget in Brief Fiscal Year 2016, pg 16

PART II – SOUTH DAKOTA
522
- Pesticide Program - Export Certification Program - Plant Protection Program
Many of these programs are state level vehicles for delivering USDA funding and services. We
have selected a few for specific consideration for illustrative purposes – and in some cases to
identify supplementary support.
Federal programs for South Dakota
- Agriculture Mediation Program - Beginning Farmer Down Payment Loan - Conservation Reserve Program (CRP) - Conservation Reserve Enhancement Program (CREP) - Direct and Counter-cyclical Payment (DCP) Program - Direct Farm Ownership Loan - Direct Operating Loan - Emergency Conservation Program (ECP) - Emergency Farm Loans - Farm Storage Facility Loan Program - Grassland Reserve Program (GRP) - Guaranteed Farm Ownership Loan - Guaranteed Operating Loan - Indian Tribal Land Acquisition Program - Milk Income Loss Contract Extension (MILCX) Program - Non-insured Crop Disaster Assistance Program (NAP) - Non-recourse Marketing Assistance Loan and Loan Deficiency Payment (LDP) Program - Sugar Loan Program and Sugar Marketing Allotments - Sugar Storage Facility Loan Program - Youth Loans
The programs administered by the Department of Agriculture do not appear to provide support
exclusively to dairy producers. Therefore, the total value of the support attributable to dairy
production is calculated on the basis of dairy’s total share of state agricultural production. We
recognize that this methodology will result in the amount of support allocated to dairy being
overstated in some states and understated in others. However, this methodology has been
adopted because it allows us to determine the amount of support allocated to dairy producers by
the state governments, on an aggregate basis.

PART II – SOUTH DAKOTA
523
The total funding for the Department of Agriculture for 2015 was $46,064,709, and the
percentage allocation to dairy for South Dakota in 2015 was 4.7%. Therefore, the total amount
allocated to dairy production for 2015 is $2,165,041.

PART II – SOUTH DAKOTA
524
Livestock Loan Participation Program
(a) Program Description
This program allows farmers and ranchers to obtain livestock loans through a local lender. The
Department of Agriculture participates in up to 50% of the loan to a maximum of $200,000. The
maximum term of the loan is 5 years.659
(b) WTO Consistency
Based on the information available, it appears that the program provides support to farmers and
ranchers that permit them to obtain loans for livestock purchase. In these circumstances, the
Department’s participation in the loans likely provides a subsidy to the recipient farmers and
ranchers. As the subsidy offsets the costs of specific farmers and ranchers, and allows them to
obtain stock and increase production, the value of these subsidies should be included in the U.S.
AMS.
(c) Expenditure and Allocation
The budgetary information available from the Government of South Dakota is not sufficiently
detailed to allow us to determine actual, estimated or budgeted expenditures on account of this
program.
659 Livestock Loan Participation, AgDevelopment, South Dakota Department of Agriculture

PART II – SOUTH DAKOTA
525
Value-Added Livestock Underwriting Program (VALU) Guaranty
(a) Program Description
This program allows farmers and ranchers to obtain livestock “purchase money” with up to a
50% guarantee on a livestock purchase loan through a local center. Guarantees are provided on
loans up to a maximum of $100,000. The maximum term of the loan is 26 months.660
(b) WTO Consistency
Based on the information available, it appears that the program provides support to farmers and
ranchers by permitting them to obtain “purchase money”. In these circumstances, the
Department’s participation likely provides a subsidy to the recipient farmers and ranchers. As
the subsidy offsets the costs of specific farmers and ranchers, and allows them to obtain stock
and increase production, the value of these subsidies should be included in the U.S. AMS.
(c) Expenditure and Allocation
The budgetary information available from the Government of South Dakota is not sufficiently
detailed to allow us to determine actual, estimated or budgeted expenditures on account of this
program.
660 Value-Added Livestock Underwriting Guaranty, AgDevelopment, South Dakota Department of Agriculture

PART II – SOUTH DAKOTA
526
Rural Development Loan Participation Program
(a) Program Description
This program allows eligible farmers, ranchers or agricultural businesses to obtain lower cost
loans. The Department can provide up to 80% of a loan provided by a local lender. Eligible
projects must be value-added production, processing, marketing or exporting of South Dakota
agricultural commodities. The maximum participation amount is $500,000 with a maximum
term of 10 years. 661
(b) WTO Consistency
Based on the information available, this program provides support in the form of lower cost
loans that support agricultural production or marketing. Thus, the subsidy provided offsets the
costs of specific producers and is intended to have trade and/or production distorting effects.
Consequently, the support provided under this program should be included in the U.S. AMS.
(c) Expenditure and Allocation
The budgetary information available from the Government of South Dakota is not sufficiently
detailed to allow us to determine actual, estimated or budgeted expenditures on account of this
program.
661 Rural Development Agricultural Loan Participation, AgDevelopment, South Dakota Department of Agriculture

PART II – SOUTH DAKOTA
527
Biomass Ethanol Program
(a) Program Description
South Dakota imposes a $0.28 per gallon tax on gasoline and a $0.20 per gallon tax on
gasohol.662 “Gasohol” is an ethanol-blend fuel that contains ethyl alcohol of at least 99% purity
typically derived from agricultural products.663
(b) WTO Consistency
The reduced tax rate imposed on gasohol confers a subsidy in the amount of the difference
between the gasohol tax rate and the gasoline tax rate. This subsidy only applies to gasohol
made using ethanol produced from cereal grains. Therefore, this subsidy supports and is directly
tied to the production of cereal grains. In these circumstances, the value of this subsidy should
be included in the U.S. AMS.
(c) Expenditure and Allocation to Dairy
The total value of expenditures under this program is not available, therefore, we cannot estimate
any benefit on account of this program.
662 South Dakota, Legislative, Fuel taxation, 10-47B-4 663 Ibid., 10-47B-3(10)

PART II – TENNESSEE
528
42. TENNESSEE
Agricultural producers in Tennessee benefit from subsidies and support provided by the
Department of Agriculture. The total funding for agriculture programs operated by the
Department of Agriculture is reported as follows: 664
FY 2014-15 (Actual) $88,761,700
FY 2015-16 (Estimated) $96,465,200
FY 2016-17(Recommended) $97,143,600
The State of Tennessee administers the following programs:
- Agricultural Enhancement Program (TAEP) - Genetics: Cattle - Bred Beef Heifers - Goats/Sheep - Livestock Equipment - Livestock Working Facility Cover - Hay Storage - Livestock Feed Storage - Grain Storage - Producer Diversification - Poultry Growers- - Export Assistance Program - Feral Swine Program - Grain Indemnity Fund Program - Specialty Crop Black Grants Program - Fuel Quality Program - Agritourism Program - Agricultural Resources Conservation Fund - Nonpoint Source Program - The Equine Interstate Movement Permit Program - Urban Riparian Buffer Program - Forest Legacy Program - Food Distribution Program for Schools - Farmers Market Promotion Retail Grant Program - Water Quality Program - Certified Crop Adviser Program - Statewide Agricultural Producer Association Grant Program - Tennessee Beef Promotion Program - UT Dairy Extension Program
664 State of Tennessee, The Budget, Fiscal Year 2016-17, pg B-309
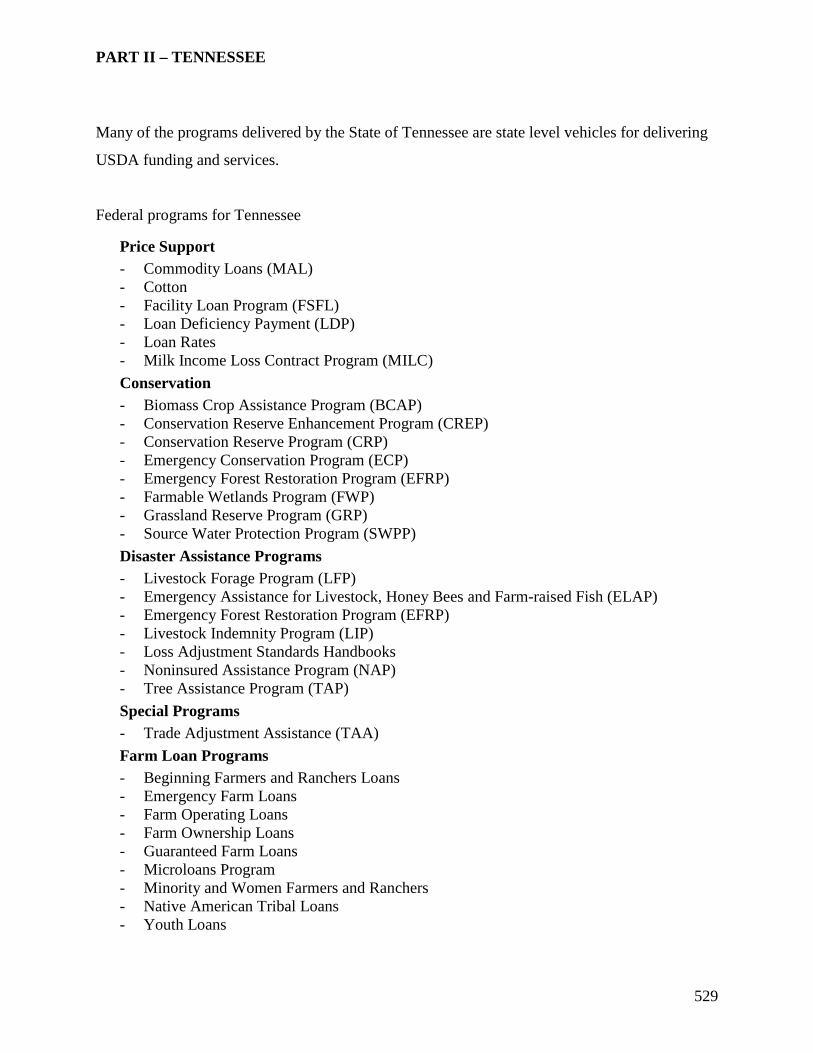
PART II – TENNESSEE
529
Many of the programs delivered by the State of Tennessee are state level vehicles for delivering
USDA funding and services.
Federal programs for Tennessee
Price Support - Commodity Loans (MAL) - Cotton - Facility Loan Program (FSFL) - Loan Deficiency Payment (LDP) - Loan Rates - Milk Income Loss Contract Program (MILC) Conservation - Biomass Crop Assistance Program (BCAP) - Conservation Reserve Enhancement Program (CREP) - Conservation Reserve Program (CRP) - Emergency Conservation Program (ECP) - Emergency Forest Restoration Program (EFRP) - Farmable Wetlands Program (FWP) - Grassland Reserve Program (GRP) - Source Water Protection Program (SWPP) Disaster Assistance Programs - Livestock Forage Program (LFP) - Emergency Assistance for Livestock, Honey Bees and Farm-raised Fish (ELAP) - Emergency Forest Restoration Program (EFRP) - Livestock Indemnity Program (LIP) - Loss Adjustment Standards Handbooks - Noninsured Assistance Program (NAP) - Tree Assistance Program (TAP) Special Programs - Trade Adjustment Assistance (TAA) Farm Loan Programs - Beginning Farmers and Ranchers Loans - Emergency Farm Loans - Farm Operating Loans - Farm Ownership Loans - Guaranteed Farm Loans - Microloans Program - Minority and Women Farmers and Ranchers - Native American Tribal Loans - Youth Loans
PART II – TENNESSEE
530
The programs administered by the Department of Agriculture do not appear to provide support
exclusively to dairy producers. Therefore, the total value of the support attributable to dairy
production is calculated on the basis of dairy’s total share of state agricultural production. We
recognize that this methodology will result in the amount of support allocated to dairy being
overstated in some states and understated in others. However, this methodology has been
adopted because it allows us to determine the amount of support allocated to dairy producers by
the state governments, on an aggregate basis.
Total funding for the Department of Agriculture for 2015 was $96,465,200, and the percentage
allocation to dairy for Tennessee in 2015 was 3.8%. Therefore, the total amount allocated to
dairy production for 2015 is $3,665,678.

PART II – TEXAS
531
43. TEXAS
Agricultural producers in Texas benefit from subsidies and support provided by the Texas
Department of Agriculture and the Texas AgriLife Research. The total funding for agriculture
programs supported through these programs is reported as follows:
Funding for programs administered by the Department of Agriculture is reported as follows:665
FY 2015 (Estimated) $560,715,554
FY 2016 (Recommended) $558,811,361
FY 2017 (Required) $550,607,573
Funding for programs administered by the Texas AgriLife Research is reported as follows:666
FY 2015 (Estimated) $68,649,191
FY 2016 (Budget) $73,268,702
FY 2017 (Required) $73,268,702
The State of Texas administers the following programs:
- Structural Pest Control Service - Consumer Protection Program - Aquaculture Program - Cotton Stalk Destruction Program - Egg Quality Program - Fuel Quality Program - Grain Warehouse Program - Handling and Marketing of Perishable Commodities Program - Organics Program - Pesticides Program - Plant Quality Program - Seed Quality Program
665 General Appropriations Act for the 2016-2017, pg VI-1 666 Ibid., pg III-224

PART II – TEXAS
532
Production Agriculture - Agricultural Inspection Grant Program - Agricultural Loan Guarantee Program - Coordinated Hog Out Grant Program (CHOMP) - Feral Hog Abatement Grant Program - Organic Cost-Share Reimbursement Program - Specialty Crop Block Grant Program - Specialty Crop Multi-State - Young Farmer Interest Rate Reduction Program - Young Farmer Grant - STAR Fund Health & Nutrition Grants - 3E's Grant Programs - Texans Feeding Texans - Surplus Agricultural Products Grant Program - Texans Feeding Texans - Home-Delivered Meal Grant Program - Urban Schools Agricultural Grant Program Rural Health Grants - Rural Health Facility Capital Improvement Program (CIP) - Small Rural Hospital Improvement Program (SHIP) - Rural Communities Health Care Investment Program (RCHIP) Economic Development Opportunities - Biofuel Infrastructure Partnership (BIP) Grant - Community Development Block Grants - Interest Rate Reduction Program - State Trade Expansion Program
Many of these programs are state level vehicles for delivering USDA funding and services. We
have selected a specific consideration for illustrative purposes – and in some cases to identify
supplementary support.
Federal programs for Texas
- Agricultural Mediation Program - Marketing Assistance Loan (MAL) and Loan Deficiency Payment (LDP) programs - Cooperative Marketing Association Provisions - Farm Storage Facility Loan (FSFL) Programs - Milk Income Loss Contract (MILC) Program - Dairy Indemnity Program (DIP) - Sugar Programs for Commodity Credit Corporation (CCC) - Representative of CCC for cotton and UGRSA Warehouse issues - Agriculture Risk Coverage (ARC) - Price Loss Coverage (PLC) - Non-insured Crop Disaster Assistance Program (NAP)

PART II – TEXAS
533
- Emergency Assistance for Livestock, Honeybees, and Farm-Raised Fish Program (ELAP)
- Livestock Forage Disaster Program (LFP) - Livestock Indemnity Program (LIP) - Conservation Reserve Program (CRP) - Grassland Reserve Program (GRP) - Biomass Crop Assistance Program (BCAP) - Emergency Conservation Program (ECP) - Emergency Forest Restoration Program (EFRP)
The programs administered by the Department of Agriculture and the Texas Agricultural
Experiment Station do not appear to provide support exclusively to dairy producers. Therefore,
the total value of the support attributable to dairy production is calculated on the basis of dairy’s
total share of state agricultural production. We recognize that this methodology will result in the
amount of support allocated to dairy being overstated in some states and understated in others.
However, this methodology has been adopted because it allows us to determine the amount of
support allocated to dairy producers by the state governments, on an aggregate basis.
The total funding level for the Department of Agriculture and the Texas AgriLife Research for
2015 was $629,364,745. The percentage allocation to dairy for Texas in 2015 was 7.7%.
Therefore, the total amount allocated to dairy production for 2015 is $48,461,085.

PART II – TEXAS
534
Linked Deposit Program
(a) Program Description
Through this program, the Department of Agriculture can facilitate commercial lending at below
market rates to qualified applicants for eligible projects, including: production of an alternative
crop; and processing and marketing of agricultural crops or livestock. This is an interest buy-
down program that sets the deposit interest rate but such rate may not drop below the floor rate
of 1.5%.667
(b) WTO Consistency
By reducing interest rates charged to eligible producers on loans from private lenders, the
program confers a subsidy. As the subsidy is intended to support production and reduces costs
of specific eligible producers, any support provided through this program should be included in
the U.S. AMS.
(c) Expenditure and Allocation
The budgetary information available from the Government of Texas is not sufficiently detailed to
allow us to determine actual, estimated or budgeted expenditures on account of this program.
667 Linked Deposit Program, Agricultural Finance Programs, Texas Agricultural Finance Authority, Texas Department of Agriculture

PART II – UTAH
535
44. UTAH
Agricultural producers in Utah benefit from subsidies and support provided by the Department of
Agriculture and Food. The total funding for agriculture programs operated by the Department of
Agriculture and Food are reported as follows: 668
FY 2015 (Actual) $29,875,782
FY 2016 (Authorized) $45,536,900
FY 2017 (Recommended) $45,613,000
The State of Utah administers the following programs:
- Agriculture Resource Development Loans (ARDL) - Rural Rehabilitation Loans - Petroleum Storage Tank Loans - State Revolving Fund Water Quality Loans - Utah Agricultural Medication Program (UAMP) - Animal Health Program - Disaster Services for Animals Program - Aquaculture (Fish Health) - Utah Grazing Improvement Program (UGIP) - US Livestock Genetic Exports (USLGE) - Dairy Inspection - Meat & Poultry Inspection - Poultry & Eggs Program - Utah Community Spay & Neuter Program - Wildlife Services - Agriculture Certificate of Environmental Stewardship (ACES) - Ag Land Preservation - Conservation Easements - Ground Water Program
Many of these programs are state level vehicles for delivering USDA funding and services. We
have selected a few for specific consideration for illustrative purposes – and in some cases to
identify supplementary support.
668 State of Utah, Budget Recommendations, FY 2017, Fiscal Year 2016 Supplements, pg 15

PART II – UTAH
536
Federal programs for Texas
- Conservation Reserve Program - Price Support Initiatives - Commodity Loans - Loan Deficiency Payments - Reimbursement Transportation Cost Payment Program - Dairy Margin Protection Payment - Dairy Indemnity Payment Program - Facility Loan Programs - Non-insured Disaster Assistance Program (NAP) Agriculture Risk Coverage (ARC) and
Price Loss Coverage (PLC) - Agriculture Loss Coverage-County (ARC-CO) - Price Loss Coverage (PLC)
The programs administered by the Department of Agriculture and Food do not provide support
exclusively to dairy producers which we are able to measure. Therefore, the total value of the
support attributable to dairy production is calculated on the basis of dairy’s total share of state
agricultural production. We recognize that this methodology will result in the amount of support
allocated to dairy being overstated in some states and understated in others. However, this
methodology has been adopted because it allows us to determine the amount of support allocated
to dairy producers by the state governments, on an aggregate basis.
The total funding level for the Department of Agriculture and Food for 2015 was $29,875,782,
and the percentage allocation to dairy for Utah in 2015 was 18.9%. Therefore, the total amount
allocated to dairy production for 2015 is $5,646,523.

PART II – UTAH
537
Rural Rehabilitation Loan Program
(a) Program Description
Through this program, the Department of Agriculture and Food provides low interest loans to
farmers and ranchers who could not receive conventional financing. Loans provided under this
program may be used by beginning farmers and ranchers to upgrade their operations. Loans may
also be provided to farmers in distress. The purpose of this program is to save agricultural
operations that would be viable with more favourable financing. 669
Total assets for this fund are $8.5 million with $7.7 million out of individual loans. The
maximum term is 10 years. Interest rates vary from 5% to 6%, with no fees. Borrowers must
not be eligible to receive conventional financing.670
(b) WTO Consistency
Loans provided under this program constitute subsidies on the basis that they are “low interest”
and are made to farmers and ranchers who would not otherwise qualify for loans from a
commercial lender. The loans are provided to allow the eligible farmer and rancher to upgrade
their operations. Consequently, support provided through this program should be included in the
U.S. AMS on the basis that it is intended to have trade and/or production distorting effects.
(c) Expenditure and Allocation
The budgetary information available from the Government of Utah is not sufficiently detailed to
allow us to determine actual, estimated or budgeted expenditures on account of this program.
669 Utah Department of Agriculture and Food, Conservation and Resource Management, Agriculture Loans, Rural Rehabilitation Loan 670 National Council of State Agricultural Finance Programs, Utah Department of Agriculture and Food, Rural Rehabilitation Loan Program

PART II – UTAH
538
Land Use Program
(a) Program Description
The Division of Water Resources is charged with the responsibility of developing a State Water
Plan. This plan was to coordinate and direct the activities of state and federal agencies concerned
with Utah’s water resources. As a part of this objective, the Division of Water Resources
continually assesses the water-related land use of the state. This data includes determining
cropland water use evaluating irrigated land losses and conversion to urban uses, planning for
new water development, establishing irrigation for any area, and developing water budgets.671
(b) WTO Consistency
This program would appear to be exempt from AMS pursuant to Annexes 2.2(a) and 2.2(d) to
the WTO Agreement on Agriculture, but activities related to establishing irrigation and
developing water budgets would appear to be production enhancing and distorting.
(c) Expenditures and Allocation
The budgetary information available from the Government of Utah is not sufficiently detailed to
allow us to determine actual, estimated or budgeted expenditures on account of this program.
671 Utah Natural Resources, Division of Water Resources, Land Use Program Description and Methods

PART II – VERMONT
539
45. VERMONT
Agricultural producers in Vermont benefit from subsidies and support provided by the Agency of
Agriculture, Food and Markets. The total funding for programs operated by the Agency of
Agriculture, Food and Markets are reported as follows:672
FY 2015 (Actual) $17,697,975
FY 2016 (Budget) $18,457,726
FY 2017 (Gov. Recommended) $22,344,571
The State of Vermont administers the following programs:
- Agricultural Clean Water Initiative Grant Program (Ag-CWIP) - Farm to School Grant Program - Specialty Crop Block Grant Program - Specialty Crop Multi-State Program - Working Lands Enterprise Fund - Local Food Market Development Grants - GAP Audit Reimbursement Funds - Large Farm Operations (LFOs) Program - Medium Farm Operations (MFOs) Program - Apiary Inspection Program - Meat and Poultry Inspection Program - Milk and Dairy Section - Appraisal Program - Vermont’s Feed & Pet Food Program - Vermont’s Seed Program - Vermont’s Fertilizer and Lime Program - Vermont Environmental Stewardship Program (VESP) - Vermont Farm Safety Program - Hemp Registration Program - Farm Viability Enhancement Program - Domestic Export Program
672 Agriculture, Food and Markets, State of Vermont, Fiscal Year 2017Budget Recommendations, pg 371

PART II – VERMONT
540
Many of these programs are state level vehicles for delivering USDA funding and services. We
have selected a few for specific consideration for illustrative purposes – and in some cases to
identify supplementary support.
Federal programs for Texas
- Renewable Energy Systems Program - Energy Efficiency Improvement Program - Commodity Operations - Conservation Reserve Program - Conservation Reserve Enhancement Program - Emergency Conservation Program - Emergency Forest Restoration Program - Farmable Wetlands Program - Grassland Reserve Program - Source Water Protection Program - Livestock Forage Program (LFP) - Livestock Indemnity Program (LIP) - Emergency Assistance for Livestock, Honeybees, and Farm-Raised Fish (ELAP) - Tree Assistance Program (TAP) - Loans for losses to crops, trees, livestock, farm land and farm property - Emergency Conservation Program (ECP) - Non-insured Disaster Assistance Program (NAP)
Dairy farming is by far the most important component of Vermont agriculture. Senator Leahy is
arguably the principal promoter of the U.S. dairy industry, its protection and financial support.
While Vermont’s program suite does not earmark the dairy sector, it is clearly the principal
beneficiary. The total value of the support attributable to dairy production is calculated on the
basis of dairy’s total share of state agricultural production. We recognize that this methodology
will result in the amount of support allocated to dairy being overstated in some states and
understated in others. However, this methodology has been adopted because it allows us to
determine the amount of support allocated to dairy producers by the state governments, on an
aggregate basis.
The total funding level for the Agency of Agriculture, Food and Markets for 2015 was
$17,697,975, and the percentage allocation to dairy for Vermont in 2015 was 60.0%. Therefore,
the total amount allocated to dairy production for 2015 is $10,618,785.

PART II – VERMONT
541
Vermont Agricultural Credit Corporation
(a) Program Description
The Vermont Agricultural Credit Corporation assists producers whose credit needs are not fully
met by conventional agricultural credit sources at reasonable rates and terms. The Corporation
can provide a maximum aggregate loan size is $1.5-$2.0 million based on use of funds per
borrower. The loans provided can be both for farm ownership and farm operation. Most loans
require a guarantee from the USDA Farm Services Agency, but this guarantee is not required for
smaller loans. The Corporation can also make loans for purposes that are not eligible for USDA
Farm Services Agency guarantees.673
(b) WTO Consistency
The loans provided by the Vermont Agricultural Credit Corporation provide a benefit to
producers. Based on the information available, it is evident that the loans are intended to be used
to finance continued or new farm production (i.e., the loans fund both farm operations and farm
ownership). Consequently, the support provided through these loans will result in trade and/or
production distorting effects and, on that basis, should be included in the U.S. AMS.
(c) Expenditure and Allocation
The budgetary information available from the Government of Vermont is not sufficiently
detailed to allow us to determine actual, estimated or budgeted expenditures on account of this
program.
673 Vermont Agricultural Credit Corporation Brochure, Vermont Economic Development Authority

PART II – VERMONT
542
EZ Guarantee Program
(a) Program Description
This program, administered by the Vermont Economic Development Authority, can guarantee a
maximum of 9 months of deferred principal and interest payments (to a maximum of $100,000)
granted to farmers on their outstanding debt with other financial institutions. The objective of
this program is to provide immediate cash flow relief to Vermont farmers.674
(b) WTO Consistency
This program provides a subsidy that directly benefits participating Vermont farmers and allows
them to reduce their costs. Consequently, support provided through this guarantee program
should be included in the U.S. AMS.
(c) Expenditure and Allocation
The budgetary information available from the Government of Vermont is not sufficiently
detailed to allow us to determine actual, estimated or budgeted expenditures on account of this
program.
674 Vermont Legislature, Agricultural Loan Payment Guarantee Program¸ No. 7 – Sec 1 (H476)

PART II – VIRGINIA
543
46. VIRGINIA
Agricultural producers in Virginia benefit from subsidies and support provided by the
Department of Agriculture and Consumer Services. The total funding for programs operated by
the Department of Agriculture and Consumer Services are reported as follows:675
FY 2015 $63,537,451
FY 2016 $63,622,095
FY 2017 $63,822,327
In addition, funding for the Virginia Agriculture Council is set at $490,334 for FY 2008, FY
2009 and FY 2010.676 The Council promotes agricultural interests in Virginia.
The State of Virginia administers the following programs:
- State Programs - Animal Identification - Laboratory Services - Livestock Marketing Program - Meat & Poultry Program - Poultry & Eggs Program - Veterinary Services - Agricultural Stewardship Program - Virginia Farmland Preservation Program - Pesticides Program - Century Farm Program - Education Program - Food Safety Program - Dairy Services Program - Food Distribution program - STATE MILK COMMISSION - Agricultural Commodity Inspection - Grading and inspection program - VDACS’ livestock marketing program - Nursery Inspection Program
675 Department of Agriculture and Consumer Services, 2014-2016 Biennial Operating Budget, pg B6 676 Virginia Agriculture Council, 2016-2018 Biennial Operating Budget, pg B214

PART II – VIRGINIA
544
- Plant Pest Survey & Detection Program
Many of the programs delivered by the State of Virginia are state level vehicles for delivering
USDA funding and services.
Federal programs for Virginia
- Price Support Initiatives - Nonrecourse Marketing Assistance Loans - Loan Deficiency - Recourse Marketing Assistance Loan - Reimbursement Transportation Cost Payment Program - Dairy Margin Protection Payment - Dairy Indemnity Payment Program - Farm Storage Facility Loan Program - Sugar Storage Facility Loan Program
The programs administered by the Department of Agriculture and Consumer Services and the
Virginia Agriculture Council do not appear to provide support exclusively to dairy producers.
Therefore, the total value of the support attributable to dairy production is calculated on the basis
of dairy’s total share of state agricultural production. We recognize that this methodology will
result in the amount of support allocated to dairy being overstated in some states and understated
in others. However, this methodology has been adopted because it allows us to determine the
amount of support allocated to dairy producers by the state governments, on an aggregate basis.
The total funding level for the Department of Agriculture and Consumer Services and the
Virginia Agriculture Council for 2015 was $64,027,785, and the percentage allocation to dairy
for Virginia in 2015was 9.1%. Therefore, the total amount allocated to dairy production for
2015 is $5,826,528.

PART II – WASHINGTON
545
47. WASHINGTON
Agricultural producers in Washington benefit from subsidies and support provided by the
Department of Agriculture. Total funding for expenditures by the Department of Agriculture in
are reported in the Biennial Budget as $.677
2011-13 (Actual) $147,325,059
2013-15 (Estimated) $159,257,091
2015-17 (Proposed) $165,609,000
The State of Washington administers the following programs:
- Animal Health Program - Animal Disease Traceability - Avian Health Program - Dairy Program - Dairy Nutrient Management Program - Livestock Inspection Program - Food Safety Program - Organic Program - Produce Safety Program - Fruit & Vegetable Program - Seed Inspection Program - Warehouse Audit Program - Sustainable Agriculture Research and Education Program - International Marketing Program - Organic Food Program
Many of these programs are state level vehicles for delivering USDA funding and services. We
have selected a specific consideration for illustrative purposes – and in some cases to identify
supplementary support.
Federal programs for Washington
- Agriculture Risk Coverage and Price Loss Coverage Programs (ARC/PLC) - Beginning Farmers and Ranchers Loans
677 Washington State Department of Agriculture, Governor’s Proposed Budget 2015-2017, pg 4

PART II – WASHINGTON
546
- Biomass Crop Assistance Program (BCAP) - Conservation Reserve Program (CRP) - Conservation Reserve Enhancement Program (CREP) - Dairy Margin Protection Program (Dairy-MPP) - Debt for Nature Program - Emergency Assistance for Livestock, Honeybees, and Farm-Raised Fish (ELAP) - Emergency Conservation Program (ECP) - Emergency Farm Loans - Emergency Forest Restoration Program (EFRP) - Farm Loans (Direct) - Farm Operating Loans (Direct) - Farm Ownership Loans (Direct) - Farm Operating and Ownership Loans (Guaranteed) - Farm Storage Facility Loan Program - Indian Tribal Land Acquisition Program - Land Contract (LC) Guarantee Program - Livestock Forage Disaster Program (LFP) - Livestock Indemnity Program (LIP) - Non-insured Crop Disaster Assistance Program (NAP) - Marketing Assistance Loan and Loan Deficiency Payment (LDP) Program - State Acres for Wildlife Enhancement (SAFE) - Transition Incentives Program (TIP) - Tree Assistance Program (TAP) - Youth Loans
The programs administered by the Department of Agriculture do not provide support exclusively
to dairy producers which can be measured based on available information. Therefore, the total
value of the support attributable to dairy production is calculated on the basis of dairy’s total
share of state agricultural production. We recognize that this methodology will result in the
amount of support allocated to dairy being overstated in some states and understated in others.
However, this methodology has been adopted because it allows us to determine the amount of
support allocated to dairy producers by the state governments, on an aggregate basis.
The expenditures of the Department of Agriculture for 2015, 82,804,500, are determined by
taking half of the number set out in the Biennium Budget. The percentage allocation to dairy for
Washington in 2015 was 11.3%. Therefore, the total amount allocated to dairy production for
2015 is $9,356,909.

PART II – WASHINGTON
547
Department of Agriculture Dairy Program678
(a) Program Description
The Washington State Department of Agriculture (WSDA) Dairy Program involves:
- Licensing and Inspection of Dairy Farms and Plants
- Inspection of Milk Tankers
- IMS Survey Program
- Sampling and Testing of Dairy Products
- Investigation of Dairy related Complaints
- Testing of Pasteurizers
- Licensing and Evaluation of Dairy Technicians
- Issuing export certificates of sanitation and free sale for food products manufactured in
Washington state.
- Technical Assistance on dairy related issues
- Equipment review
(b) WTO Consistency
Many of these activities would appear to be exempt from AMS pursuant to Annex 2.2 to the
WTO Agreement on Agriculture. Many of these programs involve state level delivery of USDA
programs.
(c) Expenditures and Allocation
The budgetary information available from the Government of Washington State is not
sufficiently detailed to allow us to determine actual, estimated or budgeted expenditures on
account of this program.
678 WSDA Dairy Program, Washington State Department of Agriculture

PART II – WEST VIRGINIA
548
48. WEST VIRGINIA
Agricultural producers in West Virginia benefit from subsidies and support provided by the
Department of Agriculture. The expenditures by the Department of Agriculture are reported as
follows:679
FY 2015 (Actual) $348,750,000
FY 2016 (Budgeted) $338,000,000
FY 2017 (Requested) $338,000,000
The State of West Virginia administers the following programs:
- West Virginia Rural Rehabilitation Loan Fund (WVRRLF) - Farm To School Program - Food Distribution Program - Promotional Programs - WV Grown Program - Senior Farmers' Market Nutrition Program - Farmers' Market Nutrition Program - Water Quality Program - Specialty Crop Block Grant Program - Environmental Programs - Nutrient Management Certification Program - MarketReady Producer Training Program - Pest Management Program
Many of these programs are state level vehicles for delivering USDA funding and services.
Federal programs for West Virginia
- Down Payment Loan Program - Conservation Reserve Program (CRP) - Conservation Reserve Enhancement Program (CREP) - Direct Farm Ownership Loan - Direct Operating Loan - Microloans - Emergency Conservation Program (ECP)
679 Department of Agriculture Expenditures, 2017 Executive Budget, State of West Virginia, pg 75
PART II – WEST VIRGINIA
549
- Emergency Farm Loans - Farm Storage Facility Loan Program (FSFL) - Guaranteed Farm Ownership Loan - Guaranteed Operating Loan - Milk Income Loss Contract (MILC) Program - Non-insured Crop Disaster Assistance Program (NAP) - Non-recourse Marketing Assistance Loan and Loan Deficiency Payment (LDP) Program - Youth Loans
The programs administered by the Department of Agriculture do not provide support exclusively
to dairy producers which is measureable and in some cases does not constitute a subsidy subject
to AMS. Therefore, the total value of the support attributable to dairy production is calculated
on the basis of dairy’s total share of state agricultural production. We recognize that this
methodology will result in the amount of support allocated to dairy being overstated in some
states and understated in others. However, this methodology has been adopted because it allows
us to determine the amount of support allocated to dairy producers by the state governments, on
an aggregate basis.
The expenditures of the Department of Agriculture for 2015were $348,750,000, and the
percentage allocation to dairy for West Virginia in 2015 was 3.3%. Therefore, the total amount
allocated to dairy production for 2015 is $11,508,750.

PART II – WISCONSIN
550
49. WISCONSIN
Agricultural producers in Wisconsin benefit from subsidies and support provided by the
Department of Agriculture, Trade and Consumer Protection. The expenditures by the
Department of Agriculture are reported as follows:680
FY 2015 (Adjusted Base) $97,074,100
FY 2016 (Recommended) $94,030,900
FY 2017 (Recommended) $143,618,000
The State of Wisconsin administers the following programs:
- Aquaculture (Fish Farm) Program - Dog Breeders & Sellers Program - Farm-raised Deer Program - Poultry Flock Programs - Humane Officer Program - Master Meat Crafter Program - Agricultural Economic Development Program - Organics, Livestock Grazing and Specialty Crops Program - Minority Farmers Outreach Program - Rural Electric Power Services Program - Mediation and Arbitration Program - Dairy Development Program - Apiary program - Fruit and Vegetable Inspection Program - Grain Inspection Program - Fertilizer, Soil and Plant Additive, and Lime Licensing Program - Grow Wisconsin Dairy Grant Program
Many of these programs are state level vehicles for delivering USDA funding and services. We
have selected a few for specific consideration for illustrative purposes – and in some cases to
identify supplementary support.
680 Wisconsin Department of Agriculture, Trade and Consumer Protection, 2015-2017 Executive Budget, pg 1

PART II – WISCONSIN
551
Federal programs for Wisconsin
- Conservation Reserve Enhancement Program (CREP) - Conservation Reserve Program - Emergency Conservation Program - Source Water Protection Program - Livestock Forage Program (LFP) - Livestock Indemnity Program (LIP) - Emergency Assistance for Livestock, Honeybees, and Farm-Raised Fish (ELAP) - Tree Assistance Program (TAP)
Wisconsin is a major dairy producing state where dairy represents 46.0% of farm gate receipts.
Therefore, the total value of the support attributable to dairy production is calculated on the basis
of dairy’s total share of state agricultural production. We recognize that this methodology will
result in the amount of support allocated to dairy being overstated in some states and understated
in others. However, this methodology has been adopted because it allows us to determine the
amount of support allocated to dairy producers by the state governments, on an aggregate basis.
The expenditures of the Department of Agriculture for 2015were $97,074,100, and the
percentage allocation to dairy for Wisconsin in 2015 was 46.0%. Therefore, the total amount
allocated to dairy production by the Department of Agriculture for 2015 is $44,654,086.
In addition to the Department of Agriculture subsidies, Wisconsin permits tax credits up to
$22,000,000 for the 2017 budget, in designated agricultural development zones. The tax credits
are open to all agribusinesses, but are specifically intended to assist the dairy industry which is
very important to Wisconsin Agriculture. Therefore, for purposes of this report we have
assumed that at least 25% of the tax credits, or $5,500,000, would be used to benefit dairy
producers.
Therefore, including the value of the tax credit program, total expenditures on agricultural
programs in 2015 was $102,574,100. As noted above, dairy represented 46.0% of farm gate
receipts in Wisconsin in 2015. The total allocation to dairy for 2015, including the 25% share of
the tax credit program, is $47,184,086

PART II – WISCONSIN
552
Credit Relief Outreach Program (CROP) Guarantee
(a) Program Description
This program provides 80% guarantees on loans up to $100,000, 90% on loans less than
$100,000. Loans may be used to pay for services or consumable goods needed to produce
agricultural commodities. The commodity must be planted and harvested for consumption
within the term of the loan. Loans may be used for livestock if the livestock is purchased, fed
and sold within the term of the loan.
The maximum interest rate is prime plus 1% set on the date of the Note. The maturity date is
March 31st of the following year.
Eligible applicants are Wisconsin residents actively engaged in the farm operation. The eligible
farmer’s debt to asset ratio must be 40% or more.681
(b) WTO Consistency
Based on the information available, the loan guarantees provided through this program would
confer a subsidy on the recipient producers. The maximum interest rate available is expressed as
prime plus 1%, which leaves open the possibility of loans at or below price. Eligible producers
must be actively engaged in farming and have a debt to asset ratio of 40% or more, which raises
the question of whether these applicants could obtain financing from commercial lenders at
better terms.
The subsidy provided under this program must be included in the U.S. AMS. The guaranteed
loan must be used for production within the term of the loan. Thus, as the program is intended to
support production, it would have trade and/or production distorting effects.
681 Credit Relief Outreach Program, National Council of State Agricultural Finance Program

PART II – WISCONSIN
553
(c) Expenditure and Allocation
The budgetary information available from the Government of Wisconsin is not sufficiently
detailed to allow us to determine actual, estimated or budgeted expenditures on account of this
program.

PART II – WISCONSIN
554
Agribusiness Guarantee
(a) Program Description
This program provides a maximum guarantee which is the lesser of 50% or $750,000 used by
businesses located in a Wisconsin municipality with 50,000 or more people to create a product
new to the business or to expand production of an existing product. The new product or
expanded production must use a raw agricultural commodity. Applicants must demonstrate that
it made a “notable effort” to purchase a substantial portion of its raw agricultural commodities
from Wisconsin suppliers.682
(b) WTO Consistency
Based on the information available, it appears that the loan guarantee provided under this
program would confer a benefit on recipients. As the loan guarantee is provided based on the
use of raw agricultural commodities produced in Wisconsin, it would also indirectly subsidize
agricultural production. As the intention of the program is to increase agricultural production,
the subsidies must be included in the U.S. AMS.
(c) Expenditure and Allocation
The budgetary information available from the Government of Wisconsin is not sufficiently
detailed to allow us to determine actual, estimated or budgeted expenditures on account of this
program.
682 Agribusiness Guarantee, National Council of State Agricultural Finance Programs

PART II – WISCONSIN
555
Agricultural Development Zone Program
(a) Program Description
This program, operated by the Department of Commerce, is intended to attract, promote, retain
and encourage expansion of agricultural businesses in four regions designated as Agricultural
Development Zones. Business, including agribusiness, is promoted through $22,000,000 in tax
credits allocated to the zone. 683 Unused tax credits can be carried forward for 15 years. The tax
credits can be claimed over the life of the zone. Although the program is available to all
agribusiness, it is intended to “assist Wisconsin in regaining its prominence in the dairy industry
and in dairy processing production.” 684
(b) WTO Consistency
The tax credits provided through this program constitute a subsidy for purposes of the WTO
Agreement on Subsidies and Countervailing Measures and the WTO Agreement on Agriculture.
As the purpose of the program is to provide an incentive for greater production, support provided
under this program should be included in the U.S. AMS.
(c) Expenditures and Allocation
The information available is for the fiscal year 2017 expenditures under this program. Total tax
credits provided in 2017 would be $22,000,000. Although the program is open to all
agribusinesses operated within the Agricultural Development Zones, the intention of the program
is to assist the Wisconsin dairy industry. Therefore, it would be reasonable to assume that this
program provides substantial assistance to dairy producers and processors. For purposes of this
study, we have assumed that at least 25% of the tax credits would be used by dairy producers and
processors. In light of the importance of the dairy industry in Wisconsin, we believe that this is a
reasonable assumption that likely understates the importance of this program to dairy. Thus, of
683 Tax credit for Certified Businesses in Calendar Year 2017. WEDC, Transparency, Programs, Business Development Tax Credit 684 Agricultural Development Zone Program, Wisconsin Department of Commerce, Business Development

PART II – WISCONSIN
556
the $22,000,000available under this program in 2017 (the program began on January 1, 2009),
$5,500,000 would benefit the dairy industry.

PART II – WYOMING
557
50. WYOMING
Agricultural producers in Wyoming benefit from subsidies and support provided by the
Department of Agriculture. The expenditures by the Department of Agriculture are reported as
follows:
2015-16 Biennial Budget $40,274,286685
2017-18 Biennial Budget $37,754,386686
The State of Wyoming administers the following programs:
- Pesticide Safety Education Program - Pesticide Program - Pesticide Disposal Program - Apiary (Honeybees) Program - Seed Program - Feed Program - Fertilizer Program - Nursery Stock Program - Quarantine Program - Wellness Program - Living Legacy Program - Rangeland Health Assessment Program - Gray Wolf Depredation Compensation Program - Organic Certification Reimbursement Grant - Specialty Crop Block Grant Program - Dairy Program - Food Establishment Program - Farmers’ Market Food Safety Training Program - Child Care Program - State Meat Program - Agriculture Producer Research Grant Program - Agricultural & Natural Resource Mediation Program - Fuel Quality Program
Many of these programs are state level vehicles for delivering USDA funding and services.
685 State of Wyoming, 2015 Budget Fiscal Data Book, December 2014, pg 72 686 State of Wyoming, 2017 Budget Fiscal Data Book, December 2016, pg 102

PART II – WYOMING
558
Federal programs for Wyoming:
- Agriculture Mediation Program - Agriculture Risk Coverage (ARC) & Price Loss Coverage (PLC) - Agriculture Loss Coverage-County (ARC-CO) - Price Loss Coverage (PLC) - Beginning Farmer Down Payment Loan - Conservation Reserve Program (CRP) - Direct Farm Ownership Loan - Emergency Assistance for Livestock, Honey Bees, & Farm raised Fish (ELAP) Program - Emergency Conservation Program (ECP) - Emergency Farm Loans - Farm Storage Facility Loan Program - Grassland Reserve Program (GRP) - Guaranteed Operating Loan - Indian Tribal Land Acquisition Program - Livestock Forage Disaster Program (LFP) - Livestock Indemnity Program (LIP) - Microloans Program - Minority and Women Farmers and Ranchers - Non-insured Crop Disaster Assistance Program (NAP) - Non-recourse Marketing Assistance Loan and Loan Deficiency Payment (LDP) Program - Sugar Storage Facility Loan Program - Tree Assistance Program (TAP) - Youth Loans
The programs administered by the Department of Agriculture do not appear to provide support
exclusively to dairy producers. Therefore, the total value of the support attributable to dairy
production is calculated on the basis of dairy’s total share of state agricultural production. We
recognize that this methodology will result in the amount of support allocated to dairy being
overstated in some states and understated in others. However, this methodology has been
adopted because it will allow us to determine the amount of support allocated to dairy producers
by the state governments, on an aggregate basis.
The expenditures of the Department of Agriculture for 2015 were $20,137,143 (half of Biennial),
and the percentage allocation to dairy for Wyoming in 2015 was 1.4%. Therefore, the support
allocated to dairy production for 2015 in Wyoming is $281,920.

PART II – IRRIGATION SUBSIDIES
559
51. IRRIGATION SUBSIDIES
(a) Program Description
The States and local governments provide very substantial support to agriculture in the form of
low-cost water provided through irrigation systems. This support is distinct from the irrigation
infrastructure and services provided by the U.S. Federal Government addressed in Part I. The
Federal Government support to irrigation comes in the form of infrastructure development.
Since the Reclamation Act of 1902 was introduced, the U.S. Federal Government has invested
approximately $21.8 billion in the infrastructure required for the approximately 133 irrigation
projects from 1902 through 1994. We have not been able to update this information but
investments are ongoing.
The State Governments, through state and local authorities, provide the subsidized water
distributed through these irrigation systems to users, including agricultural producers. Water is
provided to these producers at prices that are generally below the prevailing price to other users
(i.e., the price to agricultural producers is below the price charged to industrial or residential
users).
“While irrigation may be used to produce the most profitable crops for the area, the last units of water applied will rarely return more than $30 per acre-foot, and in most cases, much less. Industrial, commercial, domestic, and environmental restoration applications can, in most cases, pay much more.”687
Irrigation is vitally important to U.S. agriculture.
“Most agricultural water withdrawals occur in the arid Western States where irrigated production is concentrated. In 2000, about 85 percent of total agricultural withdrawals occurred in a 19-State area encompassing the Plains, Mountain, and Pacific regions. In the Mountain region, over 90 percent of the water withdrawal is used by agriculture, almost all (96 percent) for irrigation.”688
687 Gollehon, Noel R., Water Markets: Implications for the Rural Areas of the West, Rural Development Perspectives, Vol 14, No. 2, at pg 57 688 Agricultural Resources and Environmental Indicators, 2006 Edition, Chapter 2.1, pg 25 (http://www.ers.usda.gov/publications/AREI/EI1316/Chapter2/2.1/)

PART II – IRRIGATION SUBSIDIES
560
Irrigation has allowed the United States to develop very profitable agricultural production on arid
and semi-arid land. The USDA ERS has recognized the important role that irrigation plays in
U.S. agriculture,
“Irrigated cropland is important to the U.S. farm economy, accounting for about 49 percent of total crop sales from just 16 percent of the Nation’s harvested cropland in 1997 (USDA 2001).”689
These irrigation programs make agricultural production possible in areas where it would not
otherwise be economically viable. For example, despite being located in areas not suited to grow
either cotton or rice, the subsidized water made available to California producers allows them to
grow significant quantities of both crops.690 And there are substantial benefits to livestock:
“Government-subsidized water use for one purpose alone – irrigating pastures for grazing sheep – exceeds the water used for all other purposes in California, residential and industrial. In one recent year $530 million in taxpayer dollars were spent on pumping this water to sheep ranchers when the gross revenues of the sheep ranching industry in that year were less than one-fifth of that amount, $100 million.”691
As a further example, water for irrigation in the Columbia River Basin in the U.S. Pacific
Northwest has been used to support a very profitable potato industry. Without access to this
water, it is unlikely that any of this production could have occurred. In 1995, William Bean of
the Columbia Basin Institute determined that irrigators paid approximately 4% of the market
value of water, which translated into an annual subsidy of approximately $50 million.692
We were asked about our methodology. Essentially we agree with Berthelot693 that there are
several methods694 – we tend to accept (while doubting) amounts reported by the U.S.
689 Aillery, Marcel and Golleho, Noel, Agricultural Resources and Environmental Indicators, Chapter 2.2, pg 2 690 DiLorenzo, Thomas, California’s Enemy: The State, Ludwig von Mises Institute, January 19, 2001 691 Ibid. 692 Manifest Subsidy: How Congress pays industry – with federal tax dollars – to deplete and destroy the nation’s natural resources, Edward A. Chadd, Common Cause National Magazine, Fall 1995, pg 3 of 8 693 It is interesting that Berthelot in one of his own critiques of U.S. subsidies suggested that our July 2003 “argumentation could have been more robust so that we will not consider their figures seriously” (“The huge lies in the US notification of its agricultural trade-distorting domestic supports from 2002 to 2005”, Jacques Berthelot, Solidarité, January 3, 2008) – We did however describe the basis of our estimates. We are not lawyers – our

PART II – IRRIGATION SUBSIDIES
561
Government to the WTO or the OECD and dancing on the head of a pin about whether the
proper interest rates have been used to calculate present values of investments long since sunk.
Our methodology has been more focused on the provision of goods and services to irrigators and
to farmers and ranchers below market prices. We are also looking into electrical and fuel
subsidies but as we have noted these are revenues forgone and we have not yet been able to track
these benefits with reliable specificity. 695
Jacques Berthelot696 points us to additional evidence from Bruce Sundquist:
• Farmers in California’s Central Valley is roughly one fifth of the state’s water and pay on average slightly over 1 cent /m³, just 2% of what Los Angeles pays for its drinking water and only 10% of its replacement value697
• One analysis of new U.S. project in central Utah found that the water it will provide will cost close to 40 times more than irrigators will pay for it. Or they will pay about 2.5 % of cost – a 97.5% subsidy based on cost to Government – and based on a benefit to farmer and ranchers basis significantly more.
• On average, the U.S. government subsidizes irrigation at $54/acre/year.698
There can be no other conclusion; the provision of low-cost water for irrigation confers
significant support and benefits on U.S. agricultural producers.
Government experience is trade negotiations and Canadian GATT liaison, Government finance and program development in the Department of Finance and trade negotiation as well as WTO and NAFTA dispute settlement 694 Berthelot explains that “However this conclusion is provisional for two reasons: 1) we have not yet shown the undernotifications made of the PS AMSs, to which we turn now; 2) because the US should have notified almost all the NPS subsidies as PS subsidies.” Ibid. 695 Berthelot in his excellent overview notes “Let us forget here the methods 3 and 4 and the additional method 5 which would give the highest subsidies.” We relied primarily on methods 3 and 4 – our concern is benefits to farmers – much more than cost to Government. Ibid. 696 Ibid. 697 Berthelot’s calculation based on the cost benchmark was $ 7-14 billion. Ours is based on a benefit to farmers and ranchers at something less than commercial rates (“relative to the costs charged to non agricultural users”) was $10-$ 33 billion and we struck a middle ground of $21.5 billion. Had we used full consumer rates our estimate would have been $37-$75 billion. 698 Sundquist, Bruce “Economics, Politics and History of Irrigation” in “The Earth’s Carrying Capacity” (http://home.allnet.net/bsundquist1/ir7.hmtl#A)

PART II – IRRIGATION SUBSIDIES
562
(b) WTO Consistency
The provision of low-cost water to producers by state and local governments constitutes a
subsidy for purposes of the WTO Agreement on Subsidies and Countervailing Measures and the
WTO Agreement on Agriculture and must be included in the U.S. AMS.
The subsidy exists in the form of water for irrigation provided to producers at prices below the
prevailing market price.699 The value of the subsidy is the difference between price charged to
agricultural producers and the price charged to other users (i.e., industrial and residential users).
These prices are established by the state and local water boards that administer the irrigation
systems.
The fact that water is provided to producers through these irrigation systems does not affect the
nature of the subsidy. The water at issue is not in its natural state, but exists in irrigation systems
for distribution. Thus, the water is no longer in its natural state but has been transformed into a
good or service for distribution.
This interpretation of water as a good or service has been recognized by the Government of
Canada and by the NAFTA Parties. The Government of Canada has noted that,
“Water in its natural state can be equated with other natural resources, such as trees in the forest, fish in the sea, or minerals in the ground. While all of these things can be transformed into saleable commodities through harvesting or extraction, until that crucial step is taken they remain natural resources and outside the scope of the trade agreements.”700
699 The basis was established in Canada – Aircraft, WTO WT/DS70, WT/DS71 700 Bulk Water Removal and International Trade Considerations, Department of Foreign Affairs and International Trade, November 16, 1999, pg 2

PART II – IRRIGATION SUBSIDIES
563
The NAFTA Parties also issued a declaration on water in which they stated that,
“Unless water, in any form, has entered into commerce and become a good or product, it is not covered by the provisions of any trade agreement, including the NAFTA. And nothing in the NAFTA would oblige any NAFTA Party to either exploit its water for commercial use, or to begin exporting water in any form. Water in its natural state in lakes, rivers, reservoirs, aquifers, waterbasins and the like is not a good or product, is not traded, and therefore is not and never has been subject to the terms of any trade agreement.”701
Thus, unless water has been drawn, extracted or harvested, it remains in its natural state and is
not subject to any trade agreement. Conversely, water that has been drawn, extracted or
harvested has been transformed into a good or service and is subject to trade disciplines. On this
basis, the water flowing in U.S. irrigation systems is a good or service subject to the trade
agreements. Thus, the provision of this water at prices below the prevailing market price confers
a subsidy on recipients.
The subsidy provided through below-market priced water must be included in the U.S. AMS.
The water provided through these irrigation systems not only reduces costs to individual
producers, but permits agriculture to exist in areas wholly unsuited to agriculture and to
participate more than proportionately in the market. Three times as much when irrigated land
represents 17% of harvested cropland and accounts for 50% of the farm-gate receipts for crops.
Arguably without the water for irrigation, there would be no or much more marginal production.
Thus, the subsidy provided to producers in the form of water at below-market prices has trade
and/or production distorting effects, as well as cost reduction effects, and must be included in the
U.S. AMS.
701 Statement by the Governments of Canada, Mexico and the United States

PART II – IRRIGATION SUBSIDIES
564
(c) Expenditures
It is difficult to determine the actual value of the irrigation subsidy provided by U.S. state and
local governments to agriculture producers. There are approximately 133 irrigation projects
across 11 Western States, these states being Arizona, California, Colorado, Idaho, Montana,
Nevada, New Mexico, Oregon, Utah, Washington, and Wyoming. Based on the USDA Census
of Agriculture, the 11 Western States had irrigated the following acreage of land:702
State
Irrigated
Land (Acres)
% Share of 11
State Total
Arizona 851,861 3.5% California 7,549,161 32.0% Colorado 2,309,543 11.5% Idaho 3,511,839 13.5% Montana 1,872,389 8.1% Nevada 689,953 2.8% New Mexico 689,953 3.3% Oregon 1,554,173 7.4% Utah 1,125,106 4.7% Washington 1,623,389 7.0% Wyoming 1,418,284 6.2% Total 23,200,330 100.0%
US EPA Groundwater FAQ
Irrigation is not limited to these states – they are the principal but not the only beneficiaries. We
note that there are other states which grow significant volumes of sugar beets which are very
dependent on irrigation.
The water flowing in these irrigation projects is distributed through many more water boards,
each of which establish their own prices.
702 NASS 2012 Census of Agriculture Report, Table 2 Irrigated Farms by Acres Irrigated: 2013 and 2008

PART II – IRRIGATION SUBSIDIES
565
In 2003, GCS prepared a report for the Dairy Farmers of Canada that reviewed
U.S. irrigation subsidies.703 In that report, GCS estimated the total value of
subsidies to U.S. agricultural producers through below-market priced water at
between $10,000,000,000 and $33,000,000,000. Taking the median point in the
range defined by these estimates, the total value of irrigation subsidies in 2003
was $21,500,000,000.
In 2013 the U.S. Geological Survey (USGS) and the California Department of Water Resources
(DWR) estimates water use for agricultural irrigation in California at 25.8 million acre-feet704, on
the same report, Renee Johnson and Betsy A. Cody shows on the USDA’s 2013 Farm and Ranch
Irrigation Survey reports that, nationally, California has the largest number of irrigated farmed
acres compared to other states and accounts for about one fourth of total applied acre-feet of
irrigated water in the United States.705
703 WTO Consistency of U.S. and New Zealand Agricultural Practices, Grey, Clark, Shih and Associates, Limited, July 15, 2003, pp 42 - 60 704 CRS, California Agricultural Production and Irrigated Water Use, By Renee Johnson and Betsy A. Cody, June 30, 2015.pg 1 705 CRS, California Agricultural Production and Irrigated Water Use, By Renee Johnson and Betsy A. Cody, June 30, 2015.pg 14
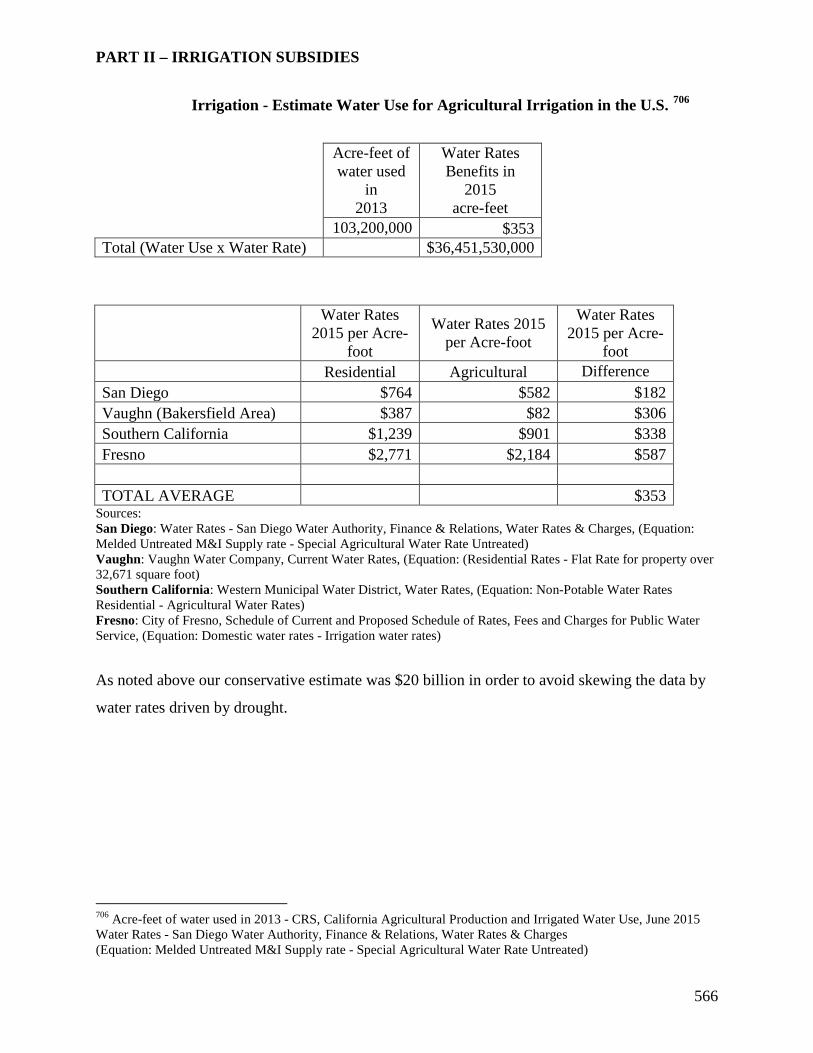
PART II – IRRIGATION SUBSIDIES
566
Irrigation - Estimate Water Use for Agricultural Irrigation in the U.S. 706
Acre-feet of water used
in 2013
Water Rates Benefits in
2015 acre-feet
103,200,000 $353 Total (Water Use x Water Rate) $36,451,530,000
Water Rates 2015 per Acre-
foot
Water Rates 2015 per Acre-foot
Water Rates 2015 per Acre-
foot Residential Agricultural Difference San Diego $764 $582 $182 Vaughn (Bakersfield Area) $387 $82 $306 Southern California $1,239 $901 $338 Fresno $2,771 $2,184 $587 TOTAL AVERAGE $353
Sources: San Diego: Water Rates - San Diego Water Authority, Finance & Relations, Water Rates & Charges, (Equation: Melded Untreated M&I Supply rate - Special Agricultural Water Rate Untreated) Vaughn: Vaughn Water Company, Current Water Rates, (Equation: (Residential Rates - Flat Rate for property over 32,671 square foot) Southern California: Western Municipal Water District, Water Rates, (Equation: Non-Potable Water Rates Residential - Agricultural Water Rates) Fresno: City of Fresno, Schedule of Current and Proposed Schedule of Rates, Fees and Charges for Public Water Service, (Equation: Domestic water rates - Irrigation water rates)
As noted above our conservative estimate was $20 billion in order to avoid skewing the data by
water rates driven by drought.
706 Acre-feet of water used in 2013 - CRS, California Agricultural Production and Irrigated Water Use, June 2015 Water Rates - San Diego Water Authority, Finance & Relations, Water Rates & Charges (Equation: Melded Untreated M&I Supply rate - Special Agricultural Water Rate Untreated)

PART II – IRRIGATION SUBSIDIES
567
(c) Allocation to Dairy
Support provided through the irrigation programs is not provided exclusively to support U.S.
dairy producers. While analyses on a state by state base could yield a higher share to dairy, we
have allocated base on the 10.54% share of dairy in national farm cash receipts.
Based on those numbers GCS estimates that about $20,000,000,000 in benefits have been
provide to producers in 2015. The number have been rounded from the multiplication of the total
acre-feet of water used in 2013 by the difference between Residential and Agricultural Rates –
per acre-feet – in 2015 on San Diego. If taken in consideration other counties the number would
have been much higher, $ 36,451,530,000, as seen on table above. But for this report just the San
Diego rate has been used in order to avoid skewing the results due to droughty in this period
examined.
Therefore, dairy producers should be allocated the respective state share of dairy production of
the total estimated value of irrigation subsidies provided by U.S. state and local governments.
Thus, the total estimated amount of these irrigation subsidies allocated to dairy producers would
be $2,108,000,000.