grid analysis for hydrologic modeling - gis-t symposium elevation urban zone. grid model grid based...
TRANSCRIPT

Grid Analysis for Hydrologic Grid Analysis for Hydrologic ModelingModeling
Presented byPresented bySean DaviesSean Davies
Intergraph CorporationIntergraph CorporationMapping and GeoSpatial SolutionsMapping and GeoSpatial Solutions
GISGIS--T 2004T 2004

Grid Analysis Capabilities
Hot Spot AnalysisLeast-Cost Corridor AnalysisDownhill Flow Path DeterminationViewshed AnalysisSpatial Statistical Analysis (water quality, etc.)
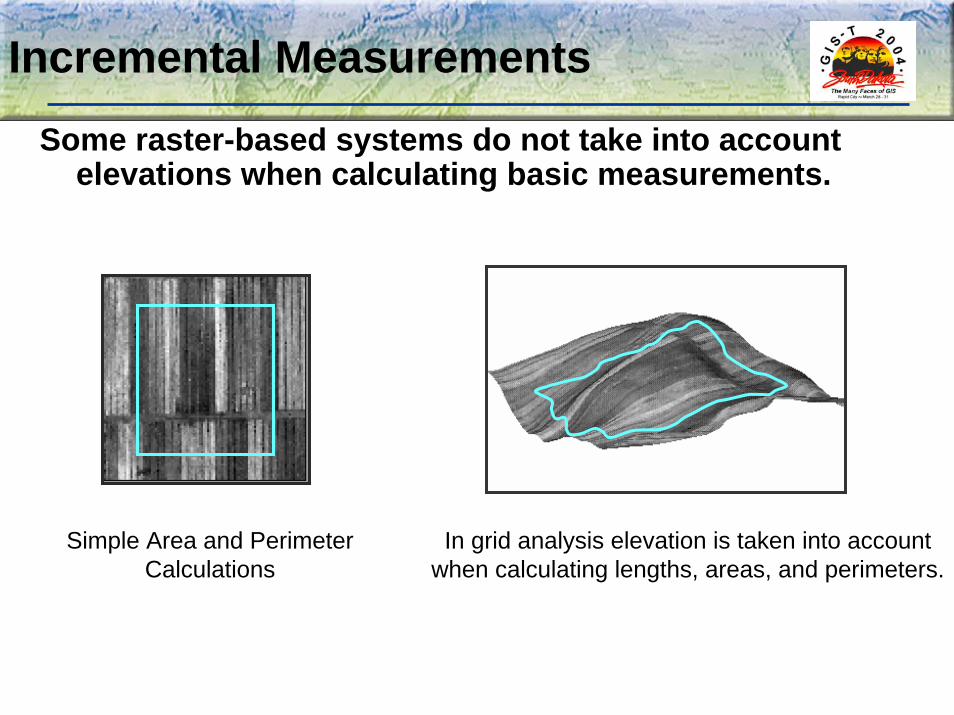
Incremental MeasurementsSome raster-based systems do not take into account
elevations when calculating basic measurements.
Simple Area and Perimeter Calculations
In grid analysis elevation is taken into account when calculating lengths, areas, and perimeters.

Advanced BuffersRaster / Grid systems can create buffers with varying conditions.
Base Roads
Simple Buffer
Take Elevation into account (DEM)
Spread Uphill from Roads
Spread Downhill from Roads
Take Zone Values (friction) into account
Spread through zone friction
Shortest Route over Surface
Equal Distance Measurement

Data Visualization
Patterns in Data Are Hard to See.
Visual Results of Density Analysis.
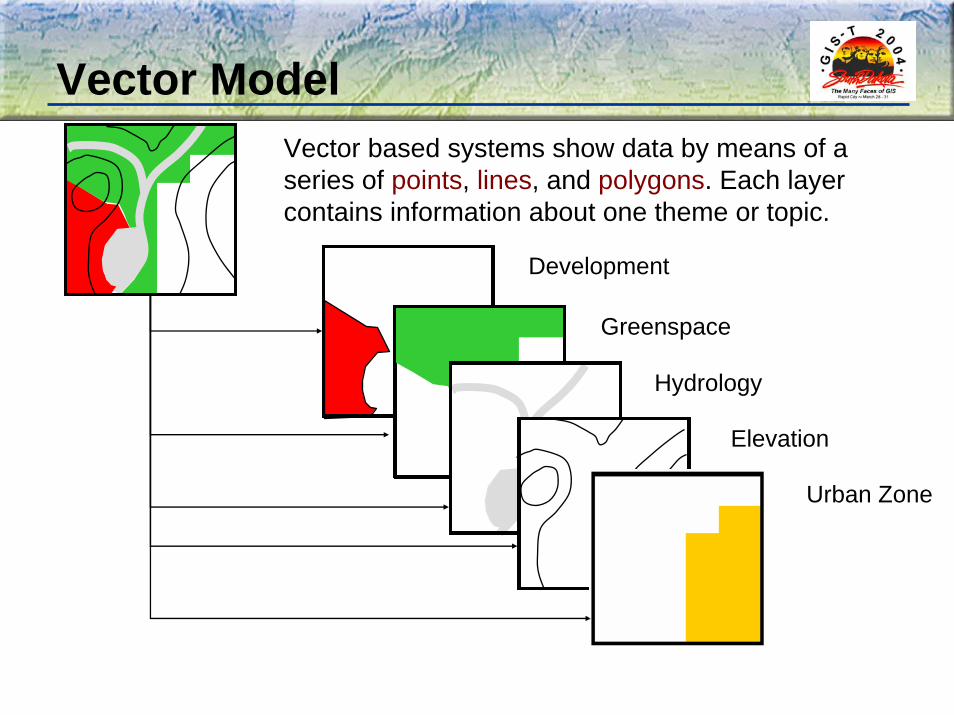
Vector ModelVector based systems show data by means of a series of points, lines, and polygons. Each layer contains information about one theme or topic.
Development
Greenspace
Hydrology
Elevation
Urban Zone

GRID ModelGrid based systems show data by means of a series of gridded cells. Each layer contains information about one theme or topic.
Development
Greenspace
Hydrology
Urban Zone
Elevation
21.59
21.59
21.59
21.59
21.59
21.59
21.59
21.59
21.59
21.59
21.59
21.59
21.59
21.59
21.59
21.59

Vector and Grid
Vector GridEmploys points, lines, and polygons to represent data.
Employs cells or images to represent data.
Reliance on databases for data storage and retrieval.
The maps themselves contain the data. (can be tied to a database)
Compares layers of information based on database queries.
Compares layers of information based on cell-by-cell comparisons.
Strong query tools. Strong analytical tools.

Grid Layers
In a grid layer, geographic space is divided into a grid of square cells in which each cell represents a square parcel of land.
Each cell has a location, value, resolution, and appearance.
These can be combined into zones of similar cells.
A grid layer legend in the edit window provides information about the layer.
Using this concept, multiple layers can be used to describe or analyze different features of the same geographic space.
Cell Value
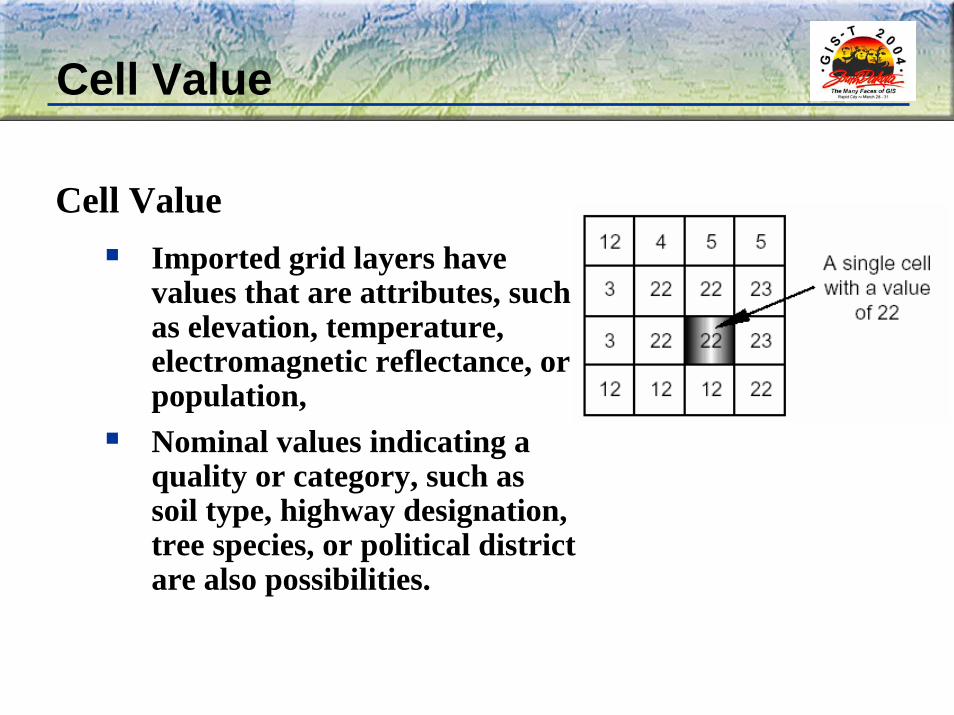
Cell ValueImported grid layers have values that are attributes, such as elevation, temperature, electromagnetic reflectance, or population, Nominal values indicating a quality or category, such as soil type, highway designation, tree species, or political district are also possibilities.
Cell Resolution
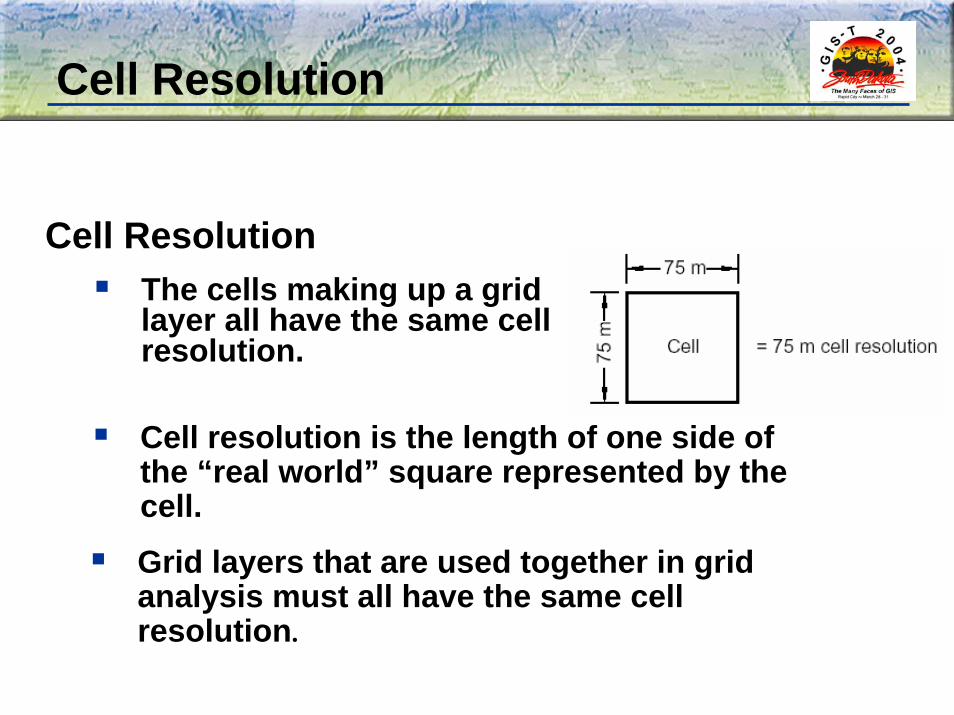
Cell ResolutionThe cells making up a grid layer all have the same cell resolution.
Cell resolution is the length of one side of the “real world” square represented by the cell.
Grid layers that are used together in grid analysis must all have the same cell resolution.

Zones
ZonesAll of the cells in a grid layer that have the same value are collectively called a zone.
A zone can be a single, contiguous region, several disjointed regions, or a scattering of individual cells.
Each zone is represented by a single entry in the legend.

Grid Analysis “is a game of only several pieces and a few basic rules but unlimited possibilities. It is also a game that generally requires no previous experience in computer programming, advanced mathematics, or even formal cartography. What the game does require, however, is an eye for both spatial and logical structure.”
- Dana Tomlin

What is GeoSpatial HMS?
Brings GIS processing capabilities to create data for input into HEC-HMS.Gives the full spatial data compilation, preparation, and processing functionality of GeoMedia and GeoMedia Grid to the hydrologic engineer.Employs easy to use menu options, tool bars, and a Wizard interface so that users new to GeoMedia and GeoMedia Grid can access the power of these applications without having to learn more than the most basic functions.
What does GeoSpatial HMS do?
Allows the hydrologic engineer to visualize spatial and hydrologic information.Identifies drainage paths and watershed boundaries in Digital
Elevation Model (DEM) data and then uses that information to derive the required data structure for hydrologic analysis and response to precipitation inputs in HEC-HMS.Creates grid-based data for the ModClark linear quasi-distributed
runoff transformation, the HEC-HMS basin model, physical watershed and stream characteristics, and an HMS background map file.Uses GeoMedia and GeoMedia Grid to develop hydrologic
modeling parameters and generate input files for HEC-HMS.

GeoSpatial HMS Basin Processing
Allows easy, flexible, and interactive subbasin delineation, processing, and manipulation.Provides immediate confirmation of basin merging and subdivision.Has a stream profile tool that allows the user to subdivide a basin based upon significant grade breaks.Allows the user to import a file of points for batch sub-basin delineation.

HMS Model Support
Produces a number of hydrologic inputs that are used directly in HMS.Provides table of stream and watershed characteristics for the estimation of hydrologic parameters.Performs error checking and detection before HMS files input files are generated.