grid indentation analysis of composite microstructure and
TRANSCRIPT
Materials Science and Engineering A 430 (2006) 189–202
Grid indentation analysis of composite microstructureand mechanics: Principles and validation
G. Constantinides a, K.S. Ravi Chandran c, F.-J. Ulm a, K.J. Van Vliet b,∗a Department of Civil and Environmental Engineering, Massachusetts Institute of Technology, Cambridge, MA 02139, USA
b Department of Materials Science and Engineering, Massachusetts Institute of Technology, Cambridge, MA 02139, USAc Department of Metallurgical Engineering, The University of Utah, Salt Lake City, UT 84112-0114, USA
Received 7 December 2005; received in revised form 11 May 2006; accepted 17 May 2006
Abstract
Several composites comprise material phases that cannot be recapitulated ex situ, including calcium silicate hydrates in cementitous materi-als, hydroxyapatite in bone, and clay agglomerates in geomaterials. This requirement for in situ synthesis and characterization of chemicallycomplex phases obviates conventional mechanical testing of large specimens representative of these material components. Current advances inexperimental micro and nanomechanics have afforded new opportunities to explore and understand the effect of thermochemical environmentsooiPptvdc©
K
1
ipatsAmTuod
0d
n the microstructural and mechanical characteristics of naturally occurring material composites. Here, we propose a straightforward applicationf instrumented indentation to extract the in situ elastic properties of individual components and to image the connectivity among these phasesn composites. This approach relies on a large array of nano to microscale contact experiments and the statistical analysis of the resulting data.rovided that the maximum indentation depth is chosen carefully, this method has the potential of extracting elastic properties of the indentedhase which are minimally affected by the surrounding medium. An estimate of the limiting indentation depth is provided by asssuming a layered,hin film geometry. The proposed methodology is tested on a “model” composite material, a titanium-titanium monoboride (Ti–TiB) of variousolumetric proportions. The elastic properties, volume fractions, and morphological arrangement of the two phases are recovered. These resultsemonstrate the information required for any micromechanical model that would predict composition-based mechanical performance of a givenomposite material.
2006 Elsevier B.V. All rights reserved.
eywords: Indentation analysis; Composites; Titanium-titanium boride; Material characterization
. Introduction
The mechanically significant phases of several composites,ncluding calcium silicates in cementitious materials, hydroxya-atite in bones, and clay agglomerates in geomaterials, cannot bedequately reproduced ex situ in large specimens. This restrictshe use of conventional mechanical characterization approachesuch as uniaxial tension/compression or resonance frequency.s a consequence, the intrinsic (and thermochemically altered)echanical properties of such phases are essentially unknown.he advent of instrumented indentation [14,40] provides annprecedented opportunity to measure the mechanical responsef these phases at the appropriate length scale (∼ 10−6 m). Suchata is a critical requirement of multiscale mechanical modeling
∗ Corresponding author. Tel.: +1 617 25 3315; fax: +1 617 253 8745.E-mail address: [email protected] (K.J. Van Vliet).
efforts that would predict the composite mechanical perfor-mance for a given composition and microstructure.
It is now well established that the response of a materialupon the reversal of contact loading provides access to the elas-tic properties of the indented material (for recent reviews seeRefs. [6,31]). The indentation technique consists of establishingcontact between an indenter of known geometry and mechan-ical properties (typically diamond) and the indented materialfor which the mechanical properties are of interest, and subse-quently acquiring the continuous change in penetration depthh as a function of increasing indentation load P (P–h curve).Typically, the extraction of properties is achieved by applyinga continuum scale mechanical model to derive two quantities,indentation hardness H and indentation modulus mechanicalM [2,11,30,39]:
Hdef= P/Ac (1a)
921-5093/$ – see front matter © 2006 Elsevier B.V. All rights reserved.oi:10.1016/j.msea.2006.05.125
190 G. Constantinides et al. / Materials Science and Engineering A 430 (2006) 189–202
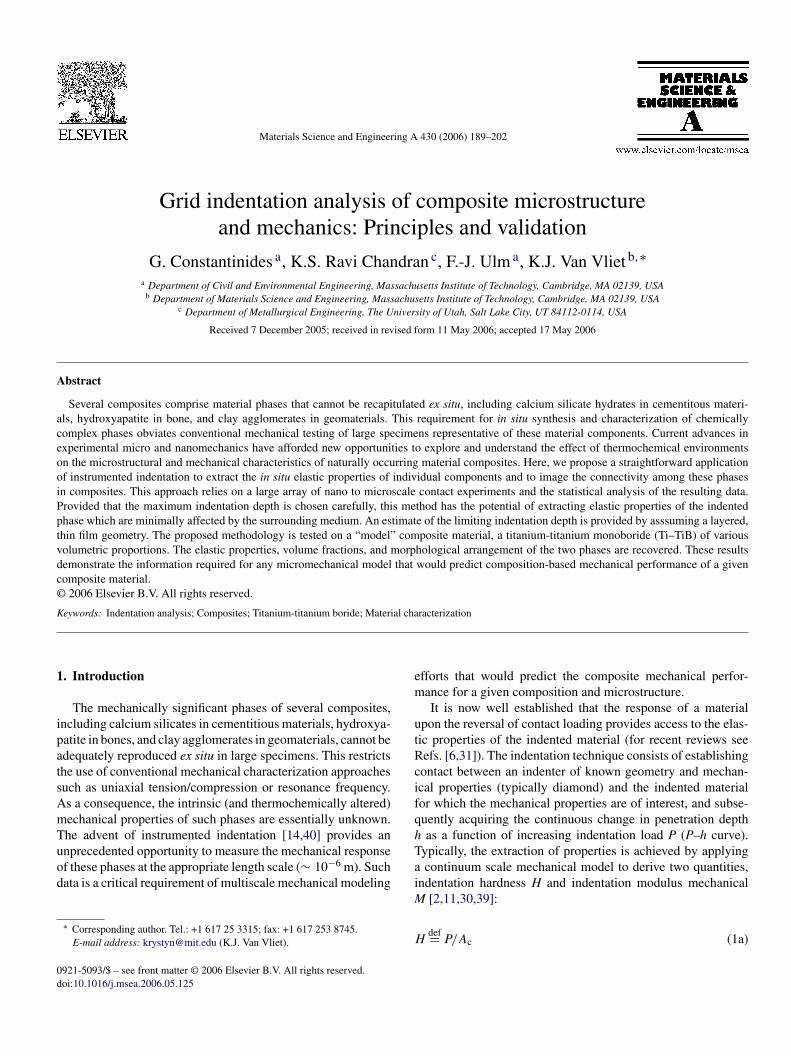
Fig. 1. Principles of indentation testing.
Mdef=
√π
2
S√Ac
(1b)
All quantities required to determine H and M are directlyobtained from the P–h curves, with the exception of the pro-jected area of contact Ac. Chief among these are the maximumapplied force Pmax and corresponding maximum depth hmax,the unloading indentation stiffness S = dP
dh|h=hmax , and residual
indentation depth hf upon full unloading of the material surface(Fig. 1). The contact area Ac can also be extrapolated from themaximum depth hmax [17,30,31]. Furthermore, M can be linkedto the elastic modulus E of the indented material by applying alinear elastic model to the data [15,36]. The methodology how-ever, is currently restricted to monolithic systems, and little hasbeen reported for indentation on composite materials, a cate-gory composing the majority of solids. Application of Eqs. (1a)and (1b) to multiscale composites poses several difficulties, asthe underlying analysis relies on the self-similarity of the inden-tation test; this strictly holds only for homogeneous materials[3].
Herein, we explore the following question: is it possibleto apply continuum indentation analysis to structurally hetero-geneous materials and, if so, how? We propose a straightfor-ward extension of instrumented indentation analysis for multi-scale composites, which by design circumvents the interactionbetween the individual phases present in the microstructure. Inpciidatmiotb
2
oam
umes and microstructural volumes are of the same order (seeFig. 1). This lack of length scale separation obfuscates the useof continuum analysis to translate indentation data into mean-ingful mechanical properties. We therefore propose a means toreduce this complexity through careful choice of indentationlength scales that enable application of continuum indentationanalysis.
2.1. Indentation length scales
Continuum indentation analysis is premised on spatiallyhomogeneous mechanical response and, therefore, constitutiverelations between stress and strain that are independent of thelength scales of analysis such as the indentation depth h [3]. Therepresentative volume element (RVE) of homogeneous mechan-ical response and characteristic size L must obey to the lengthscale separability condition:
d � L � (h, a, D) (2)
where (h, a) are the indentation depth and the indentation radius,respectively, that define the order of magnitude of the variation ofthe position vector x, D is a characteristic microstructural lengthscale, and d is the characteristic size of the (largest) microstruc-tural/mechanical heterogeneity contained in the RVE. Providedthat Eq. (2) is satisfied, an indentation experiment executed to ania1adfptlttmctsrlta
articular, we present a grid indentation technique that, underertain restrictions, can provide both quantitative and qualitativenformation about the morphology and mechanical properties ofndividual phases comprising the material. The large amount ofata acquired is treated in a statistical sense. That is, statisticalnalysis of results provides access to the mechanical proper-ies and volumetric proportions of all phases comprising the
aterial, and additionally the spatial representation of mechan-cally distinct phases elucidates the morphological arrangementf different phases. This is illustrated here for Berkovich inden-ation in a “model” binary composite material: titanium-titaniumoride (Ti–TiB).
. Identifying critical length scales: thin film analogy
The literature on indentation on composite materials includesnly few very recent publications [8,9,12,19,25]. This limitedctivity is not altogether surprising, given the complexity of theechanical response of a material system when indentation vol-
ndentation depth h gives access to the material properties thatre characteristic of the material at a length scale of L (see Fig.). Most indentation solutions are based on the self-similaritypproach, derived from the infinite half-space model (which byefinition has no length scale limit) that assumes spatially uni-orm mechanical properties (see e.g., Ref. [6]). Therefore, theroperties extracted by means of an inverse analysis from inden-ation data are averaged quantities characteristic of a materialength scale defined by the indentation depth h or the indenta-ion radius a. A good estimate is that the characteristic size ofhe material domain sensed by an indentation is of the order of
ax(h, a); roughly 3h for Berkovich indentation and h for theorner cube. Given the self-similarity of the indentation contact,he choice of indentation depth directly determines the lengthcale of the material RVE. Analysis of composite materialsequires consideration of the case in which the microstructuralength D is of the order of the indentation depth h, for whichhe classical tools of continuum indentation analysis would notpply.
G. Constantinides et al. / Materials Science and Engineering A 430 (2006) 189–202 191
2.2. Intrinsic phase properties: h � D
We thus aim to derive a critical indentation depth below whichmicrostructural length scales do not interfere significantly withthe indentation response, such that indentation data acquired tosuch a depth provide access to the intrinsic properties of thematerial comprising that RVE of the microstructure. The sim-plest geometrical representation of a heterogeneous binary (two-phase) composite system is a layered medium, which is in factthe most severe geometric heterogeneity that can be investigatedvia indentation [12]. Such layered systems have been investi-gated in some detail in the context of thin films on substrates,one of the most popular current applications of nanoindentation.In the case of this thin film analogy, we equate film thicknesst with the characteristic length scale of the microstructure Din Eq. (2), and explore thin film indentation models to identifya critical indentation depth below which the properties of thehomogeneous phase are measured accurately. We restrict ouranalysis here to the indentation stiffness, film stiffness Ef , butsimilar concepts can be extended to the film hardness Hf .
The majority of models for thin film indentation rely on phe-nomenological arguments or finite element simulations, and tendto relate the composite modulus Eeff to the elastic moduli of thefilm Ef and of the substrate Es:
Eeff = Ef + (Es − Ef )Ψ (3)
wtohtulttdswpc
Φ
Itrobstias
by solving a Fredholm integral equation of the second kind witha continuous symmetrical kernel which depends on the bond-ing conditions. With the aid of finite element calculations, Chenand Vlassak [5] compared the theoretical results of Yu et al. [42]with numerical results and showed very good agreement. Perriotand Barthel [32] proposed a method relying on the work by Liand Chou [26], in which they calculated the Green’s functionfor a coated substrate. The stress/strain relation of Li and Choucould not be inverted and thus not implemented easily for con-tact problems. Using the auxiliary fields introduced by Sneddonand Ting [37,41], however, Perriot and Barthel have reformu-lated this solution to allow inversion, and have found that theload–displacement response is independent of indenter geome-try and modulus mismatch. This response is very much like thatprovided by Gao et al. [16], and is also in good agreement for themodulus mismatch ratio in the range 0.5–2. Perriot and Barthelhave empirically extended Eq. (4) to a wider range of modulusmismatch ratios (Es/Ef = 0.01–100):
ΨPB =[
1 +( t
ak)n
]−1
(5)
where a is the contact radius, n is an empirical constant (n ∼1.27) and k is defined by:
log(k) = −0.093 + 0.792 log
(Es
E
)+ 0.05
(log
(Es
E
))2
EtE
rt(E
m
Fwt
here Ψ is a weight function that depends on the ratio of inden-ation depth to film thickness h/t. In fact, as Ψ → 0, the effectf the substrate is eliminated and Eeff → Ef . Several modelsave been proposed in the literature to estimate Ψ and quan-ify the effect of the substrate on the composite response. Bysing the Hankel’s transform method, Li and Chou [26] calcu-ated the Green’s function for a coated substrate and evaluatedhe displacement, stress field and load–indentation depth rela-ion of the thin film/substrate system under an axisymmetricallyistributed contact load. King [24] studied the effect of the sub-trate on the global response using finite element simulations,hereas Gao et al. [16] devised a first-order rigorous moduli-erturbation method to derive a closed-form solution for theontact compliance of an uncracked film/substrate composite:
G = 1 − ΨG = 2
πtan−1
( t
a
)
+[
(1 − 2ν)( t
a
)ln
(1 + (t/a)2
(t/a)2
)− (t/a)
1 + (t/a)2
]
× [2π(1 − ν)]−1 (4)
n this approach, based on a perturbation calculation of the elas-ic energy of a coated substrate indented with a flat punch ofadius a, the assumption is made that the mechanical propertiesf both materials do not differ widely. The model was validatedy Chen and Vlassak [5] by means of finite element analysis,howing that the model is correct for moduli mismatch ratio inhe range 0.5–2, deviating from reality in cases when the contrasts higher. Yu et al. [42] have considered the elastic solution of anxisymmetric mixed boundary value problem and the results (forpherical, conical, or cylindrical flat punch contact) are obtained
f f
(6)
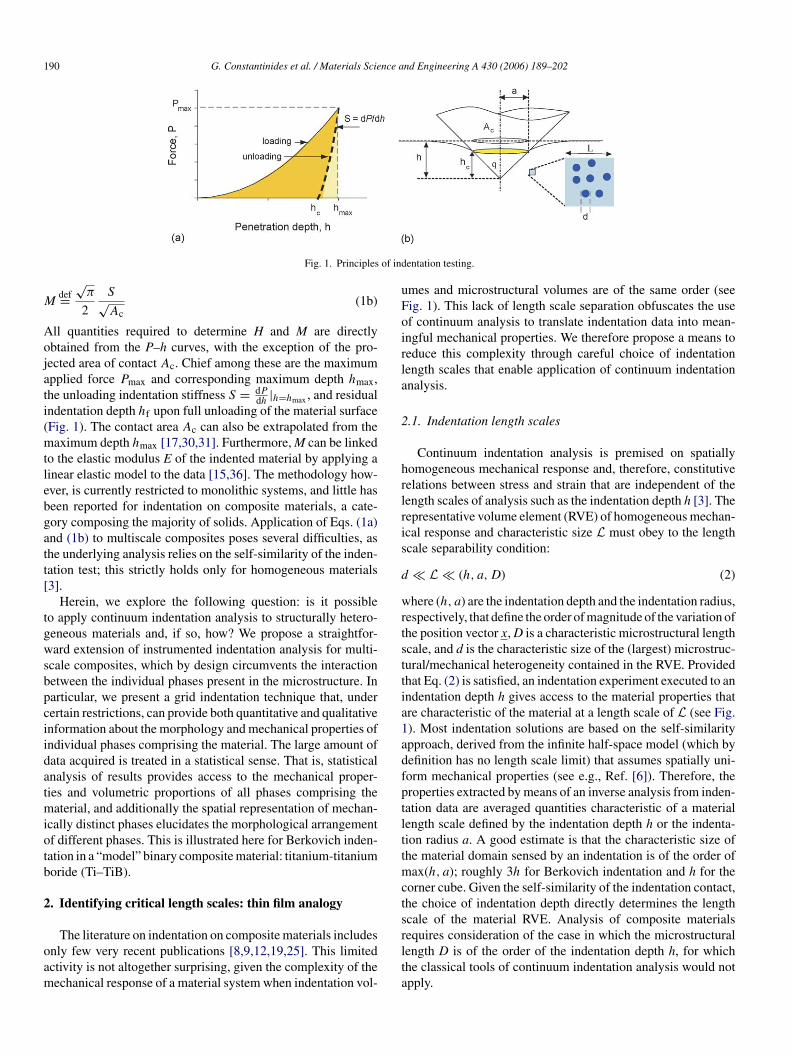
qs. (3) to (6) show a fair degree of consistency and suggesthat substrate effects are negligible for stiffness mismatch ratio
s/Ef ∈ [0.2, 5] as long as the indentation depth h (or contactadius a) is smaller than or equal to 10% of the film thickness. This is illustrated in Fig. 2 in which the critical a/t-ratio,a/t)10%, for which the error in the modulus estimation, (Eeff −
f )/Ef , does not exceed ±10%, is shown as a function of theodulus mismatch ratio Es/Ef .
ig. 2. Critical a/t-ratio vs. Es/Ef as predicted by Perriot and Barthel [32] forhich the composite modulus, Eeff, is within 10% of the film modulus, Ef . a is
he contact radius and t is the thickness of the layer.
192 G. Constantinides et al. / Materials Science and Engineering A 430 (2006) 189–202
The above models have been developed for a very specificgeometric arrangement of two phases, but are generally con-sidered to be a very good first-order approximation for moregeneral morphologies. The only available information for par-ticulate systems in the literature is a finite element study by Durstet al. [12], who performed numerical investigations of hardnessfor overlaying-substrate systems having a yield strength ratioof 0.5–2. Three different geometries are considered: a layeredmedium, a square particle embedded in a semi-infinite medium,and a semi- infinite fiber embedded in an semi-infinite medium.These results suggest that the thin film geometry yields the mostsevere restrictions on the depth of indentation and, therefore,use of the thin-film analogy to define a critical indentation depthwith respect to the size of the heterogeneity appears to be aconservative choice.
In summary, in order to apply continuum indentation anal-ysis to heterogeneous systems, the indentation depth should beat most 1/10 of the characteristic size of the microstructure Din order to access phase properties. This rule of thumb, alsoknown as 1/10-rule of Buckle [4], is a rough first estimate andin cases where the contrast between the mechanical proper-ties of the two phases becomes significant (( Es
Ef) /∈ [0.2, 5]) the
method tends to be too relaxed – at higher indentation depths,the indentation response interferes with microstructure, and spe-cial care should be taken in the interpretation of the indentationresults.
2
apautcmttr
3
3
eIstoclsa(b
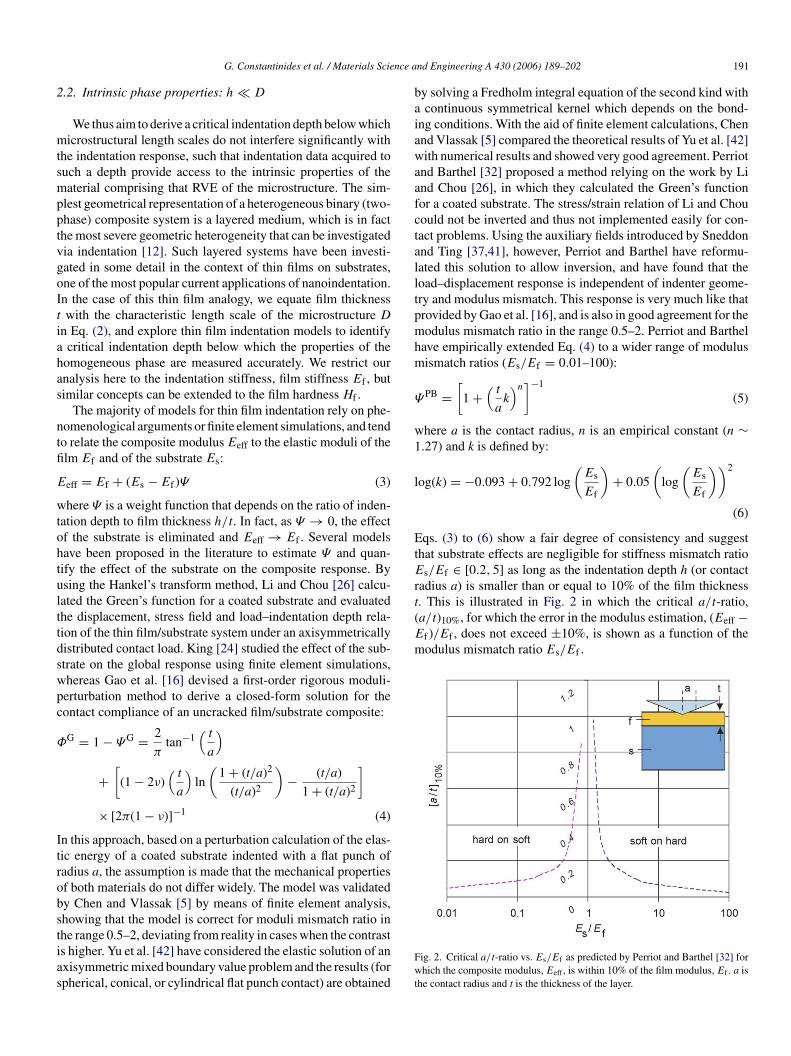
Fig. 3. Schematic of the principle of the proposed massive array or grid inden-tation technique for heterogeneous materials. Bottom: at low indentation depths(h � d) the individual constituents can be identified giving rise to multimodeditributions. Top: at large indentation depths (h � d) the properties of a homog-enized medium are obtained.
the probability of encountering one or the other phase is equalto the surface fraction occupied by the two phases on the indenta-tion surface. Provided that a similar distribution is found equallyon other surfaces, the surface fraction can be assimilated withthe volume fraction of the two phases present in the (isotropic)material. Consider next an indentation test performed to a maxi-mum indentation depth that is much larger than the characteristicsize of the individual phases, h � D (Section 2.3). It is readilyunderstood, by letting D = d in the scale separability conditionof Eq. (2), that the properties extracted from such an indentationexperiment are representative in a statistical sense of the averageproperties of the composite material.
This simple gedanken experiment has all the ingredients ofstatistical indentation analysis that need to be performed whenit comes to composite materials. The key results of such anal-ysis are distributions and their derivatives (e.g., histograms orfrequency diagrams) of mechanical properties determined by alarge number of indentation experiments at a specific scale ofmaterial observation defined by the indentation depth. Generallyspeaking, small indentation depths (h < 0.1D) provide accessto mechanical phase properties, and potentially to volume frac-tions:
fJ = NJ
N;
n∑J=1
NJ = N (7)
wcipaT
.3. Composite properties: h � D
To complete the thin film analogy, it is useful to providen estimate for the indentation depth that gives access to com-osite properties. The finite element simulations of Durst etl. [12] suggest that the response reaches an asymptotic val-es for a/t > 2. Equating t with D, it is possible to estimatehat an indentation depth of h > 2D cot θ (with θ the equivalentone semi-angle; see Fig. 1) should give access to compositeaterial properties. Hence, it is at indentation depths h between
hese two limiting cases, 0.01 < h/D < 2 cot θ that microstruc-ure is expected to strongly affect the measured indentationesponse.
. Massive array indentation experiments
.1. Gedanken experiment
Consider a material to be composed of two phases of differ-nt mechanical properties and characterized by a length scale D.f the indentation depth is much smaller than the characteristicize of the phases, h � D (Section 2.2) then a single indenta-ion test gives access to the material properties of either phase 1r phase 2. If, in addition, a large number of tests (N � 1) arearried out on a grid (Fig. 3) defined by a grid spacing � that isarger than the characteristic size of the indentation impression,o to avoid interference in between individual indentation tests,nd much larger than the characteristic size of the two phases�√
N � D), so that the locus of indentation has no statisticalias with respect to the spatial distribution of the two phases,
here NJ is the number of indentations on material phase J, thatan be identified by the difference in material properties; thats fJ is the volume fraction of a mechanically distinct materialhase. In turn, greater indentation depths (h > 2D cot θ) provideccess to homogenized material properties of the composite.his principle is demonstrated in Fig. 3. Finally, a mapping of

G. Constantinides et al. / Materials Science and Engineering A 430 (2006) 189–202 193
mechanical properties allows one to identify characteristic mor-phologies within the resolution defined by the array spacing.
3.2. Deconvolution of mechanical response distributions
The above gedanken experiment is based on the premise thatthe two phases have two properties of sufficient contrast thatthese can be separated in small-scale indentation tests. Compos-ite materials are generally more complex, requiring the use ofsome elementary statistics relations to analyze the indentationdata. Let us assume that the distribution of the mechanical prop-erty x = M of each phase J is best approximated by the normalor Gaussian distribution:
pJ (x) = 1√2πs2
J
exp
(− (x − µJ )2
2s2J
)(8)
where the mean µJ is the arithmetic mean of all NJ values ofeach phase, while the standard deviation, sJ , or the root meansquare deviation, is a measure of the dispersion of these values:
µJ = 1
NJ
NJ∑k=1
xk; s2J = 1
NJ − 1
NJ∑k=1
(xk − µJ )2 (9)
The case of a single phase, n = 1, corresponds to the case of ahomogenous material, for which mean value and standard devi-aImepd
P
wc
∑J
HEbrom
m
wdpmtn
total number of experiments; hence:
3n − 1 ≤ m < N (13)
In the application of the deconvolution technique to composites,the number of phases n is generally known in advance. Indeed,in small-scale indentation (h � D) n is determined by the num-ber of distinct chemical phases (e.g., those identified by X-raydiffraction) and/or morphological units (e.g., those identified byoptical or electron microscopy) that comprise the microstruc-ture. In turn, for the large-scale indentation response (h � D),n = 1 represents the composite material.
4. Experimental validation of massive array indentation
To validate the proposed approach, we have investigated aseries of discontinuously reinforced titanium alloys containingtitanium boride (TiB) whiskers in different distributions. Themicrostructural evolution and the volume fractions of the dif-ferent phases have been studied in detail in Refs. [34] and [1],respectively. Titanium-titanium monoboride alloys (Ti–TiB) arecurrently considered as possible candidate materials for sev-eral advanced applications, ranging from military and aerospaceapplications to automobile parts. Other attractive reinforcingmaterials like SiC, C, or Al2O3 lead to the formation of reac-tion products at the interface, which have hindered macroscopicmechanical performance. The TiB particle reinforcement wasftmcamuccoarppuvc
4
4
bpCHwwpca
tion describe the properties of the material in a statistical sense.n the case of several phases (J = 1, n), that all follow a nor-al distribution, and which do not (mechanically) interact with
ach other, the overall frequency distribution of the mechanicalroperty x = M obeys to the following theoretical probabilityensity function:
(x) =n∑
J=1
fJ pJ (x) (10)
here fJ is the volume fraction of phase J subjected to theonstraint:n
=1
fJ = 1 (11)
ence, there is a total of 3n − 1 unknowns in the problem ofq. (10); (fJ , µJ , sJ ) for each phase reduced by the compati-ility condition of Eq. (11). If empirical frequency densities oresponse distributions are obtained by nanoindentation in formf discrete values Pi one can determine the unknowns by mini-izing the standard error:
inm∑
i=1
(Pi − P(xi))2
m(12)
here Pi is the observed value of the experimental frequencyensity, P(xi) = ∑n
J=1 fJ pJ (xi) is the value of the theoreticalrobability density function shown in Eq. (10) at point xi, andis the number of intervals (bins) chosen to construct the his-
ogram. The number of observed values Pi should exceed theumber of unknowns, and will obviously be smaller than the
ound to circumvent the problems associated with reactivity ofitanium [13,35], while maintaining the advantages of a metal
atrix composite (MMC) including improved specific strength,reep, and corrosion resistance as compared to the titaniumlloy matrix. While TiB currently serves as reinforcement inany MMCs, the elastic properties of this phase are essentially
nknown. Similarly to calcium silicate hydrates in cement-basedomposites or clay minerals in geomaterials, the TiB phaseannot be adequately reproduced in large specimens requiredf traditional testing methods. The proposed grid indentationpproach provides a unique opportunity to measure the elasticesponse of single crystal TiB at length scales of the order of thehase diameter, and additionally to validate the generality of theroposed experimental approach. The extracted results will besed as input information in a micromechanical model that pro-ide predictions about the elastic composite response, and thenompared with published macroscopic elasticity measurements.
.1. Materials and methods
.1.1. Specimen preparationTi–TiB composites of varying volume fractions were made
y reaction sintering of Ti and TiB2 powder compacts underressure in a hot press in an Argon back-filled atmosphere.ommercially available Ti powder (source: Alfa Aesar, Warall, MA) of average particle size: 28 �m and composition int.%: 0.23% O, 0.02% N, 0.01% C, 0.04% Fe, and 0.024% Has used. The TiB2 powder (source: Advanced Ceramics Cor-oration, Cleveland, OH) of average particle size: 2.4 �m andomposition in wt.%: 30.3% B, 0.67% Zr, 0.01% C, 0.04% Fe,nd 0.024% H was used as the source of B. The mixtures were

194 G. Constantinides et al. / Materials Science and Engineering A 430 (2006) 189–202
Table 1Volumetric proportions of power mixture and resulting composite solidcomposition
Powder mixture (%) Composite (%)
Ti/TiB2 Ti TiB TiB2
1.000/0.000 1.00 0.00 0.000.882/0.118 0.70 0.30 0.000.763/0.237 0.45 0.55 0.000.408/0.592 0.00 0.92 0.08
prepared by mixing and ball milling to produce the target com-positions of 0.0, 0.2, 0.6, and 1.0 volume fractions of TiB in theTi–TiB composites. Table 1 lists the powder mixture proportionsand the resulting volume fractions of Ti, TiB and TiB2 phasesin the composite. TiB is an intermediate phase between Ti andTiB2 components in the Ti–B phase diagram and the formationof TiB proceeds by the simple reaction:
Ti + TiB2 → 2TiB (14)
Reaction sintering was carried out at temperatures rangingfrom 1100 to 1400 ◦C under varying levels of pressures fordifferent compositions, to yield completely reacted and trans-formed microstructures in the final compacts. Density measure-ments and optical microscopic observations assured the full den-sity of the composites. Samples of size of about 10 mm × 10 mm× 3 mm were cut by electro-discharge-machining (EDM) fromthe fabricated plates. The samples were ground and successivelypolished with 125-, 75-, 40-, 20-, and 10-�m metal-bonded dia-mond disks. Final polishing was carried out with 6-, 1-, and0.1-�m diamond pastes on a felt cloth. The samples were thenetched with Kroll’s reagent. Microstructural examination wasconducted in a Hitachi 3000N scanning electron microscope(SEM) in secondary electron imaging mode. Some samples,especially the high TiB volume fraction composites were repet-itively etched to reveal the extremely fine TiB whisker bundles.Xi4sst
4
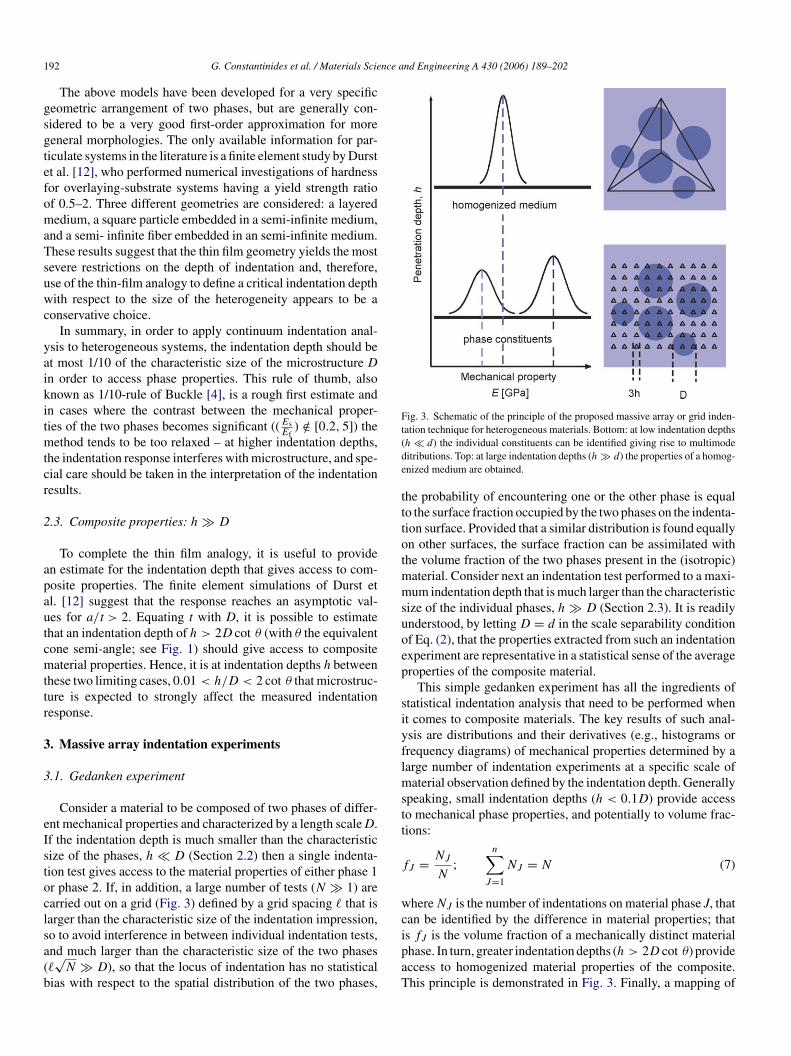
hvowTT7watnat
Fig. 4. Scanning electron microscopy images of etched Ti–TiB–TiB2 spec-imens: (a) 70%Ti–30%TiB, (b) 45%Ti–55%TiB, (c) 92%TiB–8%TiB2.Scalebars = 50 �m.
in length and about 0.6 �m in width, containing traces of Ti inbetween them. The pronounced refinement in these composi-tions relative to the other compositions has been explained (seeRef. [34]) on the basis of powder packing, anisotropic diffusionof B in TiB and the mean-free-path length available for TiBwhisker growth in a given powder-packed configuration. TheTiB phase coarsened significantly and lost the whisker structurein the 92%TiB–8% TiB2 composite – the average length of TiB
-ray diffraction analyses were carried out on polished spec-mens in a Siemens D5000 X-ray diffractometer operated at0 kV and 40 mA and using Cu Kα radiation. High resolutioncans were made to determine accurately the integrated inten-ities of specific diffraction peaks. The intensity profiles werehen Gaussian-fitted to estimate the volume fractions of phases.
.1.2. Ti–TiB composite microstructural characteristicsThe TiB whiskers formed by in situ reaction in the composites
ad a variety of sizes and aspect ratios that also varied with theolume fraction of TiB itself (see Fig. 4). This is due to the naturef powder packing, sintering times and the amount of TiB2 thatas required to form a composite of TiB in equilibrium withi at the process temperature. Nevertheless, in all composites,iB invariably formed as whiskers of varying aspect ratios. The0%Ti–30%TiB composite consisted of long, needle shaped TiBhiskers with a maximum length of about 50 �m and a width of
bout 5 �m embedded in Ti matrix. Duplex TiB whisker struc-ure was observed in 45%Ti–55%TiB composite; the first beingeedle-shaped and long TiB whiskers of about 40 �m in lengthnd about 4 �m in width, randomly oriented in Ti matrix, andhe second being bundles of short TiB whiskers of about 1.4 �m

G. Constantinides et al. / Materials Science and Engineering A 430 (2006) 189–202 195
Table 2Experimental program and mean ± standard deviation of indentation results
100Ti 70Ti–30TiB 45Ti–55TiB 8Ti–86TiB–6TiB2
# 1 × 100 2 × 100 2 × 100 2 × 100P∗
max (�N) 3481 ± 2 3484 ± 2 493 ± 2 3495 ± 1hmax (nm) 179 ± 18 137 ± 33 40 ± 11 89 ± 8S (�N/nm) 79.94 ± 10.38 81.69 ± 55.82 47.11 ± 5.52 142.25 ± 7.36τL/τH/τU (s) 10/5/10 10/5/10 10/5/10 10/5/10
∗ The deviation of the maximum force from the applied number is due to the spring force correction (see Ref. [22]).
phase was about 20 �m and the width was about 4 �m. The solidsolubility of B in Ti at room temperature is practically negligibleand all the B is present in the form of either TiB or TiB2.
4.1.3. Indentation parametersWe have suggested that the elastic properties of the individ-
ual components can be accessed by indentation experiments withmaximum indentation depths hmax/D ≤ 1/10.1 In nanoinden-tation, the maximum indentation depth must be such that thescale separability condition of Eq. (2) is satisfied:
d0 � hmax ≤ D/10. (15)
Hence, in order to obtain the properties of Ti and TiB, d0 andD represent the characteristic sizes of, respectively, the hetero-geneity within Ti and TiB, and D the microstructure of TiB.The crystalline nature of titanium and titanium boride implyd0 of the order the lattice parameters of the underlying crys-tal structures (Angstroms). Certainly, the characteristic size ofthe microstructure D is more difficult to estimate, as the size andshape of the TiB whiskers depend directly on initial compositionand heat treatment (temperature, duration, etc.). Scanning elec-tron microscopy images of Ti–TiB [18,34] suggest that a lengthscale of DI ∼ 1 − 3 �m is characteristic of the TiB whiskers(see Fig. 4); we adopt this limit herein. Hence, an appropriateindentation depth that allows access to the Ti and TiB phases byn
h
Ier4adpsaatp5w
mh
phases that do not satisfy Eq. (15) is expected to be random innature, and should be captured by the statistical analysis method(see Section 3.2).
Finally, we must relate the target indentation depths to themassive array of experiments conducted on a highly hetero-geneous material (see Fig. 3). A convenient way to achieveon-average indentation depths of the magnitude specified byEq. (16) is to employ a series of load-controlled indentationexperiments. This requires some experimental iteration. Forthe present material system, we found that a maximum loadof Pmax = 3500 �N yields an average maximum indentationdepth of hmax ∈ [60, 100] nm. Experiments were conductedusing a commercial nanoindenter (Hysitron, Inc. TriboInden-ter) that applies load and acquires load and displacement via asingle capacitive transducer and initiates contact with the samplesurface via piezoactuation of this transducer. In all indentationexperiments a trapezoidal load history was prescribed, definedby a loading segment duration τL = 10 s, a holding period atPmax of τH = 5 s, and an unloading segment duration τU = 10 s.In addition, a holding period of 10 s subsequent to the initiationof contact facilitated correction for thermal drift within the loadtrain of the instrumented indenter. Table 2 summarizes the detailsof the experimental program.
4.2. Indentation results and statistical analysis
aoii5itbeftbaiewmtar
anoindentation is:
max ∈ [100, 300] nm (16)
n the case of 45%Ti–55%TiB specimen, the TiB whiskersxhibited a refined morphology and the indentation depth waseduced further to access the individual constituents, hmax 0 nm. For smaller depths, issues related to imperfect geometryt the indenter apex may become significant [14], and for largerepths the “substrate effect” related to the proximity of otherhases will prohibit access to intrinsic properties of the TiB. Wehould emphasize, however, that Eq. (15) is only satisfied in anverage sense, and that the presence of experiments within anrray that violate these conditions is inevitable. For instance,he length and width of TiB whiskers has been determinedreviously to vary within a specimen (especially for 45%Ti–5%TiB), with a fraction of the whisker population exhibitingidths D < 1 �m [18]. The error induced by indentation on such
1 We recall that the critical indentation depth would be a function of the moduliismatch Es/Ef . For general composites where the modulus Ef is unknown
max/D ≤ 1/10 would be a good starting point.
Indentation results were analyzed both individually and glob-lly: An individual test gives access to mechanical informationf the indented region, and a series of tests describes the compos-te material behavior. Typical load–depth (P − h) responses forndentation on the two phases (Ti and TiB) are illustrated in Fig.. The complete set of indentations varied in terms of the max-mum indentation depths all across the region defined by thesewo extreme scenarios, depending on the degree of interactionetween the two phases. The majority of the responses, how-ver, were centered around these two mean values. This will beurther exemplified through the statistical analysis of the inden-ation moduli presented below. Individual tests were analyzedased on the methodology presented by Oliver and Pharr [30]:function of the form P = b(h − hf )m was fitted to the unload-
ng portion of the P–h curve and the indentation stiffness, S, wasvaluated at maximum load, Pmax. The indentation modulus, M,as then calculated from Eq. (1b), where the area of contact ataximum load, Ac, was estimated according to the area func-
ion approach of Oliver and Pharr. This method is based on thessumption that the elastic contact height-to-indentation depthelation [36], hc/h = 2/π equally applies to the elastic recovery

196 G. Constantinides et al. / Materials Science and Engineering A 430 (2006) 189–202
Fig. 5. Typical P − h responses of indentations on Ti and TiB. Indents spanwithin this range depending on the degree of ineteraction between the two phases.
in elasto-plastic indentation characterized by a residual inden-tation depth hf :
hc − hf = 2
π(hmax − hf ) (17)
Since hmax and hf are measurable quantities, one can determinethe contact depth hc from Eq. (17), and subsequently the con-tact area Ac = A(hc), where A(hc) is a polynomial functiondescribing the imperfect indenter tip geometry and is calibratedby performing several indents on specimen with known proper-ties (here, fused silica) [30]. In practice, however, the residualindentation depth hf is very sensitive to surface imperfections.For purely elastic unloading with a conical indenter geometry,the P − h response follows the quadratic form of the loadingregime:
P = c(h − hf )2; h − hf = 2P
S(18)
such that the magnitude of hf is not required. Indeed, a combi-nation of Eqs. (17) and (18) yields:
hc
hmax= 1 − ε
Pmax
Shmax(19)
where ε = 2(1 − 2/π) = 0.73. Eq. (19) is also valid for otherindenter shapes: ε = 1 for a flat punch, and ε = 0.75 for aparabola of revolution. The main assumption incorporated in thisafsitaceur
P
Fig. 6. An atomic resolution scanning probe microcopy image of a residualindent on a Ti–TiB–TiB2 specimen in (a) gradient and (b) three-dimensionalrendering.
with values for the power-law exponent in the range 1.2 ≤ m ≤1.6 for a large range of tested materials [31]. By comparingthis experimental scaling relation with the closed form elasticsolutions for the flat punch (P ∝ h), conical indenter (P ∝ h2)and paraboloid of revolutions (P ∝ h3/2) [36], it appeared thatthe unloading curves are best approximated by an indenter thatbehaves like a paraboloid of revolution, (m = 1.5); and the valueε = 0.75 was recommended for Berkovich indentation. The con-clusions are somewhat surprising because the axi-symmetricequivalent of the Berkovich indenter is a cone, for which m = 2.This discrepancy has since been explained by the concept of an“effective indenter shape” [31]: During loading the localizedarea around the indent gets heavily distorted and as a conse-quence, upon unloading, permanent deformations remain on thesurface of the material. Reloading that region involves a coni-cal surface that pushes against a concave surface. According toOliver and Pharr, such a phenomenon can be well approximatedby a paraboloid indenter pressed against a flat surface.
Detailed finite element simulations and experiments (seeRefs. [31,30] and references therein) have shown that Eq. (19) isin very good agreement with the actual area of contact at maxi-mum load, provided that there is no significant pile-up of mate-rial at the contact perimeter. Scanning probe microscopy imagesof residual indentations (Fig. 6) demonstrate that there is novisible pile-up in the Berkovich indentation of the Ti–TiB com-posites, suggesting that the Oliver and Pharr method would yieldrl
4
prtmp
cp
nalysis is that the surface area beyond the contact points con-orms with the elasticity solutions: it assumes that the materialinks-in. The main assumption of the Oliver and Pharr methods that the shape of the deformed solid outside the area of con-act is elastic. This is not true when plastic deformations occurround the indenter to form material pile-up. Indeed, Eq. (19)annot predict hc/h > 1 which may be the source of importantrrors. The second concern about this method is that most of thenloading curves in Berkovich indentation tests obey to a powerelation of the form:
= c(h − hf )m (20)
eliable estimates of the area of contact. The large amount of ana-yzed indentation data was then treated in a statistical fashion.
.2.1. Mechanical response distributionsMechanical response distributions represented as frequency
lots are used to analyze indentation data on a composite mate-ial. For small indentation depths, h � D, such plots give riseo multimode distributions, each peak corresponding to the
echanical manifestation of a phase.2 In order to extract elasticroperties of the relevant phases, the deconvolution technique
2 In the case of nanoindentation on Ti–TiB systems, the mechanical phasesoincide with a chemical phase. Such a scenario provides a direct link betweenhysical chemistry and mechanics.

G. Constantinides et al. / Materials Science and Engineering A 430 (2006) 189–202 197
Fig. 7. Frequency plots of the indentation modulus for the four specimens: 100%Ti, 70%Ti–30%TiB, 45%Ti–55%TiB, and 92%TiB–8%TiB2.
presented in Section 3.2 is employed. It should be noted, how-ever, that this process, as is true of most optimization schemes,can result in convergence of the solution to local minima. Toovercome this problem, judicious choice of the initial valuesof optimized parameters (using the frequency distributions) isrequired.
Fig. 7(a) shows the distribution of indentation modulus ona pure titanium matrix, 100%Ti. In this case, n = 1 and thedata can be fitted by a normal distribution of the form (8),where the mean value and the standard deviation are M100%Ti =134 ± 5 GPa (see Eq. (9)). The resulting frequency plot shows arelatively small scatter and high repeatability, underscoring themicrostructural and mechanical homogeneity of this elemen-tal matrix and the robustness of the indentation experimentsand analysis. Fig. 7 (b)–(d) depict the frequency plots of theM for three Ti–TiB alloys; 70%Ti–30%TiB, 45%Ti–55%TiB,92%TiB–8%TiB2. It is evident from the results that a secondpeak increases in intensity as the boron content increases, indi-cating the presence of a new phase, TiB. In the case of 92%TiB–8%TiB2 a small percentage of residual, unreacted TiB2 remainedin the matrix. This was detected by our indentation results and
is manifested as a peak in the frequency plot of Fig. 7(d) withan indentation modulus of: MTiB2 = 394 ± 13. The extractedindentation moduli and volumetric proportions of the differentphases are summarized in Table 3. In order to quantify the effectof the phases surrounding the RVE of indentation on the cal-culated M of each phase, we will use as reference for MTi andMTiB the results obtained on 100% Ti and 92%TiB–8%TiB2specimens accordingly. The indentation moduli obtained forTi and TiB in the two intermediate-volume specimens, Ti–30%TiB (MTi = 144 ± 12 GPa, MTiB = 330 ± 147 GPa) andTi–54%TiB (MTi = 141 ± 10 GPa, MTiB = 280 ± 70 GPa) arewithin 10% of the independently measured values on M100%Ti =134 ± 5 GPa and M92%TiB-8%TiB2 = 306 ± 22 GPa. This is inline with the restrictions posed by finite element calculationsfor the specific choice of indentation depth (see Fig. 2). Fur-thermore, this agreement with independent measures or compu-tationally simulated estimates of M (see Section 4.3) for thesephases supports the accuracy of the current approach in compos-ite analysis. That is, given a reasonable choice of the indentationdepth and a large number of well-designed indentation experi-ments, the intrinsic elastic properties of individual phases can
Table 3Indentation moduli and volumetric proportions of the different phases (Ti and TiB) obtained from the deconvolution of the experimentally obtained frequency plots
Indentation Modulus, M [GPa] Volume Fraction, f [%]
Ti TiB TiB Ti TiB TiB
100Ti 134 ± 5 –70Ti–30TiB 144 ± 12 330 ± 14746Ti–54TiB 141 ± 10 280 ± 7092TiB–8TiB2 136 ± 15 306 ± 22
2 2
– 100 0 0– 74 26 0– 44 56 0394 ± 13 4 93 3

198 G. Constantinides et al. / Materials Science and Engineering A 430 (2006) 189–202
be extracted. This is a consequence of the choice of the indenta-tion depth h, which was deliberately chosen to be small enoughcompared to the characteristic length of the heterogeneities D,such that an indentation test that is situated on an inclusion phasesatisfies h/D � 1.
The relatively high standard deviation observed for the TiBphase should be noted. This is a consequence of the “ substrateeffect” due to proximity of non-TiB phases in close proximityto the RVE that includes TiB. Since the whisker width variessignificantly, the condition h/D � 1 is likely violated in a sig-nificant number of individual experiments within the massivearray. In principle, this experimental obstacle could be overcomeby further reducing the maximum indentation depth, but wasbeyond the limits of the current experimental capabilities dueto geometric imperfections at the indenter apex for h < 40 nm.The proximity effect is also demonstrated by the decrease inthe standard deviation with increasing volumetric proportionsof TiB. It has been shown that the characteristic size of the TiB,D, increases in the case of 92%TiB–8%TiB2 (see Ref. [1] andSection 4.1.2), and thus the condition h/D is better satisfied asfTiB increases.
4.2.2. Volumetric proportionsThe volumetric proportions of the two phases, Ti and TiB,
have been measured by quantitative X-ray diffraction analysisand are reported in Table 1 (see also Ref. [34]). The direct com-pammitsc
V
we
R
wiT(
pGSltoatti
approach increase in accuracy as the mechanical dissimilaritybetween any two phases increases.
4.2.3. Mechanical mapping of microstructureInstrumented indentation facilitates controlled spatial dis-
tribution among indents in patterns such as regularly spacedarrays. In the nanoindentation arrays employed herein, a squaregrid of 10 �m inter-indentation spacing was chosen. The anal-ysis of each indentation P − h response provides informationabout the mechanical properties such as M at each array coordi-nate (x, y). These properties are, strictly speaking, representativeof a material domain of characteristic length scale max(h, a)that defines the RVE. Hence, provided that the array spacing islarger than the characteristic length scale of the material sam-pled in each experiment, mapping of the properties over the gridregion indicates the morphological arrangement of the phasescomprising the microstructure. A convenient and simple way togenerate these maps is by transforming the discrete data sys-tem into a continuous distribution of mechanical properties bylinearly interpolating the grid point values over the grid region.The result of this mapping can be displayed as contour plots inplan view (see Fig. 8). Such a contour depiction of mechani-
Fig. 8. Mechanical mapping of the indentation results on 70Ti–30TiB (b-c)as compared with an SEM image (a) of an etched microstucture at a similarmagnification. 1 = Titanium (Ti), 2 = Titanium monoboride (TiB). Scalebar =10 �m.
arison method [10], used extensively to estimate the retainedustenite in hardened steels, was here used to provide an esti-ate of the TiB volume fractions in various composites. In thisethod, the volume fractions are determined from the relative
ntensities of a particular plane (preferably the strongest reflec-ion) of TiB phase relatively to the integrated intensity of thetrongest TiB line. Accordingly, the volume fraction of TiB (Vf )an be written as:
f = RTiITiB
RTiITiB + RTiBITi(21)
here I is the integrated intensity of the (h k l) peak. The param-ter R is given by:
= |Fhkl|2pL
V0(22)
here V0 is the volume of unit cell, Fhkl is the structure factor, ps the multiplicity factor, and L is the Lorentz polarization factor.he reflections used in the analysis were (1 0 1)Ti, (2 0 0)TiB and
1 0 1)TiB2.An estimate of the volumetric proportions of the different
hases is also given by the relative area of each individualaussian distribution under the cumulative frequency plot (seeection 3.2 and Eq. (10)). The resulting values after deconvo-
uting the four alloys are provided in Table 3, and demonstratehe capacity of grid indentation to quantify the relative presencef different phases. Importantly, herein these volume fractionsre determined not by the differential chemical composition ofhese phases, but by the differential mechanical properties ofhese phases. It should be noted that this criterion immediatelymplies that the volume fractions estimated by the indentation

G. Constantinides et al. / Materials Science and Engineering A 430 (2006) 189–202 199
cal properties requires the selection of minima-maxima limitsbetween different phases. As the frequency plots in Figs. 7(b) to(d) show, there is some overlap in the distribution between dif-ferent phases, which complicates the definition of clear bound-aries between phases. As a first-order approach, we chooseequal size domains centered around the mean values of eachphase:
1. 0–200 GPa: Values situated in this range are associated withregions for which the mechanical response is dominated bythe titanium matrix.
2. 200–400 GPa: Values situated in this range are containedwithin the second peak in the frequency plots of Figs. 7(b) to(d), and are associated with regions in which the mechanicalresponse is dominated by the TiB whiskers.
Fig. 8 shows plan views of contour plots of the indenta-tion modulus for the Ti–30%TiB specimen. An SEM imageis also shown in Fig. 8, and demonstrates the correlation ofthese mechanical maps with electron microscopy images of themicrostructure. Hence, the mechanical maps provide a means tocharacterize the morphology of the microstructure at the scaledefined by the chosen indentation depth, and enables visual-ization of the mechanically distinct features. In particular, forthe Ti–TiB composite, the contour plots provide a snapshotof the formation process of the composite: TiB whiskers andp8pzAac[
4
ttrsTwSisimv
4
fp[a
indentation modulus is directly related to the Young’s modulus,E, and Poisson’s ratio, ν, of the indented material:
Ms = M = Es
(1 − ν2s )
(23)
where the subscript s indicates the indented material, s = Ti,TiB, TiB2. The effect of indenter compliance can be consid-ered by substituting for M in Eq. (23) the commonly employed[6,17,31] result of the Hertz contact solution of two elasticallydeformable bodies [21]:
1
M= 1 − ν2
E+ 1 − ν2
in
Ein(24)
where E, ν and Ein, νin are the elastic constants of the indentedmaterial and the indenter, respectively. Strictly speaking, dia-mond crystals are transversely isotropic and Eq. (24) is onlyapproximate. The International Standards Organization hasrecently issued a draft international standard (ISO 14577-2002,[23]) in which recommend the use of Ein = 1140 GPa, vin =0.07 for diamond indenters. For the purposes of our analysis,we will therefore employ these proposed isotropic constants.
The indentation moduli can be converted to the elastic prop-erties of the individual phases by considering Eq. (24) andassuming a Poisson’s ratio for each phase. It is interesting todecompose the effect of the indenter deformation and the Pois-son’s effect on the magnitude of E calculated from a given M.To this end, we start by calculating the material plane-stresselastic modulus Ms, which does not include any assumptionon the Poisson’s ratio. Fig. 9 shows the contribution of theindenter deformation on the elastic properties extracted thereby.The horizontal axis corresponds to the measured (composite)M which implicitly includes the deformation of the indenter,and the vertical axis quantifies the effect of indenter deforma-tion on Ms calculated as a function of M for a given indenterstiffness. It is impressive to note that as the stiffness of theindented material increases, the indenter deformation becomesmore significant and should be accounted in our analysis. In
Fig. 9. Error induced by the deformation of the indenter, defined as (Ms −M)/M × 100.
articles are embedded in a percolated matrix of Ti (see Fig.). The morphological characterization of the microstructurerovided by this mechanical mapping completes the characteri-ation of the properties and morphological arrangement in space.s it will be further discussed in Section 4.3.2, these data arepiece of the puzzle for the development of micromechani-
al models for upscaling of composite mechanical performance43].
.3. Elastic properties of Ti, TiB, and TiB2
The indentation moduli M determined from the grid indenta-ion experiments for the Ti, TiB, and TiB2 phases are insensitiveo spatial location, number of experiments, and specimen prepa-ation procedure. The extracted values can therefore be con-idered as mechanical properties characteristic of each phase.o further investigate the intrinsic nature of these properties,e compare our results with values reported in the literature.ince the TiB phase cannot be reproduced in macroscale phys-
cal dimensions, data on the elastic constants of this phase arecarce. In fact, the only information regarding E of this phases provided by atomistic simulations [18] or by extrapolating
acroscopic experiments on composites comprising differentolumetric proportions of TiB, fTiB, to fTiB = 1 [1].
.3.1. Elastic modulus in terms of MElastic contact mechanics provides a convenient framework
or linking the measured indentation modulus, M, with the elasticroperties of the indented material. The Galin-Sneddon solution15,20,27,33,36–38] of a rigid, axisymmetric indenter acting onlinear elastic, isotropic, infinite half-space suggests that the

200 G. Constantinides et al. / Materials Science and Engineering A 430 (2006) 189–202
Fig. 10. Sensitivity of the dimensionless ratio of Young’s modulus normalizedby indentation modulus, Es/Ms, to the Poisson’s ratio νs, over the range ofcommonly observed values of ν for engineering materials: 0 ≤ ν ≤ 0.5.
the following calculations, we will rely on the Hertz solutionof the contact between two isotropic solids of Eq. (24), and theisotropic assumption of the diamond indenter suggested by ISO[23].
Given the plain-stress elastic modulus of the indented mate-rial, the Young’s or uniaxial elastic modulus, Es = Ms × (1 −ν2) can be determined, provided a reasonable estimate of thePoisson’s ratio. However, it is not necessary to know the valueof the Poisson’s ratio with great precision to obtain a reasonableestimate of the Young’s modulus. In fact, a Poisson’s ratio of0.1–0.4, representative of the range including most engineeringmetals and ceramics, induces an error on E of less than 10%(see Fig. 10). Assuming a value of ν = 0.32 [13], 0.16 [1], 0.17[29] for Ti, TiB, and TiB2, respectively, the elastic moduli of thethree phases can be calculated:
M =
⎧⎪⎪⎪⎪⎪⎪⎨⎪⎪⎪⎪⎪⎪⎩
M Ms (Ms − M)/Ms Es
[GPa] [GPa] [%] [GPa]
140 159 14 138 Ti
305 416 36 406 TiB
394 600 52 585 TiB2
The elastic moduli of Ti and TiB (ETi = 138 GPa, ETiB2 =585 GPa) are in excellent agreement with macroscopic proper-ties reported in the literature: Elit
Ti = 110–120 GPa [13], ElitTiB2
=565 GPa [29]. The elastic properties of the TiB, however, remainaasmab3ee
mates from indentation experiments have also been reported[18], but the experimental scatter was quite significant. Thus,validation of the magnitude of ETiB obtained herein by recourseto existing data is difficult.
4.3.2. Micromechanical modeling and macroscopiccomposite behavior
To investigate the accuracy of our extracted ETiB, we willuse E
expTiB = 406 GPa as input in a composite model that pre-
dicts the macroscopic (homogenized) response, and comparethis prediction with reported macroscopic data. The Ti–TiBcomposite can be conveniently modeled with the Mori-Tanakamicromechanical scheme, which is suitably applied for matrix-inclusion geometries [28]. The model has been tested on sev-eral materials and has been found to show very good predic-tive capabilities (see e.g., Ref. [7]). In the case of a titaniummatrix with isotropic spherical inclusions of TiB, the Mori-Tanaka scheme yields the following homogenized response(Khom, Ghom):
Khom = KTi + (KTiB − KTi)fTiB
1 + a(1 − fTiB)((KTiB/KTi) − 1)(25)
Ghom = GTi + (GTiB − GTi)fTiB
1 + b(1 − fTiB)((GTiB/GTi) − 1)(26)
where KTi and KTiB are the bulk modulus of the titanium matrixamrs
a
Eohtbbvte
E
ν
Tν
Ttmu(tls
matter of current debate. This material exhibits crystallinenisotropy (orthorhombic unit cell), but the nine elastic con-tants required to describe the stiffness tensor have never beeneasured experimentally, chiefly due to the inability to prepare
ppropriate samples. Estimates of ETiB that assume isotropicehavior vary widely (Elit
TiB = 232–622 GPa). A value of ElitTiB =
71 GPa was suggested from inverse analysis of the compositelastic modulus [1], whereas a value of Elit
TiB = 485 GPa wasstimated from ab-initio atomistic simulations [18]. Some esti-
nd TiB inclusion, respectively, and GTi and GTiB are the shearodulus of the titanium matrix and titanium boride inclusion,
espectively. The variables a and b in Eqs. (25) and (26) aretated as:
= 3KTi
3KTi + 4GTi; b = 6
5
KTi + 2GTi
3KTi + 4GTi(27)
qs. (25) and (26) simplify the elongated whisker morphologyf the titanium composite by equivalent isotropic spheres. Itas been found however that, given the random orientation ofhe fibers in the matrix, the experimentally observed isotropicehavior of a macroscopic composite can be well approximatedy a spherical assumption [1,7]. Finally, given the homogenizedalues of the bulk and shear moduli, the Young’s modulus andhe Poisson’s ratio can be calculated using standard relations oflasticity theory:
hom = 9KhomGhom
3Khom + Ghom; (28)
hom = 3Khom − 2Ghom
6Khom + 2Ghom(29)
he mean elastic values of titanium boride (ETiB = 406 GPa,TiB = 0.16), as extracted from the indentation analysis (seeable 3), are incorporated in Eqs. (25) and (26) to calculate
he micromechanical predictions of E for a series of fTiB. Aean value between our indentation estimate and literature val-
es is used for the elastic properties of the titanium matrixElit
Ti = 120 GPa, νTiB = 0.32). The micromechanical predic-ions of the E and G, together with experimental data found in theiterature (Refs. [1,13,18]), are reported in Fig. 11. The impres-ive accuracy of the predictions validates the extracted elastic

G. Constantinides et al. / Materials Science and Engineering A 430 (2006) 189–202 201
Fig. 11. Experimental data and micromechanical predictions of composite mod-ulus (Upper: Young’s modulus E; Lower: Shear modulus G) versus the volumefractions of the reinforcing TiB. Source of Macroscopic data: Resonance Fre-quency [1]; Uniaxial Tension [1]; 3 Point Bending [18].
modulus of the TiB phase, as well as the use of the Mori-Tanakascheme to capture the strain localization within TiB inclu-sions.
This verification of ETiB completes the validation of the pro-posed massive array or grid indentation approach. This method-ology is of particular importance for materials for which theproperties of constituent phases are measurable only in situ. Assuch, grid indentation represents the only currently availableapproach for measuring the intrinsic mechanical properties ofphases as required for micromechanical modeling of compositeresponse.
5. Conclusions
1. The proposed massive array indentation approach can pro-vide the in situ elastic properties of individual phases within amultiphase microstructure. The proposed methodology relieson careful choice of the indentation depth and on a largenumber of experiments that are treated in a simple statisticalmanner. This provides a framework to determine valuableinformation about the composite microstructure, includingthe morphological arrangement and volumetric proportionsof each mechanically dissimilar phase.
2. In cases for which the elastic properties of the indented mate-rial are comparable to the elastic properties of the indenter
3
585 GPa. These magnitudes of E assume the isotropic natureof all phases, and are in agreement with available litera-ture values. Further, by employing the phase properties soobtained, the elastic modulus of each Ti–TiB composite pre-dicted by micromechanical modeling agrees well with thatobtained through independent experiments, suggesting thatsuch a simplified micromechanical approach can be conve-niently employed for modeling purposes.
References
[1] R.R. Atri, K.S. Ravichandran, S.K. Jha, Mater. Sci. Eng. A 271 (1999)150.
[2] S.I. Bulychev, V.P. Alekhin, M.K. Shorshorov, A.P. Ternovskii, G.D.Shnyrev, Ind. Lab. (Transl: Zavodskaya Laboratoria) 41 (1975) 1409 citedfrom [3].
[3] F.M. Borodich, L.M. Keer, C.S. Korach, Nanotechnology 14 (2003)803.
[4] H. Buckle, in: J.W. Westbrook, H. Conrad (Eds.), The Science of HardnessTesting and Its Applications, American Society for Metals, Metal Park OH,1973, pp. 453–459.
[5] X. Chen, J.J. Vlassak, J. Mater. Res. 16 (2001) 2974.[6] Y.T. Cheng, C.M. Cheng, Mater. Sci. Eng. R44 (2004) 91.[7] R.M. Christensen, J. Mech. Phys. Solids 38 (1990) 379.[8] G. Constantinides, F.-J. Ulm, K.J. Van Vliet, Mat. Struct. 205 (2003) 191
(Special issue of Conrete Sci Eng).[9] G. Constantinides, F.-J. Ulm, Cement Concrete Res. 34 (2004) 67.
[10] B.D. Cullity, Elements of X-ray Diffraction, second ed., Addison Wesley
[
[[
[
[
[[[
[[[
[[
[[[[[[[[[[[
[
(M > 100 GPa), error is minimized by including the con-tribution of the indenter elastic deformation. In our calcu-lation the indentation deformation was evaluated using thecommonly employed model of Hertz. A more detailed anal-ysis that takes the anisotropic behavior of the indenter intoaccount requires further attention.
. Application of this approach in a titanium-titanium boridebinary alloy system yielded an average value for Ti, TiB,and TiB2 of ETi = 138 GPa, ETiB = 406 GPa, and ETiB2 =
Inc, Reading, MA, 1978.11] M. Dao, N. Chollacoop, K.J. Van Vliet, T.A. Venkatesh, S. Suresh, Acta
Mater. 49 (2001) 3899.12] K. Durst, M. Goken, H. Vehoff, J. Mater. Res. 19 (2004) 85.13] A. Evans, C. San Marchi, A. Mortensen, Metal Matrix Composites. An
Introduction and a Survey, Kluwer Academic Publisher, 2003.14] A.C. Fischer-Cripps, Nanoindentation, Springer Verlag, New-York,
2003.15] L.A. Galin, translated by H. Moss. in: I.N. Sneddon (Ed.), Contact Prob-
lems in Theory of Elasticity, North Carolina State College, 1951.16] H.J. Gao, C.H. Chiu, J. Lee, Int. J. Solids Struct. 29 (1992) 2471.17] A.E. Giannakopoulos, S. Suresh, Scripta Mater. 40 (1999) 1191.18] S. Gorsse, Y. Le Petitcorps, S. Matar, F. Rebillat, Mater. Sci. Eng. A 340
(2003) 80.19] J.R. Gregory, S.M. Spearing, Compos. Sci. Technol. 65 (2005) 595.20] J.W. Harding, I.N. Sneddon, Proc. Cambridge Phil. Soc. 41 (1945) 16.21] H. Hertz, ‘On the contact of elastic solids (in German), zeitschrift fur die
reine und angewandte mathematik’, (1881) English translation in miscel-laneous papers (translated by D.E. Jones and G.A. Schott), Macmillan,London, UK, 1986, pp. 156–171.
22] Triboindenter Users Manual, Hysitron Inc., Minneapolis, MN, 2001.23] ISO 14577, Metallic Materials – Instrumented Indentation Test for Hard-
ness and Materials Parameters, 2002.24] R.B. King, Int. J. Solids Struct. 23 (1987) 1657.25] B.D. Kozola, Y.L. Shen, J. Mater. Sci. 38 (2003) 901.26] J. Li, T.W. Chou, Int. J. Solids Struct. 34 (1997) 4463.27] A.E.H. Love, Quart. J. Math. 10 (1939) 161.28] T. Mori, K. Tanaka, Acta Metal. 21 (1973) 1605.29] R.G. Munro, J. Res. Natl. Inst. Stand. Technol. 105 (2000) 709.30] W.C. Oliver, G.M. Pharr, J. Mater. Res. 7 (1992) 1564.31] W.C. Oliver, G.M. Pharr, J. Mater. Res. 19 (2004) 3.32] A. Perriot, E. Barthel, J. Mater. Res. 19 (2004) 600.33] G.M. Pharr, W.C. Oliver, F.R. Brotzen, J. Mater. Res. 7 (1992) 613.34] S.S. Sahay, K.S. Ravichandran, R.R. Atri, B. Chen, J. Rubin, J. Mater. Res.
14 (1999) 4214.35] T. Saito, T. Furuta, T. Yamaguchi, in: F.H. Froes, J. Storer (Eds.), Proceed-
ings of a Symposium Held during Materials Week, Rosemont, Illinois,1994.

202 G. Constantinides et al. / Materials Science and Engineering A 430 (2006) 189–202
[36] I. Sneddon, Int. J. Eng. Sci. 3 (1965) 47.[37] I. Sneddon (Ed.), Application of Integral Transforms in the Theory of
Elasticity, Springer Verlag, Wien-New York, 1977.[38] N.A. Stillwell, D. Tabor, Proc. Phys. Soc. 78 (1965) 169.[39] S. Suresh, A.E. Giannakopoulos, J. Alcala, Acta Mater. 45 (1997) 1307.
[40] D. Tabor, The Hardness of Metals, Oxford Classical Texts in the PhysicalSciences-First published, 1951.
[41] T.C.T. Ting, J. Appl. Mech. 88 (1966) 845.[42] H.Y. Yu, S.C. Sanday, B.B. Rath, J. Mech. Phys. Solids 38 (1990) 745.[43] A. Zaoui, J. Eng. Mech. 128 (2002) 808.