grid modernization through a smart grid platform
DESCRIPTION
Grid Modernization Through a Smart Grid Platform. Washington Electric Energy Systems Symposium University of Washington June 15 th 2011 Patricia Hoffman U.S. Department of Energy. Technologies, Markets, and Policies are Intricately Linked. Policies drive markets which drives technology - PowerPoint PPT PresentationTRANSCRIPT
Grid Modernization
Through a Smart Grid Platform
Washington Electric Energy Systems Symposium University of Washington
June 15th 2011
Patricia HoffmanU.S. Department of Energy
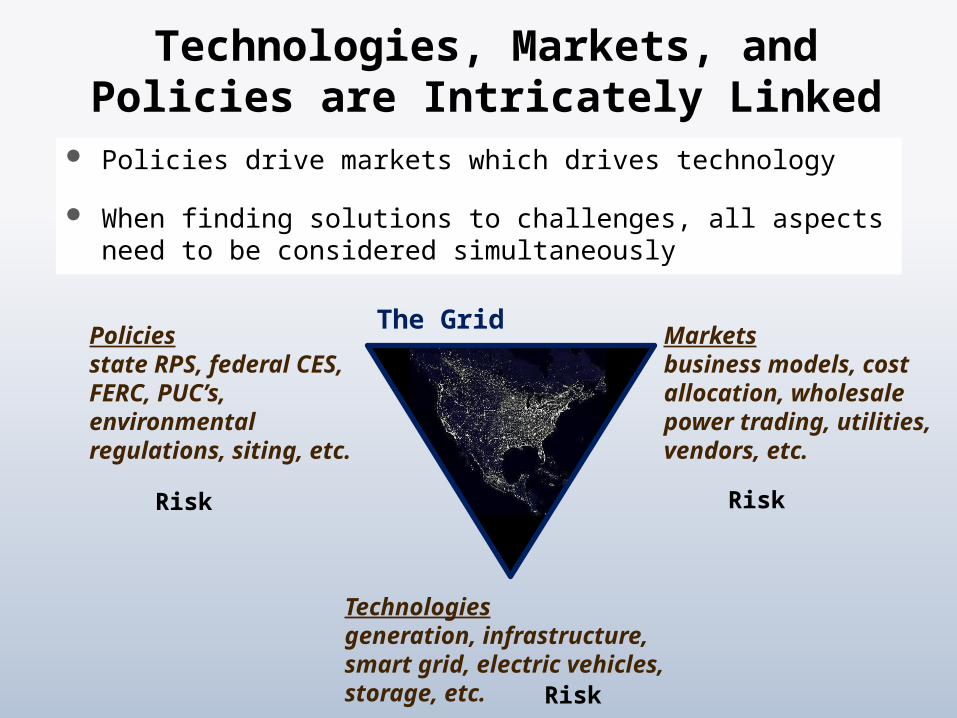
Technologies, Markets, and Policies are Intricately Linked
Policies drive markets which drives technology When finding solutions to challenges, all aspects need to
be considered simultaneously
Technologiesgeneration, infrastructure, smart grid, electric vehicles,storage, etc.
Marketsbusiness models, cost allocation, wholesale power trading, utilities, vendors, etc.
Policiesstate RPS, federal CES, FERC, PUC’s, environmental regulations, siting, etc.
The Grid
Risk
Risk
Risk
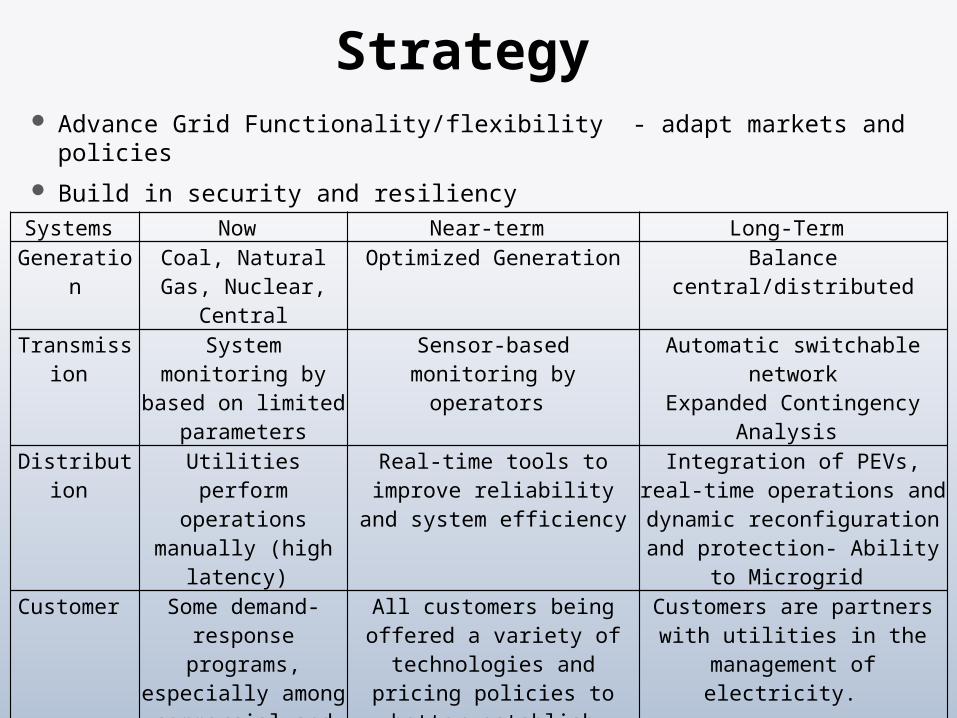
Strategy Advance Grid Functionality/flexibility - adapt markets and policies Build in security and resiliencySystems Now Near-term Long-Term
Generation Coal, Natural Gas, Nuclear, Central
Optimized Generation Balance central/distributed
Transmission System monitoring by based on limited
parameters
Sensor-based monitoring by operators
Automatic switchable networkExpanded Contingency Analysis
Distribution Utilities perform operations manually
(high latency)
Real-time tools to improve reliability and system efficiency
Integration of PEVs, real-time operations and dynamic
reconfiguration and protection- Ability to Microgrid
Customer Some demand-response programs,
especially among commercial and
industrial customers; most residential
customers on fixed rates
All customers being offered a variety of technologies and
pricing policies to better establish demand-side management
practices
Customers are partners with utilities in the management of
electricity.
Utility business model: neutral arbitrator of the grid or an energy
service company?
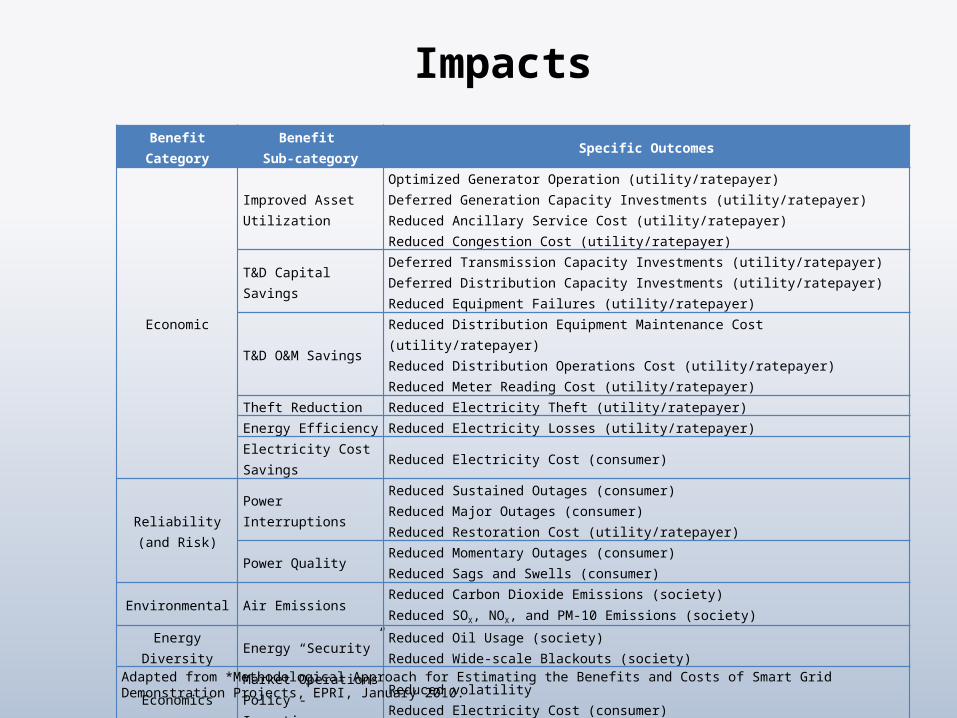
Impacts Benefit Category Benefit
Sub-category Specific Outcomes
Economic
Improved Asset Utilization
Optimized Generator Operation (utility/ratepayer)Deferred Generation Capacity Investments (utility/ratepayer)Reduced Ancillary Service Cost (utility/ratepayer)Reduced Congestion Cost (utility/ratepayer)
T&D Capital SavingsDeferred Transmission Capacity Investments (utility/ratepayer)Deferred Distribution Capacity Investments (utility/ratepayer)Reduced Equipment Failures (utility/ratepayer)
T&D O&M SavingsReduced Distribution Equipment Maintenance Cost (utility/ratepayer)Reduced Distribution Operations Cost (utility/ratepayer)Reduced Meter Reading Cost (utility/ratepayer)
Theft Reduction Reduced Electricity Theft (utility/ratepayer)Energy Efficiency Reduced Electricity Losses (utility/ratepayer)Electricity Cost Savings Reduced Electricity Cost (consumer)
Reliability (and Risk)
Power InterruptionsReduced Sustained Outages (consumer)Reduced Major Outages (consumer)Reduced Restoration Cost (utility/ratepayer)
Power Quality Reduced Momentary Outages (consumer)Reduced Sags and Swells (consumer)
Environmental Air EmissionsReduced Carbon Dioxide Emissions (society)Reduced SOX, NOX, and PM-10 Emissions (society)
Energy Diversity Energy “Security” Reduced Oil Usage (society)Reduced Wide-scale Blackouts (society)
Economics Market OperationsPolicy - Incentives
Reduced volatilityReduced Electricity Cost (consumer)
Adapted from *Methodological Approach for Estimating the Benefits and Costs of Smart Grid Demonstration Projects, EPRI, January 2010.
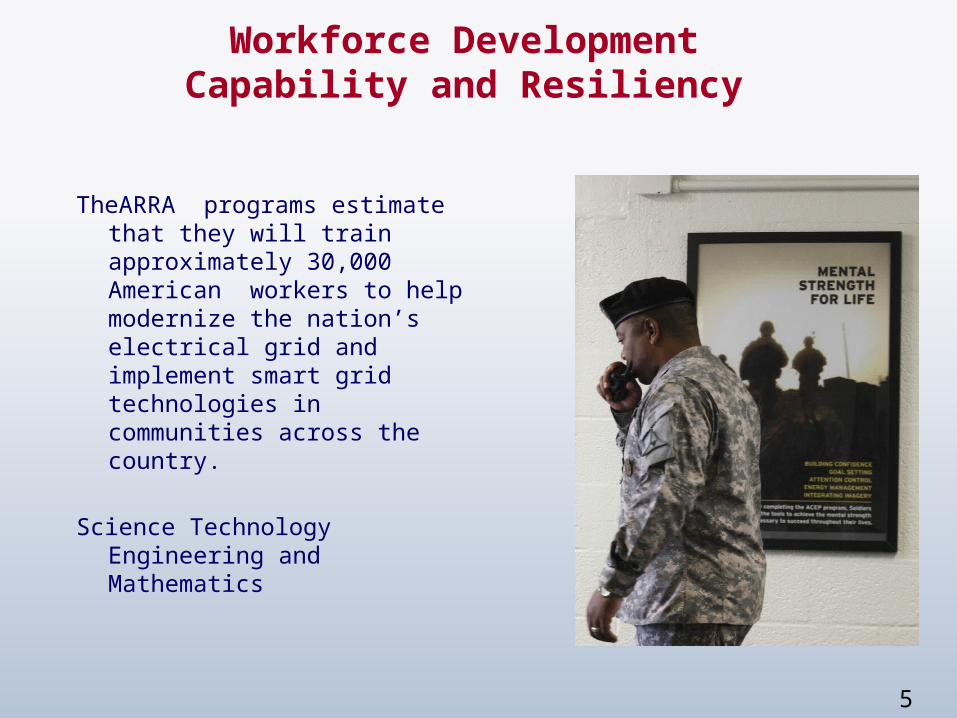
Workforce DevelopmentCapability and Resiliency
5
TheARRA programs estimate that they will train approximately 30,000 American workers to help modernize the nation’s electrical grid and implement smart grid technologies in communities across the country.
Science Technology Engineering and Mathematics
Manufacturing/Supply Chain
TransformersControl Systems components
Assessment of Critical Components
Transmission and Central
Generation
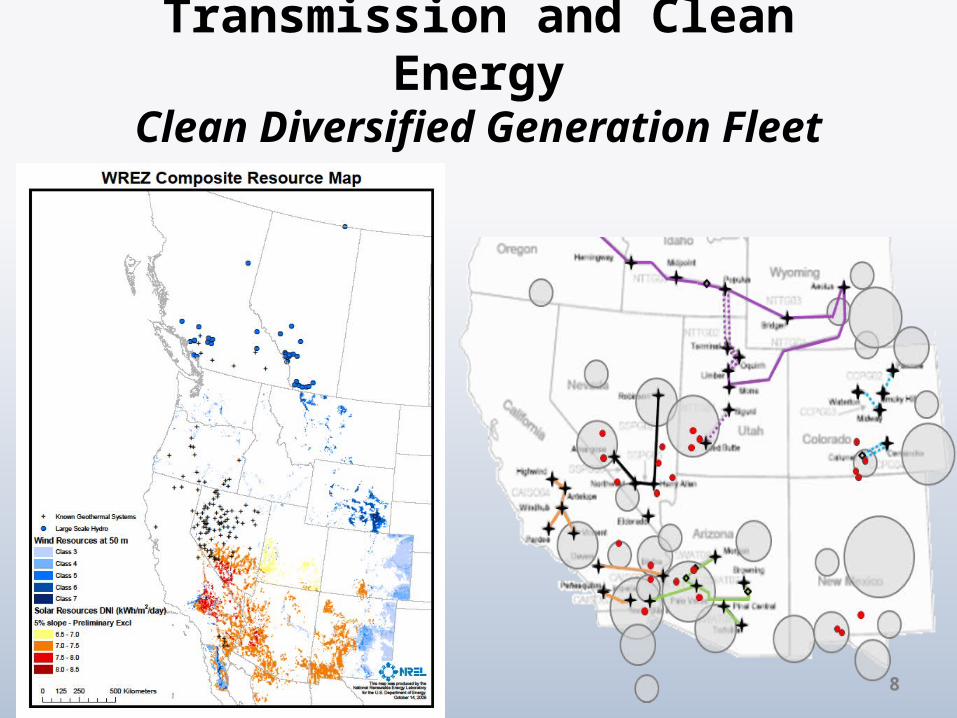
Transmission and Clean Energy
Clean Diversified Generation Fleet
8
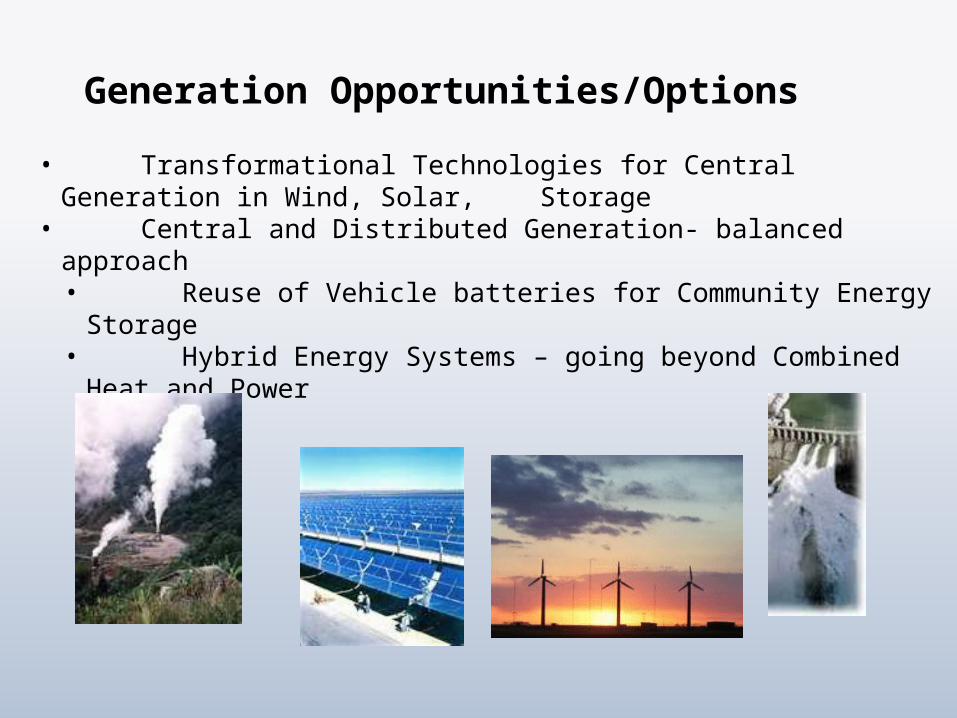
Generation Opportunities/Options• Transformational Technologies for Central Generation in Wind, Solar,
Storage• Central and Distributed Generation- balanced approach
• Reuse of Vehicle batteries for Community Energy Storage• Hybrid Energy Systems – going beyond Combined Heat and Power
Distribution and Demand
Distribution and Demand
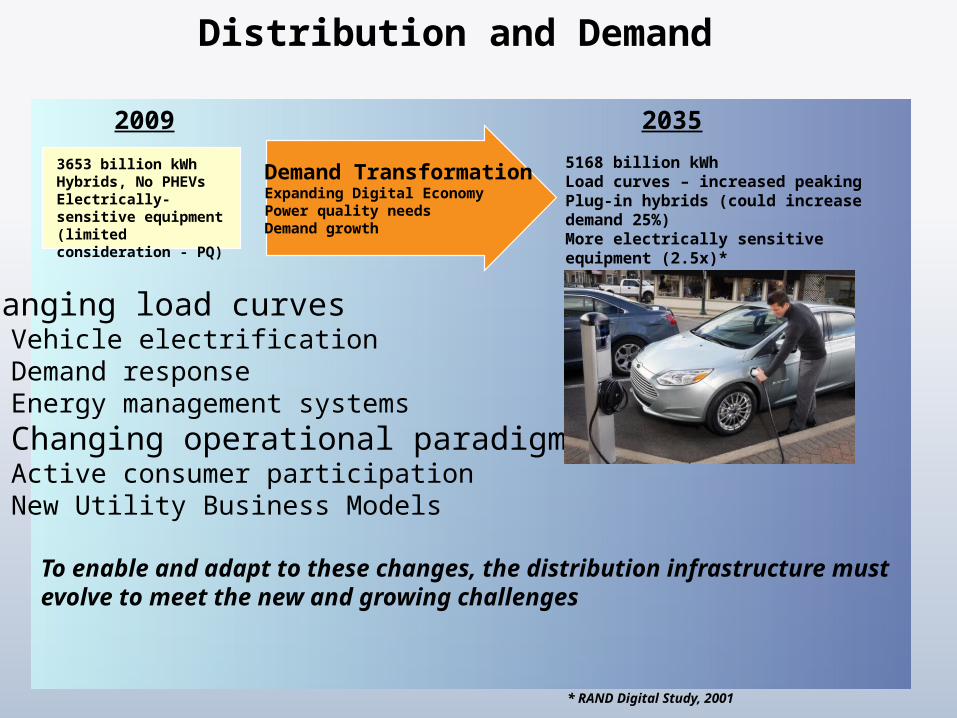
5168 billion kWhLoad curves – increased peakingPlug-in hybrids (could increase demand 25%)More electrically sensitive equipment (2.5x)*
3653 billion kWhHybrids, No PHEVsElectrically-sensitive equipment (limited consideration - PQ)
Demand TransformationExpanding Digital EconomyPower quality needsDemand growth
2009 2035
* RAND Digital Study, 2001
Changing load curvesVehicle electrificationDemand responseEnergy management systemsChanging operational paradigmsActive consumer participationNew Utility Business Models
To enable and adapt to these changes, the distribution infrastructure must evolve to meet the new and growing challenges

Optimized control of voltage and reactive power (Volt/VAR) requirements resulting in improved energy efficiency, including an ability to undertake conservative voltage reduction (CVR)
Impact of Distribution Automation Technology
Dominion Virginia Power applied CVR at its Trabue station in Midlothian where 6,000 customers in the test area saved roughly $260,000 in energy costs, or about 2.7 percent of their overall consumption during the past year.
Many empirical studies indicate a reduction in distribution system voltage reduces energy consumption.How CVR achieves this energy reduction has been a topic of debate.
*“Evaluation of Conservative Voltage Reduction (CVR) on a National Level [PNNL-19596]”, July 2010, http://www.pnl.gov/main/publications/external/technical_reports/PNNL-19596.pdf
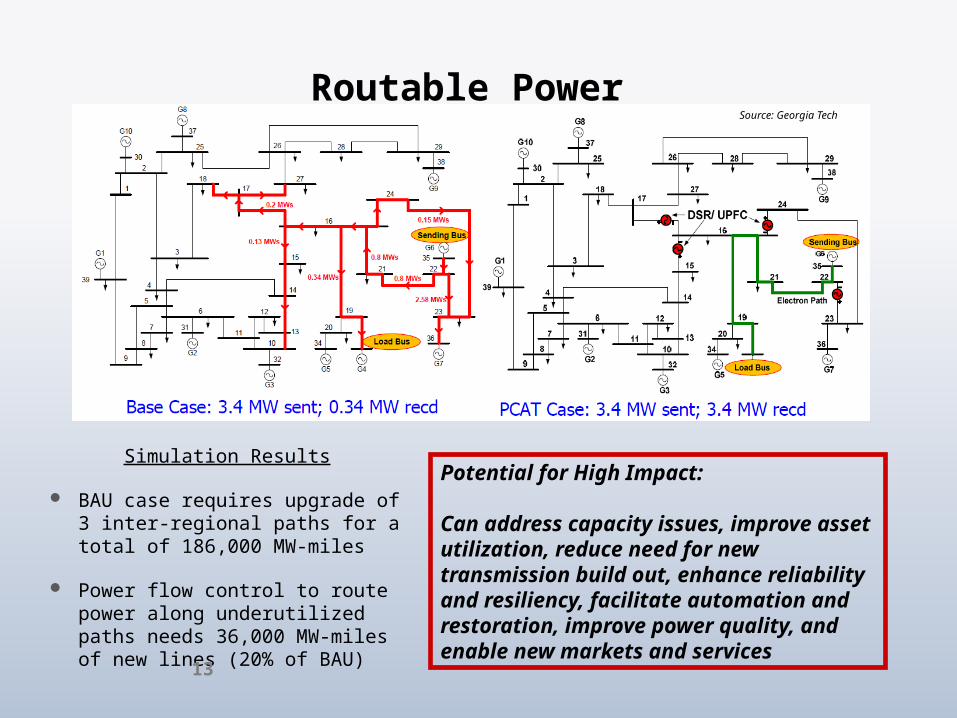
Routable Power
Simulation Results BAU case requires upgrade of
3 inter-regional paths for a total of 186,000 MW-miles
Power flow control to route power along underutilized paths needs 36,000 MW-miles of new lines (20% of BAU)
Source: Georgia Tech
Potential for High Impact:
Can address capacity issues, improve asset utilization, reduce need for new transmission build out, enhance reliability and resiliency, facilitate automation and restoration, improve power quality, and enable new markets and services
13
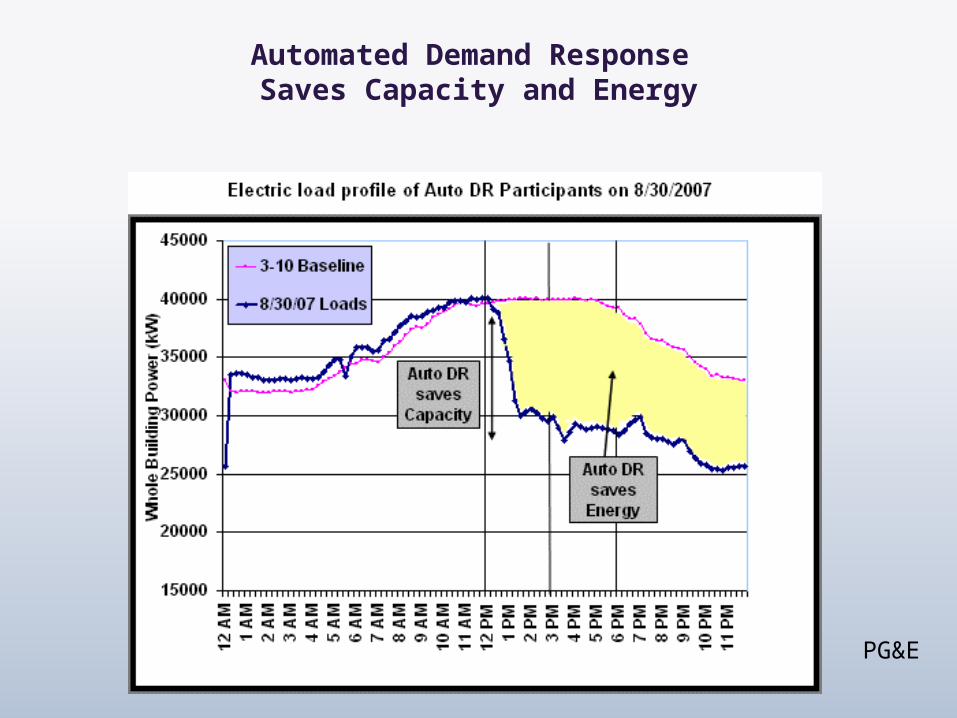
Automated Demand Response Saves Capacity and Energy
PG&E

Energy Management + Demand Response
Demand ResponseOptimized profileOriginal profile
Adaptive set-points
Optimization can save energy as well as provide reduces peak requirements
Standards vs Markets
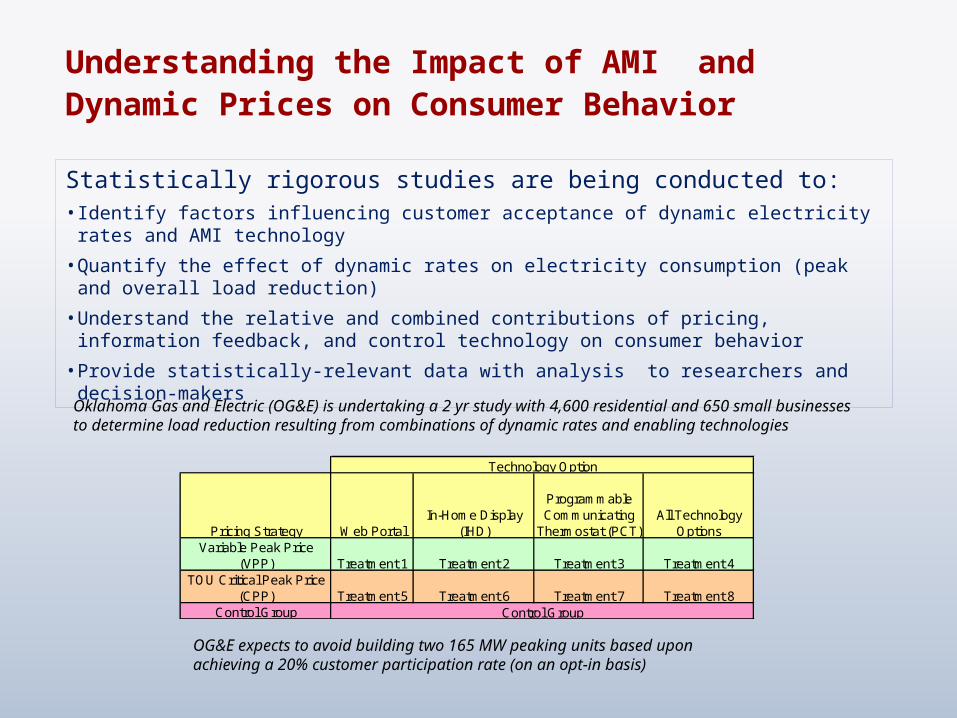
Statistically rigorous studies are being conducted to:• Identify factors influencing customer acceptance of dynamic electricity rates and AMI technology• Quantify the effect of dynamic rates on electricity consumption (peak and overall load reduction)• Understand the relative and combined contributions of pricing, information feedback, and control
technology on consumer behavior• Provide statistically-relevant data with analysis to researchers and decision-makers
Pricing Strategy Web PortalIn-Home Display
(IHD)
Programmable Communicating
Thermostat (PCT)All Technology
OptionsVariable Peak Price
(VPP) Treatment 1 Treatment 2 Treatment 3 Treatment 4TOU Critical Peak Price
(CPP) Treatment 5 Treatment 6 Treatment 7 Treatment 8Control Group
Technology Option
Control Group
Oklahoma Gas and Electric (OG&E) is undertaking a 2 yr study with 4,600 residential and 650 small businesses to determine load reduction resulting from combinations of dynamic rates and enabling technologies
OG&E expects to avoid building two 165 MW peaking units based upon achieving a 20% customer participation rate (on an opt-in basis)
Understanding the Impact of AMI and Dynamic Prices on Consumer Behavior

Outage Management Systems – Reliability
Arizona’s Public Service’s self-healing grid pilot in Flaggstaff has avoided more than 300,000 customer outage minutes in eight separate events since July 2010
Cullman Electric Cooperative has implemented an enterprise GIS system that includes real-time location and tracking from Air-Trak. The system displays all power outages and pinpoints vehicle locations.

Research Opportunities: Communications, Controls and Modeling
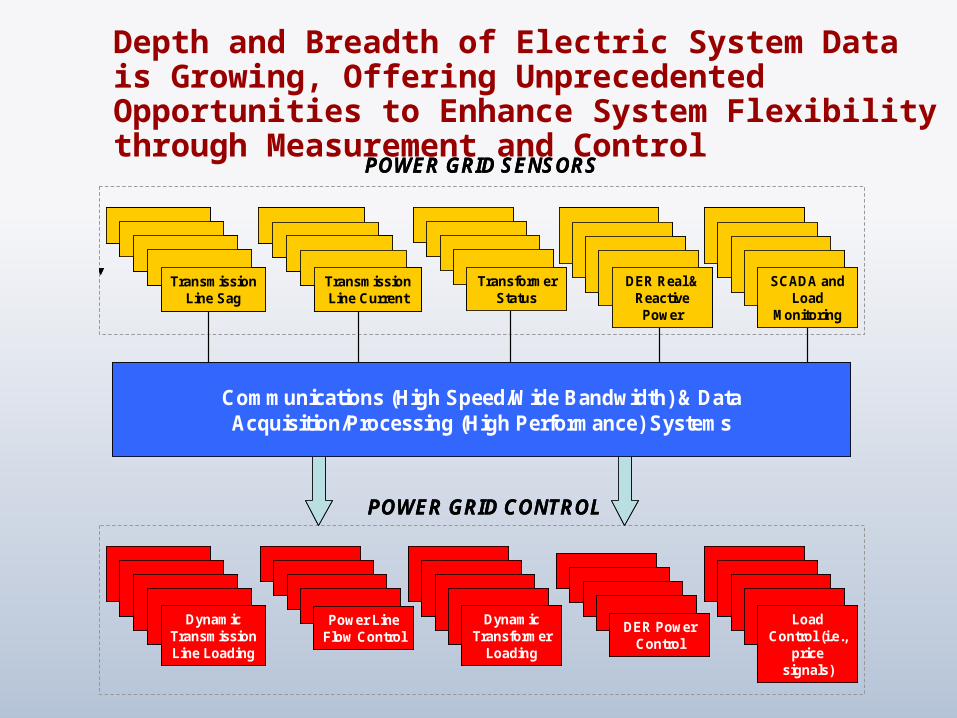
Depth and Breadth of Electric System Data is Growing, Offering Unprecedented Opportunities to Enhance System Flexibility through Measurement and Control
POWER GRID SENSORS
POWER GRID CONTROL
DER Power Control
Transmission Line Sag
Transmission Line Current
Transformer Status
DER Real & Reactive Power
Communications (High Speed/Wide Bandwidth) & Data Acquisition/Processing (High Performance) Systems
SCADA and Load
Monitoring
Dynamic Transmission Line Loading
Power Line Flow Control
Dynamic Transformer
Loading
Load Control (i.e.,
price signals)
POWER GRID SENSORS
POWER GRID CONTROL
DER Power Control
DER Power Control
Transmission Line Sag
Transmission Line Sag
Transmission Line CurrentTransmission Line Current
Transformer Status
Transformer Status
DER Real & Reactive Power
DER Real & Reactive Power
Communications (High Speed/Wide Bandwidth) & Data Acquisition/Processing (High Performance) Systems
SCADA and Load
Monitoring
SCADA and Load
Monitoring
Dynamic Transmission Line Loading
Dynamic Transmission Line Loading
Power Line Flow ControlPower Line
Flow ControlDynamic
Transformer Loading
Dynamic Transformer
Loading
Load Control (i.e.,
price signals)
Load Control (i.e.,
price signals)
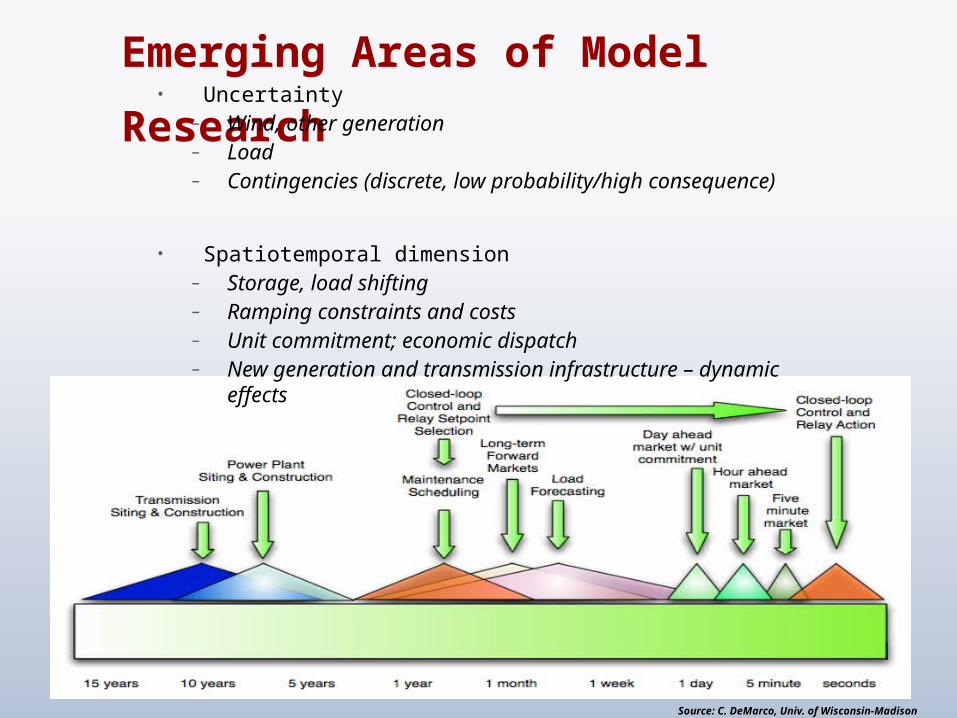
Emerging Areas of Model Research
• Uncertainty– Wind, other generation– Load– Contingencies (discrete, low probability/high
consequence)
• Spatiotemporal dimension– Storage, load shifting– Ramping constraints and costs– Unit commitment; economic dispatch– New generation and transmission infrastructure –
dynamic effects
Source: C. DeMarco, Univ. of Wisconsin-Madison
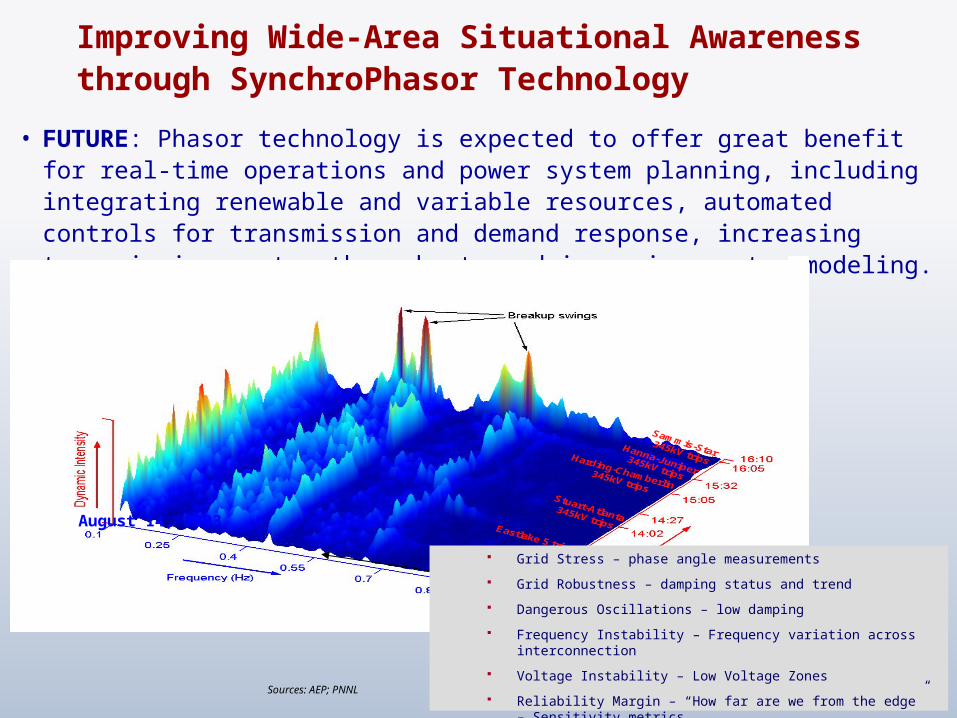
• FUTURE: Phasor technology is expected to offer great benefit for real-time operations and power system planning, including integrating renewable and variable resources, automated controls for transmission and demand response, increasing transmission system throughput, and improving system modeling.
August 14, 2003
Sources: AEP; PNNL
Improving Wide-Area Situational Awareness through SynchroPhasor Technology
Grid Stress – phase angle measurements
Grid Robustness – damping status and trend
Dangerous Oscillations – low damping
Frequency Instability – Frequency variation across interconnection
Voltage Instability – Low Voltage Zones
Reliability Margin – “How far are we from the edge” – Sensitivity metrics
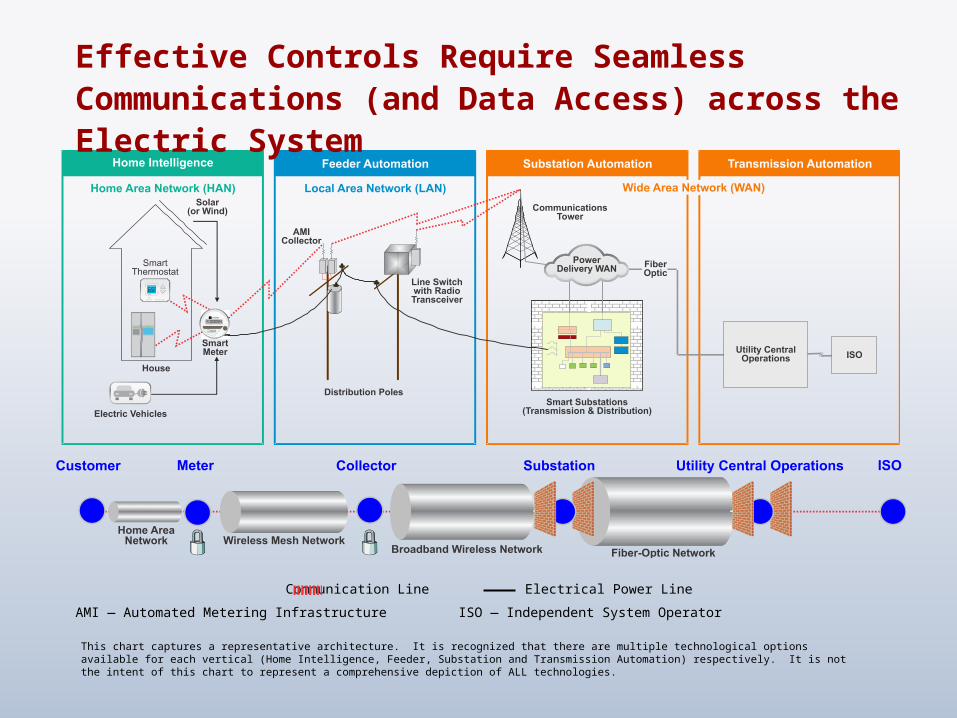
AMI — Automated Metering Infrastructure ISO — Independent System Operator
This chart captures a representative architecture. It is recognized that there are multiple technological options available for each vertical (Home Intelligence, Feeder, Substation and Transmission Automation) respectively. It is not the intent of this chart to represent a comprehensive depiction of ALL technologies.
Communication Line Electrical Power Line
Effective Controls Require Seamless Communications (and Data Access) across the Electric System
Research Opportunities: Technologies
Power Electronics Transformers Advanced Protection Devices Storage
24
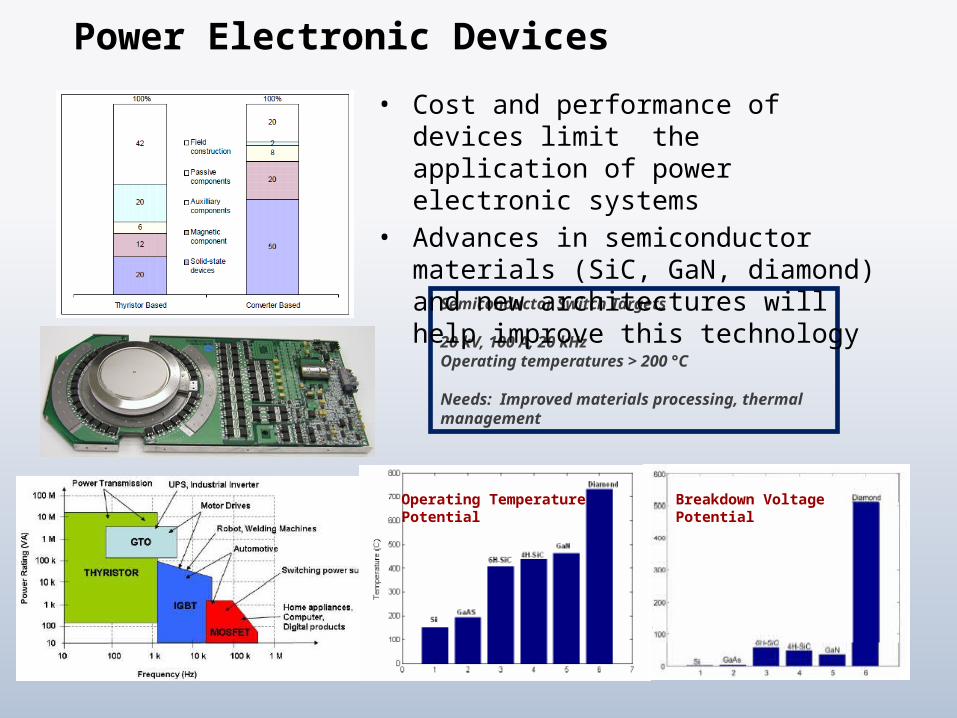
Power Electronic Devices
Breakdown Voltage Potential
Operating TemperaturePotential
Semiconductor Switch Targets
20 kV, 100 A, 20 kHzOperating temperatures > 200 °C
Needs: Improved materials processing, thermal management
• Cost and performance of devices limit the application of power electronic systems
• Advances in semiconductor materials (SiC, GaN, diamond) and new architectures will help improve this technology

Ubiquitous and critical component in the grid infrastructure
Potential for size/weight reduction and multi-functional capabilities (fault current limiting, etc.)
Can leverage power electronic devices for solid-state transformers
Improved resiliency to geomagnetic storm events (main point of failure that can lead to blackouts)
Advanced Transformers
Source: OSHA
Source: NASA
25
26
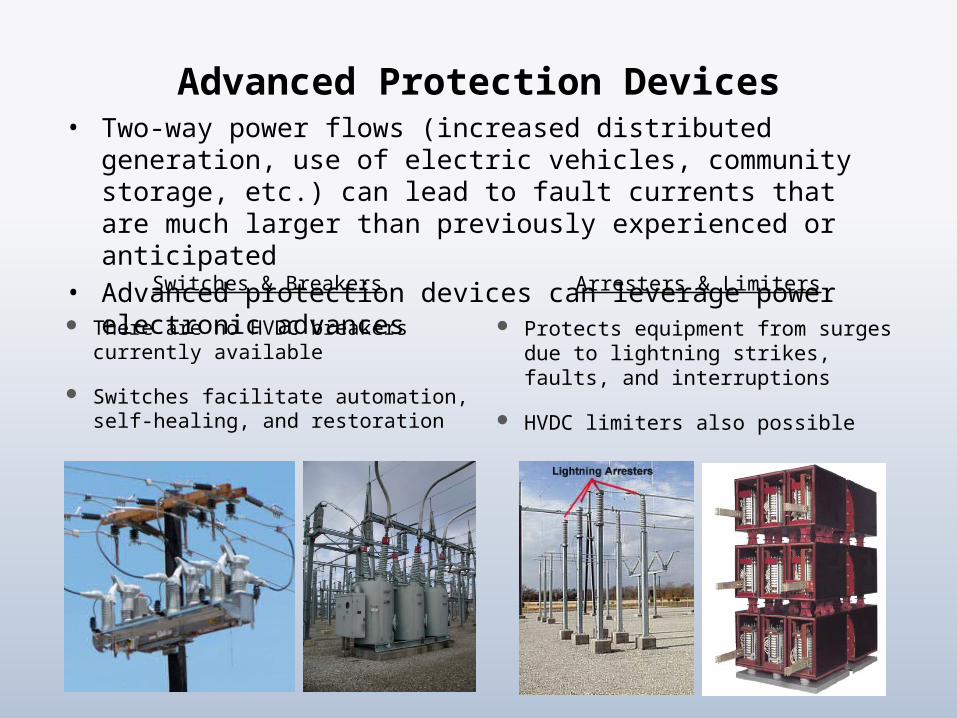
Advanced Protection Devices
Switches & Breakers There are no HVDC breakers
currently available Switches facilitate automation, self-
healing, and restoration
Arresters & Limiters Protects equipment from surges
due to lightning strikes, faults, and interruptions
HVDC limiters also possible
• Two-way power flows (increased distributed generation, use of electric vehicles, community storage, etc.) can lead to fault currents that are much larger than previously experienced or anticipated
• Advanced protection devices can leverage power electronic advances
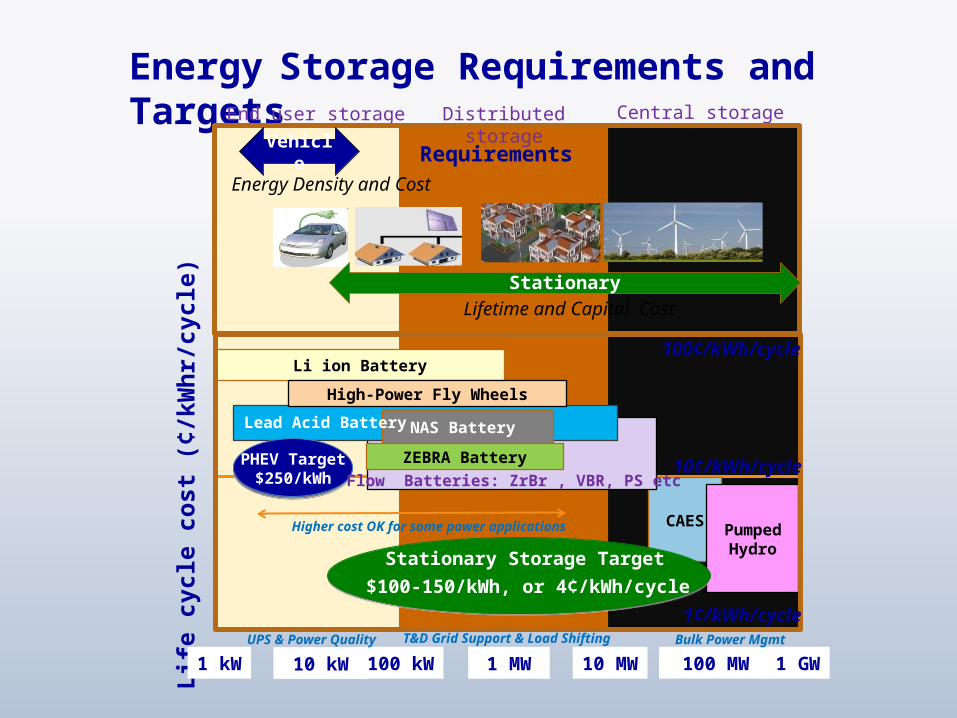
Energy Storage Requirements and Targets
Life
cycl
e co
st (¢
/kW
hr/c
ycle
)
CAES Pumped Hydro
Distributed storage Central storageEnd user storage
Stationary
1 kW 100 kW 10 MW 1 GW10 kW 1 MW 100 MW
Li ion Battery
NAS Battery ZEBRA Battery
VehicleEnergy Density and Cost
Lifetime and Capital Cost
Requirements
PHEV Target$250/kWh Flow Batteries: ZrBr , VBR, PS etc
Lead Acid Battery
100¢/kWh/cycle
10¢/kWh/cycle
High-Power Fly Wheels
1¢/kWh/cycle
Stationary Storage Target$100-150/kWh, or 4¢/kWh/cycle
Higher cost OK for some power applications
UPS & Power Quality T&D Grid Support & Load Shifting Bulk Power Mgmt
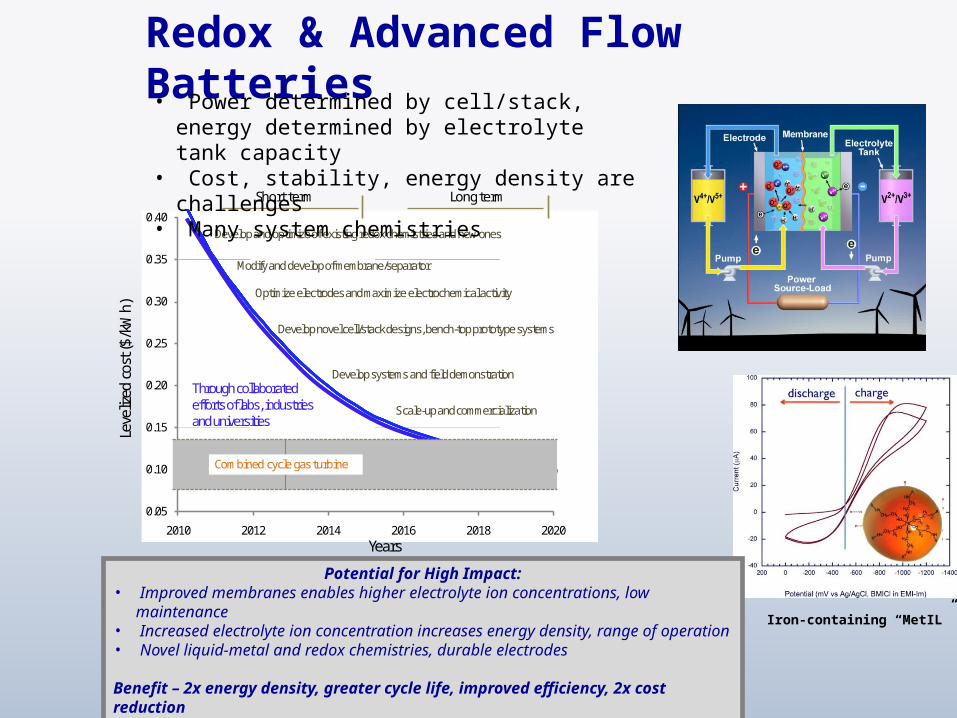
Redox & Advanced Flow Batteries
Iron-containing “MetIL”
Potential for High Impact:• Improved membranes enables higher electrolyte ion concentrations, low
maintenance• Increased electrolyte ion concentration increases energy density, range of
operation• Novel liquid-metal and redox chemistries, durable electrodes
Benefit – 2x energy density, greater cycle life, improved efficiency, 2x cost reduction
0.05
0.10
0.15
0.20
0.25
0.30
0.35
0.40
2010 2012 2014 2016 2018 2020
Short term Long term
Combined cycle gas turbine
Leve
lized
cost
($/k
Wh)
Years
Develop and optimize of existing redox chemistries and new ones
Develop systems and field demonstration
Scale-up and commercialization
Develop novel cell/stack designs, bench-top prototype systems
Optimize electrodes and maximize electrochemical activity
Modify and develop of membrane/separator
Through collaborated efforts of labs, industries and universities
• Power determined by cell/stack, energy determined by electrolyte tank capacity
• Cost, stability, energy density are challenges• Many system chemistries

0.05
0.10
0.15
0.20
0.25
0.30
0.35
2010 2012 2014 2016 2018 2020
Leve
lized
cost
($/k
Wh)
Years
Short term Long term
Combined cycle natural gas turbine
Develop effective sealing, stack components
Proof of concept of planar design
Modify electrode cathode chemistries interfaces
Optimization of interfaces and cell designs to allow operation ~200oC and energy efficiency (system >80%)
Develop and demonstrate KWs prototype system
Scale-up and commercialization
SBB
Traditional tubular sodium –sulfur cell, operated >300-350oC
Newly developed planar sodium metal-halide cell, operated <250oC
Planar stack, operated <250oC
.
Potential for High Impact:• Improved sealing and thin solid electrolytes enable planar design• Cathode optimization enables reduced temperatures• Novel nanofiber synthesis enables room temperature sodium-ion system
Benefit - 2x power density, 50% energy density improvement, 2x cost reduction
Sodium-based Batteries High efficiency & energy density, but high
temperature and cost limit deployment
New planar design enables reduced temperature and cost, and more advanced sodium ion concepts may be room temperature
Mn2O3 orthorhombic lattice
Security and Risk
SECURITY and RISK
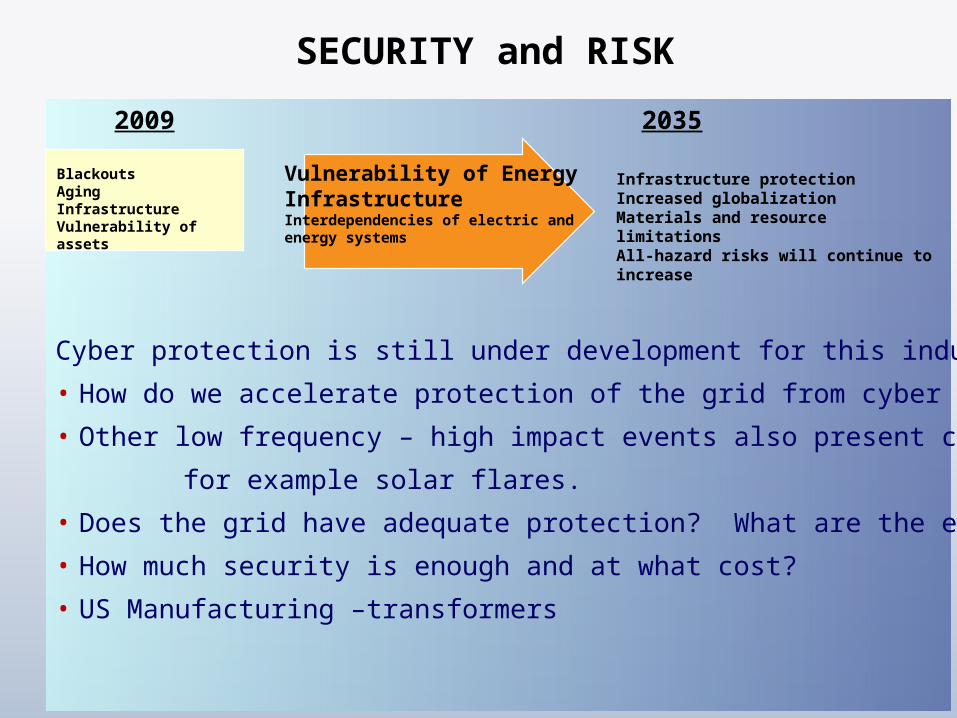
Cyber protection is still under development for this industry – • How do we accelerate protection of the grid from cyber concerns?• Other low frequency – high impact events also present concerns
for example solar flares. • Does the grid have adequate protection? What are the expectations? • How much security is enough and at what cost?• US Manufacturing –transformers
Vulnerability of Energy InfrastructureInterdependencies of electric and energy systems
Infrastructure protectionIncreased globalizationMaterials and resource limitationsAll-hazard risks will continue to increase
Blackouts Aging InfrastructureVulnerability of assets
2009 2035

Cyber Security (IT and Control Systems)Develop and
Integrate Protective Measures
Detect Intrusion & Implement
Response StrategiesSustain SecurityImprovements
Sustain SecurityImprovements
Measure and Assess Security
Posture
Energy asset owners are able to perform fully automated security state monitoring and control systems networks with real-time remediation
Next-generation control systems components and architectures produced with built-in, end-to-end security will replace older legacy systems
Control systems networks will inform operator response to provide contingency and remedial actions in response to attempted intrusions
Implement effective incentives through Federal and state governments to accelerate investment in secure control system technologies and practices
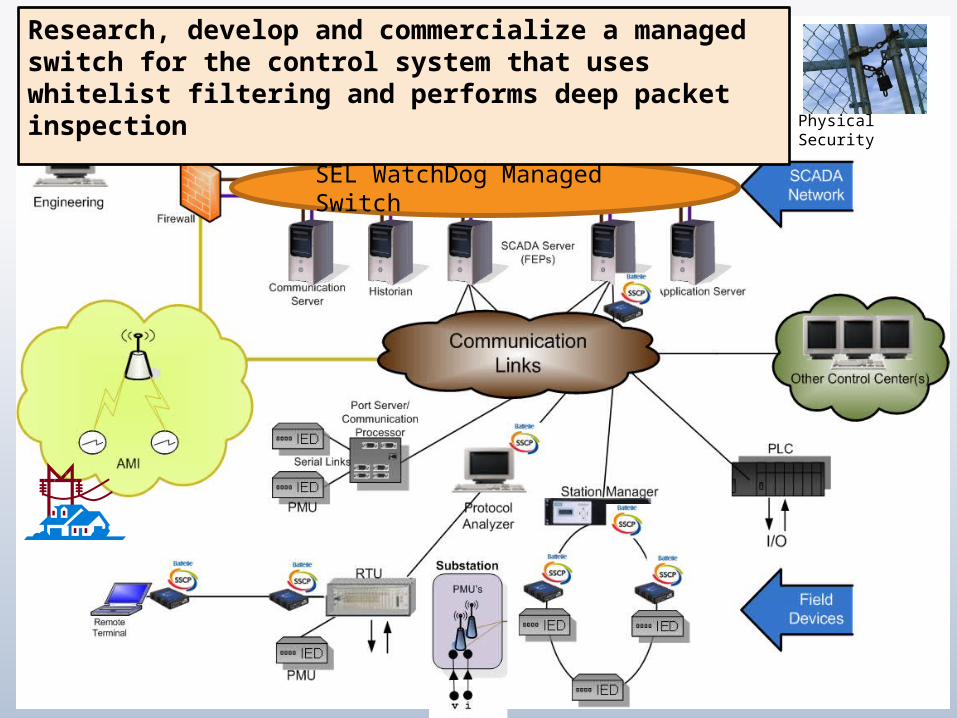
Physical Security
SEL WatchDog Managed Switch
Research, develop and commercialize a managed switch for the control system that uses whitelist filtering and performs deep packet inspection
Physical Security
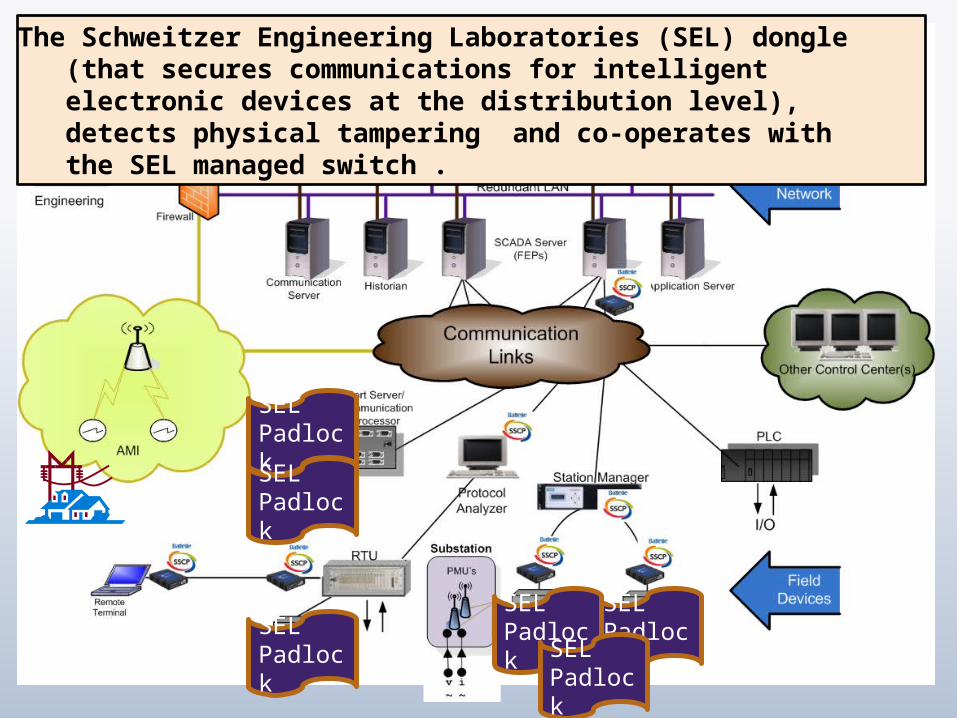
SEL Padlock
SEL PadlockSEL Padlock
SEL Padlock
SEL Padlock SEL
Padlock
The Schweitzer Engineering Laboratories (SEL) dongle (that secures communications for intelligent electronic devices at the distribution level), detects physical tampering and co-operates with the SEL managed switch .
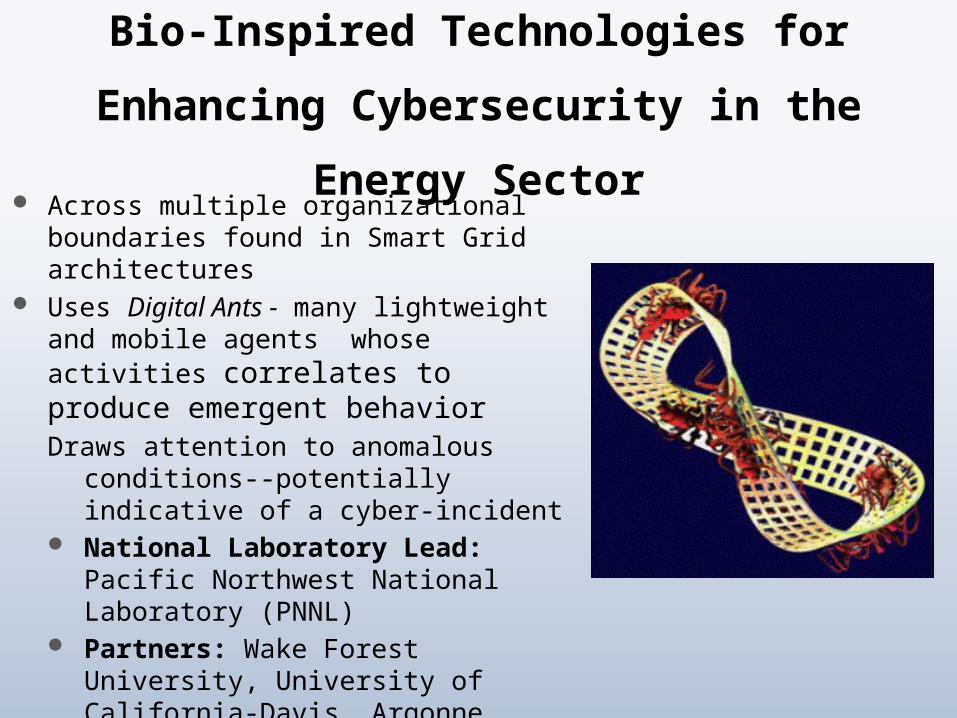
Bio-Inspired Technologies for Enhancing Cybersecurity in the Energy Sector
Across multiple organizational boundaries found in Smart Grid architectures
Uses Digital Ants - many lightweight and mobile agents whose activities correlates to produce emergent behavior Draws attention to anomalous conditions--
potentially indicative of a cyber-incident National Laboratory Lead: Pacific
Northwest National Laboratory (PNNL) Partners: Wake Forest University,
University of California-Davis, Argonne National Laboratory (ANL), SRI International
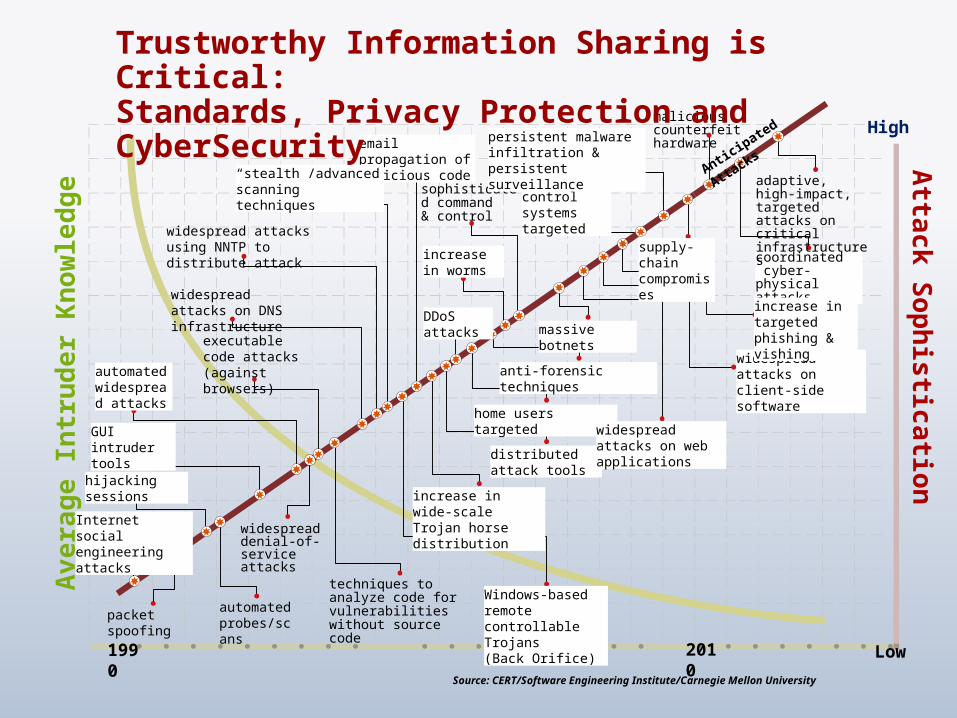
DDoS attacks
email propagation of malicious code
“stealth”/advanced scanning techniques
widespread attacks on DNS infrastructure
executable code attacks (against browsers)automated
widespread attacks
GUI intruder tools
hijacking sessions
Internet social engineering attacks
packet spoofing automated probes/scans
widespread denial-of-serviceattacks
techniques to analyze code for vulnerabilitieswithout source code
increase in worms
sophisticated command & control
anti-forensic techniques
home users targeted
distributed attack tools
increase in wide-scale Trojan horse distribution
Windows-based remote controllable Trojans (Back Orifice)1990 2010
coordinated cyber-physical attacks
malicious counterfeithardware
control systems targeted
Anticipated Attacks
supply-chain compromises
widespread attacks on web applications
massive botnets
adaptive, high-impact, targeted attacks on critical infrastructures
persistent malware infiltration & persistent surveillance
widespread attacks on client-side software
increase in targeted phishing & vishing
widespread attacks using NNTP to distribute attack
High
Low
Attack Sophistication
Aver
age
Intr
uder
Kno
wle
dge
Source: CERT/Software Engineering Institute/Carnegie Mellon University
Trustworthy Information Sharing is Critical: Standards, Privacy Protection and CyberSecurity