grimur valdimarsson, director fishery industries division...
TRANSCRIPT

1
International Fish TradeInternational Fish Trade
Grimur Valdimarsson, Grimur Valdimarsson, DirectorDirector
Fishery Industries DivisionFishery Industries DivisionFAO, Rome,ItalyFAO, Rome,Italy

2
OutlineOutline
?? Regulatory Framework for Fish TradeRegulatory Framework for Fish Trade?? Production Production
•• Aquaculture versus WildAquaculture versus Wild•• Developing versus Developed countriesDeveloping versus Developed countries
?? TradeTrade?? Major commoditiesMajor commodities?? Developing versus Developed countriesDeveloping versus Developed countries
•• Growing trade of developing countriesGrowing trade of developing countries•• Trade flowsTrade flows
The presentation was prepared by Grimur Valdimarsson, director and Helga Josupeit, fishery industry officer of the Fishery Industries Division. It will start by giving some indications on the international regulatory framework within which fish trade is operating. It will describe the significant growth of aquaculture production during the past decade, while wild capture production has remained stable. Then it will show how developing countries have overtaken the developed countries with regard to both fish production and fish exports during the early 1990.
Fish trade will be discussed, by identifying the major commodities traded, the importance of foreign exchange earnings for developing countries as well as price developments.

3
Outline (cont.)Outline (cont.)
?? WTO agreementsWTO agreements?? DOHA discussionsDOHA discussions?? FISH INFOnetwork and the work of FISH INFOnetwork and the work of
FAO in the field of market FAO in the field of market informationinformation
?? Value Added fish products and Value Added fish products and changes in market structureschanges in market structures
?? ConclusionsConclusions
Agreements of the World Trade Organization (WTO) and their importance for fisheries will be discussed, by citing some examples. The ongoing round of trade negotiations, the DOHA “development round” (round no. 9) will be touched upon. One chapter of this round is dealing with the role of artisanal fisheries in international trade.
The work of FAO in the field of market information will be discussed as well as the emergence of supermarkets in the developing world and its impact on fish sales, including value added products and ready meals.
The paper will end with some concluding notes, on the future of international trade of fish and fishery products.

4
TRADE LIBERALIZATIONTRADE LIBERALIZATION
was put at the heart of the global was put at the heart of the global development agenda as laid down in development agenda as laid down in Agenda 21 of the Earth Summit on Agenda 21 of the Earth Summit on
Sustainable DevelopmentSustainable Development(Rio) (Rio)
in 1992in 1992
Increased importance of environmental concerns led the United Nations Security Council in January 1992 to bring on an international forum in Rio de Janeiro, Brazil, later that year. It became known as the Earth Summit or the Rio Summit but formally the United Nations Conference on Environment and Development (UNCED). The Earth Summit built on the 1972 UN Stockholm Conference on the Human Environment which dealt with “the protection and improvement of the human environment ……which affects the well-being of peoples and economic development throughout the world”.
The United Nations Conference on Environment and Development (UNCED) was the culmination of two years of negotiations by the Preparatory Committees (PrepComs). Five major agreements on global environmental issues were signed. Two of these, The Framework Convention on Climate Change and The Convention on Biological Diversity, were formal treaties whose provisions are binding on the parties. The other three UNCED agreements were non-binding statements on the relationship between sustainable environmental practices and the pursuit of social and socioeconomic development. Agenda 21 is a wide-ranging assessment of social and economic sectors with goals forimproving environmental and developmental impact of each. The Rio Declarationsummarizes consensus principles of sustainable development, and the Statement on Forest Principles pledges parties to more sustainable use of forest resources.

5
The Earth Summit in Rio in The Earth Summit in Rio in 1992 (Agenda 21)1992 (Agenda 21)
?? ““promote sustainable development promote sustainable development through trade liberalizationthrough trade liberalization””
?? create a system create a system ““that is nonthat is non--discriminatory, rule based, discriminatory, rule based, equitable, secure, transparent and equitable, secure, transparent and predictablepredictable””
Agenda 21 touched on the broad issues of environmental, trade, and cost-benefit relations. For example, Chapter 2 brought out the issue of "an open, equitable, secure, non-discriminatory and predictable multilateral trading system". Tariff and non-tariff barriers should be removed to allow developing countries access to markets for their export goods, opportunities can be seen particularly for agricultural products. Declining commodity prices povide reduced export earnings. Therefore, developing countries should be assisted in adopting appropriate commodity policies, and international agreements for commodity markets are supported. Diversification of export markets should be strengthened and the efforts of the Uruguay Round of the GATT talks on trade liberalization are addressed. By enhancing competition and making more efficient use of natural resources, open international trade is considered as supportive to environmental protection. National and international environmental policies "should address the root causes of environmental degradation so as not to result in unjustified restrictions on trade." Trade and environment should be made "mutually supportive" and the role of multilateral fora such as GATT, UNCTAD, etc. in dealing with trade and environment should be clarified.

6
Hunger:Hunger:840 million people still suffer from 840 million people still suffer from hunger hunger
(FAO)(FAO)
Unequal distribution of wealth:Unequal distribution of wealth:““Ten percent of the worldTen percent of the world’’s population s population
produces 70 percent of its goods and produces 70 percent of its goods and services and receives 70 percent of services and receives 70 percent of world income world income -- an average of $ 30.000 an average of $ 30.000 per person. At the other extreme, half per person. At the other extreme, half of the worldof the world’’s population lives on less s population lives on less than $ 2 a daythan $ 2 a day””
Collier and Dollar (2001) Collier and Dollar (2001)
The international community is committed to reduce hunger in the world. The World Food Summit Five Years Later (in 2002) declared: “We renew our global commitments made in the Rome Declaration at the World Food Summit in 1996 in particular to halve the number of hungry in the world no later than 2015, as reaffirmed in the United Nations Millennium Declaration. We resolve to accelerate the implementation of the WFS Plan of Action.”
Same is true regarding the widening gap between rich and poor: James Wolfensohn, President of the World Bank said
“Our primary goal in development must be to reduce the disparities across and within countries…The key development challenge of our time is the challenge of inclusion”.

7
The WTO (and its The WTO (and its predecessor,GATT) has mainly predecessor,GATT) has mainly
been concerned with ...been concerned with ...
lowering CUSTOM DUTIES lowering CUSTOM DUTIES (TARIFFS) (TARIFFS)
butbuttechnical issues are becoming ever technical issues are becoming ever
more important more important
Tariffs have been the main instrument of trade policy in the past. After the completion of the Uruguay Round (the previous round of negotiations which was completed in 1993, round no.8), average weighted import tariffs on fish products were reduced to the current 4.5% level in developed countries. This may seem quite low, but the average hides a number of very high tariffs for selected fish species and products (“tariff peaks”) as well as many cases of “tariff escalation” when processed or value added fish products get a much higher duty than unprocessed fish. Import duties in developed country markets therefore continue to present a certain barrier to advanced processing of the raw material and thus negatively effects the fishery industries in many developing countries. This also affects developed countries that stand outside the large trade blocks such as the European Union.
Import tariffs on fish and fishery products are generally higher in developing countries ant this poses a problem regarding development of more “South-South” trade. USA and Japan substantially reduced tariffs on fish products in the UR negotiation. However, there is still some way to go before they reach their bound negotiated rates of tariff. Japan negotiated a bound tariff rate (after UR in 1995) of 6.08%, but still some 7% was being applied in 1999. The USA average bound negotiated rate was 2.12%, but somewhat higher rates were applied in 1999 (2.5%). In recent years, however, technical issues have become ever more important.

8
During the 50 years of negotiations During the 50 years of negotiations to lower tariffs world trade has grown to lower tariffs world trade has grown
by 6% annuallyby 6% annually……
?? AGRICULTRUAL goods, such as AGRICULTRUAL goods, such as meat, still carry some 70meat, still carry some 70--80% tariffs 80% tariffs whereaswhereas
?? INDUSTRIAL goods, including FISH INDUSTRIAL goods, including FISH carry some 4.5% tariffscarry some 4.5% tariffs
After 50 years of trade negotiations to lower import tariffs, AGRICULTRUAL goods, such as meat, still carry some 70-80% tariffs whereas
INDUSTRIAL goods, which importantly include FISH carry some 4.5% tariffs.

9
Some production figures...Some production figures...

10
0
2 0
4 0
6 0
8 0
1 0 0
1 2 0
1 4 0
1 9 5 0 1 9 5 4 1 9 5 8 1 9 6 2 1 9 6 6 1 9 7 0 1 9 7 4 1 9 7 8 1 9 8 2 1 9 8 6 1 9 9 0 1 9 9 4 1 9 9 8 2 0 0 2
Mill
ions
A q u a c u l t u r eC a p t u r e
Fish Production (in MT) Fish Production (in MT)
FISHSTAT 2004
Worldwide fishery production continues to increase, but at lower growth rates than some years before.
With wild fish stocks increasingly being fully fished or overfished, this growth is mainly due to aquaculture production. In fact, aquaculture production grew at an average rate of 9 percent since 1970, while capture production remained relatively stable at values around 90 million tons since the Nineties.
By 2002, the share of aquaculture in total production had reached 30 percent.

11
0
2 0
4 0
6 0
8 0
1 0 0
1 2 0
1 4 0
1 9 5 0 1 9 5 4 1 9 5 8 1 9 6 2 1 9 6 6 1 9 7 0 1 9 7 4 1 9 7 8 1 9 8 2 1 9 8 6 1 9 9 0 1 9 9 4 1 9 9 8
Mill
ions
D e v e lo p in gD e v e lo p e d
Fish Production (in MT) Fish Production (in MT)
FISHSTAT 2004
The above graph shows the impressive growth of developing countries as fish producing nations. Developing countries increased their share in total fish production from 25% in 1950 to 70% at present. While developing nations, first among all China, were responsible for the almost continuous increase in world fish production, production in the developed world started to declined sharply in 1989. This decline was caused by stringent fishing quotas being applied in the North Atlantic, the disappearance of the Eastern block that contributed significantly to developed country catches, but overfishing is also an important factor. Landings from ten of the most valuable groundfish stocks (such as cods and hakes) have globally been reduced by almost 45% over the last 15 years largely due to over-fishing. This gives cause for serious concern because this overfishing is most pronounced in those countries that should have the best conditions to control their fisheries. Fish stocks are also threatened by a number of other factors such as land based pollution and global warming.

12
0
2 0
4 0
6 0
8 0
1 0 0
1 2 0
1 9 5 0 1 9 5 4 1 9 5 8 19 6 2 1 9 6 6 1 9 7 0 1 9 7 4 1 9 7 8 1 9 8 2 1 9 8 6 19 9 0 1 9 9 4 1 9 9 8
Mill
ions D e v e lo p e d
Fish Production (in MT) Fish Production (in MT)
0
2 0
4 0
6 0
8 0
1 0 0
1 2 0
1 9 5 0 1 9 5 4 1 9 5 8 19 6 2 1 9 6 6 1 9 7 0 1 9 7 4 1 9 7 8 1 9 8 2 1 9 8 6 19 9 0 1 9 9 4 1 9 9 8
Mill
ions D e v e l o p in g
FISHSTAT 2004
This graph displays the same figures as the previous slide, but illustrates better the impressive growth in production by developing countries, as well as the continuous decline in production by developed countries after 1989.

13
Some fish trade figures...Some fish trade figures...

14
International Fish Exports International Fish Exports –– 20022002(percentage by value)(percentage by value)
S h r im p1 8 %
G r o u n d f i s h1 5 %
S a lm o n8 %
O t h e r s2 5 %
T u n a9 %
C e p h a l o p o d s5 %
M o l l u s c s ( o t h e r )
6 %
F r e s h w a t e r2 %
S m a l l p e la g i c s
7 %
F i s h m e a l4 %
F is h o i l1 %
Total export value:US$ 58 billionFISHSTAT 2004
Shrimp is the most important fishery commodity traded internationally with about 18% share in value terms. It is interesting to note that this share went down from 20% over the past 20 years, despite the substantial increase in supply of shrimp products to the world market. Groundfish is another important product group with 15% of trade. Tuna is third with 9%. The relative importance of salmon as an export item has increased over the past years, to reach 8% in 2002, up from 5% in the mid 1990s, as a result of the growing salmon farming industry in Norway and Chile.

15
InternationalInternational FishFish TradeTrade -- 20022002I m p o r t s
U S A1 9 %
J a p a n2 2 %
D e v e lo p in g1 8 %
E U ( 1 5 )3 3 %
O t h e r s8 %
E x p o r t s
E U ( 1 5 )2 1 %
O t h e r s2 2 %
J a p a n1 %
U S A6 %
D e v e l o -p i n g5 0 %
FISHSTAT 2004
Fish imports reached a new record of more than US$ 61 billion in 2002. Developed countries accounted for about 82 percent of the total value of imports of fish products. Japan was the largest importer of fish and fish products, accounting for some 22 percent of the world import value in 2002. Japanese fishery imports (US$ 13.6 billion) accounted for some 4 percent of its total merchandise trade. The United States, besides being the world's fourth largest exporting country, was the second largest importer, with imports remaining around US$ 10 billion. In 2002, the European Union further increased its dependency on imported fish by 10 percent since 2000. Spain was the world’s third largest importer of fish and fish products valued at US$ 3.9 billion, followed by France (US$ 3.2 billion), Italy (US$ 2.9 billion), Germany (US$ 2.4 billion) and the United Kingdom (US$ 2.3 billion). Preliminary data indicate that in 2003 the major fish markets increased their imports by about 10 percent.

16
Net exports of food items by Net exports of food items by developing countriesdeveloping countries
- 5
0
5
1 0
1 5
2 0
Fish
Co
ffee
Banana
Cocoa
Sugar
Tea
Rice
Meat
U S $ 1 0 0 0 m i l l i o n 1 9 8 2
1 9 9 2
2 0 0 2
FISHSTAT and FAOSTAT 2004
For developing countries fish is a very important foreign exchange earner. Net export earnings was US$ 17 800 million in 2002, which compares with US$ 11 000 million in 1992, and only US$ 4 000 million in 1982. In comparison net exports for coffee have been going down during this period from US$ 7 000 million to US$ 5 000 million. Other commodities, such as bananas tea and cocoa are also of much less importance than fish for foreign exchange earnings. Net export earnings from all these ‘classical’ commodities of developing countries together provide less income than fish products alone.

17
0
5
10
15
20
25
30
35
197619771978197919801981198219831984198519861987198819891990199119921993199419951996199719981999200020012002
US$
x 1
000
mill
ion
Developed Developing
Fish Commodities Fish Commodities -- Export Export
FISHSTAT 2004
The figure shows that in value terms, developing and developed countries have roughly the same share in world fish exports, with developing countries exceeding exports of developed countries in recent years. The total value of world exports was US$ 58000 million in 2002 and is expected to grow even further in coming years. It should be noted, that while trade expanded strongly in 1970s and 1980s, total fish trade has come to a halt in recent years.

18
Trade Flows 2002 Trade Flows 2002 (in million US$)(in million US$)
Developed Developing
Developed Developing
Exports
Imports
24600 5000
3800
25000
Calculations based onCOMEXT 2004
The above slide shows the four main trade flows among developed and developing countries. Developed countries export about US$ 24,6 billion worth of fish to other developed countries while exports to developing countries, mainly low priced small pelagics, were only US$ 3,8 billion. On the other hand, developing countries exported fish for US$ 25 billion to developed countries, while intra-developing countries trade were only US$ 5 billion.

19
MEAT AND SEAFOOD PRICE MEAT AND SEAFOOD PRICE INDICES INDICES
((100 = 1997100 = 1997--1999)1999)
0.4
0.6
0.8
1
1.2
1.4
1.6
1.8
2
1991-0
1
1992-0
1
1993-0
1
1994-0
1
1995-0
1
1996-0
1
1997-0
1
1998-0
1
1999-0
1
2000-0
1
2001-0
1
2002-0
1
2003-0
1
2004-0
1
PigBovineSalmonCod
FISHSTAT and FAOSTAT 2004
This slide shows price trends for various animal protein products, as collected by FAO. Bovine and Pig prices have declined significantly over the last decade as well as the price of salmon. Interestingly, cod has maintained its price over this period or even shown growth. The price indices are calculated……………AND DO NOT TAKE INFLATION INTO ACCOUNT……

20
TheThe ratio ratio ofof thethe first hand first hand priceprice to to thethe retailretail priceprice
01 02 03 04 05 06 07 08 09 0
1 0 0
F e b -9 2A u g -9 2F e b -9 3A u g -9 3F e b -9 4A u g -9 4F e b -9 5A u g -9 5F e b -9 6A u g -9 6F e b -9 7A u g -9 7F e b -9 8A u g -9 8F e b -9 9A u g -9 9F e b -0 0A u g -0 0F e b -0 1A u g -0 1F e b -0 2A u g -0 2F e b -0 3
P o r k U S A
B e e f U S A
W h o l e s a l m o nF r a n c eC O D U K
Blue Planet 2004
The above graph compares the retail price to the producer price. Cod fishermen only receive about 21% of the final retail price, which means that the price of cod is multiplied by 5 on the distribution chain. This share for cod increased over the past 10 years, while all other primary producers (salmon farmers in Norway, beef and pork producers in USA) now get a lower share of the final price than 10 years ago. This decline in the position of producers could be due to concentration of retailers thus strengthening their bargening power .

21
WTO AgreementsWTO Agreements

22
WTO Agreements of WTO Agreements of relevance for fisheriesrelevance for fisheries
?? Agreement on Sanitary and Agreement on Sanitary and Phytosanitary Measures (SPS)Phytosanitary Measures (SPS)
?? Agreement on Technical Barriers to Agreement on Technical Barriers to Trade (TBT)Trade (TBT)
?? Agreement on Subsidies and Agreement on Subsidies and Countervailing MeasuresCountervailing Measures
?? Agreement on Import Licensing Agreement on Import Licensing ProceduresProcedures
?? Agreement on AntiAgreement on Anti--DumpingDumping?? Agreement on Rules of OriginAgreement on Rules of Origin?? Dispute SettlementDispute Settlement
The agreements of relevance for fisheries are:Agreement on Sanitary and Phytosanitary Measures (SPS)
Agreement on Technical Barriers to Trade (TBT)
Agreement on Subsidies and Countervailing Measures
Agreement on Import Licensing Procedures
Agreement on Anti-Dumping
Agreement on Rules of Origin
Dispute Settlement
Tariff reduction
In the following text, we will give examples for the more important agreements, starting with the market access agreement, which aims at reducing tariffs.

23
Agreement on Sanitary and Agreement on Sanitary and Phytosanitary issues (SPS)...Phytosanitary issues (SPS)...
?? Right of Members to apply Right of Members to apply measures they deem necessary to measures they deem necessary to protect human, animal and plant protect human, animal and plant life and health life and health
?? Should not be a disguised Should not be a disguised restriction on international traderestriction on international trade
?? Protection levels should not be more Protection levels should not be more trade restrictive than required to trade restrictive than required to provide provide ““appropriate level of appropriate level of protectionprotection”” APLPAPLP
The Sanitary and Phytosanitary Agreement (SPS) requires that measures be based on the risks to humans, animal and plant life and health using international risk assessment techniques. The risk assessments should take into account the available scientific evidence, the relevant processes and production methods, the inspection/sampling/ testing methods the prevalence of specific illnesses etc. Protection levels should not be more trade restrictive than required to provide an “appropriate level of protection” which also has been termed “acceptable risk”. The Agreement on Sanitary and Phytosanitary issues(SPS) has been set up to avoid sanitary standards being operated in such a way as to constitute distortion or barriers to trade.
To secure safety of food products new regulations based on HACCP (Hazard Analysis and Critical Control Point) have spread worldwide, to the majority of developed countries and to developing countries. The new regulations with regard to quality control and assurance that have been adopted by major importing countries are important factors influencing the fish processing industry. The USA adopted mandatory seafood HACCP regulations in December 1997, which apply to both domestic and imported products. In the European Union, the HACCP system was adopted in 1994 as a Directive (491/93 EEC) to be applied at industry level. Since 1992 Canada has applied a Quality Management Program (QMP), the first mandatory food inspection programme in the world based on HACCP principles. Japan enforces similar standards on fish and fish products under the Food and Sanitation Law. The use of HACCP-based systems is voluntary for domestic production but mandatory for exports to the EU and the United States.
Under the sanitary and phytosanitary (SPS) agreement, all member countries should now be much betterinformed about the steps other countries are taking to protect their animal and plant health and the safety of human food. In this context, SPS measures are defined very widely, and include laws, regulations and any other requirements a country uses to protect animal, plant or human health from the entry, establishment or spread of pests and diseases, or to protect human life or health from unsafe food. The SPS agreement requires that under certain conditions members must notify proposed SPS measures to the WTO secretariat. The secretariat then circulates that information to all other members, to give them a chance to learn about the proposal and make submissions if desired. Member countries must notify SPS measures where: A recognized international standard does not exist, or the proposed regulation is not substantially the same as an international standard (in this context international standards are those developed by the OIE for animal health and diseases and the CODEX Alimentarius Commission for food safety) and the regulation may have a significant effect on the trade of other members.

24
Agreement on Technical Agreement on Technical Barriers to Trade (TBT)...Barriers to Trade (TBT)...
?? The Technical Barriers to Trade The Technical Barriers to Trade Agreement (TBT) ensures that Agreement (TBT) ensures that members do not use technical members do not use technical regulations or standards as disguised regulations or standards as disguised measures to protect domestic measures to protect domestic industries from foreign competition. industries from foreign competition.
?? LabellingLabelling disputes disputes
?? Testing proceduresTesting procedures
The Technical Barriers to Trade Agreement (TBT) ensures that members do not use technical regulations or standards as disguised measures to protect domestic industries from foreign competition. The TBT agreement has the objective of encouraging development of international standards and conformity assessment systems as well as eliminating unnecessary obstacles to trade without undermining the legitimate domestic regulations or standards regarding such aspects of public policy as health and consumer and environmental protection. If there are two or more ways to achieving the same objective the least trade restrictive alternative should be selected. Again, the agreement emphasizes the use of international standards wherever possible.
The TBT is also intended to reduce the extent to which technical regulations and standards operate as barriers to market access, primarily by encouraging the development of international standards. International standards are expected to reduce the obstacles to international trade that can be created by the proliferation of standards in different countries.
Goods imported from other members must be accorded no less favourable treatment than goods produced domestically. Technical regulations shall only be used where there is a case for their use and less trade restrictive measures should be used if circumstances change so that regulations are no longer appropriate.
The TBT Agreement recognises that countries have the right to establish protection at levels they consider appropriate, and that they should not be prevented from taking measures necessary to ensure those levels of protection are met. The agreement therefore encourages countries to use international standards where appropriate, but it does not require them to change their levels of protection as a result of standardisation.

25
Some examples of tariffs and Some examples of tariffs and WTO agreements issues..WTO agreements issues..

26
Tariff escalation for cod: EUTariff escalation for cod: EU
?? Cod Cod –– fresh and frozenfresh and frozen 15%15%?? Cod fillets Cod fillets –– fresh and frozen fresh and frozen 18%18%?? Cod fillets dried, saltedCod fillets dried, salted 20%20%?? Cod dried, saltedCod dried, salted 13%13%?? Cod fillets Cod fillets –– batteredbattered 25%25%
TARIC 2004
WTO membership includes as a pre-requisite tariff reduction. Trade tariffs have been the principal means of protecting domestic producers against international competition. Taking the EU as an example, some 11% of nominal tariff still exists for fisheries products. Because of various tariff concessions (ACP (Africa, Caribbean and Pacific) and GSP (General System of Preferences)) the average tariff on fish products is actually 3%. The EU is negotiating bilateral agreements on tariff exemptions with various countries, similar to the ones that exist with Iceland, Norway, Morocco and Mexico.
This above example shows some tariff escalations for cod – whole cod has a general tariff of 15%, but in fillet form it goes up to 18% and reaches the top when this fillet is battered or breaded.

27
Tariff escalation for tuna: EUTariff escalation for tuna: EU
?? EU tariffs are 18% for frozen whole tuna and EU tariffs are 18% for frozen whole tuna and 24% for tuna loins and canned tuna24% for tuna loins and canned tuna
But there are some special agreements..But there are some special agreements..
?? Asian Caribbean Pacific (ACP ) countries: 0% Asian Caribbean Pacific (ACP ) countries: 0% duty on all seafood products duty on all seafood products
?? GPSGPS--Drugs agreement set certain duty free Drugs agreement set certain duty free quotas for canned tuna and tuna loins from quotas for canned tuna and tuna loins from Andean Community and Central AmericaAndean Community and Central America
The listed EU tariffs for frozen whole tuna are 18% ( but this tariff has been suspended for many years and no duty has to be paid on frozen whole tuna imports) and 24% for tuna loins and canned tuna. There are several tariff exemptions:
ACP countries (Africa, Caribbean and Pacific countries) have enjoyed a 0% duty for fishery products since the beginnings of the EU. The most recent ACP-EU agreement, signed in June 2000, called for the removal of trade barriers and granted certain concessions to the ACP countries. Canned tuna received duty-free status. In a move to fight against illegal drugs from Latin America, the EU under a special Drugs Agreement, grants duty free quotas for canned tuna and tuna loins from Central American countries the Andean Community.
EU imports of tuna from the Philippines and Thailand have been historically subject to a 24% tariff. However, the EU tariff applied to canned tuna imports from Thailand, the Philippines and Indonesia has been lowered to 12% for a quota of 25 000 MT as from 1 July 2003.

28
SPS agreement applied by SPS agreement applied by EU: antibioticsEU: antibiotics
?? Detention of shrimp with antibiotics Detention of shrimp with antibiotics (mostly chloramphenicol) in EU(mostly chloramphenicol) in EU•• China (mainland and Taiwan, province of China (mainland and Taiwan, province of
China) China) •• ThailandThailand•• IndonesiaIndonesia•• India India •• PhilippinesPhilippines•• Viet NamViet Nam•• BangladeshBangladesh•• and others and others
During the past two years, many Asian countries had problems with antibiotics (mainly chloramphenicol) found in their seafood, mainly in shrimp to the EU. This detention ( and destruction) of shrimp prompted exporters to divert their products to other markets. The ban on Chinese export shrimp to the EU was lifted in October 2004. Exporters and traders in Asian countries are confident that the EU will soon change their policy by allowing some chloramphenicol in shrimp and other aquaculture products. It is anticipated that shrimp containing these banned antibiotics will no longer be destroyed, but sent back to the country of origin or a country willing to buy such products.

29
Examples of TBT/SPS issuesExamples of TBT/SPS issues
?? Country of origin labeling in USA (COOL)Country of origin labeling in USA (COOL)?? TEDsTEDs (Turtle excluding devices) for (Turtle excluding devices) for
catching shrimpcatching shrimp?? TunaTuna--dolphin issue. The dolphin issue. The certificiationcertificiation that that
dolphins are not killed in fishing for tunadolphins are not killed in fishing for tuna?? Trade description of scallops: SaintTrade description of scallops: Saint--
Jacques Jacques vsvs ppéétoncletoncle?? Australia: Banning imports of salmon from Australia: Banning imports of salmon from
Canada due to possible fish disease agentsCanada due to possible fish disease agents?? Trade description of sardines: Peru Trade description of sardines: Peru vsvs EUEU
?? SardinellaSardinella pilcharduspilchardus vs. Sardinops vs. Sardinops sagaxsagax
Country of Origin Labeling (termed COOL) law went into effect in the USA on 30 September 2004 but the US Department of Agriculture interim final rule delays the enforcement to 4 April 2005. All but processed seafood on the US market is subject to this law. DEFINITION?? Retailers will need to specify the country their seafood comes from and how it is produced (wild – cultured).
In 2004, the US State Department declined to authorize shipments of Thai wild, trawl-caught shrimp unless a prove were supplied to the effect that the harvesting practices pose no threat to sea turtles. Thailand joins Nigeria, Venezuela and Indonesia on the list of previously certified countries that are no longer able to ship wild, trawl-caught shrimp to the US market under requirements set by Section 609 of U.S. law, which banned the importation of shrimp products harvested in a way that could harm various sea turtle species.
Similar legislation passed in the USA in 1988 banned imports of tuna from any country unless the fishing techniques effectively prevent killing of dolphins that are frequently associated with schools of tuna. Mexican fishermen exceeded the kill rate, deemed acceptable by the US, in 1989, which led to a ban on imports into the USA in 1990. The US Commerce Department proposed to rewrite this law in 2004 to allow tuna caught with nets to be labelled dolphin-safe if observers certified that no dolphins were killed or seriously injured in the process. Dolphins commonly swim with schools of tuna, and fisheries in Mexico and South America encircle the popular mammals with nets to hone in on their prey. However, in September 2004, this move by the Commerce Department was blocked by a federal judge, so Mexican tuna still cannot be exported to the USA.

30
WTO definition of dumpingWTO definition of dumping
?? three methods to calculate a three methods to calculate a productproduct’’s s ““normal valuenormal value””. . •• The main one is based on the price in The main one is based on the price in
the exporterthe exporter’’s domestic market. s domestic market. •• the price charged by the exporter in the price charged by the exporter in
another country, another country, •• or a calculation based on the or a calculation based on the
combination of the exportercombination of the exporter’’s production s production costs, other expenses and normal profit costs, other expenses and normal profit margins. margins.
Anti-dumping measures are meant to protect local industries from imports at unfairly low prices, so called dumping prices. Article VI of the GATT provides for the right of contracting parties to apply anti-dumping measures, i.e. measures against imports of a product at an export price below its “normal value” (usually the price of the product in the domestic market of the exporting country) if such imports cause injury to a domestic industry in the territory of the importing contracting party. WTO defines three methods to calculate a product’s “normal value”. The main one is based on the price in the exporter’s domestic market, the price charged by the exporter in another country, or a calculation based on the combination of the exporter’s production costs, other expenses and normal profit margins.

31
AntiAnti--dumping: Shrimp USAdumping: Shrimp USA
?? Against countries selling at a price Against countries selling at a price below in domestic (US) production below in domestic (US) production pricesprices
?? Obvious difference between the US Obvious difference between the US definition of dumping and the WTO definition of dumping and the WTO definitiondefinition
?? Complaint likely to come soonComplaint likely to come soon
The US shrimp market is significantly supplied by domestic sources, mostly from capture fisheries. The rise in imports from competitive low-cost producers from aquaculture operations, has led to a fall in shrimp prices, with US producers becoming less competitive. This has led US shrimp producers to field accusations of dumping by foreign producers, which as a matter of fact were six of the top seven shrimp exporters (only Mexico excluded). This complaint went against countries selling at a price below the domestic (US) production prices. There is an obvious difference between the US definition of dumping and the WTO definition. As a result, in all likelihood, the countries involved will file a complaint with the WTO, but in the meantime, before the case is finally settled (this can take 2 years or more) major disruptions can be expected on both the US and international markets. In the short term, prices to consumers will rise in the US as supplies go down and duties are imposed. Internationally, supplies directed away from the US market will lead to falling prices elsewhere.

32
Resulting US tariffs on shrimp...Resulting US tariffs on shrimp...
?? Countries affected:Countries affected:•• BrazilBrazil up to 67.8%up to 67.8%•• EcuadorEcuador 6.08%6.08%--9.35%9.35%•• IndiaIndia 3.56%3.56%--27.46%27.46%•• ThailandThailand 5.56%5.56%--10.25%10.25%•• ChinaChina 27.9%27.9%--113%113%•• Viet NamViet Nam 4.1%4.1%--25.8%25.8%
The US Department of Commerce announced tariffs on shrimp imports for the above six countries, which range between 0%-113%. The final decision is coming soon – by early 2005 for Brazil, Ecuador, India and Thailand. For China and Viet Nam the decision was taken in late November 2004. Since these anti dumping duties were announced, discussions were held bilaterally between the USA and the affected countries in an attempt to have the anti-dumping tariffs reduced. As usual in these cases, some products are likely to find their way into the market at lower tariffs by transshipment through a country not affected by these anti-dumping tariffs. All countries involved are lobbying in an attempt to get a tariff reduction.
However, there are ways around the tariffs. Dusted and battered shrimps were excluded from the scope of the investigation, which means that no duties will be applied to shrimp in this form. The definition of dusted shrimp is “a shrimp-based product that (1) is produced from fresh (or thawed-from-frozen) and peeled shrimp; (2) to which a 'dusting' layer of rice or wheat flour of at least 95 percent purity has been applied; (3) so that the entire surface of the shrimp flesh is thoroughly and evenly coated with the flour; and (4) the non-shrimp content of the end product constitutes between 4 to 10 percent of the product's total weight after being dusted, but prior to being frozen; and (5) is subjected to IQF freezing immediately after application of the dusting layer. Since dusting accounts for as little as 4% of product weight, the dusted shrimp exclusion provides one avenue for Chinese and Indian producers to ship shrimp to the U.S., for applications that involve breading or further processing.
If these six countries have the most to loose from this trade row, the roughly 13,000 U.S. Gulf Coast and southern Atlantic shrimpers have the most to gain. Under a highly unusual U.S. law passed in 2000, they are eligible to get the proceeds of any duties slapped on imports. The World Trade Organization has declared this legislation illegal and has even gone so far as to declare that major

33
99thth Round: Doha Agenda: Round: Doha Agenda: The Development RoundThe Development Round
34
Market access for Market access for nonnon--agricultural products agricultural products
(including fish)(including fish)
GOAL OF THE DOHA ROUND:GOAL OF THE DOHA ROUND:?? Reduce or eliminate import tariffsReduce or eliminate import tariffs?? Reduce tariff escalation Reduce tariff escalation
(value(value--added)added)?? Protect special needs of developing Protect special needs of developing
countriescountries?? Capacity building on negotiation issuesCapacity building on negotiation issues
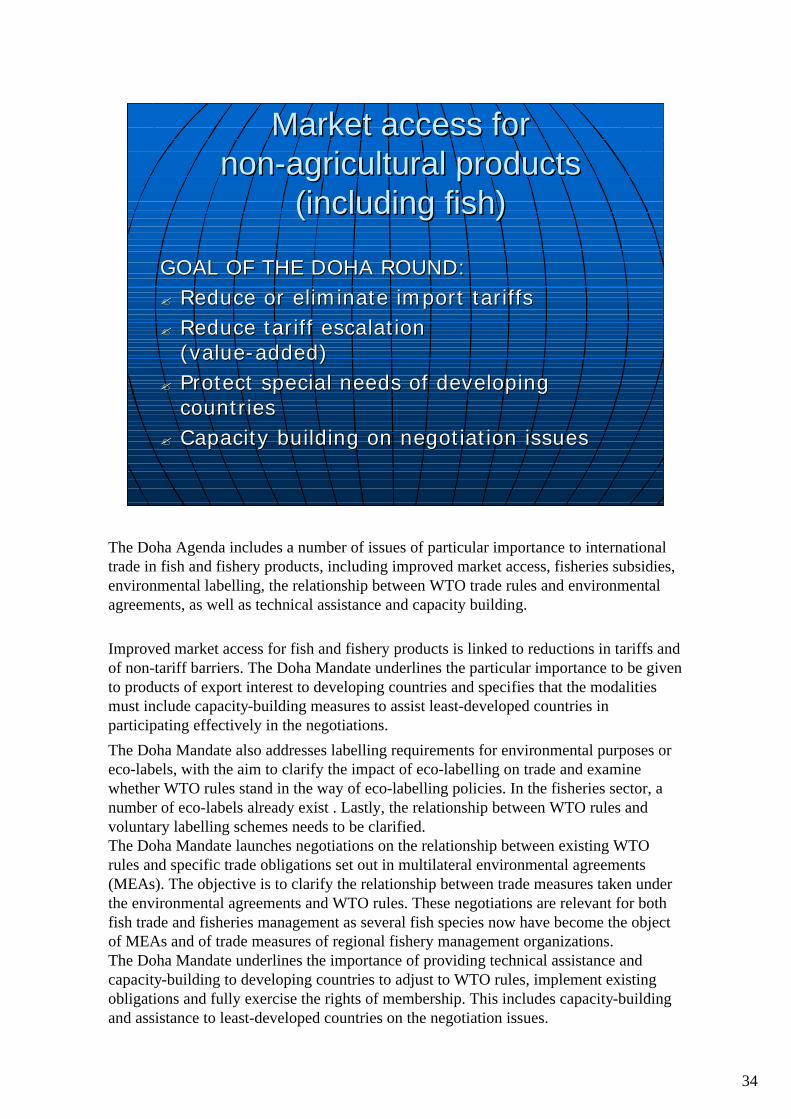
The Doha Agenda includes a number of issues of particular importance to international trade in fish and fishery products, including improved market access, fisheries subsidies, environmental labelling, the relationship between WTO trade rules and environmental agreements, as well as technical assistance and capacity building.
Improved market access for fish and fishery products is linked to reductions in tariffs and of non-tariff barriers. The Doha Mandate underlines the particular importance to be given to products of export interest to developing countries and specifies that the modalities must include capacity-building measures to assist least-developed countries in participating effectively in the negotiations.
The Doha Mandate also addresses labelling requirements for environmental purposes or eco-labels, with the aim to clarify the impact of eco-labelling on trade and examine whether WTO rules stand in the way of eco-labelling policies. In the fisheries sector, a number of eco-labels already exist . Lastly, the relationship between WTO rules and voluntary labelling schemes needs to be clarified. The Doha Mandate launches negotiations on the relationship between existing WTO rules and specific trade obligations set out in multilateral environmental agreements (MEAs). The objective is to clarify the relationship between trade measures taken under the environmental agreements and WTO rules. These negotiations are relevant for both fish trade and fisheries management as several fish species now have become the object of MEAs and of trade measures of regional fishery management organizations. The Doha Mandate underlines the importance of providing technical assistance and capacity-building to developing countries to adjust to WTO rules, implement existing obligations and fully exercise the rights of membership. This includes capacity-building and assistance to least-developed countries on the negotiation issues.

35
Fish processing in Fish processing in developing countriesdeveloping countries
?? LARGE POTENTIAL FOR LARGE POTENTIAL FOR EMPLOYMENT CREATION (NOT THE EMPLOYMENT CREATION (NOT THE LEAST FOR WOMEN)LEAST FOR WOMEN)
?? TODAY, TARIFF ESCALATION TODAY, TARIFF ESCALATION HINDERS PRODUCTION OF VALUEHINDERS PRODUCTION OF VALUE--ADDED PRODUCTS ADDED PRODUCTS
Fish processing has not escaped the effects of globalization. Significant quanties of whole frozen fish are now transported from developed countries to low wage areas for thawing, processing and packaging to be sold on the international market. Reduced tariff escalation would make new opportunities for developing countries in producing value-added fishery products.

36
Are fish exports bad for developing Are fish exports bad for developing countries?countries?

37
Impact of Fish Trade on Food Security: Impact of Fish Trade on Food Security: 11 countries 200211 countries 2002--20042004
?? Main Findings were Main Findings were •• international trade in fishery products has had a international trade in fishery products has had a
positive effect on food security through export positive effect on food security through export earningsearnings
•• international trade has not had a detrimental international trade has not had a detrimental effect on food security in the form of fish as effect on food security in the form of fish as food. food.
•• sustainable resource management practices are sustainable resource management practices are a necessary condition for sustainable a necessary condition for sustainable international trade. international trade.
With the financial help from Norway, FAO has conducted a comprehensive study on fish exports from developing countries. The study examined the effect of international fish trade on food security in developing countries that have developed significant fish export industries. The main finding is that international trade in fishery products has had a positive effect on food security in the countries. Production and trade statistics also indicate that international trade has not had a negative effect on food security in the form of fish as food. Increases in production, coupled with imports and exports of fishery products, has ensured the continued availability of fish for domestic supply in Low Income Food Deficit Countries (LIFDCs). The study, however, cautions that sustainable resource management practices are often lacking and emphasises that this is a necessary condition for sustainable international trade. Market demand needs to be coupled with an effective resource management policy.

38
Helping developing countries with Helping developing countries with fish trade...fish trade...
For many decades, FAO has been involved in helping developing countries with improving their trade performance. Various projects to that effect have been carried out in the developing regions with the following objectives:
•to contribute to the development and modernization of the fisheries sector;
•to contribute to more balanced supplies of fishery products to the Contracting parties;(WHAT CONTRACTING PARTIES??)
•to make the best use of export opportunities;
•to promote technical and economic cooperation among contracting parties.
Dealing with sanitary requirements of the importing countries.....

39
The FISH INFOnetwork The FISH INFOnetwork (FIN) consists of 7 independent intergovernmental organisations as well as FAO GLOBEFISH, a unit situated in the Fisheries Department of the Food and Agriculture Organisation of the UN (FAO).
Created to assist the fishery sector particularly in developing countries and countries in transition, the network provides services to private industry and to governments.
The execution of multilateral and bilateral projects is one of the main activities of the network. It is also widely known for its range of publications and periodicals as well as for the organisation of international conferences, workshops and training seminars.FIN has more than 70 full time staff members and works with over 100 additional international consultants in all the fields of fisheries. 50 national governments have signed international agreements with the different FIN services and are using the expertise of these services to develop the fishery sector worldwide.GLOBEFISH (OECD countries)INFOPESCA (South and Central America), INFOFISH (Asia and Pacific region), INFOPECHE (Africa), INFOSA (Southern African suboffice of INFOPECHE), INFOSAMAK (Arab countries) EUROFISH (Eastern and Central Europe) INFOYU (China).

40
FIN MagazinesFIN Magazines
FIN publishes regular magazines, such as INFOPESCA International (in Spanish), INFOFISH International (in English) and INFOSAMAK Magazine (in Arabic, French and English). These magazines cover all main issues of world fish trade.

41
Price Reports and Market Price Reports and Market AnalysisAnalysis
GLOBEFISH issues Price Reports (European Fish Price report), market studies (called GLOBEFISH Research Programme) and a yearly analysis of the world fish market (GLOBEFISH Highlights)

42
FAO GLOBEFISH WebpageFAO GLOBEFISH Webpage
www.globefish.org gives the most up-dated analysis of industry issues, and market reports. It also gives direct access to regulatory items on the web.

43
Value additionValue addition-- the future?the future?

44
Modern working environment has substantially reduced the time for food preparation “at home” in the industrialized countries. The above graph shows that this time went down from 2.5 hours in the 1930s to 15 minutes at present. The forecast is that this will further be reduced to 8 minutes in the year 2020. This development is the main driver behind the increasing attention of the food industry and the retail sector to produce ready-meals and in that respect fish is no exception.
45
Value Addition...Value Addition...
GLOBEFISH has recently issued a study on seafood value addition, which in some detail describes various products prepared from fish. In addition it gives some analysis of the problems encountered by the fish processing industry with the preparation of ready-meals and other value-added products.

46
In addition to the increasing participation of women in the workplace resulting in less time being spent on food preparation in the home, the emerging dominance of supermarkets in retail food distribution has put its mark on the seafood market in recent years. This trend has been particularly noticeable for developed countries, but the above graph shows how supermarkets are also increasing their share in food sales in developing countries.

47
ConclusionConclusion
?? Fish production continues to growFish production continues to grow?? Developing represent 70% of Developing represent 70% of
production (by volume)production (by volume)?? 38% of fish production enters 38% of fish production enters
international trade (by value)international trade (by value)?? China is the main exporting country, China is the main exporting country,
overtaking Thailand in 2003. overtaking Thailand in 2003.
Fish production worldwide continues to grow, with aquaculture being the main source of expansion.
Developing countries overtook developed countries in the mid-1990s as main producers of fishery products and are now responsible for some 70% (by volume) of global production.
Fish is one of the most traded food items, with 38% (by value) of the production entering international trade. This share, however, has been surprisingly stable over the past twenty years or so.
China is the main exporting country overtaking Thailand in 2003.

48
Conclusion (cont.)Conclusion (cont.)
?? Shrimp is the main commodity trade with Shrimp is the main commodity trade with 18% of total value. 18% of total value.
?? NetNet--export earnings are very important export earnings are very important source of income for developing countries. source of income for developing countries.
?? Fish could be losing competitiveness when Fish could be losing competitiveness when compared to other animal protein.compared to other animal protein.
?? IntraIntra--developing countries is very limited developing countries is very limited at US$ 5 billionat US$ 5 billion
Shrimp is the main commodity trade with 18% of total value. Net-export earnings are very important source of income for developing countries.
Fish could be losing competitiveness when compared to other animal protein. Fish prices increase by 10% before reaching the final consumer, while for other animal protein producers receive a higher share of the final price. (IS THIS NOT TO SIMPLISTIC????) COST COULD BE LOWER FOR FISH THAT OTHER ANMAL PROTEIN PRODUCERS ECT.
The trade flows are from developing countries to developed countries, and among developed countries. Intra-developing countries is very limited at US$ 5 billion, but could increase in the near future.