grocery bag bans and foodborne illness jonathan …...1 grocery bag bans and foodborne illness...
TRANSCRIPT
1
Grocery Bag Bans and Foodborne Illness
Jonathan Klick
Joshua D. Wright!
August 15, 2012
Abstract
Recently, many jurisdictions have implemented bans or imposed taxes upon plastic grocery bags on environmental grounds. Plastic bags are thought to endanger marine animals and add to litter. San Francisco County was the first major US jurisdiction to enact such a regulation, implementing a ban in 2007 and extending it to all retailers in 2012. There is evidence, however, that reusable grocery bags, a common substitute for plastic bags, contain potentially harmful bacteria, especially coliform bacteria such as E. coli. We examine deaths and emergency room admissions related to these bacteria in the wake of the San Francisco ban. We find that both deaths and ER visits spiked as soon as the ban went into effect. Relative to other counties, deaths in San Francisco increase by 50-100 percent, and ER visits increase by a comparable amount. Subsequent bans by other cities in California appear to be associated with similar effects.
! Klick, Professor of Law, University of Pennsylvania School of Law; Wright, Professor, George Mason University School of Law and Department of Economics. We thank Natalie Hayes and Elise Nelson for excellent research assistance.

2
Introduction
In an effort to reduce litter and protect marine animals, jurisdictions across the globe are considering banning plastic grocery bags. In the US, California leads the way. San Francisco enacted a county-wide ban covering large grocery stores and drug stores in 2007. It extended this ban to all retail establishments in early 2012. Los Angeles followed suit in 2012, as did a number of smaller cities throughout the state. Some municipalities have imposed taxes on the bags rather than implement bans. These bans are designed to induce individuals to use reusable grocery bags, in the hope that a reduction in the use of plastic bags will lead to less litter. Recent studies, however, suggest that reusable grocery bags harbor harmful bacteria, the most important of which is E. coli. If individuals fail to fastidiously clean their reusable bags, these bacteria may lead to contamination of the food transported in the bags. Such contamination has the potential to lead to health problems and even death. We examine the pattern of deaths from intestinal diseases generally and emergency room visits for E. coli related illness in particular around the implementation of the San Francisco County ban in October 2007. We find that deaths increase by 50-100 percent relative to California’s other counties. We find comparable changes in emergency room visits. This suggests that the plastic bag ban generated serious public health problems. Examination of other California bans yields similar results. Using standard estimates of the statistical value of life, we show that the health costs associated with the San Francisco ban swamp any budgetary savings from reduced litter. This assessment is unlikely to be reversed even if fairly liberal estimates of the other environmental benefits are included. We provide details about the motivation for and the provisions of the San Francisco ban in Section 2. We discuss the evidence regarding the health risks of reusable bags in Section 3. Section 4 provides our estimates of the effect of the San Francisco ban, and Section 5 provides a cost benefit analysis. Section 6 concludes. 2. Grocery Bag Bans
In 2007,1 San Francisco adopted the Plastic Bag Reduction Ordinance (“PBRO”) prohibiting the distribution of non-compostable plastic checkout bags by supermarkets with more than $2 million in annual gross sales and by pharmacies with at least five 1 The ban went into effect on October 20, 2007.

3
locations within San Francisco. The PBRO amended the San Francisco Environmental Code to require the affected stores to distribute only compostable plastic, recyclable paper, or reusable bags at checkout. The PBRO cites San Francisco County’s duty to reduce the environmental impact of plastic checkout bags both locally and more broadly. The ordinance attributes the deaths of over 100,000 marine animals per year to plastic entanglement and states that over 12 million barrels of oil are required to produce the plastic bags used in the United States annually. The PBRO favorably references a bag tax in Ireland, and claims the Irish ordinance has led to a 90% reduction in plastic checkout bag usage. In addition to prohibiting the distribution of non-compostable plastic checkout bags, the PBRO regulates the distribution of compostable plastic bags, recyclable paper bags, and reusable bags. The PBRO provides that a compostable plastic bag must meet American Society for Testing and Materials standards for compostability by a recognized verification entity, and must display the terms “Green Cart Compostable” and “Reusable” in a highly visible manner on the outside of the bag. The PBRO further provides that any recyclable paper bag distributed by a covered store at checkout must: contain no old growth fiber, be 100% recyclable, contain at least 40% post-consumer recycled content, and display “recyclable” and “reusable” in a highly visible manner on the outside of the bag. The PBRO also requires that reusable bags be made of cloth or other machine washable fabric, or made of durable plastic at least 2.25 mils thick. Violation of the PBRO results in a fine of up to $100 for the first violation, $200 for the
second violation, and $500 for each subsequent violation in a given year. The ordinance also contemplates the imposition of administrative penalties equal to the fines. The City Attorney may seek injunctive relief or civil penalties of up to $200 for the first violation, $400 for the second violation, and $600 for each subsequent violation in a given year. In February 2012, the San Francisco Board of Supervisors expanded the non-compostable plastic checkout bag ban to cover all retail and food establishments in San Francisco County. Effective October 1, 2012, stores must charge a minimum of $0.10 for any bag provided to customers. The stores must list the bag charge separately on each customer’s receipt. The mandatory $0.10 charge does not apply to transactions paid for via food stamps or other government aid programs. The expanded ordinance also details additional requirements for bags to be designated as “reusable.” As of October 1, 2012, reusable bags must have a usable life greater than 125 uses, and be capable of carrying at least 22 pounds over a distance of at least 175 feet. Furthermore, reusable bags must be durable enough to be washed and disinfected

4
at least 100 times. Because the usable life requirement exceeds the number of washes requirement, the ordinance assumes the bag will not be washed after every use. Several other California municipalities banned plastic bags in the two years after San Francisco,2 including the City of Malibu, the Town of Fairfax, and the City of Palo Alto. Malibu’s ordinance prohibits retail establishments (including grocery stores, pharmacies, liquor stores, convenience stores, and any store selling food, clothing, or personal items) from providing any plastic checkout bags (regardless of compostability) to a customer. Stores may provide recyclable paper bags, as well as single item plastic bags. The ordinance does not include any stipulated penalties. In the Town of Fairfax, the plastic bag ordinance provides that all retail establishments may distribute only recyclable paper bags or reusable bags. The penalty for distributing a prohibited bag is $100 for the first offense, up to $200 for a second offense, and $500 for each subsequent offense in a given year. Palo Alto’s plastic bag ordinance prohibits supermarkets with at least $2 million in annual gross revenue from distributing anything other than recyclable paper bags or reusable bags. Violators are subject to a penalty not greater than $250 for the first two offenses. Three or more violations constitute a misdemeanor, which allows for fines up to $1,000. Table 1 lists the grocery bag bans in California.3
Table 1: Grocery Bag Bans in California
Jurisdiction Implementation Date San Francisco (county and city) October 20, 2007 Malibu (city) November 26, 2008 Fairfax (city) June 4, 2009 Palo Alto (city) September 18, 2009 3. What’s In Your Bag?
2 California law prohibits municipalities from instituting taxes or fees on plastic bags until at least 2013, which has resulted in local governments seeking to regulate plastic bag distribution implementing bans rather than taxes. 3 Other California cities which have adopted bans include: Santa Monica, Calabasas, Long Beach, San Jose, Manhattan Beach, Pasadena, Monterey, Sunnyvale, Ojai, Millbrae, Laguna Beach, Los Angeles, Dana Point, Carpinteria, Ukiah, Watsonville, Solana Beach, Fort Bragg, Carmel-by-the-Sea, Santa Cruz. Other California counties include: Los Angeles (unincorporated areas), Santa Clara, Marin, Santa Cruz, San Luis Obispo, Alameda, Mendocino (unincorporated areas). Sixteen jurisdictions outside California have adopted laws banning or taxing plastic bags.

5
Williams et al (2011) randomly selected reusable grocery bags from consumers in grocery stores in Arizona and California. They examined the bags, finding coliform bacteria in 51 percent of the bags tested. Coliform bacteria were more prevalent in the California bags, especially those collected in the Los Angeles area. E. coli was found in 8 percent of the bags examined. The study also found that most people did not use separate bags for meats and vegetables. Further, 97 percent of individuals indicated they never washed their reusable grocery bags. Bacteria appeared to grow at a faster rate if the bags were stored in car trunks. This study suggests there may be large risks associated with the use of reusable grocery bags, though it does imply that fastidious washing of the bags can virtually eliminate the risks. However, it appears that no one actually washes these bags. Repp and Keene (2012) provide a case study where a reusable grocery bag was the point source for an outbreak of norovirus among an Oregon soccer team participating in a tournament in Washington State. The authors tracked the infections to a reusable grocery bag that had been stored in a hotel bathroom used by a sick member of the team. While the original source of the virus never touched the bag in question, the authors found evidence of the norovirus in the bag. The bag contained food the rest of the team members consumed, leading to the subsequent infections. This case study suggests that reusable grocery bags are highly susceptible to contamination. Though the literature on the health risks of reusable grocery bags is sparse, these studies highlight the cross contamination potential of these bags and the general tendency of their users not to clean them. Thus, it is possible that banning plastic grocery bags can lead to public health problems, as individuals substitute to reusable bags. 4. Plastic Bag Bans and Foodborne Illness
We focus on the San Francisco ban because it is the earliest ban in a major jurisdiction, allowing us to examine a few post ban time periods. Also, given that death data are generally aggregated at the county level, the fact that the San Francisco ban covered the entire county is helpful. We examined cause of death data from the CDC Wonder System. Given the confidentiality protocols of this data source, we were not able to examine all counties in California since county periods with few deaths attributable to a given cause of death are censored. To maximize our sample, we aggregate over all ICD-10 codes comprising “intestinal infectious diseases” (A00-A09). To analyze emergency room visits, we used the California Office of Statewide Health Planning and Development’s Emergency Department and Ambulatory Surgery Data for each quarter

6
from 2005-2010. These data provide the county of residence of each person admitted to a California ER, as well as the principal diagnosis for the individual using ICD-9 codes. Given the prevalence of coliform bacteria, especially E. coli, in reusable grocery bags, we focus on ER visits involving E. coli. We also examine foodborne illnesses generally, adding salmonella, listeria, toxoplasma, campylobacter, clostridium, and norovirus (food poisoning) to the E. coli counts in some of our ER analyses. Descriptive statistics are available in Table 2.
Table 2: Descriptive Statistics Variable Definition Mean Std.
Dev. Source
Deaths from intestinal diseases
Number of deaths in given county in given year attributed to causes listed under the ICD-10 heading “intestinal infectious diseases” (A00-A09)
123 186 CDC
ER Visits for E. Coli
Number of emergency room admissions in given county in given quarter of a year where principal diagnosis code involved E. coli
82 177 California Office of Statewide Health Planning and Development
ER Visits for Foodborne Illness
Number of emergency room admissions in given county in given quarter of a year where principal diagnosis code involved any foodborne illness, including E. coli, salmonella, listeria, toxoplasma, clostridium, food poisoning, and campylobacter
93 200 California Office of Statewide Health Planning and Development

7
4.a The San Francisco Bag Ban and Deaths from Infectious Diseases
The San Francisco County ban went into effect in October 2007. The cause of death data are only available on an annual basis, and are currently available through 2009. We examine the period 2005-2009 and include all California counties that have un-censored death counts available for each of these years. This restriction leaves us with the following 10 counties in addition to San Francisco: Alameda, Contra Costa, Fresno, Los Angeles, Orange, Riverside, Sacramento, San Bernardino, San Diego, and Ventura. Given the short time period examined, we directly examine deaths, rather than rates, because any population changes during the time period are interpolated rather than observed. To account for differences in the magnitude of deaths across these counties, we examine the natural log of deaths. In our regressions, we include county-level fixed effects and common year effects. Because of likely dependence through time in foodborne illness deaths, perhaps due to unmeasured cultural effects that influence diet or safety practices of the grocery stores in the county, we cluster standard errors at the county level. However, we are also concerned that there is dependence across counties within a given time period, due to unmeasured shocks to food distribution channels. To account for this, we use the multi-way clustering technique described in Cameron, Gelbach, and Miller (2012) clustering on county and year. Table 3 provides the results of this regression. We find that the San Francisco County ban is associated with a 46 percent increase in deaths from foodborne illnesses. This implies an increase of 5.5 deaths for the county. The effect is statistically significant at better than the 1 percent level. To provide confidence in the causal interpretation of this result, we analyzed restricted samples that may provide a better counterfactual for San Francisco County. If we restrict attention to the three Bay area counties, San Francisco plus Alameda and Contra Costa, our estimated effect increases and remains statistically significant despite the decline in sample size. We also examined a sample restricted to counties with percentage changes in deaths between 2005 and 2006 that were similar to San Francisco’s increase of 9 percent: Alameda (0 percent); Contra Costa (+12.5 percent); San Bernardino (+15 percent); and Ventura (+11.8 percent). Results for this set of counties were also similar. The analysis provided here presents some inferential difficulties. Namely, we only observe a policy change within a single cluster. Conley and Taber (2011) and Gelbach, Helland, and Klick (forthcoming) suggest that in such a setting, using the critical values from a standard normal distribution may not be appropriate for statistical inference.
8
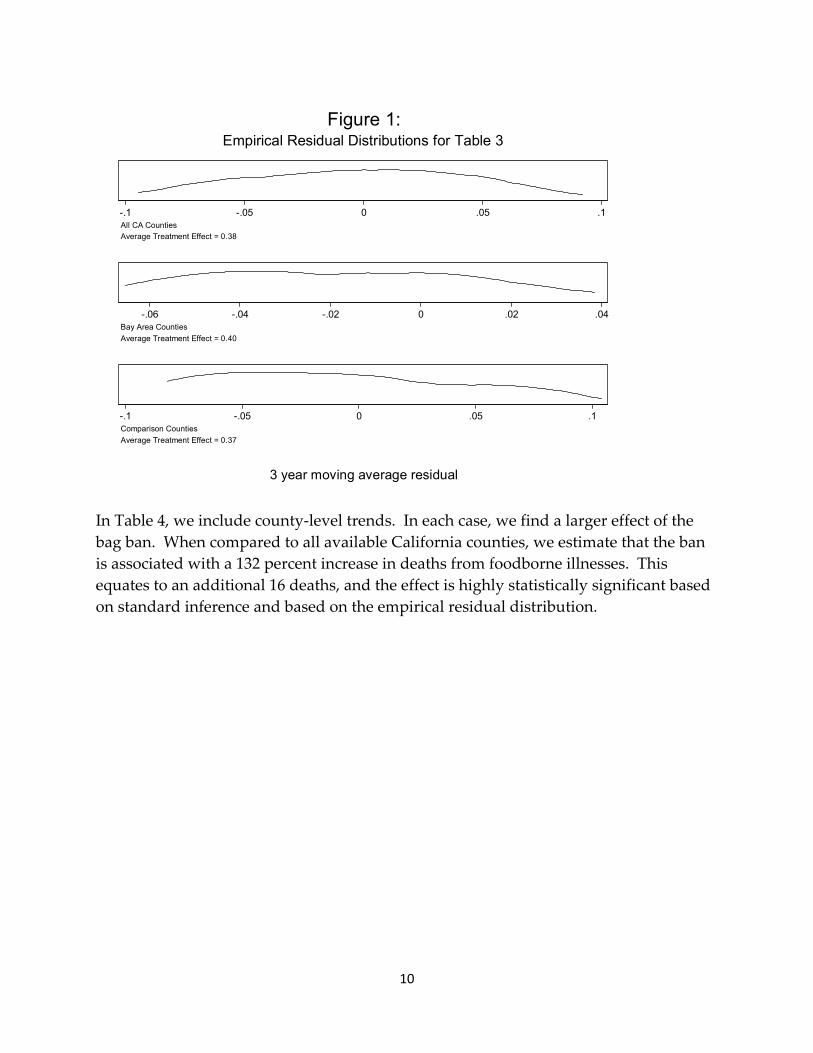
Roughly speaking, because there is limited averaging across potentially dependent observations, a central limit theorem may not hold. Both suggest a procedure wherein the estimated treatment effect is compared to the empirical distribution of non-treatment residuals. In the current setting, because our estimated treatment effect is averaged over three periods after the law change, we provide the distribution of a three period moving average of non-treatment residuals in Figure 1. In all specifications, we find that our treatment effect is statistically significant, with the coefficients lying well outside of the relevant residual distributions.

9
Table 3: Effect of San Francisco County Plastic Bag Ban on Deaths from Intestinal
Diseases (standard errors multi-way clustered by county and by year)
ln(deaths from intestinal infectious diseases) All Counties Bay Area Counties Comparable
Counties Bag Ban 0.38***
(0.12) 0.40*** (0.05)
0.37*** (0.13)
County Fixed Effects
Yes Yes Yes
Year Fixed Effects Yes Yes Yes County-Trends No No No Relative Effect +46% +49% +45% Implied Change in Deaths
+5.52 +5.88 +5.40
p-value from Empirical Distribution Function
0.00 0.00 0.00
Observations 55 15 25 Note: Dependent variable is the natural log of the number of deaths in a given county in a given year attributed to causes listed under the ICD-10 heading “intestinal infectious diseases” (A00-A09) according to the CDC. Implied change in deaths is relative to the deaths in San Francisco County in 2006, the year before the ban was implemented. The p-value from the empirical distribution function comes from the method suggested in Conley and Taber (2011) and Gelbach, Helland, and Klick (forthcoming) adjusted for a treatment effect averaged over a three year period. *** p < 0.01 (against a two-sided test of a null hypothesis of the bag ban coefficient = 0) ** p < 0.05 (against a two-sided test of a null hypothesis of the bag ban coefficient = 0) * p < 0.10 (against a two-sided test of a null hypothesis of the bag ban coefficient = 0)
10
In Table 4, we include county-level trends. In each case, we find a larger effect of the bag ban. When compared to all available California counties, we estimate that the ban is associated with a 132 percent increase in deaths from foodborne illnesses. This equates to an additional 16 deaths, and the effect is highly statistically significant based on standard inference and based on the empirical residual distribution.
-.1 -.05 0 .05 .1All CA CountiesAverage Treatment Effect = 0.38
-.06 -.04 -.02 0 .02 .04Bay Area CountiesAverage Treatment Effect = 0.40
-.1 -.05 0 .05 .1Comparison CountiesAverage Treatment Effect = 0.37
3 year moving average residual
Empirical Residual Distributions for Table 3Figure 1:

11
Table 4: Effect of San Francisco County Plastic Bag Ban on Deaths from Intestinal
Diseases Accounting for County-Level Trends
(standard errors multi-way clustered by county and by year) ln(deaths from intestinal infectious diseases) All Counties Bay Area Counties Comparable
Counties Bag Ban 0.84***
(0.11) 0.68*** (0.02)
0.65*** (0.17)
County Fixed Effects
Yes Yes Yes
Year Fixed Effects Yes Yes Yes County-Trends Yes Yes Yes Relative Effect +132% +98% +91% Implied Change in Deaths
+15.83 +11.78 +10.97
p-value from Empirical Distribution Function
0.00 0.00 0.00
Observations 55 15 25 Note: Dependent variable is the natural log of the number of deaths in a given county in a given year attributed to causes listed under the ICD-10 heading “intestinal infectious diseases” (A00-A09) according to the CDC. Implied change in deaths is relative to the deaths in San Francisco County in 2006, the year before the ban was implemented. The p-value from the empirical distribution function comes from the method suggested in Conley and Taber (2011) and Gelbach, Helland, and Klick (forthcoming) adjusted for a treatment effect averaged over a three year period. *** p < 0.01 (against a two-sided test of a null hypothesis of the bag ban coefficient = 0) ** p < 0.05 (against a two-sided test of a null hypothesis of the bag ban coefficient = 0) * p < 0.10 (against a two-sided test of a null hypothesis of the bag ban coefficient = 0)

12
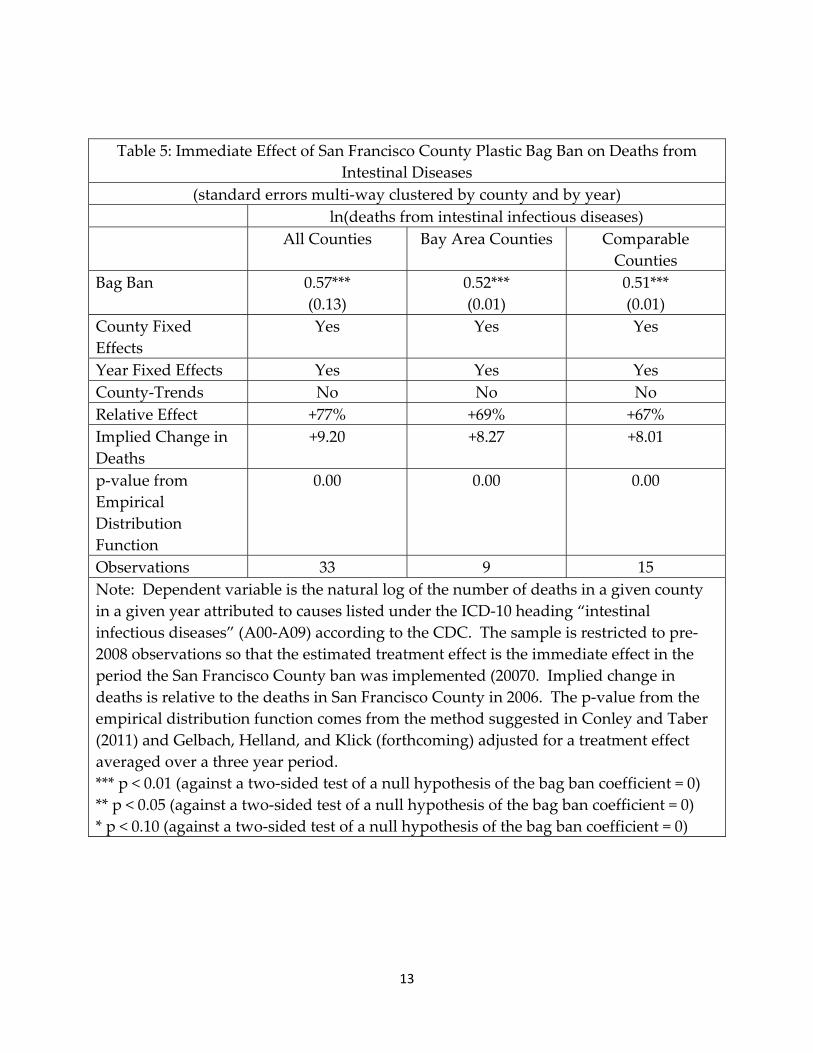
Table 5 examines the immediate effect of the ban, restricting the analysis to the period 2005-2007. Although examining such a short time period could present power problems, it allows us to examine whether the increase in deaths occurred right away. Given the October 2007 implementation, any estimated effect would represent the immediate reaction to the bag ban. Relative to the long term average effect estimated in Table 3, the immediate effect appears to be even larger, suggesting an increase in deaths of more than 9. Despite the small sample sizes, this effect is statistically significant at better than the 1 percent level, regardless of which inference approach is used.
-.1 -.05 0 .05 .1All CA CountiesAverage Treatment Effect = 0.84
-.02 -.01 0 .01 .02Bay Area CountiesAverage Treatment Effect = 0.68
-.1 -.05 0 .05 .1Comparison CountiesAverage Treatment Effect = 0.65
3 year moving average residual
Empirical Residual Distributions for Table 4Figure 2:
13
Table 5: Immediate Effect of San Francisco County Plastic Bag Ban on Deaths from Intestinal Diseases
(standard errors multi-way clustered by county and by year) ln(deaths from intestinal infectious diseases) All Counties Bay Area Counties Comparable
Counties Bag Ban 0.57***
(0.13) 0.52*** (0.01)
0.51*** (0.01)
County Fixed Effects
Yes Yes Yes
Year Fixed Effects Yes Yes Yes County-Trends No No No Relative Effect +77% +69% +67% Implied Change in Deaths
+9.20 +8.27 +8.01
p-value from Empirical Distribution Function
0.00 0.00 0.00
Observations 33 9 15 Note: Dependent variable is the natural log of the number of deaths in a given county in a given year attributed to causes listed under the ICD-10 heading “intestinal infectious diseases” (A00-A09) according to the CDC. The sample is restricted to pre-2008 observations so that the estimated treatment effect is the immediate effect in the period the San Francisco County ban was implemented (20070. Implied change in deaths is relative to the deaths in San Francisco County in 2006. The p-value from the empirical distribution function comes from the method suggested in Conley and Taber (2011) and Gelbach, Helland, and Klick (forthcoming) adjusted for a treatment effect averaged over a three year period. *** p < 0.01 (against a two-sided test of a null hypothesis of the bag ban coefficient = 0) ** p < 0.05 (against a two-sided test of a null hypothesis of the bag ban coefficient = 0) * p < 0.10 (against a two-sided test of a null hypothesis of the bag ban coefficient = 0)

14
4.b ER Visits and the Bag Ban
While powerful, the analysis of deaths presented above is limited by the conventions of the cause of death data, censoring and annual aggregation, and the short post-ban period over which data are available. To address these limitations and examine another metric of foodborne illness, we examine admissions to California emergency rooms. The ER data are helpful because they do not present the censoring problem discussed above, as every county experiences enough foodborne illness visits to preserve anonymity.4 Also, we can focus attention on a more specific set of illnesses. Namely, we examine visits related to E. coli, given the prevalence of that particular bacterium in the reusable grocery bag study cited above. Lastly, the ER data are aggregated at the quarterly level, allowing us to more precisely isolate the relationship between any change in health outcome and the implementation of the San Francisco ban. We aggregated the ER data by county of the patient’s residence and quarter of year, counting all the instances where the patient’s principal diagnosis involved E. coli according to the recorded ICD-9 code. The data allow us to examine every quarter from 2005 through the end of 2010. We examine the natural log of the number of ER visits 4 Despite this, we did omit Los Angeles, Marin, and Santa Clara counties as they each contained a city that passed its own ban during the period.
-.2 -.1 0 .1 .2 .3All CA CountiesTreatment Effect = 0.57
-.04 -.02 0 .02 .04Bay Area CountiesTreatment Effect = 0.52
-.05 0 .05Comparison CountiesTreatment Effect = 0.51
Residuals Pre-2008
Empirical Residual Distributions for Table 5Figure 3:

15
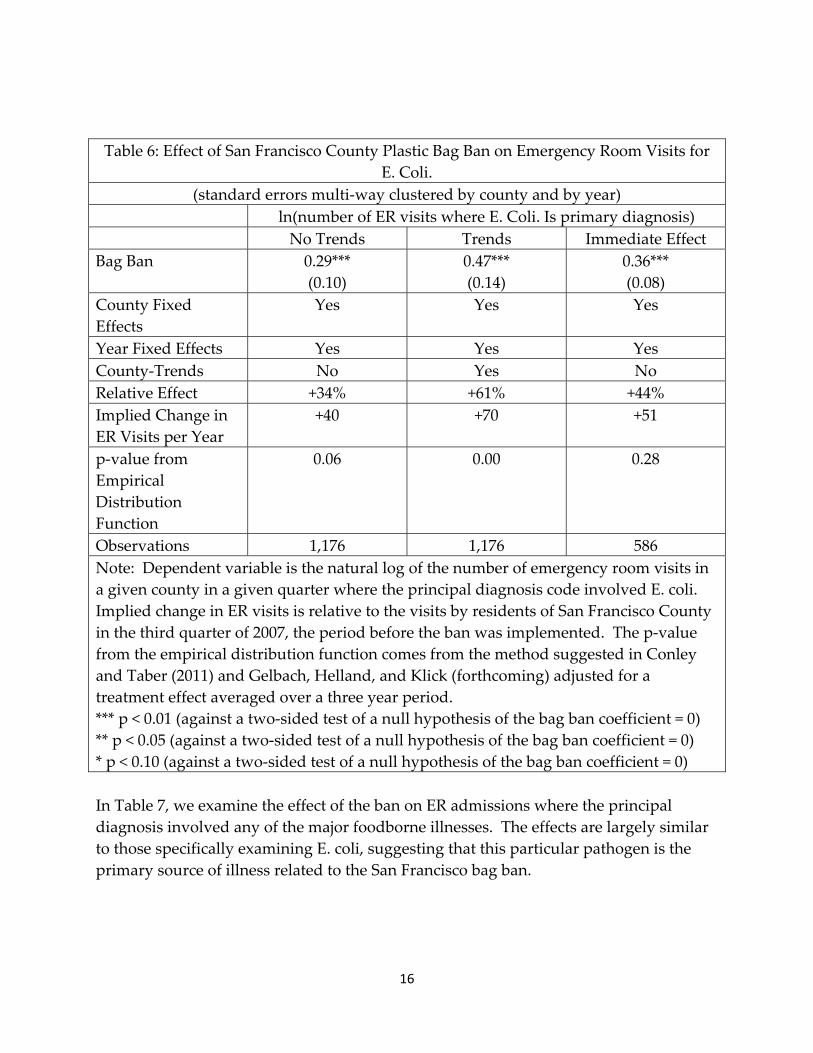
involving E. coli, controlling for county fixed effects and separate time fixed effects for each quarter. We again multi-way cluster the standard errors at the county and time period levels to account for the dependence discussed above. We examine three separate specifications: (1) no county level trends; (2) county level trends; and (3) a specification that limits the sample from 2005 through the end of 2007 to isolate the immediate effect of the bag ban on ER admissions. Table 6 provides our results. We find that the bag ban is associated with a 34 percent increase in ER visits where E. coli is included in the principal diagnosis. This suggests an additional 40 ER visits. If trends are included, these estimates increase to a 61 percent rise or 70 additional ER visits. If we focus upon the immediate effect of the ban, it is slightly larger than the average effect, suggesting that the increase was observed immediately. All of these results are statistically significant at better than the 1 percent level using standard inference methods. When comparing to the empirical residual distribution, the average effect without trends is statistically significant at the 10 percent level, and the effect where trends are included is statistically significant at the 1 percent level. The immediate effect is not statistically significant using the non-parametric inference method. Although not presented, if we restrict the sample to all of the Bay Area counties, all of the estimated coefficients increase in magnitude and precision. This lends confidence to the conclusion that the San Francisco County ban is associated with an increase in ER admissions related to E. coli.
16
Table 6: Effect of San Francisco County Plastic Bag Ban on Emergency Room Visits for E. Coli.
(standard errors multi-way clustered by county and by year) ln(number of ER visits where E. Coli. Is primary diagnosis) No Trends Trends Immediate Effect
Bag Ban 0.29*** (0.10)
0.47*** (0.14)
0.36*** (0.08)
County Fixed Effects
Yes Yes Yes
Year Fixed Effects Yes Yes Yes County-Trends No Yes No Relative Effect +34% +61% +44% Implied Change in ER Visits per Year
+40 +70 +51
p-value from Empirical Distribution Function
0.06 0.00 0.28
Observations 1,176 1,176 586 Note: Dependent variable is the natural log of the number of emergency room visits in a given county in a given quarter where the principal diagnosis code involved E. coli. Implied change in ER visits is relative to the visits by residents of San Francisco County in the third quarter of 2007, the period before the ban was implemented. The p-value from the empirical distribution function comes from the method suggested in Conley and Taber (2011) and Gelbach, Helland, and Klick (forthcoming) adjusted for a treatment effect averaged over a three year period. *** p < 0.01 (against a two-sided test of a null hypothesis of the bag ban coefficient = 0) ** p < 0.05 (against a two-sided test of a null hypothesis of the bag ban coefficient = 0) * p < 0.10 (against a two-sided test of a null hypothesis of the bag ban coefficient = 0) In Table 7, we examine the effect of the ban on ER admissions where the principal diagnosis involved any of the major foodborne illnesses. The effects are largely similar to those specifically examining E. coli, suggesting that this particular pathogen is the primary source of illness related to the San Francisco bag ban.

17
Table 7: Effect of San Francisco County Plastic Bag Ban on Emergency Room Visits for
Any Foodborne Illness (standard errors multi-way clustered by county and by year)
ln(number of ER visits where a foodborne illness is primary diagnosis)
No Trends Trends Immediate Effect Bag Ban 0.24***
(0.09) 0.35*** (0.11)
0.25*** (0.07)
County Fixed Effects
Yes Yes Yes
Year Fixed Effects Yes Yes Yes County-Trends No Yes No Relative Effect +27% +42% +28% Implied Change in ER Visits per Year
+42 +64 +42
p-value from Empirical Distribution Function
0.10 0.00 0.41
Observations 1,176 1,176 586 Note: Dependent variable is the natural log of the number of emergency room visits in a given county in a given quarter where the principal diagnosis code involved any foodborne illness, including E. coli, salmonella, listeria, toxoplasma, clostridium, food poisoning, and campylobacter. Implied change in ER visits is relative to the visits by residents of San Francisco County in the third quarter of 2007, the period before the ban was implemented. The p-value from the empirical distribution function comes from the method suggested in Conley and Taber (2011) and Gelbach, Helland, and Klick (forthcoming) adjusted for a treatment effect averaged over a three year period. *** p < 0.01 (against a two-sided test of a null hypothesis of the bag ban coefficient = 0) ** p < 0.05 (against a two-sided test of a null hypothesis of the bag ban coefficient = 0) * p < 0.10 (against a two-sided test of a null hypothesis of the bag ban coefficient = 0) 4.c Other California Bag Bans
While a number of other California jurisdictions have adopted bag bans, only Malibu, Fairfax, and Palo Alto adopted their bans during the time period covered by the ER data. Also, because these bans cover only cities or towns, any analysis is potentially problematic. While it is likely that individuals in San Francisco do most of their food

18
shopping within the county, residents of Palo Alto may shop outside the jurisdiction’s boundaries. To bias against finding an effect, we coded each county containing these cities as having adopted a ban when the city itself did. We also omitted San Francisco County from this set of analyses. Otherwise, the analyses are comparable to those above. Table 8 provides the results for these other bans. Although the estimated effects are smaller, as expected given that small portions of counties are coded as entire counties, they are still statistically significant (at the 5 percent level) and quite large in both the no trends and trends specifications.

19
Table 8: Effect of Other California Plastic Bag Bans on Emergency Room Visits
(standard errors multi-way clustered by county and by year) ln(number of ER visits where E. Coli is the primary diagnosis) No Trends Trends
Bag Ban 0.18** (0.08)
0.19** (0.09)
County Fixed Effects
Yes Yes
Year Fixed Effects Yes Yes County-Trends No Yes Relative Effect +19% +21% Implied Change in ER Visits per Year
+956 +1,030
Observations 1,224 1,224 Note: Note: Dependent variable is the natural log of the number of emergency room visits in a given county in a given quarter where the principal diagnosis code involved E. coli. Implied change in ER visits is relative to the visits by residents of the counties in which bans were enacted in the quarter before the ban was implemented. *** p < 0.01 (against a two-sided test of a null hypothesis of the bag ban coefficient = 0) ** p < 0.05 (against a two-sided test of a null hypothesis of the bag ban coefficient = 0) * p < 0.10 (against a two-sided test of a null hypothesis of the bag ban coefficient = 0) Taken together, these results suggest that E. coli deaths and ER visits spike after jurisdictions ban plastic grocery bags. This is a natural implication of the work finding that reusable grocery bags contain harmful bacteria given the tendency of individuals to not use separate bags for meats and vegetables and their failure to clean the bags. The increases are practically important and occur effectively immediately after these bans go into effect. These results also likely understate the true total effect because many individuals likely suffer foodborne illnesses without going to the hospital or dying. 5. Is It Worth It?
Our results suggest that the San Francisco ban led to between 5.4 and 15.8 additional deaths. Using the EPA’s current estimate of the value of a statistical life, 8.4 million in current dollars, this suggests a loss of between $45 million and $133 million without considering the additional hospital costs, either associated with these deaths or with the increased ER visits documented above, or the personal costs suffered by individuals who do not seek medical care.

20
Against these costs, in 2004 San Francisco estimated that plastic bag waste cost it $8.5 million annually,5 which is $10.3 million in current dollars. Given that plastic bags are generally estimated to be cheaper to make than substitute bags, this implies that any improvements to the environment owing to the bad ban need to be worth between $35 million and $123 million annually to justify the bans on cost benefit grounds. A precise valuation of the environmental benefits is hard to come by. However, many advocacy groups suggest that plastic refuse (from all sources, not just bags) kills 1 million birds and 100,000 other aquatic animals annually. A conservative estimate is that global plastic bag use is at least 500 billion bags annually, of which 180 million were used in San Francisco prior to the ban.6 If we assume that a jurisdiction’s “share” of animal deaths is proportionate to bag use, and we ignore all other source of plastic, this suggests that San Francisco’s annual contribution to animal deaths is on the order of 400 birds and marine animals. This implies a break even valuation of each animal of between $87,500 and $307,500. These numbers are only rough guidelines, but they suggest that the current trend toward bag bans may be imprudent. 6. Conclusion
State and local governments have recently imposed bans or levied taxes upon plastic grocery bags. This trend is in response to environmental concerns that plastic bags contribute to litter and endanger marine animals. San Francisco County was the first major US jurisdiction to enact such a regulation, implementing a ban in 2007 and extending it to all retailers in 2012. There has been little empirical evidence proffered illuminating the costs and benefits of these bag bans. We undertake such an analysis in light of concerns that consumers might substitute from the banned or taxed bags toward reusable grocery bags, a common substitute and potential carrier of harmful bacteria such as E. coli. We examine deaths and emergency room admissions related to these bacteria in the wake of the San Francisco ban. We find that both deaths and ER visits spiked as soon as the ban went into effect. Relative to other counties, deaths in San Francisco increase by 50-100 percent, and ER visits increase by a comparable amount. Subsequent bans by other cities in California appear to be associated with similar effects. Conservative estimates of the costs and benefits of the San Francisco plastic bag ban suggest the health risks they impose are not likely offset by environmental benefits.
5 See http://www.cawrecycles.org/issues/plastic_campaign/plastic_bags/problem 6 See http://www.sfgate.com/green/article/S-F-FIRST-CITY-TO-BAN-PLASTIC-SHOPPING-BAGS-2606833.php
21
References
Cameron, A. Colin, Jonah B. Gelbach, and Douglas L. Miller (2011). “Robust Inference with Multiway Clustering.” Journal of Business and Economic Statistics, 29(2): 238-249. Conley, Timothy G., and Christopher R. Taber (2011). “Inference with ‘Difference in Differences’ with a Small Number of Policy Changes.” Review of Economics and Statistics, 93(1): 113-125. Town of Fairfax Code Chapter 8.18 § 8.18.010-8.18.100 (as amended by Town of Fairfax voters, 2008). Florida Dept. of Environmental Protection. “Retail Bags Report - List of Retail Bag Policies - USA” Web 15 August 2009 <http://www.dep.state.fl.us/waste/retailbags/pages/list_USA.htm>. Gelbach, Jonah B., Eric Helland, and Jonathan Klick (forthcoming). “Valid Inference in Single-Firm, Single-Event Studies.” American Law and Economics Review. City of Malibu Municipal Code Chapter 9.28 § 010-020 (as amended by City of Malibu Ordinance No. 323, 2008). Palo Alto Municipal Code Chapter 5.35 Title 5 (as amended by Palo Alto Ordinance No. 5032, 2009). Plasticbaglaws.org. “State and Local Laws.” PlasticBagLaws.org. Web 15 August 2009 <http://plasticbaglaws.org/legislation/state-laws/>. Repp, Kimberly K., and William E. Keene (2012). “A Point-Source Norovirus Outbreak Caused by Exposure to Fomites.” Journal of Infectious Diseases, 205: 1639-1641. San Francisco Environment Code, Chapter 17 § 1701-1709 (as amended by Plastic Bag Reduction Ordinance 81-07-106883, 2007). Williams, David L., Charles P. Gerba, Sherri Maxwell, and Ryan G. Sinclair (2011). “Assessment of the Potential for Cross-contamination of Food Products by Reusable Shopping Bags.” Food Protection Trends, 31(8): 508-513.