gross domestic product second quarter …...table a: sectoral growth rate revisions for the first...
TRANSCRIPT

1
Namibia Statistics AgencyP.O. Box 2133, FGI House, Post Street Mall,Windhoek, Namibia
Tel: +264 61 431 3200Fax: +264 61 431 3253
Email: [email protected]
GROSS DOMESTIC PRODUCT
SECOND QUARTER 2019

GROSS DOMESTIC PRODUCT - SECOND QUARTER 20192
Vision Statement
“To be a high performance institution in quality statistics delivery”
Core Values
Integrity Excellent Performance
Accuracy
Team Work
Accountability
Transparency
Mission Statement
“Leveraging on partnerships and innovative technologies, to produce and disseminate relevant, quality, timely statistics and spatial data that are fit-for-purpose in accordance with international standards and best practice”
3
Preface ................................................................................................................4
1 Introduction ...................................................................................................5
2 Revisions .......................................................................................................6
3 Data sources and timeliness ..........................................................................7
4 Key findings ...................................................................................................7
4.1 Inflation rate ...................................................................................................9
4.2 Trade Balance ...............................................................................................10
4.3 Agriculture and forestry ...............................................................................12
4.4 Fishing and fish processing on board1 ........................................................14
4.5 Mining and quarrying ..................................................................................16
4.6 Manufacturing..............................................................................................21
4.7 Electricity and water ....................................................................................24
4.8 Construction5 ...............................................................................................28
4.9 Wholesale and retail trade ..........................................................................31
4.10 Hotels and restaurants7 ............................................................................33
4.11 Transport and communication ..................................................................35
4.12 Financial intermediation ............................................................................38
4.13 Public Administration and defence, Education and Health .....................41
Appendix 1 Methodological Notes .................................................................46
Table of Contents

construction (-5.5 percent), ‘wholesale and retail trade’ (-2.0 percent), and ‘hotels and restaurants’ (-2.8 percent).
Furthermore, moderate declines were recorded in ‘public administration and defence’, ‘transport and communications’, education and ‘health’ sectors that registered declines of 2.7 percent, 0.9 percent, 0.9 percent and 2.6 percent, respectively. The significant reduction in economic activities is attributed to weak domestic demand for goods and services, reduced disposable income coupled with drought condition affecting most households.
However, other sectors posted positive performance during the quarter under review. ‘manufacturing’ and ‘electricity & water’ sectors recorded improved performances, posting growths in real value added of 18.8 percent and 2.7 percent, respectively in the second quarter of 2019. Improved performance is also observed in the financial intermediation and fishing sector, which posted growths in real value added of 1.9 percent and 0.6 percent, in second quarter of 2019 compared to 0.7 percent and 6.2 percent respectively in the corresponding quarter for 2018.
Year on year, inflation surged up, recording a 4.2 percent compared to 3.8 percent recorded in 2018. This represent an increase of 0.4 percentage points, and is largely due to increases in ‘food and non-alcoholic beverages’ as well as ‘alcoholic beverages and tobacco’.
During the quarter under review, imports rose faster recording N$ 19,687 million whereas exports decelerated to N$ 13,288 million, widening the trade balance by N$ 6,399 million. This is largely due to increase in importation of fuel and reduction in export of diamonds.
I would therefore again like to emphasise the importance of accurate and timely delivery of data from our stakeholders in the private and public sectors to the Namibia Statistics Agency (NSA), as per section 38 of the Statistics Act on which the compilation of quarterly GDP depends. I wish to express my appreciation to all the data providers; both institutions and individuals, without whose contributions the publication would not have been possible.
Finally, I would like to bring it to the reader’s attention that manual calculations could lead to rounding errors. All calculations in this report were done using the MS Excel and thus manual calculations might differ slightly due to rounding to the nearest decimal.
Alex ShimuafeniStatistician-General & CEOWindhoek, September 2019
This publication presents an overview of economic developments during the second quarter of 2019. Quarterly Gross Domestic Product (GDP) estimates assist in the analysis of short-term movements in the economy, as opposed to the annual GDP that provides in-depth and comprehensive view of the changes in the economy. Other economic indicators such as volume indices of production, distributive trade indices and levels of employment can be used for that purpose.
The domestic economy performance remains subdued in the second quarter of 2019, recording a contraction of 2.6 percent compared to a growth of 0.6 percent recorded in the corresponding period of 2018. Year on year, in real terms, Gross Domestic Product stood at N$ 25,515 million compared to N$ 26,185 million, showing that the sum of real value added shrunk by N$ 670 million.
The deterioration in performance is observed across major sectors with more than half of the sectors posting declining growth rates in real value added. The key drivers for the contraction is attributed to ‘mining and quarrying’ (-20.2 percent), ‘agriculture and forestry’ (-28.1 percent)
GROSS DOMESTIC PRODUCT - SECOND QUARTER 20194
PREFACE
1 IntroductionThe main purpose of compiling quarterly national accounts is to provide a timely and frequent picture of economic developments, unlike the annual national accounts that is published once a year. Quarterly data determine the short-term movements in the series, while the annual data determine the overall level and long-term movements in the series. In principle, the only difference between quarterly and annual national accounts is the reference period and the scope of coverage, where the annual national accounts provides a more comprehensive scope of data coverage.
The definitions and conceptual frameworks, as well as the accounts and accounting identities of the 1993 System of National Accounts (SNA93) are followed for both accounts. The NSA started the compilation of quarterly GDP at constant prices as a first step in compiling full quarterly national accounts.
Since quarterly and annual estimates are often based on different kinds of data sources, the annual total derived from the sum of the four quarters under consideration differs from annual estimates based on more comprehensive sources of data. Therefore, in order to make them comparable, quarterly estimates are benchmarked to their annual estimates during the compilation of the quarterly GDP.
51 Introduction
Benchmarking is the process of combining a time series of high frequency data with less frequent but more accurate data.

Table A: Sectoral growth rate revisions for the first quarter of 2019
SectorFirst quarter 2019 in percent as recorded
Revised first quarter 2019 in percent
Difference
Agriculture -6.7 -31.4 -24.7
Fishing 1.1 3.3 2.1
Mining and quarrying -1.1 -1.1 0.0
Manufacturing 3.6 3.6 0.0
Electricity and water 2.7 2.7 0.0
Construction -27.8 -27.8 0.1
Wholesale and retail trade -6.7 -7.0 -0.3
Hotels and restaurants -8.7 -8.7 0.0
Transport and communication -0.5 -0.5 0.0
Financial intermediation 1.4 1.4 0.0
Real estate activities and business services 0.4 0.4 0.0
Public administration -1.2 -1.2 0.0
Education 1.3 1.3 0.0
Health 2.4 2.4 0.0
Other private services -1.1 -1.1 0.0
FISIM 4.6 4.6 0.0
All industries at basic prices -1.9 -2.9 -0.9
Taxes on products -3.2 -3.4 -0.2
GDP -2.0 -2.9 -0.9
* When calculating the differences manually in the figures above, there may occur slight differences that are due to rounding to the nearest decimal in MS Excel.
2 RevisionsRevisions are part of good quarterly national accounts compilation best practices because they provide users with more accurate data. It provides the opportunity to incorporate new and more accurate information, and thereby improve the accuracy of the estimates without introducing breaks in the time series. Depending on the extent of availability of more comprehensive data, revisions are made to estimate quarters up to the last three years.
The revisions made in the first quarter of 2019 are outlined in Table 1. Based on the revised changes, real GDP growth for the first quarter of 2019 contracted by 2.9 percent from a decline of 2.0 percent. The major revisions were observed in the following sectors: agriculture and forestry (-24.7 percentage points), Fishing and fish processing on board (2.1 percentage points) and mining and quarrying (0.1 percentage points). The revision in the data was solely necessitated by the updated data received from sources.
GROSS DOMESTIC PRODUCT - SECOND QUARTER 20196
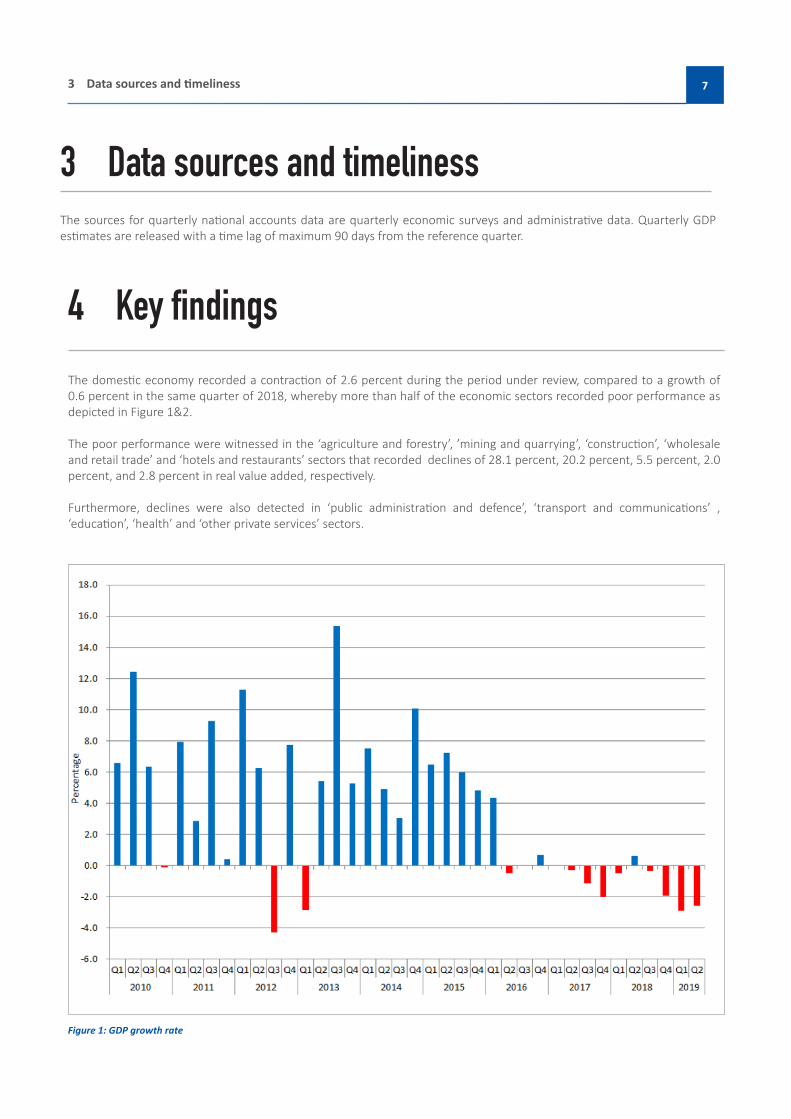
3 Data sources and timelinessThe sources for quarterly national accounts data are quarterly economic surveys and administrative data. Quarterly GDP estimates are released with a time lag of maximum 90 days from the reference quarter.
4 Key findings
Figure 1: GDP growth rate
The domestic economy recorded a contraction of 2.6 percent during the period under review, compared to a growth of 0.6 percent in the same quarter of 2018, whereby more than half of the economic sectors recorded poor performance as depicted in Figure 1&2.
The poor performance were witnessed in the ‘agriculture and forestry’, ’mining and quarrying’, ‘construction’, ‘wholesale and retail trade’ and ‘hotels and restaurants’ sectors that recorded declines of 28.1 percent, 20.2 percent, 5.5 percent, 2.0 percent, and 2.8 percent in real value added, respectively.
Furthermore, declines were also detected in ‘public administration and defence’, ‘transport and communications’ , ‘education’, ‘health’ and ‘other private services’ sectors.
73 Data sources and timeliness

Despite this negative growth being observed, other sectors such as ‘manufacturing’ and ‘electricity & water’ registered growths of 18.8 percent and 2.7 percent compared to a decline of 8.7 percent and a growth of 16.3 percent recorded in the corresponding quarter of 2018, respectively.
Figure 2, shows the performance growth rates of selected sectors for the period under review.
Figure 2: Selected sectors value added performance growth rates
GROSS DOMESTIC PRODUCT - SECOND QUARTER 20198

4.1 Inflation rate
Year on year, average inflation rate shows an upward trend, recording a 4.2 percent, increasing by 0.4 percentage points. The upward surge is on-account of food and non-alcoholic beverages; ‘alcoholic beverages and tobacco’ that recorded increases of 4.6 percent and 6.2 percent, respectively.
Quarter on quarter, the average consumer price index stood at 137.3 basis points, compared to 131.7 basis points and this represents an increase of 5.5 basis points, translating into an increase of 4.2 percent.
94 Key findings

4.2 Trade Balance
Year on year, export of goods stood at N$ 13,288 million during the quarter under review compared to the N$ 15,979 million registered in the same quarter of 2018. This shows that the export of goods declined over the period by N$ 2,691 million, representing a decline of 16.8 percent (Figure 4). Furthermore, quarter-on-quarter, exports of goods declined by N$ 2,511 million, posting a decline of 15.9 percent.
On the other hand, year on year, goods imported stood at N$ 19,687 million compared to N$ 16,147 million recorded in the corresponding quarter of 2018, representing an increase of 21.9 percent. This is an increase of N$ 3,540 million worth of import of goods. Quarter on quarter, imports also rose by N$ 4,004 million.
Figure 4: Trade Balance
This implies that exports of goods decelerated fast from a growth of 5.1 percent to a decline of 16.8 percent and furthermore, imports accelerated faster at the rate of 21.9 percent from a decline of 2.7 percent resulting in a trade deficit. The trade deficit is mainly driven by a rise in imports of fuel and a dip in the exports of diamonds.
Export Imports Trade Balance
GROSS DOMESTIC PRODUCT - SECOND QUARTER 201910

Figure 5: Imports of goods by broad economic categories
During the period under review, imports capital goods dropped to N$ 2,535 million compared to N$ 5,186 million in 2018, representing a decline of 51.1 percent, however, on quarter to quarter, imports of capital goods increased by 8.9 percent. As expected, given this is a drought period impacting the country, imports of final goods picked up to 37.4 percent year on year while quarter on quarter, it rose by 12.9 percent. Intermediate consumption goods follows a similar trend, surging by 68.6 percent year on year and picking up by 38.3 percent quarter on quarter.
114 Key findings

4.3 Agriculture and forestry
The agriculture and forestry sector registered a contraction of 28.1 percent in real value added during the second quarter of 2019, relative to a growth of 2.7 percent recorded during the same period in 2018 (Figure 6).
The noteworthy contraction in the sector emanates from further contractions recorded in both the livestock and crop subsectors. The livestock subsector registered a contraction of 23.8 percent in the second quarter of 2019 in comparison to a contraction of 9.8 percent recorded in the corresponding quarter of 2018. The contraction witnessed in the livestock subsector is predominantly driven by the perpetual decline in the stock of cattle.
Figure 6: Agriculture real value added growth rate
Export of live cattle to South Africa and Angola recorded a strong growth of 45.3 percent in the second quarter of 2019 compared to a contraction of 22.3 percent recorded during the corresponding quarter of 2018. Similarly, Cattle export to abattoirs and butchers recorded a growth of 34.2 percent compared to a contraction of 0.1 percent recorded in 2018.
Small stock marketed to abattoirs and butchers contracted, registering a decline of 34.7 percent compared to a growth of 20.3 percent recorded in the corresponding quarter of 2018 (Figure 7). Additionally, live small stock export to South Africa and Angola slowed, registering a slow growth of 1.7 percent relative to a growth of 7.7 percent recorded in the corresponding quarter of 2018.
GROSS DOMESTIC PRODUCT - SECOND QUARTER 201912

Figure 7: Number of livestock marketed, volume index 2010 = 100
Equally, the crop farming subsector registered a contraction of 39.1 percent relative to a strong growth of 25.5 percent in real value added recorded during the same quarter of 2018. The poor performance is primarily driven by the severe drought.
134 Key findings

4.4 Fishing and fish processing on board1
Figure 8: Fishing and fish processing on board real value added growth rate
The performance of the sector comes on the backdrop of recovering demersal landings which recorded a decline of 6.9 percent in the second quarter of 2019 relative to a deeper contraction of 16.2 percent recorded in the corresponding quarter
1 The estimate of fishing and fish processing on board is based on preliminary figures because a complete set of data is still being awaited from the industry.
The sector fishing and fish processing on board registered a slow growth of 0.6 percent in real value added in comparison to a growth of 6.2 percent recorded in the corresponding quarter of 2018 (Figure 8).
GROSS DOMESTIC PRODUCT - SECOND QUARTER 201914
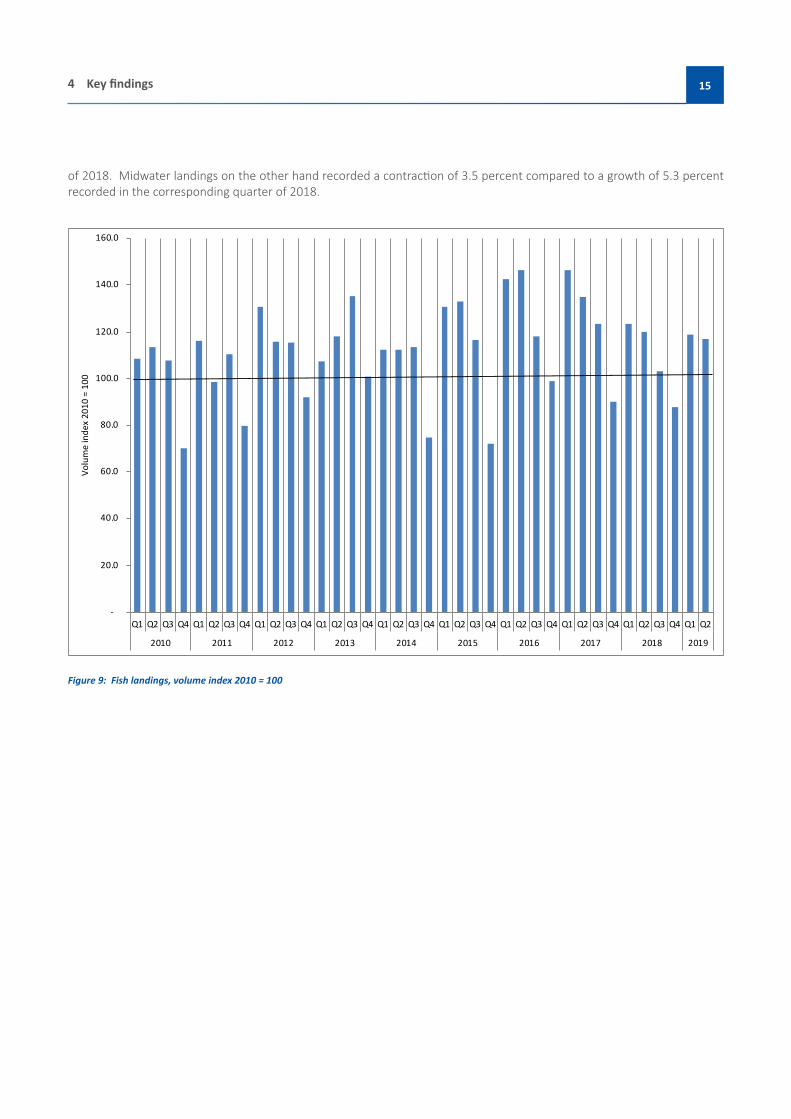
of 2018. Midwater landings on the other hand recorded a contraction of 3.5 percent compared to a growth of 5.3 percent recorded in the corresponding quarter of 2018.
-
20.0
40.0
60.0
80.0
100.0
120.0
140.0
160.0
Q1 Q2 Q3 Q4 Q1 Q2 Q3 Q4 Q1 Q2 Q3 Q4 Q1 Q2 Q3 Q4 Q1 Q2 Q3 Q4 Q1 Q2 Q3 Q4 Q1 Q2 Q3 Q4 Q1 Q2 Q3 Q4 Q1 Q2 Q3 Q4 Q1 Q2
2010 2011 2012 2013 2014 2015 2016 2017 2018 2019
Volu
me
inde
x 20
10 =
100
Figure 9: Fish landings, volume index 2010 = 100
154 Key findings
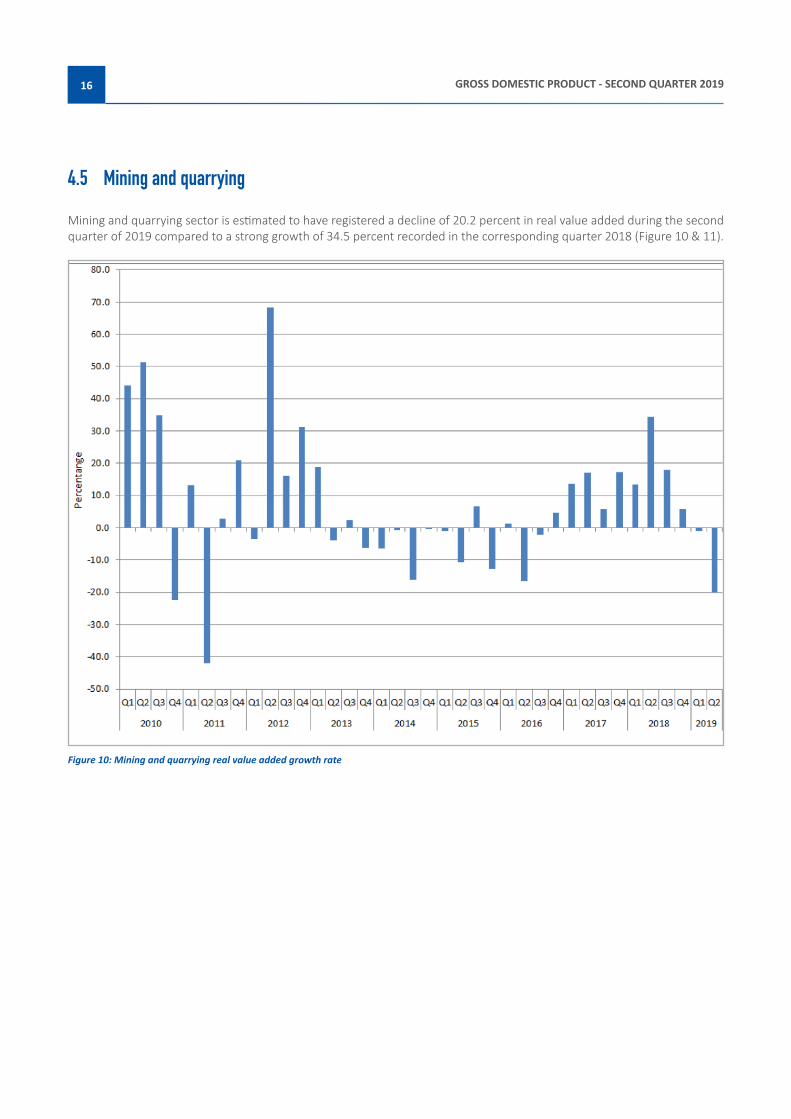
4.5 Mining and quarrying
Mining and quarrying sector is estimated to have registered a decline of 20.2 percent in real value added during the second quarter of 2019 compared to a strong growth of 34.5 percent recorded in the corresponding quarter 2018 (Figure 10 & 11).
Figure 10: Mining and quarrying real value added growth rate
GROSS DOMESTIC PRODUCT - SECOND QUARTER 201916

0.0
20.0
40.0
60.0
80.0
100.0
120.0
140.0
160.0
Q1 Q2 Q3 Q4 Q1 Q2 Q3 Q4 Q1 Q2 Q3 Q4 Q1 Q2 Q3 Q4 Q1 Q2 Q3 Q4 Q1 Q2 Q3 Q4 Q1 Q2 Q3 Q4 Q1 Q2 Q3 Q4 Q1 Q2 Q3 Q4 Q1 Q2
2010 2011 2012 2013 2014 2015 2016 2017 2018 2019
Volu
me
inde
x 20
10=1
00
Mining Total Mining Index 3 per. Mov. Avg. (Mining Total Mining Index)
Figure 11: Total mining production volume index 2010 = 100
The negative growth in mining and quarrying sector is attributed to diamond, uranium and other mining quarrying subsectors that recorded declines.
Diamonds subsector is estimated to have recorded a negative growth of 34.3 percent in real value added in the second quarter of 2019, compared to a strong growth of 36.7 percent in the corresponding quarter of 2018. The performance of this subsector is attributed to the decline growth in the production of carats produced as compared to last year same quarter (Figure 12).
174 Key findings

-
100
200
300
400
500
600
700
Q1Q2Q3Q4Q1Q2Q3Q4Q1Q2Q3Q4Q1Q2Q3Q4Q1Q2Q3Q4Q1Q2Q3Q4Q1Q2Q3Q4Q1Q2Q3Q4Q1Q2Q3Q4Q1Q2
2010 2011 2012 2013 2014 2015 2016 2017 2018 2019
Cara
ts in
thou
sand
s
Diamonds Production Diamonds Sales
Figure 12: Diamond production and sales in thousands of carats
Uranium subsector is estimated to have registered a decline of 6.4 percent in real value added compared also to a strong growth of 75.1 percent registered in the corresponding quarter of 2018. The decline is attributed to decline in production (Figure 13).
GROSS DOMESTIC PRODUCT - SECOND QUARTER 201918

Figure 13 Uranium production in short tons
In the second quarter of 2019, other mining and quarrying, also estimated to have recorded a decline of 5.3 percent in real value added compared to a decline of 12.8 percent recorded in the second quarter of 2018. The performance in the subsector is attributed to the reduction in granite and salt production.
However, metal ores subsector is estimated to have recorded a strong growth of 5.4 percent in real value added, compared to a decline of 6.0 percent recorded in the same quarter of 2018. The robust growth in the subsector is attributed to an increase in gold and zinc production (Figure 14).
194 Key findings

0.0
50.0
100.0
150.0
200.0
250.0
Q1 Q2 Q3 Q4 Q1 Q2 Q3 Q4 Q1 Q2 Q3 Q4 Q1 Q2 Q3 Q4 Q1 Q2 Q3 Q4 Q1 Q2 Q3 Q4 Q1 Q2 Q3 Q4 Q1 Q2 Q3 Q4 Q1 Q2 Q3 Q4 Q1 Q2
2010 2011 2012 2013 2014 2015 2016 2017 2018 2019
Volu
me
inde
x 20
10=1
00
Figure 14: Metal ores volume index 2010 = 100
GROSS DOMESTIC PRODUCT - SECOND QUARTER 201920

4.6 ManufacturingThe manufacturing sector is estimated to have recorded a strong growth of 18.8 percent in real value added during the second quarter of 2019 compared to a decline of 8.7 percent recorded in the corresponding quarter of 2018 (Figure 15).
Figure 15: Manufacturing real value added growth rate
The performance of the sector is observed in real value added of almost all the subsectors; where by subsectors beverages, basic metals, and diamond processing posted strong growths of 20.1 percent, 54.1 percent and 22.4 percent compared to declines of 12.8 percent, 28.1 percent and 3.2 percent, respectively (Figure 16).
214 Key findings

-40.0
-30.0
-20.0
-10.0
0.0
10.0
20.0
30.0
40.0
50.0
60.0
70.0
80.0
Q1 Q2 Q3 Q4 Q1 Q2 Q3 Q4 Q1 Q2 Q3 Q4 Q1 Q2 Q3 Q4 Q1 Q2 Q3 Q4 Q1 Q2 Q3 Q4 Q1 Q2 Q3 Q4 Q1 Q2 Q3 Q4 Q1 Q2 Q3 Q4 Q1 Q2
2010 2011 2012 2013 2014 2015 2016 2017 2018 2019
Perc
enta
ge
Beverages Basic metals Diamond processing
Figure 16: Beverages, basic metals and diamond processing real value added growth rate2
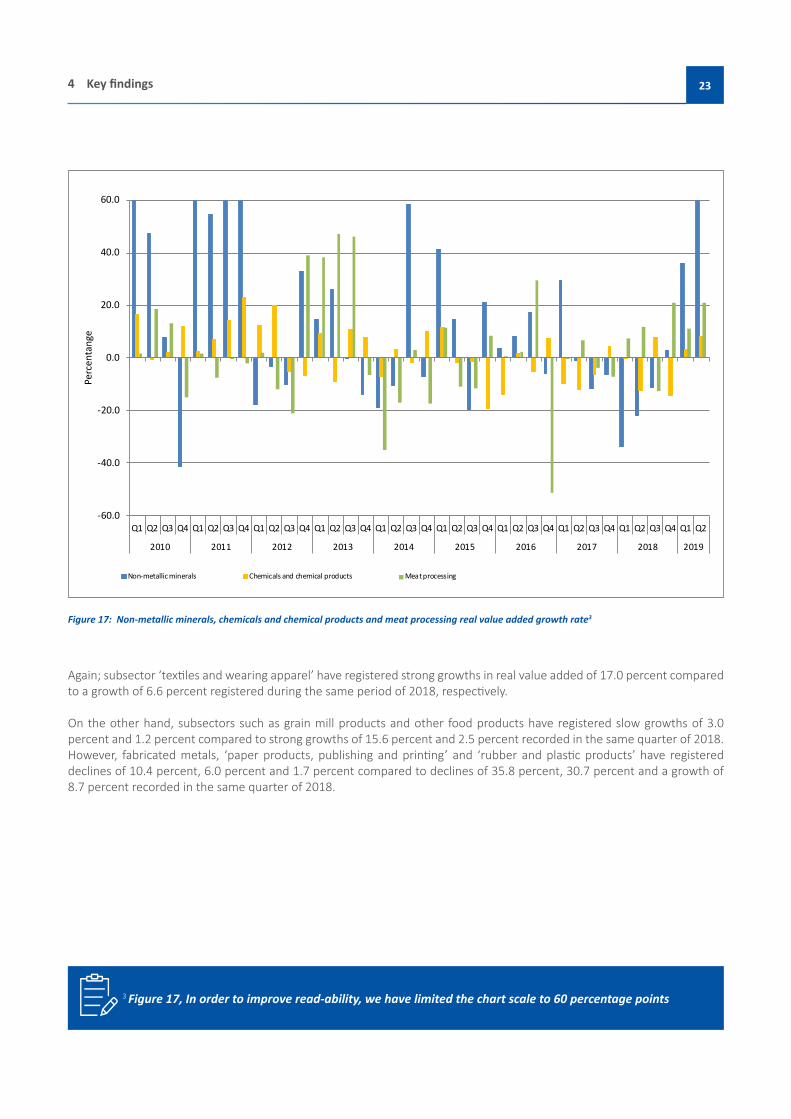
In addition, subsectors non-metallic mineral products; ‘chemicals and chemicals products’ and meat processing registered positive growths of 60.8 percent, 8.5 percent and 21.2 percent in real value added compared to declines of 21.7 percent, 12.2 percent and 11.7 percent recorded in the corresponding quarter of 2018 (Figure 17).
2 Figure 16, In order to improve read-ability, we have limited the chart scale to 40 percentage points and 80 percentage points
GROSS DOMESTIC PRODUCT - SECOND QUARTER 201922
-60.0
-40.0
-20.0
0.0
20.0
40.0
60.0
Q1 Q2 Q3 Q4 Q1 Q2 Q3 Q4 Q1 Q2 Q3 Q4 Q1 Q2 Q3 Q4 Q1 Q2 Q3 Q4 Q1 Q2 Q3 Q4 Q1 Q2 Q3 Q4 Q1 Q2 Q3 Q4 Q1 Q2 Q3 Q4 Q1 Q2
2010 2011 2012 2013 2014 2015 2016 2017 2018 2019
Perc
enta
nge
Non-metallic minerals Chemicals and chemical products Meat processing
Figure 17: Non-metallic minerals, chemicals and chemical products and meat processing real value added growth rate3
Again; subsector ‘textiles and wearing apparel’ have registered strong growths in real value added of 17.0 percent compared to a growth of 6.6 percent registered during the same period of 2018, respectively.
On the other hand, subsectors such as grain mill products and other food products have registered slow growths of 3.0 percent and 1.2 percent compared to strong growths of 15.6 percent and 2.5 percent recorded in the same quarter of 2018.However, fabricated metals, ‘paper products, publishing and printing’ and ‘rubber and plastic products’ have registered declines of 10.4 percent, 6.0 percent and 1.7 percent compared to declines of 35.8 percent, 30.7 percent and a growth of 8.7 percent recorded in the same quarter of 2018.
3 Figure 17, In order to improve read-ability, we have limited the chart scale to 60 percentage points
234 Key findings

4.7 Electricity and waterThe electricity and water sector slowed, registering a growth of 2.7 percent in real value added in the second quarter of 2019 compared to a strong growth of 16.3 percent recorded in the corresponding quarter of 2018 (Figure 18).
Figure 18: Electricity and water real value added growth rate
The performance of the sector is attributed to both the water and electricity subsectors that recorded positive growths. The water subsector recorded a growth of 6.7 percent in real value added, compared to a strong growth of 23.0 percent recorded during the corresponding quarter of 2018. Equally, the electricity subsector recorded a growth of 1.9 percent during the period under review compared to a growth of 15.0 percent recorded during the same quarter of 2018 (Figure 19).
GROSS DOMESTIC PRODUCT - SECOND QUARTER 201924
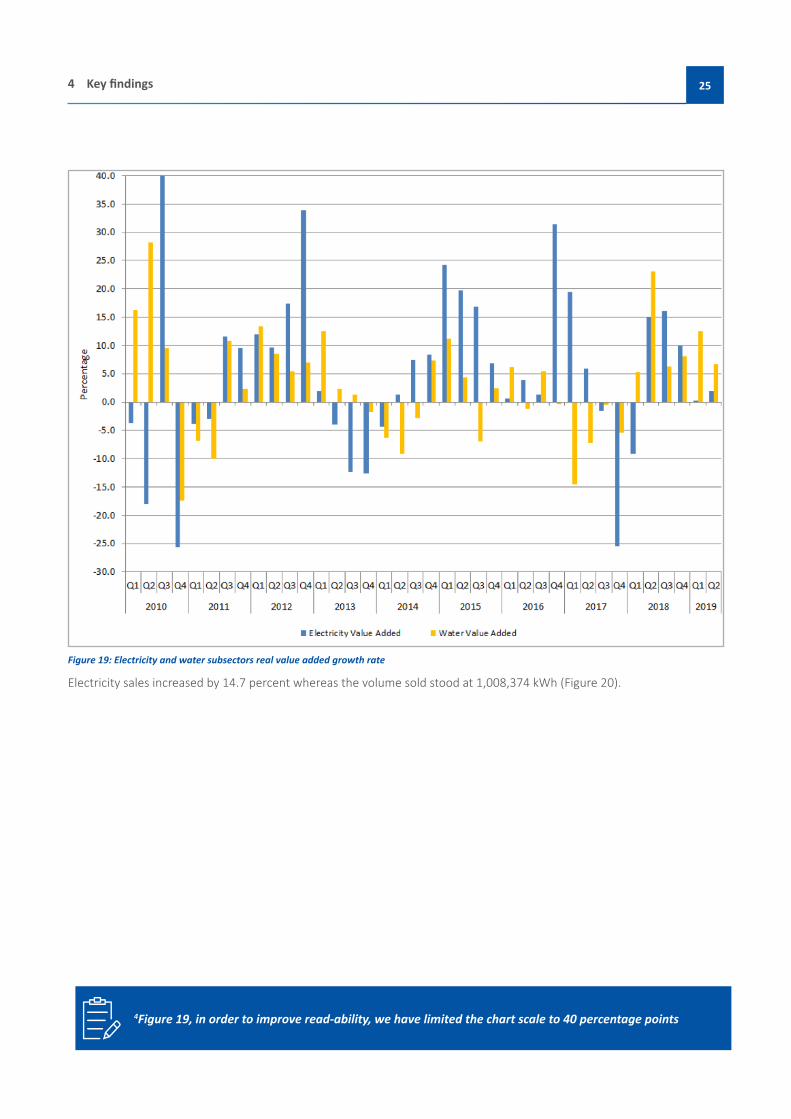
Figure 19: Electricity and water subsectors real value added growth rate
Electricity sales increased by 14.7 percent whereas the volume sold stood at 1,008,374 kWh (Figure 20).
4Figure 19, in order to improve read-ability, we have limited the chart scale to 40 percentage points
254 Key findings

Figure 20: Total units of electricity sold in millions of KWH
During the quarter under review, the country imported 776,886 kWh of electricity, representing an increase of 40.6 percent compared to a contraction of 19.3 percent recorded in the same quarter of 2018 (Figure 21).
GROSS DOMESTIC PRODUCT - SECOND QUARTER 201926

Figure 21: Sources of electricity in millions of KWH
274 Key findings

4.8 Construction5
The construction sector marginally improved recording a contraction of 5.5 percent in real value added for the second quarter of 2019 compared to 7.5 percent registered in the corresponding quarter of 2018 (Figure 22).
Figure 22: Construction real value added growth rate
The performance in the sector is attributed to government expenditure on construction that have improved significantly and recorded a strong real growth of 52.8 percent compared to a decline of 21.6 percent registered in the corresponding quarter of 2018 (Figure 23).
5The methodology to estimate value added for construction uses a moving average of two quarters as construction spans over time.
GROSS DOMESTIC PRODUCT - SECOND QUARTER 201928

Figure 23: Real value of Government Expenditure on construction – millions N$6
In addition, buildings completed also posted a strong growth in real value of 39.5 percent compared to a growth of 4.3 percent in the corresponding quarter of 2018 (Figure 24).
6The figure for the government expenditure on construction is preliminary and may be subject to change.
294 Key findings

Figure 23: Real Value of buildings completed – millions N$
The increase in the value of buildings completed is mainly observed in the central region that registered a growth of 97.1 percent compared to a strong growth of 127.7 percent recorded in the corresponding quarter of 2018.
However, the buildings completed in western and northern regions registered declines in real value of 2.2 percent and 34.2 percent compared to declines of 34.6 percent and 18.1 percent recorded in the second quarter of 2018, respectively.
GROSS DOMESTIC PRODUCT - SECOND QUARTER 201930

4.9 Wholesale and retail trade
The wholesale and retail trade sector is estimated to have recorded a decline of 2.0 percent in real value added during the second quarter of 2019 compared to a decline of 7.3 percent registered in the corresponding quarter of 2018 (Figure 25). This is an improved growth as compared to the same quarter of 2018.
Figure 25: Wholesale and retail trade real value added growth rate
The performance of the sector is reflected in total revenue of wholesale and retail trade that recorded an increase of 2.5 percent compared to a decline of 1.2 percent recorded in the same quarter of 2018 ( (Figure 26).
314 Key findings

Figure 26: Total revenue of wholesale and retail trade – millions N$
GROSS DOMESTIC PRODUCT - SECOND QUARTER 201932
7The figures for hotels and restaurants must be interpreted with caution as they are based only on Hospitality Association of Namibia (HAN) membership.
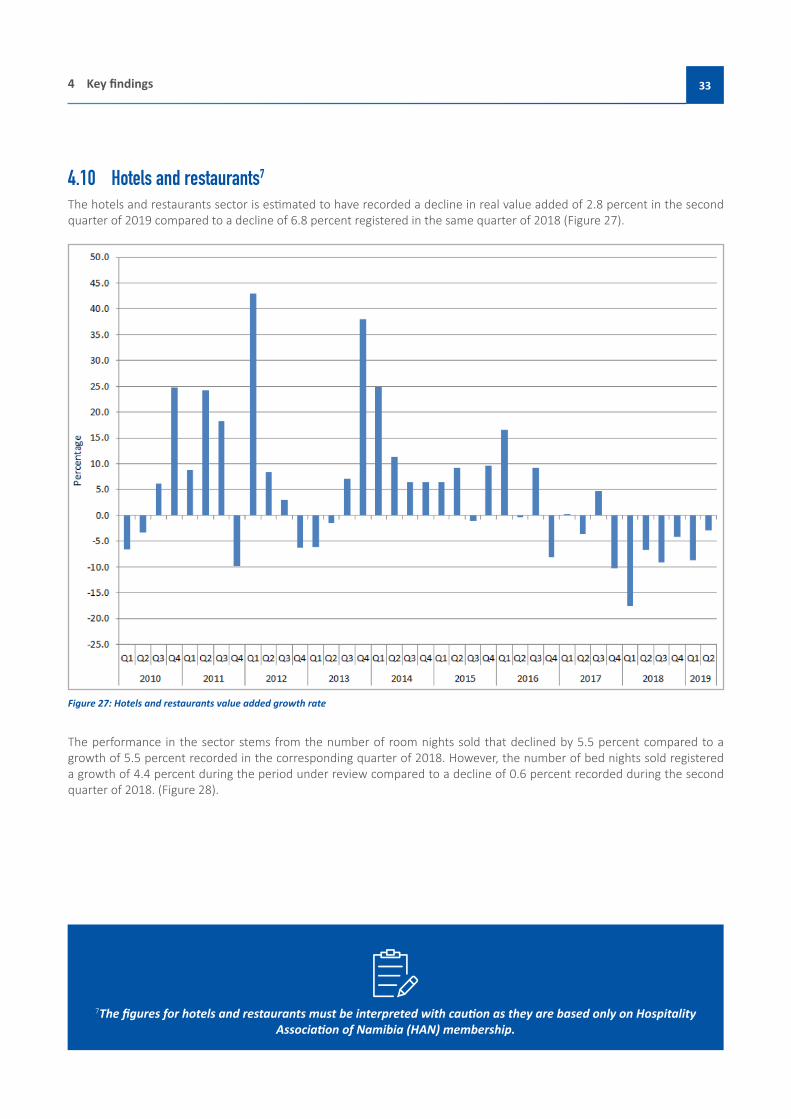
4.10 Hotels and restaurants7 The hotels and restaurants sector is estimated to have recorded a decline in real value added of 2.8 percent in the second quarter of 2019 compared to a decline of 6.8 percent registered in the same quarter of 2018 (Figure 27).
Figure 27: Hotels and restaurants value added growth rate
The performance in the sector stems from the number of room nights sold that declined by 5.5 percent compared to a growth of 5.5 percent recorded in the corresponding quarter of 2018. However, the number of bed nights sold registered a growth of 4.4 percent during the period under review compared to a decline of 0.6 percent recorded during the second quarter of 2018. (Figure 28).
334 Key findings

Figure 28: Growth rate in number of bed nights and room nights sold
GROSS DOMESTIC PRODUCT - SECOND QUARTER 201934

4.11 Transport and communicationThe transport and communication sector is estimated to have recorded a negative growth in real value added of 0.9 percent in the second quarter of 2019, compared to a decline of 6.7 percent recorded in the same quarter of 2018. This is an improvement when compared to the same quarter of the previous year (Figure 29). The performance of the sector is mainly attributed to railway transport and telecommunications that recorded positive growths of 24.4 percent and 0.9 percent in real value added, respectively.
Figure 29: Transport and communication real value added growth rate
Railway transport subsector is estimated to have registered a strong growth of 24.4 percent in real value added, compared to a decline of 9.1 percent registered in the same quarter of 2018. The performance of the subsector is attributed the volume of freight transported that has increased in the period under review, compared to the corresponding quarter of 2018 (Figure 30).
354 Key findings

-
100
200
300
400
500
600
700
Q1 Q2 Q3 Q4 Q1 Q2 Q3 Q4 Q1 Q2 Q3 Q4 Q1 Q2 Q3 Q4 Q1 Q2 Q3 Q4 Q1 Q2 Q3 Q4 Q1 Q2 Q3 Q4 Q1 Q2 Q3 Q4 Q1 Q2 Q3 Q4 Q1 Q2
2010 2011 2012 2013 2014 2015 2016 2017 2018 2019
Thou
sand
s of t
onne
s
Trans Namib Rail Trans Namib Road
Source: Trans NamibFigure 30: Volume of freight transported in thousands of tonnes
Telecommunication subsector is estimated to have recovered, registering an improved growth of 0.9 percent in real value added, compared to a decline of 12.4 percent registered in the same quarter of 2018.
Subsectors such as Post & couriers and passengers transport, are estimated to have recorded slow growths of 2.4 percent and 0.3 percent in real value added compared to 11.1 percent and 1.6 percent recorded in the corresponding quarter of 2018, respectively.
However, subsectors such as air transport, airport services, freight transport and port services are estimated to have recorded negative growths of 6.2 percent, 7.6 percent, 2.9 percent and 5.5 percent in real value added, respectively.The poor performance in port services is attributed to the decline in cargo handled at the ports (Figure 31).
GROSS DOMESTIC PRODUCT - SECOND QUARTER 201936

-
200
400
600
800
1,000
1,200
1,400
1,600
1,800
2,000
Q1 Q2 Q3 Q4 Q1 Q2 Q3 Q4 Q1 Q2 Q3 Q4 Q1 Q2 Q3 Q4 Q1 Q2 Q3 Q4 Q1 Q2 Q3 Q4 Q1 Q2 Q3 Q4 Q1 Q2 Q3 Q4 Q1 Q2 Q3 Q4 Q1 Q2
2010 2011 2012 2013 2014 2015 2016 2017 2018 2019
Thou
sand
s of t
onne
s
Source: Namibia Ports AuthorityFigure 31: Volume of freight transported in thousands of tonnes
374 Key findings

4.12 Financial intermediationThe financial intermediation sector posted a growth of 1.9 percent in real value added in the second quarter of 2019, compared to a growth of 0.7 percent recorded in the corresponding quarter of 2018 (Figure 32).
Figure 32: Financial intermediation value added growth rate
The performance is attributed to the banking subsector that grew by 3.4 percent in real value added compared to a growth of 0.3 percent estimated in the corresponding quarter of 2018 (Figure 33).
On the other hand, the insurance subsector estimated a contraction of 0.4 percent as compared to the 1.3 percent observed in the corresponding quarter of 2018.
GROSS DOMESTIC PRODUCT - SECOND QUARTER 201938

Figure 33: Banking and insurance value added growth rate
Year on year total deposits rose by 11.6 percent during the period under review, the growth is supported by increases in both total stock of deposits of households and government. Total stock of deposits stood at N$ 105,024 million compared to N$ 94,148 million recorded during the corresponding quarter of 2018.
Similarly, total claims by all sectors increased by 8.4 percent in the second quarter of 2019, standing at N$ 106,775 million. During the period under review, total claims by government increased to N$ 20,487 million compared to N$ 17,199 million in the corresponding quarter of 2018.
Figure 34 below shows deposits made by all sectors; claims made by the private and net claims by the government sector since the first quarter of 2010
394 Key findings

Source: Bank of NamibiaFigure 34: Deposits and claims
GROSS DOMESTIC PRODUCT - SECOND QUARTER 201940
4.13 Public Administration and defence, Education and Health
The public sector estimated a decline of 2.7 percent in real value added in the second quarter of 2019 compared to a growth of 0.7 percent estimated in the preceding quarter of 2018. The performance is attributed to a reduction observed in the number of staff employed.
The education sector also recorded a contraction, however an improvement of 0.9 percent in real value added in the second quarter of 2019 as compared to a decline of 3.1 percent in the corresponding quarter of 2018. The performance stems from an increase in the number of teachers employed.
Additionally, the health sector registered a marginal contraction of 2.6 percent in real value added during the period under review as compared to a decline of 2.0 percent estimated in the corresponding quarter of 2018.
414 Key findings

Table B: Quarterly Gross Domestic Product by Activity in Constant 2010 Prices - million N$
Year Quarter Agriculture FishingMining
and quarrying
Manufac-turing
Electricity and water
Construc-tion
Wholesale and retail
trade
Hotels and restau-rants
Transport and com-
munication2008 1 1,010 524 2,366 2,410 481 874 1,849 363 855
2 1,042 610 2,391 2,279 538 757 1,920 371 738 3 760 562 2,673 2,457 436 634 2,014 261 912 4 766 467 2,863 2,250 344 707 2,067 271 920
2009 1 736 911 1,335 2,507 422 778 1,985 235 958 2 929 803 1,808 2,231 479 641 2,062 329 968 3 890 715 1,610 2,293 159 492 2,189 419 990 4 1,260 513 2,281 2,555 443 540 2,399 351 1,058
2010 1 1,020 797 1,924 2,476 424 723 2,112 220 1,050 2 1,092 816 2,736 2,580 430 634 2,205 318 1,034 3 975 763 2,171 2,629 346 537 2,435 444 1,058 4 1,127 494 1,768 2,622 339 724 2,532 438 1,095
2011 1 959 816 2,180 2,657 405 865 2,251 239 1,078 2 1,084 679 1,586 2,628 410 734 2,320 396 1,092 3 998 736 2,231 2,754 385 659 2,489 525 1,105 4 1,216 502 2,135 2,854 364 776 2,767 395 1,168
2012 1 1,087 765 2,105 2,632 453 915 2,523 341 1,157 2 1,240 643 2,669 2,581 447 869 2,410 428 1,171 3 1,015 623 2,593 2,351 441 665 2,511 541 1,210 4 1,261 494 2,805 2,583 464 812 2,801 370 1,263
2013 1 955 584 2,503 2,573 474 1,003 2,524 320 1,242 2 955 655 2,563 2,894 437 972 2,819 422 1,245 3 799 770 2,652 2,784 400 1,030 3,053 579 1,345 4 1,003 593 2,630 2,345 415 1,191 3,362 511 1,275
2014 1 901 685 2,340 2,560 451 1,470 3,153 400 1,351 2 1,137 695 2,544 2,697 432 1,425 2,933 470 1,298 3 982 702 2,222 2,681 420 1,389 3,443 617 1,361 4 1,107 455 2,619 2,647 448 1,699 3,858 544 1,389
2015 1 859 770 2,317 2,346 546 1,911 3,297 426 1,469 2 924 764 2,270 2,572 502 1,848 3,342 513 1,426 3 808 659 2,370 2,621 467 1,717 3,682 610 1,392 4 1,105 404 2,288 2,596 474 1,961 4,061 596 1,482
2016 1 847 799 2,344 2,615 554 1,629 3,457 496 1,594 2 1,007 819 1,894 2,503 516 1,211 3,682 511 1,526 3 926 662 2,320 2,557 477 1,289 3,800 666 1,508 4 981 553 2,395 3,027 591 1,354 3,885 548 1,542
2017 1 988 819 2,666 2,722 619 1,101 3,233 497 1,534 2 1,219 768 2,215 2,748 534 822 3,255 493 1,457 3 1,062 728 2,456 2,755 471 991 3,468 698 1,384 4 1,031 557 2,810 2,682 463 1,198 3,698 492 1,394
2018 1 990 808 3,024 2,734 578 1,093 3,095 410 1,432 2 1,253 816 2,979 2,509 621 760 3,017 460 1,360 3 990 716 2,894 2,905 537 677 3,213 634 1,328 4 972 617 2,971 2,776 507 831 3,340 471 1,464
2019 1 680 834 2,995 2,833 593 790 2,879 374 1,425 2 901 821 2,377 2,980 638 718 2,956 446 1,348
GROSS DOMESTIC PRODUCT - SECOND QUARTER 201942

Table B: Quarterly Gross Domestic Product by Activity in Constant 2010 Prices - million N$ (Cont)
Year QuarterFinancial interme-diation
Real estate activities
and business services
Public admi-
nistrationEducation Health
Other private services
FISIMAll indust.
at basic prices
Taxes on products
GDP at market prices
2008 1 1,051 1,579 2,569 1,401 682 733 231 18,514 1,364 19,878 2 1,093 1,610 1,767 1,360 433 734 229 17,413 1,409 18,822 3 1,129 1,644 2,221 1,459 530 734 235 18,190 1,465 19,655 4 1,037 1,681 1,850 1,492 547 734 190 17,807 1,503 19,310
2009 1 1,038 1,721 2,036 1,422 629 750 194 17,269 1,398 18,667 2 1,041 1,750 1,062 1,432 423 748 201 16,508 1,482 17,990 3 1,033 1,767 2,867 1,570 677 746 200 18,215 1,610 19,825 4 1,089 1,772 2,885 1,458 581 742 225 19,704 1,709 21,412
2010 1 1,144 1,766 2,030 1,550 763 755 251 18,503 1,392 19,895 2 1,166 1,770 1,714 1,266 512 760 254 18,779 1,450 20,229 3 1,135 1,784 2,413 1,458 767 775 246 19,443 1,638 21,082 4 1,157 1,808 2,943 1,599 489 799 261 19,672 1,721 21,393
2011 1 1,150 1,842 2,780 1,683 545 851 256 20,044 1,428 21,473 2 1,203 1,872 2,540 1,709 427 865 277 19,269 1,543 20,812 3 1,235 1,898 2,941 1,790 1,022 861 289 21,340 1,696 23,035 4 1,275 1,920 1,318 1,712 680 837 297 19,623 1,862 21,484
2012 1 1,276 1,938 4,024 1,815 641 815 287 22,200 1,694 23,895 2 1,283 1,958 2,012 1,671 547 780 290 20,419 1,696 22,114 3 1,307 1,981 2,077 1,714 754 752 288 20,246 1,798 22,045 4 1,328 2,006 1,725 2,000 884 733 304 21,225 1,919 23,144
2013 1 1,463 2,033 3,028 1,676 695 713 323 21,463 1,749 23,212 2 1,504 2,056 2,022 1,651 800 701 345 21,350 1,960 23,310 3 1,550 2,073 3,069 2,129 754 696 357 23,328 2,099 25,426 4 1,606 2,086 2,090 1,982 829 698 364 22,252 2,119 24,371
2014 1 1,616 2,094 2,696 1,909 1,031 707 343 23,021 1,929 24,950 2 1,654 2,108 2,205 1,944 705 720 354 22,613 1,845 24,458 3 1,744 2,128 3,070 2,238 696 735 378 24,049 2,151 26,200 4 1,774 2,153 2,375 2,110 961 754 387 24,505 2,324 26,829
2015 1 1,747 2,186 3,014 2,113 1,114 774 381 24,508 2,057 26,566 2 1,758 2,210 2,570 2,065 854 789 366 24,042 2,185 26,227 3 1,789 2,226 3,493 2,191 886 798 372 25,336 2,427 27,763 4 1,830 2,233 2,718 2,169 1,133 800 345 25,506 2,610 28,116
2016 1 1,796 2,192 3,228 2,351 1,228 797 389 25,537 2,179 27,716 2 1,808 2,179 2,567 2,137 1,015 794 364 23,806 2,293 26,099 3 1,839 2,177 3,486 2,269 952 791 373 25,346 2,429 27,775 4 1,884 2,186 3,096 2,279 1,080 789 369 25,822 2,481 28,302
2017 1 1,874 2,205 3,304 2,404 1,272 789 361 25,663 2,062 27,726 2 1,932 2,221 2,664 2,170 988 786 367 23,908 2,109 26,017 3 1,969 2,234 3,374 2,190 956 783 388 25,131 2,334 27,465 4 1,968 2,244 3,068 2,273 1,019 778 377 25,297 2,434 27,731
2018 1 1,922 2,249 3,304 2,283 1,198 773 363 25,529 2,059 27,588 2 1,946 2,253 2,684 2,102 969 769 363 24,133 2,052 26,185 3 1,983 2,256 3,421 2,192 929 766 373 25,067 2,302 27,369 4 2,018 2,258 3,055 2,200 1,010 764 403 24,852 2,351 27,202
2019 1 1,949 2,258 3,265 2,312 1,227 764 379 24,799 1,989 26,788 2 1,983 2,258 2,612 2,084 943 764 385 23,444 2,071 25,515
434 Key findings

Table C: Quarterly Gross Domestic Product by Activity in Constant 2010 Prices – Percentage changes
Year Quarter Agricul-ture FishingMining
and quarrying
Manufac-turing
Electricity and water
Construc-tion
Wholesale and retail
trade
Hotels and restau-rants
Transport and com-
munication2008 1 -15.1 2.5 -20.2 86.5 -13.2 39.3 0.2 35.0 12.8
2 -30.2 29.4 8.1 9.6 3.1 29.3 -4.1 44.9 3.8 3 -28.5 29.3 25.2 -27.3 -18.6 7.3 -4.3 -21.4 11.1 4 -34.2 -6.4 5.1 2.0 -5.3 -8.5 -6.9 -26.0 14.4
2009 1 -27.1 74.0 -43.6 4.0 -12.1 -11.0 7.3 -35.2 12.1 2 -10.8 31.6 -24.4 -2.1 -11.0 -15.3 7.4 -11.1 31.2 3 17.2 27.3 -39.8 -6.7 -63.6 -22.4 8.7 60.4 8.6 4 64.5 9.7 -20.3 13.6 28.8 -23.6 16.1 29.6 15.0
2010 1 38.6 -12.5 44.1 -1.3 0.3 -7.0 6.4 -6.5 9.6 2 17.5 1.7 51.3 15.6 -10.3 -1.1 6.9 -3.3 6.8 3 9.5 6.8 34.8 14.7 118.2 9.1 11.2 6.1 6.9 4 -10.6 -3.6 -22.5 2.6 -23.5 33.9 5.5 24.8 3.6
2011 1 -6.0 2.3 13.3 7.3 -4.4 19.6 6.6 8.7 2.7 2 -0.7 -16.8 -42.0 1.9 -4.6 15.8 5.2 24.2 5.6 3 2.4 -3.5 2.8 4.8 11.4 22.8 2.2 18.2 4.4 4 7.9 1.5 20.8 8.8 7.4 7.2 9.3 -9.8 6.7
2012 1 13.3 -6.2 -3.4 -0.9 11.9 5.8 12.1 42.9 7.3 2 14.3 -5.3 68.2 -1.8 9.1 18.3 3.9 8.3 7.2 3 1.7 -15.3 16.2 -14.7 14.4 0.9 0.9 3.0 9.5 4 3.7 -1.6 31.4 -9.5 27.6 4.6 1.2 -6.4 8.1
2013 1 -12.1 -23.7 18.9 -2.3 4.7 9.6 0.0 -6.2 7.42 -22.9 1.9 -4.0 12.1 -2.3 11.8 17.0 -1.6 6.43 -21.3 23.5 2.3 18.4 -9.2 55.0 21.6 7.1 11.24 -20.5 20.1 -6.2 -9.2 -10.7 46.7 20.1 38.1 1.0
2014 1 -5.7 17.3 -6.5 -0.5 -4.8 46.5 25.0 24.9 8.8 2 19.0 6.1 -0.7 -6.8 -1.1 46.7 4.1 11.3 4.2 3 22.9 -8.9 -16.2 -3.7 4.9 34.8 12.8 6.4 1.2 4 10.3 -23.2 -0.4 12.9 8.1 42.6 14.7 6.4 8.9
2015 1 -4.7 12.4 -1.0 -8.4 21.1 30.0 4.5 6.4 8.8 2 -18.7 9.9 -10.8 -4.6 16.4 29.6 13.9 9.3 9.8 3 -17.7 -6.1 6.7 -2.3 11.2 23.6 7.0 -1.1 2.3 4 -0.2 -11.3 -12.6 -1.9 5.7 15.5 5.3 9.6 6.7
2016 1 -1.4 3.8 1.2 11.5 1.5 -14.8 4.9 16.5 8.5 2 9.0 7.3 -16.6 -2.7 2.7 -34.4 10.2 -0.4 7.0 3 14.6 0.4 -2.1 -2.4 2.2 -24.9 3.2 9.2 8.3 4 -11.2 37.0 4.7 16.6 24.7 -30.9 -4.3 -8.2 4.1
2017 1 16.7 2.4 13.7 4.1 11.6 -32.4 -6.5 0.2 -3.8 2 21.1 -6.2 17.0 9.8 3.5 -32.2 -11.6 -3.6 -4.5 3 14.7 10.0 5.8 7.7 -1.3 -23.2 -8.7 4.7 -8.2 4 5.1 0.7 17.3 -11.4 -21.7 -11.5 -4.8 -10.2 -9.6
2018 1 0.2 -1.3 13.4 0.5 -6.6 -0.7 -4.3 -17.5 -6.6 2 2.7 6.2 34.5 -8.7 16.3 -7.5 -7.3 -6.8 -6.7 3 -6.8 -1.6 17.8 5.4 14.1 -31.7 -7.4 -9.1 -4.1 4 -5.7 10.8 5.7 3.5 9.6 -30.6 -9.7 -4.2 5.1
2019 1 -31.4 3.3 -1.0 3.6 2.7 -27.8 -7.0 -8.7 -0.5 -28.1 0.6 -20.2 18.8 2.7 -5.5 -2.0 -2.8 -0.9
GROSS DOMESTIC PRODUCT - SECOND QUARTER 201944
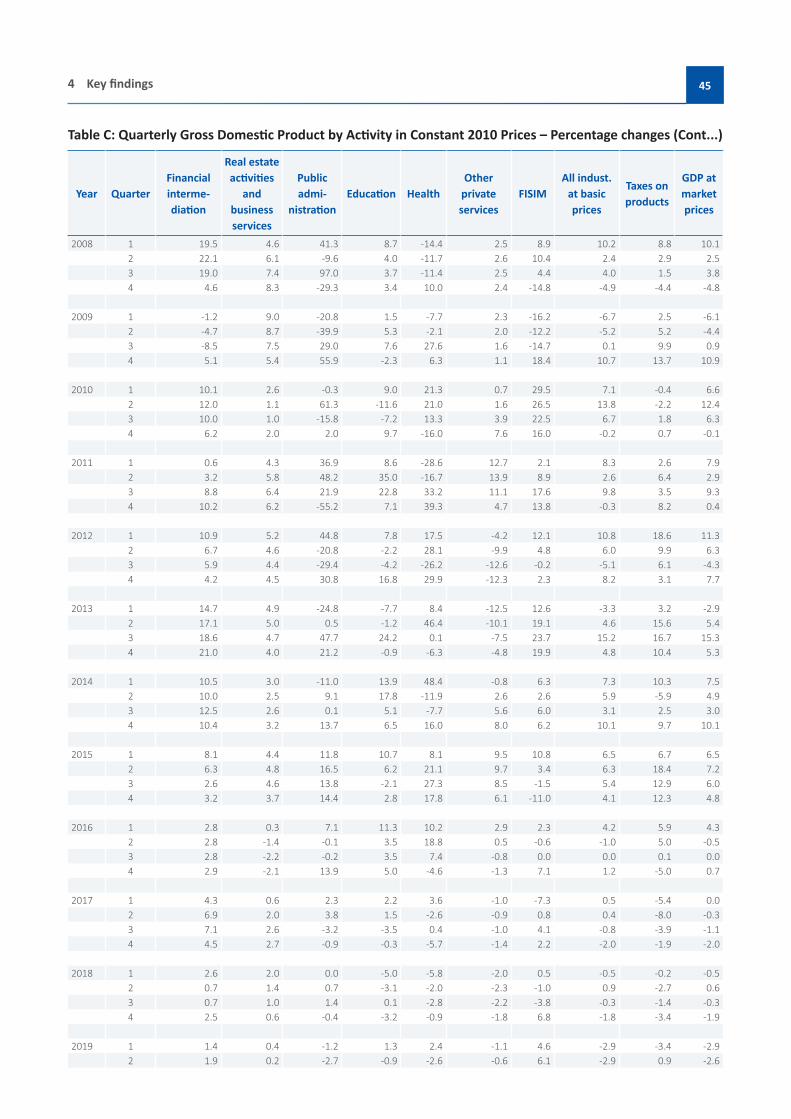
Table C: Quarterly Gross Domestic Product by Activity in Constant 2010 Prices – Percentage changes (Cont...)
Year QuarterFinancial interme-diation
Real estate activities
and business services
Public admi-
nistrationEducation Health
Other private services
FISIMAll indust.
at basic prices
Taxes on products
GDP at market prices
2008 1 19.5 4.6 41.3 8.7 -14.4 2.5 8.9 10.2 8.8 10.1 2 22.1 6.1 -9.6 4.0 -11.7 2.6 10.4 2.4 2.9 2.5 3 19.0 7.4 97.0 3.7 -11.4 2.5 4.4 4.0 1.5 3.8 4 4.6 8.3 -29.3 3.4 10.0 2.4 -14.8 -4.9 -4.4 -4.8
2009 1 -1.2 9.0 -20.8 1.5 -7.7 2.3 -16.2 -6.7 2.5 -6.1 2 -4.7 8.7 -39.9 5.3 -2.1 2.0 -12.2 -5.2 5.2 -4.4 3 -8.5 7.5 29.0 7.6 27.6 1.6 -14.7 0.1 9.9 0.9 4 5.1 5.4 55.9 -2.3 6.3 1.1 18.4 10.7 13.7 10.9
2010 1 10.1 2.6 -0.3 9.0 21.3 0.7 29.5 7.1 -0.4 6.6 2 12.0 1.1 61.3 -11.6 21.0 1.6 26.5 13.8 -2.2 12.4 3 10.0 1.0 -15.8 -7.2 13.3 3.9 22.5 6.7 1.8 6.3 4 6.2 2.0 2.0 9.7 -16.0 7.6 16.0 -0.2 0.7 -0.1
2011 1 0.6 4.3 36.9 8.6 -28.6 12.7 2.1 8.3 2.6 7.9 2 3.2 5.8 48.2 35.0 -16.7 13.9 8.9 2.6 6.4 2.9 3 8.8 6.4 21.9 22.8 33.2 11.1 17.6 9.8 3.5 9.3 4 10.2 6.2 -55.2 7.1 39.3 4.7 13.8 -0.3 8.2 0.4
2012 1 10.9 5.2 44.8 7.8 17.5 -4.2 12.1 10.8 18.6 11.3 2 6.7 4.6 -20.8 -2.2 28.1 -9.9 4.8 6.0 9.9 6.3 3 5.9 4.4 -29.4 -4.2 -26.2 -12.6 -0.2 -5.1 6.1 -4.3 4 4.2 4.5 30.8 16.8 29.9 -12.3 2.3 8.2 3.1 7.7
2013 1 14.7 4.9 -24.8 -7.7 8.4 -12.5 12.6 -3.3 3.2 -2.92 17.1 5.0 0.5 -1.2 46.4 -10.1 19.1 4.6 15.6 5.43 18.6 4.7 47.7 24.2 0.1 -7.5 23.7 15.2 16.7 15.34 21.0 4.0 21.2 -0.9 -6.3 -4.8 19.9 4.8 10.4 5.3
2014 1 10.5 3.0 -11.0 13.9 48.4 -0.8 6.3 7.3 10.3 7.5 2 10.0 2.5 9.1 17.8 -11.9 2.6 2.6 5.9 -5.9 4.9 3 12.5 2.6 0.1 5.1 -7.7 5.6 6.0 3.1 2.5 3.0 4 10.4 3.2 13.7 6.5 16.0 8.0 6.2 10.1 9.7 10.1
2015 1 8.1 4.4 11.8 10.7 8.1 9.5 10.8 6.5 6.7 6.5 2 6.3 4.8 16.5 6.2 21.1 9.7 3.4 6.3 18.4 7.2 3 2.6 4.6 13.8 -2.1 27.3 8.5 -1.5 5.4 12.9 6.04 3.2 3.7 14.4 2.8 17.8 6.1 -11.0 4.1 12.3 4.8
2016 1 2.8 0.3 7.1 11.3 10.2 2.9 2.3 4.2 5.9 4.3 2 2.8 -1.4 -0.1 3.5 18.8 0.5 -0.6 -1.0 5.0 -0.5 3 2.8 -2.2 -0.2 3.5 7.4 -0.8 0.0 0.0 0.1 0.0 4 2.9 -2.1 13.9 5.0 -4.6 -1.3 7.1 1.2 -5.0 0.7
2017 1 4.3 0.6 2.3 2.2 3.6 -1.0 -7.3 0.5 -5.4 0.02 6.9 2.0 3.8 1.5 -2.6 -0.9 0.8 0.4 -8.0 -0.3 3 7.1 2.6 -3.2 -3.5 0.4 -1.0 4.1 -0.8 -3.9 -1.14 4.5 2.7 -0.9 -0.3 -5.7 -1.4 2.2 -2.0 -1.9 -2.0
2018 1 2.6 2.0 0.0 -5.0 -5.8 -2.0 0.5 -0.5 -0.2 -0.5 2 0.7 1.4 0.7 -3.1 -2.0 -2.3 -1.0 0.9 -2.7 0.63 0.7 1.0 1.4 0.1 -2.8 -2.2 -3.8 -0.3 -1.4 -0.3 4 2.5 0.6 -0.4 -3.2 -0.9 -1.8 6.8 -1.8 -3.4 -1.9
2019 1 1.4 0.4 -1.2 1.3 2.4 -1.1 4.6 -2.9 -3.4 -2.9 2 1.9 0.2 -2.7 -0.9 -2.6 -0.6 6.1 -2.9 0.9 -2.6
454 Key findings

Appendix 1 Methodological NotesSystem of National Accounts 1993:The SNA 1993 is an internationally agreed methodology used for compilation of national accounts estimates published by the United Nations in co-operation with other international organizations. This means that the methodology, concepts and classifications are in accordance with the latest guidelines of an internationally agreed system of national accounts.
Quarterly GDP estimates:Quarterly estimates of value added in real terms are less comprehensive and therefore need to be aligned to the annual real estimates. Short-term indicators are used to estimate the quarterly GDP. In terms of coverage, quarterly indicators are not as reliable as in instances where the results of annual estimates are used. Therefore, the quarterly estimates must be adapted to the independent annual estimates when such estimates become available. To this extent, the Proportional Denton Method, which is a technique that generates a series of the quarterly estimates as proportional to the indicator as possible subject to the restrictions provided by the annual data is used.
Classifications:The estimates of value added by industry are classified according to the first revision of the International Standard Industrial Classification of all Economic Activities (ISIC), with suitable adaptations for Namibian conditions.
FISIM: Financial Intermediation Services Indirectly Measured
Regional breakdown:The following regions are represented by municipalities and town councils in respective towns that are surveyed by the NSA;
Central region: WindhoekNorthern region: Okahandja, Otjiwarongo, Outjo, Grootfontein, Tsumeb, Ondangwa, Oshakati, Ongwediva, Okakarara, Rundu and Katima-Mulilo
Eastern region: GobabisWestern region: Swakopmund, Walvis Bay, Henties Bay, Karibib, Usakos and OmaruruSouthern region: Keetmanshoop, Mariental, Karasburg, Nami≠Nüs (Lüderitz) and Rehoboth
Rounding off:There may be rounding off differences that may occur when manually calculating figures as compared to the values published in this report. This report used the MS Excel to round off to the nearest decimal. Please refer to the excel tables.
GROSS DOMESTIC PRODUCT - SECOND QUARTER 201946

47Appendix 1 Methodological Notes
Notes

GROSS DOMESTIC PRODUCT - SECOND QUARTER 201948
Notes

49Appendix 1 Methodological Notes
Notes

GROSS DOMESTIC PRODUCT - SECOND QUARTER 201950
Namibia Statistics AgencyP.O. Box 2133, FGI House, Post Street Mall,Windhoek, Namibia
Tel: +264 61 431 3200Fax: +264 61 431 3253
Email: [email protected]