ground motion prediction equations and seismic...
TRANSCRIPT

Ground Motion Prediction Equations and Seismic Hazard
AssessmentAssessment
Prof. Ellen M. Rathje, Ph.D., P.E.
Department of Civil Architectural andDepartment of Civil, Architectural, and Environmental Engineering
University of Texas at Austin
18 November 2010

Seismic Design FrameworkSource Characterization
Locations of sources (faults)Magnitude (M )Magnitude (Mw)
RecurrenceGround Motion Characterization
Closest distance fault to site (Rcl)Closest distance fault to site (Rcl)Local site conditions
RGround motion =
fxn (magnitude distanceRrup
Soil conditions
fxn (magnitude, distance, site conditions)
Soil conditionsTopographic conditions

Predicting Ground Shaking
• Ground motion prediction equations (GMPE)Statistical models to predict ground shaking− Statistical models to predict ground shaking
− Developed for different tectonic regions (shallow crustal regions subduction zones intra plate)crustal regions, subduction zones, intra-plate)
• Next Generation Attenuation (NGA) ProjectGMPE f h ll t l th k− GMPEs for shallow crustal earthquakes (appropriate for Haiti, based on available data)Based on a consistentl processed dataset of− Based on a consistently processed dataset of recordingsFive models generated by 5 separate teams− Five models generated by 5 separate teams

NGA Database
• 3551 recordings
• 173 earthquakes
• Mw = 4.2 - 7.9
Recordings available at http://peer.berkeley.edu/nga

NGA Models
ln (Y) = fsource (M, mechanism) + fdistance (M, Rrup) + f (Vs others)+ fsite (Vs, others)
where Y = spectral acceleration at period, T
• Key Parameters− M: moment magnitudeM: moment magnitude− Style of faulting (mechanism):
reverse strike-slip normalreverse, strike slip, normal− Rrup: distance to fault rupture plane− Vs30: average shear wave velocity in top 30 mVs30: average shear wave velocity in top 30 m− Z1.0: depth to Vs = 1.0 km/s
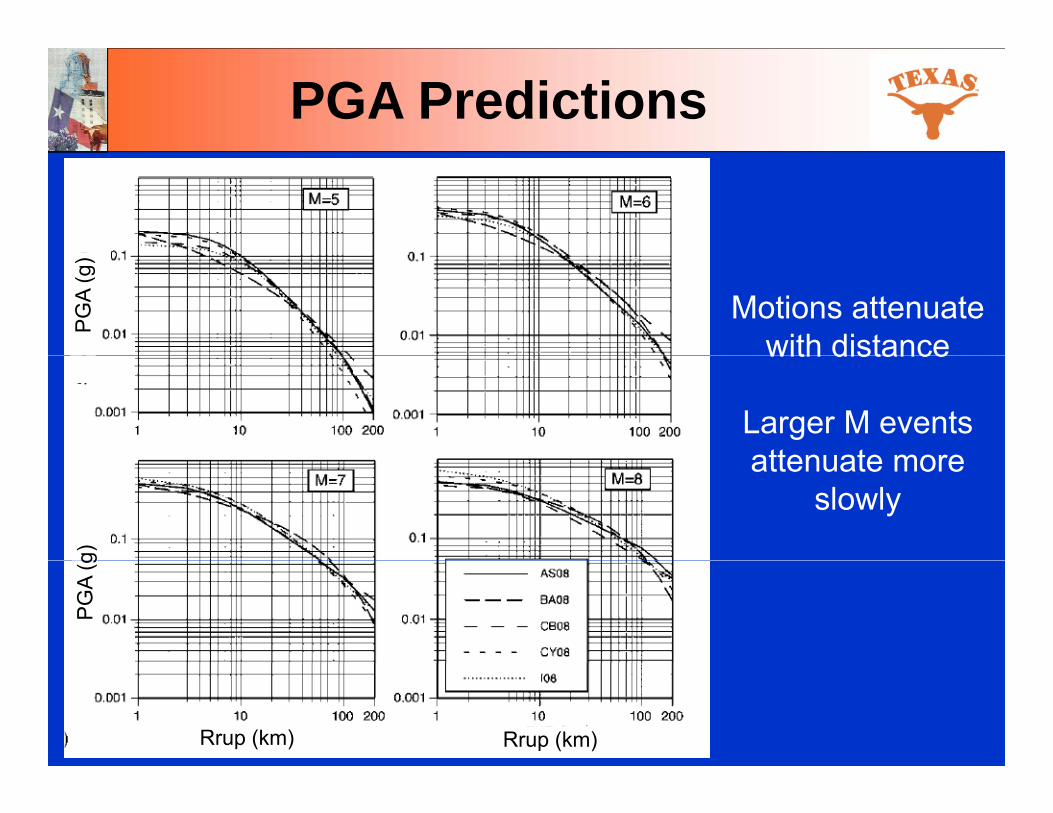
PGA PredictionsP
GA
(g)
Motions attenuate with distancewith distance
Larger M events attenuate more
g)
attenuate more slowly
PG
A (g
Rrup (km) Rrup (km)

Response Spectra PredictionsRrup = 10 km
Vs30 = 760 m/s (R k)
0.08 g
(Rock) 0.02 g
PGA:PGA: M7 is 3x larger
than M50.25 g
0.18 gSa at T = 1.0 s: M7 is 9x largerM7 is 9x larger
than M5
Rrup (km)

Influence of Vs30: Site Effects
M = 7, Rrup = 30 kmVs30 = 760 m/s (“Rock”)
0 1 g0.14 g
PGA 0 09
0.2 g
0.1 gPGA: 200 m/s is 1.4x
larger than 760 m/s
0.09 g
g
Sa at T = 1.0 s: 200 / i 2 2200 m/s is 2.2x
larger than 760 m/s

Scatter in Ground Motions
• Given M, Rrup large range of possible motionsmotions
1994 Northridge (Mw = 6.7) io
n (g
)
( w )Earthquake
Acc
eler
atPe
ak A
From D. Boore Distance (km)
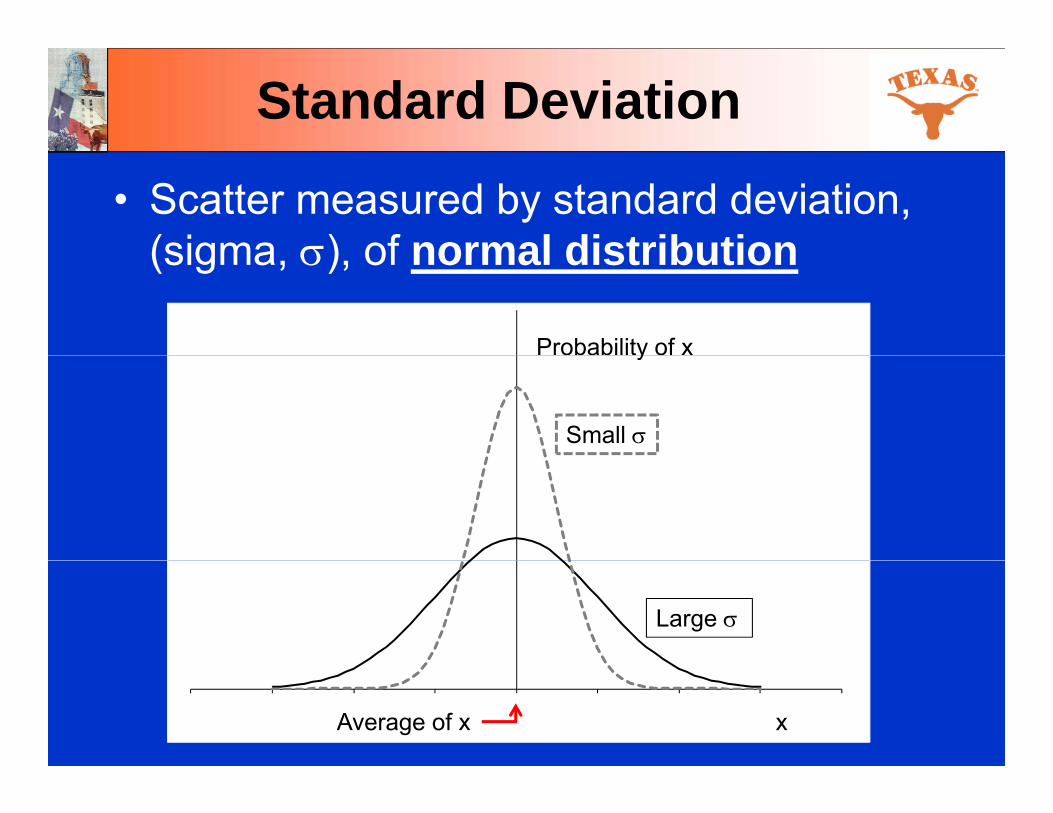
Standard Deviation
• Scatter measured by standard deviation, (sigma ) of normal distribution(sigma, ), of normal distribution
Probability of xy
Small
Large
xAverage of x

Sigma for GMPEs
• Ground motions are log-normally distributed (i e ln of x is normally distributed)(i.e., ln of x is normally distributed)
Probability of ln(x)y ( )
Small
Large
ln(x)Average of ln(x)
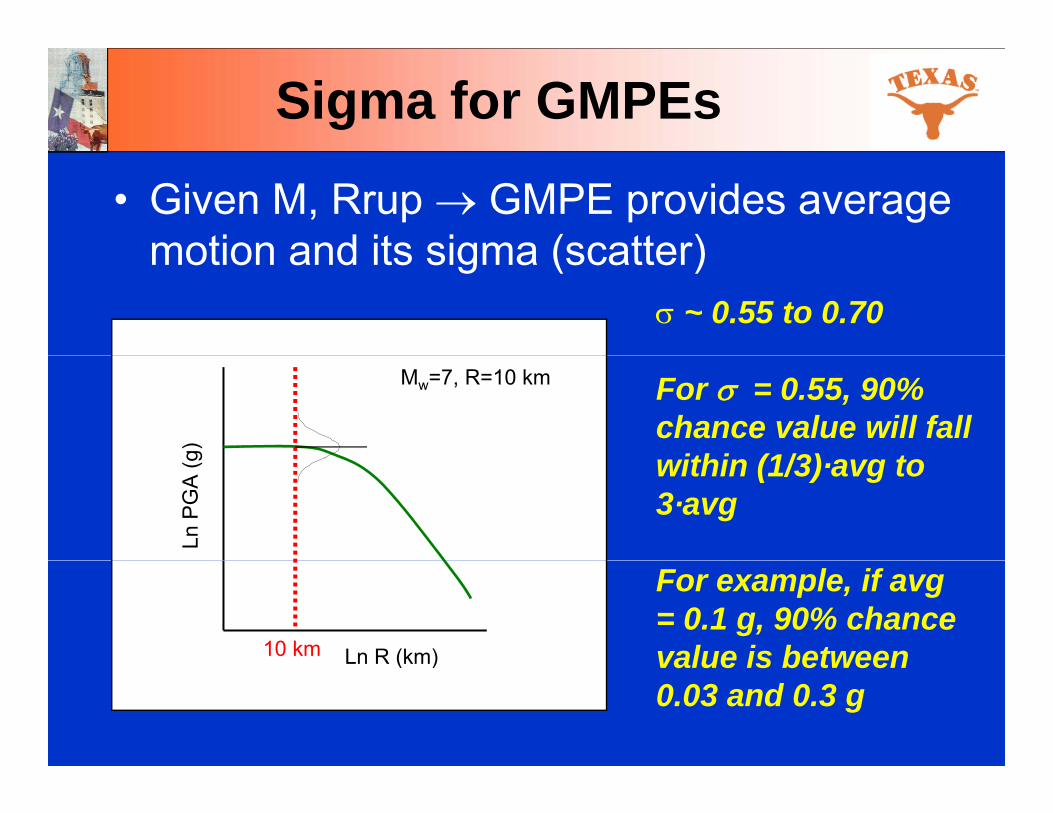
Sigma for GMPEs
• Given M, Rrup GMPE provides average motion and its sigma (scatter)motion and its sigma (scatter)
~ 0.55 to 0.70
g)
Mw=7, R=10 km For = 0.55, 90% chance value will fall
ithi (1/3) t
LnP
GA
(g within (1/3)·avg to 3·avg
Ln R (km)10 km
For example, if avg= 0.1 g, 90% chance value is betweenLn R (km) value is between 0.03 and 0.3 g
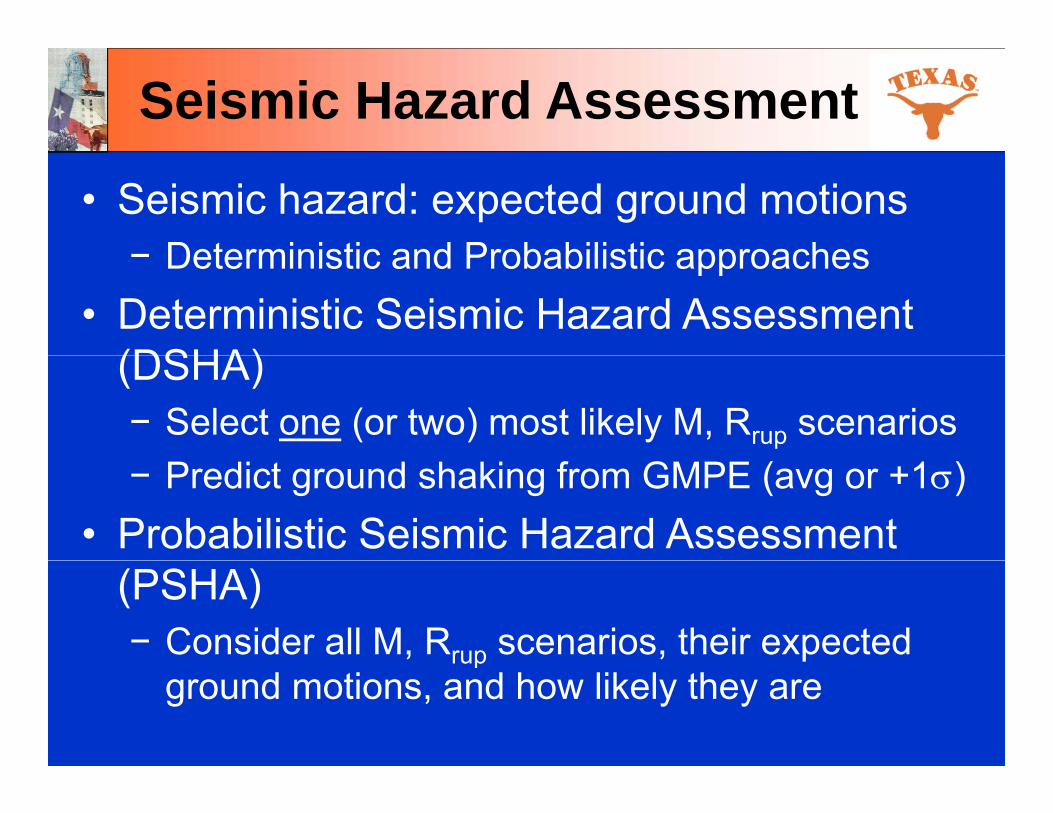
Seismic Hazard Assessment
• Seismic hazard: expected ground motionsDeterministic and Probabilistic approaches− Deterministic and Probabilistic approaches
• Deterministic Seismic Hazard Assessment (DSHA)(DSHA)− Select one (or two) most likely M, Rrup scenarios− Predict ground shaking from GMPE (avg or +1)
• Probabilistic Seismic Hazard Assessment (PSHA)− Consider all M, Rrup scenarios, their expected rup
ground motions, and how likely they are

DSHA M = 7.0, R = 10 km Response spectrum from GMPE
1Avg
0.6
0.8
eration (g) +1 Std Dev
0.4
ectral Accele
0
0.2Spe
0.01 0.1 1 10
Period (s)

Seismic Hazard Assessment
• Probabilistic Seismic Hazard Assessment (PSHA)(PSHA)− Consider all M, Rrup scenarios
Consider all potential ground motion levels− Consider all potential ground motion levels− Consider how likely each scenario and ground
motion are to occur (i e probability)motion are to occur (i.e., probability)− Compute seismic hazard curve
B ildi d d i d ti• Building code design ground motions are derived from PSHA

PSHA
• Product: ground motion level and its annual rate of exceedance ( = # times per year gmrate of exceedance ( = # times per year gm level exceeded)1E-01
ceed
ance
, Return period ~ (1 / )
500 yr return period ~ 0 002
1E-03
1E-02
ual R
ate
of E
xc[1
/yr]
500 yr return period ~ 0.002
2500 yr return period ~ 0.0004
1E-04
1E 03
Mea
n A
nnu
As , ground motions because they are less likely
0.0 0.2 0.4 0.6 0.8 1.0
PGA (g)
t ey a e ess e y

PSHA
• PSHA accounts for 4 things that DSHA does notnot− Large scatter () in ground motion prediction
More small earthquakes than large− More small earthquakes than large− Activity rates (i.e., Number EQ/yr) vary from fault
to faultto fault− Increased hazard from multiple faults
Sit A Sit BM=7M=7M=7
Site A Site BDSHA:
Hazard A = Hazard B
R=10 km R=10 km R=10 kmPSHA:
Hazard A > Hazard B

Requirements for PSHA
• Rate of earthquakes and their distribution across magnitudes:across magnitudes: − Magnitude recurrence
GMPE t di t d h ki l l d• GMPE to predict ground shaking levels and standard deviation given M, Rrup
Activity rate: No. of Eqs /yr GMPE
dmdrrfmfrmzGMPzMREz RMm r
oGMGM )()(,)()(
P [Mi]
Mag Recurrence
P [Rj]Annual rate of exceedanceof gm level = “z”

PSHA
• Magnitude RecurrenceNumber of small earthquakes vs large− Number of small earthquakes vs. large
1.E+00
1.E‐01
/ yr (
1/yr
) Defined using:
• Geodetic slip rates1.E‐02
m(1/yr)
er o
f EQ
s /
Max Mw
• Geodetic slip rates
• Rates of small EQs
1 E‐04
1.E‐03
Num
be
Rates of small EQs
• Fault length (Mmax)1.E 04
5 6 7 8 9
Magnitude

PSHA CalculationMagnitude Distribution
Derived from magnitude recurrenceGround Motion Prediction
How likely is PGA > 0.2 g for each M?
0.5
0.6
0.7
0.8
bilit
y
0.675
g)
PGA=0.2 g
M]
0
0.1
0.2
0.3
0.4
Prob
ab
0.2250.075 0.025
Log
PG
A (g
Mw=7
P [M
Magnitude 4 5 6 7
Rrup = 10 km for all earthquakesActivity rate 0 5 per yr ( )
L
10 km
Mw=5Magnitude, M
Activity rate = 0.5 per yr Log R (km)10 km
Probability [M=5] > Probability [M=7]y [ ] y [ ]
Prob [PGA > 0.2 g given M = 5] < Prob [PGA > 0.2 g given M = 7]

PSHA Calculation
][][,2.0)2.0( jim r
jioPGA rPmPrmgPGAPgi j
M P[mi] P[r = 10 km] P[PGA>0.2|m,r] P[M] · P[PGA>0.2 g]i
4 0.675 1.0 0.01 0.006755 0.225 1.0 0.05 0.020256 0 075 1 0 0 25 0 018756 0.075 1.0 0.25 0.018757 0.025 1.0 0.58 0.01450
Sum = 0 06025Sum = 0.06025(0.2 g) = o · 0.06025
(0.2 g) = 0.03012Return Period ~ 33 yr

Hazard Curve
• Perform hazard calculation for multiple values of PGA to generate hazard curvevalues of PGA to generate hazard curve
1E-01 ~ 0.002 500 yr return period
1E-02
Exce
edan
ce,
y p 10% probability of
exceedance in 50 yrs
1E-03
nnua
l Rat
e of
E[1
/yr]
~ 0.0004 2500 yr return period 2% probability of
1E-040.0 0.2 0.4 0.6 0.8 1.0
Mea
n A
n exceedance in 50 yrs
0 36 g 0.58 gPGA (g)
0.36 g 0.58 g
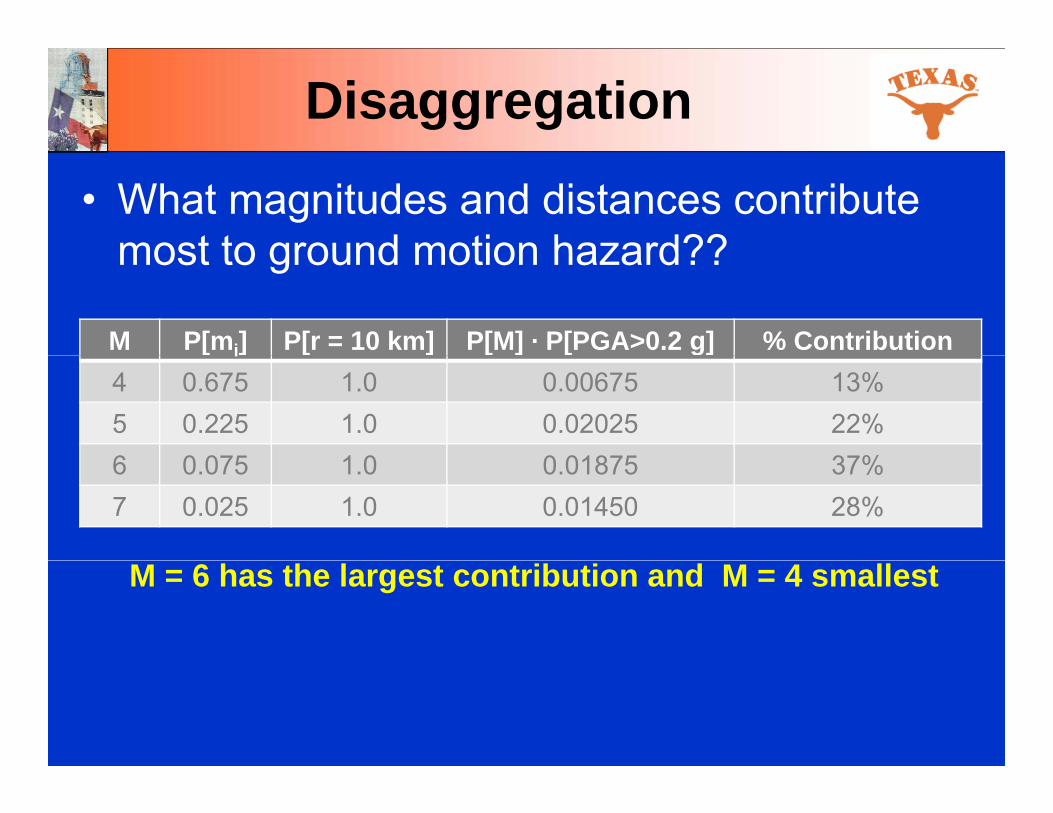
Disaggregation
• What magnitudes and distances contribute most to ground motion hazard??most to ground motion hazard??
M P[mi] P[r = 10 km] P[M] · P[PGA>0.2 g] % Contributioni
4 0.675 1.0 0.00675 13%5 0.225 1.0 0.02025 22%6 0 075 1 0 0 01875 37%6 0.075 1.0 0.01875 37%7 0.025 1.0 0.01450 28%
M = 6 has the largest contribution and M = 4 smallest

DisaggregationOakland, CA Disaggregation for 10% probability of
exceedance in 50 yrs (500 yr return period)

Uniform Hazard SpectrumDevelop hazard curves for
multiple response spectrum periods
1da
)
PGASa at T=0.3 sS t T 1 0
0.1
ance
(Lam
bd Sa at T=1.0 sSa at T=2.0 s
0.01
te o
f Exc
eeda
0.001
Annu
al R
at
0.00010 0.5 1 1.5 2
Acceleration (g)

Uniform Hazard SpectrumPlot Sa value from each hazard curve at its
appropriate spectral period
1
1.5
0.5
1
Sa (g
)
00 1 2 3 4
Period (s)

Summary
• Ground motion prediction equations (GMPE)Statistical models to predict ground shaking− Statistical models to predict ground shaking
− Model the effects of M, Rrup, style of faulting, site conditionsconditions
− NGA models represent the state-of-the-art in GMPEs for shallow crustal earthquakesGMPEs for shallow crustal earthquakes
− NGA models are currently believed to best represent ground shaking in Haiti (butrepresent ground shaking in Haiti (but recordings in Haiti will help confirm this!)

Summary
• Seismic Hazard AssessmentDeterministic seismic hazard analysis (DSHA)− Deterministic seismic hazard analysis (DSHA) provides an “EQ scenario” of ground shaking
− Probabilistic seismic hazard analysis (PSHA)Probabilistic seismic hazard analysis (PSHA) considers all uncertainties (e.g., all potential earthquakes, rate of earthquakes, etc.)q , q , )
− PSHA has become the standard for defining ground motions used in designg g