ground penetrating radar digital imaging and modeling of
TRANSCRIPT

187187
Revista do Instituto de Geociências - USPGeol. USP, Sér. cient., São Paulo, v. 18, n. 2, p. 188-200, Junho 2018
Disponível on-line no endereço www.igc.usp.br/geologiausp - 187 -
AbstractThanks to the discovery of new giant oil fields in the South Hemisphere in the last decades, named Pre-salt, there has been a considerable interest in the geometrical and sedimentological characterization of microbial deposits, coquinas, and collapsed caves, which represent a considerable part of these reservoirs. It is known that exposures analogous to oil reservoirs are an important source of information at the sub-seismic scale, as this information is helpful in parametrizing and modeling reservoirs, especially microbial reservoirs. This scenario is more favorable when the Ground Penetrating Radar (GPR) method is used in analogous exposures located in arid regions with scarce or no soil, such as the Fazenda Arrecife, in the Chapada Diamantina (Salitre Formation), Northeastern Brazil. Although rarely mentioned in the literature on microbialite geophysical imaging, GPR has been used in microbial deposits associated with the Neoproterozoic storm deposits of the Salitre Formation. The results of 3D imaging of a microbial colony, using the 200 MHz antenna, with both conventional processing and processing using geophysical attributes, are presented in this study. The conventional process-ing produced a 3D digital model that allowed the geometrical characterization and parametrization of the imaged microbial colony. The use of four geophysical attributes yielded good results, establishing the contact between the microbial colony and tempestite deposits, and determining the internal geometry of microbial deposits. The processing with “instantaneous amplitude” and “Hilbert trace with energy” highlighted the contact between the microbialite colony (low amplitude) and tempestite deposits (high amplitude), whereas the processing with the “energy” attribute provided a better visualization of the internal lamination of columnar microbialites, result similar to that obtained in the processing with “Hilbert trace with similarity”. GPR obtained images of up to 10 m in depth, with excellent resolution for microbial deposits and tempestites associated with them. The processing using geophysical attributes achieved considerably better results when compared to conventional processing, allowing a better visualization of the internal and external geometry of the imaged colony.
Keywords: Ground Penetrating Radar; Microbialites; Geophysical attributes.
ResumoComo resultado das descobertas, na última década, de campos petrolíferos gigantes no hemisfério sul, denominados gene-ricamente de pré-sal, há um crescente interesse na caracterização geométrica e sedimentológica de depósitos microbiais, de coquinas e de cavernas colapsadas, que representam parte considerável desses reservatórios encontrados. Afloramentos aná-logos a reservatórios petrolíferos constituem-se em uma importante fonte de informação auxiliar, em escala subsísmica, por fornecer dados que permitem a parametrização e a modelagem de reservatórios, especialmente os microbiais. Esse cenário é ainda mais favorável quando usado o método Ground Penetrating Radar (GPR) em afloramentos análogos que ocorrem em regiões áridas, com pouco solo (ou nenhum), como na Fazenda Arrecife, Chapada Diamantina (Formação Salitre), Nordeste do Brasil. A despeito das escassas referências bibliográficas relacionadas ao imageamento geofísico de microbia-litos, o GPR foi utilizado sobre os depósitos microbiais associados a depósitos de tempestade, de idade Neoproterozoica, pertencentes à Formação Salitre. Neste trabalho estão sendo apresentados os resultados obtidos no imageamento 3D de uma
Ground Penetrating Radar digital imaging and modeling of microbialites from the Salitre Formation, Northeast Brazil
Imageamento e modelagem digital com Ground Penetrating Radar em microbialitos Neoproterozoicos da Formação Salitre, Nordeste do Brasil
Rebeca Seabra de Lima1, Washington Luiz Evangelista Teixeira1, Filipe Ramos de Albuquerque1, Francisco Pinheiro Lima-Filho1
1Programa de Pós-Graduação em Geodinâmica e Geofísica, Laboratório de Análises Estratigráficas, Departamento de Geologia, Universidade Federal do Rio Grande do Norte - UFRN, Avenida Senador Salgado Filho, 3.000, Caixa Postal 1.596,
CEP 59088-980, Lagoa Nova, Natal, RN, BR ([email protected]; [email protected]; [email protected]; [email protected])
Received on July 25, 2018; accepted on May 21, 2018
DOI: 10.11606/issn.2316-9095.v18-146075

Lima, R. S. et al.
- 188 - Geol. USP, Sér. cient., São Paulo, v. 18, n. 2, p. 188-200, Junho 2018
INTRODUCTION
More than 30% of the world’s hydrocarbon reserves are located in carbonate reservoirs (Bagdan and Pemberton, 2004) and this percentage is likely to increase, as a result of discoveries of new giant oil fields in carbonate rocks, generically named “Pre-salt layers” (Carminatti et al., 2008). Regardless of the complexity involved in the identification of this oil system, it is known that a considerable part of the reservoirs corresponds to microbial deposits (Awramik and Buchheim, 2012; Virgone et al., 2013). One example of these reservoirs, already in production, is located in the Santos Basin (Beltrão et al., 2009; Muniz and Bosence, 2009, 2015; Himi et al., 2015).
As a direct consequence of this discovery, there is an effort to identify similar old and new oil fields (Virgone et al., 2013). The microbialites of the Lagoa Salgada, Rio de Janeiro (Srivastava and Rocha 2002; Silva et al., 2007; Rezende et al., 2013), the microbialites of the Shark Bay, in Australia (Jahnert and Collins, 2011) and the microbialites of the region of Great Salt Lake, United States (Virgone et al., 2013; Pace et al., 2016) are considered as new analogues to the “Pre-salt” reservoirs. There are few outcrops considered as old analogues, such as the Cretaceous microbial deposits, Salta Basin, Argentina (Hamon et al., 2012; Roemers Oliveira et al., 2015), the Jurassic micro-bial deposits, Iberian Basin, Spain (Pueyo-Anchuela et al., 2011), the Eocene microbial deposits, Green River Basin, United States (Virgone et al., 2013), and the Neoproterozoic microbialites of the Irecê Basin, Brazil (Himi et al., 2015).
For Virgone et al. (2013), new and old analogues of these outcrops provide additional features that describe the sedimen-tological and stratigraphic pattern observed in core samples and that can increase current understanding of the impact of climate change, fluid flow, and water chemistry in carbon-ate production. Study of analogous outcrops provides more information about the eventual presence of (depositional and deformational) heterogeneities to an extent not observed using conventional seismic methods and, therefore, not used in usual operation in reservoirs. Thanks to advances in data process-ing and computational modeling, detailed 3D models can be
currently created using shallow geophysics (GPR, Eletrical Resistivity Tomography, and seismic methods), which were impossible to be built using hydrocarbon prospecting (seis-mic methods). Using these models, the reservoir fluid distri-bution can be better understood.
The Ground Penetrating Radar (GPR) method has been successfully used for imaging geological characteristics of carbonate rocks such as, for example, faults and fractures (Pipan et al., 2003a, 2003b; Grasmueck et al., 2005a, 2005b; Jeannin et al., 2006; Theune et al., 2006; McClymont et al., 2008; Forte et al., 2012; Fernandes Jr. et al., 2015), col-lapsed paleocaves and other karstic features (Chamberlain et al., 2000; McMechan et al., 2002; Al-Fares et al., 2002; Loucks et al., 2004; Kruse et al., 2006; Jesus et al., 2012; Reis Júnior et al., 2014; Reis Júnior et al., 2015), carbonate platform geometries (Jorry and Biévre, 2011), and coquinas (Jahnert et al., 2012; Menezes et al., 2016).
The use of GPR to study microbial deposits was dis-cussed in few articles (Pueyo-Anchuela et al., 2011; Himi et al., 2015). However, the GPR method proved to be suit-able for imaging the Neoproterozoic microbial deposits of the Salitre Formation, NE of the Brazil, the object of this study, which is considered an old analogue of the reservoirs of Pre-salt layers (Himi et al., 2015).
The GPR method, when used in areas with dielectric mate-rials with low electrical conductivity, such as those found in our study area, allows the attenuation of the electromagnetic (EM) wave propagation to be considered, regardless of the propagation velocity. Therefore, the GPR method shows kinematic similarities with seismic methods, because elec-tromagnetic and mechanical waves propagate with veloci-ties that are closely related to the physical properties of the medium. These similarities allow the application of process-ing techniques developed for seismic methods to the GPR method with only a few changes. One of these techniques is the use of attributes, which was inherited from seismic methods and can be applied to GPR data (Castro et al., 2014). The attributes are subsets of seismic data or, in the case of this study, of GPR data, and the attribute analysis is related to the breakdown of this data into constituent attributes.
colônia microbial, utilizando-se a antena de 200 MHz, tanto com processamento convencional quanto com o uso de atributos geofísi-cos. Com o resultado do processamento convencional foi gerado um modelo digital 3D que permitiu a caracterização geométrica e a parametrização da colônia microbial imageada. A aplicação de quatro atributos geofísicos demonstrou ter bons resultados na delimita-ção do contato entre a colônia microbial e os depósitos tempestíticos, sendo eficiente também na determinação da geometria interna dos depósitos microbiais. O processamento com “amplitude instantânea” e “traço de Hilbert com energia” realçou o contato entre a colônia de microbialitos (baixa amplitude) e os depósitos tempestíticos (alta amplitude), enquanto o atributo de “energia” mostrou melhor a laminação interna dos microbialitos colunares, resultado semelhante ao obtido com a combinação do atributo “traço de Hilbert com similaridade”. O GPR propiciou imagens de até 10 m de profundidade, com excelente resolução tanto dos depósitos microbiais quanto dos tempestitos associados. O processamento com atributos geofísicos apresentou considerável ganho em relação ao processamento convencional, permitindo um aumento de qualidade na visualização da geometria externa e interna da colônia microbial imageada.
Palavras-chave: Ground Penetrating Radar; Microbialitos; Atributos geofísicos.
GPR Imaging in Microbialites
- 189 -Geol. USP, Sér. cient., São Paulo, v. 18, n. 2, p. 188-200, Junho 2018
The main features that distinguish one method from the other are related to the extent of its applicability and to the physical parameters involved (Ursin, 1983). The process-ing and interpretation techniques developed for the seismic data, used to estimate the geometry and physical properties of reservoirs based on seismic attributes, can also be applied to GPR data for highlighting the relevant geological features, provided that adjustments are made to the input parameters of the equation algorithms (Carcione, 2007), such as, for example, numbers of analyzed features, temporal sampling, velocity scale, etc., because GPR data usually have more features (temporal sampling) and a smaller time window (vertical sampling) than the conventional seismic data.
The use of attributes in GPR data is fairly recent (Cassidy, 2009). Examples of this type of application can be found in some papers, such as Sénéchal et al. (2000), Corbeanu et al. (2002), Geerdes and Young (2007), Böniger and Tronicke (2010), Forte et al. (2012), Castro et al. (2014), Reis Júnior et al. (2014), Reis Júnior et al. (2015).
This study aimed to carry out evaluations using differ-ent attributes to compare the results against each other and against conventional processing, regarding geological features (geometry of microbial bodies, contacts with adjacent rocks) and radarfacies. The attributes evaluated in this study were: “instantaneous amplitude”, “energy”, “similarity”, “Hilbert trace with energy”, and “Hilbert trace with similarity”.
GEOLOGICAL CONTEXT
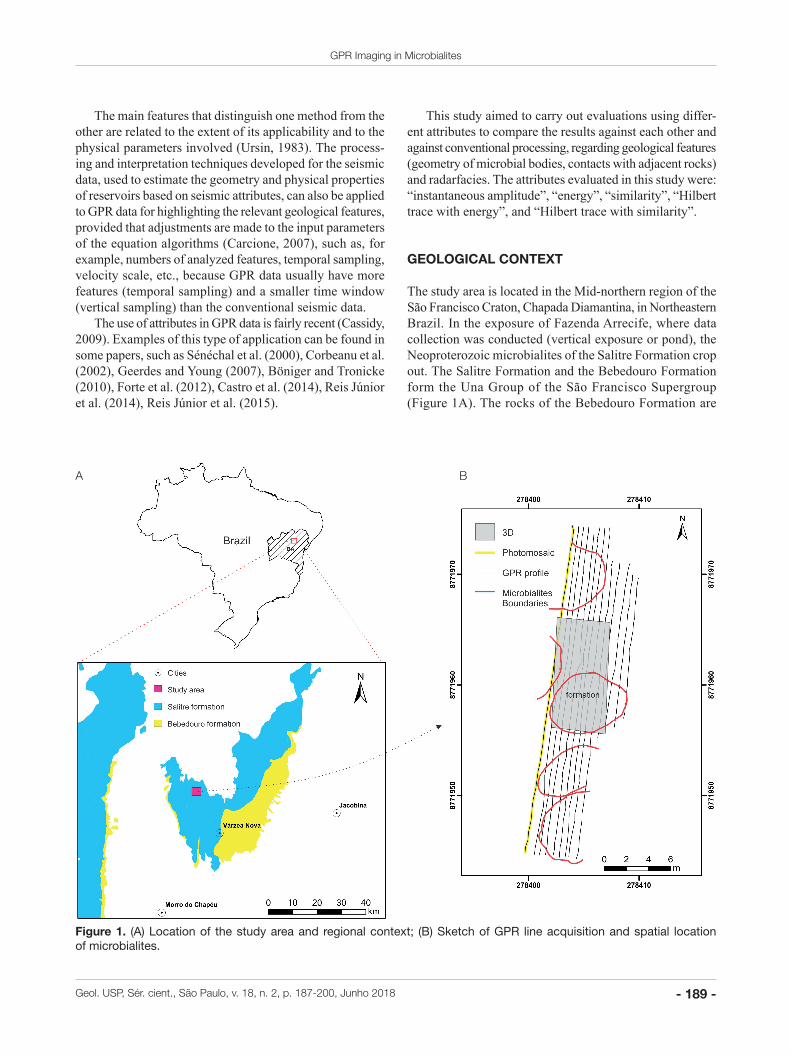
The study area is located in the Mid-northern region of the São Francisco Craton, Chapada Diamantina, in Northeastern Brazil. In the exposure of Fazenda Arrecife, where data collection was conducted (vertical exposure or pond), the Neoproterozoic microbialites of the Salitre Formation crop out. The Salitre Formation and the Bebedouro Formation form the Una Group of the São Francisco Supergroup (Figure 1A). The rocks of the Bebedouro Formation are
Figure 1. (A) Location of the study area and regional context; (B) Sketch of GPR line acquisition and spatial location of microbialites.
A B

Lima, R. S. et al.
- 190 - Geol. USP, Sér. cient., São Paulo, v. 18, n. 2, p. 188-200, Junho 2018
overlain by the Salitre Formation, and they are separated by an erosional unconformity. The Bebedouro Formation consists of metasiltites and meta-argillite, showing dis-persed pebbles with varied compositions, and dropstones suggesting a glacial origin (Guimarães, 1996; Figueiredo, 2008). The Salitre Formation consists of carbonate rocks with small terrigenous intercalations, in addition to bio-constructed rocks. These lithotypes characterize deposits of marine platform environment controlled by tides (Misi and Veizer, 1998; Bonfim et al., 1985; Souza et al., 1993). The Salitre Formation rocks were recently dated using the U/Pb method by Santana et al. (2015), and their maximum depositional age was 669 ± 14 Ma.
The rocks of the Salitre Formation, which has an abun-dance of biostromes and bioherms of microbialites with dif-ferent dimensions and origins, are the main subject of this study. In the study area, these organic-sedimentary depos-its are associated with calcarenite rocks formed by storm action, which is shown by hummocky cross-stratification, according to Srivastava and Rocha (2002). However, recent studies show that the laminated deposits intercalated with these microbialites are represented by oolitic grainstones, formed by bidirectional flow and characterized by herring-bone cross-stratification (Caird et al., 2017).
METHODOLOGY
Geophysical data acquisition
Geophysical data were acquired using a SIR-3000 system, manufactured by GSSI (Geophysical Survey Systems, Inc.), with 200 and 400 MHz antennas. Thirteen lines par-allel to the main wall of the exposure were acquired, with
NNE-SSW direction and 328.83 m of acquisition, in addition to 32 lines, forming a 3D regular network. A microbialite colony, measuring 10m N-S by 5m E-W and with an area of 50 m2, was imaged, totaling 215 linear meters of GRP data (Figure 1B). Both acquisitions were performed with a 0.5 m spacing between the lines. The 3D grid is very important for this study, because the geophysical attributes were tested on these data.
For data geolocation, a planialtimetric survey was car-ried out using Geodesic GPS, with millimeter accuracy, in addition to a Total Station. For 3D imaging (grid represented by the red dashed line in Figure 2), a microbialite colony that is completely preserved at the surface was chosen (rep-resented by the blue dashed line in Figure 2), although it is not exposed in the vertical section. Because a well-exposed colony is next to it, it was possible to correlate them and, therefore, parameterize the geophysical data.
Processing
The processing was performed using the Reflexw software to increase signal/noise relation and to obtain a better visual representation of the geophysical data regarding the goals of this study. The processing is basic and consists of a few steps in order to affect the original data as little as possible, bearing in mind that the signal quality of the raw radargrams is already satisfactory. After several processing flows were evaluated, a sequence was defined to attenuate noise without changing signal, thus, without jeopardizing the geological interpretation.
The processing sequence followed the order: 1. Start Time Correction (Start Time); 2. Dewow; 3. Background Removal; 4. Gain Removal; 5. Gain Application; 6. Bandpass Filter; 7. Topographic Correction; 8. Time-to-depth Conversion.
Although the morphology of the study area is appar-ently flat, it was necessary to apply a topographic correc-tion to better reconstruct the actual geometry of reflectors, in order to avoid problems when interpreting GPR sections. In this stage, geographical coordinates were also included in the data heading. In time-to-depth conversion, a veloc-ity analysis was carried out using the hyperbola method, and the results were: velocity ≈ 0.117m/ns and dielectric constant (ε) = 6.6.
When comparing raw (Figure 3A) and processed data (Figure 3B), the start time correction was observed in the processed data, in addition to the removal of direct waves and high and low frequency noises. The effects related to
Figure 2. Front view of one of the microbialite colonies of the Fazenda Arrecife (BA), where 3D acquisition was performed, shown by the red dashed square. The blue dashed area indicates the colony chosen to be thoroughly imaged, where two GPR lines associated with its major or minor axis were acquired.

GPR Imaging in Microbialites
- 191 -Geol. USP, Sér. cient., São Paulo, v. 18, n. 2, p. 188-200, Junho 2018
electromagnetic induction and signal attenuation with depth were corrected, enabling the visualization of growth margins of the microbialite colony (“M”) and its lateral contact with tempestite deposits (“T”). After GPR lines were processed, they were interpolated also using the Reflexw software, cre-ating a 3D cube. Subsequently, this cube was converted to SEG-Y format and then imported in OpendTect software for 3D visualization and attribute application.
Geophysical signal parametrization
For a better interpretation of the GPR data, a photomosaic of a vertical section, where microbial colonies of the study area crop out, was used (Figure 4A). Correlations between
longitudinal and 3D profiles acquired in the area just above the exposure of some colonies observed only in the surface were performed (Figure 4B).
Only one colony that crops out in the vertical section is observed in radargrams (regarding line L5), represented by microbialite radarfacies M1, and observed in the photomo-saic (Figure 4A). The colonies represented by microbial-ite radarfacies “M2”, “M3” and “M4” are observed only in surface (Figure 4C). However, the rocks adjacent to these colonies (tempestites) are identified in GPR sections as tem-pestite radarfacies and represented by “T”. A continuous reflector along the GPR section was observed, represented by the blue dashed line, and associated with the basal growth margin of these microbialites (Figure 4B).
Figure 3. (A) Raw radargram of the study area; (B) Results after processing. In the section, arrows indicate the effects of processing in GPR section, and “T” and “M” indicate the location of tempestites and microbialites, respectively.
A B
Figure 4. (A) Photomosaic of the study area; (B) Longitudinal GPR Section (L5) showing the microbialite radarfacies (“M1”, “M2”, “M3” and “M4”) and the tempestite radarfacies (“T”). The red dashed line represents the basal growth surface of microbialites, and the blue dashed line represents their lateral growth margins; (C) Schematic map showing the spatial location of the microbialite colonies at the surface.
A
B
C

Lima, R. S. et al.
- 192 - Geol. USP, Sér. cient., São Paulo, v. 18, n. 2, p. 188-200, Junho 2018
The microbialite radarfacies (“M1”, “M2”, “M3” and “M4”) are identified by low amplitude and dome aspect of reflectors (mounded geometry), which is related to the dis-position of the columns. The radarfacies related to these microbialites have lateral terminations that cut adjacent reflectors, highlighting their growth margins, which are represented by the red dashed line (Figure 4B).
However, the radarfacies related to tempestites shows low complexity and is associated with horizontal and par-allel reflectors with some undulation. This pattern of reflec-tors is consistent with the horizontal and parallel stratifica-tion predominant in tempestites. This radarfacies has reflec-tors with amplitude and heterogeneity higher than those of microbialite radarfacies. The sedimentary structure related to storm waves (hummocky cross-stratification) and identi-fied in the outcrop (Figure 5) was not observed in the radar-grams because the antennas used for acquisition (200 and 400 MHz) did not have enough vertical resolution to show these sedimentary structures.
The strong reflectors that highlight the internal lamina-tion of these microbialites (Figure 6A) are formed due to high amplitudes caused by the dielectric constant difference between the carbonate medium (εlimestone = 6.5) and the dark ferruginous phosphatic levels observed throughout the out-crop (εiron= 14.2) and, consequently, they also highlight the tempestite bedding (Figure 6B).
Ground Penetrating Radar Attributes
To improve GPR data interpretation, a technique called “seismic attributes analysis” was adopted and adapted to be used with GPR data. According to Chopra and Marfurt (2005), the seismic attribute is a quantitative measurement of a relevant geophysical characteristic from seismic data. Most recently, this technique has been used for the interpre-tation of GPR radargrams (Cassidy, 2009). This technique highlights features that were not previously observed or were not very clear in data in the original data, consequently making geological interpretation easier. However, applying geophysical attributes to GPR data for characterizing micro-bial deposits is not mentioned in the literature.
The analysis of attributes was carried out using processed 3D data. Because the largest grid profiles are parallel to the outcrop escarpment, it was possible to correlate GPR data interpretation to field geological description. Line L4 was chosen to illustrate the attribute application because it crosses the central part of the microbialite colony, making its entire (depth and lateral extension) visualization easier (Figure 7).
DISCUSSION AND RESULTS
Instantaneous amplitude attribute
The seismic attributes based on instantaneous events are derived from the analysis of the complex seismic trace
Figure 5. Hummocky cross-stratification observed in tempestite rocks.
Figure 6. Dark levels in microbialite laminations (A) and tempestite bedding (B), observed as reflectors in GPR sections.
A B

GPR Imaging in Microbialites
- 193 -Geol. USP, Sér. cient., São Paulo, v. 18, n. 2, p. 188-200, Junho 2018
in the exact place of the reference event. According to Taner et al. (1979), the conventional seismic trace can be considered as the actual component of a complex trace, which can be calculated under normal conditions. In other words, attributes calculated based on instantaneous events take into consideration the imaginary part of the complex GPR/ seismic trace.
The “instantaneous amplitude” attribute proved to be sensitive to changes in amplitude caused by electromagnetic (EM) contrast between deep rocks (Figure 8), which can be related to abrupt lithological changes between adjacent rocks (Chopra and Mafurt, 2005). The tempestite deposits are represented by more intense reflections, that is, higher amplitudes resulting from strong EM contrast of the medium, indicating that this type of rock has a heterogeneous compo-sition, since it is an impure limestone. The opposite occurs with microbialites, their reflections are less intense or even absent, and their amplitudes are lower, because there is a
Figure 7. Interpreted radargram (black dashed line) showing line L4 and its geographic location in the outcrop (bioherm center).
Figure 8. GPR section obtained with the application of the “instantaneous amplitude” attribute. The attribute highlighted the microbialite colony thanks to its distinct signature pattern. The white dashed line represents the interpretation based on the conventional processing. The green dashed line represents the interpretation based on the applied attribute.

Lima, R. S. et al.
- 194 - Geol. USP, Sér. cient., São Paulo, v. 18, n. 2, p. 188-200, Junho 2018
weak or no EM contrast in this medium, which indicates a more homogeneous rock.
Therefore, this attribute allows a better definition of the microbialite colony, which was highlighted due to the low concentration of EM energy and indicated by low amplitude values (area with predominantly warm colors). It was also possible to define its growth margins (area that surrounds the colony, represented by cold colors), where areas with higher amplitude values can be observed. The interpreta-tion resulting from the application of the “instantaneous amplitude” attribute was very similar to the interpretation of conventional processing, but with an improvement, since the application of this attribute helped, for example, to bet-ter establish the margins of the colony.
Energy attribute
The “energy attribute” is calculated from the ratio of the sum of squares of the amplitudes to the number of samples, within a specific time window. Based on amplitude varia-tions, this attribute makes possible to highlight reflectors with low and high energy (Figure 9A), producing a result similar to that of the instantaneous amplitude attribute but, in addition to the identification of the microbialite colony, this attribute yielded a better visualization of the internal lamina-tion of this microbial body, which represents its columns. Red represents areas with high energy, and black and grey represent areas with low energy. This contrast is explained by the difference between GPR signatures of tempestites and microbialites. Since microbialites are homogeneous, there is no considerable contrast in electromagnetic properties, resulting in lower amplitudes (that is, low energy), whereas for the tempestites, it is the opposite (high energy), since it is a limestone with siliciclastic components and, therefore, heterogeneous rocks.
The combination of the “Hilbert trace” attribute with other attributes was also used. The “Hilbert trace” adopts algorithms that show a pseudo-relief aspect in sections, highlighting, many times, elements that were not observed with only one inserted attribute.
Based on that, the first combination (“Hilbert trace with energy”) highlighted not only the microbialite con-tact with tempestite deposits, but also the internal structure of the microbialite colony (Figure 9B). The growth margin of the colony, for example, was more highlighted using this combination than when the “energy attribute” is used alone. On the other hand, the microbialite internal lamina-tions were more evident when the “energy attribute” was used alone. To complement the interpretation, an energy cube was built to highlight and identify the area where the microbialite is located, which is shown by light color areas of low energy (Figure 10).
Just as in the application of the “instantaneous ampli-tude” attribute, the interpretations using the “energy”
Figure 9. (A) “Energy attribute”. This attribute better highlighted microbialite internal laminations; (B) “Hilbert trace with energy” attribute. The growth margin of the microbialite colony was more considerably highlighted using this attribute than the “energy attribute” alone. The white dashed line represents the interpretation based on the conventional processing. The blue and yellow dashed lines represent the interpretation based on the applied attribute.
A B
Figure 10. 3D energy cube created to highlight the GPR signature of the microbialite colony (dashed line).

GPR Imaging in Microbialites
- 195 -Geol. USP, Sér. cient., São Paulo, v. 18, n. 2, p. 188-200, Junho 2018
and “Hilbert trace with energy” attributes were simi-lar to the interpretation with the conventional process-ing, only that the margins of the microbialite colony and its contact with the tempestite rocks were more precisely delineated.
Similarity Attribute
The “similarity attribute” is part of a group of attributes that are related to the reflector geometry, and which highlight the geometric characteristics of GPR/seismic data. It is a type of “coherence attribute”, which expresses how much two or more traces look alike (Chopra, 2001).
This attribute is also called “multi-trace” and represents similarity properties in each trace separately. Calculation of this attribute comprises a set of traces and is based on the proximity in relation to the central trace. There are sev-eral standards to calculate the “similarity attribute” and the standard adopted in this study is part of the “all directions” extension (available in the software OpendTect).
The areas with lighter colors represent high similar-ity between reflectors, whereas the areas with darker col-ors represent areas with low similarity. Based on this, the contact between the tempestites and the microbialite was highlighted (darker areas, that is, low similarity and higher heterogeneity), which represents an area that is not similar to the neighboring areas (Figure 11A).
Dark and light zones are observed in parts of the section with tempestites. The dark zones indicate areas that are not similar, which is explained by the internal heterogeneity of the tempestites. In the microbialite area, lighter zones are mostly observed, since microbialites are more homogeneous than the tempestites.
When comparing the interpretation based on the conven-tional processing with the interpretation using the “similarity
attribute”, a difference in the volume of the microbialite colony was observed. The interpretation using the “similar-ity attribute” showed a considerably smaller volume, con-trasting with the interpretations using other attributes and with the conventional interpretation, which means that the interpretation using this attribute was not very efficient in delimiting the microbialite colony.
Hilbert Trace Attribute
The “Hilbert Trace Attribute”, which belongs to the set of instantaneous attributes, is an attribute that takes into con-sideration the imaginary part of the GPR complex/seismic trace. Consequently, it can be calculated based on the real GPR/seismic trace by the Hilbert Transform. The real and imaginary traces have the same amplitude spectrum.
The combination of the “Hilbert trace attribute” with other attributes shows, as previously mentioned, an aspect of pseudo-relief in sections, often highlighting elements that are not observed with only one inserted attribute.
This technique, also known as Amplitude Volume, was developed by Bulhões (1999). For the Amplitude Volume technique, a time window should be chosen considering the wavelength of the GPR/seismic data that will be studied.
The combination “Hilbert trace with similarity” (Figure 11B) yields results similar to those shown in the section where the “similarity attribute” was used, although the internal structure of microbialite and the contact with the tempestite deposits were more evident when the “simi-larity attribute” was used.
The interpretations of the microbialite colony with the “Hilbert trace with similarity attribute” and the “similarity attribute” were similar, since, in both cases, the volume of the colony was considerably smaller when compared to the interpretation with other attributes and with the conventional
Figure 11. (A) “Similarity attribute”. This attribute highlighted the contact between the microbialite colony and tempestite deposits; (B) “Hilbert trace with similarity” attribute. This attribute highlighted the internal structure of the microbialite colony. The white dashed line represents the interpretation based on the conventional processing. The red and orange dashed lines represent the interpretation based on the attribute applied.
A B

Lima, R. S. et al.
- 196 - Geol. USP, Sér. cient., São Paulo, v. 18, n. 2, p. 188-200, Junho 2018
interpretation. The interpretation with the “Hilbert trace with similarity” attribute showed a microbialite bioherm even smaller when compared to the interpretation with the “similarity attribute”.
The result of the comparison between the interpretations based on the conventional processing and the interpretations based on tested attributes can be seen in Figure 12. It was observed that the attributes that better represent the micro-bialite colony were “instantaneous amplitude”, “energy”, and “Hilbert trace with energy”. On the other hand, the
“Hilbert trace with similarity” attribute obtained the worst result, showing a considerably smaller volume for the micro-bialite colony, which does not correspond to the patterns observed in the outcrop.
3D Digital Model
Based on the conventional processing of GPR lines, a 3D digital model was built using the software Surpac 6.6.2, which is appropriate for creating tridimensional virtual models, among other uses. Using this software, a virtual volume of the microbialite colony was created based on the reflectors that delimit its outer structure by means of strings (lines), in both X and Y GPR sections, which were interpolated to obtain the tridimensional model shown in Figure 13A. Internal surfaces corresponding to the colony lamination, which has a mounded geometry, were also revealed (Figure 13B).
The parametrization of the geophysical data was carried out based on the 3D model (Figure 13C):• Major axis = 7.5 m;• Minor axis = 5.5 m;• Maximum thickness = 2.5 m;• Volume = 43 m3;• Total surface area = 85 m2.
Therefore, the 3D solid created based on geophysical interpretations allowed the parametrization of the micro-bialite colony imaged in the study area.
Figure 12. Comparative model showing the results of the interpretations for the microbialite colony, based on the conventional processing and on the application of tested attributes.
Figure 13. (A) Visualization of the 3D digital model of the microbialite colony obtained from strings (lines) in successive GPR sections; (B) internal lamination of the microbialite; (C) colony parametrization. “Y” axis represents the Geographic North in all images.
A B
C

GPR Imaging in Microbialites
- 197 -Geol. USP, Sér. cient., São Paulo, v. 18, n. 2, p. 188-200, Junho 2018
CONCLUSION
GPR data have two different signatures in the study area: one signature with low amplitude values (lower intensity reflectors, with mounded geometry), associated with microbialite radarfacies. The other signature shows higher intensity reflectors, mostly horizontal and paral-lel, which indicates areas with high amplitudes, related to tempestite radarfacies.
The growth margins of the imaged microbialite were identified (in decimeter scale) and its internal geometry (lamination) was highlighted applying mathematical algo-rithms (attributes) to GPR data. The attributes related to the amplitude (“instantaneous amplitude”, “energy”, and “Hilbert trace with energy”) allow the identification of two areas with different electromagnetic characteristics: regions with low amplitude, consequently, low energy, were iden-tified as zones where microbialites crop out; regions with high amplitude and energy were identified as tempestite rocks. The “energy attribute” better highlighted the inter-nal structure of the microbialite colony, whereas the com-bination between this attribute and the “Hilbert trace” high-lighted the growth margins of the colony and its contact with the tempestite deposits. The “similarity” attribute not only highlighted the contact between the microbialite colony and the tempestite deposits, but also the internal lamination of the colony. However, using the combination “Hilbert trace with similarity”, these features were not so clear, although a similarity contrast could be inferred.
The interpretation of GPR sections based on the applica-tion of attributes yields better results than the conventional processing. The 3D solid created based on these interpreta-tions confirms the actual geologic model of the microbialite colonies located in the study area and allows the parametri-zation of geophysical data, providing information such as area, volume, thickness, etc.
The methodology adopted in this study, involving the application of attributes to GPR data, highlighted microbial-ite characteristics, which were not very clear in the origi-nal data. Therefore, this methodology can be used in other similar geologic contexts (outcropping or not).
ACKNOWLEDGMENTS
The authors would like to thank the DGB Earth Sciences Company for the academic license of the OpendTect 6.0.0 software and Petrobras (Brazilian Petroleum Corporation) for the financial support to the Sismocarbo project. RSL and FPLM would also like to thank the Human Resources Program (Programa de Recursos Humanos) of Petrobras (PRH) – 229 for the fellowship in Universidade Federal do Rio Grande do Norte (UFRN).
REFERENCES
Al-Fares, W., Bakalowicz, M., Guérin, R., Dukhan, M. (2002). Analysis of the karst aquifer structure of the Lamalou area (Hérault, France) with ground penetrating radar. Journal of Applied Geophysics, 51(2), 97-106. http://doi.org/10.1016/S0926-9851(02)00215-X
Awramik, S. M., Buchheim, H. P. (2012). The quest for microbialite analogs to the South Atlantic Pre-Salt carbonate hydrocarbon reservoirs of Africa and South America. Houston Geological Society Bulletin, 55, 21.
Bagdan, C. A., Pemberton, S. G. (2004). Karst breccia and bank collapse breccia: Implications for reservoir characterization of the McMurray Formation, Alberta, Canada. AAPG Bulletin, 88, 13.
Beltrão, R. L. C., Sombra, C. L., Lage, A. C. V. M., Fagundes Netto, J. R., Henriques, C. C. D. (2009). SS: Pre-salt Santos basin – Challenges and New Technologies for the Development of the Pre-salt Cluster, Santos Basin, Brazil. Offshore Technology Conference. Houston, Texas. https://doi.org/10.4043/19880-MS
Bonfim, L. F. C., Rocha, A. J. D., Pedreira, A. J., Morais Filho, J. C., Guimarães, J. T., Tesch, N. A. (1985). Projeto Bacia de Irecê. Relatório Final. Salvador: CPRM.
Böniger, U., Tronicke, J. (2010). Improving the interpretability of 3D GPR data using target–specific attributes: application to tomb detection. Journal of Archaeological Science, 37(4), 672-679. http://dx.doi.org/10.1016/j.jas.2010.01.013
Bulhões, É. M. (1999). Técnica “Volume de Amplitude” para mapeamento de feições estruturais. 6th International Congress of the Brazilian Geophysical Society. Rio de Janeiro: SBGq.
Caird, R. A., Pufahl, P. K., Hiatt, E. E., Abram, M. B., Rocha, A. J. D., Kyser, T. K. (2017). Ediacaran stromatolites and intertidal phosphorite of the Salitre Formation, Brazil: Phosphogenesis during the Neoproterozoic Oxygenation Event. Sedimentary Geology, 350, 55-71. http://dx.doi.org/10.1016/j.sedgeo.2017.01.005
Carcione, J. M. (2007).Wave fields in real media: wave propagation in anisotropic, anelastic, porous and electromagnetic media. Amsterdam: Elsevier.
Carminatti, M., Wolff, B., Gamboa, L. (2008). New exploratory frontiers in Brazil. World Petroleum Congress, n. 19, 1-11. Madrid.

Lima, R. S. et al.
- 198 - Geol. USP, Sér. cient., São Paulo, v. 18, n. 2, p. 188-200, Junho 2018
Cassidy, N. J. (2009). Ground penetrating radar data processing, modelling and analysis. In: H. M. Jol (Ed.), Ground Penetrating Radar: theory and applications (1, 141-172). Amsterdam: Elsevier.
Castro, D. L., Reis Júnior, J. A., Teixeira, W. L. E., Albuquerque Silva, V., Lima Filho, F. P. (2014). Ground-penetrating radar imaging techniques applied in 3D environment: example in inactive dunes. Revista Brasileira de Geofísica, 32(2), 273-289. http://dx.doi.org/10.22564/rbgf.v32i2.482
Chamberlain, A. T., Sellers, W., Proctor, C., Coard, R. (2000). Cave detection in limestone using ground penetrating radar. Journal of Archaeological Science, 27(10), 957-964. https://doi.org/10.1006/jasc.1999.0525
Chopra, S. (2001). Integrating coherence cube imaging and seismic inversion. The Leading Edge, 20(4), 354-362. https://doi.org/10.1190/1.1438948
Chopra, S., Marfurt, K. J. (2005). Seismic attributes - A historical perspective. Geophysics, 70(5), 3SO-28SO. https://doi.org/10.1190/1.2098670
Corbeanu, R. M., McMechan, G. A., Szerbiak, R. B., Soegaard, K. (2002). Prediction of 3-D fluid permeability and mudstone distributions from ground-penetrating radar (GPR) attributes: Example from the Cretaceous Ferron member, east-central Utah. Geophysics, 67(5), 1495-1504. https://doi.org/10.1190/1.1512794
Fernandes Jr., A. L., Medeiros, W. E., Bezerra, F. H., Oliveira Jr., J. G., Cazarin, C. L. (2015). GPR investigation of karst guided by comparison with outcrop and unmanned aerial vehicle imagery. Journal of Applied Geophysics, 112, 268-278. https://doi.org/10.1016/j.jappgeo.2014.11.017
Figueiredo, F. T. (2008). Fácies sedimentares e proveniência da Formação Bebedouro, Neoproterozóico (BA). Dissertation (Mastering Course). São Paulo: Instituto de Geociências – USP.
Forte, E., Pipan, M., Casabianca, D., Di Cuia, R., Riva, A. (2012). Imaging and characterization of a carbonate hydrocarbon reservoir analogue using GPR attributes. Journal of Applied Geophysics, 81, 76-87.
Geerdes, I., Young, R.A. (2007). Spectral decomposition of 3D GPR data from an alluvial environment. The Leading Edge, 26(8), 1024-1030. https://doi.org/10.1190/1.2769560
Grasmueck, M., Viggiano, D., Smith, L., Nyahay, R. (2005a). 3-D vision Ground Penetrating Radar (GPR): reservoir anatomy beyond the outcrop surface. AAPG Annual Meeting. Calgary, Alberta.
Grasmueck, M., Weger, R., Horstmeyer, H., (2005b). Full-resolution 3D GPR imaging. Geophysics, 70(1), K12-K19. https://doi.org/10.1190/1.1852780
Guimarães, J. T. (1996). A Formação Bebedouro no Estado da Bahia; faciologia estratigrafia e ambientes de sedimentação. Dissertation (Mastering Course). Salvador: Instituto de Geociências – UFBA.
Hamon, Y., Rohais, S., Deschamps, R., Gasparrini, M. (2012). Outcrop analogue of Pre-salt microbial series from South Atlantic: the Yacoraite Fm, Salta rift system (NW Argentina). AAPG Hedberg Conference, 1-4. Houston, Texas.
Himi, M., Medeiros Souza, A., Lovera, R., Francelino, A. M., Egito, L. M., Teixeira, W. E., Lima Filho, F. P., Casas, A. (2015). First Attempt to Characterize Neoproterozoic Stromatolites at Chapada Diamantina (Brazil) by Geophysical Methods. European Meeting of Environmental and Engineering Geophysics, n. 21, 1-5. Turin, Italy: NSG.
Jahnert, R. J., Collins, L. B. (2011). Significance of subtidal microbial deposits in Shark Bay, Australia. Marine Geology, 286(1-4), 106-111. https://doi.org/10.1016/j.margeo.2011.05.006
Jahnert, R., De Paula, O., Collins, L., Strobach, E., Pevzner, R. (2012). Evolution of a coquina barrier in Shark Bay, Australia by GPR imaging: Architecture of a Holocene reservoir analog. Sedimentary Geology, 281, 59-74. http://dx.doi.org/10.1016/j.sedgeo.2012.08.009
Jeannin, M., Garambois, S., Grégoire, C., Jongmans, D. (2006). Multiconfiguration GPR measurements for geometric fracture characterization in limestone cliffs (Alps). Geophysics, 71(3), B85-B92. http://dx.doi.org/10.1190/1.2194526
Jesus, T. E. S., Reis Jr., J. A., Castro, D. L., Lima Filho, F. P. (2012). Imageamento digital de paleocavernas colapsadas com ground penetrating radar. Geologia USP. Série Científica, 12(3), 71-84. http://dx.doi.org/10.5327/Z1519-874X2012000300005
Jorry, S. J., Biévre, G. (2011). Integration of sedimentology and ground-penetrating radar for high-resolution imaging of a carbonate platform. Sedimentology, 58(6), 1370-1390. https://doi.org/10.1111/j.1365-3091.2010.01213.x
Kruse, S., Grasmueck, M., Weiss, M., Viggiano, D. A. (2006). Sinkhole structure imaging in covered Karst terrain. Geophysical Research Letters, 33(16), 1-6. https://doi.org/10.1029/2006GL026975

GPR Imaging in Microbialites
- 199 -Geol. USP, Sér. cient., São Paulo, v. 18, n. 2, p. 188-200, Junho 2018
Loucks, R. G., Mescher, P., McMechan, G. A. (2004). Three-dimensional architecture of a coalesced, collapsed-paleocave system in the Lower Ordovician Ellenburger Group, central Texas. AAPG Bulletin, 88(5), 545-564. https://doi.org/10.1306/12220303072
McClymont, A. F., Green, A. G., Streich, R., Horstmeyer, H., Tronicke, J., Nobes, D. C., Pettinga, J., Campbell, J., Langridge, R. (2008). Visualization of active faults using geometric attributes of 3D GPR data: an example from the Alpine Fault Zone, New Zealand. Geophysics, 73(2), B11-B23. https://doi.org/10.1190/1.2825408
McMechan, G. A., Loucks, R. G., Mescher, P., Zeng, X. (2002). Characterization of a coalesced, collapsed paleocave reservoir analog using GPR and well-core data. Geophysics, 67(4), 1148-1158. https://doi.org/10.1190/1.1500376
Menezes, P. T. L., Travassos, J. M., Medeiros, M. A. M. (2016). A High-resolution facies model of pre-salt lacustrine carbonates reservoirs. Morro do Chaves Fm. Example, Brazil. EAGE Conference and Exhibition, n. 78, 1-5. Vienna, Austria.
Misi, A., Veizer, J. (1998). Neoproterozoic carbonate sequences of the Una Group, Irecê Basin, Brazil: chemostratigraphy, age and correlations. Precambrian Research, 89(1-2), 87-100. https://doi.org/10.1016/S0301-9268(97)00073-9
Muniz, M., Bosence, D. (2009). Sedimentological and stratigraphic analysis of Aptian non-marine carbonates of the Southern Campos Basin, Brazil. AAPG Annual Convention & Exhibition. Denver, Colorado.
Muniz, M. C., Bosence, D. W. J. (2015). Pre-salt microbialites from the Campos Basin (offshore Brazil): image log facies, facies model and cyclicity in lacustrine carbonates. In: M. C. Muniz, D. W. J. Bosence (Eds.), Microbial carbonates in space and time: implications for global exploration and production (418(1), 221-242). London: Geological Society. (Geological Society Special Publications).
Pace, A., Bourillot, R., Bouton, A., Vennin, E., Galaup, S., Bundeleva, I., Patrier, P., Dupraz, C., Thomazo, C., Sansjofre, P., Yokoyama, Y., Franceschi, M., Anguy, M., Pigot, L., Virgone, A., Visscher, P. T. (2016). Microbial and diagenetic steps leading to the mineralisation of Great Salt Lake microbialites. Scientific Reports, 6, 1-12. https://doi.org/10.1038/srep31495
Pipan, M., Forte, E., DalMoro, G., Sugan, M., Finetti, I. (2003a). Integrated vertical radar profiles (VRP) and multi-fold GPR for site characterization. International Workshop on Advanced Ground Penetrating Radar, n. 2, 125-129. Delft, Netherlands: Institute of Electrical and Electronics Engineers.
Pipan, M., Forte, E., Guangyou, F., Finetti, I. (2003b). High-resolution GPR imaging and joint characterisation in limestones. Near Surface Geophysics, 1, 39-55. https://doi.org/10.3997/1873-0604.2002006
Pueyo-Anchuela, Ó., San Miguel, G., Martínez, M., Aurell, M., Bádenas, B. (2011). Geophysical mapping and 3D geometrical characterization of carbonate carbonate buildups in Jabaloyas (Kimmeridgian, NE Spain). Abstracts. IAS Meeting of Sedimentology, n. 28. Zaragoza, Spain.
Reis Júnior, J. A., Castro, D. L., Casas, A., Himi, M., Lima Filho, F. P. (2015). ERT and GPR survey of collapsed paleocave systems at the western border of the Potiguar Basin in northeast Brazil. Near Surface Geophysics, 13(4), 369-381. https://doi.org/10.3997/1873-0604.2015013
Reis Júnior, J. A., Castro, D. L., Jesus, T. E. S., Lima Filho, F. P. (2014). Characterization of collapsed paleocave systems using GPR attributes. Journal of Applied Geophysics, 103, 43-56. https://doi.org/10.1016/j.jappgeo.2014.01.007
Rezende, M. F., Tonietto, S. N., Pope, M. C. (2013). Three-dimensional pore connectivity evaluation in a Holocene and Jurassic microbialite buildup. AAPG Bulletin, 97(11), 2085-2101. https://doi.org/10.1306/05141312171
Roemers Oliveira, E., Fernandes, L. A., Freire, E. B., Simões, L. S. A. (2015). Filamentos microbianos em estromatólitos e laminitos da Sequência Balbuena III (Maastrichtiano/Daniano) da Formação Yacoraite na Sub-bacia Metán-Alemania, na região de Salta, Argentina, e seus significados paleoambientais. Brazilian Journal of Geology, 45(3), 399-413. http://dx.doi.org/10.1590/2317-488920150030255
Santana, A. V. A., Chemale Júnior, F., Scherer, C. M. S. (2015). Caracterização petrográfica, geoquímica e análises isotópicas U-PB (SHRIMP) em siltito tufáceo, Formação Salitre, Supergrupo São Francisco, Bahia. Congresso Brasileiro de Geoquímica e International Symposium on Climate and Geodynamics of Amazon Basin, n. 15. Brasília: Geochemical Brazilian Society.
Sénéchal, P., Perroud, H., Sénéchal, G. (2000). Interpretation of reflection attributes in a 3-D GPR survey at Vallée d’Ossau, western Pyrenees, France. Geophysics, 65(5), 1435-1445. https://doi.org/10.1190/1.1444832
Silva, L. H., Iespa, A. A. C., Damazio-Iespa, C. M. (2007). Considerações sobre estromatólito do tipo domal da Lagoa Salgada, Estado do Rio de Janeiro, Brasil. Anuário do Instituto de Geociências, 30(1), 50-57.

Lima, R. S. et al.
- 200 - Geol. USP, Sér. cient., São Paulo, v. 18, n. 2, p. 188-200, Junho 2018
Souza, S. L., Brito, P. C. R., Silva, R. W. S. (1993). Estratigrafia, sedimentologia e recursos minerais da Formação Salitre na Bacia de Irecê, Bahia. In: A. J. Pedreira (Ed.), Série arquivos abertos (2, 1-34). Bahia: CBPM.
Srivastava, N. K., Rocha, A. J. D. (2002). Fazenda Arrecife, BA - Estromatólitos- Neoproterozóicos. In: C. Schobbenhaus, D. A. Campos, E. T. Queiroz, M. Winge, M. Berbert-Born (Eds.), Sítios geológicos e paleontológicos do Brasil (1, 95-100). Brasília: DNPM/CPRM/SIGEP.
Taner, M. T., Koehler, F., Sheriff, R. E. (1979). Complex seismic trace analysis. Geophysics, 44(6), 1041-1063. https://doi.org/10.1190/1.1440994
Theune, U., Rokosh, D., Sacchi, M.D., Schmitt, D.R. (2006). Mapping fractures with GPR: a case study from Turtle Mountain. Geophysics, 71(5), B139-B150. https://doi.org/10.1190/1.2335515
Ursin, B. (1983). Review of elastic and electromagnetic wave propagation in horizontally layered media. Geophysics, 48(8), 1063-1081. https://doi.org/10.1190/1.1441529
Virgone, A., Broucke, O., Held, A. E., Lopez, B., Seard, C., Camoin, G., Guo, L. (2013). Continental carbonates reservoirs: the importance of analogues to understand presalt discoveries. International Petroleum Technology Conference, n. 6, 1-9. Beijing, China.