ground water information booklet bidar...
TRANSCRIPT

GOVERNMENT OF INDIA
MINISTRY OF WATER RESOURCES
CENTRAL GROUND WATER BOARD
GROUND WATER INFORMATION BOOKLET
BIDAR DISTRICT, KARNATAKA
SOUTH WESTERN REGION
BANGALORE
JULY 2008

FOREWORD
Ground water contributes to about eighty percent of the drinking water
requirements in the rural areas, fifty percent of the urban water requirements and
more than fifty percent of the irrigation requirements of the nation. Central
Ground Water Board has decided to bring out district level ground water
information booklets highlighting the ground water scenario, its resource
potential, quality aspects, recharge – discharge relationship, etc., for all the
districts of the country. As part of this, Central Ground Water Board, South
Western Region, Bangalore, is preparing such booklets for all the 27 districts of
Karnataka state, of which six of the districts fall under farmers’ distress category.
The Bidar district Ground Water Information Booklet has been prepared
based on the information available and data collected from various state and
central government organisations by several hydro-scientists of Central Ground
Water Board with utmost care and dedication. Dr.J.Davithuraj, Assistant
Hydrogeologist, has prepared this booklet under the guidance of Dr.K.Md.
Najeeb, Superintending Hydrogeologist, Central Ground Water Board, South
Western Region, Bangalore. The figures were prepared by S/Sri.
H.P.Jayaprakash, Scientist-C and K.Rajarajan, Assistant Hydrogeologist. The
efforts of Report processing section in finalising and bringing out the report in this
format are commendable.
I take this opportunity to congratulate them for the diligent and careful
compilation and observation in the form of this booklet, which will certainly serve
as a guiding document for further work and help the planners, administrators,
hydrogeologists and engineers to plan the water resources management in a
better way in the district.
sd/- (T.M.HUNSE)
Regional Director

BIDAR DISTRICT AT A GLANCE Sl. No
ITEMS Statistics
GENERAL INFORMATION i) Geographical area (Sq.km) 5417.65
ii) Administrative Divisions (As on 2005-06) a) Number of Tahsil / Blocks 05 b) Number of panchayat/Village 175/621 iii) Population (As on 2001Census) 15,02,373
1.
iv) Average Annual Rainfall (mm) 827 GEOMORPHOLOGY
Major physiographic units Northern low lands and southern highland (Bidar platue)
2.
Major Drainages The Manjara and the Karanja rivers LAND USE (Sq.km) a) Forest area 277.07
b) Net area sown 3543.05
3.
c) Cultivable area 193.82 4. MAJOR SOIL TYPES Black soils and Lateritic soils
IRRIGATION BY DIFFERENT SOURCES (Areas in sq km) Dug wells 239.89
Tubewells /Borewells 134.62 Tanks/Ponds 8.50
Canals 6.19 Other sources 10.45
5.
Net Irrigated area 400.30
NUMBER OF GROUND WATER MONITORING WELLS OF CGWB (As on 31.03.2007) No of Dugwells 45
6.
No of Piezometers 19 7. PREDOMINANT GEOLOGICAL FORMATIONS Deccan trap
HYDROGEOLOGY Fractured basalt and weathered vesicular basalt
Major water bearing formation Basalt
Pre-monsoon Depth to water level during-2006 2.81 to 17.90 m bgl Post-monsoon Depth to water level during-2006 0.40 to 13.09 mbgl
8.
Long term water level trend in 10 years (1997-2006) in m/year
Pre-monsoon Post -monsoon
0.0 to 0.69 falling 0.01 to 0.85 Rising 0.09 to 0.86 falling 0.0 to 0.937 Rising
GROUND WATER EXPLORATION BY CGWB (As on 31.3.2007)
No of wells drilled (EW, OW, PZ, SH, Total) EW-30 OW-13 Depth range (m) 45 to 235
Discharge (litres per second) Negligible to 6
9.
Transmissivity (m2 /day) 3.23 to 40.31
GROUND WATER QUALITY
Presence of chemical constituents more the permissible limit Electrical Conductivity (micro mohs/cm at 25º c) Fluoride (F in ppm) Nitrate (No3 in ppm) Chloride (Cl in ppm)
Ranges 165-1140 0.02-1.6 02-120 14-187
10.
Type of water Alkaline DYNAMIC GROUND WATER RESOURCES (2004) IN MCM
Annual Replenishable Ground water Resources 427.19 Net Annual Ground Water Draft 32.40 Projected Demand for Domestic and industrial uses upto 2025
230.08
11.
Stage of Ground Water Development (%) 56.68
AWARENESS AND TRANING ACTIVITY 12. Mass Awareness Programmes organised Date Place No of participants
Nil
EFFORTS OF ARITIFICIAL RECHARGE & RAINWATER HARVESTING
Projects completed by CGWB (No & amount spent)
Nil
13.
Projects under technical guidance of CGWB (Numbers)
Nil
GROUND WATER CONTROL AND REGULATRION Area of OE Taluk 21% of Bidar taluk, 9% of
Basvakalyan taluk and 7% of Bhalki taluk
Area of Critical Taluk 5% of Bhalki taluk
14.
No of Blocks notified Nil 15. MAJOR GROUND WATER PROBLEMS AND
ISSUES Water scarcity in some areas

BIDAR DISTRICT 1.0 INTRODUCTION
The Bidar district is the northern most part of the Karnataka state with geographical area of 5460 sq.km. It lies between 17°35’ and 18°29’ North latitude and 76°41’ to 77°39’ East longitude. It is bounded by Nizamabad and Medak districts of Andhra Pradesh state on the eastern side, Latur and Osmanabad districts of Maharastra state on the western side, Nanded district of Maharastra state on the northern side and Gulbarga district on southern side. 1.1 ACCESSIBILITY The Hydrabad-Parli Vaijanath, broad gauge railway section of the South Central Railway passes through Bidar and Bhalki taluks of this district. The National Highway No-9 connecting Hydrabad with Puna and Bombay passes through Humanabad and Bidar taluks of the district. The district is served by a good network of roads, which connects Bidar district with other important towns of the district of state and neighbouring state. Metal roads have connected all the important villages and all the parts of area are easily approachable. 1.2 ADMINISTRATIVE DIVISIONS
The Bidar district is constituted by five talukas i.e. Aurad, Basavakalyan, Bhalki, Bidar and Humnabad with Bidar being the head quarters of the district. The Taluka wise statistics are given in Table– 1 and administrative map is presented in Fig-1.
Table-1: Talukwise Area, Village & Population No. of villages S.
No. Taluk Area
(sq. km) Inhabited Uninhabited
Population (as per 2001 census)
1 Aurad 1227.2 151 01 245739 2 Basavakalyan 1202.97 112 03 299910 3 Bhalki 1117.2 130 03 257042 4 Bidar 925.19 124 10 405540 5 Humnabad 987.56 82 05 294587 Total 5460.12 599 22 1502373
1.3 DRAINAGE:
Major parts of the district is covered by Godavari basin, drained by its two major tributaries the Manjara and the Karanja rivers. The Manjara river is perennial river flows over a distance of 155 km in the central parts of the district and flows eastern direction with a meandering course. The Karanja river flows in northern-western direction for 74km with karanja reservoir being major water source. The river Mullamari takes its origin near Matala village of Basavakalyan taluk flows from west to east length of 38 sq.km and then flows into Gulbarga district and joins the river Kagna. The Kagna river is one of the main tributary of Bhima river. Besides, there are several streams, which are of ephemeral in nature. The drainage pattern in the district varies from sub-dendritic to dendritic and some streams have a sub parallel drainage to the main river. The drainage map of the district is presented in Fig-2.
1.4 IRRIGATION PRACTICES In the district the irrigation takes place from surface water and ground water. The surface water irrigation is through canals, tanks and from medium and minor irrigation projects. Major irrigation dam has been constructed across the Karanja river and medium irrigation dam constructed across Chukkenala and Mullamari rivers. From ground water the irrigation is

through dug wells, dug cum bore wells and bore wells. Taluk wise irrigated area from different sources is shown in Table – 2.
Table-2: Area Irrigated by different sources in each Taluk of Bidar district.
S. No.
Taluk Canals Tanks Dug wells
Bore wells
Lift irrigation
Other source
Total
1 Aurad 0 2.88 9.45 11.18 0.06 6.03 29.60 2 Basavakalyan 0.50 1.54 55.62 22.80 0 1.39 81.85 3 Bhalki 5.34 1.08 43.12 5.80 0.26 0.57 56.17
4 Bidar 0 2.55 61.17 51.23 0.33 2.46 117.74 5 Humnabad 0.35 0.45 70.53 43.61 0 0 114.94 Total 6.19 8.50 239.89 134.62 0.65 10.45 400.30
1.5 LAND USE The district has 5460.12sqkm of total geographical area out of which 277.07sqkm are
forest, which is 5.07% of the total area of district. Land not available for cultivation in the district is 688.40sqkm and uncultivable land is 440.66 sq.km. Actual agriculture land is 8789sqkm out of that 851.4sqkm area is cultivated more than once the Tahsil wise details of land use in given in Table-3.
Table: 3. Taluk wise land utilisation in Bidar district (in sq.km) Net area sown Taluk Area
(sq.km) Forest Land not
available for
cultivation
Un-cultiva
ble land
Fallow Land
Net Sown Sown > once Total
Aurad 1227.2 23.11 81.85 78.28 185.99 870.1 190.7 1060.8 Basavakalyan 1202.97 71.43 180.84 95.58 163.16 754.8 162.6 917.4 Bhalki 1117.2 25.84 82.39 139.38 38.28 832.5 301.4 1133.9 Bidar 925.19 46.5 114.79 34.00 251.73 521.5 89.8 611.3 Humnabad 987.56 110.14 228.53 93.42 106.38 564.1 107.0 671.1 Total 5460.12 277.07 688.40 440.66 745.54 3543.1 851.4 4394.5
1.6 CROPPING PATTERN
The main occupation of the people in the district is agriculture and related operations. There are two main seasons in which agricultural practices are carried out. The two seasons are Kharif and Rabi. Khariff season commences from June and the crops are harvested in September. Rabi season commences from September and crops harvested in Febuaray. The main food crops are Jowar, Paddy, Wheat, Bajra, Maize and pulses. Groundnut, sugarcane and cotton are the cash crops. 1.7 STUDIES CARRIED OUT BY CGWB
The Central Ground Water Board has drilled 43 bore wells under ground water exploration programme. The statistics of these bore wells comprising number of bore wells, depth range and discharge range etc., The periodic monitoring of DTW of observation dug wells (45) and borewells (19) in the district are also carried out by CGWB during January, May, August and November of every year, which are discussed in Hydrogeology part. Officers from CGWB have carried out Hydrogeological Surveys in the district.

2.0 RAINFALLS AND CLIMATE The district experiences semi-arid climate with extreme summer. The dust storms and
severe heat waves are common in the district between April and May. The temperature begins to rise towards the end of February till May, which is the hottest month of the year. Coldest months are December and January. The temperature varies in the district between 20 ºC and 42 ºC
The year in the district may be divided into summer season from March to May, southwest monsoon season from June to September, post-monsoon season from October to November and winter season from December to February.
Generally, the monsoon sets in the month of June and reaches its climax in the month of September. The rainfall generally is spread over 39 to 53 days. Nearly 75% to 80% of the annual rainfall is during the period of Southwest monsoon. A few showers are also received during the North- East Monsoon, generally in the month of December.
Bidar district receives an average rainfall of 827 mm. The normal annual rainfall over the district ranges from 735 mm to 860 mm and taluk wise normal and actual rainfall of the district is presented in Table-4.
Table: 4 Taluk-wise normal rainfalls in Bidar district Sl No
Taluk No.of raingauge stations
Normal rainfall (mm) 1901-70
Actual rainfall (mm) 2006
Rainy days
1 Aurad 6 735 882 39
2 Basavakalyan 6 830 451 49 3 Bhalki 9 859 808 48
4 Bidar 8 860 762 53 5 Humnabad 8 849 714 48
Total 37 Average 827 Average 724 Average 47
The Indian Meteorological Department (IMD) has divided rainfall into five categories i.e.
excess, normal, moderate, severe and acute to arrive at the agricultural drought conditions. The details are given in Table – 5. As per the table, when the rainfall is more than 25% of Normal Annual Rainfall it is excess, when the rainfall departs from normal Annual Rainfall between +25% to -25% it is normal. When the rainfall departs more than -25% from Normal Annual Rainfall it causes drought. The drought is named as moderate, severe and acute according to the departure of rainfall from Normal Annual Rainfall, thus if the departure is between -25 and -50%, then it is termed as moderate; if it is between -50 and -75%, then severe; and if more than -75%, then it is termed as acute.
Table 5- Agricultural Drought Based on Rainfall Departure from Normal Sr No Taluk Departure in % from
Normal Annual Rainfall Category
1 Aurad +20 Excess 2 Basavakalyan -46 Moderate Drought 3 Bhalki -6 Normal 4 Bidar -11 Normal
5 Humnabad -16 Normal

The percentage probability of occurrence of normal rainfall over the district has shown in Table-6.
Table-6: Probability Analysis of Occurrence of Annual Rainfall Rainguage Stations Probability
(%) Aurad Basavakayan Bhalki Bidar Humanabad
10 1200 910 1100 1000 1100
20 1170 900 1070 1000 1050
30 1110 880 1020 1080 1000 40 1050 850 980 1030 940
50 990 810 910 970 900 60 920 790 880 920 850
70 880 770 820 890 780 80 830 750 790 840 710
90 750 700 710 800 680
100 700 680 700 750 610
The dependable rainfall for the above stations can be used for construction of any
recharge structure in the district.
3.0 GEOMORPHOLOGY AND SOIL TYPES Physiographically, the district can be divided into two regions. They are northern low
lands and southern high lands. The southern high lands are popularly known as Bidar plateau, which is made up of laterite. The ground altitudes are varying from 420 to 684 m above MSL. Bidar plateau has an elevation range from 640 to 684 m above MSL. The ground surface is flat, gently sloping forming broad valleys and flat topped hills. Flat topped hills with Step like sides exhibit the terraced landscape. Soils The two important types of soils noticed in the district are black soils and lateritic soils. 1. Black Soils
Major parts of the district are comprised of black soils and are derived from Deccan traps. These are deep black in colour and their texture varies from loam to clay. Lime concentration in this soil is high resulting in poor infiltration capacities. Their infiltration characteristics are poor to moderate. This type of soils covers mainly in areas lying below 610 m contour and along the valley portions. 2. Lateritric Soils
A Latertic soil is confined to the central portion of the district. Latertic soils are pale to bright red in colour and clay to clayey loam in nature. This soil has moderate to good infiltration characteristics. This type of soils covers mainly in areas lying above 610 m contour.

4.0 GROUND WATER SCENARIO 4.1 HYDROGEOLOGY The entire district is underlain by lava flows of the Deccan trap except small area covered with the laterites capping and shown in Fig-3. Deccan trap consists of successive lava flows, almost horizontal in disposition. Individual flows show considerable variation in physical character, thickness, nature and extent of weathering etc. The basaltic lava flows are generally dark, grey, hard and compact. Each lava flows normally consists two units lower massive basalt and upper vesicular basalt. Secondary minerals like zeolites, quartz, calcite or some earthy or ferruginous material fill the vesicles. Well-developed columnar joints and spherical weathering are characteristic features of the massive basalt. The massive basalt and vesicular basalt are similar in term of compositionally and texturally. Water bearing properties of formation
Deccan Trap basalts represent a thick pile of nearly horizontal layered formation. The porosity and permeability change within an individual flow and also from flow to flow and place to place. The weathered zones, joints and fractures in the massive and vesicular units of basalt form the water bearing horizons. Abundance of vesicles with interconnecting nature coupled with joints and horizontal partings in the vesicular basalt make it a good aquifer. The red bole bed, occurring as top undulating layer of flow, inhibit movement of ground water as it is composed of mixture of fragmentary material and clay particles. It therefore acts like an aquiclude and its position in the lava sequence indicate presence of permeable water bearing zone underneath. Occurrence of Groundwater
Basalt: In general ground water occurs under water table conditions in shallow aquifer and semi-confined to confined conditions in deeper aquifer. The fractured jointed vesicular basalt and massive basalt when overlain by red bole bed of considerable thickness develops semi-confined to confined conditions. Hence the red bole bed acts as a confining layer. The red bole bed being of clayey in nature also acts as a ground barrier for downward movement. The weathered and jointed zone of massive basaltic unit and vesicular basaltic unit constitute the unconfined aquifer, which are being tapped by dug wells. The semi-confined to confined aquifers are being tapped by dug cum bore wells and bore wells. The presence of columnar joint in massive basalt also helps in the occurrence and movements of ground.
Laterite: Laterite occupied a small area in southern parts of the district. Laterite mainly occurring above 610m contours generally varies in thickness from 10 to 30 m. On high ground 1 to 2 m of laterite is very hard, ferruginous, iron black in colour, grading downwards into soft greyish or reddish coloured laterite, more clayey and aluminous in character at some places. The maximum thickness of 45 m is noticed near Bidar fort. The laterites are more or less a porous rock and acts as a recharge source to the underlying rocks. During monsoon the rock gets saturated quickly. However, de-saturation is also equally quick, once the monsoon is over. Depth to Water Level: The Central Ground Water Board has established 45 hydrograph stations. These hydrograph stations are measured four times a year, each year i.e. in January, May, August and November. Depth to water level varies within the area depending on the hydrogeological setup, incidence of rainfall, topographic setting and stage of groundwater development. Pre-monsoon Depth to Water Level: In order to study the summer ground water regime of the district, depth to water level map has been prepared based on pre-monsoon (May 2006) water

level data and presented in Fig-4. The depth to water level in the district varies from 2.81 m to 17.90 m bgl. The perusal of Fig-4, reveals that the shallow water level less than 5 m bgl occurs in small isolated patches around Kamalnagar, Sangam and Alandi of Aurad taluk and Lakangaon, Sivani, Kakinal, Batsangi, Melkunda and Helsi of Bhalki taluk. The shallow water level in these areas is due to low topography and nearer to river course of Karanja and Manjra rivers. These are the areas where ground water development can be accelerated. Area with D.T.W. in the range of 5-10 mbgl is found scattered over the four taluks except Bidar taluk. The depth to water level more than 10 metre and less than 20 m occur in whole Bidar taluk, 50% area of Bhalki & Humanabad taluks and 25% area of Aurad taluk. The deeper water level in pre monsoon is due to the excessive withdrawal of ground water.
Post-monsoon Depth to Water Level: Depth to water level map has been prepared based on post-monsoon (November 2006) water level data and presented in Fig-5. The post-monsoon water level over the district varies from 0.40 to 13.09 m bgl. From the Fig-5, it is observed that depth to water level is less than 2 m bgl occurs three isolated pockets around Sangam of Aurad taluk and Lakangaon, Sivani, Kakinal, Batsangi, Melkunda saigaon and Helsi of Bhalki taluk and also Hulsur & Mudebi of Basavakalyan taluk. Area having D.T.W. in the range between 2 and 5 m bgl is found in northern part, central part and extreme southern part of the district. Area with D.T.W. in the range of 5-10 mbgl is found scattered over the all taluks. Area with D.T.W. in the range between 10 and 20 mbgl occurs as elongated patches in Bidar taluk from north to south and extending towards Bhalki taluk in western part and Humnabad taluk in southern part and also one isolated pocket around Basvakalyan, Partapur, Morkhandi and Matala of Basvakalyan taluk. Long Term Water Level Trend: Ground water is a renewable resource it gets depleted when the aquifer is over drafted. The aquifer gets recharged during monsoon period. Rainfall is the main source of recharge to ground water. In order to study the long-term trends of ground water level in the district, water level data has been analyzed for 45 NHS observation wells for pre monsoon and post-monsoon established by Central Ground Water Board, for the periods from January1996 to November-2005. Talukawise long-term water level trend data of Bidar district is presented in Table-7.
Table–7. Talukawise Long Term Water Level Trend of Bidar district
Ranges of long-term water level trend m/year
Pre monsoon Post monsoon
Sl. No
Taluk
Fall Rise Fall Rise
1 Aurad 0.027 to 0.500 0.014 to 0.124 0.020 to 0.298 0.0 to 0.438
2 Basavakalyan 0.0 to 0.126 0.065 to 0.476 0.022 to 0.494 -
3 Bhalki 0.066 to 0.102 0.028 to 0.327 0.046 to 0.186 0.022 to 2.50
4 Bidar 0.092 to 0.686 0.215 to 0.851 0.009 to 0.792 0.0 to 0.937
5 Humnabad 0.120 to 0.390 0.048 to 0.383 0.089 to 0.865 -
Pre-Monsoon Water Level Trend The pre monsoon water level trend shows the effect of ground water development. Significant decline more than 20 cm/yr is observed in Aurad and Kamalnagar of Aurad taluk, Kamthana of Bidar taluk and K.Hallikheda of Humnabad taluk. Significant rising tend >20 cm/yr is observed in Matala of Basvakalyan taluk, Halbarga of Bhalki taluk, Bidar of Bidar taluk and Changler and Halikheda of Humnabad taluk.

Post-Monsoon Water Level Trend The post monsoon water level trend indicates whether the ground water body has been fully recharged or not. If water level trend is declining, it suggests that the aquifer is getting desaturated year after year. The water level decline in post monsoon may be due to poor rainfall or large development of ground water in that area. Significant water level decline >20 cm/yr is observed in Donegaon, Kamalnagar and Kusnur of Aurad taluk, Rajeswara of Basavakayan taluk, Andur, Bagdel and Kamthana of Bidar taluk and Changler, Chitguppa, Dublagundi, Ghatboral, Hallikheda, Humnabad, K.Hallikheda, Maniknagar, Meenkere and Nirna of Humanabad taluk. Significant rising tend >20 cm/yr is observed in Aurad of Aurad taluk, Alandi of Bhalki taluk and Bidar of Bidar taluk. Yield In the district of Bidar, there are three types of ground water extraction structure i.e. the dug wells, bore well and dug cum bore well, The yield depends upon the geological formation, their location with respect to physiography, diameter and depth etc., Yield of Dug wells Majority of the dug wells are used for domestic purposes. The rope and pulley is used to withdraw the water. The dug wells and dug cum bore wells tapping phreatic aquifers of basalt and laterites. In basaltic area, the yield of wells depends upon the saturated thickness and jointed, fractured thickness of vesicular/massive basalt. The dug wells located in topographic lows yield relatively better. Yield ranges of dug wells and dug cum bore wells from 20 to 200 m3 / day with sustaining pumping for one to four hours in a day during summer and 5 to 10 hours during winter. Yield of Bore wells
To provide drinking water facilities to villages, the state government has drilled number of bore wells. The yield of these bore wells ranges from less than 1 lps to as high as 12.64 lps. Most of the high yielding bore wells are generally in the close vicinity of lineament. Most of the high yielding bore wells are fitted with power pumps while the other high as well as poor yielding bore wells are fitted with hand pumps. Ground Water Exploration
43 exploratory wells have been drilled in the district under Ground water exploration programme between the period of September1990 and March1994 to ascertain the presence of productive aquifer zones, quality of ground water, yield of aquifer zones and determine aquifer parameter. Maximum depth drilled in the district is 202m and the entire depth has been recorded with basalt of different flows. Yield of the formation between 0-100m is in range of negligible to 6 lps. However, the exploratory wells drilled at Morabi up to a depth of 58.45 m yielded 20 lps and at Dubalgundi drilled up to a depth of 88.65 m yielded 16.5 lps and Hallikheda drilled up to a depth of 58.15 m yielded 14.6 lps. Maximum depth of drilling up to 200 m has been done in Bidar and Aurad taluks. The yield ranges from 0.07 to 6.28 lps. Drilling beyond 100m and up to a depth of 200 m has not given encouraging results. The pumping test of these wells has given Transmissivity values ranging from 3.23 m2/day to 40.31 m2/day. During present exploratory drilling programme one exploratory well and one observation well have been drilled to a depth of 204mbgl and 235 m bgl respectively. Discharge of exploratory well was recorded 5.41lps and observation well was 3.26 lps.

Table 8:TALUKWISE GROUND WATER RESOURCES OF BIDAR DISTRICT AS ON 31ST MARCH 2004
CATEGORISATION OF TALUKS AS ON MARCH
2004
TO
TA
L A
NN
UA
L G
RO
UN
D
WA
TE
R R
EC
HA
RG
E
NE
T A
NN
UA
L G
RO
UN
D
WA
TE
R A
VA
ILA
BIL
ITY
EX
IST
ING
GR
OS
S G
RO
UN
D
WA
TE
R D
RA
FT
FO
R
IRR
IGA
TIO
N
EX
IST
ING
GR
OS
S G
RO
UN
D
WA
TE
R D
RA
FT
FO
R
DO
ME
ST
IC A
ND
IN
DU
ST
RIA
L
WA
TE
R S
UP
PLY
EX
IST
ING
GR
OS
S G
RO
UN
D
WA
TE
R D
RA
FT
FO
R A
LL
US
ES
ALLO
CA
TIO
N F
OR
D
OM
ES
TIC
AN
D I
ND
US
TR
IAL
US
E F
OR
NE
XT
25 Y
EA
RS
NE
T G
RO
UN
D W
AT
ER
A
VA
ILA
BIL
ITY
FO
R F
UT
UR
E
IRR
IGA
TIO
N D
EV
ELO
PM
EN
T
AV
ER
AG
E C
RO
P W
AT
ER
R
EQ
UIR
EM
EN
T
BA
LA
NC
E G
RO
UN
D W
AT
ER
IR
RIG
AT
ION
PO
TE
NT
IAL
AV
AIL
AB
LE
SA
FE
AR
EA
(
%)
SE
MI-
CR
ITIC
AL
AR
EA
(%
)
CR
ITIC
AL A
RE
A (
%)
OE
A
RE
A (
%)
HAM
HAM
HAM
HAM
HAM
HAM
HAM
(m)
HAM
Aurad 7748.45 7361.03 1319.90 506.30 1826.20 78.14 5302.99 0.84 6345.25 100
Basvakalyan 8496.96 8079.08 3266.91 589.65 3856.56 819.61 4073.13 0.90 4521.13 91 09
Bhalki 9162.91 8704.76 3877.09 555.85 4432.94 772.63 4110.61 0.87 4711.30 88 05 07
Bidar 7161.56 6803.43 5993.52 1117.08 7110.60 1975.16 1963.72 0.87 2250.69 79 21
Humnabad 10149.28 9646.00 5310.39 471.44 5781.82 655.30 3680.31 0.87 4239.15 100
Total 42719.16 40594.3 19767.81 3240.32 23008.12 4300.84 19130.8 0.87 22067.5

13
4.2 GROUND WATER RESOURCES The resource estimation and categorization is carried out as per the recommendations of
‘Ground Water Resources Estimation Methodology – 97 ‘ (GEM – 97) considering water shed as a unit. Water shed and hydrological boundaries do not match with the administrative boundaries. As a result different parts of taluk fall in different watersheds having different stages of ground water development and categorization. Pro-rata approach to consolidate the watershed data into Talukwise data gives only details on ground water resource, draft, and additional irrigation potential. Pro rata approach cannot be applied for taluk, as a unit, as far as stage of development and categorization is concerned. However average stage of development is given to have over all idea about the taluk.
The percentage of safe, critical and over exploited area in each taluk is given Table-8. It is observed from the Table-8 that Aurad and Humanabad taluks are completely under safe. 88% of Bhalki and 91% of Basavakalyan taluks are safe and 79% of Bidar taluk is safe while rest of 21% comes under over exploited area. No area comes under the category of semi-critical. The overall stage of ground water development in the district ha s reached 56.68%. Thus regionally the situation appears quite good, however few areas of the district have attained overexploited stage. In such areas site specific recharge structures coupled with water conservation measures are the need of the hour.
1. Annual Ground Water Recharge = 42,719.16 ham 2. Net Ground water availability = 40,594.30 ham 3. Gross Draft Irrigation = 19,767.81 ham 4. Gross Domestic and Industrial draft = 3,240.32 ham 5. Total Draft = 23,008.12 ham 6. Allocation for Domestic and Industrial requirement for next 25 years = 4,300.84 ham 7. Net ground water availability for irrigation = 19,130.80 ham
Status of ground water utilisation map of Bidar district has been prepared based on ground water resource estimation and shown in Fig-6. It is observed from Fig-6 that entire district comes under safe category except few areas of Bidar taluk, Bhalki taluk and Basvakalyan taluk. 4.3 GROUND WATER QUALITY
Water quality observations are essential to know the changes in quality of ground water, which plays a prominent role in promoting both the standards of agricultural production and human health. To evaluate the quality of ground water, ground water samples have been collected from observation wells of National Hydrograph Stations and Exploratory bore wells. The ground water quality of the district has been analysed from the point of view of drinking and irrigation purposes.
Ground Water Suitability for drinking purposes Based on analytical data of 56 samples of hydrograph stations and Exploratory bore wells, an effort was made to classify ground water for drinking purpose as IS standards given below in Table-9.
14
Table –9 Drinking water standards and concentration ranges (IS: 1991)
Parameters
Desirable Limit ppm
Permissible Limit ppm
Undesirable effect outside limit
Concentration ranges in the
district ppm
Total dissolved solids
500
2000
Palatability decrease and may cause gastro intestinal
problems
105-690
Nitrate
45
No Relaxation
May cause Methamoglobineimia
02-120
PH 6.5-8.5 No Relaxation
The water will affect the mucous
membrane and water supply
system.
7.0-8.5
Fluoride <1.5 >1.5 Excessive fluoride causes mottling of tooth enamel and
skeletal deformation
0.02-1.6
Calcium
75
200
Encrustation in water supply structure and
adverse effects on domestic use.
03-110
Magnesium 30 100 -do- 04-54
Chloride 250
1000
Taste, Corrosion palatability are
affected
14-187
Sulphate
200
400
May cause gastro intestinal
01-101
Hardness
300
600
Encrustation in water supply structure and
adverse effects on domestic use.
68-492
The analyses of ground water samples of the district revealed that the ground water
quality found to be potable in general when compared with standards prescribed by BIS (IS-10500-1991) and it is also suitable for irrigation purposes in the major parts of the district. Distribution of fluoride concentration map has been presented Fig- 7. The perusal of map-7 reveals that the entire district is having fluoride concentration in the range of less than 1.5 ppm except area around Bidar.

15
Ground Water Suitability for irrigation purposes Apart from domestic consumption, irrigation is consuming a major share of ground water
for agricultural activities. The quality of water used for irrigation is an important factor in productivity and quality of irrigated crops.
Electrical conductivity
The ability of water to conduct an electrical current is called its electrical conductance or conductivity. Electrical conductivity is very useful for determining water quality, because it is an indicator of salinity in water, which affects the taste and has an impact on the user acceptance of water as potable. Classified ground water based on EC values, for irrigation purpose and is given in Table-10. Table-10: Suitability of ground water based on Electrical conductivity for irrigation purpose
Sl.No. Conductivity
(µMhos/cm)
Suitability for irrigation % of samples
01 Below 250 Entirely safe 10
02
250 - 750
(Moderately Saline)
Safe under practically all conditions
57
03 750-2250
(Medium to high salinity)
Safe only with permeable soil and moderate leaching
33
04 Above 2250 Unfair for irrigation Nil
According to the above classification, 67% of ground water samples have EC value less
than 750 µmhos/cm and falls in safe catagery. 33% of ground water samples have EC value
between 750- 2250 µmhos/cm and falls in medium salinity to high salinity category. Isocone map has been prepared based on EC value of ground water samples and shown in Fig-7. Iso cone map depicts that area around Mudbi of Basvakalyan taluk, Changler of Humanabad taluk
and Bhalki having EC value more than 1000 µmhos/cm and falls under medium to high salinity. Chloride:
The suitability of ground water based on chloride concentration has been classified and presented in Table-11.
Table-11 Classification of Based on Chloride (Scofield 1933) S N Class Chloride Concentration
(ppm)
% of Samples
1 Class I <150 92
2 Class II 150-500 08
3 Class III >500 Nil
According to above classification, 92% of ground water samples falls in category I and II. Thus it is indicating that the ground water of the district is suitable for irrigation activities under ordinary condition of soil and climate. None of the samples indicated its unsuitability for irrigation purposes.
4.4 STATUS OF GROUND WATER DEVELOPMENT
16
At present ground water is being utilised in the district through dug wells and bore wells for irrigation and domestic proposes. Dug wells are usually circular, square or rectangular in shape and the depth varies from 7 to 20 m in lateritic area and 6 to 12 m in basaltic area. Depth of well depends upon the topography of the terrain as well as the depth of water level and seasonal fluctuation. The talukwise ground water structures have been presented in Table-12.
Table: 12 Taluk wise ground water structures in Bidar district
Domestic water supply Sl. No
Taluk Irrigation structures Bore wells
Piped WS Schemes
MW schemes
1 Aurad 4742 1453 89 142 2 Basavakalyan 11249 1522 78 162
3 Bhalki 5796 1373 80 139 4 Bidar 12419 1447 79 137
5 Humnabad 12860 1274 76 72 Total 47066 7069 402 652
In 60% of the district area the yields of shallow zones upto the depth of 20m was less
than 1 lps. In rest of the 40% area of the district the yields recorded were between 1 to 2 lps, especially in Aurad, Humnabad and Bidar taluk. Within the weathered and fractured basalt, phreatic aquifers are encountered at a shallow depth range of 0 to 20 mbgl and are tapped mainly by dug wells. Average thickness of these aquifers ranges from 5 to 15m. At deeper depth range (40-200m) bore wells are the most common abstraction structures with an yield ranging from 1 to 12 lps. 5.0 GROUND WATER MANAGEMENT STRATEGY 5.1 GROUND WATER DEVELOPMENT
The ground water is regarded as a renewable natural resource therefore only certain quantitative of water may be withdrawn annually so that no detrimental effects such as water level deflection take place. In the area ground water is developed through dug wells dug cum bore wells and bore wells. The dug wells tap the shallow aquifer whereas dug-cum bore wells and bore well tap both shallow and deep aquifers. It is observed from the Table-8, that all talukas falling under the Safe category, which is wide, scope for ground water development. There are few areas in Bhalki, Basavakalyan and Bidar talukas of the district, the ground water development has reached overexploited stage . This is clearly indicating that ground water has been over exploited and causing rapid depletion of aquifers. In these areas, ground water augmentation technique should be taken up to arrest the decline trend of water level. There should not be any additional development of ground water. In these areas priority should be given for ground water augmentation by constructing suitable structures such as nala bundings, cheek dams, percolation tanks etc.

17
5.2 WATER CONSERVATION & ARTIFICIAL RECHARGE Artificial recharge of aquifers is a solution to the declining trends of ground water levels in
some parts of the district due to over- exploitation of the ground water resources and poor saturation of the aquifers due to decreased rainfall. There is rise in the utilization of ground water for irrigation and domestic purposes through dug wells and bore wells. To increase the augmentation to ground water the following strategy may be adopted to enhance / save the ground water resources for future development.
a) Artificial recharge practices should be adopted by rainwater harvesting system. There are two basic types of water harvesting system. One is directive application where run off water is collected and stored in the soil profile during the precipitation. The second one is supplemented water system where the collected water is stored off set in some reservoir or storage container and applied later to the crop with some form of irrigation system.
b) Minor irrigation tanks, check dams and ponds, which are state owned and have been used as a source of irrigation in the past. Many of these structures are in disuse on account of poor maintenance or no maintenance. The farmers in the vicinity of such tanks, check dams and ponds can be organized on a group basis with right to create charge and maintain the structure through appropriate legislation.
c) Formation of cooperative societies should be encouraged for the construction of structures, operation and maintenance both for existing and new one and for the distribution of water among the owners of small land holding.
The design of water harvesting system is basically same for all locations. At the same
time there is no standard design for a water harvesting system. Each site and water use are unique and each system must be fitted with local condition and needs. There are many elements, which are to be considered such as precipitation pattern, water requirement pattern soil, land topography, equipment, labour and acceptability of water harvesting concepts by the water user.
d) The farmer should be encouraged to make arrangement for the preservation of rainwater on their fields and running out of their filed by digging numerous narrow channel above 15 m long 15 cm broad and 15 cm deep in their field.
e) Construction of small ponds in the field of farmers be encouraged at individual small farm level.
Many village ponds are silted and are in disc state after the implementation of modern pipeline water supply system in the villages. Desilting and repairing of these ponds be taken up. It will help in raising the water table of the area. 6.0 GROUND WATER RELATED ISSUES & PROBLEMS
The availability and sustainability of ground water in the Bidar district is controlled by Physiography, geology and rainfall received. There are prominent hill ranges, many isolated hillocks etc. The district entire is occupied by hard rock formation of basaltic lava flow, which is generally very poor in ground water storage and transmissivity. Therefore this formation gets maximum saturation during monsoon and if it is fully saturated resulting in a situation of rejected recharge. These aquifers then are drained naturally due to sloping and undulatory topography. Similarly wherever more groundwater development takes place, these aquifers become nearly dry or semi-dry reaching to water scarcity for drinking purpose during summer months. In many areas where adequate recharge to ground water does not occurs due to one or many reasons, the presence of massive basalt at the ground surface also hinders in the process of recharge to the underlying porous Strata. The rainfall of the district varies from 451
18
mm to 882 mm with average rainy days of 47 and during last five years was from 550 mm to 882 mm. This indicates that the district is not free from drought condition. Late onset of the monsoon or early withdrawal of monsoon affects the rainfall recharge and ground water availability in the district. The years of low rainfall also adversely affect the ground water resources as. 1) Lesser amount of recharge to ground water reservoir and. 2) More withdrawal of water from the reservoir. This ultimately results into drying up and lowering of water levels in dug wells and bore wells in district during the summer.
7.0 RECOMMENDATIONS
The following recommendations are made for planned and scientific development of ground water resource based on hydrogeological studies.
The study of average rainfall data reveals that district is not free from drought condition Hence it is suggests that the artificial recharge structures like percolation tanks, Nala bund etc may be constructed to augment the ground water resource.
Most of the dugwells in the district go dry in the month of February and March, hence it is suggested that to construct the recharge structures for facilitate the groundwater.
The depth of the dugwells, which can be, developed in the district range between 8 to 15 m bgl depending upon topographic setup and thickness of the weathered zone. The depth of the well may be decided more precisely by referring to the depth to water level (Fig-4).
To augment the groundwater resource, percolation tanks and other artificial recharge structures may be constructed where the depth to water level is more than 15m bgl (Fig-4).
Kamalnagar, Kamthana and K.Hallikheda hydrograph stations are showing significant declining (>20 cm) trend of groundwater levels for pre and post monsoon seasons. Hence, it is necessary that this trend to be reversed by introducing controlling measures by construction of artificial recharge structures and other water conservation structures to enhance the recharge to ground water. Red bole horizons in the basaltic areas invariably indicate that below them lie the weathered vesicular basalts and below the vesicular basalts lie the highly weathered and fractured massive basalts. Therefore, if a well ends in red bole, it should be deepened further to tap the entire thickness of the weathered/fractured zones until it encounters hard massive basalt below. Many dug wells in the district are being used as waste dumping sites thus enhancing the nitrate concentrations and other harmful chemical substances. Care must be taken that these wells are cleaned once annually and used for other household purposes.
In the City/Urban areas the roof top rainwater harvesting for artificial recharge should be made mandatory. So that the available resources for drinking water supply should remain sustainable.
BIDAR DISTRICT
1.0 INTRODUCTION The Bidar district is the northern most part of the Karnataka state with geographical area of 5460 sq.km. It lies between 17°35’ and 18°29’ North latitude and 76°41’ to 77°39’ East longitude. It is bounded by Nizamabad and Medak districts of Andhra Pradesh state on the eastern side, Latur and Osmanabad districts of Maharastra state on the western side, Nanded district of Maharastra state on the northern side and Gulbarga district on southern side. 1.1 ACCESSIBILITY The Hydrabad-Parli Vaijanath, broad gauge railway section of the South Central Railway passes through Bidar and Bhalki taluks of thedistrict. The National Highway No-9

19
connecting Hydrabad with Puna and Bombay passes through Humanabad and Bidar taluks of the district. The district is served by a good network of roads, which connects Bidar district with other important towns of the district of state and neighbouring state. Metal roads have connected all the important villages and all the parts of area are easily approachable. 1.2 ADMINISTRATIVE DIVISIONS
The Bidar district is constituted by five talukas i.e. Aurad, Basavakalyan, Bhalki, Bidar and Humnabad with Bidar being the head quarters of the district. The Taluka wise statistics are given in Table– 1 and administrative map is presented in Fig-1.
Table-1: Talukwise Area, Village & Population
No. of villages Sl. No.
Taluk Area (sq. km) Inhabited Uninhabited
Population (as per 2001 census)
1 Aurad 1227.2 151 01 245739
2 Basavakalyan 1202.97 112 03 299910 3 Bhalki 1117.2 130 03 257042
4 Bidar 925.19 124 10 405540 5 Humnabad 987.56 82 05 294587
Total 5460.12 599 22 1502373 1.3 DRAINAGE:
Major parts of the district is covered by Godavari basin, drained by its two major tributaries the Manjara and the Karanja rivers. The Manjara river is perennial river flows over a distance of 155 km in the central part of the district and flows in eastern direction with a meandering course. The Karanja river flows in northwestern direction for 74km with Karanja reservoir being major water source. The river Mullamari takes its origin near Matala village of Basavakalyan taluk flows from west to east for a length of 38 sq.km and then flows into Gulbarga district and joins the river Kagna. The Kagna river is one of the main tributary of Bhima river. Besides, there are several streams, which are of ephemeral in nature. The drainage pattern in the district varies from sub-dendritic to dendritic and some streams have a sub parallel drainage to the main river. The drainage map of the district is presented in Fig-2.
1.4 IRRIGATION PRACTICES In the district the irrigation takes place from surface water and ground water. The surface water irrigation is through canals, tanks and from medium and minor irrigation projects. Major irrigation dam has been constructed across the Karanja river and medium irrigation dam constructed across Chukkenala and Mullamari rivers. From ground water the irrigation is through dug wells, dug cum bore wells and bore wells. Taluk wise irrigated area from different sources is shown in Table – 2. Table-2: Area Irrigated from different sources in each taluk of Bidar district.
Sl. No.
Taluk Canals Tanks Dug wells
Bore wells
Lift irrigation
Other source
Total
1 Aurad Nil 2.88 9.45 11.18 0.06 6.03 29.60
2 Basavakalyan 0.50 1.54 55.62 22.80 Nil 1.39 81.85
3 Bhalki 5.34 1.08 43.12 5.80 0.26 0.57 56.17 4 Bidar Nil 2.55 61.17 51.23 0.33 2.46 117.74
5 Humnabad 0.35 0.45 70.53 43.61 Nil Nil 114.94 Total 6.19 8.50 239.89 134.62 0.65 10.45 400.30

20
1.5 LAND USE The district has 5460.12 sqkm of geographical area out of which 277.07sqkm are
forest, which is 5.07% of the total area of district. Land not available for cultivation in the district is 688.40 sqkm and uncultivable land is 440.66 sq.km. Actual agriculture land is 3543 sqkm out of that 851.4 sqkm area is cultivated more than once. The Tahsil wise details of land use are given in Table-3.
Table: 3. Taluk wise land utilisation in Bidar district (in sq.km) Net area sown Taluk Area
(sq.km) Forest Land not
available for
cultivation
Un cultiva ble land
Fallow Land
Net Sown Sown > once Total
Aurad 1227.2 23.11 81.85 78.28 185.99 870.1 190.7 1060.8 Basavakalyan 1202.97 71.43 180.84 95.58 163.16 754.8 162.6 917.4
Bhalki 1117.2 25.84 82.39 139.38 38.28 832.5 301.4 1133.9 Bidar 925.19 46.5 114.79 34.00 251.73 521.5 89.8 611.3
Humnabad 987.56 110.14 228.53 93.42 106.38 564.1 107.0 671.1 Total 5460.12 277.07 688.40 440.66 745.54 3543.1 851.4 4394.5
1.6 CROPPING PATTERN
The main occupation of the people in the district is agriculture and related operations. There are two main seasons in which agricultural practices are carried out, which are Kharif and Rabi. Khariff season commences from June and the crops are harvested in September. Rabi season commences from September and crops harvested in Febuaray. The main food crops are Jowar, Paddy, Wheat, Bajra, Maize and Pulses. Groundnut, sugarcane and cotton are the cash crops. 1.7 STUDIES CARRIED OUT BY CGWB
The Central Ground Water Board has drilled 43 bore wells under ground water exploration programme. The statistics of these bore wells comprises number of bore wells, depth range and discharge range etc., The periodic monitoring of DTW of observation dug wells (45) and borewells (19) in the district are also carried out by CGWB during January, May, August and November of every year, which are discussed in Hydrogeology chapter. Officers from CGWB have carried out Hydrogeological Surveys in the district. 2.0 RAINFALLS AND CLIMATE The district experiences semi-arid climate with extreme summer. The dust storms
and severe heat waves are common in the district between April and May. The temperature begins to rise towards the end of February till May, which is the hottest month of the year. Coldest months are December and January. The temperature varies in the district between 20 ºC and 42 ºC
The year in the district may be divided into summer season from March to May, southwest monsoon season from June to September, post-monsoon season from October to November and winter season from December to February.
Generally, the monsoon sets in the month of June and reaches its climax in the month of September. The rainfall generally is spread over 39 to 53 days. Nearly 75% to 80% of the annual rainfall is during the period of Southwest monsoon. A few showers are also received during the North- East Monsoon, generally in the month of December.
Bidar district receives an average rainfall of 827 mm. The normal annual rainfall over the district ranges from 735 mm to 860 mm and taluk wise normal and actual rainfall of the district is presented in Table-4.

21
Table: 4 Taluk-wise normal rainfalls in Bidar district Sl. No
Taluk No.of Raingauge
stations
Normal rainfall (mm)
1901-70
Actual rainfall (mm) 2006
No. of Rainy days
2006 1 Aurad 6 735 882 39
2 Basavakalyan 6 830 451 49 3 Bhalki 9 859 808 48
4 Bidar 8 860 762 53 5 Humnabad 8 849 714 48
Total 37 Average 827 Average 724 Average 47
The Indian Meteorological Department (IMD) has divided rainfall into five categories
i.e. excess, normal, moderate, severe and acute to arrive at the agricultural drought conditions. The details are given in Table – 5. As per the table, when the rainfall is more than 25% of Normal Annual Rainfall then it is termed as excess, when the rainfall departs from normal Annual Rainfall between +25% and 25% then it is termed as normal. When the rainfall departs more than -25% from Normal Annual Rainfall, it causes drought. The drought is named as moderate, severe and acute according to the departure of rainfall from Normal Annual Rainfall, thus if the departure is between -25 and -50%, then it is termed as moderate; if it is between -50 and -75%, then it is termed as severe; and if more than -75%, then it is termed as acute.
Table 5- Agricultural Drought Based on Rainfall Departure from Normal
Sl. No Taluk Departure in % from Normal Annual Rainfall
Category
1 Aurad +20 Excess 2 Basavakalyan -46 Moderate Drought 3 Bhalki -6 Normal 4 Bidar -11 Normal
5 Humnabad -16 Normal
The percentage probability of occurrence of normal rainfall over the district has
shown in Table-6.
Table-6: Probability Analysis of Occurrence of Annual Rainfall Rain gauge Stations Probability
(%) Aurad Basavakayan Bhalki Bidar Humanabad
10 1200 910 1100 1000 1100
20 1170 900 1070 1000 1050 30 1110 880 1020 1080 1000 40 1050 850 980 1030 940 50 990 810 910 970 900 60 920 790 880 920 850

22
70 880 770 820 890 780 80 830 750 790 840 710 90 750 700 710 800 680
100 700 680 700 750 610
The dependable rainfall for the above stations can be used for construction of any recharge structure in the district.
3.0 GEOMORPHOLOGY AND SOIL TYPES
Physiographically, the district can be divided into two regions. They are northern low lands and southern high lands. The southern high lands are popularly known as Bidar plateau, which is made up of laterite. The ground altitudes are varying from 420 to 684 m above MSL. Bidar plateau has an elevation range from 640 to 684 m above MSL. The ground surface is flat, gently sloping forming broad valleys and flat topped hills. Flat topped hills with Step like sides exhibit the terraced landscape. Soils The two important types of soils noticed in the district are black soils and lateritic soils. 2. Black Soils
Major parts of the district are comprised of black soils and are derived from Deccan traps. These are deep black in colour and their texture varies from loam to clay. Lime concentration in this soil is high resulting in poor infiltration capacities. Their infiltration characteristics are poor to moderate. This type of soils cover mainly in areas lying below 610 m contour and along the valley portions. 2. Lateritic Soils
A Lateritic soil is confined to the central portion of the district. Lateritic soils are pale to bright red in colour and clay to clayey loam in nature. This soil has moderate to good infiltration characteristics. This type of soils cover mainly in areas lying above 610 m contour. 4.0 GROUND WATER SCENARIO 4.1 HYDROGEOLOGY The entire district is underlain by lava flows of the Deccan trap except small area covered with the laterites capping and shown in Fig-3. Deccan trap consists of successive lava flows, almost horizontal in disposition. Individual flows show considerable variation in physical character, thickness, nature and extent of weathering etc. The basaltic lava flows are generally dark, grey, hard and compact. Each lava flows normally consists two units lower massive basalt and upper vesicular basalt. Secondary minerals like zeolites, quartz, calcite or some earthy or ferruginous material fill the vesicles. Well-developed columnar joints and spherical weathering are characteristic features of the massive basalt. The massive basalt and vesicular basalt are similar in terms of composition and texture. Water bearing properties of formation
Deccan Trap basalts represent a thick pile of nearly horizontal layered formation. The porosity and permeability change within an individual flow and also from flow to flow and place to place. The weathered zones, joints and fractures in the massive and vesicular units of basalt form the water bearing horizons. Abundance of vesicles with interconnecting nature coupled with joints and horizontal partings in the vesicular basalt make it a good aquifer. The red bole bed, occurring as top undulating layer of flow, inhibit movement of

23
ground water as it is composed of mixture of fragmentary material and clay particles. It therefore acts like an aquiclude and its position in the lava sequence indicate presence of permeable water bearing zone underneath. Occurrence of Groundwater
Basalt: In general ground water occurs under water table conditions in shallow aquifer and semi-confined to confined conditions in deeper aquifer. The fractured jointed vesicular basalt and massive basalt when overlain by red bole bed of considerable thickness develops semi-confined to confined conditions. Hence the red bole bed acts as a confining layer. The red bole bed being of clayey in nature also acts as a barrier for downward movement. The weathered and jointed zone of massive basaltic unit and vesicular basaltic unit constitute the unconfined aquifer, which are being tapped by dug wells. The semi-confined to confined aquifers are being tapped by dug cum bore wells and bore wells. The presence of columnar joint in massive basalt also helps in the occurrence and movements of ground.
Laterite: Laterite occupied a small area in southern parts of the district. Laterite mainly occurring above 610m contours generally varies in thickness from 10 to 30 m. On high ground 1 to 2 m of laterite is very hard, ferruginous, iron black in colour, grading downwards into soft greyish or reddish coloured laterite, more clayey and aluminous in character at some places. The maximum thickness of 45 m is noticed near Bidar fort. The laterites are more or less a porous rock and acts as a recharge source to the underlying rocks. During monsoon the rock gets saturated quickly. However, de-saturation is also equally quick, once the monsoon is over. Depth to Water Level The Central Ground Water Board has established 45 hydrograph stations. These hydrograph stations are measured four times a year, each year i.e. in January, May, August and November. Depth to water level varies within the area depending on the hydrogeological setup, incidence of rainfall, topographic setting and stage of groundwater development. Pre-monsoon Depth to Water Level In order to study the summer ground water regime of the district, depth to water level map has been prepared based on pre-monsoon (May 2006) water level data and presented in Fig-4. The depth to water level in the district varies from 2.81 m to 17.90 m bgl. The perusal of Fig-4, reveals that the shallow water level less than 5 m bgl occurs in small isolated patches around Kamalnagar, Sangam and Alandi of Aurad taluk and Lakangaon, Sivani, Kakinal, Batsangi, Melkunda and Helsi of Bhalki taluk. The shallow water level in these areas is due to low topography and nearer to river course of Karanja and Manjra rivers. These are the areas where ground water development can be accelerated. Area with depth to water level in the range of 5-10 mbgl is found scattered over the four taluks except Bidar taluk. The depth to water level more than 10 metre and less than 20 m occur in whole Bidar taluk, 50% area of Bhalki & Humanabad taluks and 25% area of Aurad taluk. The deeper water level in pre monsoon is due to the excessive withdrawal of ground water.
Post-monsoon Depth to Water Level Depth to water level map has been prepared based on post-monsoon (November 2006) water level data and presented in Fig-5. The post-monsoon water level over the district varies from 0.40 to 13.09 m bgl. From the Fig-5, it is observed that depth to water level is

24
less than 2 m bgl occurs three isolated pockets around Sangam of Aurad taluk and Lakangaon, Sivani, Kakinal, Batsangi, Melkunda saigaon and Helsi of Bhalki taluk and also Hulsur & Mudebi of Basavakalyan taluk. Area having depth to water level in the range between 2 and 5 m bgl is found in northern part, central part and extreme southern part of the district. Area with depth to water level in the range of 5-10 mbgl is found scattered over the all taluks. Area with depth to water level in the range between 10 and 20 mbgl occurs as elongated patches in Bidar taluk from north to south and extending towards Bhalki taluk in western part and Humnabad taluk in southern part and also one isolated pocket around Basvakalyan, Partapur, Morkhandi and Matala of Basvakalyan taluk. Long Term Water Level Trend Ground water is a renewable resource it gets depleted when the aquifer is over drafted. The aquifer gets recharged during monsoon period. Rainfall is the main source of recharge to ground water. In order to study the long-term trends of ground water level in the district, water level data has been analyzed for 45 NHS observation wells for pre monsoon and post-monsoon established by Central Ground Water Board, for the periods from January1996 to November-2005. Talukawise long-term water level trend data of Bidar district is presented in Table-7.
Table–7. Talukawise Long Term Water Level Trend of Bidar district
Ranges of long-term water level trend m/year
Pre monsoon Post monsoon
Sl. No
Taluk
Fall Rise Fall Rise
1 Aurad 0.027 to 0.500 0.014 to 0.124 0.020 to 0.298 0.0 to 0.438
2 Basavakalyan 0.0 to 0.126 0.065 to 0.476 0.022 to 0.494 -
3 Bhalki 0.066 to 0.102 0.028 to 0.327 0.046 to 0.186 0.022 to 2.50
4 Bidar 0.092 to 0.686 0.215 to 0.851 0.009 to 0.792 0.0 to 0.937
5 Humnabad 0.120 to 0.390 0.048 to 0.383 0.089 to 0.865 -
Pre-Monsoon Water Level Trend The pre monsoon water level trend shows the effect of ground water development. Significant decline more than 20 cm/yr is observed in Aurad and Kamalnagar of Aurad taluk, Kamthana of Bidar taluk and K.Hallikheda of Humnabad taluk. Significant rising tend >20 cm/yr is observed in Matala of Basvakalyan taluk, Halbarga of Bhalki taluk, Bidar of Bidar taluk and Changler and Halikheda of Humnabad taluk. Post-Monsoon Water Level Trend The post monsoon water level trend indicates whether the ground water body has been fully recharged or not. If water level trend is declining, it suggests that the aquifer is getting desaturated year after year. The water level decline in post monsoon may be due to poor rainfall or large development of ground water in that area. Significant water level decline >20 cm/yr is observed in Donegaon, Kamalnagar and Kusnur of Aurad taluk, Rajeswara of Basavakayan taluk, Andur, Bagdel and Kamthana of Bidar taluk and Changler, Chitguppa, Dublagundi, Ghatboral, Hallikheda, Humnabad, K.Hallikheda, Maniknagar, Meenkere and Nirna of Humanabad taluk. Significant rising tend >20 cm/yr is observed in Aurad of Aurad taluk, Alandi of Bhalki taluk and Bidar of Bidar taluk.

25
Yield In the district of Bidar, there are three types of ground water extraction structure i.e. the dug wells, bore well and dug cum bore well. The yield depends upon the geological formation, their location with respect to physiography, diameter and depth of the well etc., Yield of Dug wells Majority of the dug wells are used for domestic purposes. The rope and pulley is used to withdraw the water. The dug wells and dug cum bore wells tapping phreatic aquifers of basalt and laterites. In basaltic area, the yield of wells depends upon the saturated thickness and jointed, fractured thickness of vesicular/massive basalt. The dug wells located in topographic lows yield relatively better. Yield ranges of dug wells and dug cum bore wells are from 20 to 200 m3 / day with sustain pumping for one to four hours in a day during summer and 5 to 10 hours during winter. Yield of Bore wells To provide drinking water facilities to villages, the state government has drilled number of bore wells. The yield of these bore wells ranges from less than 1 lps to as high as 12.64 lps. Most of the high yielding bore wells are generally in the close vicinity of lineament. Most of the high yielding bore wells are fitted with power pumps while the other high as well as poor yielding bore wells are fitted with hand pumps. Ground Water Exploration 43 exploratory wells have been drilled in the district under Ground water exploration programme between the period of September1990 and March1994 to ascertain the presence of productive aquifer zones, quality of ground water, yield of aquifer zones and to determine aquifer parameters. Maximum depth drilled in the district is 202m and the entire depth has been recorded with basalt of different flows. Yield of the formation between 0 and 100m is in range of negligible to 6 lps. However, the exploratory wells drilled at Morabi up to a depth of 58.45 m yielded 20 lps and at Dubalgundi drilled up to a depth of 88.65 m yielded 16.5 lps and Hallikheda drilled up to a depth of 58.15 m yielded 14.6 lps. Maximum depth of drilling up to 200 m has been done in Bidar and Aurad taluks. The yield ranged from 0.07 to 6.28 lps. Drilling beyond 100m and up to a depth of 200 m has not given encouraging results. The pumping test of these wells has given Transmissivity values ranging from 3.23 m2/day to 40.31 m2/day. During present exploratory drilling programme one exploratory well and one observation well have been drilled to a depth of 204mbgl and 235 m bgl respectively. Discharge of exploratory well was recorded 5.41lps and observation well was 3.26 lps.

26
Table 8:TALUKWISE GROUND WATER RESOURCES OF BIDAR DISTRICT AS ON 31ST MARCH 2004
CATEGORISATION OF TALUKS AS ON MARCH
2004
TO
TA
L A
NN
UA
L G
RO
UN
D
WA
TE
R R
EC
HA
RG
E
NE
T A
NN
UA
L G
RO
UN
D
WA
TE
R A
VA
ILA
BIL
ITY
EX
IST
ING
GR
OS
S G
RO
UN
D
WA
TE
R D
RA
FT
FO
R
IRR
IGA
TIO
N
EX
IST
ING
GR
OS
S G
RO
UN
D
WA
TE
R D
RA
FT
FO
R
DO
ME
ST
IC A
ND
IN
DU
ST
RIA
L
WA
TE
R S
UP
PLY
EX
IST
ING
GR
OS
S G
RO
UN
D
WA
TE
R D
RA
FT
FO
R A
LL
US
ES
ALLO
CA
TIO
N F
OR
D
OM
ES
TIC
AN
D I
ND
US
TR
IAL
US
E F
OR
NE
XT
25 Y
EA
RS
NE
T G
RO
UN
D W
AT
ER
A
VA
ILA
BIL
ITY
FO
R F
UT
UR
E
IRR
IGA
TIO
N D
EV
ELO
PM
EN
T
AV
ER
AG
E C
RO
P W
AT
ER
R
EQ
UIR
EM
EN
T
BA
LA
NC
E G
RO
UN
D W
AT
ER
IR
RIG
AT
ION
PO
TE
NT
IAL
AV
AIL
AB
LE
SA
FE
AR
EA
(
%)
SE
MI-
CR
ITIC
AL
AR
EA
(%
)
CR
ITIC
AL A
RE
A (
%)
OE
AR
EA
(%
)
Ta
luk
HAM HAM HAM HAM HAM HAM HAM (m) HAM
Aurad 7748.45 7361.03 1319.90 506.30 1826.20 78.14 5302.99 0.84 6345.25 100 - - -
Basvakalyan 8496.96 8079.08 3266.91 589.65 3856.56 819.61 4073.13 0.90 4521.13 91 - - 09
Bhalki 9162.91 8704.76 3877.09 555.85 4432.94 772.63 4110.61 0.87 4711.30 88 - 05 07
Bidar 7161.56 6803.43 5993.52 1117.08 7110.60 1975.16 1963.72 0.87 2250.69 79 - - 21
Humnabad 10149.28 9646.00 5310.39 471.44 5781.82 655.30 3680.31 0.87 4239.15 100 - -
-
Total 42719.16 40594.3 19767.81 3240.32 23008.12 4300.84 19130.8 0.87 22067.5

27
4.2 GROUND WATER RESOURCES The resource estimation and categorization is carried out as per the
recommendations of ‘Ground Water Resources Estimation Methodology - 97 (GEM -97) considering water shed as a unit. Water shed and hydrological boundaries do not match with the administrative boundaries. As a result different parts of taluk fall in different watersheds having different stages of ground water development and categorization. Pro-rata approach to consolidate the watershed data into Talukwise data gives only details on ground water resource, draft, and additional irrigation potential. Pro rata approach cannot be applied for taluk, as a unit, as far as stage of development and categorization is concerned. However average stage of development is given to have over all idea about the taluk.
The percentage of safe, critical and over exploited area in each taluk is given inTable-8. It is observed from the Table-8 that Aurad and Humanabad taluks are completely under safe category. 88% of Bhalki and 91% of Basavakalyan taluks are safe and 79% of Bidar taluk is safe while rest of 21% comes under over exploited area. No area comes under the category of semi-critical. The overall stage of ground water development in the district has reached 56.68%. Thus regionally the situation appears to be quite good, however few areas of the district have attained over exploited stage. In such areas site specific recharge structures coupled with water conservation measures are the need of the hour.
1. Annual Ground Water Recharge = 42,719.16 ham 2. Net Ground water availability = 40,594.30 ham 3. Gross Draft for Irrigation = 19,767.81 ham 4. Gross Domestic and Industrial draft = 3,240.32 ham 5. Total Draft = 23,008.12 ham 6. Allocation for Domestic and Industrial requirement for next 25 years = 4,300.84 ham 7. Net ground water availability for irrigation = 19,130.80 ham
Status of ground water utilisation map of Bidar district has been prepared based on ground water resource estimation and is shown in Fig-6. It is observed from Fig-6 that entire district comes under safe category except few areas of Bidar taluk, Bhalki taluk and Basvakalyan taluk. 4.3 GROUND WATER QUALITY
Water quality observations are essential to know the changes in quality of ground water, which plays a prominent role in promoting both the standards of agricultural production and human health. To evaluate the quality of ground water, ground water samples have been collected from observation wells of National Hydrograph Stations and Exploratory bore wells. The ground water quality of the district has been analysed from the point of view of drinking and irrigation purposes.
Ground Water Suitability for drinking purposes Based on analytical data of 56 samples of hydrograph stations and Exploratory bore wells, an effort was made to classify ground water for drinking purpose as IS standards given below in Table-9.

28
Table –9 Drinking water standards and concentration ranges (IS: 1991)
Parameters
Desirable Limit ppm
Permissible Limit ppm
Undesirable effect outside limit
Concentration ranges in the
district ppm
Total dissolved solids
500
2000
Palatability decrease and may cause gastro intestinal problems
105-690
Nitrate
45
No Relaxation
May cause Methamoglobineimia 02-120
PH 6.5-8.5 No Relaxation
The water will affect the mucous membrane and water supply
system.
7.0-8.5
Fluoride 1.0 1.5 Excessive fluoride causes mottling of tooth enamel and skeletal
deformation
0.02-1.6
Calcium
75
200
Encrustation in water supply structure and adverse effects on
domestic use.
03-110
Magnesium 30 100 -do- 04-54
Chloride 250
1000
Taste, Corrosion palatability are affected
14-187
Sulphate 200 400 May cause gastro intestinal problems
01-101
Hardness
300
600
Encrustation in water supply structure and adverse effects on
domestic use.
68-492
The analyses of ground water samples of the district revealed that the ground
water quality found to be potable in general when compared with standards prescribed by BIS (IS-10500-1991) and it is also suitable for irrigation purposes in the major parts of the district. Distribution of fluoride concentration map has been presented Fig- 7. The perusal of map-7 reveals that the entire district is having fluoride concentration in the range of less than 1.5 ppm except area around Bidar. Ground Water Suitability for irrigation purposes
Apart from domestic consumption, irrigation is consuming a major share of ground water for agricultural activities. The quality of water used for irrigation is an important factor in productivity and quality of irrigated crops.
Electrical conductivity
The ability of water to conduct an electrical current is called its electrical conductance or conductivity. Electrical conductivity is very useful for determining water quality, because it is an indicator of salinity in water, which affects the taste and has an impact on the user acceptance of water as potable. The ground water is classified based on EC values, for irrigation purpose and is given in Table-10.

29
Table-10: Suitability of ground water based on Electrical conductivity for irrigation purpose
Sl.No. Conductivity
(µMhos/cm)
Suitability for irrigation % of samples
01 Below 250 Entirely safe 10
02
250 - 750
(Moderately Saline)
Safe under practically all conditions
57
03 750-2250
(Medium to high salinity)
Safe only with permeable soil and moderate leaching
33
04 Above 2250 Unfair for irrigation Nil
According to the above classification, 67% of ground water samples have EC
value less than 750 µmhos/cm and falls in safe category. 33% of ground water
samples have EC value between 750 and 2250 µmhos/cm and falls in medium salinity to high salinity category. Isocone map has been prepared based on EC value of ground water samples and shown in Fig-7. Isocone map depicts that area around Mudbi of Basvakalyan taluk, Changler of Humanabad taluk and Bhalki having EC
value more than 1000 µmhos/cm and falls under medium to high salinity. Chloride:
The suitability of ground water based on chloride concentration has been classified and presented in Table-11.
Table-11 Classification of Based on Chloride (Scofield 1933) Sl.
No.
Class Chloride Concentration
(ppm)
% of Samples
1 Class I <150 92
2 Class II 150-500 08
3 Class III >500 Nil
According to above classification, 92% of ground water samples falls in category I. Thus it is indicating that the ground water of the district is suitable for irrigation activities under ordinary condition of soil and climate. None of the samples indicated its unsuitability for irrigation purposes.
4.5 STATUS OF GROUND WATER DEVELOPMENT
At present ground water is being utilised in the district through dug wells and bore wells for irrigation and domestic proposes. Dug wells are usually circular, square or rectangular in shape and the depth varies from 7 to 20 m in lateritic area and 6 to 12 m in basaltic area. Depth of well depends upon the topography of the terrain as well as the depth of water level and seasonal fluctuation. The talukwise ground water structures have been presented in Table-12.

30
Table: 12 Taluk wise ground water structures in Bidar district
Domestic water supply Sl. No
Taluk Irrigation structures Bore wells
Piped WS Schemes
MW schemes
1 Aurad 4742 1453 89 142 2 Basavakalyan 11249 1522 78 162
3 Bhalki 5796 1373 80 139 4 Bidar 12419 1447 79 137
5 Humnabad 12860 1274 76 72
Total 47066 7069 402 652
In 60% of the district area the yields of shallow zones upto the depth of 20m was less than 1 lps. In rest of the 40% area of the district, the yields recorded were between 1 to 2 lps, especially in Aurad, Humnabad and Bidar taluk. Within the weathered and fractured basalt, phreatic aquifers are encountered at a shallow depth range of 0 to 20 mbgl and are tapped mainly by dug wells. Average thickness of these aquifers ranges from 5 to 15m. At deeper depth range (40-200m) bore wells are the most common abstraction structures with an yield ranging from 1 to 12 lps. 5.0 GROUND WATER MANAGEMENT STRATEGY 5.1 GROUND WATER DEVELOPMENT
The ground water is regarded as a renewable natural resource. Therefore, only certain quantity of water may be withdrawn annually so that no detrimental effects such as water level deflection may take place. In the area, ground water is developed through dug wells, dug cum bore wells and bore wells. The dug wells tap the shallow aquifer whereas dug-cum bore wells and bore wells tap both shallow and deep aquifers. It is observed from the Table-8, that all talukas falling under the Safe category and there is a wide scope for ground water development. There are few areas in Bhalki, Basavakalyan and Bidar talukas of the district, the ground water development has reached over exploited stage. This is clearly indicates that ground water has been over exploited and causing rapid depletion of water levels. In these areas, ground water augmentation technique should be taken up to arrest the declining trend of water level. There should not be any additional development of ground water. In these areas priority should be given for ground water augmentation by constructing suitable structures such as nala bunds, cheek dams, percolation tanks etc. 5.2 WATER CONSERVATION & ARTIFICIAL RECHARGE
Artificial recharge of aquifers is a solution to the declining trends of ground water levels in some parts of the district due to over- exploitation of the ground water resources and poor saturation of the aquifers due to decreased rainfall. There is rise in the utilization of ground water for irrigation and domestic purposes through dug wells and bore wells. To increase the recharge to ground water the following strategy may be adopted to enhance / save the ground water resources for future development.
f) Artificial recharge practices should be adopted by rainwater harvesting system. There are two basic types of water harvesting system. One is

31
direct application where run off water is collected and stored in the soil profile during the precipitation. The second one is supplemented water system where the collected water is stored in some reservoir or storage container and applied later to the crop with some form of irrigation system.
g) Minor irrigation tanks, check dams and ponds, which are state owned and have been used as a source of irrigation in the past. Many of these structures are in disuse on account of poor maintenance or no maintenance. The farmers in the vicinity of such tanks, check dams and ponds can be organized on a group basis with right to create charge and maintain the structure through appropriate legislation.
h) Formation of cooperative societies should be encouraged for the construction of structures, operation and maintenance both for existing and new one and for the distribution of water among the owners of small land holding.
The design of water harvesting system is basically same for all locations. At
the same time there is no standard design for a water harvesting system. Each site and water use is unique and each system must be fitted with local condition and needs. There are many elements, which are to be considered such as precipitation pattern, water requirement pattern soil, land topography, equipment, labour and acceptability of water harvesting concepts by the water user.
i) The farmer should be encouraged to make arrangement on their fields for the preservation of rainwater running out of their filed by digging numerous narrow channels of about 15 m length, 15 cm width and 15 cm depth.
j) Construction of small ponds in the field of farmers has to be encouraged at individual small farm level.
Many village ponds are silted and are in poor state after the implementation of modern pipeline water supply system in the villages. Desilting and maintaining of these ponds to be taken up. It will help in raising the water table of the area. 6.0 GROUND WATER RELATED ISSUES & PROBLEMS
The availability and sustainability of ground water in the Bidar district is controlled by physiography, geology and rainfall pattern. There are prominent hill ranges, many isolated hillocks etc. The entire district is occupied by hard rock formation of basaltic lava flow, which is generally very poor in ground water storage and transmissivity. Therefore, this formation gets maximum saturation during monsoon and if it is fully saturated resulting in a situation of rejected recharge. These aquifers then are drained naturally due to sloping and undulating topography. Similarly, wherever more groundwater development takes place, these aquifers become nearly dry or semi-dry reaching to water scarcity for drinking purpose during summer months. In many areas where adequate recharge to ground water does not occurs due to one or the other reasons, the presence of massive basalt at the ground surface also hinders in the process of recharge to the underlying porous strata. The rainfall of the district varies from 451 mm to 882 mm with average rainy days of 47 and during last five years was from 550 mm to 882 mm. This indicates that the district is not free from drought conditions. Late onset of the monsoon or early withdrawal of monsoon affects the rainfall recharge and ground water availability in the district. The years of low rainfall also adversely affect the ground water resources as. 1) Lesser amount of recharge to ground water reservoir.

32
2) More withdrawal of water from the reservoir. This ultimately results into drying up and lowering of water levels in dug wells and bore wells in the district during the summer.
7.0 RECOMMENDATIONS
The following recommendations are made for planned and scientific development of ground water resource based on hydrogeological studies.
The study of average rainfall data reveals that district is not free from drought conditions. Hence, it is suggested that the artificial recharge structures like percolation tank, nala bund etc may be constructed to augment the ground water resource.
Most of the dugwells in the district go dry in the month of February and March. Hence, it is suggested that to construct the recharge structures for facilitate the groundwater recharge.
The depth of the dug wells which can be developed in the district range between 8 to 15 m bgl depending upon topographic setup and thickness of the weathered zone. The depth of the well may be decided more precisely by referring to the depth to water level (Fig-4).
To augment the groundwater resource, percolation tanks and other artificial recharge structures may be constructed where the depth to water level is more than 15m bgl (Fig-4).
Kamalnagar, Kamthana and K.Hallikheda hydrograph stations are showing significant declining (>20 cm) trend of groundwater levels for pre and post monsoon seasons. Hence, it is necessary that this trend to be reversed by introducing controlling measures by construction of artificial recharge structures and other water conservation structures to enhance the recharge to ground water. Red bole horizons in the basaltic areas invariably indicate that below them lay the weathered vesicular basalts and below the vesicular basalts lay the highly weathered and fractured massive basalts. Therefore, if a well ends in red bole, it should be deepened further to tap the entire thickness of the weathered/fractured zones until it encounters hard massive basalt below. Many dug wells in the district are being used as waste dumping sites thus enhancing the nitrate concentrations and other harmful chemical substances. Care must be taken that these wells are cleaned annually and used for other household purposes.
In the City/Urban areas the roof top rainwater harvesting for artificial recharge should be made mandatory. So that the available resources for drinking water supply should remain sustainable.

33

34

35
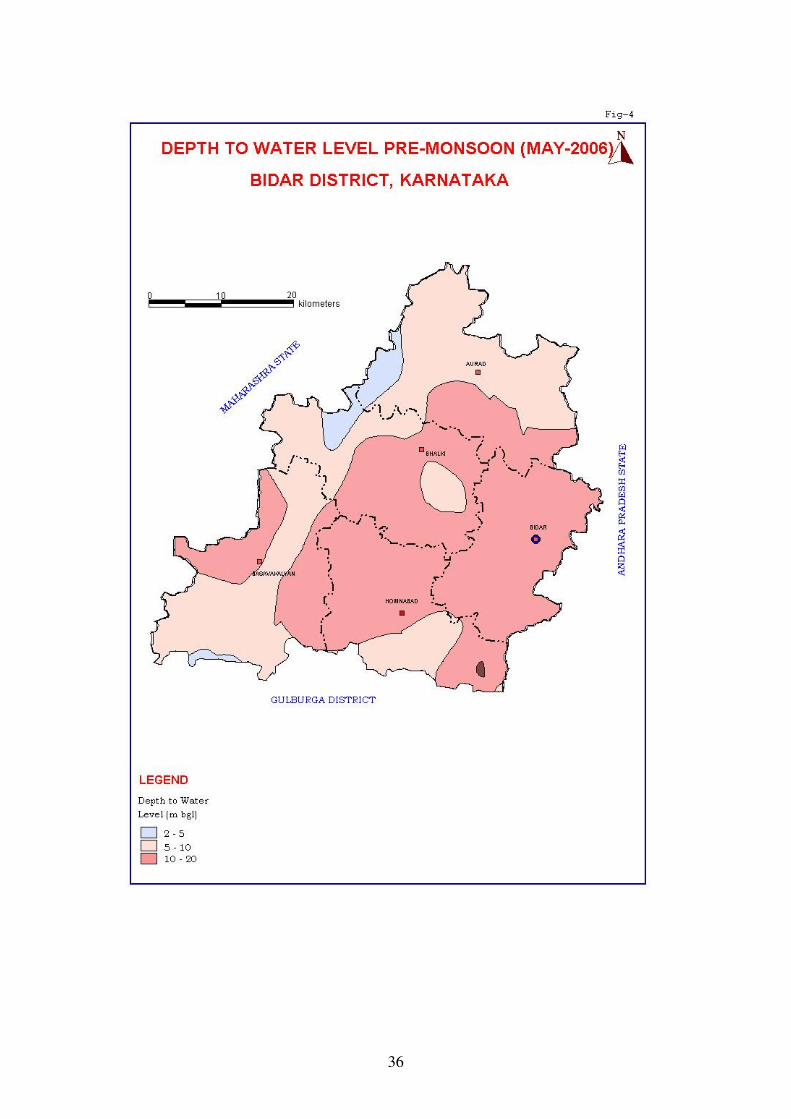
36

37

38

39