ground-water resources of towner county, north … · ground-water resources of towner county,...
TRANSCRIPT
r
GROUND-WATER RESOURCE S
O F
TOWNER COUNTY, NORTH DAKOT A
By
P. G . Randich and R. L. Kuznia r
U .S. Geological Surve y
COUNTY GROUND-WATER STUDIES 36 — PART II INorth Dakota State Water CommissionVernon Fahy . State Engineer
BULLETIN 79 — PART II INorth Dakota Geological Surve yDon L . Halvorson . State Geologis t
Prepared by the U .S . Geological Survey in cooperatio nwith the North Dakota State Water Commission ,
North Dakota Geological Survey ,and the Towner County Board of Commissioners
1984

GROUND-WATER RESOURCE S
OF
TOWNER COUNTY, NORTH DAKOT A
By
P. G. Randich and R . L. Kuzniar
U .S. Geological Surve y
COUNTY GROUND-WATER STUDIES 36 — PART II INorth Dakota State Water CommissionVernon Fahy, State Engineer
BULLETIN 79 — PART Il lNorth Dakota Geological SurveyDon L . Halvorson, State Geologist
Prepared by the U .S . Geological Survey in cooperationwith the North Dakota State Water Commission ,
the North Dakota Geological Survey,and the Towner County Board of Commissioner s
1984
Bismarck, North Ddikota

CONTENTS
PageABST:RACT 1INTRODUCTION 1
Objectives and scope 3Previous investigations 3Acknowledgments 3Location-numbering system 4Geography 4Geohydrologic setting 4
AVAILABILITY AND QUALITY OF GROUND WATER 6General concepts 6Water in bedrock 10
Pierre aquifer 10Water in the glacial drift 1 1
Water available from storage 1 1Potential yield of glacial-drift aquifers 1 1Spiritwood aquifer system 13Rolla aquifer system 1 4Undifferentiated aquifers in buried
glaciofluvial deposits 16Undifferentiated aquifers in outwash deposits 18
GROUND-WATER USE 18Rural domestic and livestock supplies 18Public supplies 19
SUMMARY 20SELECTED REFERENCES 2 1DEFINITIONS OF SELECTED TERMS 24
iii

ILLUSTRATION S
Plate1. Map showing bedrock topography of Towne r
County, North Dakota (in pocket )2. Map showing availability of water fro m
glacial-drift aquifers in Towner County ,North Dakota (in pocket )
3. Hydrogeologic sections of the Spiritwoodaquifer system in Towner County ,North Dakota (in pocket )
4. Map "showing potentiometric surface of th eSpiritwood aquifer system, Towner County ,North Dakota (in pocket)
Figure1. Map showing physiographic divisions in Nort h
Dakota and location of study area 22. Diagram showing location-numbering system 53. Map showing depth to the top of the Dakot a
Sandstone 74. Diagram showing classification of water
from the Spiritwood aquifer system forirrigation use 1 5
5. Diagram showing classification of waterfrom the undifferentiated aquifers fo rirrigation use 1 7
iv

TABLES
PageTable
1. Major chemical constituents in water — thei rsources, effects upon usability, andrecommended and mandatory concentration limits 9
2. Hydraulic conductivity of common glacial-drif taquifer materials 1 2
3. Summary of data for glacial-drift aquifers 2 1
SELECTED FACTORS FOR CONVERTING INCH-POUND UNITS T OTHE INTERNATIONAL SYSTEM OF UNITS (SI )
A dual system of measurements — inch-pound units and the InternationalSystem of Units (SI) — is used in this report . The SI is an organized syste mof units adopted by the 11th General Conference of Weights and Measuresin 1960. Selected factors for converting inch-pound units to SI units are give nbelow .
Multiply inch-pound unit ByAcre 0.4047Acre-foot (acre-ft) 0 .001233Foot (ft) 0 .3048Foot squared per day
(ft 2/d)0 .0929
Foot per mile (ft/mi) 0.1894
Gallon per day (gal/d) 0.00378 5
Gallon per minute (gal/min) 0.06309Inch (in .) 25 . 4Micromho per centimete r
at 25° Celsius (umho/cmat 25°C)
1
Mile (mi) 1 .609Square mile (mil) 2 .590
To obtain SI unithectare (ha)cubic hectometer (hm 3)meter (m )meter squared per day
(m 2/d)meter per kilometer
(m/km)cubic meter per da y
(m3/d )liter per second (L/s )millimeter (mm )microsiemen per
centimeter at 25 °C(uS/cm at 25°C )kilometer (km )square kilometer (km 2 )
To convert degrees Fahrenheit (°F) to degrees Celsius (°C) use the followin gformula: °C = (°F-32)x 5/9 .
v

GROUND-WATER RESOURCES OFTOWNER COUNTY, NORTH DAKOT A
By
P. G . Randich and R. L . Kuznia r
ABSTRACT
An investigation of the ground-water resources of Towner County, Nort hDakota, indicates that large quantities of water can be obtained from glacial -drift aquifers . The underlying Pierre aquifer is more extensive than aquifer sin the glacial drift, but yields are only about 10 gallons per minute and thewater contains more sodium and dissolved solids .
Glacial-drift aquifers occur as sand and gravel deposits associated withburied valleys and glaciofluvial deposits in Towner County . The saturatedthickness of these deposits ranges from 4 to 287 feet (1 to 87 meters) . Glacial-drift aquifers underlie about 550 square miles (1,420 square kilometers) i nTowner County and contain approximately 2 .8 million acre-feet (3,450 cubichectometers) of water that is available from storage . The most extensive glacial-drift aquifer is the Spiritwood aquifer system, which has an areal extent o fabout 370 square miles (960 square kilometers) . Potential well yields rangefrom 5 to 1,500 gallons per minute (0.3 to 95 liters per second) from the majo rglacial-drift aquifers ; however, the Spiritwood is the only major glacial-driftaquifer that has potential well yields of more than 500 gallons per minute (3 2liters per second) . Water from the glacial-drift aquifers generally is very hard .Dissolved-solids concentrations in samples collected from these aquifers range dfrom 396 to 4,450 milligrams per liter .
The Pierre aquifer consists of a fractured siliceous shale that ranges from25 to 400 feet (7.6 to 122 meters) in thickness in the upper part of the formation .Most wells developed in this aquifer yield less than 10 gallons per minute (0 . 6liters per second) . Dissolved-solids concentrations in water samples collecte dfrom the Pierre aquifer ranged from 976 to 6,590 milligrams per liter .
The rural population and most communities in Towner County depen don ground water, largely from the drift aquifers, as a source of supply .
INTRODUCTIO N
The investigation of the ground-water resources of Towner County (fig .1) was made cooperatively by the U .S. Geological Survey, North Dakota StateWater Commission, North Dakota Geological Survey, and the Towner CountyBoard of Commissioners . The results of the investigation are published in threeparts . Part I is an interpretive report describing the geology of the study area .Part II (Kuzniar and Randich, 1983) is a compilation of the geologic an d
1

OC MIt ES
150 MILOM ElENS
98
LAK E
EM BINA _\ PIERCE
~ -
IRAMSEY
rWALS H
1
rB EN SON~ u ~r -J
1CENTRAL y~
L
FNELSON T AND FORK S
! DRIFII PRAIRIE
J
I
SNEYENNE
C, /MC HENRYL T_
_BIL L_
I
I
i
is'
KN/FF
VE
_
SSOUR/
c PI
OLIVE R
' R
DUNN 'STARK --' r'E - - RTh N -
I
) .(.
ORTO N
'y6jNT
'
6~AN1RIVfR -
N-
\LSH ERIDAN 1NELL S
. BURLEIGHJKIDDER
r
1 I'rte
`
STUTSMAN- -EMMO4S
47
is
LOGA~N SOG'_L A MOURE_MC INTOSH
I DICKEY
STEELE\ rRAILL1AND) +I)̀
-Cns9\PLAI N
I
(RED RIV E
TRAARG
ALLEY )~SNSO
E M NT
1V
yRICHLA1V.~_
98° MODIFIED FROM FENNEMAN 11946 10
Z5
0 0
10 0
FIGURE 1 .-Physiographic divisions in North Dakota and location of study area .

hydrologic data collected during the investigation, and is a reference for th eother two parts . Part III is an interpretive report describing the ground-wate rresources . The reports are prepared and written to assist State and county watermanagers, consultants to water users, and water users in the development o fground-water supplies .
Objectives and Scope
The purpose of the investigation was to provide detailed geologic andhydrologic information needed for the orderly development of water suppliesfor municipal, domestic, livestock, irrigation, industrial, and similar uses .
The objectives of the investigation were to : (1) Determine the location ,extent, and nature of the major aquifers ; (2) evaluate the occurrence andmovement of ground water, including sources of recharge and discharge ; (3)estimate the quantities of water stored in the glacial aquifers ; (4) estimate th epotential yields to wells tapping the major aquifers ; (5) determine the chemica lquality of the ground water; and (6) identify current and potential use of theground water .
Interpretations contained in this report are based on data obtained fromexisting wells and from test holes drilled during the investigation . These dat ainclude lithologic and geophysical logs of 312 test holes and wells ; water-levelmeasurements in 46 observation wells ; and 178 chemical analyses of ground-water samples .
Water-level measurements will be continued in selected observation well sas part of a statewide program to monitor ground-water resources . The purposeof the statewide program is to provide data to governmental agencie sresponsible for managing the water resources of the State .
Previous Investigation s
The earliest geologic report that included Towner County was written b yUpham (1895, p . 169-193), who briefly described the glacial moraines an ddrainage to Devils Lake . Simpson (1929, p . 236-240), included a briefdescription of the geology and ground-water resources of North Dakota . Alocal groundwater study was made by Kahil (1965) in the vicinity of Roc kLake . Bluemle (1977) described the glacial geology of Towner County .
Acknowledgment s
Collection of the data on which this report is based was made possible b ythe cooperation of residents and officials of Towner County . Recognition isgiven to M. O. Lindvig and A . E. Comeskey for contracting and providingmost lithologic and geophysical logs . Particular recognition is due C . A.Simpson and Son drilling contractors who furnished many lithologic logs an drecords of wells .
3
Location-Numbering Syste m
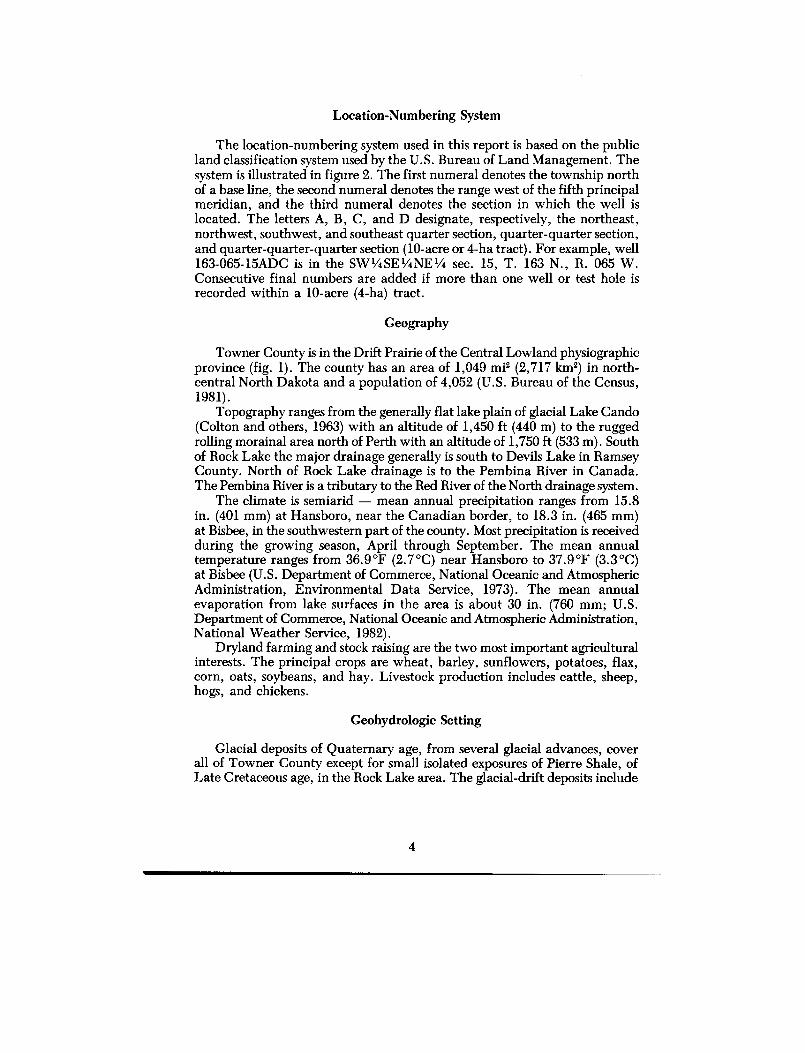
The location-numbering system used in this report is based on the publi cland classification system used by the U .S. Bureau of Land Management . Thesystem is illustrated in figure 2 . The first numeral denotes the township northof a base line, the second numeral denotes the range west of the fifth principa lmeridian, and the third numeral denotes the section in which the well i slocated . The letters A, B, C, and D designate, respectively, the northeast ,northwest, southwest, and southeast quarter section, quarter-quarter section ,and quarter-quarter-quarter section (10-acre or 4-ha tract) . For example, well163-065-15ADC is in the SW'/4SE'/4NE'/4 sec . 15, T. 163 N., R. 065 W .Consecutive final numbers are added if more than one well or test hole i srecorded within a 10-acre (4-ha) tract .
Geography
Towner County is in the Drift Prairie of the Central Lowland physiographicprovince (fig . 1) . The county has an area of 1,049 mil (2,717 km 2) in north-central North Dakota and a population of 4,052 (U .S. Bureau of the Census ,1981) .
Topography ranges from the generally flat lake plain of glacial Lake Cando(Colton and others, 1963) with an altitude of 1,450 ft (440 m) to the rugge drolling morainal area north of Perth with an altitude of 1,750 ft (533 m). Southof Rock Lake the major drainage generally is south to Devils Lake in RamseyCounty . North of Rock Lake drainage is to the Pembina River in Canada .The Pembina River is a tributary to the Red River of the North drainage system .
The climate is semiarid — mean annual precipitation ranges from 15 . 8in . (401 mm) at Hansboro, near the Canadian border, to 18 .3 in . (465 mm )at Bisbee, in the southwestern part of the county . Most precipitation is receive dduring the growing season, April through September . The mean annualtemperature ranges from 36.9°F (2 .7°C) near Hansboro to 37 .9°F (3 .3°C )at Bisbee (U .S. Department of Commerce, National Oceanic and AtmosphericAdministration, Environmental Data Service, 1973) . The mean annualevaporation from lake surfaces in the area is about 30 in . (760 mm; U.S .Department of Commerce, National Oceanic and Atmospheric Administration ,National Weather Service, 1982) .
Dryland farming and stock raising are the two most important agriculturalinterests . The principal crops are wheat, barley, sunflowers, potatoes, flax ,corn, oats, soybeans, and hay . Livestock production includes cattle, sheep ,hogs, and chickens .
Geohydrologic Setting
Glacial deposits of Quaternary age, from several glacial advances, cove rall of Towner County except for small isolated exposures of Pierre Shale, o fLate Cretaceous age, in the Rock Lake area . The glacial-drift deposits include
4

FIGURE 2.-Location-numbering system .
5

relatively impermeable glacial till and lacustrine clay, and water-yieldingglaciofluvial materials such as sand and gravel . The thickest drift deposits (500ft or 152 m) are in the buried bedrock valleys ; consequently, the bedrock valley scontain the major glacial-drift aquifers in Towner County .
The Pierre Shale underlies the glacial drift throughout Towner County.Ground water is obtained from fractures in the upper part of the Pierre Shal eand, for practical purposes, the lower, unfractured part of the formation formsthe base of the fresh-water-bearing units in the study area . The Pierre Shal eand the glacial drift were studied in detail with special reference to their water -bearing properties .
The generalized topography of the Pierre Shale in Towner County is show non plate 1 (in pocket) . Test-hole and surficial geologic data were used in con-struction of the map . Glacial advances altered the bedrock topography befor esubsequent deposition of the glacial deposits occurred . The most prominentfeatures are northwest-trending buried valleys incised into the bedrock tha tonce contained streams along the margins of the glaciers .
The Dakota Sandstone of Early Cretaceous age underlies the entire area .Depth to the Dakota Sandstone is shown in figure 3 . The Dakota contains wate rthat generally is saline and undesirable for domestic or irrigation use. Althoughthe Dakota is not used in Towner County, it is used for livestock watering ,domestic, and public supplies in some adjoining counties where no other wate ris available . If water from the Dakota were to be used for the aforesaid sup -plies in Towner County an economical desalinization process would berequired .
AVAILABILITY AND QUALITY OF GROUND WATE R
General Concepts
All ground water is derived from precipitation . After the precipitation fallson the Earth 's surface, part is returned to the atmosphere by evaporation, partruns off into streams, and the remainder infiltrates into the ground . Some ofthe water that enters the ground is held by capillarity and may evaporate o rbe transpired. The water in excess of the moisture-holding capacity of the soilinfiltrates downward to the water table and ultimately becomes available t owells .
Ground water moves under the effects of gravity and pressure from areasof recharge to areas of discharge . Ground-water movement generally is slowand may be only a few feet per year . The rate of ground-water movementis governed by the hydraulic conductivity of the material through which th ewater moves and by the hydraulic gradient . Gravel, well-sorted sand, andfractured rocks may have large conductivities, and where saturated, may for mimportant aquifers . Cemented deposits and fine-grained materials such as silt ,clay, and shale usually have small conductivities and restrict ground-wate rmovement .
6

49 00'T .
1 E
11640
,
1610•
LHANSOR O
1341
-1
1345T .
1 E
I
1710
.t.
_4
O
LIT
O
O
pOO
T .
1 f
- ~y~
n
1
L-
1708
CK LAKE
I
T .
i f
990 0PERT
Z
1481
I
EGE LAN D
BISBEE q
I
D CAND O
1436
139 4
~\»>_
fIMAZA '.
I . .
4 N
3N .
2 N
1 N
T . 160 N .
T 159 N
158 N
T 157 N
R 67 W .
R 66 W
0 1 2 3 4 5
10 MILE S
0 1 2 34 5
10KILOMETER S
R 68 W . R 65W 99 00
EXPLANATIO N
500 LINE OF EQUAL DEPTH TO TOP OF TH EDAKOTA SANDSTONE—Interval, 100 feet .Datum is land surfac e
•1390 DATA POINT—Number is depth to top o fDakota Sandstone, in feet below land surfac e
FIGURE 3 .-Depth to the top of the Dakota Sandstone .
7
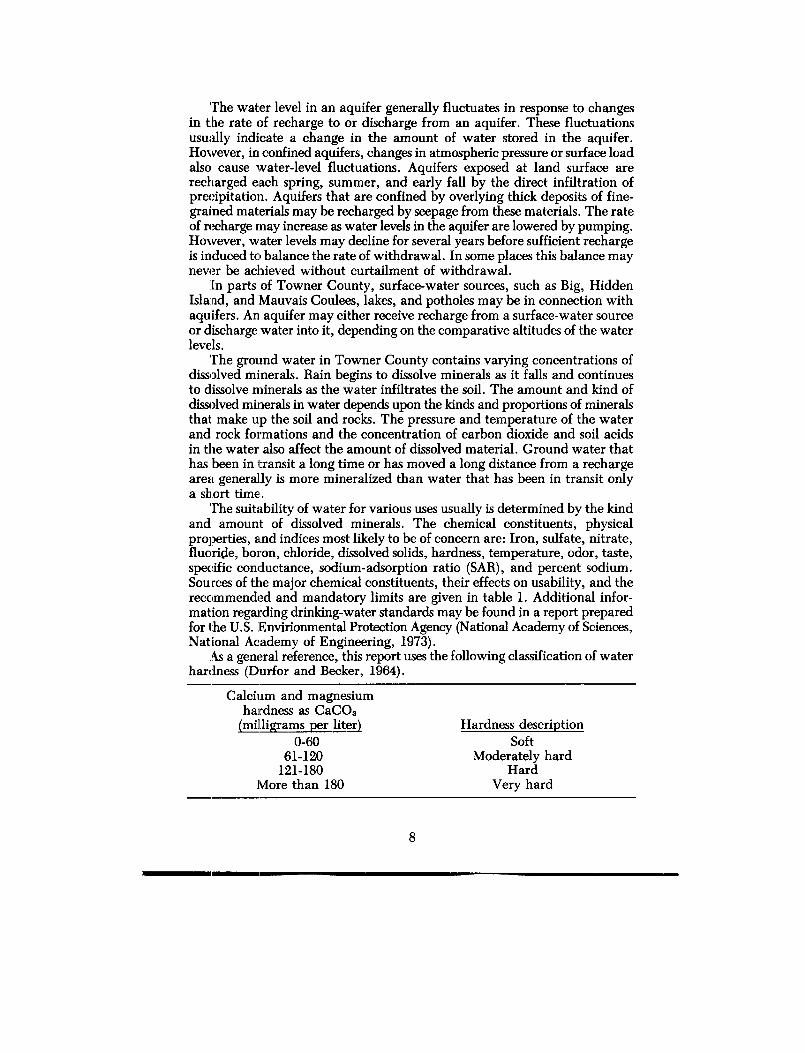
The water level in an aquifer generally fluctuates in response to change sin t:he rate of recharge to or discharge from an aquifer . These fluctuationsusually indicate a change in the amount of water stored in the aquifer .However, in confined aquifers, changes in atmospheric pressure or surface loa dalso cause water-level fluctuations . Aquifers exposed at land surface ar erecharged each spring, summer, and early fall by the direct infiltration o fprecipitation. Aquifers that are confined by overlying thick deposits of fine-grained materials may be recharged by seepage from these materials . The rat eof recharge may increase as water levels in the aquifer are lowered by pumping.However, water levels may decline for several years before sufficient recharg eis induced to balance the rate of withdrawal . In some places this balance maynever be achieved without curtailment of withdrawal .
[n parts of Towner County, surface-water sources, such as Big, Hidde nIsland, and Mauvais Coulees, lakes, and potholes may be in connection wit haquifers . An aquifer may either receive recharge from a surface-water sourc eor discharge water into it, depending on the comparative altitudes of the wate rlevels .
'The ground water in Towner County contains varying concentrations o fdissolved minerals . Rain begins to dissolve minerals as it falls and continue sto dissolve minerals as the water infiltrates the soil . The amount and kind ofdissolved minerals in water depends upon the kinds and proportions of mineral sthat make up the soil and rocks . The pressure and temperature of the wate rand rock formations and the concentration of carbon dioxide and soil acidsin the water also affect the amount of dissolved material . Ground water thathas been in transit a long time or has moved a long distance from a rechargearea generally is more mineralized than water that has been in transit onlya short time .
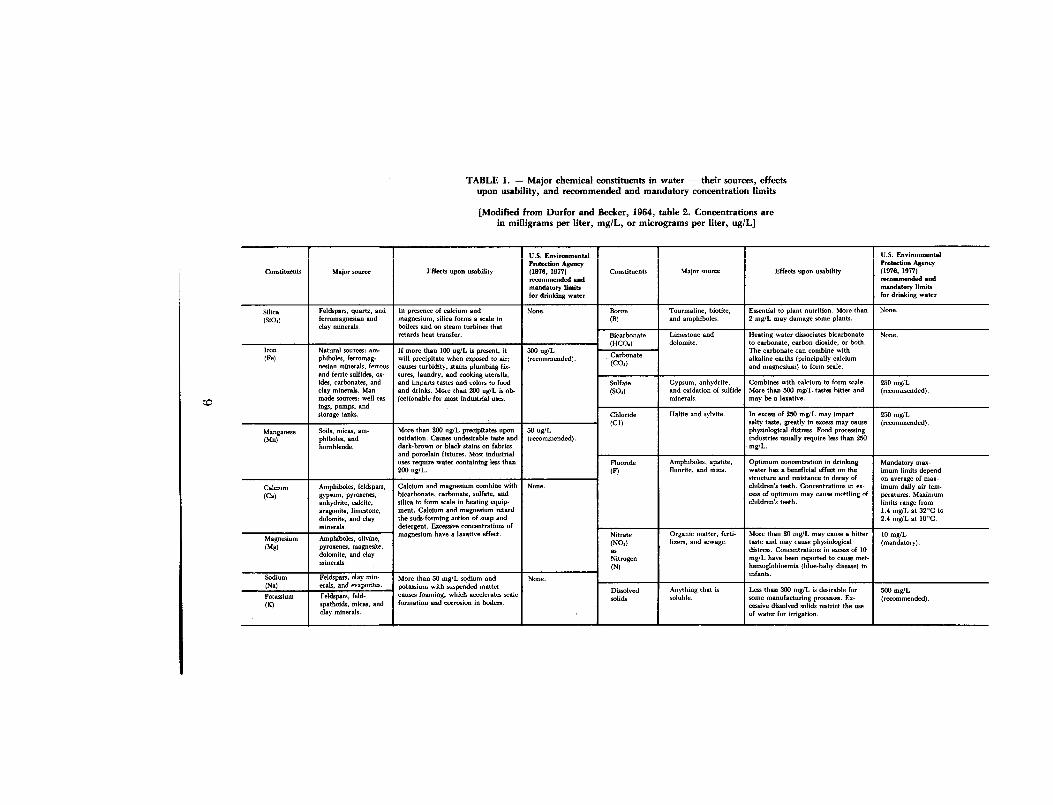
The suitability of water for various uses usually is determined by the kin dand amount of dissolved minerals . The chemical constituents, physicalproperties, and indices most likely to be of concern are : Iron, sulfate, nitrate ,fluoride, boron, chloride, dissolved solids, hardness, temperature, odor, taste ,specific conductance, sodium-adsorption ratio (SAR), and percent sodium .Sources of the major chemical constituents, their effects on usability, and th erecommended and mandatory limits are given in table 1 . Additional infor-mation regarding drinking-water standards may be found in a report prepare dfor the U .S . :Envirionmental Protection Agency (National Academy of Sciences ,National Academy of Engineering, 1973) .
As a general reference, this report uses the following classification of wate rhardness (Durfor and Becker, 1964) .
Calcium and magnesiumhardness as CaCO3
(milligrams per liter)
Hardness description
0-60
Soft
61-120
Moderately hard
121-180
HardMore than 180
Very hard
8
CC)
TABLE 1 . — Major chemical constituents in water — their sources, effectsupon usability, and recommended and mandatory concentration limits
[Modified from Durfor and Becker, 1964, table 2 . Concentrations arein milligrams per liter, mg/L, or micrograms per liter, ug/L]
Constituents
IMajor source
IEffects upon usability
I
U .S . Environmenta lProtection Agency(1976, 1977)recommended andmandatory limitsfor drinking water
IConstituents
IMajor source
IEffects upon usability
I
U .S. EnvironmentalProtection Agency(1976, 1977)recommended andmandatory limit sfor drinking water
Silica Feldspars, quartz, and In presence of calcium and None. Boron Tourmaline, biotite, Essential to plant nutrition . More than None.
(SiOs) ferromagnesian an dclay minerals.
magnesium, silica forms a scale inboilers and on steam turbines that
(B) and amphiboles . 2 mg/L may damage some plants .
retards heat transfer . Bicarbonate(HCOs)
Limestone an ddolomite .
Heating water dissociates bicarbonateto carbonate, carbon dioxide, or both.
None .
Iron Natural sources : am- If more than 100 ug/L is present, it 300 ug/L The carbonate can combine with(Fe) phiboles, ferroma -g willr
precipitate when exposed to air ; (recommended) . Carbonate alkaline earths (principally calciumnesian minerals, ferrousand ferric sulfides, ox-
causes turbidity, stains plumbing fix -Lures, laundry, and crooking utensils,
(COs)and magnesium) to form scale.
ides, carbonates, and and imparts tastes and colors to food Sulfate Gypsum, anhydrite, Combines with calcium to form scale . 250 mg/Lclay minerals . Man- and drinks . More than 200 ug/L is ob- (SO,) and oxidation of sulfide More than 500 mg/L tastes bitter and (recommended) .made sources : well car-ings, pumps, and
jectionable for most industrial uses. minerals. may be a laxative .
storage tanks. Chloride Halite and sylvite . In excess of 250 mg/L may impart 250 mg/L
(Cl) salty taste, greatly in excess may cause (recommended) .
Manganese Soils, micas, am- More than 200 ug/L precipitates upon 50 ug/L physiological distress . Food processing
(Mn) phiboles, and oxidation. Causes undesirable taste and (recommended) . industries usually require less than 25 0
hornblende. dark-brown or black stains on fabricsand porcelain fixtures . Most industrial
mg/L .
uses require water containing less than Fluoride Amphiboles, apatite, Optimum concentration in drinking Mandatory max -200 ug/L . (F) Fluorite, and mica . water has a beneficial effect on th e
structure and resistance to decay ofimum limits dependon average of max -
Calcium Amphiboles, feldspars, Calcium and magnesium combine with None. children's teeth . Concentrations in ex- imum daily air tom-
(Ca) gypsum, pyroxenes, bicarbonate, carbonate, sulfate, and cess of optimum may cause mottling of peratures . Maximu m
anhydrite, calcite, silica to form scale in heating equip- children's teeth . limits range fromaragonite, limestone, ment . Calcium and magnesium retard 1 .4 mg/I. at 32°C todolomite, and cla yminerals .
the suds-forming action of soap anddetergent . Excessive concentrations of
2 .4 mg/L at 10°C .
Magnesium Amphiboles, olivine,magnesium have a laxative effect . Nitrate Organic matter, ferti- More than 20 mg/L may cause a bitter 10 mg/L
(Mg) pyroxenes, magnesite,(NO') lizers, and sewage . taste and may cause physiologica l
distress. Concentrations in excess of 10(mandatory) .
dolomite, and clayas
minerals .Nitrogen mg/L have been reported to cause met -
(N) hemoglobinemia (blue-baby disease) i n
Sodium Feldspars, clay min- More than 50 mg/L sodium and None .infants .
(Na) erals, and evapnrites . potassium with suspended matterDissolved Anything that is Less than 300 mg/L is desirable for 500
Potassium Feldspars, feld- causes foaming, which accelerates scalesolids soluble. some manuf acturing p
mg/ L(recommended) .
(K) spathoids, micas, and formation and corrosion in boilers . cesst a dissolved solids restrict the useclay minerals. of water for irrigation .

Hardness in water used for ordinary domestic purposes does not become par -ticularly objectionable until it reaches a level of about 100 mg/L.
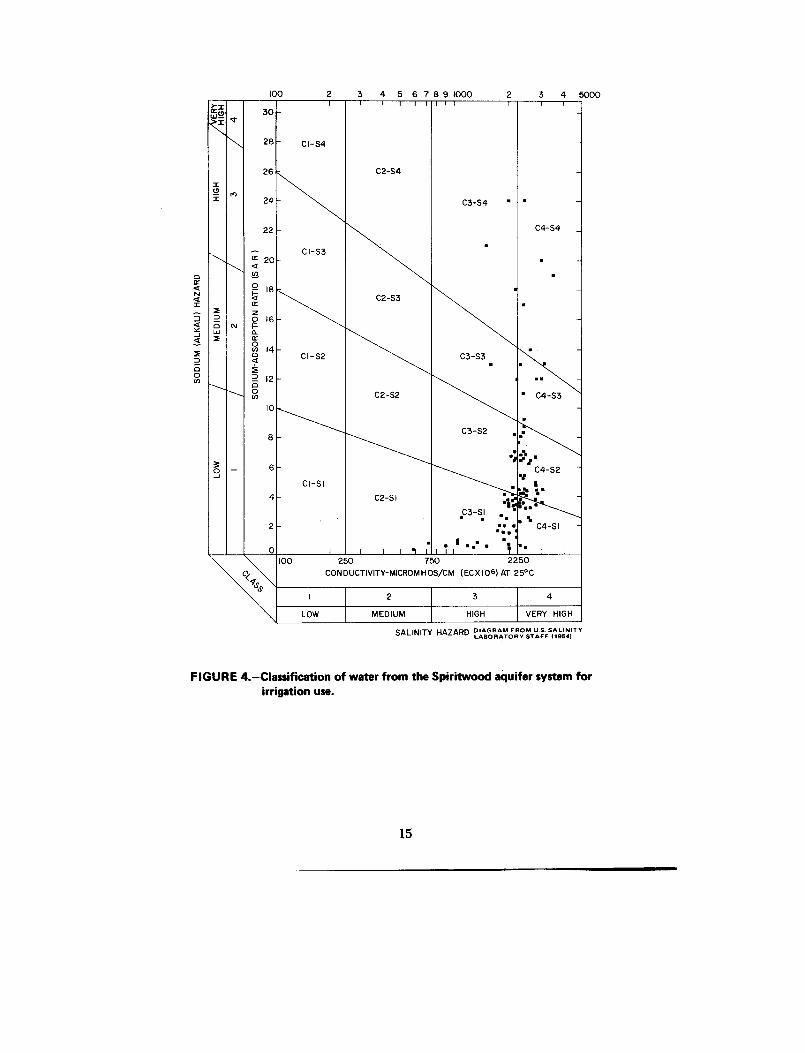
The quality of water used for irrigation is an important factor in cro pproductivity and in effects on the soil . The U.S. Salinity Laboratory Staff (1954)developed an irrigation classification system based on SAR and specific con -ductance . SAR is related to the sodium hazard and specific conductance i srelated to the salinity hazard . The hazards increase as the numerical value sof the indices increase . Irrigation classifications for selected water samples fro mglacial-drift aquifers in Towner County were determined using the Salinit yLaboratory Staff's classification system .
In this report numerous references are made to ground-water types, suc has sodium sulfate type and calcium sulfate type . These types are derived frominspection of water analyses and represent the predominant cation (sodium ,calcium, or magnesium) and anion (bicarbonate, sulfate, or chloride), as ex -pressed in milliequivalents per liter . Results of some analyses indicate that th ewater is a mixed chemical type in which two or more cations or anions ar epresent in nearly equal concentrations .
Water in the Bedrock
Pierre Aquifer
The Pierre Shale consists of light-gray to black siliceous shale, marlstone ,and claystone with thin lenses of yellowish to white bentonite . A test hole inwestern Towner County indicated a thickness of 535 ft . The Pierre directlyunderlies the glacial drift and crops out in small isolated areas near Rock Lake .The upper part of the Pierre Shale in Towner County consists of extensivel yfractured black siliceous shale. The fractured shale ranges in thickness fro m25 to 400 ft (7 .6 to 120 m) and forms an aquifer that is a source of water fo rmany farms in Towner County .
Studies of the hydraulic characteristics of the aquifer in Benson Count yby Aronow, Dennis, and Akin (1953), in Walsh County by Downey (1973) ,and in Cavalier County by Hutchinson (1977) indicate the transmissivity o fthe fracture system in the Pierre ranges from 22 to 121 ft 2 /d (2 to 11 .2 m 2 /d) .Because of the low transmissivities of the Pierre, most wells developed in th eaquifer are not expected to yield more than 10 gal/min (0 .6 L/s) in TownerCounty .
Recharge to the Pierre aquifer is derived mainly from precipitation per-colating through the overlying glacial drift . Ground water in the Pierre aquifermoves toward and discharges into the buried valleys in Towner County . Theamount of water in transient storage in the Pierre aquifer is related directl yto the extent and thickness of the fracture zones, which vary significantly .
Analyses of water samples from 42 wells completed in the Pierre aquife rindicate that the chemical quality of the water differs widely within the aquifer.The analyses indicate the water ranges from soft to very hard but predomi-nantly is either moderately or very hard. Dissolved-solids concentrations rangedfrom 976 to 6,590 mg/L and averaged 2,470 mg/L .
10

The dominant cation was sodium . The dominant anion in 25 of the 4 2samples was chloride . Sodium concentrations ranged from 100 to 2,400 mg/Land averaged 870 mg/L . Chloride concentrations ranged from 37 to 4,000 mg/ Land averaged 890 mg/L ; sulfate concentrations ranged from less than 1 to 1,700mg/L and averaged 310 mg/L ; and bicarbonate concentrations ranged from422 to 963 mg/L and averaged 682 mg/L . Most of the analyses indicate veryhigh salinity and sodium hazards for irrigation purposes .
Water in the Glacial Drift
Aquifers that have the largest potential for ground-water developmen toccur in the glacial deposits . The Spiritwood (Randich, 1977, and Hutchin-son and Klausing, 1980) and Rolla (Randich and Kuzniar, 1983) aquifer system sextend into Towner County from adjacent areas (pl . 2, in pocket) and pre-viously were named in reports describing those areas . Smaller aquifers recog-nized and described during this investigation were not individually named ,but were classified according to origin as buried glaciofluvial and outwashaquifers .
Water Available from Storag e
Where sufficient data are available, an estimate of ground water availabl efrom storage is calculated in units of acre-feet (cubic hectometers) . Usingaverage values, the volume of water available from an unconfined aquifer i sdefined by the following formula :
V = mASy
(1 )
where :
V = volume of water available from storage, in acre-feet ;E = saturated thickness, in feet;A = areal extent, in acres ; andSy = long-term specific yield of the aquifer .
The specific yield for glacial-drift aquifer materials ranges from 0 .001 to 0.35 .The commonly used range for these materials in North Dakota is 0 .10 to 0 .20 .In a confined aquifer the quantity of water gained due to expansion and com-pression is insignificant compared to storage estimates based on a long-ter mspecific yield of 15 percent .
Potential Yield of Glacial-Drift Aquifers
The estimated yields of the glacial-drift aquifers in Towner County ar eshown on plate 2 . The basic factor used in determining these estimates wa stransmissivity . Aquifer tests were used to determine the transmissivity of variou saquifer materials at selected sites . However, these transmissivities are vali d
11

only for a local area surrounding the test site, and aquifer tests are very ex -pensive to conduct . Therefore, transmissivities generally were determined b yestimating the hydraulic conductivity from lithologic logs at test-hole sites andmultiplying the estimated hydraulic conductivity by the thickness of th eaquifer . Although the estimates derived are only valid for the site of the loggedhole, the large number of logged holes provides a more extensive data bas ethan could be provided by aquifer tests .
The hydraulic conductivity was estimated from lithology by using the em -pirical values shown in table 2 . The range of values represents various degreesof sorting . Estimates were based on the smaller value unless the lithologic lo gindicated that the material was well sorted . Generally very fine sand and sil twere omitted from estimates if they did not contribute more than five percen tof the total transmissivity . The total transmissivity of the aquifer is the sumof the transmissivities of the separate units .
TABLE 2 . — Hydraulic conductivity of common glacial-drif taquifer materials
[Modified from Keech, 1964]
Hydraulic conductivityMaterial (feet per day) (meters per day)
Gravel 267-668 81-204Gravel and sand 134-267 41-8 1Sand, very coarse 120-134 37-4 1Sand, coarse 107-120 33-3 7Sand, medium to coarse 80-107 24-3 3Sand, medium 53-80 16-2 4Sand, fine to medium 40-53 12-1 6Sand, very fine, silty 13-40 4-12Silt and clay 1-13 0.3-4
Meyer (1963, p . 338-340, fig. 100) published a chart relating well diameter ,specific capacity, and coefficients of transmissivity and storage . The relatio nshows that for coefficients of storage of less than 0 .005 (generally confinedaquifers) and for transmissivities within the range of 270 to 13,000 ft 2/d (25to 1,200 m2 /d) the ratio of transmissivity to specific capacity is about 270 :1 ,when the specific capacity is in units of gallons per minute per foot o fdrawdown after 24 hours of pumping . The ratio is larger for transmissivitie sgreater than 13,000 ft2/d (1,200 m 2 /d) . In most confined aquifers the storagecoefficient is within the range of 0 .00005 to 0.005, and the chart indicate sthat within this range large changes in the storage coefficient correspond torelatively small changes in specific capacity . Therefore, in confined aquifer shaving transmissivities of as much as 13,000 ft 2 /d (1,200 m2 /d) the specificcapacity of an efficient, fully penetrating well may be approximated b ydividing the transmissivity by 270 . The potential yield of a fully penetratin gwell at a specific site was estimated by multiplying the specific capacity b y
12

an arbitrarily chosen drawdown value of 30 feet (9 m) . Where 30 feet (9 m)of drawdown was not available, one-half of the saturated thickness was use dto estimate yield .
Meyer's chart shows that for aquifers having a coefficient of storage largerthan 0.005 (unconfined aquifers) the specific capacity will be larger, and theratio of transmissivity to specific capacity approaches 134 :1 for small valuesof transmissivity and large values of the storage coefficient . Therefore, full ypenetrating wells generally yield about twice as much water from unconfine daquifers as similar wells in confined aquifers having the same transmissivity .
The principles described above were used to prepare plate 2 . The estimatedpotential well yields shown are total yields available from both the uncon-fined and confined parts of an aquifer system, where these two conditions exist .The yield map (pl . 2) is intended as a guide in the location of ground-waterresources, and not as a map to locate well sites within a given specific yield .Few, if any, aquifers in the glacial drift are so uniform in areal extent an dphysical properties that production wells could be constructed in them withoutadditional test drilling .
Spiritwood Aquifer Syste m
The Spiritwood aquifer system underlies an area of about 370 mi l (960km 2 ) in Towner County . It is part of a large, complex buried-valley aquifersystem that extends northward from Benson and Ramsey counties, throughcentral Towner County, and into Canada (pl . 2) .
The Spiritwood aquifer system in Towner County consists of sand andgravel beds interbedded with lenses of silt, clay, and till (pl . 3, in pocket) .Data from 138 test holes show that the aquifer system ranges in thickness fro m4 to 287 ft (1 to 87 m) and has an average aggregate thickness of 67 ft (20m). The deeper aquifer materials are derived primarily from shale and igneousrocks, whereas the upper materials are derived primarily from carbonate an dsiliceous rocks .
Water in the Spiritwood aquifer system generally is under confined condi -tions . Water levels in observation wells range from about 14 ft (4 m) aboveland surface at 159-066-29DDD to 125 ft (38 m) below land surface a t161-067-07DDD . Based on a relatively short period of record, annual water -level fluctuations range from about 1 to 4 ft (0 .3 to 1 m) . These fluctuation sprobably are in response to recharge from precipitation and to discharge t ostreams, lakes, and the underlying Pierre aquifer .
The potentiometric surface and areas where flowing wells might b edeveloped in the Spiritwood aquifer system are shown on plate 4 (in pocket) .The ground-water gradient is about 4 ft/mi (0 .8 m/km) toward the southeastfrom the ground-water divide northwest of Rock Lake, and toward the north -east north of the divide . In the topographically high area in northwesternTowner County, the ground-water gradient is about 20 ft/mi (4 m/km) easttoward the center of the buried valley . Water levels in wells developed in th eupper part of the Spiritwood aquifer system are at higher altitudes than wate r
13

levels in wells developed in the lower part of the system (pl . 3) and indicatewater movement is downward through the system .
Transmissivities calculated from lithologic logs (table 2) and analyses o faquifer tests in Towner and adjacent counties indicate the transmissivity o fthe Spiritwood aquifer system ranges from 4,000 to 20,000 f t 2 /d (370 to 1,860m 2/d) . Depending upon local aquifer thickness and hydraulic conductivity o fthe material penetrated, properly constructed wells completed in the Spirit -wood aquifer system in Towner County should yield from 50 to 1,500 gal/min(3 to 95 Lis; pl . 2) .
Based on an areal extent of 370 mil (960 km2), an average saturate dthickness of 67 ft (20 m), and an estimated specific yield of 15 percent, abou t2.4 million acre-ft (2,960 hm 3 ) of water is available from storage in the Spirit -wood aquifer system in Towner County .
Analyses of water samples from 95 wells completed in the Spiritwoo daquifer system indicate that the water predominantly is very hard and ex-tremely variable in composition . There is some evidence that dissolved-solid sconcentrations increase with depth and that hardness decreases with depth .Dissolved-solids concentrations in the samples ranged from 396 to 2,560 mg/ Land averaged 1,670 mg/L .
Sodium was the dominant cation in 50 samples, calcium was dominan tin 44 samples, and magnesium was dominant in 1 sample. Sulfate was thedominant anion . Sodium concentrations ranged from 6 .7 to 650 mg/L andaveraged 280 mg/L, and calcium concentrations ranged from 15 to 380 mg/ Land averaged 190 mg/L. Sulfate concentrations ranged from 57 to 1,400 mg/ Land averaged 690 mg/L, and bicarbonate concentrations ranged from 279 t o775 mg/L and averaged 555 mg/L. The irrigation classifications of the watersamples ranged from C2-S1 to C4-S4 and were dominantly C3-S1 or C4-S 2(fig. 4) .
Rolla Aquifer System
The Rolla aquifer system consists of a group of confined aquifers underly-ing an area of about 9 mil (23 km 2 ) in northwestern Towner County (pl . 2) .
The aquifer system consists of sand and gravel beds that generally are inter -bedded with thin lenses of silt, clay, or till . Data from two test holes in Towne rCounty show aquifer thicknesses of 30 and 46 ft (9 and 14 m) . Major rechargeto the aquifer system is from percolation of precipitation through overlyin gdrift deposits and by underflow from extensions of the aquifer system wes tof Towner County . Ground-water movement generally is southeastward(Randich and Kuzniar, 1983, pl . 6) and discharge is into the Spiritwood aquifersystem .
Yields from the Rolla aquifer system in Towner County were estimate dusing transmissivities calculated from lithologic logs (table 2) . Depending uponlocal aquifer thickness and hydraulic conductivity of the material penetrated ,properly constructed wells completed in the Rolla aquifer system should yieldfrom 5 to 200 gal/min (0 .3 to 13 L/s ; pl . 2) . Based on an areal extent of 9
14
100
2
3
4 5 6 7 8 9 1000
2
3 4 5000r I I
I
I
I
I I
I
I
1 I
I
30 - -
28 -
CI-S4 -
26 C2-S4 -x
24 - C3-S4
. .
-
P2 - C4-S4
_
20CI-S 3
- -
o
IB ' -a C2-S3z0 16 -o
w D.f x
u) 14 -
2
12
CI-S2 C3-S3 .
I ••
-co C2-S2 C4-S3
10 -
8C3-S2
0 6•• ti
C4-S2
-w
4CI
SIC2-SI
• +ti-ir
C3-S I.
. .. .%
2 .I C4-SI
-
0 I 1
I
1
7
I I
I•
T ~~
I
I
_
100
250
750
2250C~ \ CONDUCTIVITY-MICROMHOS/CM (ECXI0 6) AT 25° C
9sS
2 3 4
LOW MEDIUM HIGH VERY HIGH
SALINITY HAZARD DIAGRAM FROM U.S. SALINIT YLABORATORY STAFF (1954)
FIGURE 4.-Classification of water from the Spiritwood aquifer system fo rirrigation use .
15

mi2 (23 km 2), an average saturated thickness of 30 ft (9 m), and an estimate dspecific yield of 15 percent, about 26,000 acre-ft (32 h m 3) of water is availabl efrom storage in the Rolla aquifer system in Towner County .
Chemical analyses of water samples from three wells completed in the Roll aaquifer system indicate the water is very hard . Two of the samples were asodium-calcium sulfate type water and one sample was a calcium sulfate typ ewater . Dissolved-solids concentrations in the three samples were 1,440, 1,460 ,and 1,560 mg/L ; sulfate concentrations were 620, 630, and 660 mg/L ; calciumconcentrations were 180, 190, and 230 mg/L ; and sodium concentrations were150, 240, and 250 mg/L . Two of the samples were classified C3-Sl for irriga-tion use and one was classified C3-S2 .
Undifferentiated Aquifers in Buried Glaciofluvial Deposit s
Lenticular beds of sand and gravel are interspersed randomly with till i nmost parts of Towner County and form undifferentiated aquifers in burie dglaciofluvial deposits . These aquifers range from less than 1 to about 25 mi2(2 .6 to 65 km2) in areal extent . The cumulative total extent of these aquifersis estimated to be about 75 mi 2 (190 km 2) .
Data from 49 test holes show that these aquifers consist of interbedded san dand gravel . Generally the aquifers are less than 50 ft (15 m) thick and hav ean average thickness of about 20 ft (6 m) . Water levels in the aquifers rangefrom about 1 to 120 ft (0 .3 to 37 m) below land surface, and the aquifersgenerally are under confined conditions . Recharge is derived from precipita-tion infiltrating through the overlying glacial drift . Most of the aquifers prob-ably could not sustain well yields of more than 10 gal/min (0 .6 L/s) becauseof their limited areal extent . However, in some areas, such as the eastern part sof Tps . 158 and 162 N ., R. 065 W. (pl . 2), where areal extent and saturate dthickness are adequate, well yields of 500 gal/min (32 L/s) may be possible .
Based on an areal extent of 75 mi 2 (190 km2), and average thickness of 2 0ft (6 m), and an estimated specific yield of 15 percent, about 144,000 acre-ft(178 hm 3) of water is available to wells from storage in the aquifers .
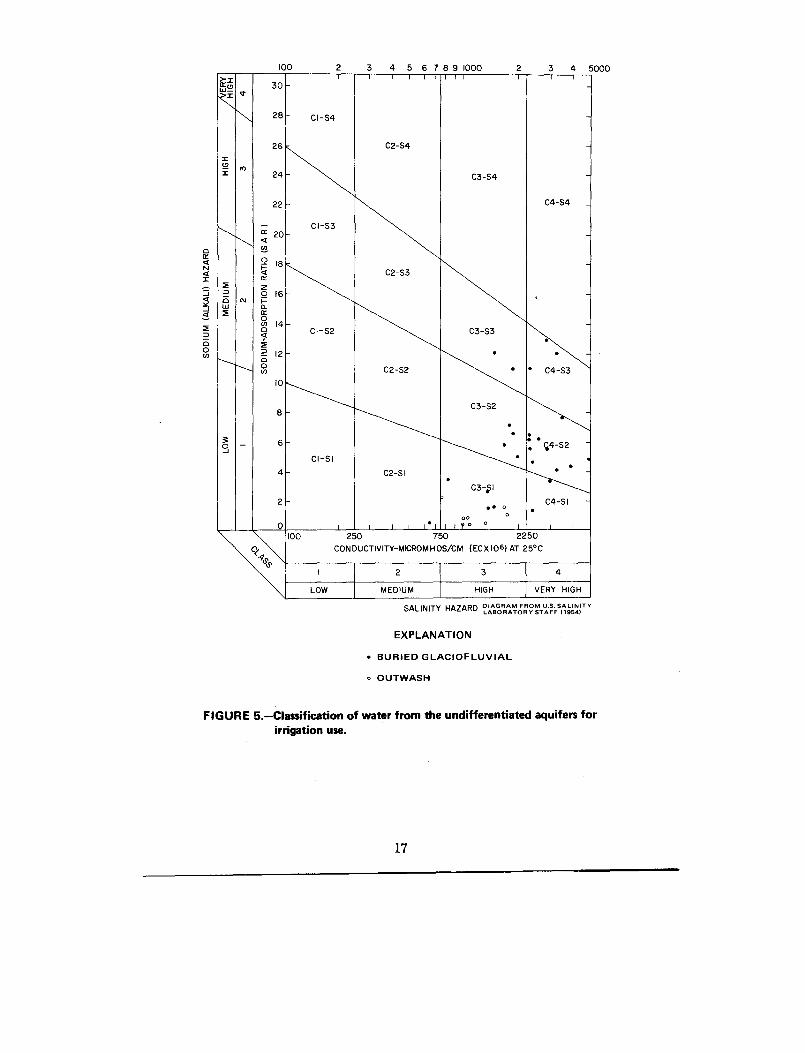
Chemical analyses of water samples from 25 wells completed in the undif -ferentiated aquifers in buried glaciofluvial deposits indicate that the water isvery hard and is highly variable in chemical character . The dominant catio ngenerally is sodium and the dominant anion generally is sulfate . Dissolved-solids concentrations in the samples ranged from 449 to 4,450 mg/L and aver -aged 1,760 mg/L . Sodium concentrations ranged from 16 to 550 mg/L andaveraged 310 mg/L ; calcium concentrations ranged from 37 to 580 mg/L an daveraged 180 mg/L ; sulfate concentrations ranged from 98 to 2,300 mg/L an daveraged 680 mg/L ; and bicarbonate concentrations ranged from 311 to 865mg/L and averaged 496 mg/L . The irrigation classifications of the wate rsamples ranged from C2-S1 to C4-S3 (fig . 5) .
16
100
2
3
4 5 6 7 8 9 1000
2
3 4 5000
128
3 0
26
24
2 2
20CI-S 3
arn
i
1 8azO 1 6a-a000
1 40a
1 20.
C4-S 3
8 C3-S22
I1 1 °
64
• •
c4-S 2
2C3-~I
C4-S I.• °
0oc
°°
°100
250
750
225 0G1( CONDUCTIVITY-MICROMHOS/CM (ECXI0 6 )AT25° C
s2 3 4
LOW MEDIUM HIGH VERY HIGH
SALINITY HAZARD DIAGRAM FROM U .S . SALINIT YLABORATORY STAFF (1954)
EXPLANATIO N
• BURIED GLACIOFLUVIA L
° OUTWASH
FIGURE 5 .-Classification of water from the undifferentiated aquifers fo rirrigation use.
17
Undifferentiated Aquifers in Outwash Deposits
Most of the stream valleys contain narrow outwash deposits of sand an dgravel . The major areas of outwash in Towner County are collapsed river sedi -ment (Clayton, 1980) . The saturated interval of these sand and gravel deposit sforms the undifferentiated aquifers in outwash deposits . The aquifers havea combined areal extent of about 100 mi2 (260 km 2) .
Data from 18 test holes show that the aquifers range in thickness from 4to 43 ft (1 to 13 m) and average 30 ft (9 m) . Water levels in these aquifersrange from 8 to 30 ft (2 to 9 m) below land surface . The undifferentiatedaquifers in outwash deposits are under unconfined conditions . Recharge t othe aquifers is derived from precipitation infiltrating through surface sediment sand seepage from streams, lakes, and potholes . Discharge is by pumping well sand ground-water movement to streams, potholes, and lakes during th erelatively dry seasons .
Transmissivities calculated from lithologic logs were used to estimate poten -tial yields from wells completed in these aquifers . Depending upon local aquiferthickness and hydraulic conductivity of the material penetrated, properly con -structed wells completed in these aquifers could yield from 5 to 300 gal/mi n(0 .3 to 19 L/s) . Based on an areal extent of 100 mi2 (260 km 2), and averagethickness of 30 ft (9 m), and an estimated specific yield of 15 percent, abou t288,000 acre-ft (355 hm 3) of water is available to wells from storage in th eundifferentiated aquifers in outwash deposits .
Chemical analyses of water samples from eight wells completed in the un -differentiated aquifers in outwash deposits indicate that the water is very hard .The dominant cation is calcium and the dominant anion is bicarbonate .Dissolved-solids concentrations in the samples ranged from 490 to 1,460 mg/ Land averaged 930 mg/L ; calcium concentrations ranged from 68 to 240 mg/ Land averaged 150 mg/L ; bicarbonate concentrations ranged from 319 to 62 4mg/L and averaged 442 mg/L ; and sulfate concentrations ranged from 85 to680 mg/L and averaged 310 mg/L . The irrigation classification of the wate rsamples was C3-S1 (fig. 5) .
GROUND-WATER US E
The principal uses of ground-water in Towner County are for domestic ,livestock, and public supplies . The estimated total mean annual ground-wateruse was 623 acre-ft (0 .77 hm 3) for 1981 .
Rural Domestic and Livestock Supplies
Rural domestic and stock wells in Towner County are from 23 to 474 ft(7 to 144 m) deep and commonly yield 5 to 50 gal/min (0 .3 to 3 Lis) . Thefollowing table shows the approximate quantity of ground water used durin g1981 .
18

Rural domestic and livestock use, Towner Count y
198 1Individual Estimated
requirements' pumpage(gallons per (gallons per
Use
day) Population day)Domestic
(does not includepublic supplies) 3
100 22,269 226,900
Cattle 20 47,000 140,000Hogs 3 42,000 6,000Sheep 2 42,900 5,800
Estimated total pumpage 378,700(1 .16 acre-ft)
'Murray, 1965 . .2U.S. Bureau of the Census, 1981 .3lncludes municipalities that rely on private wells .4U .S. Department of Agriculture, Statistical Reporting Service ,North Dakota Crop and Livestock Reporting Service, 1982 .
The quantities in the table may be larger than the amount of ground wate ractually used because some farms are vacant during the winter and som elivestock are watered out of dugouts, sloughs, or streams .
Public Supplies
Most cities and towns in Towner County depend on ground water for thei rsupplies . The following table shows the estimated mean annual quantity o fground water pumped through distribution systems during 1981 .
City Well location AquiferMean annual pumpage
1981 (acre-feet)
Cando 158-066-20CAA1 Spiritwood Mean annual pumpage-20CAA2 Spiritwood for all well s-20CAA3 Spiritwood 167 .6
Rock Lake 161-066-06CAD Spiritwood 32 .1
Estimated total pumpage
199 .7 acre-feet
1 9
SUMMARY
The objectives of this study were to : (1) Determine the location, extent ,and nature of the major aquifers; (2) evaluate the occurrence and movemen tof ground water, including sources of recharge and discharge ; (3) estimatethe quantities of water stored in the glacial aquifers ; (4) estimate the poten-tial yields to wells tapping the major aquifers ; (5) determine the chemicalquality of the ground water ; and (6) identify current and potential use of theground water .
Water in Towner County is available from aquifers in the Pierre Shal eof Late Cretaceous age, and in the glacial drift of Quaternary age . The PierreShale forms the bedrock surface below the glacial drift and crops out locall yin Towner County . The Pierre consists of light-gray to black siliceous shale ,marlstone, and claystone with thin lenses of bentonite. The Pierre aquifer con -sists of fractured black siliceous shale in the upper 25 to 400 ft (7 .6 to 120 m )of the formation . This aquifer is a source of water for many farms in Towne rCounty . Most wells developed in the Pierre aquifer yield less than 10 gal/min(0 .6 L/s) . Recharge to the aquifer is derived from precipitation percolatin gthrough the overlying glacial drift . Ground-water movement through theaquifer generally is from topographically high areas toward buried valleys in-cised into the Pierre aquifer . Dissolved-solids concentrations in water samplescollected from the aquifer ranged from 976 to 6,590 mg/L.
Aquifers in the glacial drift have the greatest potential for ground-wate rdevelopment . An estimated 2 .8 million acre-feet (3,450 hm3) of water isavailable from storage in these aquifers . The aquifers are composed of saturatedsand and gravel deposits that range in thickness from 4 to 287 ft (1 to 87 m) .The Spiritwood aquifer system is the largest glacial-drift aquifer in TownerCounty . The areal extent, estimated amount of water available from storage ,estimated potential yield to wells, and dissolved-solids ranges for the glacial-drift aquifers are summarized in table 3 . Recharge to the glacial-drift aquifersis derived from precipitation infiltrating through surface materials and, i nplaces, from adjacent or underlying bedrock aquifers . Water in the Spiritwoodaquifer system moves toward the southeast from the ground-water divide nea rRock Lake, and toward the northeast north of the divide . In the topograph-ically high area in northwestern Towner County movement is east toward th ecenter of the buried valley. Water movement in the Rolla aquifer generallyis southeastward .
The principal uses of ground water in Towner County are for domestic ,livestock, and public supplies . The estimated mean annual ground-water us ein 1981 was 623 .1 acre-ft (0 .77 hm 3) .
20

TABLE 3 . — Summary of data for glacial-drift aquifiers.
Estimated amount Dissolved-
Aquifer orApproximateareal extent
of water availablefrom storage
Estimated potentialyields to wells
solids range(milligram s
aquifer system (square miles) (acre-feet) (gallons per minute) per liter)
Spiritwood aquifer system 370 2,400,000 50-1,500 396-2,560
Rolla aquifer system 9 26,000 5-200 1,440-1,560
Undifferentiated aquifersin buried glaciofluvial 75 144,000 <10-500 449-4,450deposits
Undifferentiated aquifers 100 288,000 5-300 490-1,46 0in outwash deposits
SELECTED REFERENCES
Abbott, G. A,,, and Voedisch, F . W ., 1938, The municipal ground-watersupplies of North Dakota: North Dakota Geological Survey Bulletin 11, 99 p .
Aronow, Saul„ Dennis, P . E., and Akin, P . D., 1953, Geology and ground -water resources of the Minnewaukan area, Benson County, North Dakota :North Dakota State Water Commission and North Dakota Geologica lSurvey, North Dakota Ground-Water Studies 19, 125 p .
Bluemle, J . P . 1977, The face of North Dakota, the geologic story : NorthDakota Geological Survey Educational Series 11, pl . 1 .
Clayton, Lee, 1980, Geologic map of North Dakota : U.S. Geological SurveyMap G77220, 1 sheet .
Colton, R. B., Lemke, R . W., and Lindvall, R . M., 1963, Preliminary glacialmap of North Dakota: U.S . Geological Survey Miscellaneous Geologi cInvestigations Map I-331 .
Comly, H. H., 1945, Cyanosis in infants caused by nitrates in well water :American Medical Association journal, v. 129 .
Downey, J . S .,, Ground-water resources of Nelson and Walsh Counties, NorthDakota: North Dakota Geological Survey Bulletin 57, Part III, and Nort hDakota State Water Commission County Ground-Water Studies 17, PartIII, 67 p .
Durfor, C . N., and Becker, Edith, 1964, Public water supplies of the 100 larges tcities in the United States, 1962 : U.S. Geological Survey Water-Supply Pape r1812, 364 p .
Federal Water Pollution Control Administration, 1968, Report of theCommittee on the water-quality criteria : Washington, United StatesGovernment Printing Office, 234 p .
Fenneman, N. M., 1946, Physical divisions of the United States : U.S .Geological Survey map prepared in cooperation with the Physiographi cCommission, U.S. Geological Survey, scale 1 :700,000 [Reprinted, 1964] .
2 1

Hem, J . D., 1970, Study and interpretation of the chemical characteristicsof natural water (2d ed .) : U.S. Geological Survey Water-Supply Paper 1473 ,363 p .
Hutchinson, R. D ., 1977, Ground-water resources of Cavalier and Pembin aCounties, North Dakota : North Dakota Geological Survey Bulletin 62, Par tIII, and North Dakota State Water Commission County Ground-Wate rStudies 20, Part III, 68 p .
Hutchinson, R . D., and Klausing, R . L., 1980, Ground-water resources ofRamsey County, North Dakota : North Dakota Geological Survey Bulletin71, Part III, and North Dakota State Water Commission County Ground-Water Studies 26, Part III, 36 p .
Jacob, C. E ., 1946, Report of the subcommittee on permeability : AmericanGeophysical Union Transactions, v . 27, no. 2, p. 245-256 .
Johnson, A. I ., 1963, Application of laboratory permeability data ; U .S .Geological Survey Open-File Report, 33 p .
Kahil, A. A., 1965, Ground-water survey of the Rock Lake area, TownerCounty, North Dakota : North Dakota State Water Commission Ground -Water Studies 63, 32 p .
Keech, C. F ., 1964, Ground-water conditions in the proposed waterfowl refugearea near Chapman, Nebraska, with a section on chemical quality of thewater by P. G. Rosene : U .S. Geological Survey Water-Supply Paper 1779-E ,55 p ., 6 pls .
Keys, W . S., and MacCary, L . M., 1971, Application of borehole geophysicsto water-resource investigations : Techniques of Water-Resources Investiga -tions of the U .S. Geological Survey, Book 2, Chapter El, 126 p .
Kuzniar, R. L., and Randich, P .G., 1982, Ground-water data for Bottinea uand Rolette Counties, North Dakota : North Dakota Geological SurveyBulletin 78, Part II, and North Dakota State Water Commission CountyGround-Water Studies 35, Part II, 742 p . 1983, Ground-water data for Towner County, North Dakota : North
Dakota Geological Survey Bulletin 79, Part II, and North Dakota StateWater Commission County Ground-Water Studies 36, Part II, 280 p .
Lemke, R . W., 1960, Geology of the Souris River area, North Dakota : U .S .Geological Survey Professional Paper 325, 138 p .
Meyer, R . R., 1963, A chart relating well diameter, specific capacity, an dthe coefficients of transmissibility and storage, in Bentall, Ray, Methodsof determining permeability, transmissibility, and drawdown: U .S .Geological Survey Water-Supply Paper 1536-I, p . 338-340 .
Murray, C. R., 1965, Estimated use of water in the United States : U .S .Geological Survey Circular 556, 53 p .
National Academy of Sciences, National Academy of Engineering, 1973 [1974] ,Water quality criteria 1972: U.S. Environmental Protection Agency ,Ecological . Research Series, Report EPA 113-073-033, March 1973, 594 p .
North Dakota State Department of Health, 1962, The low sodium diet i ncardiovascular and renal diseases : Sodium content of municipal waters inNorth Dakota : 11 p .
22

1964, Chemical analyses of municipal waters in North Dakota : 25 p . 1970, Water quality standards for surface waters of North Dakota : 45 p . 1977, Regulations for public water supply systems of the State of Nort h
Dakota: Regulation 61-28 .1-02, 18 p .Randich, P. G., 1977, Ground-water resources of Benson and Pierce Counties ,
North Dakota: North Dakota Geological Survey Bulletin 59, Part III, an dNorth Dakota State Water Commission County Ground-Water Studies 18 ,Part III, 76 p .
Randich, P. G., and Kuzniar, R. L., 1982, Preliminary map showingavailabilty of water from glacial-drift aquifers in Towner County, Nort hDakota : U.S. Geological Survey Open-File Report 82-767, 1 sheet . 1983, Ground-water resources of Bottineau and Rolette Counties, Nort h
Dakota : North Dakota Geological Survey Bulletin 78, Part III, and Nort hDakota State Water Commission County Ground-Water Studies 35, Part III .
Riggs, H. C., 1968, Low-flow investigations : U .S. Geological SurveyPreliminary Report, 15 p .
Schroer, F . W., 1970, A study of the effect of water quality and managemen ton the physical and chemical properties of selected soils under irrigation :North Dakota Water Resources Institute Report of Investigations, 48 p .
Simpson, H . E., 1929, Geology and ground-water resources of North Dakota :U .S . Geological Survey Water-Supply Paper 598, 312 p .
Skougstad, M . W., Fishman, M . S ., Friedman, L . C., Erdmann, D . E ., andDuncan, S . S . (eds .), 1979, Methods of determination of inorganic substance sin water and fluvial sediment : Techniques of Water-Resources Investiga-tions, Book 5, Chapter Al, 626 p .
Smith, Carole, 1953, Summary of the National Bulk Carries Inc., Edna L .Hild No. 1, Towner County, North Dakota : North Dakota GeologicalSurvey Circular no . 41, 12 p . 1954a, Summary of the Rhodes-Langenfeld, R . R. Gibbons No . 1 ,
Towner County, North Dakota : North Dakota Geological Survey Circula rno. 35, 9 p . 1954b, Summary of the Midwest Exploration Corporation, Unio n
Central Life Insurance, and H . Amann No. 1, Towner County, Nort hDakota : North Dakota Geological Survey Circular no . 82, 8 p .
Stallman, R. W., 1963, Electric analog of three-dimensional flow to wells an dits application to unconfined aquifers : U .S. Geological Survey Water-SupplyPaper 1536-H, p . 205-242 .
Strasburg, Morton, 1954, Summary of the Midwest Exploration Company ,P. Juntunen No . 1, Towner County, North Dakota : North DakotaGeological Survey Circular no. 81, 7 p .
Theis, C . V., 1935, The relation between the lowering of the piezometri csurface and the rate and duration of discharge of a well using ground-wate rstorage : American Geophysical Union Transactions, v . 16, p. 519-524 .
23

Theis, C. V., Brown, R. H., and Meyer, R . R., 1963, Estimating thetransmissibility of aquifers from the specific capacity of wells, in Bentall ,Ray, Methods of determining permeability, transmissibility and drawdown :U.S. Geological Survey Water-Supply Paper 1536-I, p . 331-336 .
U.S. Bureau of the Census, 1981, 1980 Census of population, Number of in -habitants, North Dakota : U.S . Bureau of the Census Final Report PC80-1-A36 .
U.S. Department of Commerce, National Oceanic and Atmospheri cAdministration, Environmental Data Service, 1973, Monthly normals o ftemperature, precipitation, and heating and cooling degree days 1941-70 :Climatography of the United States, no . 81 (by State) North Dakota .
U.S. Department of Commerce, National Oceanic and Atmospheri cAdministration, National Weather Service, 1982, Evaporation atlas for th econtiguous 48 United States: National Oceanic and AtmosphericAdministrtation Technical Report NWS33, 27 p ., 4 maps .
U.S. Environmental Protection Agency, 1976 [1978], National interim primar ydrinking water regulations : Office of Water Supply, U .S. Environmenta lProtection Agency, Report EPA-570/9-76-003, 159 p .
1977, National secondary drinking water regulations : Federal Register ,v . 42, no. 62, Thursday, March 31, 1977, Part 1, p . 17143-17147 .
U.S. Public Health Service, 1962, Drinking water standards : U.S . PublicHealth Service Publication 956, 61 p .
U.S . Salinity Laboratory Staff, 1954, Diagnosis and improvement of salin eand alkali soils : U.S . Department of Agriculture Handbook 60, 160 p .
Upham, Warren, 1895 [1896], The glacial Lake Agassiz : U.S . GeologicalSurvey Monograph 25, 658 p .
Wentworth, C . K., 1922, A Scale of grade and class terms for clastic sediments :Journal of Geology, v . 30, p . 377-392 .
DEFINITIONS OF SELECTED TERM S
Aquifer — a formation, group of formations, or part of a formation tha tcontains sufficient saturated permeable material to conduct ground wate rand to yield economically significant quantities of water to wells and springs .
Aquifer system — a body of both permeable and less permeable material thatacts as a water-yielding hydraulic unit of regional extent .
Bedrock — a general term for the rock that underlies soil or other uncon-solidated surficial material .
Confined — used in this report as an adjective for an aquifer that contain sground water under pressure that is greater than atmospheric pressure .
Discharge — used in this report as the flow of ground water out of an aquiferto the land surface, to bodies of surface water, to the atmosphere, or toother aquifers .
Drawdown — decline of the water level in a well due to withdrawal of groun dwater .
24

Facies — any observable characteristic or characteristics of one part of a rockas contrasted with another or several other parts of the same rock, and th echanges that may occur in these characteristics over a geographic area .
Fluvial deposits — materials deposited by streams .Geophysical log — a record obtained by lowering an instrument into a borehole
or well and recording continuously on a meter at the surface some physicalproperty of the material surrounding the borehole . Examples used in thisinvestigation include electric logs and radioactivity logs .
Glacial drift -- all rock material (clay, sand, gravel, boulders) transportedby a glacier and deposited directly by or from the ice or by running wate rthat originated in the ice .
Glacioaqueous — pertaining to or resulting from the combined action of ic eand water .
Glaciofluvial -- pertaining to streams flowing from glaciers .Ground water — the part of the subsurface water that is in the zone o f
saturation .Hydraulic conductivity — the volume of water at the existing kinemati c
viscosity that will move in unit time under a unit hydraulic gradient throug ha unit area measured at right angles to the direction of flow .
Hydraulic gradient — the change in static head per unit distance in a give ndirection .
Infiltration — used in this report as movement of water and solutes throug hinterstices in surficial material .
Lacustrine deposits — materials deposited in lakes .Lithologic log -- a record of the description of the distribution of materials
and their properties with depth in a borehole or well .National Geodetic Vertical Datum of 1929 (NGVD of 1929) — a geodeti c
datum derived from a general adjustment of the first-order level nets ofboth the United States and Canada, formerly called mean sea level .
Observation well — a well drilled for the purpose of measuring factors suc has water levels and pressure changes .
Percolation — movement of water through the interstices of a rock or soil .Permeability -- the property of a porous rock or unconsolidated material fo r
transmitting fluids .Porosity — the property of a rock, soil, or other material containing interstices
or voids and may be expressed quantitatively as the ratio of the volume ofthe interstices to its total volume .
Potential yield — used in this report as the rate of withdrawal of water tha tcan be expected from a properly constructed well to an aquifer .
Potentiometric surface — an imaginary surface representing the level to whic hwater will rise in a tightly cased well .
Pressure head -- head pressure expressed as the height of a column of wate rthat the pressure can support .
Recharge — the processes involved in the addition of water to the zone o fsaturation or the transfer of water to an aquifer from the surroundin gmaterial .
25
Saturated — a condition in which the openings of a material are filled wit hwater.
Sodium-adsorption ratio —
(Na + )SAR –
j(Ca 2) + (MG +2 )2
where ions are expressed in milliequivalents per liter . This ratio can be usedto predict the degree to which water tends to enter a chemical reaction whichis damaging to soil structure .
Specific capacity — the rate of discharge of a well per unit of drawdown .Specific yield — the ratio of the volume of water a given mass of materia l
will yield by gravity to the volume of that mass .Storage coefficient — the volume of water released from storage per unit are a
if the water table or potentiometric surface declines a unit distance . In anunconfined aquifer it is approximately equal to specific yield .
Till — nonsorted and nonstratified sediment deposited by a glacier . Generallycomposed of clay or silt with varying amounts of sand, pebbles, andboulders .
Transmissivity — the rate at which water of the prevailing kinematic viscosityis transmitted through a unit width of the aquifer under a unit hydrauli cgradient . It is equal to an integration of the hydraulic conductivities acros sthe saturated part of the aquifer perpendicular to the flow paths .
Unconfined — used in this report as an adjective for an aquifer having a freewater table, that is, water not confined under pressure significantly greate rthan atmospheric pressure beneath impermeable materials .
26