groundfish assessment oversight panel 2015 · groundfish assessment oversight panel 2015 ... 7.39...
TRANSCRIPT

Groundfish Assessment Oversight Panel 2015
Review of Plans for Operational Assessments Clark Conference Room
Woods Hole, MA Population Dynamics Stock Assessment Lead Scientists
http://www.nefsc.noaa.gov/groundfish/operational-assessments-2015/
Northeast Fisheries Science Center
July 27, 2015

Goals for Today’s Webinar and Onsite Meeting
Quickly Review the 2015 groundfish assessment process and timeline
Review PLANS for individual stock assessments
Allow the Assessment Oversight Panel, SSC, Council Staff, GARFO and Public the opportunity to ask questions about the assessment plan (Group)
Summarize key decisions and prepare report for NRCC and Website
U.S. Department of Commerce | National Oceanic and Atmospheric Administration | NOAA Fisheries | Page 2

Operational Assessment Timeline
Species Stock
Northeast Regional
Coordinating Council meeting
Assessment Oversight
Panel meeting
July 27, 2015
Assessments conducted
August-early September
Peer Review Meeting
September 14-18
Final assessment
report delivered to the NEFMC
October 2015
U.S. Department of Commerce | National Oceanic and Atmospheric Administration | NOAA Fisheries | Page 3
http://www.nefsc.noaa.gov/groundfish/operational-assessments-2015/
You are here

Northeast Regional Coordinating Council—Guidance on topics that can be considered as part of the operational assessment.
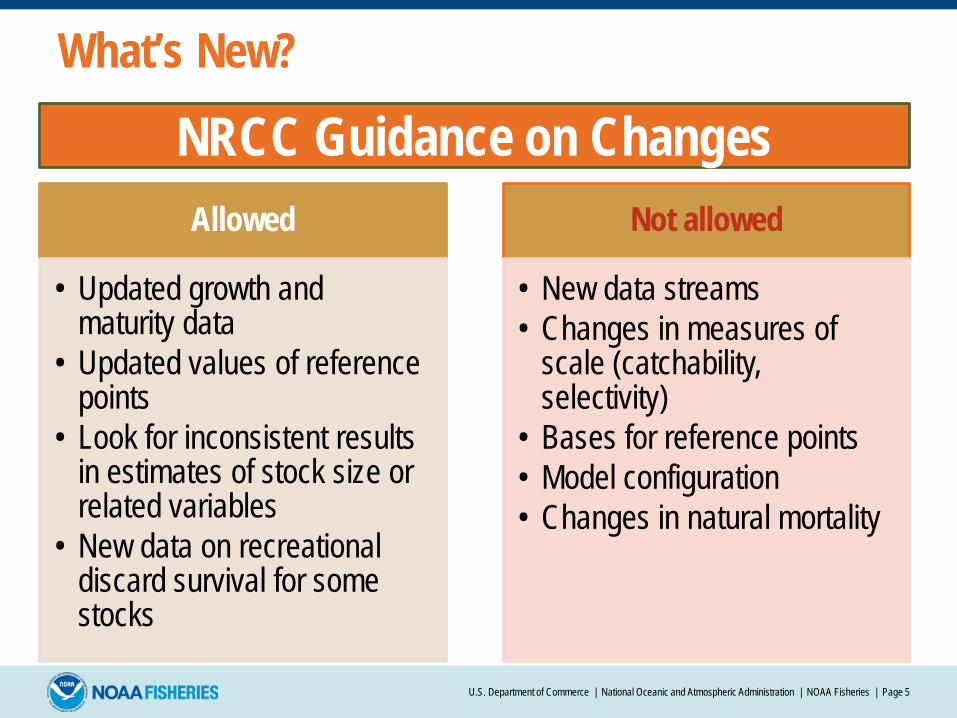
What’s New?
Allowed
• Updated growth and maturity data
• Updated values of reference points
• Look for inconsistent results in estimates of stock size or related variables
• New data on recreational discard survival for some stocks
Not allowed
• New data streams • Changes in measures of
scale (catchability, selectivity)
• Bases for reference points • Model configuration • Changes in natural mortality
U.S. Department of Commerce | National Oceanic and Atmospheric Administration | NOAA Fisheries | Page 5
NRCC Guidance on Changes

Operational Assessment Process • Operational assessments will be prepared by NEFSC or
Council/Commission staff. • A senior NEFSC assessment scientist, and the chairs of the Mid-
Atlantic and New England SSCs will constitute the Assessment Oversight Panel and will be advised by staff of the NERO, NEFMC, MAFMC, and ASMFC.
• The public may participate in the deliberations of the AOP. • Peer review of operational assessments will be conducted by an
Integrated Peer Review team including at least the lead assessor(s), the SSC member responsible for the stock, and an assessment scientist either from outside of NMFS or if from within NMFS, from outside of the lead assessor’s working group.
• Results from the peer review will then be forwarded to the PDT/TC/SSC for the Councils’ use in the ABC setting process.
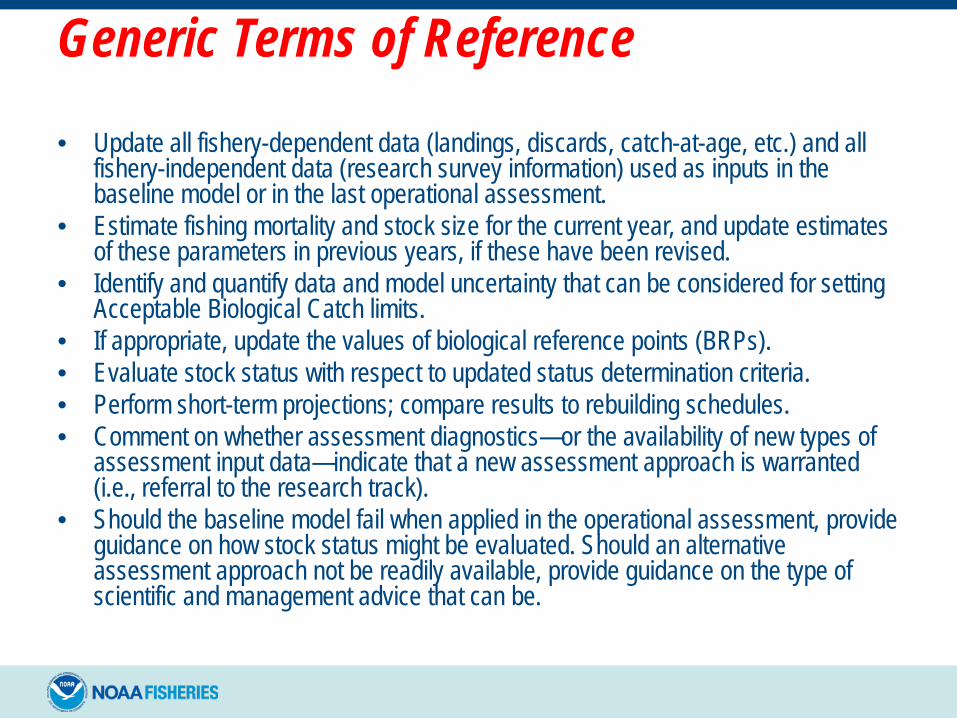
Generic Terms of Reference
• Update all fishery-dependent data (landings, discards, catch-at-age, etc.) and all fishery-independent data (research survey information) used as inputs in the baseline model or in the last operational assessment.
• Estimate fishing mortality and stock size for the current year, and update estimates of these parameters in previous years, if these have been revised.
• Identify and quantify data and model uncertainty that can be considered for setting Acceptable Biological Catch limits.
• If appropriate, update the values of biological reference points (BRPs). • Evaluate stock status with respect to updated status determination criteria. • Perform short-term projections; compare results to rebuilding schedules. • Comment on whether assessment diagnostics—or the availability of new types of
assessment input data—indicate that a new assessment approach is warranted (i.e., referral to the research track).
• Should the baseline model fail when applied in the operational assessment, provide guidance on how stock status might be evaluated. Should an alternative assessment approach not be readily available, provide guidance on the type of scientific and management advice that can be.
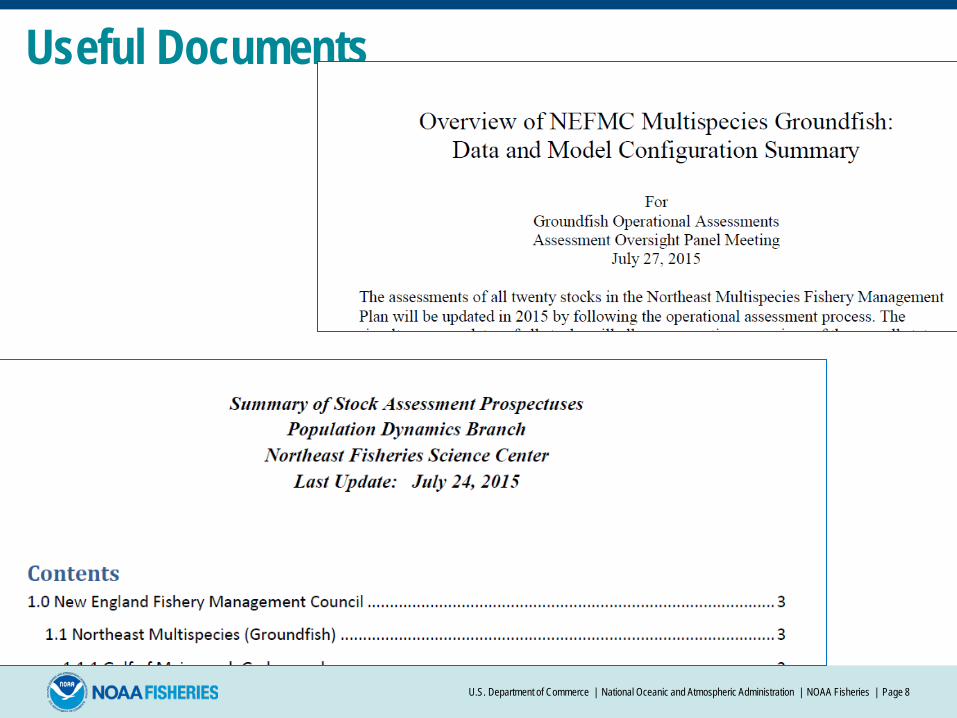
Useful Documents
U.S. Department of Commerce | National Oceanic and Atmospheric Administration | NOAA Fisheries | Page 8

For More Information • http://www.nefsc.noaa.gov/groundfish/operatio
nal-assessments-2015/
U.S. Department of Commerce | National Oceanic and Atmospheric Administration | NOAA Fisheries | Page 9

2015 AOP Panel Meeting
Gulf of Maine Atlantic cod Michael Palmer NEFSC
Woods Hole, MA July 27, 2015
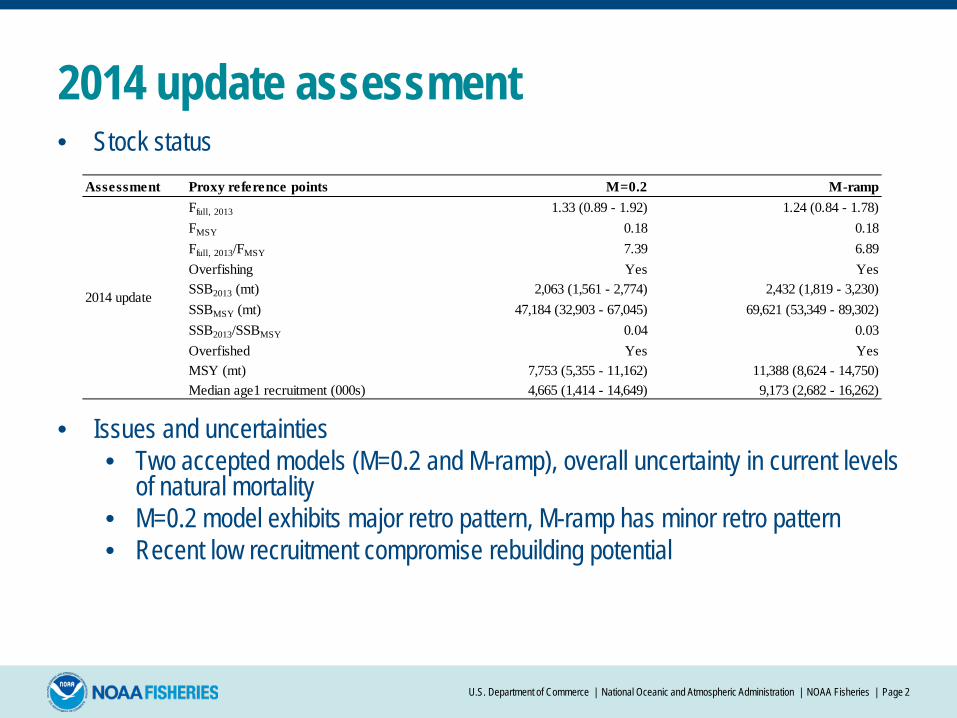
2014 update assessment • Stock status
• Issues and uncertainties • Two accepted models (M=0.2 and M-ramp), overall uncertainty in current levels
of natural mortality • M=0.2 model exhibits major retro pattern, M-ramp has minor retro pattern • Recent low recruitment compromise rebuilding potential
U.S. Department of Commerce | National Oceanic and Atmospheric Administration | NOAA Fisheries | Page 2
Assessment Proxy reference points M=0.2 M-rampFfull, 2013 1.33 (0.89 - 1.92) 1.24 (0.84 - 1.78)FMSY 0.18 0.18Ffull, 2013/FMSY 7.39 6.89Overfishing Yes YesSSB2013 (mt) 2,063 (1,561 - 2,774) 2,432 (1,819 - 3,230)SSBMSY (mt) 47,184 (32,903 - 67,045) 69,621 (53,349 - 89,302)SSB2013/SSBMSY 0.04 0.03Overfished Yes YesMSY (mt) 7,753 (5,355 - 11,162) 11,388 (8,624 - 14,750)Median age1 recruitment (000s) 4,665 (1,414 - 14,649) 9,173 (2,682 - 16,262)
2014 update

2015 update: anticipated challenges • Switch NEFSC survey station acceptance criterion from SHG to TOGA
(minor)
• Update of MRIP catch estimates to reflect data updates (minor)
• Revise the discard mortality assumption for the recreational fishery from 30% to 15% following Capizzano et al. study (minor)
• Consideration of retrospective adjustment for M=0.2 model (moderate)
• Natural mortality assumptions for short-term projections (moderate)
U.S. Department of Commerce | National Oceanic and Atmospheric Administration | NOAA Fisheries | Page 3
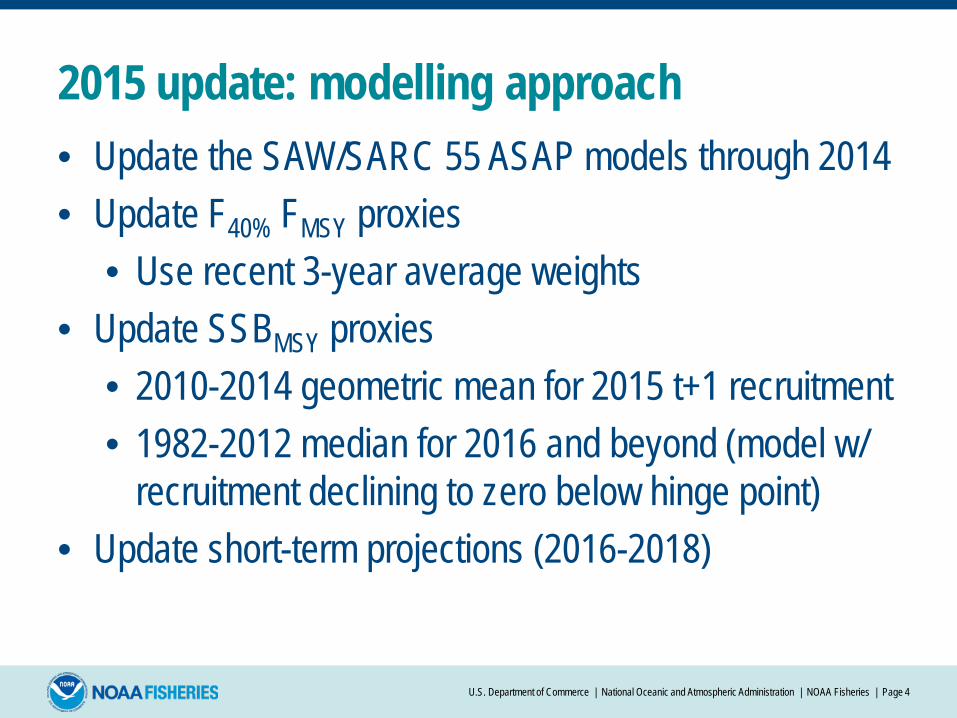
2015 update: modelling approach • Update the SAW/SARC 55 ASAP models through 2014 • Update F40% FMSY proxies
• Use recent 3-year average weights • Update SSBMSY proxies
• 2010-2014 geometric mean for 2015 t+1 recruitment • 1982-2012 median for 2016 and beyond (model w/
recruitment declining to zero below hinge point) • Update short-term projections (2016-2018)
U.S. Department of Commerce | National Oceanic and Atmospheric Administration | NOAA Fisheries | Page 4

2015 update: backup in the event of model failure
• Framework 53 set catch specifications from FY2015-2017
U.S. Department of Commerce | National Oceanic and Atmospheric Administration | NOAA Fisheries | Page 5

The end [Additional info as needed]
U.S. Department of Commerce | National Oceanic and Atmospheric Administration | NOAA Fisheries | Page 6

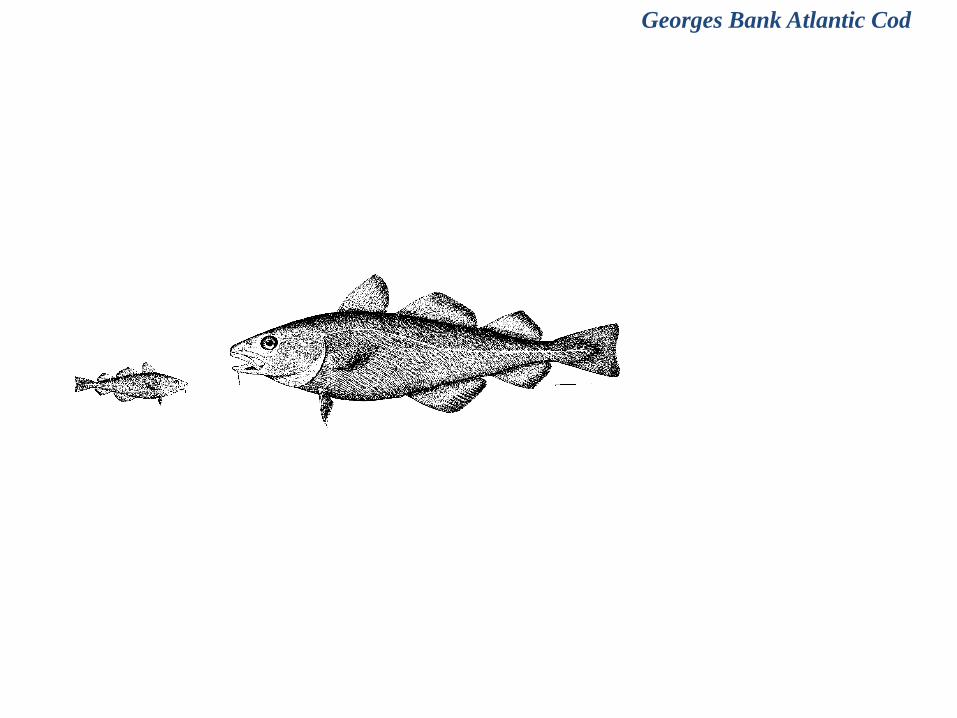
Georges Bank Atlantic Cod
Gadus morhua Loretta O’Brien
2015 Georges Bank cod Assessment Update Assessment Oversight Panel
Woods Hole, Ma.
July 27, 2015

Lead Scientist: Loretta O’Brien Team members: Nina Shepherd, Yanjun Wang (DFO) Last Assessment: SARC 55 Dec 2012; Benchmark ASAP
Update CATCH DATA from 2012-2014:
• US commercial landings – AA tables • US commercial discards – SBRM methodology
• large & small mesh otter trawl, scallop dredge, gillnet • US MRIP recreational landings & discards • CA commercial landings & discards
Update SURVEY DATA
•NEFSC Spring: update to 2015 •DFO February: update to 2015 •NEFSC Autumn: update to 2014
2015 Georges Bank Cod Assessment Update

Georges Bank Atlantic Cod
BIOLOGY
• Update maturity at age; 5 year moving average • No change for natural mortality (M =0.2) or timing of spawning
REFERENCE POINTS
• No change in methodology (F40% ) ; values will be re-estimated

Georges Bank Atlantic Cod
ASSESSMENT
Virtual Population Analysis (VPA)
• Catch-at-age: 1-10+ • Years: 1978-2014 • 3 Surveys • Present standard diagnostics and retrospective analysis • Bootstrap for projections • Apply retrospective adjustment for stock status and catch projections

Georges Bank Atlantic Cod
PROJECTIONS • F2014 ~ status quo, F40%, & 0.75 x F40%
• Recruitment model: two stage CDF, 50,000 mt breakpoint • Retrospective bias: apply 7-yr age-specific rho-adjustment factor
FALLBACK – if updated ASAP not accepted
• Provide average of recent (3 years) quota and/or catches
Georges Bank Atlantic Cod

2015 AOP Panel Meeting
Gulf of Maine haddock Michael Palmer NEFSC
Woods Hole, MA July 27, 2015

SAW/SARC 59 benchmark assessment (2014) • Stock status
• Issues and uncertainties • Generally good model diagnostics • Size of the 2012 year class
U.S. Department of Commerce | National Oceanic and Atmospheric Administration | NOAA Fisheries | Page 2
Assessment Proxy reference points BaseFfull, 2013 0.39 (0.24 - 0.60)FMSY 0.46 (0.36 -0.54)Ffull, 2013/FMSY 0.85Overfishing NoSSB2013 (mt) 4,153 (2,960 - 6,043)SSBMSY (mt) 4,108 (1,774 - 7,861)SSB2013/SSBMSY 1.01Overfished NoMSY (mt) 955 (421 - 1,807)Median age1 recruitment (000s) 1,121 (205 - 6,500)
SAW/SARC 59

2015 update: anticipated challenges
• Update of MRIP catch estimates to reflect data updates (minor)
• Impacts of ASAP likelihood constants on model results (moderate) • Sensitivity run on SAW/SARC 59 model suggest positive rescaling of
recruitment and SSB (4,153 6,130 mt) and negative rescaling of F (0.39 0.26)
• Survey trends suggest that there may have been another large year class spawned
in 2013 • Absolute size of the 2012 and 2013 year classes will be uncertain • Will have minor impact on model SSB and F estimates, but could have
implications for the projections (potentially moderate) • May want to consider carrying forward SAW/SARC 59 sensitivity model that down-
weighted terminal recruitment or consider the uncertainty when setting catch advice (e.g., constant catch)
U.S. Department of Commerce | National Oceanic and Atmospheric Administration | NOAA Fisheries | Page 3

2015 update: modelling approach • Update the SAW/SARC 59 ASAP model • Update F40% FMSY proxy
• Use recent 5-year average weights • Update SSBMSY proxy
• 1977-2014 geometric mean for 2015 t+1 recruitment
• 1977-2012 median for 2016 and beyond • Update short-term projections (2016-2018)
U.S. Department of Commerce | National Oceanic and Atmospheric Administration | NOAA Fisheries | Page 4

2015 update: backup in the event of model failure
• Framework 53 set catch specifications from FY2015-2017
U.S. Department of Commerce | National Oceanic and Atmospheric Administration | NOAA Fisheries | Page 5
The end [Additional info as needed]
U.S. Department of Commerce | National Oceanic and Atmospheric Administration | NOAA Fisheries | Page 6

D. Georges Bank Haddock
Liz Brooks NEFSC
July 27, 2015

Update Existing VPA (Ages 1-9+)
• Add US landings and discards (2011-2014) • Add Canadian landings and discards (2011-2014) • Add 2011-2014 NEFSC Fall BTS (ages 0-5) • Add 2012-2015 NEFSC Spring BTS and DFO Spring
(ages 1-8)

Update Stock Status • 2012 Stock Status:
– Not overfished (SSB2010/SSBMSY= 1.33) – No overfishing (F2010/FMSY=0.46)
• Current Reference Points (based on F40%) • FMSY = 0.39; SSBMSY = 124,900 mt; MSY = 28,000 mt • Will update with recent 5 yr. average biological information
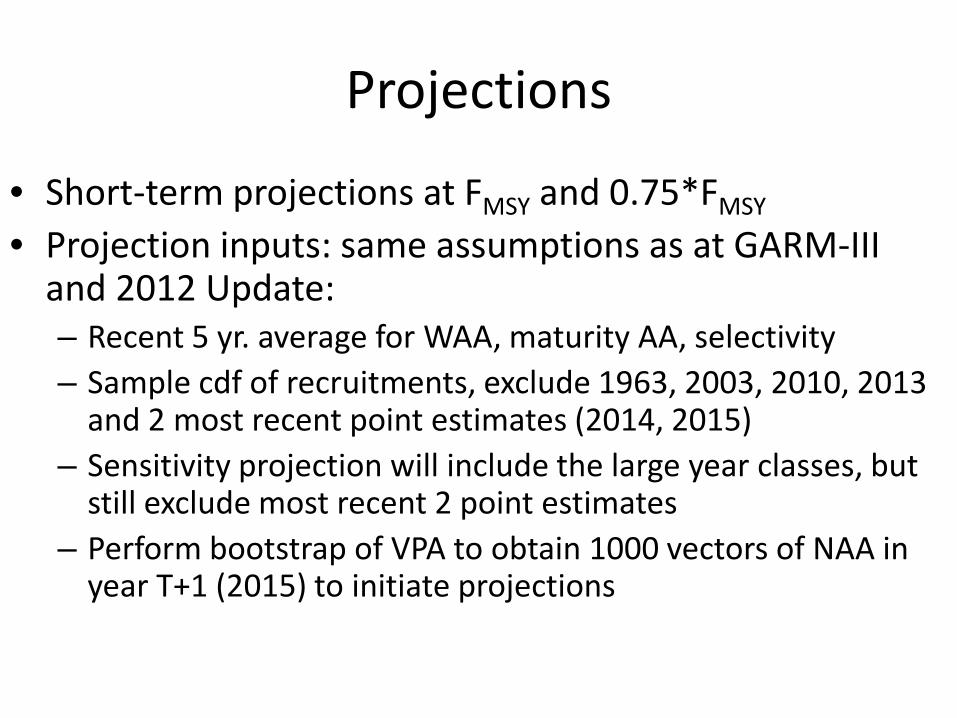
Projections
• Short-term projections at FMSY and 0.75*FMSY • Projection inputs: same assumptions as at GARM-III
and 2012 Update: – Recent 5 yr. average for WAA, maturity AA, selectivity – Sample cdf of recruitments, exclude 1963, 2003, 2010, 2013
and 2 most recent point estimates (2014, 2015) – Sensitivity projection will include the large year classes, but
still exclude most recent 2 point estimates – Perform bootstrap of VPA to obtain 1000 vectors of NAA in
year T+1 (2015) to initiate projections

Fall Back Plan
• No retrospective pattern in last assessment; if retrospective pattern emerges, examine diagnostic and “rho adjust” if appropriate
• If VPA diagnostics not acceptable, use recent average catch
E. Cape Cod-Gulf of Maine Yellowtail Flounder Larry Alade and Chris Legault
2015 Groundfish Operational Assessment Plan Population Dynamics Branch
Northeast Fisheries Science Center
July 27, 2014
Previous 2012 Groundfish update
• Last assessed in the 2012 Groundfish update assessment
• VPA Model (1985-2010); Ages 1-6+ – VPA tuned to six age-specific Surveys:
• NEFSC and Mass DMF (Spring 1-6+; Fall 1-5) • ME/NH surveys (Spring 2-5; Fall 2-4)
– Age and time invariant M = 0.2 – Commercial Catch (landings plus discards)
• Stock Status – Overfished and overfishing occurring

Plan: Update Existing VPA (Ages 1-6+) • Update US landings and discards (2011-2014) • Add NEFSC, Mass DMF, and ME/NH surveys: Spring 2012-2015) and
Fall (2011-2014) – Bigelow length based calibration factors available from peer
review in TRAC 2010 for GB yellowtail – NEFSC survey strata was modified in the last assessment due to
Bigelow depth limitations (Inshore Strata 53 or 68). • Fishery dependent data for years 1994-2010 will be updated to
account for any changes to databases since the last assessment update
• No changes to M, maturity, or timing of spawning • Sensitivity Analyses
– Account for any major revisions in data input for years 1994-2010
Biological reference points and Stock Status
• 2015 Operational Assessment Update – Update Stock Status with 2014 values:
• Current Status: Overfished (SSB2010/SSBMSY= 0.24), Overfishing (F2010/FMSY=1.4)
– Update Biological Reference Points
• Fishing reference points (based on F40%) • Biomass reference points:
– Recruitment (1985-2012 + Hindcast) – 5 yr mean WAA, maturity and selectivity
• Current reference points – FMSY = 0.26; SSBMSY = 7,080 mt; MSY = 1,600 mt

Projections • Short-term projections (Median catch 2016-2018)
– Fstatus quo (F = F2014) – FMSY = F40% (YPR) – 75%FMSY
• CCGOM under rebuilding plan (End date = 2023) – Frebuild (Iterative approach for yrs 2016-2023)
• Projection inputs same assumptions as GARM III = 2012 groundfish assessment update: – Recent 5 yr. average for WAA, maturity AA, selectivity – Sample cdf of recruitments (including hindcast) – Bootstrap VPA to obtain 1000 vectors of NAA in year T+1
(2015) to initiate projections

Fallbacks (only if necessary)
• In the last 2012 GARM assessment update – Fit to the model was improved over GARM III – However there was the emergence of
retrospective pattern • If retrospective pattern continues, apply “SSB
and F rho adjustment” • If model diagnostics further deteriorates with
regards both precision and retrospective bias – Apply recent three year average of catch or quota.
Larry Alade 2015 Groundfish Operational Assessment Plan
Population Dynamics Branch Northeast Fisheries Science Center
July 27, 2014
F. Southern New England-Mid Atlantic Yellowtail Flounder
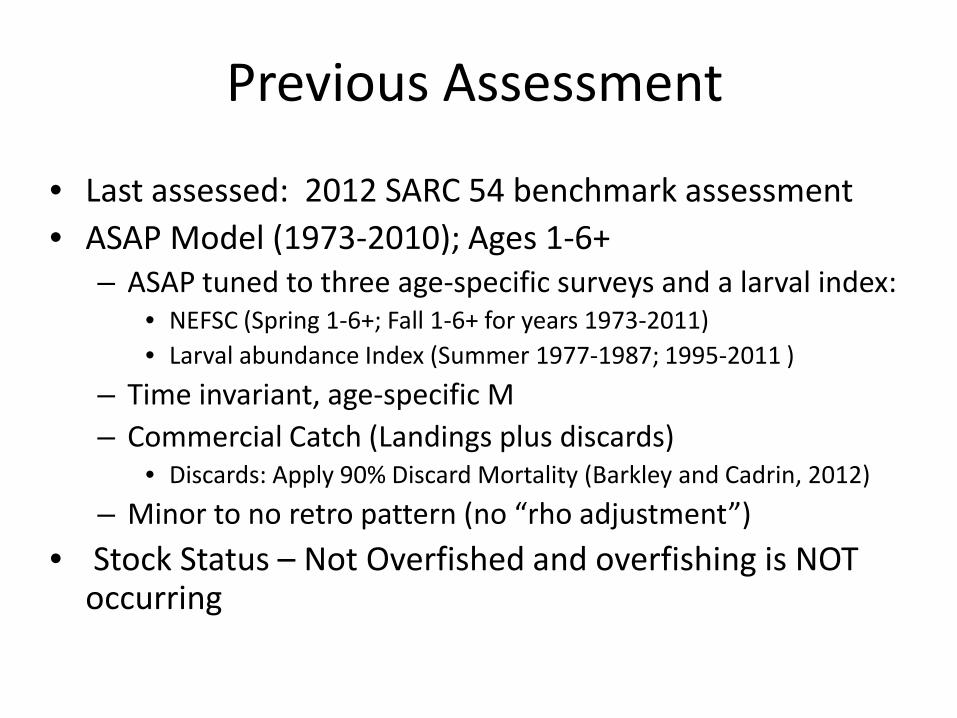
Previous Assessment
• Last assessed: 2012 SARC 54 benchmark assessment • ASAP Model (1973-2010); Ages 1-6+
– ASAP tuned to three age-specific surveys and a larval index: • NEFSC (Spring 1-6+; Fall 1-6+ for years 1973-2011) • Larval abundance Index (Summer 1977-1987; 1995-2011 )
– Time invariant, age-specific M – Commercial Catch (Landings plus discards)
• Discards: Apply 90% Discard Mortality (Barkley and Cadrin, 2012) – Minor to no retro pattern (no “rho adjustment”)
• Stock Status – Not Overfished and overfishing is NOT occurring

Update Existing ASAP model (Ages 1-6+)
• Update US landings and discards (2012-2014) • Add NEFSC, Spring (2012-2015), Fall (2012-2014) and larval
abundance index (2012-2014, and 2015?) – Bigelow length based calibration factors available from peer
review in TRAC 2010 for GB yellowtail • Fishery dependent data for years 1994-2010 will be updated
to account for any changes to databases since the last assessment update
• No changes to M, maturity, or timing of spawning • Sensitivity Analyses
– Account for any major revisions in data input for years 1994-2010

Update Existing Biological Reference Points and Stock Status
• 2015 Operational Assessment Update
– Update Stock Status: • Current status: Not Overfished (SSB2011/SSBMSY= 1.29), and
Overfishing is Not occurring (F2011/FMSY=0.38)
– Update Biological reference points: • Fishing Reference Points (based on F40%) • Biomass reference points:
– Recruitment series (1990-2013) – Recent 5 yr mean WAA, maturity and Selectivity (2010-2014)
• Current reference points: – FMSY = 0.32; SSBMSY = 2,995 mt; MSY = 773 mt
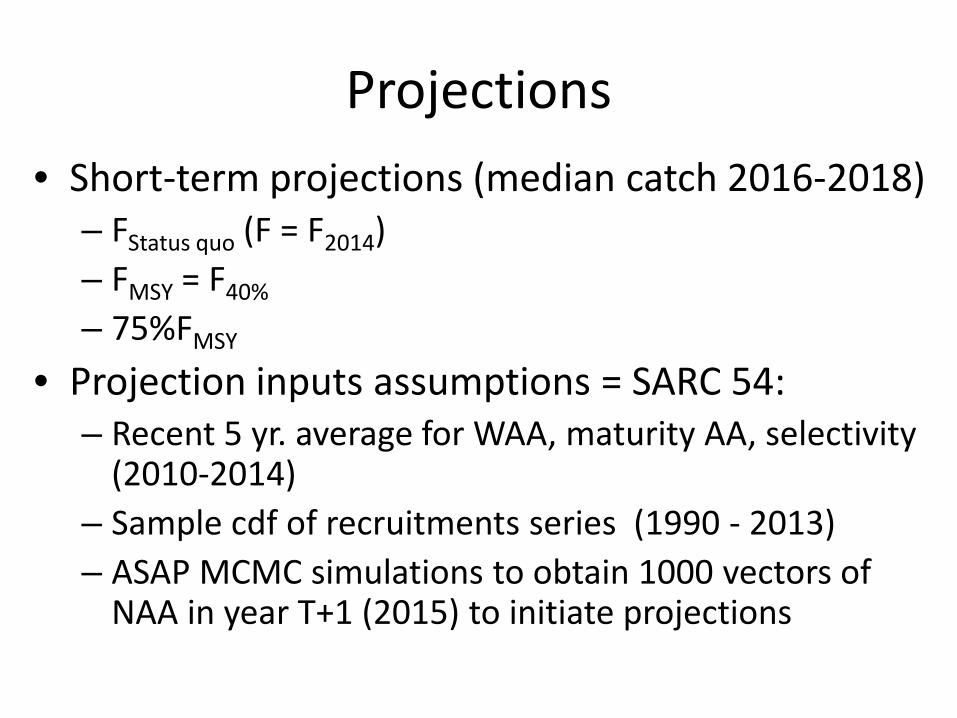
Projections • Short-term projections (median catch 2016-2018)
– FStatus quo (F = F2014) – FMSY = F40%
– 75%FMSY
• Projection inputs assumptions = SARC 54: – Recent 5 yr. average for WAA, maturity AA, selectivity
(2010-2014) – Sample cdf of recruitments series (1990 - 2013) – ASAP MCMC simulations to obtain 1000 vectors of
NAA in year T+1 (2015) to initiate projections

Fallbacks (only if necessary)
• Minimal to no retrospective pattern in last assessment; if retrospective pattern emerges, split surveys or consider “rho adjustment”
• If model diagnostics deteriorates with regards both precision and retrospective bias – Apply recent three year average of catch or quota.

G. GB Winter Flounder Pseudopleuronectes americanus
2015 Operational Stock Assessment Plan by Lisa Hendrickson
Northeast Fisheries Science Center
AOP Meeting July 27,2015

Most recent assessment
U.S. Department of Commerce | National Oceanic and Atmospheric Administration | NOAA Fisheries | Page 2
Type: Operational, Aug. 2014 Model: VPA (1-7+), 1982-2013 Stock Status: Not overfished Overfishing not occurring Important assessment considerations: Rebuilding deadline is 2017 (76% prob. at Freb = 0.27) Since 2006, 2-17% of catch is CA FMSY estimate based on fixed steepness parameter (h = 0.78) Minor F and SSB retros, unadjusted but borderline
542 543

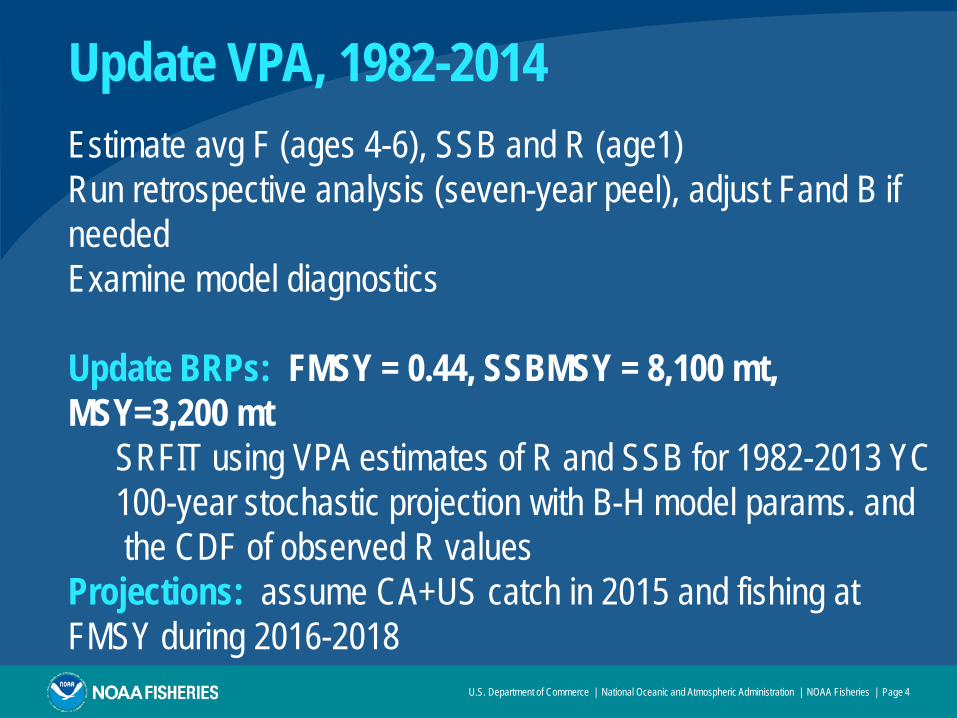
Update VPA, 1982-2014
U.S. Department of Commerce | National Oceanic and Atmospheric Administration | NOAA Fisheries | Page 3
Catch: Add 2014 data US LAA US DAA (small-mesh, lg-mesh and scall dr.) CA landings and scall dr. discards (bump-up US nos.)
Surveys: Indices-at-age, length-based CF to convert HB catches to ALB equivalents NEFSC spring – add 2015 CA spring – add 2015 NEFSC fall – add 2014 (lagged fwd one yr and age)
Biological data: no change in M, maturity-at-age or timing of spawning
Update VPA, 1982-2014
U.S. Department of Commerce | National Oceanic and Atmospheric Administration | NOAA Fisheries | Page 4
Estimate avg F (ages 4-6), SSB and R (age1) Run retrospective analysis (seven-year peel), adjust Fand B if needed Examine model diagnostics Update BRPs: FMSY = 0.44, SSBMSY = 8,100 mt, MSY=3,200 mt SRFIT using VPA estimates of R and SSB for 1982-2013 YC 100-year stochastic projection with B-H model params. and the CDF of observed R values Projections: assume CA+US catch in 2015 and fishing at FMSY during 2016-2018

Fallback Plan
U.S. Department of Commerce | National Oceanic and Atmospheric Administration | NOAA Fisheries | Page 5
1. AIM 2. Expand survey biomass indices to population biomass
using assumed q if AIM fails
NEFSC
Assessment Oversight Panel Multispecies Groundfish Updates
Southern New England Winter Flounder Pseudopleuronectes americanus
July 27th 2015
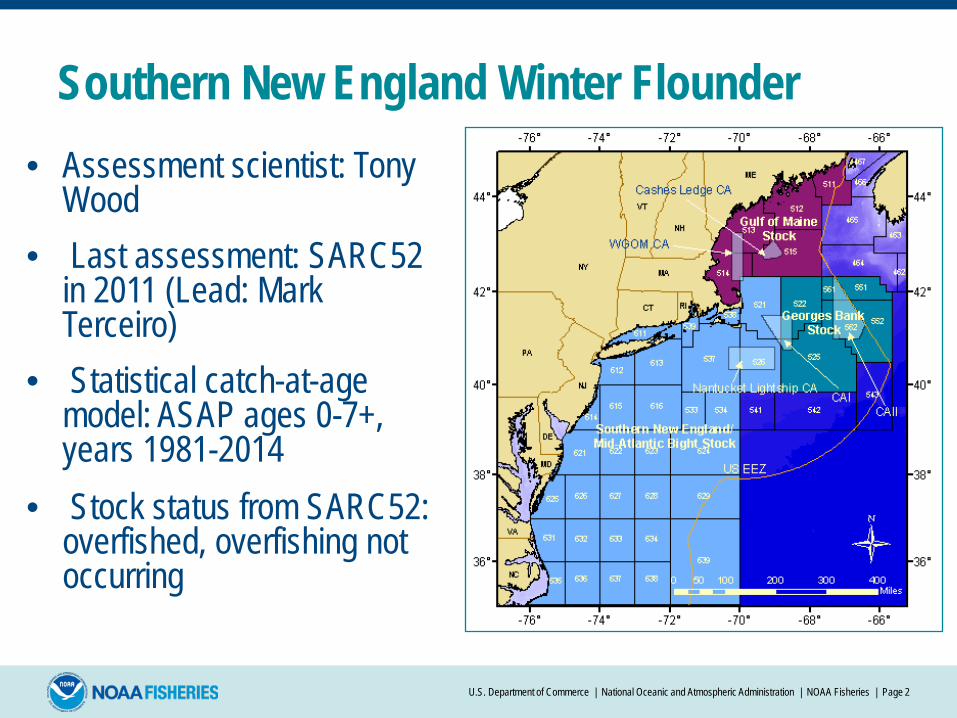
Southern New England Winter Flounder • Assessment scientist: Tony
Wood
• Last assessment: SARC52 in 2011 (Lead: Mark Terceiro)
• Statistical catch-at-age model: ASAP ages 0-7+, years 1981-2014
• Stock status from SARC52: overfished, overfishing not occurring
U.S. Department of Commerce | National Oceanic and Atmospheric Administration | NOAA Fisheries | Page 2
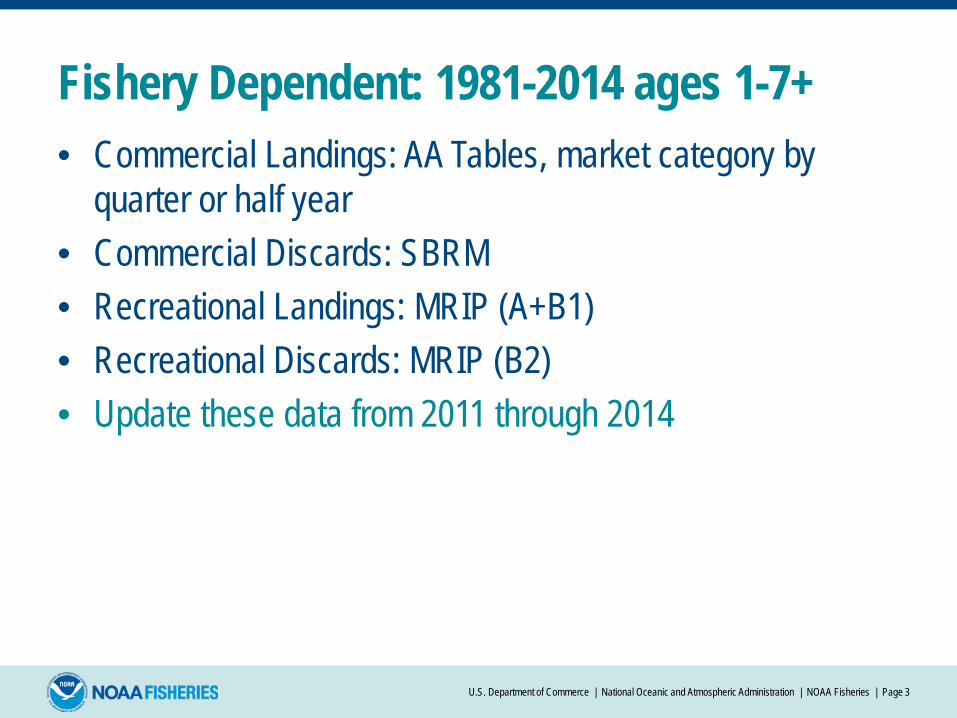
Fishery Dependent: 1981-2014 ages 1-7+ • Commercial Landings: AA Tables, market category by
quarter or half year • Commercial Discards: SBRM • Recreational Landings: MRIP (A+B1) • Recreational Discards: MRIP (B2) • Update these data from 2011 through 2014
U.S. Department of Commerce | National Oceanic and Atmospheric Administration | NOAA Fisheries | Page 3

Fishery Independent: 1981-2014 ages 0-7+ • NEFSC winter, spring, and fall • MADMF spring • RIDMF spring • CTDEP spring • NJDFW ocean and river • Recruits: MADMF, RIDFW, CTDEP, NYDEC (ages 0-2) • NEW at SARC52: URIGSO, NEAMAP • Update these data from 2011 through 2014
U.S. Department of Commerce | National Oceanic and Atmospheric Administration | NOAA Fisheries | Page 4

Biology • M = 0.3 • Maturity: MADMF Spring survey data provide maturity
information • Data from 1982-2008 used in SAW52 • Age 1: 0%, Age 2: 8%, Age 3: 56%, Age 4: 95% Age 5+: 100%
• Retain these values for 2015 update assessment
U.S. Department of Commerce | National Oceanic and Atmospheric Administration | NOAA Fisheries | Page 5
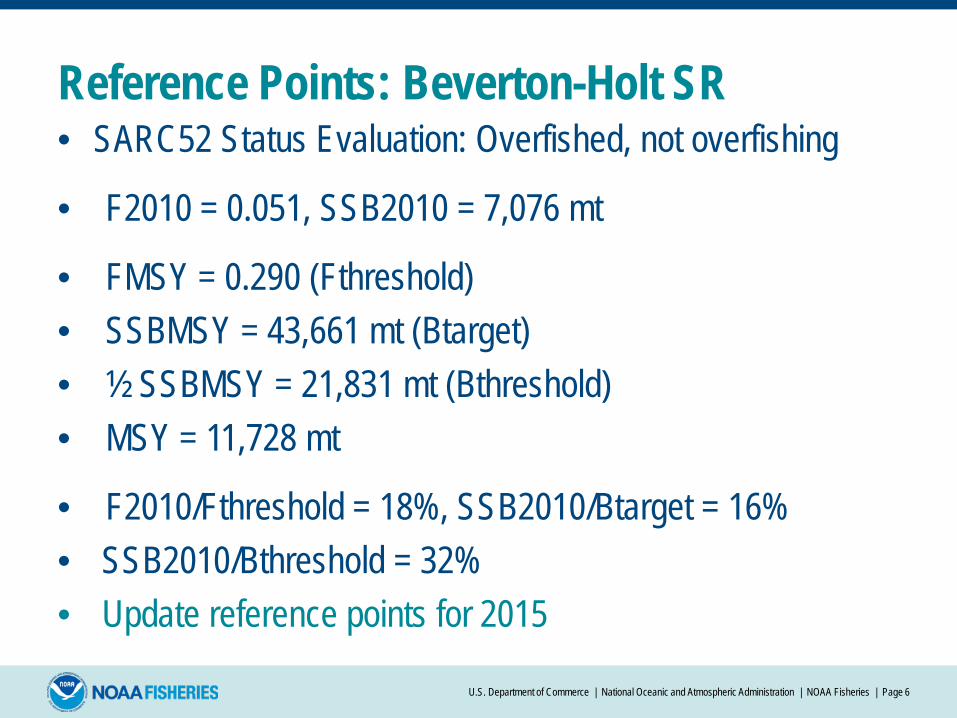
Reference Points: Beverton-Holt SR • SARC52 Status Evaluation: Overfished, not overfishing
• F2010 = 0.051, SSB2010 = 7,076 mt
• FMSY = 0.290 (Fthreshold) • SSBMSY = 43,661 mt (Btarget) • ½ SSBMSY = 21,831 mt (Bthreshold) • MSY = 11,728 mt
• F2010/Fthreshold = 18%, SSB2010/Btarget = 16% • SSB2010/Bthreshold = 32% • Update reference points for 2015
U.S. Department of Commerce | National Oceanic and Atmospheric Administration | NOAA Fisheries | Page 6

Sensitivities, Projections, and Fallback • Sensitivities:
• different values for M carried over from SARC52 • profile over fixed steepness • different reference points (F40% from SARC52)
• Projections: Assume catch taken in 2015, project 2016-2018 at FMSY, F2014, and F = 0
• Fallback: Recent average catch or expand survey biomass using assumed q
U.S. Department of Commerce | National Oceanic and Atmospheric Administration | NOAA Fisheries | Page 7

2015 Acadian Redfish Operational Assessment
Assessment Oversight Panel Meeting NORTHEAST FISHERIES SCIENCE CENTER
Woods Hole, MA July 27, 2015

Data Inputs • Previous assessment: 2012 operational assessment • Years: 1913-2014 • Ages: 1-26+ • Number of fleets: 1
• Commercial fishery • Number of surveys: 2
• NMFS spring bottom trawl survey • NMFS fall bottom trawl survey
U.S. Department of Commerce | National Oceanic and Atmospheric Administration | NOAA Fisheries | Page 2
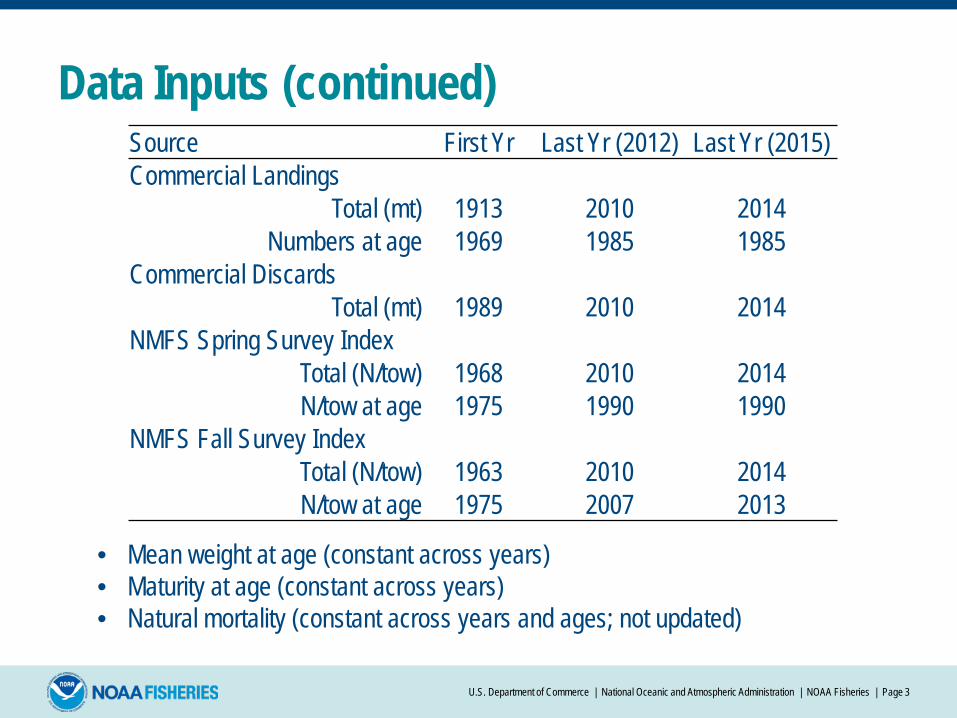
Data Inputs (continued) Source First Yr Last Yr (2012) Last Yr (2015) Commercial Landings
Total (mt) 1913 2010 2014 Numbers at age 1969 1985 1985
Commercial Discards Total (mt) 1989 2010 2014
NMFS Spring Survey Index Total (N/tow) 1968 2010 2014 N/tow at age 1975 1990 1990
NMFS Fall Survey Index Total (N/tow) 1963 2010 2014 N/tow at age 1975 2007 2013
U.S. Department of Commerce | National Oceanic and Atmospheric Administration | NOAA Fisheries | Page 3
• Mean weight at age (constant across years) • Maturity at age (constant across years) • Natural mortality (constant across years and ages; not updated)

Assessment Approach • Assessment model: ASAP
• Flat-topped fishery and survey selectivity patterns • Fishery selectivity time blocks: 1 • Ramp down recruitment CVs for recent year(s) without age data
• Forecast model: AgePro • Forecast years: 2015-2018 • 2015 preliminary catch estimate to be provided by GARFO • Forecast F: FMSY proxy of F50%
• Alternative approach: Base management advice on an analysis of recent catches and quotas
U.S. Department of Commerce | National Oceanic and Atmospheric Administration | NOAA Fisheries | Page 4
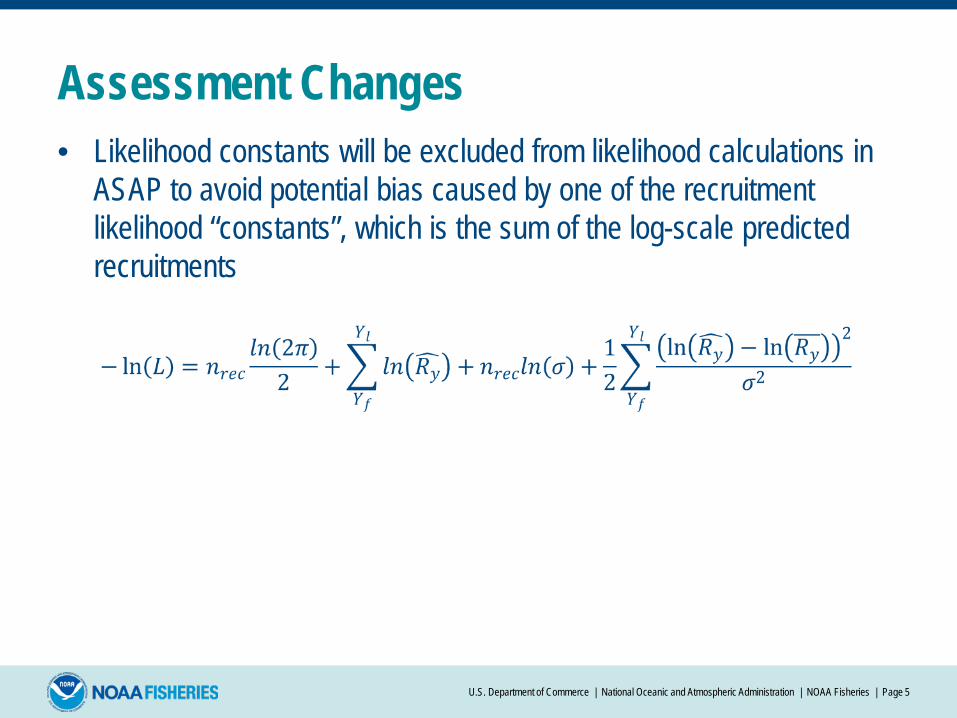
Assessment Changes • Likelihood constants will be excluded from likelihood calculations in
ASAP to avoid potential bias caused by one of the recruitment likelihood “constants”, which is the sum of the log-scale predicted recruitments
U.S. Department of Commerce | National Oceanic and Atmospheric Administration | NOAA Fisheries | Page 5

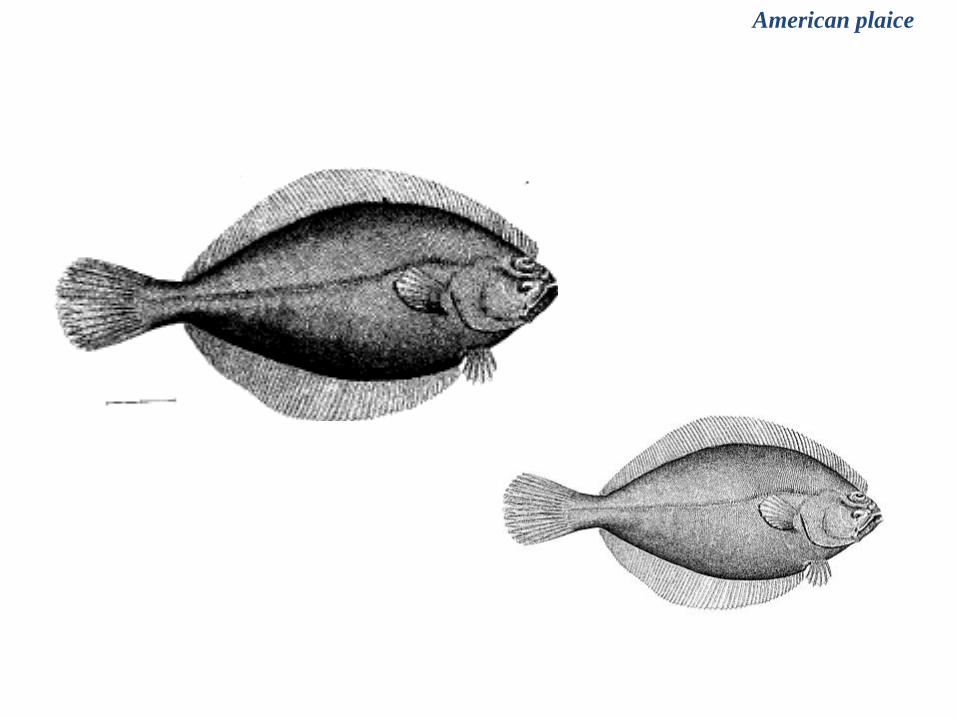
Gulf of Maine -Georges Bank American Plaice
Hippoglossoides platessoides Loretta O’Brien
September 2015 Assessment Update Assessment Oversight Panel
Woods Hole, Ma.
July 27, 2015

Lead Scientist: Loretta O’Brien Team members: Josh Dayton Last Assessment: Feb. 2012 Update ; VPA
Update CATCH DATA through 2014:
• US commercial landings – AA tables • US commercial discards – SBRM methodology
• large & small mesh otter trawl, northern shrimp trawl • CA commercial landings
2015 American Plaice Assessment Update
Update SURVEY DATA
• NEFSC Spring: update through 2015 (all data in Alb IV units) • NEFSC Autumn: update through 2014 (all data in Alb IV units)
• MADMF Spring: update through 2015 • MADMF Autumn: update through 2014

ASSESSMENT
•Virtual Population Analysis (VPA) • Catch-at-age: 1-11+ • Years: 1980-2014 • 4 Surveys • Present standard diagnostics and retrospective analysis • Retrospective rho-adjustment : 7-yr peel, as in Feb. 2012 • Stock status and catch projections determined by rho-adjustment for SSB and F
American plaice

BIOLOGY
• Update maturity at age; 5 year moving average • No change for natural mortality (M =0.2) or timing of spawning
REFERENCE POINTS
• No change from Feb. 2012 methodology (F40%) ; update values
American plaice

PROJECTIONS • F2014 ~ status quo, F40%, lower of Frebuild or 0.75(F40%) • Recruitment model: empirical CDF • Retrospective bias: apply 7-yr age-specific rho-adjustment factor
FALLBACK – if updated VPA not accepted
• Provide average of recent (3 years) quota and/or catches
American plaice
American plaice

Lead Scientists: Susan Wigley Team members: Sarah Emery Last Assessment: 2012 Operational Assessment
Catch US Commercial Landings: Update 2010, add 2011-2014, from AA tables US Commercial Discards: Update 2010, add 2011- 2014, SBRM approach by gear type (large mesh otter trawl, small mesh otter trawl, and shrimp trawl US Recreational Landings and Discards: N/A Foreign Landings and Discards: N/A
K. Proposed Update for WITCH FLOUNDER
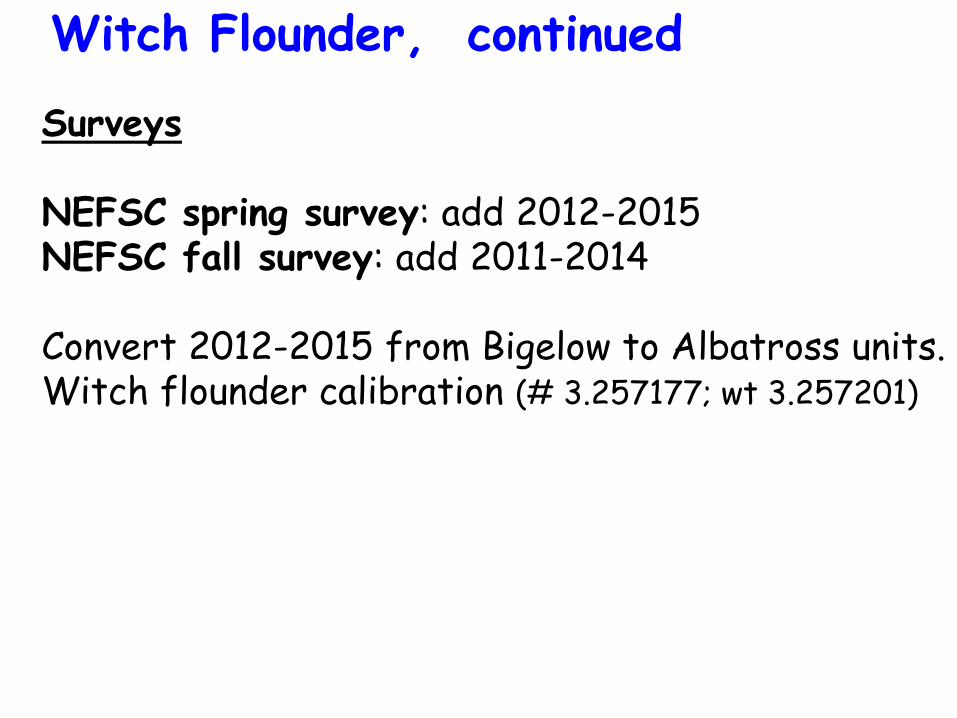
Witch Flounder, continued
Surveys NEFSC spring survey: add 2012-2015 NEFSC fall survey: add 2011-2014 Convert 2012-2015 from Bigelow to Albatross units. Witch flounder calibration (# 3.257177; wt 3.257201)

Witch Flounder, continued
Biology No changes from 2012 Operational Assessment values for natural mortality (0.15) or time of spawning Update annual maturity at age (use annual ogives based on NEFSC spring 5-yr pooled data thru Spring 2015) Reference Points No changes from 2012 Operational Assessment values F40%=0.20, SSBmsy=11,447 mt, MSY=2,352 mt
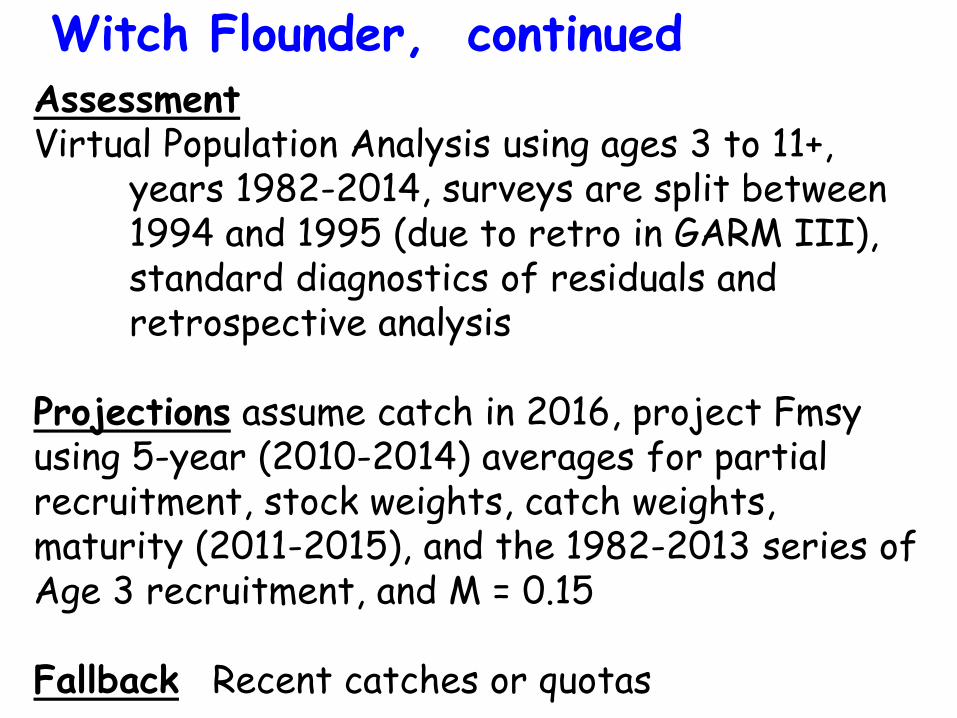
Witch Flounder, continued
Assessment Virtual Population Analysis using ages 3 to 11+, years 1982-2014, surveys are split between 1994 and 1995 (due to retro in GARM III), standard diagnostics of residuals and retrospective analysis Projections assume catch in 2016, project Fmsy using 5-year (2010-2014) averages for partial recruitment, stock weights, catch weights, maturity (2011-2015), and the 1982-2013 series of Age 3 recruitment, and M = 0.15 Fallback Recent catches or quotas
White Hake Plan
Kathy Sosebee and Michele Traver Northeast Fisheries Science Center
July 27, 2015

Previous Assessment – SAW 56 • ASAP • 1963-2011 • CAA 1989-2011 • Survey CAA 1963-2011
• Pooled ALKS for 1963-1981, autumn 2003 • Fmsyproxy = F40=0.2 • SSBmsyproxy = 32,400 mt • SSB2011 = 26877, F2011 = 0.13 • Not overfished, no overfishing
U.S. Department of Commerce | National Oceanic and Atmospheric Administration | NOAA Fisheries | Page 2
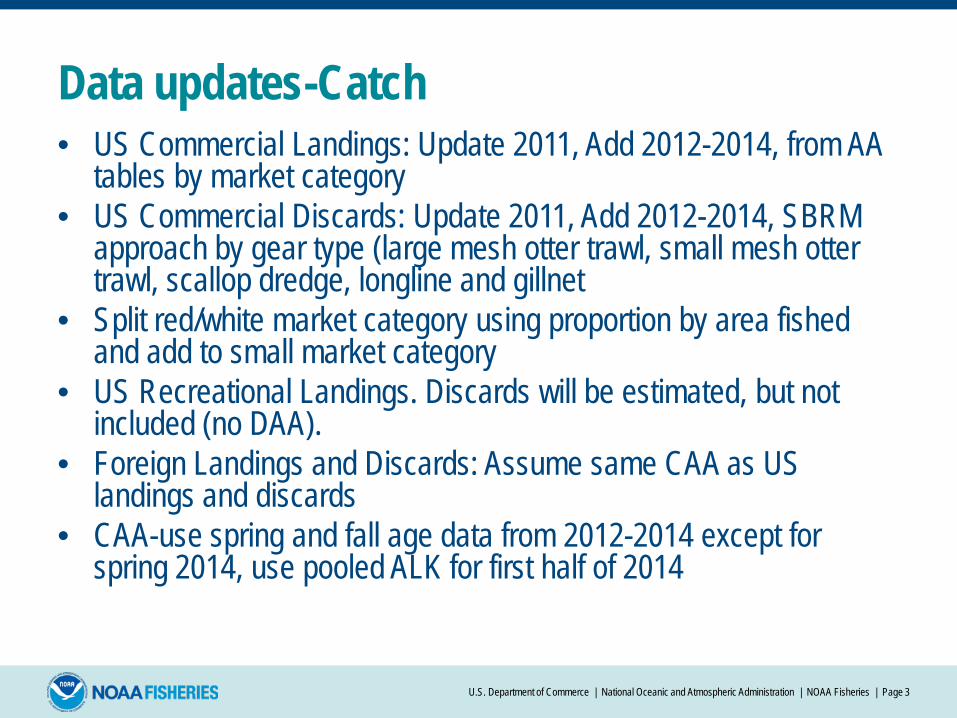
Data updates-Catch • US Commercial Landings: Update 2011, Add 2012-2014, from AA
tables by market category • US Commercial Discards: Update 2011, Add 2012-2014, SBRM
approach by gear type (large mesh otter trawl, small mesh otter trawl, scallop dredge, longline and gillnet
• Split red/white market category using proportion by area fished and add to small market category
• US Recreational Landings. Discards will be estimated, but not included (no DAA).
• Foreign Landings and Discards: Assume same CAA as US landings and discards
• CAA-use spring and fall age data from 2012-2014 except for spring 2014, use pooled ALK for first half of 2014
U.S. Department of Commerce | National Oceanic and Atmospheric Administration | NOAA Fisheries | Page 3

Data updates-Survey • NEFSC spring survey: Update 2013-2015
• CAA update 2012-2013 with annual ALKS 2014 with pooled
• NEFSC fall survey: Update 2012-2014 • CAA update 2012-2014 with annual ALKs
U.S. Department of Commerce | National Oceanic and Atmospheric Administration | NOAA Fisheries | Page 4

Assessment model- ASAP • Total catch - 1963-2014 • CAA 1989-2014, second half of 2003 and first half
of 2014 pooled • fall survey CAA 1963-2014, 1963-1981 and 2003
pooled • spring survey CAA 1968-2014, 1968-1981 and 2014
pooled • surveys are not split
U.S. Department of Commerce | National Oceanic and Atmospheric Administration | NOAA Fisheries | Page 5

Reference Points • Update F40 with updated weights and maturities • Run 100-year projections with resampling from
empirical CDF of recruitments from 1963-2012.
U.S. Department of Commerce | National Oceanic and Atmospheric Administration | NOAA Fisheries | Page 6

Projections • Assume catch in 2015 TBD • Project Fmsy for years 2016-2018 • Resample from empirical CDF of recruitments from
1995-2012.
U.S. Department of Commerce | National Oceanic and Atmospheric Administration | NOAA Fisheries | Page 7
Plan B • Catch for 2016 as in Framework 51 – OFL 6314,
ABC 4645, ACL 4420
U.S. Department of Commerce | National Oceanic and Atmospheric Administration | NOAA Fisheries | Page 8
2015 Pollock Operational Assessment
Assessment Oversight Panel Meeting NORTHEAST FISHERIES SCIENCE CENTER
Woods Hole, MA July 27, 2015
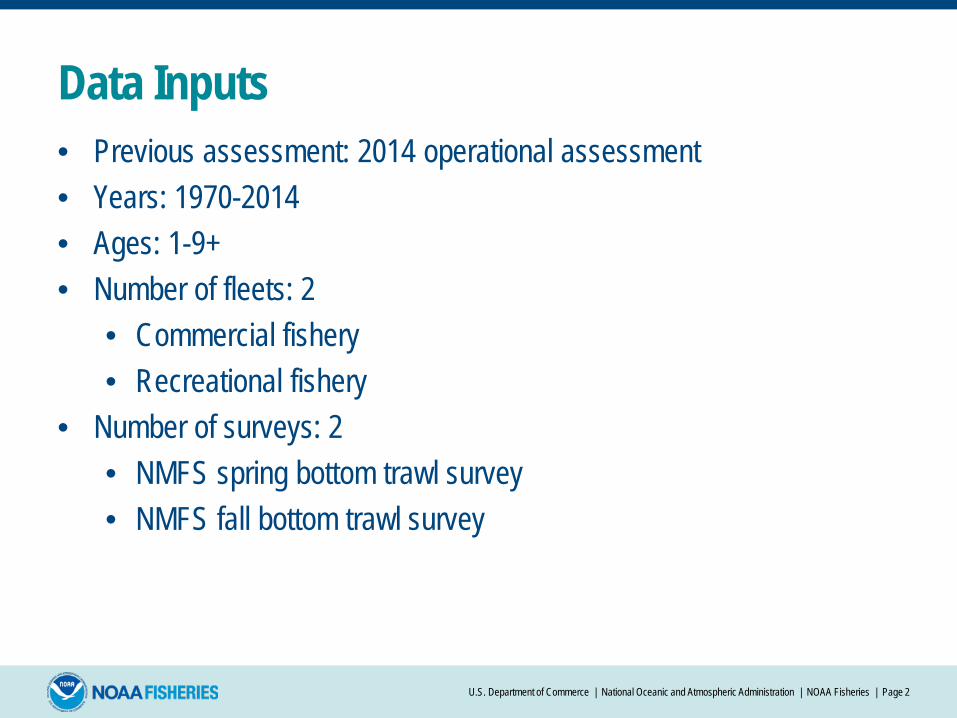
Data Inputs • Previous assessment: 2014 operational assessment • Years: 1970-2014 • Ages: 1-9+ • Number of fleets: 2
• Commercial fishery • Recreational fishery
• Number of surveys: 2 • NMFS spring bottom trawl survey • NMFS fall bottom trawl survey
U.S. Department of Commerce | National Oceanic and Atmospheric Administration | NOAA Fisheries | Page 2
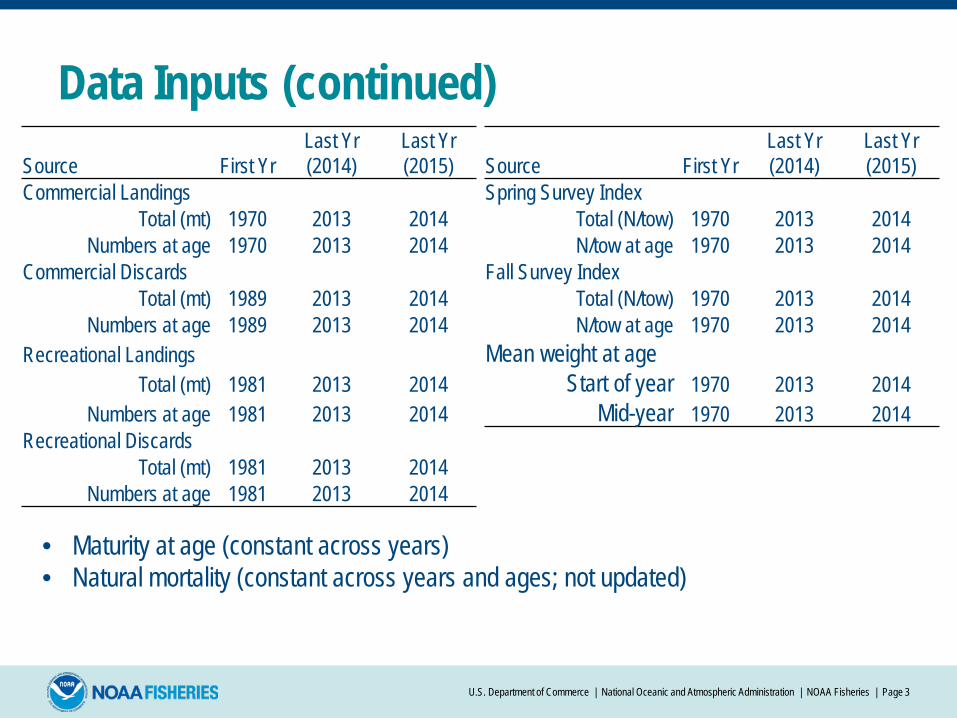
Data Inputs (continued)
U.S. Department of Commerce | National Oceanic and Atmospheric Administration | NOAA Fisheries | Page 3
Source First Yr Last Yr (2014)
Last Yr (2015) Source First Yr
Last Yr (2014)
Last Yr (2015)
Commercial Landings Spring Survey Index Total (mt) 1970 2013 2014 Total (N/tow) 1970 2013 2014
Numbers at age 1970 2013 2014 N/tow at age 1970 2013 2014 Commercial Discards Fall Survey Index
Total (mt) 1989 2013 2014 Total (N/tow) 1970 2013 2014 Numbers at age 1989 2013 2014 N/tow at age 1970 2013 2014
Recreational Landings Mean weight at age Total (mt) 1981 2013 2014 Start of year 1970 2013 2014
Numbers at age 1981 2013 2014 Mid-year 1970 2013 2014 Recreational Discards
Total (mt) 1981 2013 2014 Numbers at age 1981 2013 2014
• Maturity at age (constant across years) • Natural mortality (constant across years and ages; not updated)

Assessment Approach • Assessment model: ASAP
• Dome-shaped fishery and survey selectivity patterns • Commercial fleet selectivity time blocks: 4 • Recreational fleet selectivity time blocks: 3 • Sensitivity run with flat-topped survey selectivity patterns
• Forecast model: AgePro • Forecast years: 2015-2018 • 2015 preliminary catch estimate to be provided by GARFO • Forecast F: FMSY proxy of F40%
• Alternative approach: Base management advice on an analysis of recent catches and quotas
U.S. Department of Commerce | National Oceanic and Atmospheric Administration | NOAA Fisheries | Page 4

Assessment Changes • Likelihood constants will be excluded from likelihood calculations in
ASAP to avoid potential bias caused by one of the recruitment likelihood “constants”, which is the sum of the log-scale predicted recruitments
U.S. Department of Commerce | National Oceanic and Atmospheric Administration | NOAA Fisheries | Page 5
Proposed Update for Atlantic Wolffish
Lead Scientist: Charles Adams Team Member: Paul Nitschke
Last Assessed: 2012 Operational Assessment
NEFSC
July 27, 2015
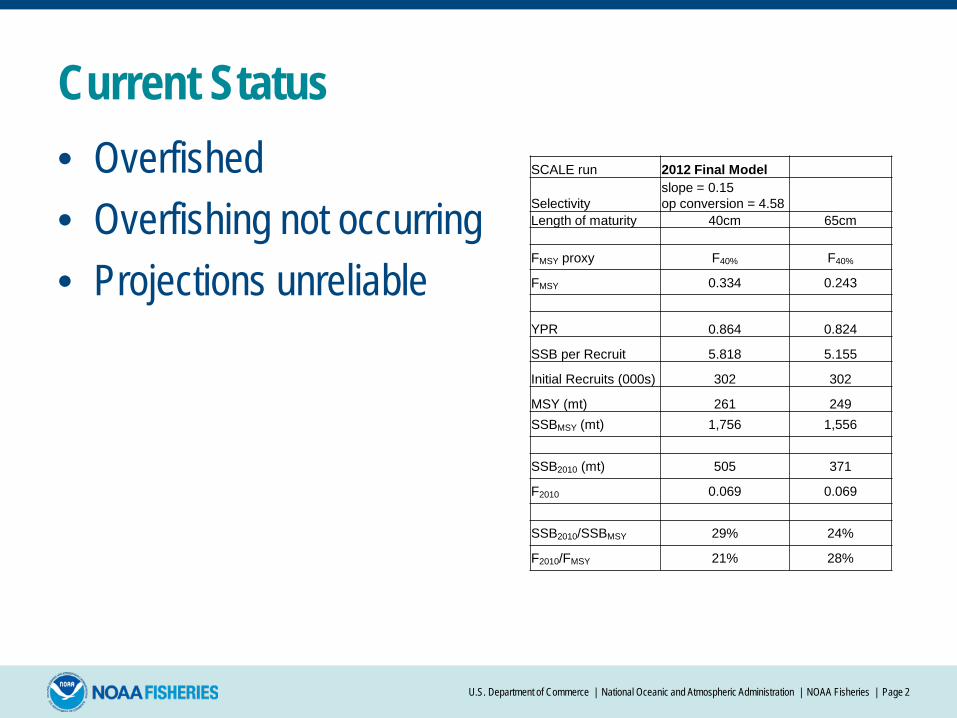
Current Status • Overfished • Overfishing not occurring • Projections unreliable
U.S. Department of Commerce | National Oceanic and Atmospheric Administration | NOAA Fisheries | Page 2
SCALE run 2012 Final Model
Selectivity slope = 0.15 op conversion = 4.58
Length of maturity 40cm 65cm FMSY proxy F40% F40%
FMSY 0.334 0.243
YPR 0.864 0.824
SSB per Recruit 5.818 5.155
Initial Recruits (000s) 302 302
MSY (mt) 261 249 SSBMSY (mt) 1,756 1,556 SSB2010 (mt) 505 371
F2010 0.069 0.069 SSB2010/SSBMSY 29% 24%
F2010/FMSY 21% 28%

Assessment Plan • Statistical Catch at Length (SCALE) model
• Forward projecting age-structured model tuned with • Total catch (mt) • Catch at length (port samples/NEFOP) • Recruitment at age 1 (1-7 cm spring NEFSC survey) • Survey indices of abundance of the larger/older fish (40+ cm) • Survey length frequency distributions
• Used in 2008 DPSWG & 2012 Operational Assessment
U.S. Department of Commerce | National Oceanic and Atmospheric Administration | NOAA Fisheries | Page 3

Assessment Plan
U.S. Department of Commerce | National Oceanic and Atmospheric Administration | NOAA Fisheries | Page 4
Input data Parameters Update Status General Data Years: 1968-2014
Ages: 30 Maximum Length: 145 1 Selectivity Block 1 Recruitment Index 3 Adult Indices 1 Survey with LF (Spring NEFSC)
Biological Mean Lengths at Age Same as 2008 assessment; modified growth from Nelson & Ross (1992) Natural Mortality Same as 2008 assessment Length-Weight Parameters update with 2011-2014 data Catch Length Frequency Observed Catch LF Distributions Same as 2012 update; new data for 2011-2014 using observed kept/discard LF Fishery Data Total Catch in Weight (mt) Corrected sum of catch for 1968-2010; new data for 2011-2014; MRIP calibration Recruitment Same as 2008 assessment Recruitment Indices NEFSC Spring Age 1 Same as 2012 update; no new data for 2011-2014 Adult Indices NEFSC Spring 40+ Same as 2012 update; new data for 2012-2014; no new data for 2011 MADMF Spring 40+ Same as 2012 update; new data for 2012; no new data for 2011, 2013-2014 NEFSC Fall 40+ Same as 2012 update; new data for 2011-2012, 2014; no new data for 2013 Survey Length Frequency Observed LF Distribution Same as 2012 update; new data for 2012-2014; no new data for 2011 Selectivity Selectivity Bounds Same as 2008 assessment Parameter Estimation Same as 2008 assessment

Backup Plan • Depletion Corrected Average Catch (DCAC) model
• Estimates sustainable yields for data-poor fisheries • 2008 Data Poor Stocks WG thought that results from the
DCAC model corresponded well with SCALE model results
• An Index Method (AIM) model • Can be used to construct BRPs based on relative
abundance indices and catches
U.S. Department of Commerce | National Oceanic and Atmospheric Administration | NOAA Fisheries | Page 5

Slide Title • List item 1
• List item 2
U.S. Department of Commerce | National Oceanic and Atmospheric Administration | NOAA Fisheries | Page 6

Assessment plan 2015 Atlantichalibut
Dan Hennen
NEFSC
July 20, 2015
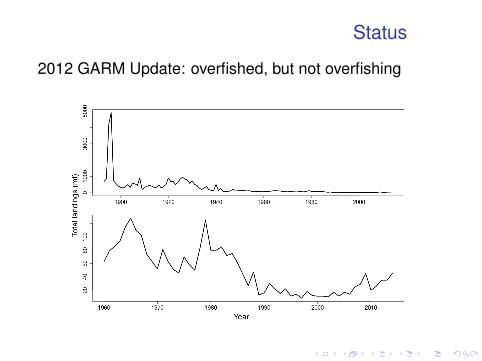
Status
2012 GARM Update: overfished, but not overfishing
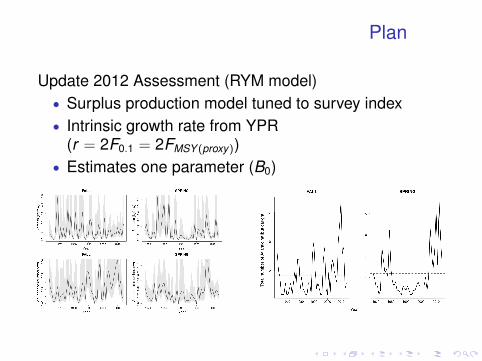
Plan
Update 2012 Assessment (RYM model)• Surplus production model tuned to survey index• Intrinsic growth rate from YPR
(r = 2F0.1 = 2FMSY (proxy))• Estimates one parameter (B0)
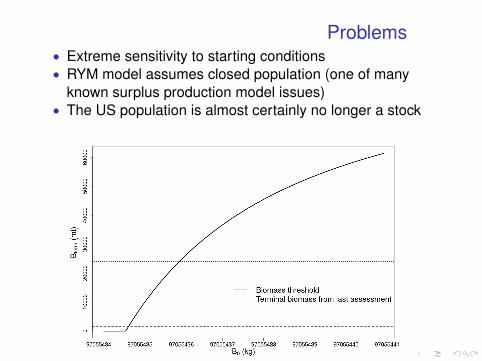
Problems• Extreme sensitivity to starting conditions• RYM model assumes closed population (one of many
known surplus production model issues)• The US population is almost certainly no longer a stock

Alternative
• Status quo regulations (1 fish per trip)
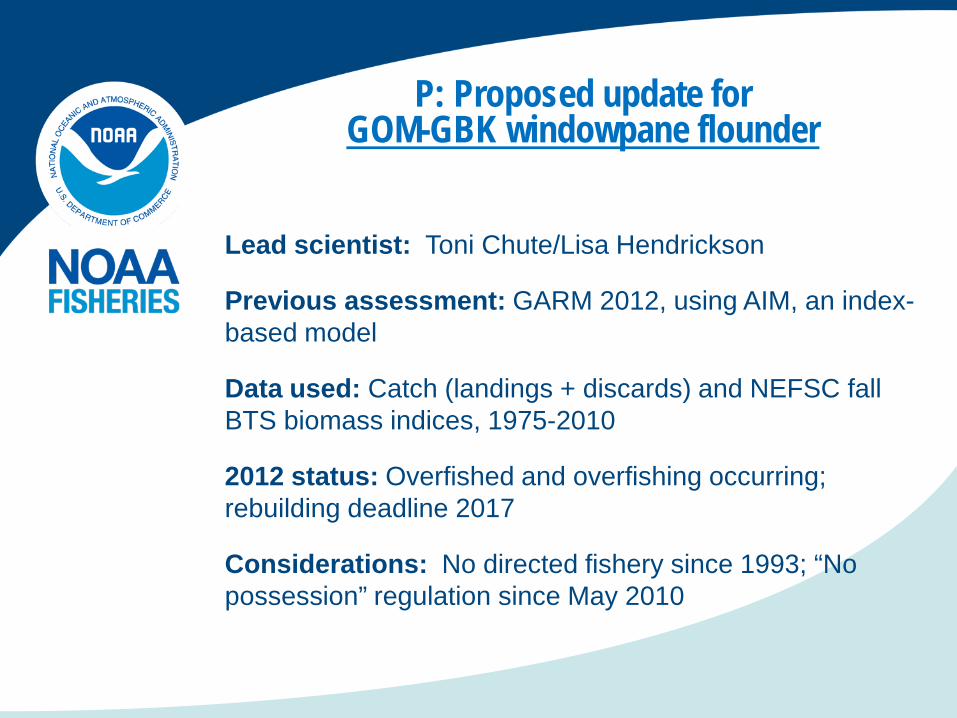
P: Proposed update for GOM-GBK windowpane flounder
Lead scientist: Toni Chute/Lisa Hendrickson
Previous assessment: GARM 2012, using AIM, an index-based model
Data used: Catch (landings + discards) and NEFSC fall BTS biomass indices, 1975-2010
2012 status: Overfished and overfishing occurring; rebuilding deadline 2017
Considerations: No directed fishery since 1993; “No possession” regulation since May 2010


2015 assessment
• Model: AIM
Input data: 1975-2014
• US commercial landings: Add 2011-2014 from AA tables
• US commercial discards: Use NE 2012 discard estimates (large mesh bottom trawl, small mesh bottom trawl, limited access scallop dredges/trawls), assume 100% discard mortality; add new estimates for 2011-2014
• No recreational landings or discards; Canadian landings and discards not available
• NEFSC fall survey: Add 2011-2014 biomass indices converted from Bigelow to Albatross units using calibration factors from Miller et al. (2010)
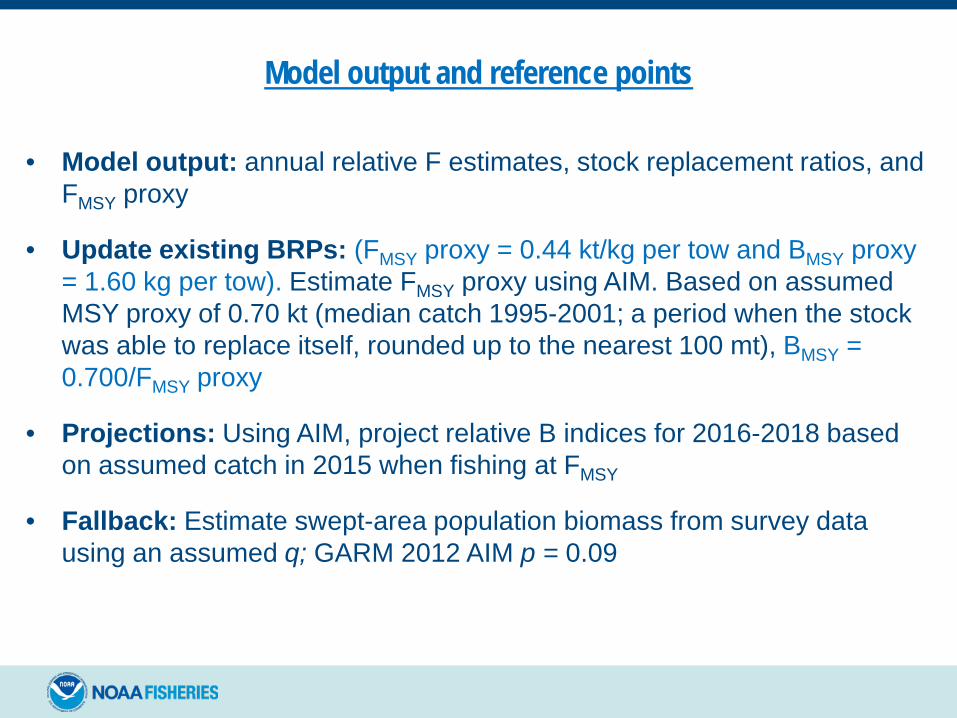
Model output and reference points
• Model output: annual relative F estimates, stock replacement ratios, and FMSY proxy
• Update existing BRPs: (FMSY proxy = 0.44 kt/kg per tow and BMSY proxy = 1.60 kg per tow). Estimate FMSY proxy using AIM. Based on assumed MSY proxy of 0.70 kt (median catch 1995-2001; a period when the stock was able to replace itself, rounded up to the nearest 100 mt), BMSY = 0.700/FMSY proxy
• Projections: Using AIM, project relative B indices for 2016-2018 based on assumed catch in 2015 when fishing at FMSY
• Fallback: Estimate swept-area population biomass from survey data using an assumed q; GARM 2012 AIM p = 0.09

Q: Proposed update for SNE-MAB windowpane flounder
Lead scientist: Toni Chute/Lisa Hendrickson
Previous assessment: GARM 2012, using AIM, an index-based model
Data used: Catch (landings + discards), NEFSC fall bottom trawl survey index through 2010
2012 status: Not overfished and overfishing was not occurring; rebuilding goal was 2014, rebuilt by 2010
Considerations: No possession regulation since May 2010

2015 assessment
Model: AIM
Model input (1975-2014)
• US commercial landings: Add 2011-2014 from AA tables
• US commercial discards: Use GARM 2012 discard estimates (large mesh bottom trawl, small mesh bottom trawl, limited access scallop dredges/trawls), assume 100% discard mortality; add new estimates from 2011-2014
• No recreational or foreign landings or discards
• NEFSC fall survey: Add 2011-2014 indices converted from Bigelow to Albatross units using calibration factors from Miller et al. (2010)
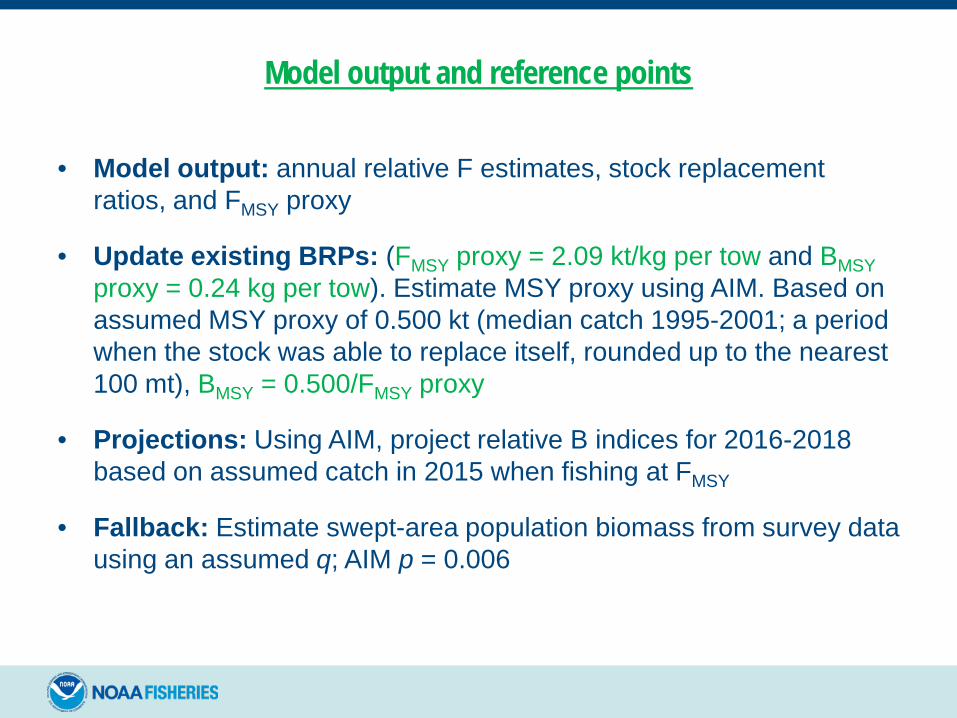
Model output and reference points
• Model output: annual relative F estimates, stock replacement ratios, and FMSY proxy
• Update existing BRPs: (FMSY proxy = 2.09 kt/kg per tow and BMSY proxy = 0.24 kg per tow). Estimate MSY proxy using AIM. Based on assumed MSY proxy of 0.500 kt (median catch 1995-2001; a period when the stock was able to replace itself, rounded up to the nearest 100 mt), BMSY = 0.500/FMSY proxy
• Projections: Using AIM, project relative B indices for 2016-2018 based on assumed catch in 2015 when fishing at FMSY
• Fallback: Estimate swept-area population biomass from survey data using an assumed q; AIM p = 0.006

R. Proposed Update for OCEAN POUT Lead Scientists: Susan Wigley Team members: TBD Last Assessment: 2012 Operational Assessment
Catch US Commercial Landings: Update 2010, Add 2011-2014, from AA tables
No possession after May 1, 2010 US Commercial Discards: Update 2010, Add 2011-2014, SBRM approach by gear type (large mesh otter trawl, small mesh otter trawl, scallop dredge, and gillnet) US Recreational Landings and Discards: N/A Foreign Landings and Discards: N/A

OCEAN POUT, continued Surveys NEFSC spring survey: add 2012-2015, Convert 2012-2015 from Bigelow to Albatross units using ocean pout calibration (Rho_N = 4.5752; Rho_W = 3.911546) Length-based conversion factors not established; not needed) NEFSC fall survey: N/A

OCEAN POUT, continued Biology No changes from 2012 Operational Assessment values Reference Points No changes from 2012 Operational Assessment values Fmsy proxy=0.76, Bmsy prxoy=4.94 kg/tow, MSY= 3,754 mt Assessment Index using catch, survey indices and exploitations ratios; years 1968 -2014
OCEAN POUT, continued Projections N/A Fallback Recent catches or quotas (no possession for this species)
Proposed Update for Gulf of Maine Winter Flounder
Lead Scientist: Paul Nitschke Last Assessed: 2014 Operational Assessments
30+ Survey Area Swept
NEFSC
July 27, 2015
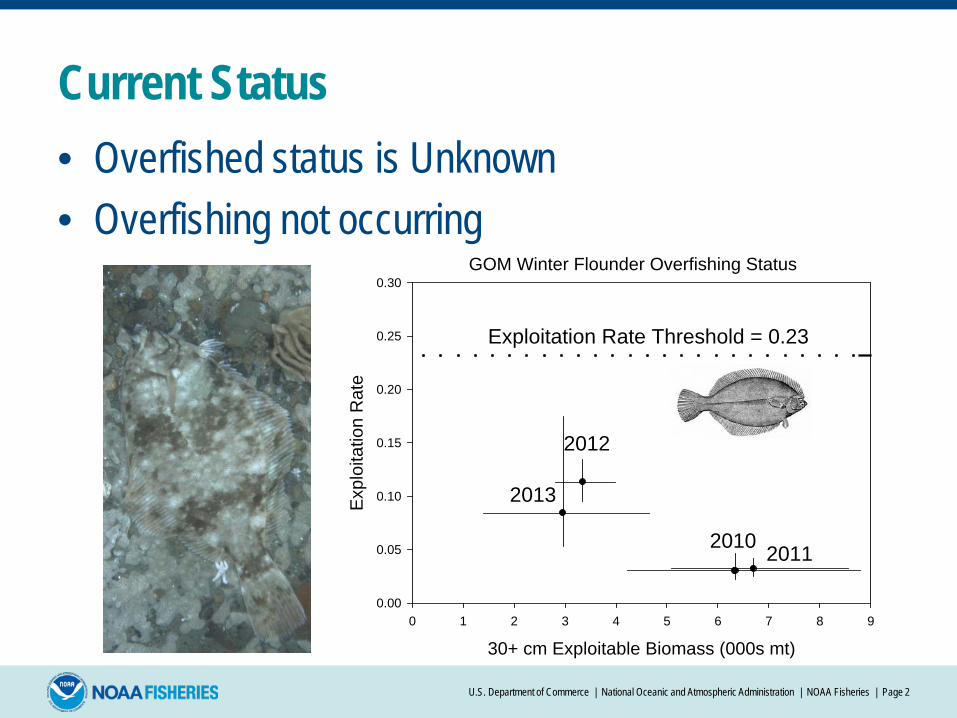
Current Status • Overfished status is Unknown • Overfishing not occurring
U.S. Department of Commerce | National Oceanic and Atmospheric Administration | NOAA Fisheries | Page 2
GOM Winter Flounder Overfishing Status
30+ cm Exploitable Biomass (000s mt)0 1 2 3 4 5 6 7 8 9
Expl
oita
tion
Rat
e
0.00
0.05
0.10
0.15
0.20
0.25
0.30
2010
Exploitation Rate Threshold = 0.23
2011
2012
2013
Assessment Plan • Update trends in the NEFSC, MDMF, and MENH
surveys. • Estimate 2015 catch (commercial & recreational
landing, recreational discards, lg mesh trawl discards and gillnet discards).
U.S. Department of Commerce | National Oceanic and Atmospheric Administration | NOAA Fisheries | Page 3
Assessment Plan 30+ cm Survey Area Swept Biomass Estimate Used in SARC 52 (2011) & 2014 Operational Update
• Exploitable Biomass = 30+ cm biomass index per tow x total survey area / tow footprint x q
• Exploitation rate = catch / 30+ cm biomass • Overfishing BRPs based on F40% from Length based
YPR (Not planning on updating).
U.S. Department of Commerce | National Oceanic and Atmospheric Administration | NOAA Fisheries | Page 4

Assessment Plan • Estimate Fall 2014 and
Spring 2015 30+ cm biomass from the NEFSC, MDMF and MENH surveys.
U.S. Department of Commerce | National Oceanic and Atmospheric Administration | NOAA Fisheries | Page 5
Area Swept 30+ cm Biomass Survey Components
2009
2010
2011
2012
2013
2014
30+
cm A
rea
Sw
ept B
iom
ass
(mt)
0
500
1000
1500
2000
2500
3000
3500
4000
4500MENHMDMFNEFSC
Area Swept 30+ cm Biomass Survey Components
2009
2010
2011
2012
2013
2014
30+
cm A
rea
Sw
ept B
iom
ass
(mt)
0
500
1000
1500
2000
2500
3000
3500
4000
4500MENHMDMFNEFSC
Spring q=1
Fallq=1

Backup Plan C • Average catch for recent years.
U.S. Department of Commerce | National Oceanic and Atmospheric Administration | NOAA Fisheries | Page 6

Groundfish Assessment Oversight Panel 2015
Paul Rago and Population Dynamics Stock Assessment Lead Scientists Northeast
Fisheries Science Center
July 27, 2015
Georges Bank Yellowtail Flounder • Lead Scientist: Chris Legault • Team Members: Larry Alade, Dheeraj Busawon
(DFO), and Heath Stone (DFO) • Last Assessed: 2015 TRAC (earlier this month) • Not for review here
• Information provided for completeness • SSC meeting September 1 • TMGC meeting September 9-11
U.S. Department of Commerce | National Oceanic and Atmospheric Administration | NOAA Fisheries | Page 2

Georges Bank Yellowtail Flounder • Empirical approach • Average three bottom trawl surveys expanded to
population biomass • Apply exploitation rate (2%-16%)
U.S. Department of Commerce | National Oceanic and Atmospheric Administration | NOAA Fisheries | Page 3

U.S. Department of Commerce | National Oceanic and Atmospheric Administration | NOAA Fisheries | Page 4