ground‐penetrating radar for close‐in mine detection
TRANSCRIPT

Chapter 3
Ground‐Penetrating Radar for Close‐in Mine Detection
Olga Lucia Lopera Tellez and Bart Scheers
Additional information is available at the end of the chapter
http://dx.doi.org/10.5772/67007
Abstract
In this chapter, two of the major challenges in the application of ground-penetratingradar in humanitarian demining operations are addressed: (i) development and testingof affordable and practical ground penetrating radar (GPR)-based systems, which canbe used off-ground and (ii) development of robust signal processing techniques forlandmines detection and identification. Different approaches developed at the RoyalMilitary Academy in order to demonstrate the possibility of enhancing close-rangelandmine detection and identification using ground-penetrating radar under laboratoryand outdoor conditions are summarized here. Data acquired using different affordableand practical GPR-based systems are used to validate a number of promising develop-ments in signal processing techniques for target detection and identification. The pro-posed approaches have been validated with success in laboratory and outdoor conditionsand for different scenarios, including antipersonnel, low-metal content landmines, impro-vised explosive devices and real mine-affected soils.
Keywords: ground-penetrating radar, clutter reduction, object detection, landmines
1. Introduction
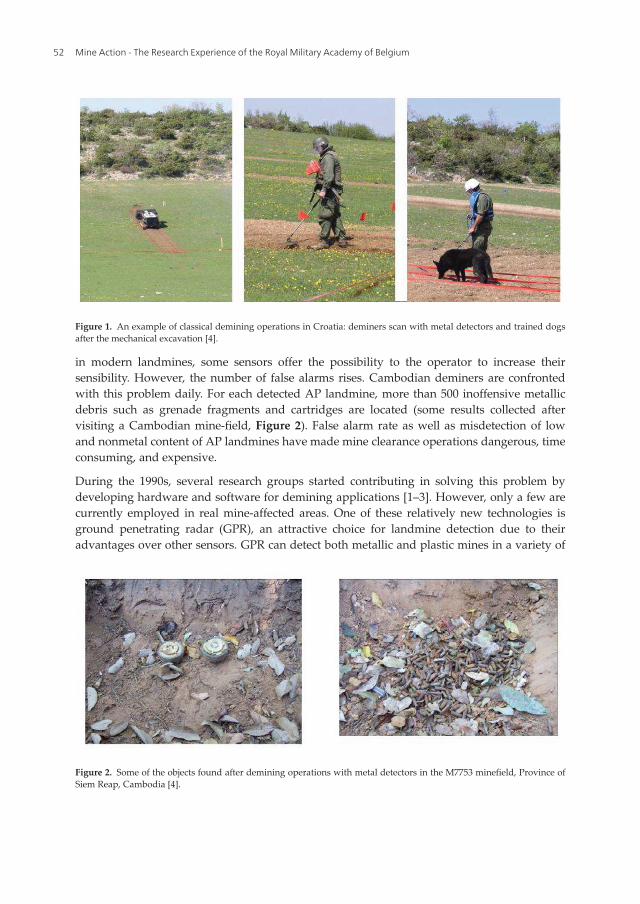
To make reliable, easily interpreted and less time-consuming operational systems for landminedetection is a real challenge [1, 2]. Nowadays, demining is performed by using different kindsof demining systems, e.g., mechanical excavation, trained dogs/rodents, and metal detectors(Figure 1). Metal detector (MD) is one of the most used close-range detection systems fordemining. However, antipersonnel (AP) landmines are not made any more with significantamounts of metal but with plastic and other nonmetallic elements. Metal detection-basedsystems available today do not efficiently detect plastic landmines with minimum metalcontent in a metal debris contaminated area. In order to compensate for small metal content
© 2017 The Author(s). Licensee InTech. Distributed under the terms of the Creative Commons Attribution-NonCommercial 4.0 License (https://creativecommons.org/licenses/by-nc/4.0/), which permits use, distributionand reproduction for non-commercial purposes, provided the original is properly cited.
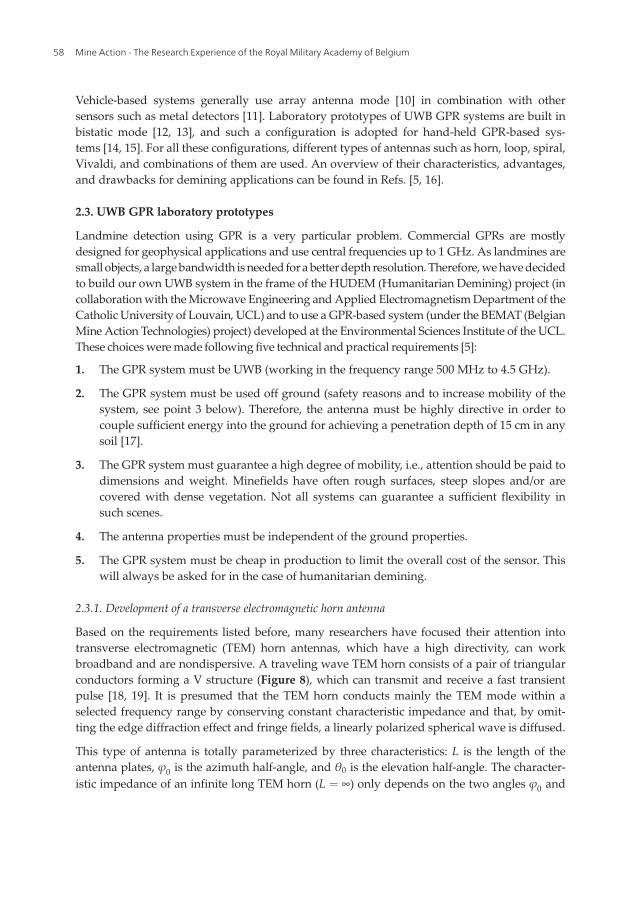
in modern landmines, some sensors offer the possibility to the operator to increase theirsensibility. However, the number of false alarms rises. Cambodian deminers are confrontedwith this problem daily. For each detected AP landmine, more than 500 inoffensive metallicdebris such as grenade fragments and cartridges are located (some results collected aftervisiting a Cambodian mine-field, Figure 2). False alarm rate as well as misdetection of lowand nonmetal content of AP landmines have made mine clearance operations dangerous, timeconsuming, and expensive.
During the 1990s, several research groups started contributing in solving this problem bydeveloping hardware and software for demining applications [1–3]. However, only a few arecurrently employed in real mine-affected areas. One of these relatively new technologies isground penetrating radar (GPR), an attractive choice for landmine detection due to theiradvantages over other sensors. GPR can detect both metallic and plastic mines in a variety of
Figure 1. An example of classical demining operations in Croatia: deminers scan with metal detectors and trained dogsafter the mechanical excavation [4].
Figure 2. Some of the objects found after demining operations with metal detectors in the M7753 minefield, Province ofSiem Reap, Cambodia [4].
Mine Action - The Research Experience of the Royal Military Academy of Belgium52

soils by noninvasive subsurface sensing [3]. GPR sends a series of microwave pulses rangingfrom about 1 to 4 GHz into the ground. It then looks for anomalies in the reflected signal,which could indicate the presence of a landmine. In terms of buried target detection, thestrength of radar echoes is usually associated with contrasts of electromagnetic characteristicsbetween targets and their surrounding soils. For antipersonnel mines, GPR is usually used incombination with a metal detector [3, 4]. The metal detector would detect all metal contents inthe soil, and the GPR is used to discriminate on the size of the objects: smaller metal objects arediscarded and larger metal objects are confirmed as dangerous. Note that the GPR has thecapacity to detect nonmetal mines. But when used alone its possible large false alarm ratemakes it more suited to look for antitank mines. Moreover, its weight can be light, so that it canbe installed in a hand-held system or in a vehicle-mounted system in the form of an array ofmultiple antenna elements [3].
This chapter addresses two of the major challenges in the application of GPR in humanitariandemining operations: (i) development of affordable and practical GPR-based systems and (ii)development of robust GPR signal processing techniques for landmine detection and identifi-cation. This chapter also reviews research carried out at the Royal Military Academy in thesetopics.
2. GPR systems
2.1. GPR principles
Electrical properties of materials are determined by electrical conductivity, permittivity andpermeability, which are function of frequency. The relative permittivity (or dielectric constant)of a medium impacts the electric field propagation and is the most important parameter forGPR. The relative permeability affects the magnetic field propagation. The electromagneticwave attenuation in the subsurface is strongly dependent on the electrical conductivity of themedium and its variation. The latter is normally controlled by water [4–8]. For a conductivematerial, the electromagnetic field is diffusive and cannot propagate as an electromagneticwave. When it is resistive, or dielectric, an electromagnetic field can propagate as an electro-magnetic wave. When an electromagnetic wave is send into the ground, GPR measures thereflected echoes from any electrical property discontinuity in the subsurface structure. Figure 3shows a block diagram of a generic GPR system [5].
The velocity and reflectivity of the electromagnetic wave in soil are characterized by thedielectric constant (relative permittivity) of the soil. When the dielectric constant of the soil isεr, the propagation velocity of electromagnetic waves in this medium is given by
v ¼ cffiffiffiffiεr
p ð1Þ
where c ¼ 3� 108 m=s. Note then that in air (εr ¼ 1), the propagation velocity is then v ¼ c.Dielectric constants measured at 100 MHz for different materials [3] are listed in Table 1.
Ground‐Penetrating Radar for Close‐in Mine Detectionhttp://dx.doi.org/10.5772/67007
53

Figure 3. Block diagram of a generic GPR system [5].
Material Attenuation (dB/m) Relative permittivity εr
Air 0 1
Clay 10–100 2–40
Concrete: dry 2–12 4–10
Concrete: wet 10–25 10–20
Fresh water 0.1 80
Sand: dry 0.01–1 4–6
Sand: saturated 0.03–0.3 10–30
Sandstone: dry 2–10 2–3
Sandstone: wet 10–20 5–10
Seawater 1000 81
Soil: firm 0.1–2 8–12
Soil: sandy dry 0.1–2 4–6
Soil: sandy wet 1–5 15–30
Soil: loamy dry 0.5–3 4–6
Soil: loamy wet 1–6 10–20
Soil: clayey dry 0.3–3 4–6
Soil: clayey wet 5–30 10–15
TNT – 3
Plastic – 2–4
Table 1. Attenuation and relative permittivity of subsurface materials measured at 100 MHz [3].
Mine Action - The Research Experience of the Royal Military Academy of Belgium54

When GPR transmits electromagnetic waves from a transmitting antenna located off-the-ground, signals travel in the air layer and when the electromagnetic wave encounters anydielectrical discontinuity, a reflection occurs. The latter is received by a receiving antenna,located off-the-ground, and it is referred to as an A-scan, e.g., a single waveform recorded byGPR, with the antennas at a given position (x, y). In this data set, the time t is the only variable,related to the depth z by the propagation velocity of the EM waves in the medium. Itsrepresentation in the time domain can be seen in Figure 4 [5]. The time axis or the relateddepth axis is usually pointed downward.
When moving the GPR antennas on a line along the x-axis, a set of A-scans can be gathered,which form a two-dimensional (2D) data set called a B-scan (Figure 5). When the amplitude of
Figure 4. Representation of an A-scan [5].
Figure 5. Configuration and representation of a B-scan.
Ground‐Penetrating Radar for Close‐in Mine Detectionhttp://dx.doi.org/10.5772/67007
55

the received signal is represented by a color scale (e.g., gray-scale), a 2D image is obtained andis shown in Figure 6. The 2D image represents a vertical slice in the ground. Reflections on apoint scatter located below the surface appear, due to the beamwidth of the transmitting andthe receiving antenna, as hyperbolic structures in a B-scan. Finally, when moving the antennaover a (regular) grid in the xy-plane, a three-dimensional (3D) data set can be recorded, called aC-scan (Figure 6). Usually a C-scan is represented as a two-dimensional image by plotting theamplitudes of the recorded data at a given time ti. The resulting image represents then ahorizontal slice at a certain depth, parallel to the recording plane (Figure 7). Nowadays, manyuser-software packages (e.g., GPRMax2D and 3D [7]) have integrated functions to plot directlytwo- or three-dimensional representations of the recorded C-scans. Examples of these plotsare: (i) an arbitrary cut in the 3D volume and (ii) an isosurface (surface with the same ampli-tude), both represented in Figure 7 [5].
Figure 6. A gray-scale illustration of a B-scan (left) and a series of B-scans forming a C-scan (right).
Figure 7. Representation of a C-scan by horizontal slices at different depths (left), arbitrary cut in the 3D volume (center),and isosurface (right) [5].
Mine Action - The Research Experience of the Royal Military Academy of Belgium56

2.2. GPR design
Table 2 gives a schematic overview of the various possible types of GPR systems that existtoday. GPR systems can be classified by the domain in which they work and by the type ofmodulation. GPR systems operate either in time domain or in frequency domain. In the timedomain GPR there are two major categories: the amplitude modulated and the carrier-freeGPR. The first one sends a pulse with a carrier frequency. This carrier frequency is modulatedby a (square) envelope. Good depth resolution is achieved by reducing the duration of thepulse as short as possible. Most of the commercially available GPRs belong to this group [5].
The need for larger bandwidth has led to the development of a second category of timedomain GPR: the carrier-free GPR. The pulse sent by the GPR has no carrier. The shape of thepulse can vary, but typically a Gaussian pulse is used. The carrier-free radar is also called anultra-wide band (UWB) GPR because of the large bandwidth. Before, GPR systems weredeveloped based on time domain waveform. Nowadays GPRs are also developed in thefrequency domain. In the latter, systems can have two possible modulation types: either thefrequency modulated (FM) continuous wave (CW) or stepped frequency (SF) GPR [5].
FM systems transmit a carrier frequency, which changes continuously by using a voltage-controlled oscillator over a certain frequency range. The frequency sweeps according to afunction within a certain time. After reception, the reflected wave is mixed with the emittedone, and the target depth can be calculated from the difference in frequency between thetransmitted and received wave. FM systems have poor dynamic range, which is an importantlimitation. Since FM radars receive signals at the same time as it is transmitting, leakage signalsbetween the antennas can obscure small reflections. Those two facts deviate the attention fromFM systems to SF radars for ground applications.
An SF GPR uses a frequency synthesizer to go through a range of frequencies equally spacedby an interval Δ. At each step, a CW is send with a high stability and mixed with the receivedsignal using a quadrature mixer. For each frequency, the amplitude and phase of the receivedsignal are compared with the transmitted signal [5]. The reader can refer to Ref. [9] for a goodoverview of this technique. Stepped-frequency continuous-wave (SFCW) radars have someadvantages over the others, including wider dynamic range and better signal-to-noise ratio(SNR) [3, 5, 6].
Besides the domain of operation, GPR antennas may be either monostatic (single emitting andreceiving antenna), bistatic (different emitting and receiving antenna), or an array configura-tion of different antenna types and sizes. In the mine detection application, high depth resolu-tion is needed and therefore ultra-wide band (UWB) antennas play an important role [8].
GPR design options
Domain Time Frequency
Modulation Amplitude (mono cycle) Carrier-free Linear sweep Stepped frequency
Table 2. Different types of GPR systems.
Ground‐Penetrating Radar for Close‐in Mine Detectionhttp://dx.doi.org/10.5772/67007
57
Vehicle-based systems generally use array antenna mode [10] in combination with othersensors such as metal detectors [11]. Laboratory prototypes of UWB GPR systems are built inbistatic mode [12, 13], and such a configuration is adopted for hand-held GPR-based sys-tems [14, 15]. For all these configurations, different types of antennas such as horn, loop, spiral,Vivaldi, and combinations of them are used. An overview of their characteristics, advantages,and drawbacks for demining applications can be found in Refs. [5, 16].
2.3. UWB GPR laboratory prototypes
Landmine detection using GPR is a very particular problem. Commercial GPRs are mostlydesigned for geophysical applications and use central frequencies up to 1 GHz. As landmines aresmall objects, a largebandwidth is needed forabetterdepth resolution. Therefore,wehavedecidedto build our own UWB system in the frame of the HUDEM (Humanitarian Demining) project (incollaborationwith theMicrowave Engineering andApplied ElectromagnetismDepartment of theCatholic University of Louvain, UCL) and to use a GPR-based system (under the BEMAT (BelgianMine Action Technologies) project) developed at the Environmental Sciences Institute of the UCL.These choicesweremade following five technical and practical requirements [5]:
1. The GPR system must be UWB (working in the frequency range 500 MHz to 4.5 GHz).
2. The GPR system must be used off ground (safety reasons and to increase mobility of thesystem, see point 3 below). Therefore, the antenna must be highly directive in order tocouple sufficient energy into the ground for achieving a penetration depth of 15 cm in anysoil [17].
3. The GPR system must guarantee a high degree of mobility, i.e., attention should be paid todimensions and weight. Minefields have often rough surfaces, steep slopes and/or arecovered with dense vegetation. Not all systems can guarantee a sufficient flexibility insuch scenes.
4. The antenna properties must be independent of the ground properties.
5. The GPR system must be cheap in production to limit the overall cost of the sensor. Thiswill always be asked for in the case of humanitarian demining.
2.3.1. Development of a transverse electromagnetic horn antenna
Based on the requirements listed before, many researchers have focused their attention intotransverse electromagnetic (TEM) horn antennas, which have a high directivity, can workbroadband and are nondispersive. A traveling wave TEM horn consists of a pair of triangularconductors forming a V structure (Figure 8), which can transmit and receive a fast transientpulse [18, 19]. It is presumed that the TEM horn conducts mainly the TEM mode within aselected frequency range by conserving constant characteristic impedance and that, by omit-ting the edge diffraction effect and fringe fields, a linearly polarized spherical wave is diffused.
This type of antenna is totally parameterized by three characteristics: L is the length of theantenna plates, ϕ0 is the azimuth half-angle, and θ0 is the elevation half-angle. The character-istic impedance of an infinite long TEM horn (L ¼ ∞) only depends on the two angles ϕ0 and
Mine Action - The Research Experience of the Royal Military Academy of Belgium58

θ0. In theory, a TEM mode does not have an upper cut-off frequency; however, this upper cut-off frequency will be practically restricted. The length L mainly determines the lower cut-offfrequency.
For improving the directivity and reducing the physical antenna dimensions withoutdiminishing the bandwidth, TEM horns can be filled with a silicone. A silicone characterizedby a real relative permittivity εr of 2.89 and a loss tangent of 0.0084 at 1 GHz is used. As aresult, the propagation speed of the TEM wave between the antenna plates will be divided byffiffiffiffiεr
p(or the electrical length of the antenna will be increased by a factor
ffiffiffiffiεr
p) and the surge
impedance will be reduced by a factorffiffiffiffiεr
p[20].
For preserving the same surge impedance as without the silicone, the angle θ0 can beincreased, which improves the directivity. In this case, the antenna impedance is chosen tomatch the 50 Ω driving cable. As a result, no mismatches will be found at the part of thetransient traveling current that bounces back at the antenna aperture toward the excitationsource, avoiding antenna ringing. The principle seems to work well for frequencies in the bandof the antenna [20].
The antenna plates are replaced by printing sets of 41 wires on circuit boards (Figure 9). Sincethe distance between the wires is small, the antenna characteristics are preserved. In addition,
Figure 8. Conventional design of the TEM horn antenna characterized by three parameters: L the length of the antennaplates, ϕ0 the azimuth half-angle, and θ0 the elevation half-angle.
Figure 9. Lower and upper antenna plates, etched on a printed circuit board.
Ground‐Penetrating Radar for Close‐in Mine Detectionhttp://dx.doi.org/10.5772/67007
59
the currents are forced to be radial, limiting the surface of conducting metal. In this applica-tion, this is of great importance since GPRs are often used in combination with metal detectors.
In order to feed the TEM horn in its balanced configuration (Figure 8) with an unbalancedcoaxial line, an UWB (frequency-independent) balun is required to prevent currents on thecoax. Several realizations of a TEM horn were made, and, at first, measurements revealed anunbalanced current component on the coax exterior. This means that the coaxial feedline wasreacting as an antenna. A common way of eliminating such currents is to add chokes (ferritecylinders) around the feeding cable [21]. For this design, a new kind of balun is tested, whichprinciple lays on an electrostatic reasoning described in Ref. [22]. The function of the taper inthe bottom plate is to provide a gradual transition between the unbalanced upper antennaplates on a ground-plane, toward a balanced alignment with two symmetrical antenna plates.However, a slide change of the surge impedance along the antenna is introduced by such atransition. The surge impedance of one antenna plate on a ground-plane is half the valuecalculated using the wire model. Since θ0 in the unbalanced configuration is measured fromthe ground plane, the resulting value will double the elevation half-angle of the balancedconfiguration. As a result, the surge impedance of the unbalanced part is found to be slightlyinferior to the surge impedance of the balanced part of the antenna. Using the wire model andtaking into account the reduction of the surge impedance due to the filling and the influence ofthe balun, an elevation half-angle θ0 (defined in the balanced part) of 14.5� is calculated tomatch 50 Ω. Summarizing, the antenna parameters are L ¼ 12 cm, ϕ0 ¼ 30�, and θ0 ¼ 14.5�,which leads to a physical antenna aperture of 12 cm � 6 cm.
The dielectric-filled antennas were integrated in a laboratory UWB GPR. For this, a study wasmade in order to optimize the position and orientation of the Tx and Rx antennas. To reducethe coupling between the two TEM horns, they were put side by side with a common H-plane(E-field of both antennas is parallel to the interface). Generally speaking, antenna coupling isnot critical since it could be neutralized. However, if the ringing between the two antennaslasts too long, it could obscure interesting parts of the returned signal. After some tests, theantennas were fixed at around 25 cm above the surface [12].
When configuring the Tx-Rx antenna system, it is important to consider the two antennas as oneantenna. Therefore, the combined antenna pattern should be analyzed. The 3 dB beamwidth thatresults of this combination is normally function of the offset angle θ1, as shown in Figure 10.When moving the GPR antennas over a fix target, in the backscattered signal displayed asfunction of time (B-scan) a hyperbolic structure will appear (Figure 6). Awider 3 dB beamwidthwill produce wider hyperbolas in the B-scan and could therefore improve the detection ofobjects. The total energy found in these hyperbolic structures is considered as a measure for theoptimization of the offset angle θ1. The expected reflected energy of the object is represented bythis total energy, after focusing the B-scan using an optimal migration methodology. In order tooptimize the offset angle, different synthetic B-scans of a buried object at 6 cm depth aresimulated for different values of θ1 [12]. An offset angle of 20� is found to produce the hyperbolawith the maximum of energy. In the configuration consider for this calculation (object at a depthof 6 cm), 20� corresponds to the angle that focuses the antennas on the object, considering therefraction. In a real scenario, the object is buried at an unknown depth, which is expected to be
Mine Action - The Research Experience of the Royal Military Academy of Belgium60

no deeper than 20 cm. Therefore, when building the laboratory UWB GPR, an angle θ1 of 20�
was selected.
Figure 11 represents a GPR image of a PMN AP landmine (12.5 cm diameter, plastic case),buried at 1 cm depth in dry sand. Data are acquired by an impulse UWB GPR emulated usinga picosecond pulse labs step-generator type PSPL 4050B, followed by an impulse-forming-network and connected to two identical dielectric-filled TEM horn antennas. Data are taken bydisplacing the Tx and Rx antennas by steps of 1 cm (represented on the x-axis). In each antennaposition, a short Gaussian impulse is radiated and the backscattered signal is recorded (y-axis).
Figure 11. Time domain representation of the impulse UWB GPR measurements performed on sand for the PMN APmine, buried at 1 cm.
Figure 10. Dielectric-filled TEM horn antenna configuration in bistatic mode [12].
Ground‐Penetrating Radar for Close‐in Mine Detectionhttp://dx.doi.org/10.5772/67007
61

2.3.2. UWB SFCW GPR in monostatic mode
An SFCW system is considered in the frame of the BEMAT project, which also covers several ofthe requirements mentioned before. It is based on the frequency domain radar-antenna-multi-layered medium model developed by Lambot et al. [23], which applies for SFCW radarsoperating off the ground in monostatic mode (in our case, a portable vector network analyzer(VNA) connected to a monostatic horn antenna, see Figure 12). In this approach, it is assumedthat the distribution of the backscattered electric field measured by the antenna does not relyupon the elements of propagation (air and subsurface layers), i.e., only the amplitude andphase of the field change. Therefore, the antenna can be described by a model of linear transferfunctions in series and in parallel, acting as global transmittances and reflectances (Figure 13).
In this model, G ωð Þ is the soil response and HiðωÞ, Ht ωð Þ, HrðωÞ, Hf ðωÞ are, respectively, theantenna return loss, the antenna transmitting and receiving transfer functions, and the antennafeedback loss, which have to be determined, with ω being the angular frequency. The antennaequation can be written as
S ωð Þ ¼ Hi ωð Þ þHt ωð ÞHrðωÞGðωÞ1�Hf ωð ÞGðωÞ ð2Þ
The latter equation is represented in the frequency domain and the transfer functions arefrequency dependent complex quantities. The multiple wave reflections occurring inside theantenna, which, as stated before, are a result of the impedance differences between the antennafeed point and the antenna aperture are represented by the return loss function HiðωÞ. Suchinner wave reflections are independent of the medium, Ht ωð Þ andHrðωÞ constitute the antennagain and phase delay between the VNA calibration plane (the connection between the antenna
Figure 12. The UWB SFCW GPR system emulated using the hand-held VNA connected to the horn antenna via a 50-Ohm N-type coaxial cable.
Mine Action - The Research Experience of the Royal Military Academy of Belgium62

feed point and the VNA cable) and the source and receiver virtual point (antenna phase center).The feedback loss transfer function Hf ðωÞ represents multiple wave reflections between theantenna and the subsurface. HiðωÞ and Hf ðωÞ are global reflectances, and Ht ωð Þ and HrðωÞ areglobal transmittances. Finally, G ωð Þ accounts for the air-soil system [23] and is defined by aGreen's function, solution of the 3D Maxwell's equations for electromagnetic waves propagatingin horizontally multilayered media [24].
The antenna transfer function HiðωÞ can be determined from using a measurement in freespace conditions, for which G ωð Þ ¼ 0. Therefore, from Eq. (2) HiðωÞ ¼ Sf eðωÞ. The antennatransfer functions Ht ωð Þ, Hr ωð Þ, and Hf ðωÞ are determined using measurements at two differ-ent heights above a planar metal sheet (considered as an infinite perfect electric conductor), forwhich G ωð Þ is known accurately, and correspond therefore to a specific distribution of themeasured electromagnetic field. Consider H ωð Þ ¼ Ht ωð Þ Hr ωð Þ, then
Hf ðωÞ ¼SbðωÞGbðωÞ �
SaðωÞGaðωÞ
Sb � Sað3Þ
H ωð Þ ¼ SaðωÞGaðωÞ � SaðωÞHf ðωÞ ð4Þ
On the one hand, a necessary condition for this antenna model is to employ the antenna suffi-ciently far from the surface. On the other hand, it is necessary to minimize losses by spherical
Figure 13. The VNA-antenna-multilayered medium system modeled as linear transfer functions in series and in parallel.
Ground‐Penetrating Radar for Close‐in Mine Detectionhttp://dx.doi.org/10.5772/67007
63

divergence in wave propagation, keep a high SNR, and ensure a high spatial resolution, condi-tions that are achieved by minimizing the distance between the antenna and the surface. In Ref.[25], laboratory experiments were carried out to characterize the transfer functions HiðωÞ, H ωð Þ,and Hf ðωÞ of a horn antenna (the antenna used in this study) as a function of height to determineto which extend they are still correct when approaching the soil surface. For this, electromagneticmeasurements were carried out with the antenna aperture situated at 30 different heights h (from1 to 28 cm) above a metal sheet of 2 � 2 m2. Results shown small errors on the calculation of thetransfer functions for h > 12 cm. Below h ffi 12 cm, these errors appear to increase, resulting inimportant errors in the calculation of the soil response G ωð Þ for field applications. These resultsindicate that, in the application of landmine detection, the independency of the received fielddistribution with respect to the medium is maintained when the antenna aperture is at minimumh ¼ 12 cm.
In order to emulate the UWB SFCW radar, a low-cost hand-held VNA connected to amonostatic horn antenna via a 50 N-type coaxial cable is used. The VNA comprises a spectralanalyzer (FSH6, Rohde and Schwarz), which uses a bridge and power divider (VSWR, Rohdeand Schwarz) to give vector measurements. A linear polarized double-ridged broadband hornantenna (BBHA 9120A, Schwarzbeck Mess-Elektronik), with 22 cm length and 14 � 24 cm2
aperture area, is used to collect data. For this application and from antenna characteristics, itcan be considered as directive (3-dB beamwidth of 45� in the E-plane and 30�in the H-plane at1 GHz and 27� in the E-plane and 22�in the H-plane at 2 GHz, when working in the 0.8–5.0 GHzfrequency range).
This UWB SPCW radar is easy to use and affordable, and it covers several of the requirementslisted before. It has a linear dynamic range of 60 dB, allowing detecting weak scatterers.Internal reflections inside the antenna are accurately calculated and included in the EM modeldescribed before. As a result, they do not influence negatively the signal-to-noise ratio of thesystem. Besides, amplitude drift (that can be due to mechanical or temperature changes on theconnection point of the antenna) is limited by a precise and easy-to-do calibration methodusing a standard Open-Short-Match calibration kit. While gathering data, this calibrationcould be performed once more.
Figure 14 shows a time domain representation of radar measurements performed in a homo-geneous sand for the PMN AP landmine (12.5 cm diameter, plastic case) buried at 10 cm. Thehorn antenna was displaced over the x-axis following constant steps of 2 cm. The height of theantenna aperture is 20 cm above the soil surface.
2.4. Hand-held dual-sensors
During the past 10 years, the development of GPR applied to landmine detection has evolvedfrom the laboratory conditions and test fields to real minefields. Nowadays, systems usingdual sensor technology combining MD and GPR (hand-held dual sensors) have enabledimproved discrimination against small metal fragments to be demonstrated in live minefields.Some of them have reached the stage where they are being produced in large numbers. Such
Mine Action - The Research Experience of the Royal Military Academy of Belgium64

systems work with both MD and GPR, and they differ on the operating principle of GPR, thesignal processing and the user interface. In this section, three of them are introduced.
MINEHOUND/VMR2 has been developed by ERA Tech., U.K., in collaboration with VallonGmbh, Germany. It combines a pulse induction MD and an impulse GPR. This dual-sensortransforms MD and GPR signals into two separated audio signals of different frequency ofvibration and tone. MINEHOUND/VMR2 has been tested in different mine-affected countriesincluding Afghanistan, Angola, Bosnia and Cambodia [26].
ALIS (Advanced Landmine Imaging System) is a Japanese detector developed at the TohokuUniversity. It incorporates an MD and a GPR, in combination with a sensor tracking system,which makes possible to analyze and visualize the data (after migration). Its hand-held versionis equipped with a VNA-based GPR and a pulse induction MD. This dual-sensor provides twodifferent user interfaces: audio for MD signal and images for both MD and GPR signals.Different trials have been performedwithALIS inmine-affected countries includingAfghanistan,Cambodia, Croatia, and Egypt [27].
AN/PSS-14 (former HSTAMIDS, Hand-held Standoff Mine Detection System) was originally aproject founded by the Defense Advanced Research Projects Agency, DARPA, U.S., and hasbeen produced later by CyTerra Corp. (now L3 Communications). It is equipped with a pulseinduction MD and a GPR based on a wide-band, SF radar. AN/PSS14 gives to the user anaudio signal when a metallic object is detected. If there is a metal detection and the GPRsystem identifies other mine-like material as well, a second sound, of a different frequency ofvibration and tonality, is played as aided target recognition. This system has been producedsince 2006 for U.S. Army operations in Iraq [28].
Figure 14. Time domain representation of the SFCWUWB GPRmeasurements performed on sand for the PMNAPmine,buried at 10 cm.
Ground‐Penetrating Radar for Close‐in Mine Detectionhttp://dx.doi.org/10.5772/67007
65

3. GPR signal processing
GPR principal function is to detect differences on the electromagnetic (EM) properties in thesoil-target medium. This permits to locate even low and nonmetallic landmines. Apart fromthe response from a potential target, the backscattered signal carries also undesirable effectsfrom antenna coupling, system ringing and subsurface reflections, which hide the targetsignature [1–3]. These effects have to be filtered out from the signal to enhance landminedetection.
3.1. Clutter
As stated before, using GPR in landmine detection operations could be advantageous since thenumber of false alarms could be reduced and since low-metallic content landmines that are notdetected by metal detection could be detected by GPR. However, extracting the landminesignature from GPR data is negatively affected by a list of influencing elements categorized asclutter, which can partly or totally obscure or deform the backscattered signal from a buriedobject. Mainly, these influencing elements are: (1) antenna reactions causing multiple reflec-tions and signal deformation; (2) the subsoil EM characteristics and their spatiotemporaldistribution controlling wave propagation velocity, attenuation, and surface and subsoil reflec-tions; (3) the EM variation between the buried object and the subsoil influencing the strength ofthe landmine response; and (4) surface roughness causing diffuse scattering. Thus, it is neces-sary to investigate suitable techniques in order to reduce clutter while maintaining highlandmine detection rates. This could be very challenging due to the complicated EM phenom-ena taking place in the theoretically unknown antenna-air-soil-mine system.
Different approaches are used to reduce this clutter and to recognize the landmine signal.Widely used approaches to reduce clutter are average and moving average background sub-traction (BS). Other BS techniques are based on wavelet transform and system identification.Once these approaches suppress part of the clutter, the next expected procedure is to detect theburied object. In this step, different signal processing techniques for the identification of the targetsignal are applied, including advanced algorithms for hyperbola detection [29], convolutionalmodels and migration techniques [5]. An overview of different signal processing techniques forlandmine detection using GPR can be found in Refs. [1, 3].
3.2. Filtering antenna effects and soil surface reflection
In Ref. [30], we propose a method to filter out the antenna internal reflections and multiplereflections between the antenna and the ground, as well as the related distortion effects, byusing the frequency-dependent linear transfer functions model developed in [23]. These func-tions also account for the antenna gain and wave propagation time, fixing time-zero at theantenna phase center. An example of data before and after filtering the antenna effects ispresented in Figure 15 (note that in the radar data represented in Figure 14, these effects werepreviously removed).
Mine Action - The Research Experience of the Royal Military Academy of Belgium66

On the left image we can observe the multiple reflections occurring in the antenna, betweenabout 0 and 2 ns. These unwanted signals obscure the backscattered response when lookingdown in the time axis. At around 3.2 ns, the air-soil interface reflection appears. Then, asecond-order reflection taking place between the antenna and the soil surface arrives at about4.5 ns. Later in time, the backscattered signal coming from an antitank (AT) landmine appearsaround 6.5 ns (hyperbolic shape). Thanks to its relatively large size and metal content, as wellas the strong electromagnetic contrast between this one and the sand, and to the low attenua-tion of the EM waves in the sand (the electric conductivity tends to zero), this landmine iseasily noticeable to the naked eye. After filtering-out antenna effects (image on the right), thetrue time zero corresponds now to the antenna phase center, located at about 7 cm from theantenna aperture, inside the antenna, resulting in a time-shifting (note that the soil reflectionand hyperbola originating from the AT landmine are shifted in time). The multiple antennareflections have been taken away and the surface reflection appears clearer, around 1.9 ns,allowing the precise calculation of the antenna height. Moreover, the hyperbolic signature ofthe AT landmine is highlighted. There are some remaining oscillations which are still visible inthe figure. These could be a consequence of the distinct suppositions postulated in the antennamodel, mainly, (i) the condition of being in the far-field, (ii) the virtual Tx-Rx point of theantenna which is approximated at a fixed position (in reality, its position varies with frequency,the high frequencies being emitted nearer the feed point, and the low frequencies beingemitted in the proportionally larger part of the antenna), and (iii) the fact that only the x-component of the electric field is supposed to be measured and that only an x-directed currentsource is available. These could also appear as a result of applying the inverse Fourier trans-form to data collected in a restricted frequency range. This chapter will show later that suchoscillations are not a disadvantage for the detection and identification of AP landmines.
The surface reflection may be removed from a full GPR transect by subtracting from allmeasurements a mean measurement or an A-scan performed over a landmine-free area. In
Figure 15. Time domain representation of the SFCW UWB GPR measurements performed on sand for an antitank (AT)mine, buried at 30 cm depth, before (left) and after (right) removing antenna effects.
Ground‐Penetrating Radar for Close‐in Mine Detectionhttp://dx.doi.org/10.5772/67007
67
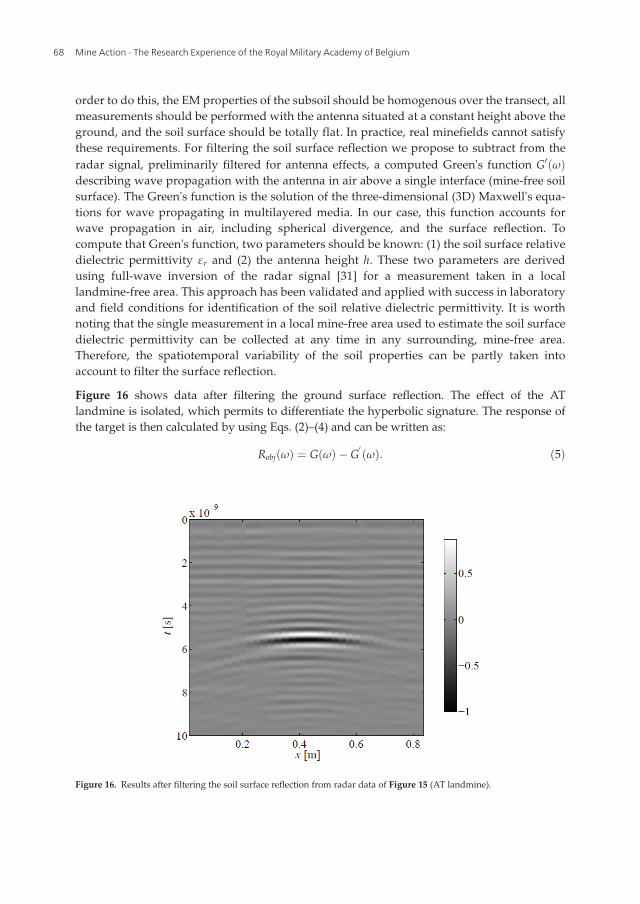
order to do this, the EM properties of the subsoil should be homogenous over the transect, allmeasurements should be performed with the antenna situated at a constant height above theground, and the soil surface should be totally flat. In practice, real minefields cannot satisfythese requirements. For filtering the soil surface reflection we propose to subtract from theradar signal, preliminarily filtered for antenna effects, a computed Green's function G0ðωÞdescribing wave propagation with the antenna in air above a single interface (mine-free soilsurface). The Green's function is the solution of the three-dimensional (3D) Maxwell's equa-tions for wave propagating in multilayered media. In our case, this function accounts forwave propagation in air, including spherical divergence, and the surface reflection. Tocompute that Green's function, two parameters should be known: (1) the soil surface relativedielectric permittivity εr and (2) the antenna height h. These two parameters are derivedusing full-wave inversion of the radar signal [31] for a measurement taken in a locallandmine-free area. This approach has been validated and applied with success in laboratoryand field conditions for identification of the soil relative dielectric permittivity. It is worthnoting that the single measurement in a local mine-free area used to estimate the soil surfacedielectric permittivity can be collected at any time in any surrounding, mine-free area.Therefore, the spatiotemporal variability of the soil properties can be partly taken intoaccount to filter the surface reflection.
Figure 16 shows data after filtering the ground surface reflection. The effect of the ATlandmine is isolated, which permits to differentiate the hyperbolic signature. The response ofthe target is then calculated by using Eqs. (2)–(4) and can be written as:
Robj ωð Þ ¼ G ωð Þ � G0ωð Þ: ð5Þ
Figure 16. Results after filtering the soil surface reflection from radar data of Figure 15 (AT landmine).
Mine Action - The Research Experience of the Royal Military Academy of Belgium68

3.3. Focusing the radar image
The radar antenna transmits energy with a beamwidth pattern such that an object severalcentimeters away from the beam axis may be detected. As a result, objects of finite dimensionsappear as hyperbolic reflectors on the B-scans. Migration techniques are used to reconstructthe reflecting structure present in the subsurface by focusing the reflections back into the trueposition of the object. We propose to filter out the effects of the antenna radiation pattern usingthe common Stolt's migration method [32], which applies a Fourier transform to back-propa-gate the scalar wave equation, extended in Ref. [30] for two media.
Consider the filtered signal Robj as a 2D data set Rðx, z, ωÞ with x being the distance along thescanning axis, z the depth and ω the angular frequency. Applying the Fourier transform withrespect to the spatial distance x to the special frequency kx yields an unfocused wavenumberdata set
R kx, z,ωð Þ ¼ðRðx, z, ωÞeikxxdx: ð6Þ
The Fourier transformation along the x coordinate makes sense only if the propagation veloc-ity does not vary in this direction. This methodology permits variations of the propagationvelocity in the z direction.
Considering the wavenumber k (k ¼ 2π=λ, with λ being the wavelength in the ground) as thevector sum of kx and kz for one-way propagation, we have:
k ¼ jkj ¼ffiffiffiffiffiffiffiffiffiffiffiffiffiffikx þ kz
p¼ ω
vð7Þ
where υ is the propagation velocity in the soil.
Assuming only upward coming waves and by introducing Eq. (7) into Eq. (6), the Fouriertransform of the wavefront at depth z is done by
R kx, z,ωð Þ ¼ Rðkx, 0,ωÞe�ikzz: ð8Þ
The migrated image will be the inverse Fourier transform of Eq. (8) at t ¼ 0 as
r x, zð Þ ¼ r x, z, 0ð Þ ¼ðð
Rðkx, 0, ωÞe�ðikxx�kzzÞdkxdω: ð9Þ
Figure 17 shows results after applying Slot's migration to the data set presented in Figures 14and 15.
3.4. Migration by space-time deconvolution
As described above, the aim of migration is to focus target reflections in the recorded data backinto their true position and physical shape. In this respect, migration can be seen as a form ofspatial deconvolution that increases spatial resolution. It is a common practice not to include in
Ground‐Penetrating Radar for Close‐in Mine Detectionhttp://dx.doi.org/10.5772/67007
69

the migration approaches the characteristics of the radar system, e.g., antenna patterns,antenna impulse response, and source waveform. In this section, a migration approach thatconsiders the system characteristics and to a certain extent, the ground characteristics, ispresented [5]. Its strategy is based on the deconvolution of the collected data with the point-spread function of the radar system. As in most of migration algorithms, it is assumed that theinteraction between the scatterers present in the medium is totally disregarded.
In order to perform the migration process by deconvolution, the data acquired by the UWBGPR have to be a convolution between the different layers and configurations present in thesubsoil and the point-spread function of the system. This is valid under certain premises. In theinterest of simplifying the analysis, a monostatic antenna configuration is taken as an example.The velocity of propagation through the propagation element can only vary in the groundwarddirection. The antennas are change location following a xy-plane at z¼ 0. The 3D data, Vrecðx, y, z¼ 0, tÞ is collected following a rectangular grid with spacing Δx and Δy. Consider a point-target
located in the subsoil at ro! ¼ ðxo, yo, zoÞ in a first step, described by an IR Λoðro! , toÞ, independent
of the incident direction and not necessarily a dirac impulse. For the antennas at any position
ra! ¼ ðxa, ya, z ¼ 0Þ, the received voltage can be written as
Vrecðra! , tÞ ¼ sðra! , ro! , tÞ⊗ΛoðtÞ ð10Þ
Where sðra! , ro! , tÞ represents the voltage response of a point scatterer placed in ro
! with IR
δ t� j r!a � r!ojv
!, as a function of the antenna location ra
! and time t. Additionally, for the
antennas at z ¼ 0 and the point scatterer at z ¼ zo, the response sðra! , ro! , tÞ is a function of ro
!
and ra! only by their difference. It is worth noting that the convolution present in Eq. (10) occurs
in the time. Consider a target modeled by a group of independent point targets located in
Figure 17. Results after applying the Slot's migration method for the datasets presented in Figure 14 (PMN AP landmine,left) and Figure 16 (AT landmine, right).
Mine Action - The Research Experience of the Royal Military Academy of Belgium70

average at the same depth z ¼ zo, the resulting voltage Vrecðxa, ya, tÞ can be calculated as alinear combination of the voltage responses of each individual point target as:
Vrecðxa, ya, tÞ ¼ðð
x,y
ðτsðxa � x, ya � y, zo, t� τÞΛzoðx, y, τÞdτ dxdy ð11Þ
Eq. (11) represents a space-time convolution along the co-ordinates x, y, and t, and can bewritten as
Vrecðx, y, tÞ ¼ szoðx, y, tÞ⊗Λzoðx, y, tÞ ð12Þ
where Λzoðx, y, tÞ is a 3D image including the feedbacks connected with the distributed targetsat the positions ðx, y, zoÞ. The 3D matrix szoðx, y, tÞ symbolizes the point-spread function of theUWB GPR system for a depth z ¼ zo and can be approximated by forward modeling for
different antenna positions ra! and a point scatterer with IR δ t� j r!a � r!oj
v
!. An example of a
3D point-spread function for a UWB GPR system and a point scatterer at 6 cm of depth is givenin Figure 18.
Even though the point-spread function szoðx, y, tÞ depends on the depth z ¼ zo, its contour willnot be altered very much with changes in z. Basically, the point-spread function could be usedfor a broad depth range. Accordingly, the point-spread function szoðx, y, tÞ can be treated asspace invariant. Therefore, the migrated image Mðx, y, tÞ can be calculated as a deconvolution
of the recorded data Vrecðra! , tÞ with the point-spread function szoðx, y, tÞ, where zo is chosen tobe the most likely depth for an object. In the application of demining, zo is taken 6 cm. Thedeconvolution can be performed in the frequency-wavenumber domain, using a Weiner filter,which makes the migration scheme very simple and not computational intensive. More detailson the presented migration method can be found in Ref. [5].
Figure 18. Synthetic C-scan of a fictive point scatterer at a depth of 6 cm below the air-ground interface, calculated byforward modeling.
Ground‐Penetrating Radar for Close‐in Mine Detectionhttp://dx.doi.org/10.5772/67007
71

Figures 19–21 show the results of the migration method on data taken by a laboratory UWBGPR described in Section 2.3, with the antennas mounted on an indoor xy-scanning table. Thedata are acquired over an area of 50 cm � 50 cm with a step of 1 cm in both x- and y-direction.Results are shown in Figure 19 for a PMN mine buried at 5 cm of depth in sand, in Figure 20for a brick of dimensions 15 cm � 9 cm � 6 cm buried at the same depth, and in Figure 21 for apiece of 20 cm barbed wire. There is a green, three-dimensional representation of the collecteddata in each of the figures, which is obtained after applying first a Hilbert transformation to theA-scan in order to calculate the cover for each A-scan. As a second step, the data are plotted byan isosurface 3D plot, accentuating all the pixel of a given intensity or higher. In each figure,the raw data are plotted the left. On the right, the migrated image is displayed. For clarity, theground reflection is suppressed in Figures 20 and 21. When observing the targets from above,the rounded form of the PMNmine is clearly displayed, and the form of the brick is more box-like. Figure 21b shows how the form of the barbed wire can be easily distinguished from the
Figure 19. Results after applying deconvolution in order to focus the data collected on a PMN mine (diameter of 11 cm)located at 5 cm depth. (a) Photo of PMN mine ; (b) 3D C-scan view of raw data; (c) 3D C-scan view of migrated data; (d)2D C-scan horizontal slide of migrated data.
Mine Action - The Research Experience of the Royal Military Academy of Belgium72

other two forms and the three sets of pins present on the real wire are clearly noticeable. It isdemonstrated with these three examples that the shape of a target in the subsoil can beextracted from the data gathered by the UWB GPR after applying the migration procedureexplained above.
The aim of migration is not only to focus reflections on objects back into the true physicalshape of the object but also into its true position. To illustrate the latter, an AP mine was buriedunder an angle of about 30� in dry sand, with the highest point of the mine at a depth of 5 cm.In the raw B-scan presented in Figure 22a, the strongest reflections on the mine are found inthe lower right corner of the image, whereas in reality the mine (designated by the rectangularbox) is situated in the middle of the image. This shift can be simply explained as follows. When
Figure 20. Results after applying deconvolution in order to focus the data collected on a brick (15cm � 9cm � 6cm)located at 5 cm depth. (a) Photo of the brick; (b) 3D C-scan view of raw data; (c) 3D C-scan view of migrated data; (d) 2DC-scan horizontal slide of migrated data.
Ground‐Penetrating Radar for Close‐in Mine Detectionhttp://dx.doi.org/10.5772/67007
73

the antennas are right above a tilted object, the latter will appear as a strong reflection in adirection away from the receiving antenna. For the antennas in the direction perpendicular tothe flat top of such a target, the reflections going toward the receiving antenna will be strongerthan in the case the antennas are right above the tilted object, causing a displacement ofthe target in the raw data. Figure 22b shows how, after applying the migration using thedeconvolution approach presented before, the target is found in its actual position. Results ofthe migration not only show that the target was at the wrong position in the raw data, but alsoclearly show that the target is tilted. Because of the different backscatter structures in thetarget, its dimensions in the z-direction could be wrongly estimated. However, the position(in time or space) of the first reflection on the target (the specular reflection) will be accurateand reliable. As a consequence, the reconstruction of the envelope of buried objects will becorrect. Comparison has been done with other migration methods, like Kirchhoff migrationand Stolt migration, applied on the same data, which led to less satisfactory results than the
Figure 21. Results after applying deconvolution in order to focus the data collected on barbed wire (approx. 20 cm length)located at 5 cm depth. (a) Photo of the barbed wire; (b) 3D C-scan view of raw data; (c) 3D C-scan view of migrated data;(d) 2D C-scan horizontal slide of migrated data.
Mine Action - The Research Experience of the Royal Military Academy of Belgium74

proposed deconvolution approach. In Figure 22c, the results after applying Kirchhoff migra-tion can be seen. Although more information could be extracted from the migrated data, theKirchhoff migration is not able to place the object completely back in its correct position.
3.5. Target classification
GPR may allow detecting buried objects such as metallic and nonmetallic AP landmines.However, this detection technique can be affected by false alarm rates as other reflectors (e.g.,stones, metal fragments, roots) can produce similar echoes. In this regards, resonance featuresin backscattered signals are proposed here in order to identify unknown targets. These featurescan be studied in either the time-domain (TD) or the frequency-domain (FD). In Ref. [33],functions of both variables, time and frequency, are considered for this particular application.Time-frequency distributions, which are 2D functions, can reveal the time-varying frequencycontent of 1D signals. One of these 2D functions is the Wigner-Ville distribution (WVD), which
Figure 22. Oblique PMN mine under an angle of 30�. (a) Raw data, (b) image after migration by deconvolutions, and (c)image after Kirchhoff migration.
Ground‐Penetrating Radar for Close‐in Mine Detectionhttp://dx.doi.org/10.5772/67007
75

is widely used for target recognition. This section shows how the application of the WVD onGPR data can yield to extract important information about the physical features of APlandmines located in the subsoil.
The WVD is one of the approaches of the time-frequency representations. It has a mainadvantage when compared to other representations such as the short-time Fourier transformor spectrogram, which is a higher time resolution. The WVD of a 1D signal sðtÞ, sWVDðt, f Þ, canbe expressed as
sWVD t, fð Þ ¼ðsa tþ τ
2
� �þ s�a t� τ
2
� �e�i2πf τdτ, ð13Þ
where
sa ¼ s tð Þ þ isðtÞ ð14Þ
is the analytic signal consisting of the real signal sðtÞ and its Hilbert transform
s tð Þ ¼ 1π
ðsðτÞ1� τ
dτ, ð15Þ
and s�aðtÞ is its conjugate.Figure 23 represents the WVD of one A-scan from Figure 16 (AT landmine). The WVD isapplied only to the A-scan containing the highest amount of energy backscattered from thetarget, calculated after filtering and migration. The dotted line in the left figure represents rawdata acquired with the SFCW UWB GPR and filtered data are presented with the solid line.
At any time (frequency) point, the WVD can be considered as the summed spectrum (correla-tion) of the signal power at this point and the cross-power of two signals parts, spacedsymmetrically with respect to the current time point.
Figure 23. WVD (right) applied to a filtered and migrated A-scan data (left) for an antitank landmine buried in sand(from Figure 16).
Mine Action - The Research Experience of the Royal Military Academy of Belgium76

As this distribution is a two-dimensional representation (matrix) of a one-dimensional signal,this transform inferred a given amount of redundancy. In order to confront this problem, Ref.[34] suggested the singular value decomposition (SVD), which is used here in conjunction withthe concept of the center of mass (CM) to extract discriminant features [35].
SVD is intended for representing the WVD matrix Ws with its singular values and singularvectors, which are unique for any matrix:
Ws½m, n� ¼ U½m,m�X
½m, n�V½n, n� ð16Þ
where the matrixes U and V consist of the left-singular and right-singular vectors, respectively,and the matrix Σ consists of the singular values. Particularly, any matrix can be disintegratedinto a number of singular triplets {uk, σk, vk}, with k ¼ 1 … minðM,NÞ, where each singularvalue σk can be considered as the square root of the corresponding triplet energy. Besides, therows and columns of Ws symbolized, respectively, the distribution of the energy in time(related to the singular vectors vk) and in frequency (related to the singular vectors uk).
Since the singular values and vectors are unique for any matrix, these triplets contain energy,time, and frequency features which help in discriminating different targets. Therefore, follow-ing Ref. [35], the CM (the center of mass is the strongest point in any distribution) of thesingular vectors vk and uk is used as time and frequency features and the singular value σk asenergy feature for each triplet {uk, σk, vk},. After analyzing different triplets, we find that thefollowing normalized features from the first triplet provide the best discriminant results:
δt ¼ 1N
XNn¼1
nv1½n�2 ð17Þ
δf ¼ 1M
XMm¼1
mu1½m�2 ð18Þ
δe ¼ σ1XminðM,nÞ
k¼1
σ2k
ð19Þ
This approach is applied to different targets, including landmines, improvised explosivedevices (IED), and false alarms (FA), which are buried in different types of soils. A descriptionof the targets is done in Table 3.
Figure 24 shows the calculated values from Eqs. (17) to (19) for targets of Table 3. The featuresof the AP landmines are well clustered and well separated from those of the metallic falsealarms and stones. The false alarms are clearly separated as well. Classification betweendifferent AP landmines (with different shapes) and between different IEDs (with differentmaterials) could be also obtained. Results also show that the extracted features could beindependent of the target depth.
Ground‐Penetrating Radar for Close‐in Mine Detectionhttp://dx.doi.org/10.5772/67007
77

4. Conclusions
In this chapter, two of the major challenges in the application of GPR in humanitariandemining operations are addressed: (i) development and testing of affordable and practicalGPR-based systems, which can be used off-ground and (ii) development of robust GPR signalprocessing techniques for landmine detection and identification.
Different approaches developed at RMA in order to demonstrate the possibility of enhancingclose-range landmine detection and identification using GPR under laboratory and outdoorconditions are summarized here. Raw GPR profiles give us a large quantity of informationabout the underground, and therefore performant signal processing techniques are needed tofilter and improve the data quality in order to extract the right information. Data acquiredusing different affordable and practical GPR-based systems are used to validate a number ofpromising developments in signal processing techniques for target detection and identifica-tion. Removing undesirable reflections by filtering and focusing the data using migrationalgorithms are some of the techniques applied in image reconstruction which are introduced
Target Type Shape Diameter (cm) Metal content
C3A1 Plastic AP Irregular 5.1 Low
PMA Plastic AP Rectangular 15.2 Low
Stone1 FA Irregular 12.0 No
Metallic can FA Irregular 12.0 High
IED5 PVC Cylindrical 6.3 No
IED6 PVC Cylindrical 6.3 Low
IED7 Glass Cylindrical 5.5 No
IED8 Glass Cylindrical 5.5 Low
Stone2 FA Irregular 8.0 No
Metallic debris FA Irregular 6.0 High
Table 3. Some characteristics of the objects used.
Figure 24. Extracted features from different targets buried at different depths.
Mine Action - The Research Experience of the Royal Military Academy of Belgium78
here. The proposed approaches have been validated with success for the imaging, detectionand classification of buried objects in laboratory and outdoor conditions. Validation has beendone for different scenarios, including AP, low-metal content landmines and IEDs, and realmine-affected soils.
Acknowledgements
The work presented in this chapter was carried out at the Signal and Image Centre, ÉcoleRoyale Militaire, Belgium, in collaboration with the Microwave Engineering and AppliedElectromagnetism Department, the Telecommunications Laboratory and the Dept. of Environ-mental Sciences and Land Use Planning of the UCL (Belgium), and with the Dept. de IngenieraEléctrica y Electrónica of the Universidad de Los Andes (Colombia). They were funded by theMinistry of Defense of Belgium in the scope of HUDEM and BEMAT projects. The InstitutoColombiano para el Desarrollo de la Ciencia y la Tecnología—Colciencias (Colombia), theBatallón Baraya (Colombia) and the Escuela de Ingenieros Militares (Colombia) are gratefullyacknowledged for their outstanding support during some trials.
Author details
Olga Lucia Lopera Tellez* and Bart Scheers
*Address all correspondence to: [email protected]
CISS Department, Royal Military Academy, Brussels, Belgium
References
[1] MacDonald J, Loockwood J, Altshuler T, Broach T, Carin L, Harmon R, Rappaport C,Scott W, Weaver R. Alternatives for Landmine Detection. Santa Monica, CA: RAND; 2003
[2] Acheroy M. Mine action: Status of sensor technology for close-in and remote detection ofanti-personnel mines. Near Surface Geophysics. 2007;5:43-55
[3] Daniels D. Ground Penetrating Radar. London: The Institution of Electrical Engineers;2004
[4] Lopera O. An integrated detection and classification methodology applied to ground-penetrating radar for humanitarian demining applications [PhD thesis]. Catholic Univer-sity of Louvain, Royal Military Academy; 2008
[5] Scheers B. Ultra-wideband ground-penetrating radar with application to the detection ofantipersonnel landmines [PhD thesis]. Catholic University of Louvain, Royal MilitaryAcademy; 2001
Ground‐Penetrating Radar for Close‐in Mine Detectionhttp://dx.doi.org/10.5772/67007
79
[6] Nicolaescu I, van Genderen P, van Dongen K, van Heijenoort J, Hakkaart P. Steppedfrequency continuous wave radar-data preprocessing. In: Proceedings of the 2nd Inter-national Workshop on Advanced GPR; 2003; The Netherlands: Delft. pp. 177-182
[7] Giannopoulos A. GprMax2D/3D V2.0 User Manual. Edinburgh: University of Edinburgh;2005
[8] Yarovoy A, Kovalenko V, Fogar A. Impact of clutter on buried object detection by groundpenetrating radar. In: International Geoscience and Remote Sensing Symposium; 2003;France. pp. 755-757
[9] Lagman A. The design of hardware and signal processing for a stepped frequencycontinuous wave ground penetrating radar [PhD Thesis]. Cape Town, South Africa:University of Cape Town; 2002
[10] Sato M, Fang G, Zeng Z. Landmine detection by a broadband GPR system. In: Interna-tional Geoscience and Remote Sensing Symposium; 2003; France
[11] Chignell RJ, Hatef M. LOTUS—A real time integrated sensor suite for antipersonnel minedetection, incorporating the MINETEC GPR. In: Yarovoy, editor. Tenth International Con-ference on Ground Penetrating Radar; Delft, The Netherlands: TUDelft; 2004. pp. 689-692
[12] Scheers B, Plasman Y, Piette M, Acheroy M, Vorst AV. Laboratory UWB GPR system forlandmine detection. In: Proceedings of the Eighth International Conference on GroundPenetrating Radar; SPIE; 2000. pp. 747-752
[13] Yarovoy A, Ligthart L, Schukin A, Kaploun I. Polarimetric video impulse radar forlandmine detection. Subsurface Sensing Technologies and Applications. 2002;3:271-293
[14] Daniels D, Curtis P, Amin R, Dittmer J. An affordable humanitarian mine detector. In:SPIE, Detection and Remediation Technologies for Mines and Minlike Targets IX; 2004.pp. 1185-1193
[15] Sato M, Fujiwara J, Feng X, Zhou Z, Kobayashi T. Development of a hand-held GPR MDsensor system (ALIS). In: SPIE, Detection and Remediation Technologies for Mines andMinlike Targets X; 2005. pp. 1000–1007
[16] Pajewski L, Tosti F, Kusayanagi W. Antennas for GPR systems. In: Benedetto A, editors.Civil Engineer Applications of Ground Penetrating Radar. Springer International Pub-lishing; Switzerland, 2015. pp. 41-67
[17] CEN Workshop Agreement. Humanitarian Mine Action—Test and Evaluation—Part 2:Soil Characterization for Metal Detector and Ground Penetrating Radar Performance. Avail-able from: http://www.mineactionstandards.org/fileadmin/MAS/documents/cen-workshop-agreements/ 2008
[18] Kanda M. Time-Domain Measurements in Electromagnetics. New York: Van NostrandReinhold Company Inc.; 1986
Mine Action - The Research Experience of the Royal Military Academy of Belgium80

[19] Klaasen JJA. An efficient method for the performance analysis of bounded-wave nuclearEMP Simulators. Sensor and Simulation Notes, 1992; note 345
[20] Scheers B, Piette M, Vander Vorst A. Development of dielectric-filled TEM horn antennasfor UWB GPR. In: Millennium Conference on Antennas & Propagation AP-2000; Davos,Switzerland, vol. II, p. 187, April 2000
[21] Baum CE. Low-frequency-compensated TEM horn. Sensor and Simulation Notes. 1995;note 377
[22] Rumsey V. Frequency Independent Antennas. New York, USA: Academic Press Inc; 1966
[23] Lambot S, Slob E, van den Bosch I, Stockbroeckx B, Vanclooster M. Modeling of ground-penetrating radar for accurate characterization of the subsurface dielectric properties.IEEE Transactions on Geoscience and Remote Sensing. 2004;42:2555-2568
[24] Michalski K, Mosig J. Multilayered media Green's functions in integral equation formu-lations. IEEE Transactions on Antennas and Propagation. 1997;45:508-519
[25] Lambot S, Lopera O, Slob EC. Effect of the antenna height on the estimation of the soilelectromagnetic properties using Full-Wave inverse modeling of GPR data. In: Daniels JJ,Chen CC, editors. Proceedings of the 11th International Conference on Ground Penetrat-ing Radar; 2006; Columbus, Ohio, USA: The Ohio State University
[26] Daniels D, Curtis P. MINEHOUND trials in Cambodia, Bosnia and Angola. In: Broach JT,Harmon RS, Holloway, JH Jr., editors. Proceedings of the SPIE; 2006; Orlando, FloridaUSA. Vol. 6217. DOI: 10.1117/12.663537
[27] Sato M, Takahashi K, Fujiwara J. Development of the hand held dual sensor ALIS andits evaluation. In: International Workshop on Advanced GPR; 2007; Naples, Italy. IEEE; 2007
[28] Ritter K. AN/PSS-14 mine detection system offers improved countermine capability.Army AL&T Magazine. 2007;1:54-59
[29] Milisavljevic N. Analysis and fusion using belief functions theory of multisensor data forclose-range humanitarian mine detection [PhD thesis]. Belgium: Ecole Nationale Superieuredes Telecommunications, France, Royal Military Academy; 2001
[30] Lopera O, Slob E, Milisavljevic N, Lambot S. Filtering soil surface and antenna effectsfrom GPR data to enhance landmine detection. IEEE Transactions on Geoscience andRemote Sensing. 2007;45(3):707-717
[31] Lambot S, Weihermüller L, Huisman JA, Vereecken H, Vanclooster M, Slob EC. Analysisof air-launched ground-penetrating radar techniques to measure the soil surface watercontent. Water Resources Research. 2006;42:W11, 403. DOI: 10.1029/2006WR005,097
[32] Ozdemir C, Demirci S, Yigit E. Practical algorithms to focus B-scan GPR images: Theoryand application to real data. Progress in Electromagnetic Research B. 2008;6:109–122
Ground‐Penetrating Radar for Close‐in Mine Detectionhttp://dx.doi.org/10.5772/67007
81

[33] Lopera O, Milisavljevic N, Daniels D, Gauthier A, Macq B. A time frequency domainfeature extraction algorithm for landmine identification from GPR data. Near SurfaceGeophysics. 2008;6:411-421
[34] Marinovic N, Eichmann G. An expansion of Wigner distribution and its applications. In:Proceedings of ICASSP'85; 26-29 April 1985; Tampa, Florida USA. IEEE. pp. 1021-1024
[35] Savelyev T, van Kempen L, Sahli H, Sachs J, Sato M. Investigation of time-domainfrequency features for GPR landmine discrimination. IEEE Transactions on Geoscienceand Remote Sensing. 2007;45:118-129
Mine Action - The Research Experience of the Royal Military Academy of Belgium82