groundwater dewatering mitigation system for freeze -up
TRANSCRIPT
CGU HS Committee on River Ice Processes and the Environment 19th Workshop on the Hydraulics of Ice Covered Rivers Whitehorse, Yukon, Canada, July 9-12, 2017.
Groundwater Dewatering Mitigation System for Freeze-up Ice Jams at the Town of Peace River, Alberta
Martin Jasek 1, Sarah Alloisio 2, Bryan Robinson 3
1BC Hydro, 6911 Southpoint Drive, Burnaby, BC V3N 4X8
2 Formerly at Fresh Water Solutions Ltd.; currently at Palmer Environmental Consulting Group Inc., 470 Granville Street, Suite 630, Vancouver, BC V6C 1V5
3 Formerly at Fresh Water Solutions Ltd.; currently with the BC Ministry of Forests, Lands and Natural Resource Operations, 10428 153th Street, Surrey, BC V3R 1E1
BC Hydro owns and operates the W.A.C. Bennett and Peace Canyon dams on the Peace River in northern British Columbia. BC Hydro along with Alberta Environment and Parks monitors the formation and break-up of the ice cover as it relates to the potential for ice-jam flooding at the Town of Peace River, Alberta. Despite operational procedures during ice cover formation, environmental factors can cause consolidations of the ice cover leading to high water level at freeze-up that can lead to groundwater seepage into basements in a low-lying subdivision in the town. This paper describes the design, implementation and operation of a groundwater dewatering system that was built by BC Hydro designed to mitigate groundwater seepage in the Lower West Peace Subdivision in the Town of Peace River, Alberta.
1. Introduction and Background BC Hydro owns and operates the W.A.C. Bennett and Peace Canyon dams on the Peace River in northern British Columbia. BC Hydro along with Alberta Environment and Parks monitors the formation and break-up of the ice cover as it relates to the potential for ice jam flooding at the Town of Peace River, Alberta (Figure 1) about 400 km downstream of the power generating facilities. Despite dam release operational procedures during ice-cover formation, environmental factors can cause consolidations of the ice cover resulting in high water levels during freeze-up that can lead to groundwater seepage into basements in a low-lying subdivision in the town. Since the W.A.C. Bennett Dam construction, winter flows have been 3 to 4 times that of pre-dam conditions and this has caused elevated water levels at freeze-up. Dykes currently protect the town from overland flooding from these events. Basement seepage events have not been that frequent and occurred in 1982, 1992, 2005 and 2008 since the construction of the dam in 1972, i.e. about once every 10 years on average. Nevertheless, due to the occurrence of two groundwater seepage events in 4 years, BC Hydro committed in 2008 to with the development and implementation of a permanent solution to the problem. The alternative of decreasing flows/decreasing electrical power generation in reaction to these events would be considerably more expensive. After the 2005 event, BC Hydro commissioned the first groundwater study of the problem (PMEL, 2005). After the 2008 event BC Hydro commissioned the installation of six test wells in 2009 (PMEL, 2009) and three higher capacity wells in 2010 (PMEL, 2010). BC Hydro also gave funding to about 20 residents to install new and improve existing sump pumps and pits in their basements. The 9 wells were used in subsequent years to mitigate the freeze-up events leading to high river and groundwater levels. However, this required considerable effort in planning and execution since there was no plumbing system attached to these wells. The operating wells were connected to overland hoses discharging into the river and loud diesel generators were required to run the pumps, causing community disruptions. Personal had to be on site 24/7 for up to two months per event while the river level remained high. Installing these first 9 wells was the easy part, installing the plumbing, power supply, discharge outfall to the river and determining the exact number and placement of wells would take considerable effort and another 6 years to complete. During those years, the 9 wells were utilized successfully for the high water event in 2012, which was smaller than the event of record (2005). The operation of the wellfield provided some very key and useful calibration data, as by that time a network of piezometers had been installed in the subdivision.
2. Groundwater modelling for preliminary wellfield design A groundwater model was developed in 2012 (Alloisio, 2012). The model, which is illustrated conceptually in Figure 2, shows river water recharging the groundwater during high river levels and groundwater draining back to the river during low river level conditions. Based on the conceptual model, a numerical groundwater flow model was developed using the industry-standard groundwater flow modelling package MODFLOW-SURFACT v.3.0 (HydroGeoLogic, 1998). MODFLOW-SURFACT is a commercially available software package based on the USGS (US Geological Survey) public domain software MODFLOW (McDonald and Harbaugh, 1988; Harbaugh et al., 2000). MODFLOW is a 3-D numerical groundwater flow

finite-difference model. The model simulates groundwater heads and flows in response to different external factors, such as recharge, groundwater pumping/injection and interaction with surface water bodies. MODFLOW-SURFACT has additional functionalities compared with MODFLOW, which increase its capability to simulate complex physical processes. These include flow in variably saturated conditions, flow near multi-layer pumping wells, and more robust numerical solvers (HydroGeoLogic, 1998). Measured river levels along the Town of Peace River’s Lower West Peace Subdivision for the 2008 and 2012 winters were used to define the model boundary condition that represents the flow interaction between the Peace River and the adjacent Quaternary aquifer (Figure 3a,b,c). Figure 4 shows river cross sections that were used to help define the river bed surface of the groundwater model. Ground surveys in the subdivision were used to define the 3-D ground surface of the groundwater model (Figure 5). Groundwater level measurements in 2012 from 21 piezometer locations indicated variable response of the groundwater to increased river levels as shown in Figure 6. The groundwater table responded relatively quickly at the north end of the subdivision and showed a progressively delayed response in the southern direction. Even for piezometers located a similar distance from the river, the ones further south had a delayed response. This indicated the hydraulic conductivity of the alluvial aquifer underlying the Subdivision was not homogeneous and created an additional complexity in calibrating the groundwater model. Well logs and pumps tests from PMEL (2008) and PMEL (2009) were used to identify different layers of different hydraulic conductivity in the aquifer (Figure 7) and to estimate the hydraulic conductivity values for these layers (Figure 8). The spatial distribution of zones of hydraulic conductivity and their values was identified by means of trial-and-error calibration. The portion of the model’s two upper layers underlying the Subdivision was assigned a hydraulic conductivity value of 15 m/d, which represents the fine silt and clay semi-confining horizon, and the main aquifer was represented as one zone with hydraulic conductivity of 400 m/d, which is typical of sand and gravel deposits. The portion of the model representing the aquifer outside the Subdivision, where no information is available, was assigned a hydraulic conductivity of 50 m/d, which allowed plausible inflows and outflows across the model southern and northern boundaries. In order to reproduce the observed differences in groundwater level response delay and magnitude, a low-conductivity (ranging from 15 to 30 m/d) linear zone running approximately in a N-S direction, which represents a possible palaeo-channel, was introduced within the gravel unit in the lower three model layers. This is shown as the narrow red feature in Figure 8. The presence of this channel was key to achieve a reasonable model calibration, as it significantly reduced the discrepancy between the observed and modelled groundwater hydrographs. This provides a strong indication that a palaeo-channel acting as a leaky hydraulic barrier may indeed be present in the gravel aquifer. Since no surface expression of a palaeo-channel can be detected on site or from the available aerial photographs, and it cannot be identified from the available lithologic logs, further hydrogeological testing would be needed to confirm its presence. Figures 9 and 10 show the results of the calibration. The calibrated groundwater model simulated observed groundwater levels within +/- 0.6 m.
Once the groundwater model was calibrated, several prediction runs were carried out. The river level changes considered in the predictions were represented using the measured river levels in winter 2005 (Figure 3a), when the most severe groundwater seepage event to date was recorded. The first prediction run simulated the 2005 design event without any pumping mitigation to determine which basements were affected by groundwater seepage and for what durations (Figure 11). The number and duration of basements affected were consistent with the actual reports in 2005. This gave additional confidence in the model calibration. The next prediction run consisted in representing groundwater pumping from the 9 already installed groundwater wells during the winter 2005 event (Figure 12a). This simulation indicated that although no basement seepage resulted, many of the groundwater levels were very close to the basement floor elevations (i.e. within 0.2 to 0.5 m). As this distance was within the modeling uncertainty, it was determined that more wells were needed for a reliable groundwater mitigation solution. Several simulations with more wells placed in different locations were conducted and ultimately an 18-well configuration (Figure 12b) was found to be effective in keeping groundwater levels 1 m or more below all the basements in the Subdivision, during the 2005 design event. The total pumping required from the wellfield to ensure groundwater seepage control was 4,540 L/min (1,200 US gpm). The study also considered a network of French drains, which the model showed to be highly efficient at reducing groundwater levels. However, this solution was abandoned in favor of groundwater wells, since its construction and maintenance would be more disruptive for the residents in the Subdivision. The study also reviewed the option of constructing a slurry cut-off wall that would prevent the river water from entering the aquifer under the subdivision. However, this solution would be extremely expensive and would still require the installation of a dewatering system to collect and pump precipitation and drainage water over the cut-off wall to the river.
3. Final well location determination and construction In 2015, the groundwater model was further refined by Alloisio (2017) based on additional pumping tests and groundwater model simulations, to establish a final wellfield design consisting of 19 wells (Figure 13). The groundwater model was used to define the new well locations taking into account avoidance of private land, avoidance of other buried utilities and proximity to proposed pipeline corridors for the dewatering system. Step pumping tests of the 10 new wells and 9 rehabilitated older wells indicated that the hydraulic conductivity of the main sand gravel unit was likely in the range between 500 and 800 m/d rather than 400 m/d determined in the previous study. The upper bound of 800 m/d was used as the new representative K value for the main sand and gravel unit in the groundwater flow model, so that the wellfield performance simulated in the model would account not only for the model uncertainty but also for the need to design a system with redundancy. The result of the predictive run based on a hydraulic conductivity of 800 m/d led to an increase of approximately 930 US gpm (3,520 L/min) in the total pumping rate required to achieve the basement seepage target. Therefore, the selected dewatering system was recommended to be designed to pump as much as 2,130 US gpm (8,060 L/min). This design flow rate distributed among the 19 individual wells was expected to result in groundwater levels maintained at least 1 m below the basement
elevations during a high river level event of the same duration and magnitude as the one recorded in the winter of 2005 (Figure 13). Construction of 5 additional wells and 10 additional piezometers occurred in the spring of 2015 and after some additional modeling to fine tune location details and to calculate sustainable pumping rates, another 5 wells were installed in the fall of 2015. A system test was conducted as part of Alloisio (2017) study, which demonstrated that, also in the presence of well interference, the individual maximum well yield would be sufficient to achieve the total design pumping rate. The construction of the piping network connecting the wells and the discharge outfall structure to the river occurred in the summer of 2016. The location of all pumping wells, piezometers, the pipe network, and the outfall structure are shown in Figure 14 and some construction photographs are shown in Figure 15. Full instrumentation of all pumping wells and water level sensors in all 10 piezometers was completed in the summer/fall of 2016. This information provides real-time water level, flow, and pump performance information, which by means of BC Hydro's OI/PI data acquisition system is available in their offices in Burnaby, British Columbia, and on remote laptops (Figure 16). A protection and control system for the pumps and Variable Frequency Drives (VFDs) have also been installed to optimize the pumping system. The system can be run in automatic mode based on water level and pumping flow rate logic but manual override for all or each individual pump is possible to fine tune the system (Ready Engineering, 2016). Figure 17 shows one of the control kiosks next to a production well and the main control kiosk where all pumps can be started and stopped simultaneously. Figure 18 shows an elevation view of the river outfall structure designed by Northwest Hydraulics Consultants (2016). Considerations included Peace River ice-jam elevation levels and leak proof piping underneath the dyke in addition to rip-rap and plunge pool design based on water velocity criteria. Photographs of the outfall during a system test in the summer of 2016 are shown in Figure 19.
4. Performance of groundwater dewatering system during the 2016 and 2017 winters
4.1 Winter freeze-up 2016 Going into winter of 2015-2016, all 19 wells, piping to collect all the discharges from the wells and the discharge outfall had already been constructed. The following remained to be installed: well and piezometer pressure transducers to measure water levels, flow meters for each of the wells and the overall telemetry for the system. In addition, some pumps were still on order or were undergoing size specifications. Unfortunately, two freeze-up consolidation events occurred on January 25 and 26 producing 3-day sustained peak river levels between 318.0 and 318.2 m compared to the design 2005 event with a 3-day peak of about 317.6 m (Figure 20). The lowest basement elevation (315.3 m) is also shown in Figure 20. Comparing the 2005 and 2016 events indicates that for the first 3 weeks of the event, the 2016 river levels were about 0.5 m higher than in the 2005 design event. In response to the high river levels in January 2016, some missing pumps were rented and the groundwater dewatering system was activated with 14 out of the 19 wells operating. Pumps were started in the last few days of January and daily manual readings of the 10 piezometers were taken throughout most of pumping period that ended on March 15, when a thermal break-up of the ice cover occurred and river levels returned to below the lowest basement elevation. Some
manual measurements of individual pump discharges and the outfall were made, which provided less accurate and discontinuous records than if flowmeters had been installed by this time. Nevertheless, it was possible to use these data to determine that the system worked better than expected and kept basements dry despite that the 2016 event being higher than the design 2005 event, and with only 14 out of 19 pumps operating. Figure 21 shows the ice jam on the Peace River and high water levels at the discharging outfall structure on January 29, 2016. A comparison of Figure 21 with Figure 19a shows the difference between a typical summer river level and this very high winter freeze-up event. Total instantaneous pumping flow rates, which were calculated based on the photographs (Figure 22 and 23) using the method described by USGS (2010) were 4,900 L/min (1,300 US gpm) on January 29, 2016 and 7,600 L/min (2,000 US gpm) on February 1, 2016, the latter being close to the design pumping rate of 8,060 L/min (2,130 US gpm), but with only 14 out of 19 wells pumping. The 2016 event data have not been analyzed or used to fine tune the calibration of the groundwater model but this is something that could be done in the future.
4.2 Winter freeze-up 2017 The freeze-up at the Town of Peace River occurred on February 7, 2017. Water levels were lower than normal at the Water Survey of Canada (WSC) gauge downstream of the subdivision. A manual survey at the WSC gauge on February 9, 2017 16:05 MST indicated a water level of 314.63 m with a high-water mark at 314.97 m. This was below 315.5 m and very close to the desired target level of 315.0 m. This location is about 3 km downstream of the north end of LWPRS. The water levels at the subdivision were about 1 to 2 m higher than at the WSC gauge depending on location and are depicted in Figure 24. This suggested a higher slope than usual as the water level at the subdivision after freeze-up in the past had generally been 0.5 to 1.3 m higher than at the WSC gauge and about 0.3 m higher during open-water conditions. This may be explained by the rougher than usual ice cover that formed in this reach in the 2017 winter. Figure 24 shows that the river levels next to the subdivision were above the lowest basement for about 18 days between February 7 and 25. The pumping system was activated on February 16, 9 days after freeze-up to test the completed system with higher groundwater levels than the summer test and partially as a precaution for seepage. The groundwater level traces show a reverse in trend when the system was turned on February 16. However, on February 19 the river levels started to decrease. The Peace Canyon dam discharges were held constant between February 4 and March 7 to promote a stable ice cover at the town of Peace River so this decrease was not a result of reduced flows from the dam. The decrease in river level was due to the return of colder weather causing ice formation upstream which was putting river flow into channel storage. Further decrease was likely due to flushing of frazil ice from high velocity areas of the river channel underneath the ice cover and depositing in low velocity areas, thus increasing the conveyance capacity of the channel. Although the lowest groundwater levels during pumping coincided with the lowest river levels around March 10, groundwater levels were 2.5 to 4 m below river levels at this time indicating a significant effect of the pumping system. The recovery of the groundwater table after the pumps were turned off on March 13 indicate a rapid recovery at similar rates as during the river freeze-up in early February.

Figure 25 shows the total and individual well pumping rates during February – March, 2017. Initially, the system was started in the fully automatic mode on February 16. A short power outage on February 17 caused the system to shut down and the system had to be restarted again in automatic mode. A few wells had water levels that were too low for them to operate in automatic mode and they had to be changed to manual mode at lower discharge for them to contribute to the overall pumping. One pump (PW2) did not start at all and needs to be repaired. The total pumping rate during this mostly automatic operation was about 4,600 L/min (1,200 US gpm). On February 18 more pumps were switched from automatic to manual mode to maximize the pumping rate and 6,000 L/min (1,600 US gpm) was achieved. This gradually decreased over the 25-day pumping period to 5,100 L/min (1,350 US gpm) as some wells switched off once the minimum flow rate sustained by the their VFD range was reached. Periodic manual tuning of the pumps was needed when they would occasionally turn off because water levels in the wells got too low. During a higher river event, this would likely not be an issue as groundwater levels would be higher. Figure 26 shows a qualitative assessment of the piezometer and well response (when not pumping) to river levels. These generally agree with the response shown on Figure 6.
5. Supplemental river discharge based mitigation Jasek and Trevor (2009) determined that another mitigation strategy is to increase river flows to flush frazil from underneath the freeze-up ice jam to increase the conveyance capacity of the channel. Although this raises river levels in the short term, over the course of the winter it may bring lower water levels than if flows were held constant or decreased. This can still be helpful because some groundwater levels in some parts of the subdivision take many weeks to get high enough to cause basement seepage. Although this mitigation strategy may not be enough to protect all basements on its own, it can be used in conjunction with the pumping system to shorten the pump-operation time or to mitigate future events that may be much greater than the design event.
6. Conclusions and recommendations for future operation This project highlights the successful application of groundwater modelling for the evaluation of alternative seepage control solutions and the design of a high-performance and cost-effective dewatering system during river freeze-up events. This demonstrates that the relatively simple representation of river-aquifer interaction of standard groundwater modelling software such as MODFLOW allows freeze-up events to be reproduced adequately for design purposes. Projecting the curvilinear trends shown on Figure 24 between freeze-up and when the pumps were turned on past the pumping start date, it appears unlikely that basements would have been impacted if the pumps had not been turned on this year. This is probably typical of the average year, where soon after freeze-up it may appear that basements will be impacted but eventually they are not, due to dropping river levels. This may cause a precautionary start-up of the system every year, unless river levels can be forecasted weeks or months into the future. The groundwater model can be used as a prediction tool, to determine the potential for basement impacts using a river level forecast as input. However, the pumps need to be operated routinely even when dewatering is not needed, in order to flush iron bacteria biofilm from the

well screens, and electricity costs are not large relative to the routine maintenance and other operating costs. The groundwater model may therefore not be required for operational use of the Peace River wellfield. The model was nonetheless a key tool for the design of an effective dewatering system at the Subdivision. Furthermore, the model could be used to determine how the automatic settings of the wellfield should be modified to adapt to significant changes in the river level freeze-up pulse, which could result from climate change. It was evident from the 2016 winter event that the pumping system can already handle something higher than the 2005 design event. It would be beneficial to use the groundwater model to determine the maximum high water level/duration event that could be handled by the pumping system. This would be important to know in advance in order to be able to recognize such an event if it were to happen, and if it were to occur, to be able recognize that other mitigation may be needed. Future work will include continuous monitoring of the wellfield performance in response to future freeze-up events, possible adaptation of the automatic pumping settings in case of significant changes in river level trends and determining the maximum water level/duration event that can be handled by the pumping system.
Acknowledgments The writers thank many that were involved in the successful completion of the project. Nick Vanderkwaak for wonderfully and skillfully managing the entire project for BC Hydro; Rod Smith for technical review of the groundwater modelling; David Strajt for BC Hydro technical overview; Dale Fehr and Wally Harder for onsite BC Hydro project management; Gabriel Ting and Rob Pimer at BC Hydro, for data integration of the SCADA system to BC Hydro’s OI/PI real-time telemetry system; and Kerry Paslawski for site water level readings, assisting in pumping tests and many other field tasks too numerous to mention. The authors are grateful to Bob Gammer and David Conway at BC Hydro, and Rick Thrall and his staff at LandLink for communications tasks with Town of Peace River and individual residents. Alberta Environment and Parks are thanked for donating the 2098E historical monitoring well and issuing of water licence permits. Finally, yet importantly, the writers and BC Hydro thank the Town of Peace River for assistance in infrastructure placement and the residents of Lower West Peace River Subdivision for their enduring patience during this lengthy project. The main contractor for the project was Barsi Enterprises Ltd. and sub-contractors were Anderson Water Services, Ketek Group, Ability Pump and Equipment, Smith Cameron Solutions, Ready Engineering Ltd., Lexus Engineering Ltd., EPI Energy Services, Main-Way Electrical Ltd., Sabre Controls Ltd., Northwest Hydraulic Consultants, Peace Sign and Graphics, Fresh Water Solutions, and Timberoot Environmental Inc.
References Alloisio, S., 2012. Lower West Peace River Subdivision – Basement seepage control. Report
prepared by Schlumberger Canada Limited for BC Hydro. Alloisio, S., 2017. Town of Peace River Lower West Peace River Subdivision – Wellfield
construction and pumping rate design. Report prepared by Fresh Water Solutions for BC Hydro.
Harbaugh, A.W., Banta, E.R., Hill, M.C., and McDonald, M.G., 2000, MODFLOW2000, the
U.S. Geological Survey modular groundwater model User guide to modularization concepts and the GroundWater Flow Process: USGS OpenFile Report 0092, 121 p.
HydroGeoLogic, 1998. MODFLOWSURFACT v. 3.0: A comprehensive MODFLOW-based
flow and transport simulator. HydroGeoLogic, Reston, VA. McDonald, M.G., and Harbaugh, A.W., 1988. A modular three dimensional finite difference
groundwater flow model. Techniques of Water Resources Investigations, Book 6. U.S. Geological Survey.
Northwest Hydraulics Consultants Ltd., 2016. PMEL, 2005. Geotechnical and Hydrogeological Investigation, Lower West Peace River
subdivision, Peace River, Alberta, PMEL File No A08-1068, 2005. PMEL, 2008. Geotechnical and Hydrogeological Investigation, Lower West Peace River
subdivision, Peace River, Alberta, PMEL File No A08-1068.1, September 17, 2008. PMEL, 2009. Hydrogeological Study, Lower West Peace River subdivision, Peace River,
Alberta, PMEL File No A10-1068.2, November 13, 2009. PMEL, 2010. Groundwater Management Plan, Lower West Peace River subdivision, Peace
River, Alberta, PMEL File No A10-1068.3, November 24, 2010. Ready Engineering, 2016. BC Hydro: Town of Peace River groundwater dewatering wells
control narrative. Report No. 8001C-R05-00006. Report prepared for BC Hydro. USGS, 2010. Estimating discharge from a pumped well by use of the trajectory free-fall or jet-
flow method. https://pubs.usgs.gov/tm/1a1/pdf/GWPD8.pdf

Figure 1. Location of Lower West Peace River Subdivision in the Town of Peace River, Alberta
(adapted from Alloisio, 2012). BC Hydro Bennett and Peace Canyon Dams about 400 km
upstream on the Peace River in British Columbia.
BC Hydro Bennett and Peace Canyon
Dams

Figure 2. Schematic of conceptual model for groundwater flow between river and the Lower
West Peace Subdivision (Alloisio, 2012).

Figure 3. River elevations for a) winter 2005 design event, b) winter 2008 high water level event
and c) winter 2012 model calibration event (Alloisio, 2012).

Figure 4. River cross sectional geometry used for the groundwater model (Alloisio, 2012).

Figure 5. Ground level elevation for groundwater model (Alloisio, 2012).
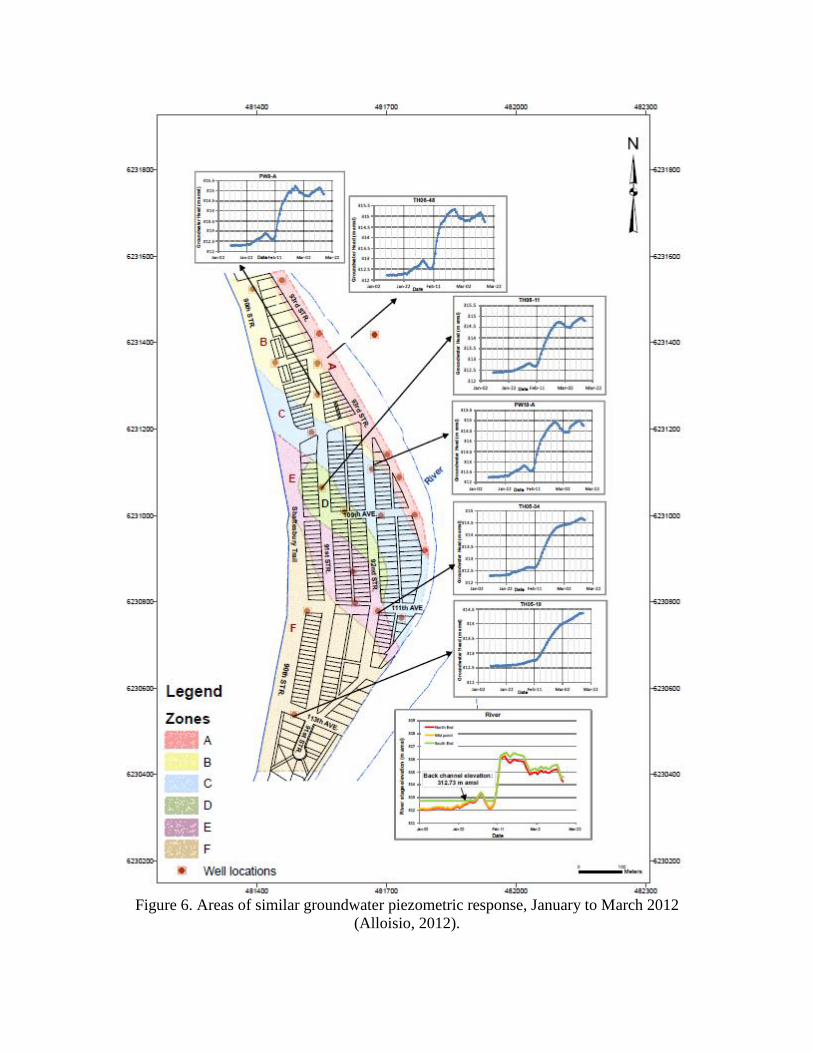
Figure 6. Areas of similar groundwater piezometric response, January to March 2012
(Alloisio, 2012).

Figure 7. Groundwater model grid, plan view, north-south cross section, east west cross section
(Alloisio, 2012).
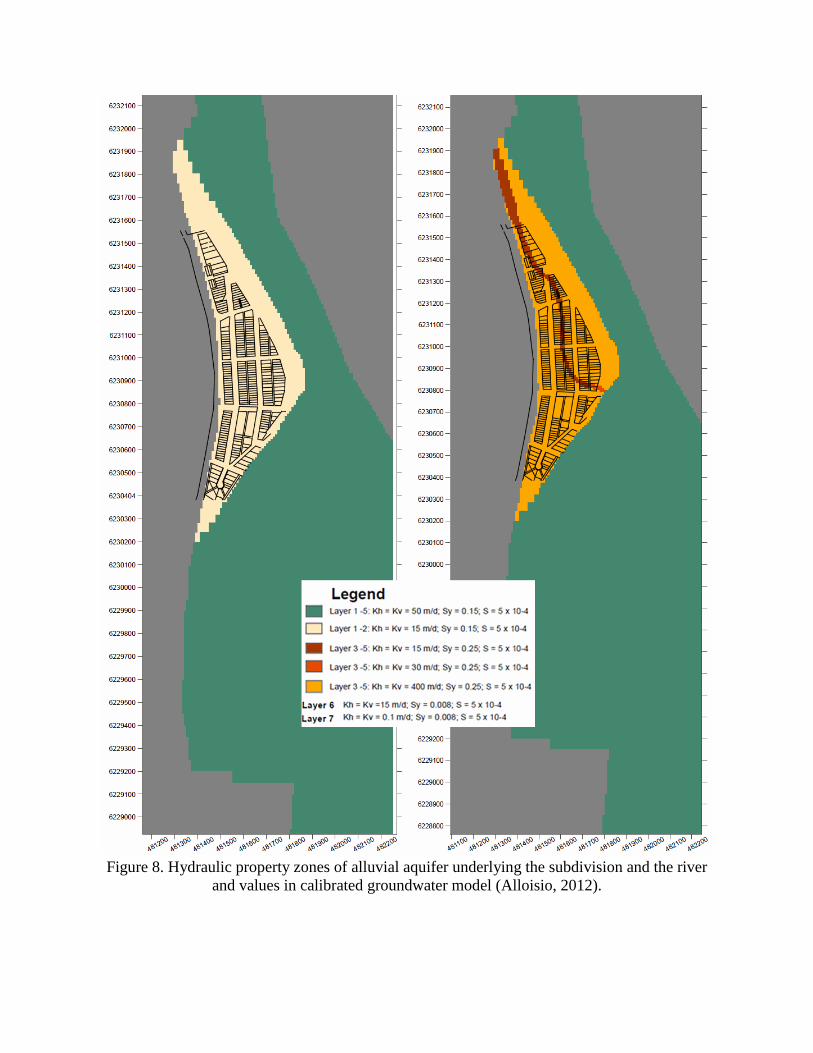
Figure 8. Hydraulic property zones of alluvial aquifer underlying the subdivision and the river
and values in calibrated groundwater model (Alloisio, 2012).

Figure 9. Example of eight groundwater elevation time series for observed and simulated ground
water levels during the winter 2012 (Alloisio, 2012). Pumping occurred from February 24 to March 6, 2012, in the field and also simulated in the model.
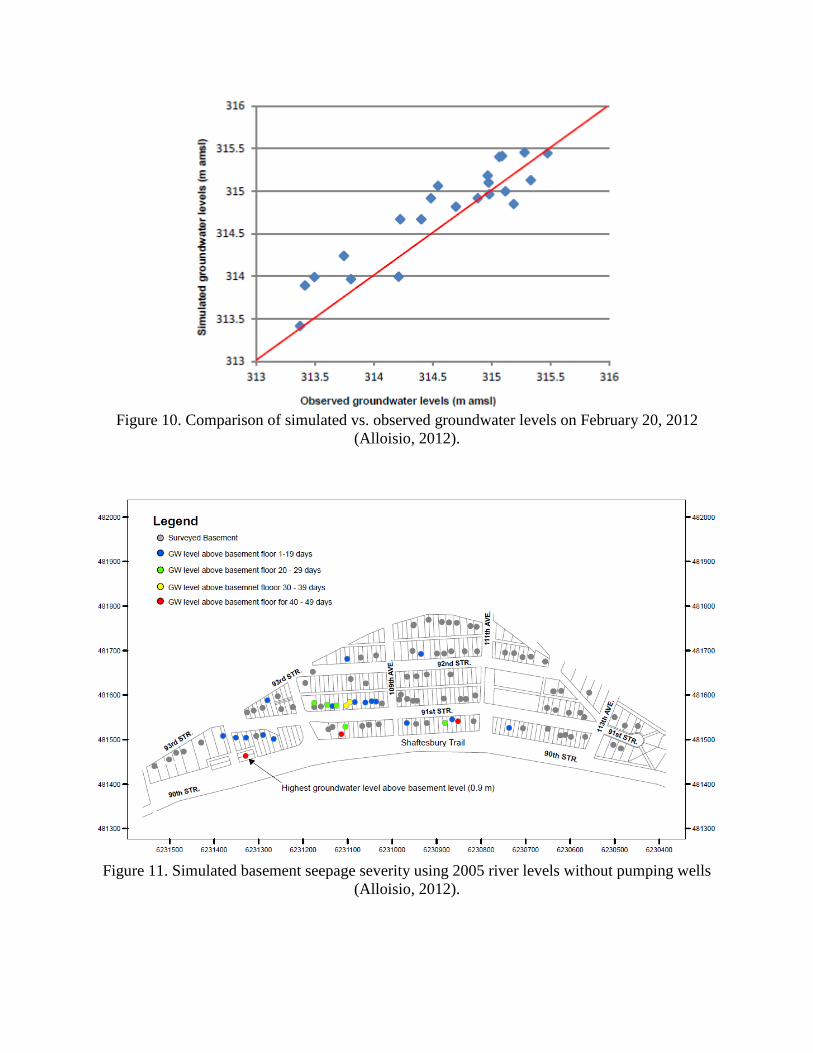
Figure 10. Comparison of simulated vs. observed groundwater levels on February 20, 2012
(Alloisio, 2012).
Figure 11. Simulated basement seepage severity using 2005 river levels without pumping wells
(Alloisio, 2012).

Figure 12. Simulated minimum distance between groundwater level and basement elevations for
2005 design event for a) 9 wells pumping and for b)18 wells pumping, (Alloisio, 2012).
a) b)
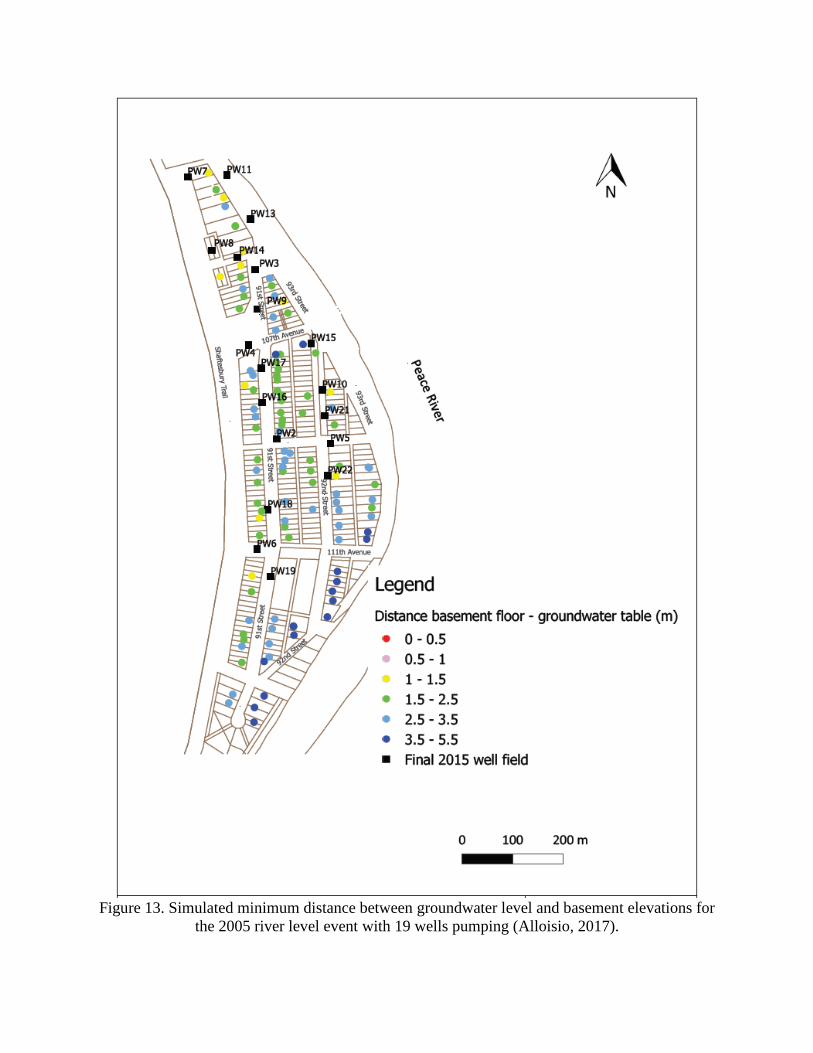
Figure 13. Simulated minimum distance between groundwater level and basement elevations for
the 2005 river level event with 19 wells pumping (Alloisio, 2017).

Figure 14. Locations of 19 constructed wells, 10 monitoring piezometers, water collection piping
network and water outfall.
Figure 15. Construction activities, a) well drilling, b) well installation, c) control kiosk to well
connection, d) pump test set-up with temporary flow meter.
a) b)
c) d)
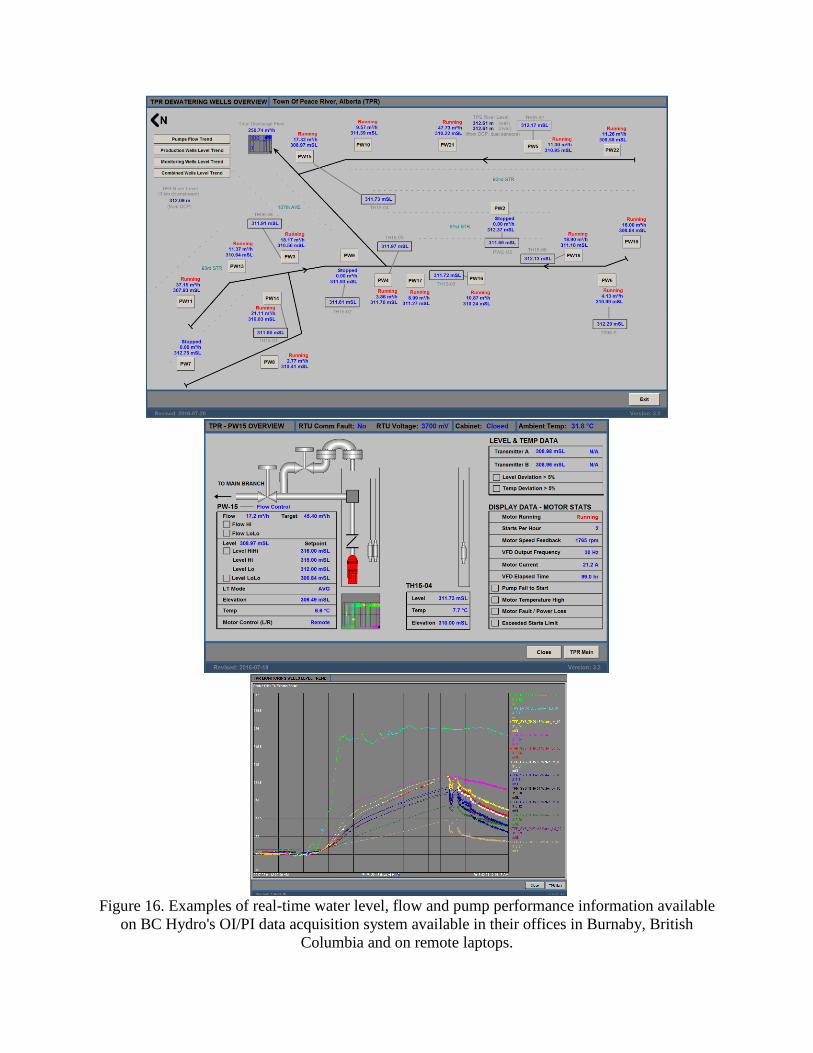
Figure 16. Examples of real-time water level, flow and pump performance information available
on BC Hydro's OI/PI data acquisition system available in their offices in Burnaby, British
Columbia and on remote laptops.

Figure 17. Finished control kiosk and production well and inside of main control kiosk.
Figure 18. Design of outfall structure, plunge pool and drainage channel to river by Northwest
Hydraulic Consultants (2016).

Figure 19. Photographs of outfall structure on July 19, 2016 during groundwater dewatering
system test.
a)
b)

Figure 20. River levels comparing the 2005 and 2016 freeze-up ice jam events and 2016
piezometer levels. Pumping of dewatering system occurred between January 27 and
March 15, 2016.
Figure 21. Photograph taken on January 29, 2016 of freeze-up ice jam on the Peace River and
discharging groundwater dewatering system outfall (Compare to summer - Figure 19a).
311
312
313
314
315
316
317
318
319
10
-Jan
17
-Jan
24
-Jan
31
-Jan
7-F
eb
14
-Feb
21
-Feb
28
-Feb
6-M
ar
13
-Mar
20
-Mar
27
-Mar
3-A
pr
10
-Ap
r
Elev
atio
n (
m) 2016
2005 (Time Shifted)
TH06-48
TH06-52
PW2-M2
TH15-01
TH15-02
TH15-03
TH15-04
TH15-05
TH15-06
Pumping Interval
Lowest Basement Elevation

Figure 22. Photograph of outfall on January 29, 2016. Q = 4,900 L/min (1,300 US gpm)
Figure 23. Photograph of outfall on February 1, 2016. Q = 7,600 L/min (2,000 US gpm)

Figure 24. River and groundwater levels in LWPR Subdivision, February – April, 2017. Warmer colours are for groundwater
levels with greater aquifer response to river levels and cooler colours are for a smaller response.
311.5
312
312.5
313
313.5
314
314.5
315
315.5
316
316.5
1-Feb 11-Feb 21-Feb 3-Mar 13-Mar 23-Mar 2-Apr 12-Apr 22-Apr
Elev
atio
n (
m)
2017
Lowest Basement
TPS River Gauge
River at Mid LWPR
River at Boat Launch
River at North End of LWPR
Mid LWPR (Surveyed)
Boat Launch (Surveyed)
North End LWPR (Surveyed)
TH06-48
TH06-52
TH15-01
TH15-02
TH15-03
TH15-04
TH15-05
TH15-06
PW2-M2
2098-E
PW02
PW03
PW04
PW05
PW06
PW07
PW08
PW09
PW10
PW11
PW13
PW14
PW15
PW16
PW17
PW18
PW19
PW21
PW22
River Freeze-upRiver Break-up
Pumping System On
Short Power Outage
Pumping Rates Manually IncreasedIndividually if Possible
Piezometers
Wells when Pumps are off
Manual Adjustments of nearby pumps
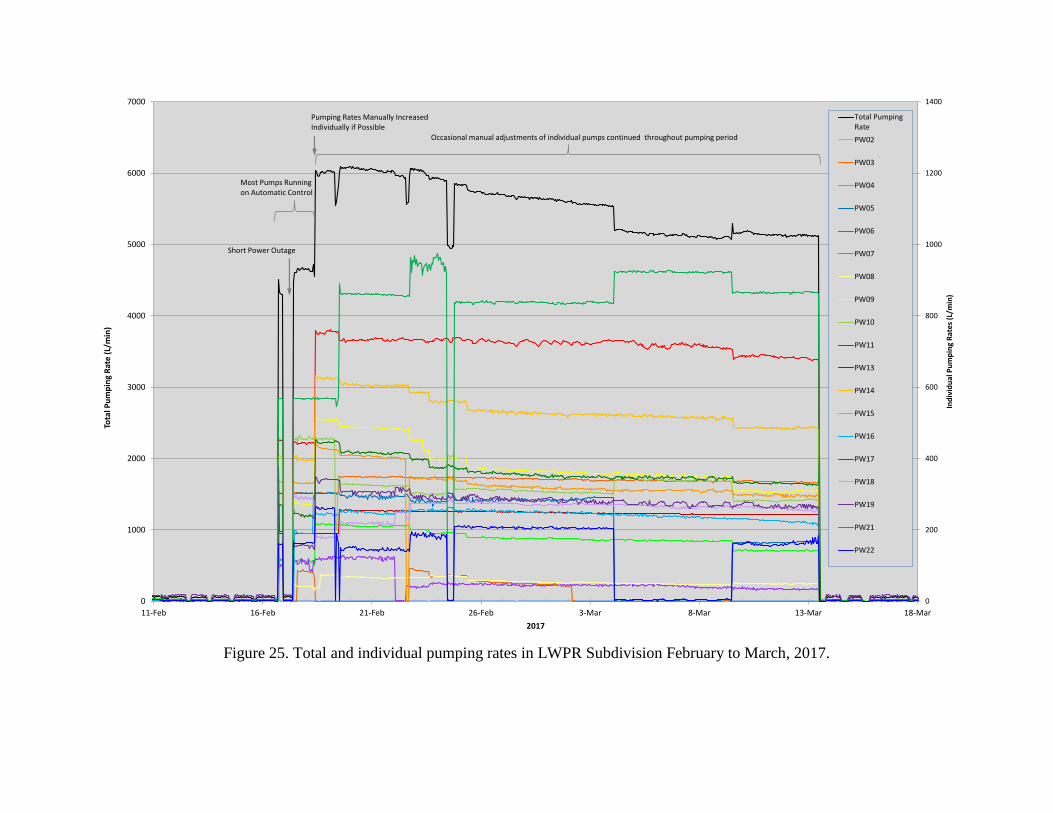
Figure 25. Total and individual pumping rates in LWPR Subdivision February to March, 2017.
0
200
400
600
800
1000
1200
1400
0
1000
2000
3000
4000
5000
6000
7000
11-Feb 16-Feb 21-Feb 26-Feb 3-Mar 8-Mar 13-Mar 18-Mar
Ind
ivid
ual
Pu
mp
ing
Rat
es (
L/m
in)
Tota
l Pu
mp
ing
Rat
e (L
/min
)
2017
Total PumpingRate
PW02
PW03
PW04
PW05
PW06
PW07
PW08
PW09
PW10
PW11
PW13
PW14
PW15
PW16
PW17
PW18
PW19
PW21
PW22
Short Power Outage
Pumping Rates Manually IncreasedIndividually if Possible
Occasional manual adjustments of individual pumps continued throughout pumping period
Most Pumps Running on Automatic Control
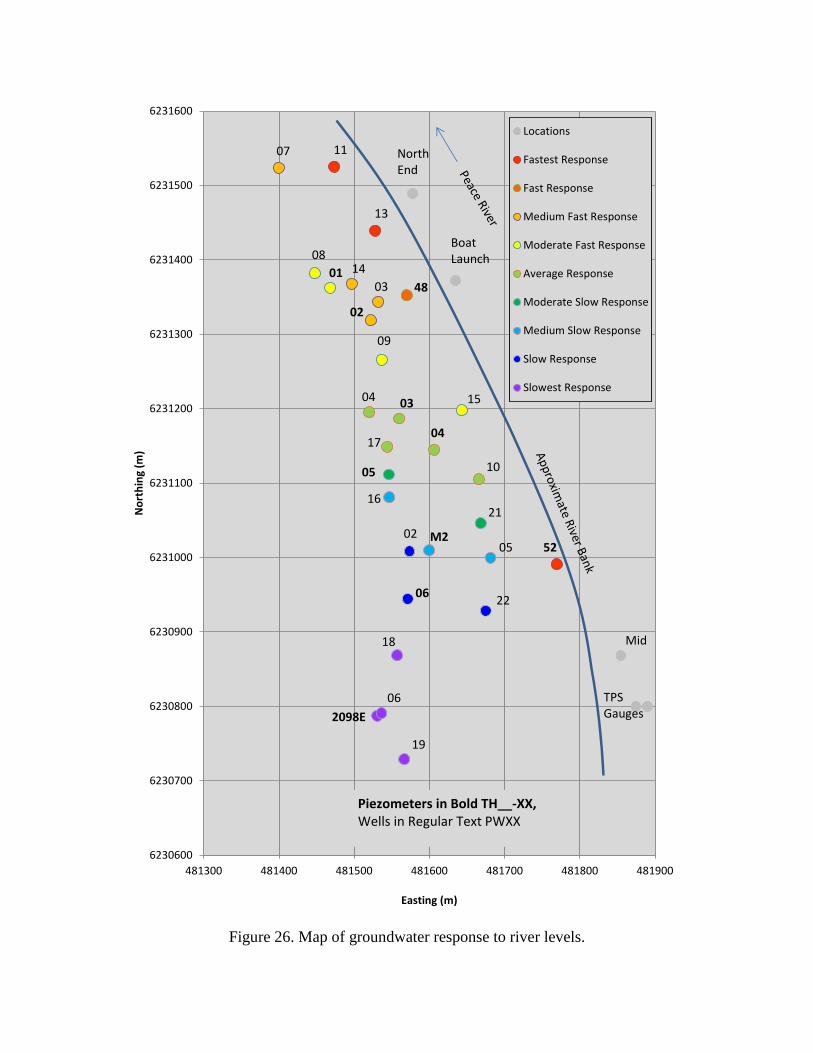
Figure 26. Map of groundwater response to river levels.
6230600
6230700
6230800
6230900
6231000
6231100
6231200
6231300
6231400
6231500
6231600
481300 481400 481500 481600 481700 481800 481900
No
rth
ing
(m)
Easting (m)
Locations
Fastest Response
Fast Response
Medium Fast Response
Moderate Fast Response
Average Response
Moderate Slow Response
Medium Slow Response
Slow Response
Slowest Response
Piezometers in Bold TH__-XX, Wells in Regular Text PWXX
48
52
01
08
07 11
13
14
03
02
09
04
17
05
16
02 M2
06
18
06
2098E
19
22
05
21
10
15
04
03
Mid
North End
Boat Launch
TPSGauges