groundwater protection in the uk - unece homepage · groundwater protection in the uk: from source...
TRANSCRIPT

Groundwater Protection in the UK:from source protection to integrated
catchment planning
Bob Harris
Environment Agency, England and WalesNational Groundwater & Contaminated Land Centre
www.environment-agency.gov.uk
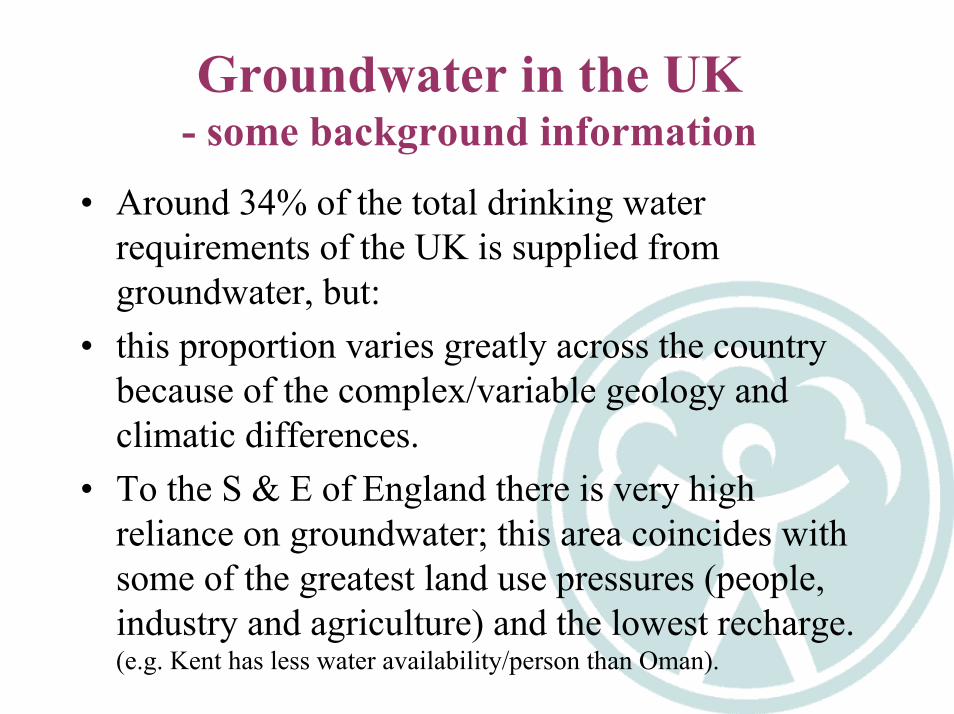
Groundwater in the UK- some background information
• Around 34% of the total drinking water requirements of the UK is supplied from groundwater, but:
• this proportion varies greatly across the country because of the complex/variable geology and climatic differences.
• To the S & E of England there is very high reliance on groundwater; this area coincides with some of the greatest land use pressures (people, industry and agriculture) and the lowest recharge. (e.g. Kent has less water availability/person than Oman).

Groundwater Use for Public Supply
North West North East
Anglian
Midland
Wales Thames
South West
Southern
% of total public water supply derived from groundwater
> 50%
< 15%
Some Historical Context
• Protection of groundwater was previously focused on sources of drinking water - wells and boreholes -through localised ad-hoc legislation:– e.g. Margate Act of 1902 and Brighton Act of 1924.

….wells were clearly vulnerable to pollution from early on

Some Historical Context• Ad-hoc reliance on the inter-connection of water
supply undertakings and local authorities but;– land use controls could be imposed from 1948 through the
Town and Country Planning Acts to protect abstractions from new development.
• In 1963 first controls over abstractions (licensing controls), although focus still on the impacts of pumping on other sources.
• In 1974 river-basin management was introduced. First opportunities for co-ordination on a Regional scale with 10 Regional Water Authorities set up.

First Aquifer Protection Policies
• Largely driven by the introduction of national waste disposal legislation from 1976 and reinforced by the European Groundwater Directive in 1979/80;
• Regional Water Authorities (RWAs) drew up the first Aquifer Protection Policies in the UK in the late 1970s/early 1980s; largely based on the protection from pollution of water supplies (simple zones) with simplified resource protection.
• Crude maps were published to reinforce (simple) policy statements.

Source Protection to Resource Protection
• There was an increased emphasis in the early 1980s on groundwater protection for resource potential reasons - e.g. sustainability issues; also: – a growing awareness of the influence of soils in both recharge and
the attenuation of pollutants from the land surface.
• The first groundwater vulnerability maps in UK drawn up and published in late 1980s for main aquifers in the Midlands; based on the national soil survey database and aquifer properties;
• Used to influence diffuse land-use activity - e.g. sewage sludge spreading.

The Growing Threat of Diffuse Pollution
• Concerns arose in the 1980s about how increasing nitrate concentrations in groundwater (derived from agricultural practices) were affecting drinking water.– European and WHO limit for drinking water of 50mg/l NO3
was being, or in danger of being, exceeded in many areas.
• Two approaches: – treat abstracted water or; – protect borehole catchments.
• Economic studies showed a combination of both was the best option in many situations;
• This led to the trialling of catchment wide protection measures for diffuse pollution control.

Catchment Protection• Firstly voluntary Nitrate Sensitive Areas (NSAs),
and then regulatory based Nitrate Vulnerable Zones (NVZs) for groundwater defined, on a source catchment basis.
• Catchment modelling therefore introduced:– firstly based on simple water balance and local
knowledge;
• However, if farming practices/livelihoods are to be constrained then more certainty/transparency is needed about the primary areas for protection;– so later models used a time-of-travel approach using
proprietary models (Flowpath, Modflow, WHPA).

Groundwater Protection Policy• Following their introduction for NSAs the modelling
approach for the definition of source protection zones was incorporated into the first national(E&W) groundwater protection policy - published in 1992.
• Two central tenets:– resource protection through groundwater vulnerability
based on properties of soils; superficial deposits, solid geology and unsaturated zone and;
– source protection through the definition of Source Protection Zones (SPZs).
• Maps and zones (the tools) were supported by policy statements for specific activities.

Policy re-published by the Environment Agency in 1998 and distributed to Local Authorities….. and it remains the Agency’s best selling publication

Groundwater Protection Tools
• Developed to support the Protection Policy and legislation with tools to support decision-making;
• Enable policies to be put into practice;• Provide a basis for future development, new tools
and improved regulation and environmental protection.

Groundwater Vulnerability• Vulnerability maps produced covering the whole
of England and Wales;• National Map at 1:1,000,000 scale and 52 maps at
1:100,000 scale;• Allows an initial appraisal of risk to be
undertaken for any potentially polluting activity.• NOT a site specific tool but has application in
preliminary vetting of activity and identifying high risk activities.

Vulnerability Illustrated
Unsaturated Zone
High Water Table
Thick Clay Soil
Deep Water Table
High Low
Thin Soil(No Drift)
Drift
Fractured Limestone Sand and
Gravel

Groundwater Vulnerability Map

Groundwater Vulnerability Maps
1:100k
Groundwater VulnerabilityMajor - HighMajor - IntermediateMajor - LowMinorNon Aquifer
Paper maps
1:106
##
#
#
#
#
#
#
#
###
#
#
#
#
#
#
#
#
#
##
#
#
#####
####
#
#
#
#
##
#
#
#
#
#
#
#
##
#
#
##
#
#
#
#
#
#
#
#
##
#
#
#
#
##
##
#
#
#
#
#
#
#
#
#
#
#
#
#
#
#
#
#
#
#
#
##
#
#
#
##
#
#
#
#
#
#
##
##
##
#
#
#
#
#
#
#
###
#
#
#
#
##
#
#
#
#
#
#
#
#
#
###
#
#
#
#
#
#
#
#
#
#
#
#
#
#
##
#
####
##
#
#
#
###
#
#
#
#
#
#
##%
%
%
%
Derby
Mansfield
Nottingham
B t T t
Non Aquifer
Mids_gw_vul.shpMAJOR_HMAJOR_IMAJOR_LMINOR_HMINOR_IMINOR_L
Notrate Data# < 20 mg/l (as NO3)# 20 - 40 mg/l (as NO3)# > 40 mg/l (as NO3)
% Towns10 km Grid
6 0 6 12 Kilometers
Digital data and GIS

Schematic Source Protection Zones
IIIIII
Cat
chm
ent B
ound
ary
Source Protection Zones around a borehole
I - Inner Zone
II - Outer Zone
III - Total Catchment
Direction of groundwater flow

Source Protection Zones -Classification
ZONE EXTENT CONTAMINANT TYPE
Zone I 50 day travel time Biological
Zone II 400 day travel time Slowly degraded
Zone III Total Catchment Non-degradable
Zone of Special Interest
Zones where local conditions require additional protection
also

Source Protection Zones• Modelling undertaken for, and by, the
NRA/Environment Agency, based on “best information”;– In some cases data lacking or geology highly complex; for
these, SPZs based on best conceptual model;
• Modelled information held in “Source Evaluation Reports” and available for inspection; – May be challenged where better data/interpretation is held by
others;
• SPZs also subject to change/improvement as a result of:– Improved data availability and modelling– Change in pumping regime/licence conditions

A
B
A
B8km
Source Protection Zones - examples of change induced by pumping
Borehole A Pumping 6 400 m³/d Borehole A Pumping 6 400 m³/dBorehole B Pumping 18 000 m³/d

Source Protection Zones• Modelling undertaken for, and by, the NRA or
Environment Agency, based on “best information”;– In some cases data lacking or geology highly complex; for
these, SPZs based on best conceptual model;
• Modelled information held in “Source Evaluation Reports” and available for inspection; – May be challenged if better data/interpretation held by others;
• SPZs also subject to change/improvement as a result of:– Change in pumping regime/licence conditions
– Improved data availability and modelling
• SPZs therefore NOT transposed into formal legal status.
IIIIII
Cat
chm
ent B
ound
ary
Source Protection Zones around a borehole
I - Inner Zone
II - Outer Zone
III - Total Catchment
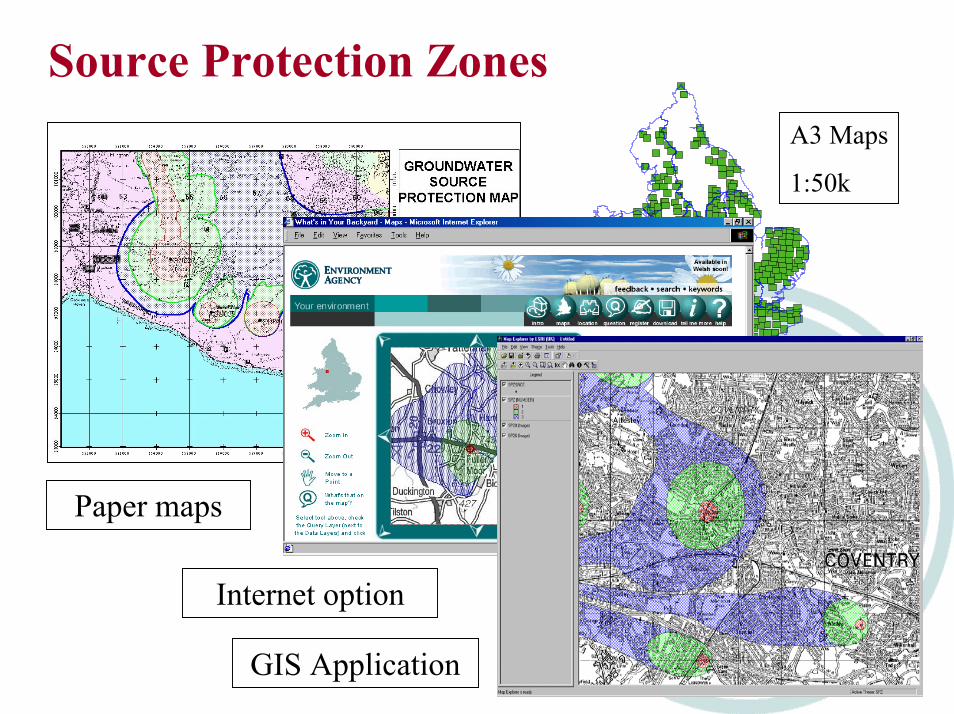
Paper maps
A3 Maps
1:50k
2 34 5
6 7
89
1
26
2423 2521
20
27
22
16151413
121110
28
29 30
31
18 1917
29A
21A
A0 Maps
1:100k
Internet option
GIS Application
Source Protection Zones

Getting the Tools Used
• Producing maps and zones is one thing but getting them applied in practice is another;
• They have greatest applicability not in site-specific assessment, but in influencing land use at a high level; e.g. filtering out unacceptable development proposals at strategic or outline stages.
• Can also be used as a first level of risk assessment for existing activities.

The Future
• We will need tiered approaches that filter out the less problematical issues and allow more detailed analysis of the difficult ones; Environmental protection and land-use planning have to move closer together.

Example of use
Strategic (Planning) level
Non-expert (Authorisation) level
Expert level
GPP & SPZ Maps
Groundwater Vulnerability Maps, SPZ Maps and Local
Knowledge
Site Specific Risk Assessment
Planning Applications & Informal Approaches

Site/activity specific tools (expert level)
Remedial targets methodology
ConSim
LandSim

The Future
• We will have much more detailed and complete environmental protection legislation and it will be a more litigious society.
• Moving from a minimalist “pseudo-voluntary approach” to an all-embracing “regulatory risk-based approach”.
• We will need more certainty; but we’ll never have enough knowledge;
• We therefore have to use risk-based approaches to decision-making for potentially polluting activities.

The Future
• Could be more precautionary unless we understand more about the complex science of the sub-surface.
• we will be more integrated - groundwater and surface waters have to be considered as a whole in catchment scale planning, being introduced as part of the Water Framework Directive………...

Water Framework Directive• Introduces integrated water management on the
catchment scale, but will have to involve the identification and management of all impacts on aquatic ecosystems

Traditional UK view ofgroundwater use and protection
Groundwater pumped
for drinking water

Changed focus given by the Water
Framework Directive

“A river is simply “A river is simply an outcrop of groundwater”an outcrop of groundwater”
We will need to change our conceptual thinking
Groundwater pumped
for drinking water

Water Framework Directive• Introduces integrated water management on the
catchment scale, but will have to involve the identification and management of all impacts on aquatic ecosystems
• The conceptual approach and associated tools need to be modified to reflect the new regime;
• So, Groundwater Vulnerability maps will need to be re-focused;
• Current maps place emphasis on resource potential of aquifers not role of groundwater in an integrated system.

New Developments
• Increased use of GIS: improved assimilation, visualisation and analysis of spatial data;
• Increased availability of data, e.g. soil, geology, physical and geochemical aquifer properties, baseline groundwater chemistry;
• Combination of process-based models and spatial data, e.g. nitrate and pesticide leaching to produce pollutant specific vulnerability and risk maps.
• e.g. POPPIE….

Aquifer
Rain Pesticide HER
Soil
UnsaturatedZone
Gridded model predictionsof pesticide leaching togroundwater
Groundwater vulnerabilitymap
Overlay of leaching grid andGVM and re-interpretation toproduce pesticide specific risk potential maps
Source Protection Zones(SPZ)
Overlay of SPZ withcombined layers
Prediction of concentrationsat boreholes
Currentdevelopments
Possiblefuture
development
MACROmetamodel
andAttenuation
Factormodel
IsoproturonLowMediumHigh
Likelihood of Isoproturondetection in groundwater
Outline of Pesticide Leaching Model - POPPIE

Conclusions• Whole package provides a framework that enables cost-
effective decision making by allowing policies to be put into practice at a range of scales;
• A suite of groundwater specific tools developed over past 15 years that can be applied at a range of scales to address multi-functional issues;
• Experience gained has identified further opportunities and the understanding of groundwater protection issues has been enhanced;
• R&D and improved knowledge/data coupled with improved IT capability and new initiatives will continue to drive the development of tools.