group of experts on protected areas and ecological
TRANSCRIPT

Strasbourg, 12 September 2018 T-PVS/PA (2018) 11
[pa11e_2018.doc]
CONVENTION ON THE CONSERVATION OF EUROPEAN WILDLIFE
AND NATURAL HABITATS
Group of Experts on Protected Areas and Ecological
Networks 9th meeting
4-5 October 2018
STATUS OF THE EMERALD NETWORK OF AREAS OF
SPECIAL CONSERVATION INTEREST (ASCI) IN 2018
Document prepared by
Marc Roekaerts (EUREKO) and Otars Opermanis
This document will not be distributed at the meeting. Please bring this copy.

T-PVS/PA (2018) 11 - 2 -
Table of contents
INTRODUCTION ................................................................................................................. - 3 -
EMERALD SUFFICIENCY STATISTICS UPDATE 2018 ................................................ - 3 -
SCIENTIFIC RESERVES .................................................................................................... - 7 -
PROGRESS OF THE SUFFICIENCY OF THE EMERALD NETWORK SINCE 2017 ... - 9 -
CONCLUSIONS AND RECOMMENDATIONS .............................................................. - 11 -

- 3 - T-PVS/PA (2018) 11
INTRODUCTION
The work on constitution of the Emerald Network follows the bio-geographical process where the key
decision–making events about network sufficiency are the bio-geographical seminars (T-PVS/PA
(2013) 13 page 7; T-PVS/PA (2016) 4 page 11). To date, twelve seminars have taken place since
November 2011 involving 14 countries. Each bio-geographical seminar produces a document named
“Final Conclusions” which summarises discussions held at the seminar and provides a coded
conclusion (T-PVS/PA (2013) 13 page 8, Table 2) for each discussed species and habitat which
indicates the actions that Contracting Parties are expected to undertake in order to complete the
Emerald Network.
Final Conclusions, together with the “Reference Lists” – another important document which lists for
each Contracting Party the species and habitats listed in the Bern Convention Resolutions No. 4 (1996)
and No. 6 (1998) which are subjects for Emerald site (ASCI) designation, are publicly available in pdf
format from the Emerald Network Reference Portal.
After a certain time - usually at the end of each calendar year - Final Conclusions from new seminars
are merged into a special Microsoft Access database named “Conclusions Database”. Thus this
database not only helds all the updated conclusions from the seminars but also keeps historic records
of network development.
The Conclusions Database was largely used to prepare the comprehensive report “ Emerald Network
status in the Eastern Partnership region and the Russian Federation” in 2017. Despite the title, many
analyses covered all 14 Bern Convention Contracting Parties whose network sufficiency has been
evaluated. Following this report two other bio-geographical seminars have taken place. The first
seminar was dealing with non-avian species and habitats in the South Caucasus countries (Armenia,
Azerbaijan and Georgia) and the second seminar was dealing with bird species in Belarus, the
Republic of Moldova and Ukraine.
The aim of this report is to update the key sufficiency statistics for all 14 Emerald countries as for end-
2018 (no more seminars are foreseen this year), especially taking into account the progress in the 6
Eastern Partnership countries. The report also aims to provide pointers for the future: i.e. what are the
most necessary actions in different countries to complete the Emerald Network. It should also help
develop recommendations for the post-2010 Emerald calendar. The analyses are based on Emerald
Conclusions Database available at the end of 2018.
EMERALD SUFFICIENCY STATISTICS UPDATE 2018
The report “Emerald Network status in the Eastern Partnership region and the Russian Federation”
(2017) explicitly describes two main methods in assessing the Emerald Network sufficiency. One of
them, i.e. quantitative assessment, compares the area of the Emerald Network with the area of the
national territory. Although such quantitative assessment is not a subject of this report, because it does
not originate from the data in the Conclusions Database, Table 1 below provides the most updated
statistics. The 2017 report provides more detailed analyses on this quantitative assessment, including a
discussion on the relationship between the quantitative and qualitative assessment.
Table 1. Quantitative assessment of the Emerald Network: covered percentage of national territory.
Data are updated taking into account databases submitted by the end of 2017 (i.e. not included in the
2017 report). ISO country codes are further used in the various graphics of this report.
Country Number of
Emerald sites
(ASCIs)
Emerald network
area (km2)
Percentage of
national territory
covered
Albania (AL) 25 4752.7 16.7
Armenia (AM) 23 10337.2 34.7
Azerbaijan (AZ) 17 16795.3 19.3
Bosnia and Herzegovina (BA) 30 3278.9 6.4
Belarus (BY) 162 24288.9 11.7

T-PVS/PA (2018) 11 - 4 -
Switzerland (CH) 37 642.4 1.6
Georgia (GE) 55 10749.6 15.4
Republic of Moldova (MD) 61 2779.0 8.21
Montenegro (ME) 32 2553.5 18.5
“the former Yugoslav Republic of
Macedonia” (MK) 33 6390.0 25.1
Norway (NO) 709 52304.4 16.1
Serbia (RS) 61 9601.0 10.9
Russian Federation (RU) 1633 496254.8 12.6
Ukraine (UA) 271 62487.3 10.4
Qualitative assessment, on the contrary, is based on the Conclusions Database. In the simpliest
fashion, qualitative assessment compares the number of sufficient decisions with the total number of
species and habitats - listed respectively in the Resolution No. 6 (1998) and No. 4 (1996) - occuring in
the country. It should be also remembered that:
If there are more than one bio-geographical region in a country, and if a feature (a habitat or a
species) occurs in several of these regions, it is assessed separately for each region;
For bird species, however, no bio-geographical regions are recognised, thus there is always
only one assessment for each country where the species occurs.
Qualitative assessment, or “sufficiency rate” can be calculated by country, by bio-geographical region,
or, for example, by country and major goups of sufficiency assessment (Figure 1).
A
B
0
20
40
60
80
100
AM UA AL GE AZ NO ME MK MD RS BY RU CH BA
Per
cen
tage
of
suff
icie
nt
dec
isio
ns
Countries
0
20
40
60
80
ANA BLS ALP STE PAN CON ATL MED ARC BOR
Per
cen
tage
of
suff
icie
nt
dec
isio
ns
Bio-geographical regions

- 5 - T-PVS/PA (2018) 11
C
Figure 1. Sufficiency rates calculated from different angles (end 2018 data).
As regards to “non-sufficient” decisions, there are several categories1: insufficient major, insufficient
moderate, insufficient minor, scientific reservation and correction of data. Figure 2A below reports the
distribution of these categories for each country. This figure shows also that the more the bar is in light
color, the more the country is advanced in Emerald Network site designation.
A
1 Please see full description at https://rm.coe.int/1680746a34 , page 8.
0
10
20
30
40
50
60
70
80
90
100
AL AM AZ BA BY CH GE MD ME MK NO RS RU UA
Per
cen
tage
of
suff
icie
nt
dec
isio
ns
Countries
Birds
Habitats
Non-avian species
0%
10%
20%
30%
40%
50%
60%
70%
80%
90%
100%
AL AM AZ BA BY CH GE MD ME MK NO RS RU UA
Pro
po
rtio
n c
on
clu
sio
n
cate
gori
es
Countries
SUF
CD
SR
IN MIN
IN MOD
IN MAJ
T-PVS/PA (2018) 11 - 6 -
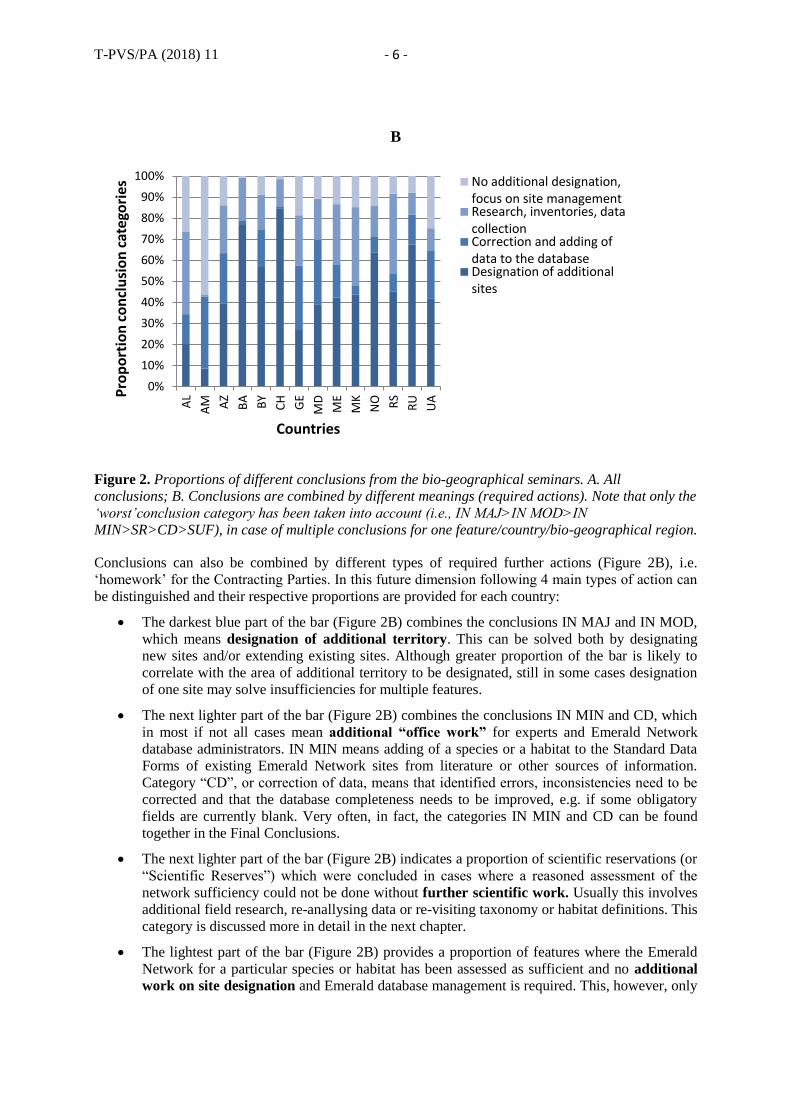
B
Figure 2. Proportions of different conclusions from the bio-geographical seminars. A. All
conclusions; B. Conclusions are combined by different meanings (required actions). Note that only the
‘worst’conclusion category has been taken into account (i.e., IN MAJ>IN MOD>IN
MIN>SR>CD>SUF), in case of multiple conclusions for one feature/country/bio-geographical region.
Conclusions can also be combined by different types of required further actions (Figure 2B), i.e.
‘homework’ for the Contracting Parties. In this future dimension following 4 main types of action can
be distinguished and their respective proportions are provided for each country:
The darkest blue part of the bar (Figure 2B) combines the conclusions IN MAJ and IN MOD,
which means designation of additional territory. This can be solved both by designating
new sites and/or extending existing sites. Although greater proportion of the bar is likely to
correlate with the area of additional territory to be designated, still in some cases designation
of one site may solve insufficiencies for multiple features.
The next lighter part of the bar (Figure 2B) combines the conclusions IN MIN and CD, which
in most if not all cases mean additional “office work” for experts and Emerald Network
database administrators. IN MIN means adding of a species or a habitat to the Standard Data
Forms of existing Emerald Network sites from literature or other sources of information.
Category “CD”, or correction of data, means that identified errors, inconsistencies need to be
corrected and that the database completeness needs to be improved, e.g. if some obligatory
fields are currently blank. Very often, in fact, the categories IN MIN and CD can be found
together in the Final Conclusions.
The next lighter part of the bar (Figure 2B) indicates a proportion of scientific reservations (or
“Scientific Reserves”) which were concluded in cases where a reasoned assessment of the
network sufficiency could not be done without further scientific work. Usually this involves
additional field research, re-anallysing data or re-visiting taxonomy or habitat definitions. This
category is discussed more in detail in the next chapter.
The lightest part of the bar (Figure 2B) provides a proportion of features where the Emerald
Network for a particular species or habitat has been assessed as sufficient and no additional
work on site designation and Emerald database management is required. This, however, only
0%
10%
20%
30%
40%
50%
60%
70%
80%
90%
100%A
L
AM AZ
BA BY
CH GE
MD
ME
MK
NO RS
RU
UAP
rop
ort
ion
co
ncl
usi
on
cat
ego
ries
Countries
No additional designation,focus on site managementResearch, inventories, datacollectionCorrection and adding ofdata to the databaseDesignation of additionalsites

- 7 - T-PVS/PA (2018) 11
concludes the second step of the Emerald Network constitution2, and further work should be
carried out on establishing site conservation objectives, introducion of conservation measures
(management plan) and monitoring. This is especially important in the context of the climate
change and the need to adapt the Emerald Network to future challenges. Please see specific
guidance on these subjects in 2014 paper “Towards management of Emerald sites: a guidance
document”
It is recommended that each country carefully examines the latest Final Conclusions3 and address
identified insufficiencies before submitting a subsequent updated Emerald Network database. The
conclusions are complemented with a column “Final Conclusion Comments” which provide more
details about the insufficiency, such as the reason of the scientific reserve or the names of geographic
objects which need to be covered by new site designations. The 2018 sufficiency database holds such
remarks for about 38% of all non-sufficient conclusions. When re-visiting sufficiency conclusions at
the repeated seminars, previous conclusions and their additional remarks are taken into account
in a systematic way.
SCIENTIFIC RESERVES
The quality of sufficiency assessments strongly depends on the quality of available scientific
intormation. This refers to knowledge about distribution patterns, abundance and ecology of the
feature (habitat or species) in the specific context of a country under examination. Time dimension is
also important in this context. In the previous work, particularly in the Eastern European countries, it
was found that relevant information exists but it is represented only as fragments from a long period of
time, often extending back to the middle of 20th century when distribution and abundance of many
species were different compared to nowadays. Thus ideally the most comprehensive and most updated
available information should be used for sufficiency assessments.
Therefore when such information was obviously lacking, scientific reservations were chosen as most
appropriate conclusion in the past bio-geographical seminars. Figure 3 shows that in some countries,
particularly in the West Balkan region, scientific reservations constituted even up to 30-40% of all
conclusions made. The percentage of scientific reservations varies between systemic groups, but it was
highest for habitats, fish and invertebrates. Also the rate of scientific reservations for bio-geographical
regions (Figure 3C) is clearly linked to the countries they represent. More scientific reservations were
given to the Meditteranean and Pannonean bio-geographical regions. It is possible to continue such
analyses by finer increments and factors, if necessary at a country, bio-geographical region or even
species or habitat level, and it can provide rather clear vision about the priorities for future work in the
field of data collection.
Yet, data collection does not always require new additional field research which is probably the most
expensive way to solve scientific reservation. Countries should also check all ongoing activities and
projects (e.g. EU Natura 2000 support projects) to verify if the desired information hasnot already
been collected, “in press” or available otherwise.
In the European Union many countries (and also some countries implementing the Emerald Network,
such as Norway) have special web-portals where different people (both professionals and amateurs)
can record their own species observations online. After years, observations accumulate in large
datasets and such portals become an important source of information recognised in the sufficiency
evaluation process. It is recommended to develop such web-portals in countries implementing the
Emerald Network.
2 Please see the report “ Emerald Network status in the Eastern Partnership region and the Russian Federation”,
page 18 3 Web-page: https://www.coe.int/en/web/bern-convention/emerald-network-reference-portal

T-PVS/PA (2018) 11 - 8 -
A
B
C
Figure 3. Use of scientific reservations by country (A), taxonomic group (B) and bio-geographical
region (C).
0
5
10
15
20
25
30
35
40
45
AL RS MK ME GE AZ MD BA BY NO UA RU CH AM
Per
cen
tage
of
Scie
nti
fic
Res
era
tio
ns
Countries
0
5
10
15
20
25
30
Per
cen
tage
of
Scie
nti
fic
Res
era
tio
ns
Main groups of sufficiency assessment
0
5
10
15
20
25
30
35
40
MED PAN ARC ALP BLS CON STE ANA BOR ATL
Per
cen
tage
of
Scie
nti
fic
Res
era
tio
ns
Bio-geographical regions
- 9 - T-PVS/PA (2018) 11
Some first examples already exist in ENP countries, although the design and functionality often is not
yet optimal:
http://www.sevin.ru/vertebrates/ (Russian Federation)
www.butterfly-conservation-armenia.org (Armenia)
http://odonata.weebly.com/105210401058104510561048104010511067.html (Belarus)
http://www.babochki-kavkaza.ru/ (Caucasus operated from the Russian Federation)
Investments in new data collection will surely pay-off also because the improved and updated
information about species and habitats will also be useful for the subsequent Phase III of the Emerald
Network set-up, i.e. for the management of sites to ensure favourable conservation status of species
and habitats.
PROGRESS OF THE SUFFICIENCY OF THE EMERALD NETWORK SINCE 2017
This chapter focuses on the progress of the sufficiency after the publication of the report “Emerald
Network status in the Eastern Partnership region and the Russian Federation” in September 2017.
During this period, two bio-geographical seminars were held with the support of the European
Environment Agency within the framework of the ENI-SEIS EAST II project “Support to Emerald
implementation in six ENI Eastern countries” (2017-2018) funded by the EU. The first seminar was
dealing with non-avian species and habitats in South Caucasus countries (Armenia, Azerbaijan and
Georgia); the second seminar was dealing with bird species in Belarus, the Republic of Moldova and
Ukraine.
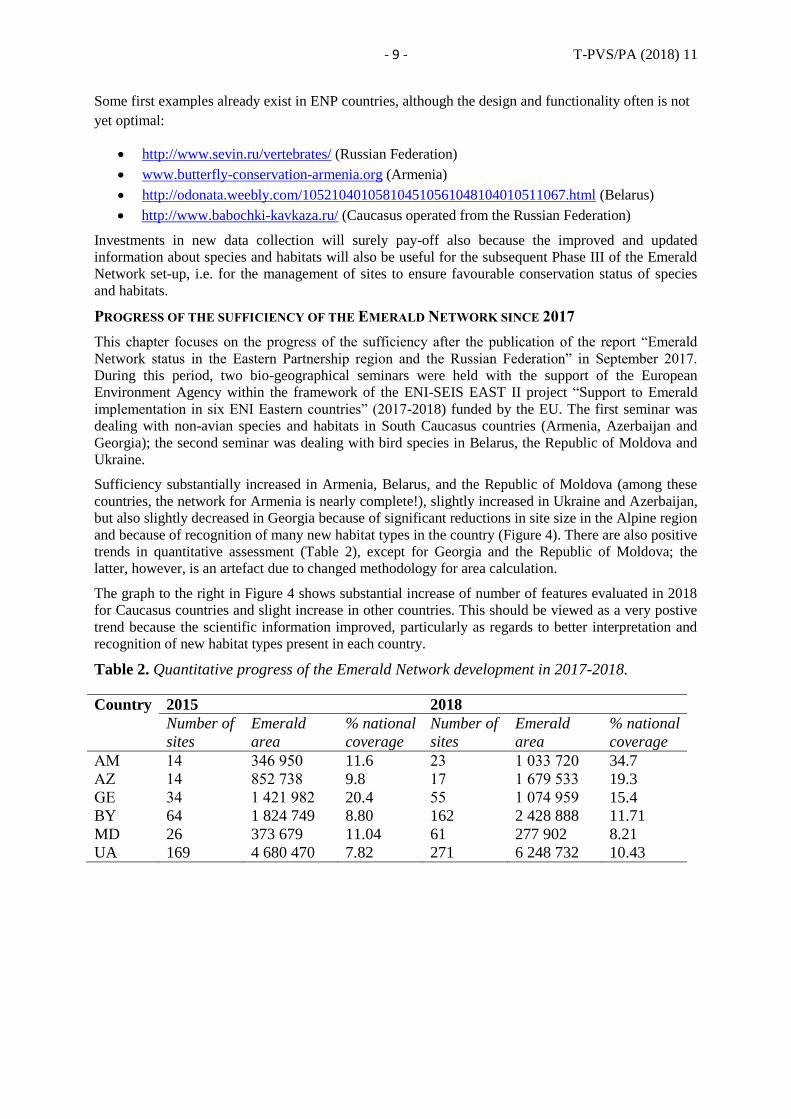
Sufficiency substantially increased in Armenia, Belarus, and the Republic of Moldova (among these
countries, the network for Armenia is nearly complete!), slightly increased in Ukraine and Azerbaijan,
but also slightly decreased in Georgia because of significant reductions in site size in the Alpine region
and because of recognition of many new habitat types in the country (Figure 4). There are also positive
trends in quantitative assessment (Table 2), except for Georgia and the Republic of Moldova; the
latter, however, is an artefact due to changed methodology for area calculation.
The graph to the right in Figure 4 shows substantial increase of number of features evaluated in 2018
for Caucasus countries and slight increase in other countries. This should be viewed as a very postive
trend because the scientific information improved, particularly as regards to better interpretation and
recognition of new habitat types present in each country.
Table 2. Quantitative progress of the Emerald Network development in 2017-2018.
Country 2015 2018
Number of
sites
Emerald
area
% national
coverage
Number of
sites
Emerald
area
% national
coverage
AM 14 346 950 11.6 23 1 033 720 34.7
AZ 14 852 738 9.8 17 1 679 533 19.3
GE 34 1 421 982 20.4 55 1 074 959 15.4
BY 64 1 824 749 8.80 162 2 428 888 11.71
MD 26 373 679 11.04 61 277 902 8.21
UA 169 4 680 470 7.82 271 6 248 732 10.43

T-PVS/PA (2018) 11 - 10 -
Figure 4. Progress in sufficiency assessments between 2015 and 2017-2018 ENI-SEIS EAST II
project. Please note, that this reflects only results of habitats and non-avian species from the
Caucasus countries and bird species from Belarus, Republic of Moldova and Ukraine.
Although Figure 4 above is useful to examine changes in sufficiency rate by country, it does not
reflect the actual progress of the whole site designation and Emerald database updating process,
particularly because there are substantial qualitative differences between different “non-sufficient”
conclusion categories (refer to page 4 of this report).
To solve this problem, we propose a new (at least neither used for Natura 2000 nor for the Emerald
Network to date) method for assessing progress in different Contracting Parties. For this purpose, at
first all conclusion categories were ranked in a gradient from “worst” to “better”: IN MAJ, IN MOD,
IN MIN, SR, CD, SUF. Then these categories were scored from 0 (IN MAJ) to 5 (SUF).
As a second step, the points given to conclusions from different years can be compared and actual
direction and magnitude of change calculated. For example, if a conclusion has changed from IN
MOD to SUF, the change score is +4 (from 1 to 5). If a conclusion was SR in both seminars, the
change score is 0. If a conclusion has been downgraded from SUF to IN MIN, the change score is -3.
Thus if the change scores from all conclusions increased, a total balance can be obtained for each
country between two seminars. Table 3 provides an example from the last 2 Emerald bio-geographical
seminars held in 2017 and 2018.
Table 3. Overall Progress of the Emerald Network development 2017-2018 assessed by the new
conclusion scoring method.
Armenia, Azerbaijan, Georgia: 2015 vs
2018
Belarus, Republic of Moldova, Ukraine:
2015 vs 2018
Country Total progress balance Country Total progress balance
AM +290 BY +72
AZ +94 MD +68
GE +28 UA +15
However, Table 3 does not entirely reflect “internal fluctuations” because the total progress balance
results from a combination of improvements and deteriorations. For example, in Georgia not only new
sites have been added, but some large existing sites have been substantially reduced in size, therefore
many previous sufficient conclusions have been re-visited, and in many cases conclusions were
downgraded.
Thus we propose to reflect data by showing both negative and positive changes, as well as the overall
balance (Figure 5). It can be seen that the overall sufficiency rate of evaluated subjects (South
0
10
20
30
40
50
60
70
80
90
100
AM UA BY MD AZ GE
Pe
rce
nta
ge o
f su
ffic
ien
t d
eci
sio
ns
Countries
2015evaluation
2017-2018evaluation
0
50
100
150
200
250
300
AM AZ BY GE MD UA
Nu
mb
er
of
feat
ure
s d
iscu
sse
d
Countries

- 11 - T-PVS/PA (2018) 11
Caucasus – non-avian species and habitats; East European countries – birds) increased in most
countries, even in those where an area reduction in the network has been observed. More than 20-year
experience from building the Natura 2000 network in the EU shows that iterative two-way direction of
changes (steady general increase but with some decrease) is an inevitable part of this process in most
countries, thus it is not surprising that the same pattern is observed also in the Emerald Network.
In particular, it is worth to highlight the case of Ukraine, where many changes with ‘negative’ sign
occurred due to broadening the scope of scientific information considered in the site selection (which
is clearly a postive trend!), and is not due to site reductions or other genuinely negative operations.
Figure 5. Overall Progress of the Emerald Network development 2017-2018 assessed by the new
conclusion scoring method.
CONCLUSIONS AND RECOMMENDATIONS
Two bio-geographical seminars since mid-2017 produced important progress in 6 countries concerned:
Armenia, Azerbaijan, Belarus, Georgia, Republic of Moldova and Ukraine. The launch of repeated
evaluation seminars for the Eastern European countries definitely was a catalyst proving to
governments and stakeholders that the Emerald Network process continues and demonstrated its
iterative character, and that all previous efforts were not just isolated efforts of one or few projects
without future perspective.
For future (pre- and post-2020 Emerald calendar), it is difficult to provide any genuinely new
recommendations other than those already suggested in the following documents:
The report “Emerald Network status in the Eastern Partnership region and the Russian
Federation” in 2017 (Page 48; Chapter “Remaining gaps and weaknesses”)
The “Three dimensional road map for achieving a fully operational Emerald Network in 7
countries of Central and Eastern Europe and South Caucasus” T-PVS/PA(2016)10; yet it is
clear that many of actions will remain valid in their importance after 2020;
Still in the context of this report, we can still propose a few improvements, mainly to improve
communication with Contracting Parties, namely:
It is strongly recommended that each country carefully examines the latest Final Conclusions
and addresses identified insufficiencies before submitting a subsequent Emerald Network
database, because these conclusions will be systematically used as a background for the new
evaluation in the next seminar;
The Bern Convention Secretariat needs to maintain a clean and user-friendly web-page where
the above conclusions could be found both in .pdf or tabular format for future work. Please
note that also in the past several countries have asked to provide Final Conclusions also in
tablular format for future work (.pdf format is not very user-friendly). The Conclusions
-100
-50
0
50
100
150
200
250
300
350
AM AZ GE
Nu
mb
er o
f fe
atu
res
Negative
Positive
Overall balance
-40
-20
0
20
40
60
80
100
BY MD UAN
um
ber
of
feat
ure
s

T-PVS/PA (2018) 11 - 12 -
Database would ideally fill this role if made publicly available, but in such case a detailed
instructions about its structure and contents and user’s manual should be provided;
It is recommended to Contracting Parties to consider Scientific Reservations as a priority
especially when it comes to grant funds to scientific research of protected species and habitats.
They should be reminded that the Bern Convention Secretariat requires not only subsequent
changes in the Emerald Network database, but also a short written note about how scientific
reservations were resolved and what consequences they have brought to the Standard Data
Forms.
This report has demonstrated that only thorough and many-sided evaluation of change in the
sufficiency of the Emerald Network database and SDFs reveals the actual progress/regress;
conclusions should not be made only considering one indicator or character.