group strategy - investor day - hsbc · group strategy investor day stuart gulliver group chief...
TRANSCRIPT

Group Strategy Investor DayStuart Gulliver Group Chief Executive
May 2012

2
Agenda
Recap and progress on execution
Vision of HSBC
Priorities going forward

3
If we are successful in executing against this strategy, we will be regarded as the world’s leading international bank
International trade and capital flows
Build on international trade and commercial banking heritage
International network in markets that matter
Strategy aligned with two long-term trends
Economic development and wealth creation
Most relevant markets for wealth creation
Retail banking only where we can achieve profitable scale
Group StrategyIntroduction and recap

4
Progress against May 2011 Report Card
Key execution elements
Capital DeploymentFive Filters
Cost efficiencyFour Programmes
Growth
May 2011 Report Card Metrics
Disposals and closures of non-strategic / underperforming businesses
Turnaround of strategically relevant businesses
USD2.5-3.5bn in sustainable cost saves by 2013
Simplify and delayer organisation
Revenue growth in faster growing markets
USD4bn in incremental wealth revenues in the medium term
USD1bn in additional CMB and GB&M revenues in the short to medium term
Progress to date
Introduction and recap
28 transactions to dispose of or close businesses
c.USD55bn expected reduction in RWAs c.15k FTE to be transferred c.USD5.9bn total consideration
USD2.0bn in total annualised sustainable savings
FTE down 14k from 1Q11 (including 1.5k from transactions and US run off portfolios)
Global functions re-engineering across the Group
1Q12 yoy revenue growth of 7% in Latin America, 16% in Hong Kong, and 18% in Rest of Asia Pacific
c.USD300m in incremental Wealth revenues in 2011
c.USD500m in incremental revenues from CMB and GB&M integration in 2011
1
2
3

5
12
16
66
3
886
42234
2012 YTD
1.9
2011
4.0
2010
0.3
2009
1.5
2008
3.3
2007
2.4
2006
0.8
2005
0.50.1
2003
0.0
2002
0.0
2001
0.1
2000
0.0
2004
Five Filters – We have announced an unprecedented number of disposals over the last 12 months
1
Number of disposals announced
Conside-ration, USDbn1
Key transactions
Progress on Execution
Completed DisposalsAnnounced Disposals
US Auto Loans HSBC
Merchant Services
US cards US upstate
NY branches
General insurance Costa
Rica, El Salvador, Honduras
French regional banks
Non-core UK card Serasa
S.A. (Brazil)
Asia Investment Managers Ltd
Credit Inter-national d'Egypte (CIE)
Italy private banking branches
Private banking operations in Italy
HSBC Canadian Direct Insurance Inc.
Framling-ton
Australian margin lending portfolio
Wells Fargo HSBC Trade Bank
(1) Based on consideration at the time of the deal announcement. Consideration for announced transactions, for the purposes of this analysis, is defined as the value received for the sale of a business for legal entity sales and the premium / discount to assets / liabilities received for the sale of a business for asset & liability transfers. The premium for the US Cards and Retail Services sale is as at closing.

6
Five Filters – Reduce fragmentation in our portfolio through closures and disposals in non-strategic markets
Europe – Slovakia, Georgia (Closure), Poland (RBWM), Russia (RBWM), Hungary (Consumer finance), Malta (Merchant acquiring)
Asia – Thailand (RBWM), Japan (Private banking, Consumer Banking)
Latin America – Costa Rica, Honduras, El Salvador, Chile (Retail), Colombia, Peru, Uruguay and Paraguay
General Insurance – UK (Motor), HK, Singapore, Mexico, Argentina, Bermuda (Ins. Mgt.), Iraq (Dar Es Salaam Insurance stake)
Pension fund management – Mexico (Afore)
Private Equity and other – US (PE), Canada (PE, Consumer Finance and Investment Advisory), Middle East (PE), UK (Montagu Private Equity stake)
Geographies
Businesses
US Upstate New York Branches
US Cards and Retail ServicesUS repositioning
28 transactions to dispose of or close businesses announced and currently being executed
Frag
men
tatio
n1
Progress on Execution
Transferred/to be transferred FTE c.15k RWA c.USD55bn

7
Five Filters – Overall Insurance review addresses General Insurance and other fragmented businesses
General Insurance
Sub-scale / Fragmentation Countries
Insurance Management Services
Bermuda Insurance Management Services
Pensions
Mexico Pensions (Afore)
Life Insurance
El Salvador Life Insurance
Honduras Life Insurance
Countries
Argentina General Insurance
Mexico General Insurance
Asia Pacific
Hong Kong General and Medical Insurance; Hong Kong (HASE) General Insurance
Singapore General and Medical Insurance
Europe UK Motor Insurance
General Insurance exit
1
Progress on Execution
Latin America
MENA Dar Es Salaam
Insurance stake
(1) Excludes El Salvador and Honduras
Transferred/to be transferred FTE c.1k1
RWA c.USD180m1

8
Five Filters – Reduced fragmentation in Europe and Asia1
Priority Markets UK France Germany Switzerland Turkey
Progress on Execution
Footprint simplification
Disposal of non-core businesses
Priority Markets Hong Kong Australia Mainland China India Indonesia Malaysia Singapore Taiwan Vietnam
Malta merchant acquiring sale
Hungary consumer finance sale
Slovakia full exit
Russia RBWM exit
Poland RBWM exit
Georgia full exit
Thailand RBWM exit
Japan RBWM and GPB exits
Singapore general insurance disposal
Europe actions
Hong Kong general and medical insurance disposal;
Asia actions
UK Montagu Private Equity stake
UK Motor Insurance
Hong Kong (HASE) general insurance
Transferred/to be transferred FTE c.0.1k
RWA c.USD700m
Transferred/to be transferred FTE c.0.7k
RWA c.USD970m

9
Mexico Disposal of pensions funds manage-ment (Afore); general insurance
Disposal of non-core businesses
Five Filters – Reduced fragmentation in Latin America1
Priority Markets Argentina Brazil Mexico
Progress on Execution
Costa Rica Full exit
El Salvador Full exit
Honduras Full exit
Argentina Disposal of general insurance
Chile Exit RBWM; become network market to support CMB, GB&MFootprint
simplification
Transferred/to be transferred FTE c.6.3k
RWA c.USD7.1bn
Colombia Onshore exit; move to rep office model
Peru Onshore exit; move to rep office model1
Uruguay Onshore exit; move to rep office model
Paraguay Full exit
(1) Planned

10
1.3
0.7
2.0
Annualised benefits
Sustainable savings from actions taken in 2011
Sustainable savings from actions taken in 1Q 2012
Total sustainable savings
2
Progress on Execution
USDbn
Four Programmes – Sustainable savings booked until 1Q 2012 to deliver USD2bn by 2012YE

11
3
GDP, USDtn
Source: HSBC – The World in 2050 (Jan 2012), Global Insights
Top economies by 2050 Income per capita in 2050
GDP Growth 06-11, CAGR
Turkey 2.1
Canada 2.3
France 2.8
Mexico 2.8
Brazil 3.0
UK 3.6
Germany 3.7
Japan 6.4
India 8.2
US 22.3
China 25.3
2.5
4.3x
2.0x
1.7x
3.5x
2.9x
1.8x
2.1x
1.6x
6.4x
1.5x
6.9x
Multiple over 2010 income
11%
1%
8%
0%
1%
0%
4%
1%
0%
1%
3%
Progress on Execution
Growth – HSBC has exposure to markets with strong fundamentals driving wealth creation

12
Growth – Progress has been made across faster growing markets
Gross loans and advances to customers growth1, countries with more than USD10bn RWA, %
Hong Kong and Rest of Asia-Pacific
Latin America
MENA
Mainland China
Singapore
Australia
Hong Kong
India
Malaysia
Brazil
Mexico
UAE
3
7
12
13
17
19
19
8
14
6
Reported regional PBT growth, %
23%2
2010-11 4Q 11-1Q 12
51%2
(2%)2
15%2
29%2
67%2
Progress on Execution
2010-11
(1) Constant currency(2) Numbers refer to whole region

13
3.7
5.55.2
2015Additional Growth
201112011Growth
0.3
20101
Strong existing client and revenue base
Integrated business model
Significant opportunities in revenue per client
Re-affirm the USD4bn additional revenue target
Facing headwinds
Definition
Revenues USD4bn target
defined on a product basis, all incremental revenues from: Asset
management Insurance Investment
products
Customers Premier customers
4.5m Advance / Mass
customers Excludes GPB
Wealth RevenuesUSDbn per year
3
Progress on Execution
Growth – Initiatives on-track to position HSBC as a leading wealth provider
(1) Excludes cash FX

14
3
Client targeting
Clients screened and prioritised for collaborative coverage
Increased sales coordination across GB&M, Payments, Cash Management and Trade
Actions to date
Collaborative client engagement
Additional GB coverage resources dedicated to CMB clients in Asia Pacific
Development and delivery of electronic FX proposition for CMB clients
Progress on Execution
Debt Capital Markets
Leveraged andAcquisition
Finance
FX Options
FX
OtherDerivatives1
c.USD500m additional revenues delivered in 2011
Incremental integration revenues by product
(1) Vanilla Rates Derivatives and Structured Products
Growth – Integration between CMB and GB&M has resulted in c.USD500m in incremental revenues in 2011

15
DifferenceUSDm
1Q 2012 results also demonstrated progress
PBT
CER
PBT
CER
1Q 2011
4,906
60.9%
5,413
58.7%
1Q 2012
4,322
63.9%
6,775
55.5%
(584)
1,362
USDm
(12%)
25%
Percent
Progress on Execution
Reported
Underlying1
(1) We measure our performance internally on a like-for-like basis by eliminating the effects of exchange differences, acquisitions and disposals of subsidiaries and businesses and the effect of changes in credit spread on the fair value of our long-term debt where the net result of such movements will be zero upon maturity of the debt, all of which distort year-on-year comparisons. We refer to this as our underlying performance.

16
Agenda
Recap and progress on execution
Vision of HSBC
Priorities going forward
17
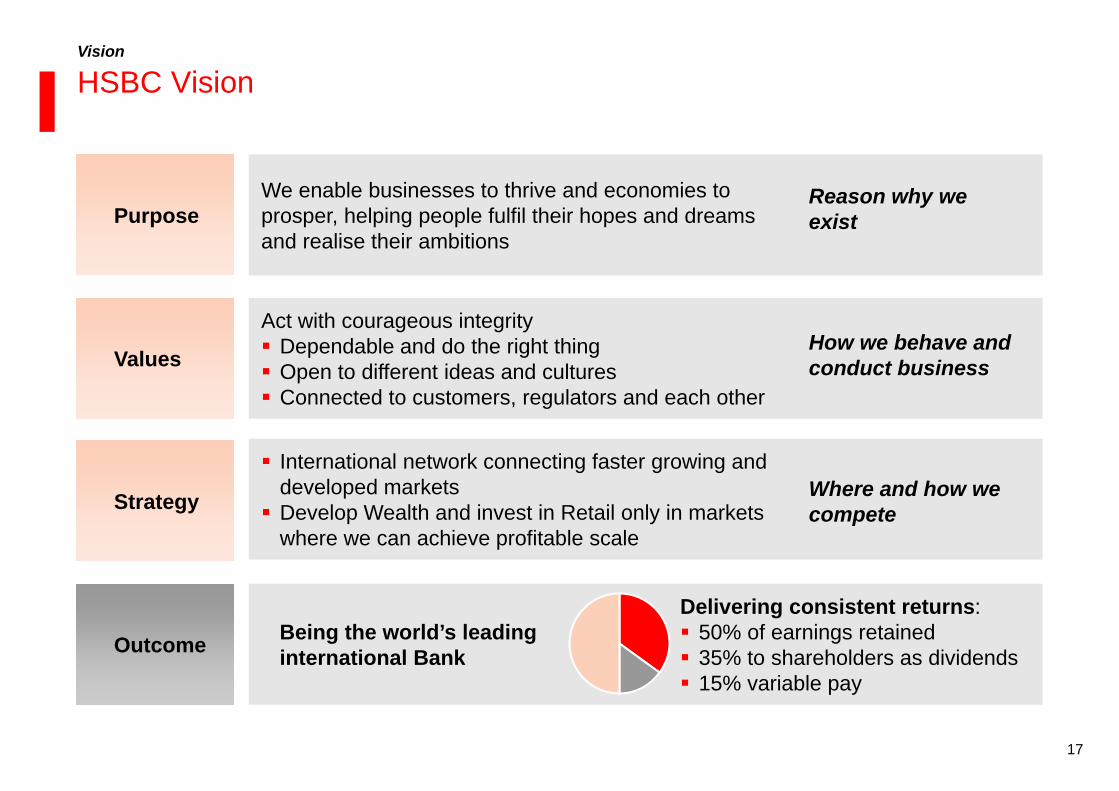
Purpose
Values
Strategy
Outcome
Reason why we exist
We enable businesses to thrive and economies to prosper, helping people fulfil their hopes and dreams and realise their ambitions
How we behave and conduct business
Act with courageous integrity Dependable and do the right thing Open to different ideas and cultures Connected to customers, regulators and each other
Where and how we compete
International network connecting faster growing and developed markets Develop Wealth and invest in Retail only in markets
where we can achieve profitable scale
Delivering consistent returns: 50% of earnings retained 35% to shareholders as dividends 15% variable pay
Being the world’s leading international Bank
Vision
HSBC Vision

18
Vision
Four integrated Global Businesses
Entrepreneur invests IPO proceeds
RetailBanking and
Wealth Management
Commercial Banking
Heritage as an international trade bank
Global Private
Banking
Global Banking
and Markets
Fast growth company first gains access to Debt or Equity markets
Exporter requires a USD futures contract
Agricultural producer buys protection against commodity price fluctuation
Business owner plans inter-generational wealth transfer
Senior manager invests for retirement
International corporate pays its employees
HR manager establishes life insurance benefits

19
Network markets
Smallmarkets
‘Homemarkets’
PriorityGrowthmarkets
Hong Kong and rest of Asia Pacific
Operations primarily focused on CMB and GB&M international clients and businesses Together with home and priority growth markets these concentrate c.85-90% of international trade
and capital flows
Markets where HSBC has profitable scale and focused operations Representative Offices
North America Latin America
Hong Kong1
Middle East and North AfricaEurope
United Kingdom
Egypt Saudi Arabia UAE
France Germany Switzerland Turkey
Canada USA
Australia Mainland China India Indonesia Malaysia Singapore Taiwan Vietnam
Argentina Brazil Mexico
Vision
(1) Includes Hang Seng Bank
Cohesive portfolio of markets

20
Committed to delivering on our financial targets
Capital
Common equity tier 1 ratio of
9.5 - 10.5%
Efficiency
CER target of 48 - 52%
Profitability
ROE target of 12 - 15%
Vision

21
‘Growth HSBC’1 delivered a pre-tax RoRWA2 of 2.2% in 2011
PBT 20112, USDbn
(1) Growth HSBC excludes US run off, GB&M legacy, US cards and retail services and non-strategic markets (excluding GB&M); (2) Excludes USD3.9bn change in fair value on own debt related to credit spread changes; (3) Excludes GB&M legacy; (4) Includes Priority Growth Markets, Network Markets and Small Markets all excluding GB&M; (5) Hong Kong and UK both excluding GB&M. Note that the UK includes the Group's head office costs and the UK Bank Levy (c. USD0.6bn); (7) Includes non-strategic markets (ex GB&M)
7.7
7.5
2.14.517.9
5.5
“Home markets”5
Growth, network
and small markets4
GB&M3‘Growth HSBC’1
20.7
Non-strategic markets
ex GB&M
0.1
US cards and retail services
GB&M legacy
0.4
US run off2011 PBTex FVOD
‘Growth HSBC’1Run-off Disposals
Closing RWAsUSDbn
1,210 42 9866
RoRWA2
% 1.6 2.26
132 50
Vision

22
Agenda
Recap and progress on execution
Vision of HSBC
Priorities going forward
II Simplify Run off Portfolio fragmentation (Five Filters) Organisation, processes and procedures
Restructure Reposition elements of GPB business model Reposition US business GB&M structurally challenged products
II
Grow Integration of Global Businesses Capital commitment to priority growth marketsIII

23
I US Legacy Consumer Assets – Running off the CML book
We continue to run off US Legacy consumer assets …
Run-off Portfolio Receivables, USDbn
16
11
7
11
7
2008
101
74
2011
49
44
5
2010
58
51
2009
79
61
CAGR (21%)Real Estate
Non real estate(unsecured)
Vehicle Finance1
Sales
Servicing
… and are actively analysing opportunities to reduce risk and improve returns
Simplifying HSBC
(1) Vehicle Finance sold in 3Q 2010
Identifying segments of the real estate portfolio we may want to consider selling that (i) represent high risk and/or high operational burden or (ii) may be sold on a capital accretive basis
Full sale of non-real estate portfolio should be explored to reduce operational risk
Continuing to collect effectively and ethically while focusing on expense control and managing operational and employee retention risks

24
GB&M – GM Legacy hold vs. sell decisions taken based on a clear economic framework
I
Simplifying HSBC
NPV of future cash flows Expected loss on sale + Transaction costs
NPV considers terminal value, net of funding and operational costs as well as Cost of Capital
Capital charge for projected RWAs assumes 10-15% Core Tier 1 requirement
Cost of Capital specific to GB&M; determined using various economic factors
Additional consideration for redeployment of capital
Decision framework
Hold
Sell
25
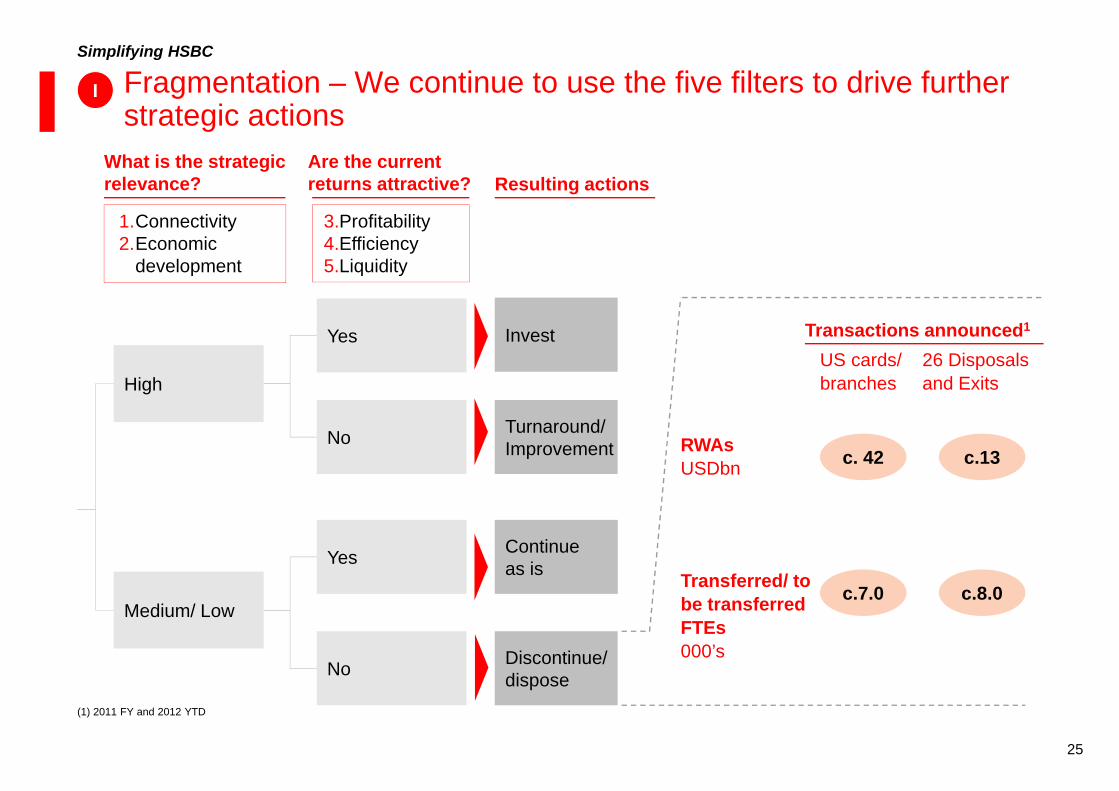
What is the strategic relevance?
Fragmentation – We continue to use the five filters to drive further strategic actions
3.Profitability4.Efficiency5.Liquidity
1.Connectivity 2.Economic
development
Are the current returns attractive?
High
Medium/ Low
Yes Continue as is
No Discontinue/ dispose
No Turnaround/ Improvement
Yes Invest
Resulting actions
Transactions announced1
RWAsUSDbn
I
Transferred/ to be transferred FTEs000’s
(1) 2011 FY and 2012 YTD
c.13
c.8.0
26 Disposals and Exits
c. 42
c.7.0
US cards/branches
Simplifying HSBC

26
Group FTE000’s
Ten global functions (e.g. HR, Finance, Marketing) to manage resources globally
Easier to enforce global controls so that every geography meets the highest standard
Target business and operating models being implemented across global businesses
As we dispose and close non-strategic businesses, we are able to organise resources at the centre
Simplifying the organisation and our approach to talent and values
How we will achieve it . . .
Continue to establish 8x8 Maximum of 8 layers between Group CEO and frontline Increased spans of control (8 reports per manager)
Focus and visibility on our global talent pool Creating opportunities for talent as we change the
organisation
Values programme, with courageous integrity as a guiding principle, led from the top and cascaded through the organisation – ensuring global adherence to high standards
Values fully integrated into performance management
Four global businesses
8 by 8 structure
ValuesCourageous Integrity
Ten global functions
Organisation
I
(5%)
1Q 12
285
1Q 11
299
Talent
Simplifying HSBC

27
Four Programmes – A strong pipeline of actions to deliver against the cost target
Implement consistent business models
Re-engineer Global Functions
Re-engineer operational processes
Streamline IT
Four ProgrammesConfirmed
Pipeline
0.6
0.5
0.5
0.3
1.9
Total(Booked & Pipeline)
0.8
0.8
0.9
0.6
3.1
Target by 2013
0.9
1.0
1.0
0.6
3.5Total
Sustainable Savings
(Booked)1
0.2
0.3
0.4
0.3
1.2
USDbn
Key actions in pipeline De-layering
Procurement
RBWM and CMB Productivity
Process Re-engineering
Right-shoring
I
Simplifying HSBC
(1) 2011 and 1Q 2012
28
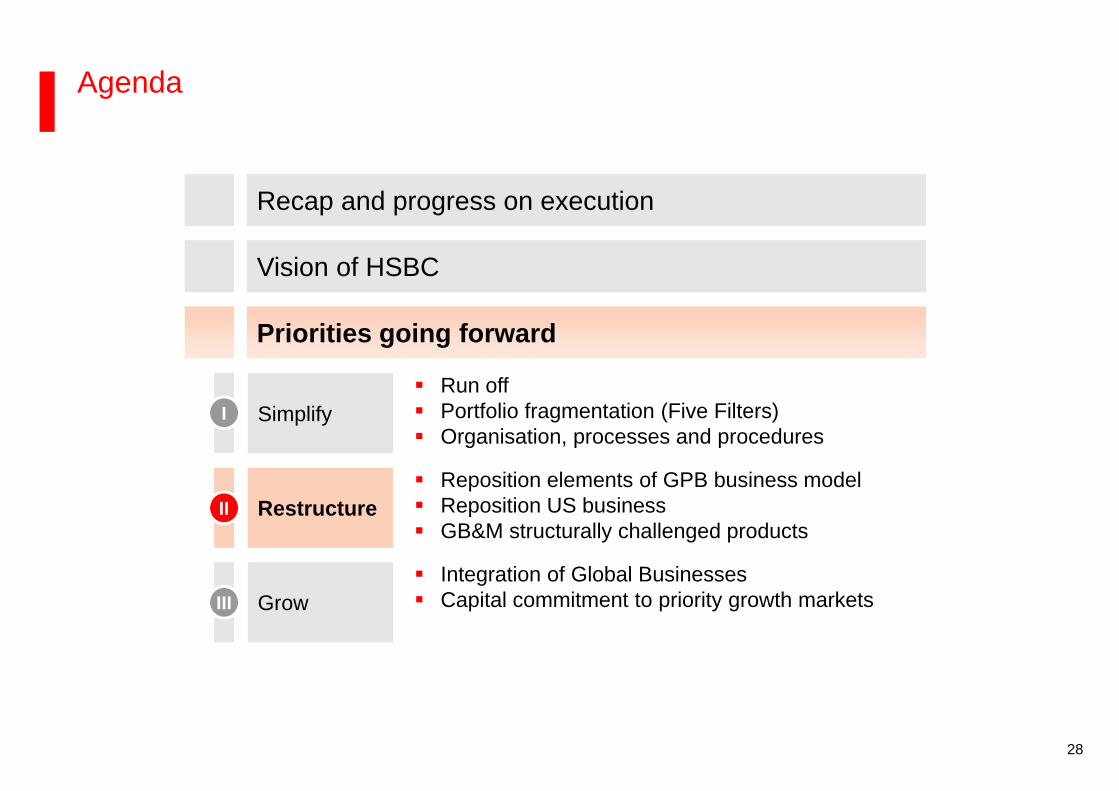
Agenda
Recap and progress on execution
Vision of HSBC
Priorities going forward
II Simplify Run off Portfolio fragmentation (Five Filters) Organisation, processes and procedures
Restructure Reposition elements of GPB business model Reposition US business GB&M structurally challenged products
II
Grow Integration of Global Businesses Capital commitment to priority growth marketsIII

29
GPB – Elements of business model to be re-positioned
Business model going forward
Integration with Group
Intensify collaboration with CMB to access entrepreneur wealth creation
Create seamless Group wealth proposition
Capturing growth
Focus investment on most attractive developed and faster growing wealth markets where GPB can build on
– Access to deep Group client franchise– Strong local and international product capabilities
Operational risk and compliance
Adhere to the highest standards in the industry Continue to focus International on transparency
and provide access to international investment opportunities
Integrated operating model
Implement new global operating model with better integration and coordination between regions
Complete global roll-out of improved data security and compliance systems and processes
HSBC challenges
‘Federation of Private Banks’– Booking centre driven– Loosely integrated
business and operating model
– Sub-optimal collaboration with rest of the Group
Reputational and financial damage after 2010 data theft
Industry challenges
Capturing new inflows from faster growing markets and domestic businesses
International businesses under increasing regulatory scrutiny
Overall pressure on profitability
II
Restructure

30
We are reshaping the US business to focus on core activities
II
Major US transactions announced to date
Consideration: USD2.4bn
Transferred FTEs: c.5k
RWAs: c.USD40bn1
Acquirer: Capital One
Closed 1st May 2012
Consideration: USD1.0bn
FTEs to be transferred: c.2k
RWAs: c.USD2bn1
Acquirer: First Niagara
Expected closing date: 2Q 2012
Reposition the US towards international businesses
Commercial Banking focused on 5 hubs concentrating over 50% of US corporate imports/exports2 – California, Florida, Illinois, New York, Texas
Global Banking serving top-tier multinationals and Global Markets (New York) as a hub for international clientsacross Americas and world, leveraging USD funding
Retail Banking Wealth Management and Global Private Bank target internationally mobile clients in large metropolitan centres in the West and East coast
US Cards and Retail Services
Upstate New York branches
Restructure
(1) As at 31st March 2012(2) International business opportunities were plotted by Metropolitan Statistical Areas (MSAs) and grouped into 5 key regions. These MSAs account for 52% of the international opportunity (Brookings
report)

31
c.11
c.10-11
c.11
c.11-12
c.11-12
c.12-13
c.18
c.19
c.7.8
c.7-8
Industry changes in product profitability
Pre-regulation Post regulation
17
15
18
25
20
15
19
27
25
30FX
Cash Equities
Prime Services
Flow Rates
Structured EQD
Structured Credit
Structured Rates
Flow Credit
Flow EQD
Commodities
ROE, %
10Source: McKinsey report “Day of Reckoning? New Regulation and Its Impact on Capital-Markets Businesses”, September 2011
Restructure
II GB&M – Industry is changing and facing profitability challenges
Industry-wide structurally challenged businesses
Industry challenges
Client activity relatively subdued with global investment banking revenue pool forecasts for flat to moderate growth
Regulatory changes reducing available capital and liquidity
Overall downward pressure on returns

32
What matters going forward…
Liquidity and funding
Diversified funding base
Deep client franchise
Access to deep and diversified client base
Network and product capabilities
Network of markets covering majority of global financial flows Global product capabilities
…HSBC GB&M execution progress 2011
Connectivity
CMB collaboration growth of c.USD500m revenues in 2011 RBWM / GPB collaboration
growth
Faster growing markets
1Q 2012 vs 1Q 2011 PBT growth in Hong Kong (20%), Rest of Asia Pacific (17%), and Latin America (22%)
Financing focused
DCM top 5 league table positions in Asia ex Japan, Europe and Latin America1
ECM initial success No. 2 in Hong Kong1
GB&M – HSBC is well positioned for the new business paradigm
II
Restructure
(1) Bloomberg

33
GB&M regulatory challenged products represent 14% of total operating income1
Financing & ECM
Rates
Securities services
PCM
Equities
Other transaction services
Asset and Structured Finance
Principal Investments
Credit
Foreign Exchange 24%
24%
10%
12%
11%
7%
5%
4%
2%
2%
GB&M Total Operating Income2 ex. BSM and OtherShare of 2011 Total Operating Income, %
Challenged products
Average, USDmMinimum, Maximum and Average 2007 – 2011, USDm
3,005
2,983
1,873
1,729
1,403
694
-501
282
407
526
(1) Excluding BSM and Other(2) Before loan impairment charges and credit risk provisions

34
GB&M is taking the necessary actions
Actively managing down legacy exposure
In 2011, disposal actions taken to mitigate USD7bn RWAincrease; but RWAs increased USD24bn largely due to regulatory changes
Clear economic framework for hold versus dispose decisions
GM Legacy
Ongoing business actions
Comprehensive RWA mitigation actions underway
Trading inventory being managed down
Optimising RWA consumption
GM Rates – reposition in light of capital constraints. GM Credit – Primary DCM focused business going forward
Industry changes in product profitability
Restructure
II

35
Agenda
Recap and progress on execution
Vision of HSBC
Priorities going forward
II Simplify Run off Portfolio fragmentation (Five Filters) Organisation, processes and procedures
Restructure Reposition elements of GPB business model Reposition US business GB&M structurally challenged products
II
Grow Integration of Global Businesses Capital commitment to priority growth marketsIII

36
Total upsideRevenues, USDbn
III
Total Upside
Collaboration areas
CMB and GPB
CMB and Insurance (RBWM)
Previous target CMB and GB&M
Additional potential CMB and GB&M
Description
Original collaboration target from May 2011 c.USD500m achieved in 2011
Enhanced coverage of CMB clients Cross-selling of Trade & Receivable
Finance (GTRF) to GB&M customers
Increased referrals between CMB and GPB
Cross-selling of Insurance (Trade Credit and Business protection)
c.1
1
c.2
Organic Growth
Integration should deliver another USD1bn revenue upside in the short to medium term

37
Apart from regulatory increases, growth in RWAs focused on growth priority markets
17
29
21
43
106
GB&M Legacy
regulatory increase
GB&M regulatory increase
Total RWA growth 2010-11
US CRS
(0)
US Legacy
(7)
GB&M Legacy
ex regulatory increase
3
GB&Mex legacy
ex regulatory increase
Home, Growth
Network and Small markets
RWA1 growth 2011 vs 2010USDbn
We will continue to deploy RWAs in key markets to drive growth
(1) Closing RWAs
III
Organic Growth
-4Total Run-off
+50Net Regulatory RWA increase
+63Growth

38
2007, % 2007 – 2011 Difference, percentage points
10
14
14
7
6
2011, %Faster growing regions1 as share of Group
USD 4.8bn
USD 1.6bn
USD 125.7bn
USD 158.5bn
c. 1,800 FTE
2007 – 2011 Difference
(1) Hong Kong, Rest of Asia Pacific, Middle East and North Africa, Latin America; (2) Net operating income before loan impairment charges and other credit risk provisions
Deposits tocustomers 41%
Gross loansand advancesto customers
24%
Revenues2 39%
PBT 64%
100%
Headcount 57%
Fast GrowersDeveloped
63%
48%
38%
49%
78%
100%
III
Organic Growth
HSBC has been shifting towards faster growing regions

39
Key opportunities in Commercial Banking
The world's leading trade bank with 9% global market share1
International network covering 77% of world trade2
and 81% of multinational companies3
Financing capabilities throughout the trade cycle Superior client franchise with over 3.6m clients Leading international bank for RMB products,
providing capabilities in over 50 countries
International revenue opportunity is growing at twice the rate of domestic (19% vs 9%)4
Accessing faster growing markets and all major trade corridors
Capturing growth opportunities in trade finance as competitors deleverage
(1) Global market share by revenue, Oliver Wyman Global Transaction Banking survey 2011(2) Global Insight 2011(3) Dun & Bradstreet(4) International revenue pool 19% CAGR 2010-14 vs 9% domestic, McKinsey Global Profit Pool Study 2011
353024
CAGR+20%
Key opportunities
World merchandise trade2, USDtn
DistinctivenessWorld Trade continues to grow faster than GDP . . .
World nominal GDP, USDtn
706358
CAGR+10%
201120102009

40
Key opportunities in Growth Priority Markets
Latin AmericaAsia Pacific
Mainland China
Leading foreign bank for RMB in 2011 Debt and equity financing opportunities International desks driving China
in/outbound business Largest branch network among foreign
peers
India
Invest in accelerating growth of internationally-focused corporate franchise
Expand distribution for retail opportunity RBS integration1
Singapore
Develop Wealth management and Private Banking
Expand Trade Finance
South – South Corridor
9% share of fast growing Brazil – China trade Recognised as ‘Financial institution of the year’ (2011) by the Brazil-China Chamber of Commerce for having
contributed most to the growth and development of the trade corridor. Asia-Latin America desks in place to facilitate cross border business
Continue strong growth in CMB, particularly with international customers
Drive collaboration revenues from CMB to GB&M, RBWM and GPB
Capture Wealth Opportunity and accelerate growth in Premier/Advance
Brazil
Leverage 1,000+ branches to capture fair share of lending in RBWM and Business Banking
Grow Wealth Management business Drive corporate opportunity through GB&M
and CMB collaboration (FX, Trade, DCM)
Mexico
(1) Subject to regulatory approval

41
Priorities going forward
Key actions
SimplifyI
Aggressively run-off legacy assets Fragmentation – Continue to dispose non-strategic businesses
through Five Filters Four Programmes – Make HSBC easier to manage and control
Integration – Capture an additional USD1bn in revenues through Global Businesses coordination
Active capital deployment in growth portfolioGrowIII
RestructureII
Reposition elements of GPB business model Reposition the US for growth Review of GB&M challenges arising from regulatory
environment
42
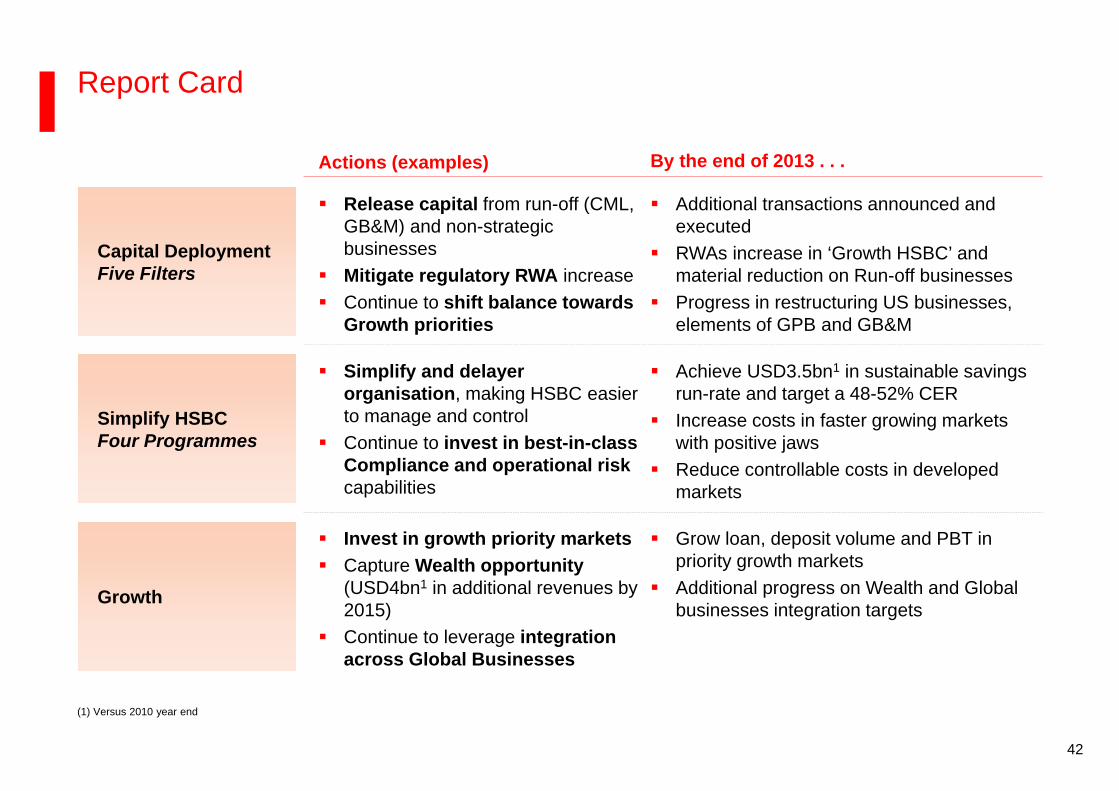
Report Card
Actions (examples) By the end of 2013 . . .
Capital DeploymentFive Filters
Release capital from run-off (CML, GB&M) and non-strategic businesses
Mitigate regulatory RWA increase Continue to shift balance towards
Growth priorities
Additional transactions announced and executed
RWAs increase in ‘Growth HSBC’ and material reduction on Run-off businesses
Progress in restructuring US businesses, elements of GPB and GB&M
Simplify HSBCFour Programmes
Simplify and delayer organisation, making HSBC easier to manage and control
Continue to invest in best-in-class Compliance and operational riskcapabilities
Achieve USD3.5bn1 in sustainable savings run-rate and target a 48-52% CER
Increase costs in faster growing markets with positive jaws
Reduce controllable costs in developed markets
Growth
Invest in growth priority markets Capture Wealth opportunity
(USD4bn1 in additional revenues by 2015)
Continue to leverage integration across Global Businesses
Grow loan, deposit volume and PBT in priority growth markets
Additional progress on Wealth and Global businesses integration targets
(1) Versus 2010 year end

43
Our purpose
Throughout our history we have been where
the growth is, connecting customers to
opportunities. We enable businesses to thrive
and economies to prosper, helping people
fulfil their hopes and dreams and realise their
ambitions. This is our role and purpose.