groupm's interaction 2016
TRANSCRIPT

Interaction
April 2016
Interaction
INTRODUCTION by Rob Norman 3
A SHORT WALK THROUGH THE NUMBERS 20AD FRAUD 23ONLINE BRANDS ADVERTISING ON TV 27TRADITIONAL TV BRAND ADVERTISING ONLINE 29ADBLOCKING 31THE YOUNG TV AUDIENCE 35VIEWABILITY 39
THE NUMBERS:ARGENTINA 42AUSTRALIA 43AUSTRIA 44BELGIUM 45BRAZIL 46CANADA 47 CHILE 48CHINA 49CZECH REPUBLIC 50DENMARK 51FINLAND 52FRANCE 53GERMANY 54GREECE 55HONG KONG 56HUNGARY 57INDIA 58INDONESIA 59IRELAND 60ITALY 61JAPAN 62LATVIA 63LITHUANIA 64MALAYSIA 65MEXICO 66NETHERLANDS 67NORWAY 68PHILIPPINES 69POLAND 70PORTUGAL 71RUSSIA 72SINGAPORE 73SLOVAK REPUBLIC 74SOUTH AFRICA 75SOUTH KOREA 76SPAIN 77SWEDEN 78TAIWAN 79THAILAND 80TURKEY 81UK 82UKRAINE 83USA 84VENEZUELA 85VIETNAM 86
APPENDICES 87
GroupMCentral Saint Giles1 St Giles High StreetLondon WC2H 8ARUnited Kingdom
All rights reserved. This publication is protected by copyright. No part of it may be reproduced, stored in a retrieval system, or transmitted in any form, or by any means, electronic, mechanical, photocopying or otherwise, without written permission from the copyright owners.
Every effort has been made to ensure the accuracy of the contents, but the publishers and copyright owners cannot accept liability in respect of errors or omissions. Readers will appreciate that the data are as up-to-date only to the extent that their availability, compilation and printed schedules will allow and are subject to change.
2 | INTERACTION APRIL 2016
CONTENTS

Introduction
Introduction
3 | INTERACTION APRIL 2016

4 | INTERACTION APRIL 2016
Welcome to Interaction 2016, our annual aggregation of digital media data and opinion.
The velocity of thought leadership and its dissemination has accelerated and colleagues from the world of GroupM and its agencies have published more than ever before. We are therefore focusing on areas we feel are most critical to the overall marketplace.
As ever the world has changed. Microsoft (other than Bing) and Apple effectively exited the advertising business, internet icon AOL was acquired by Verizon (Yahoo next?) and ad tech company Tapad by Telenor, continuing a trend of telco moves into data and advertising. Rather than further commentary on mergers and acquisitions, the dominance of Facebook and Google, the emergence of Snapchat and the possible implications of virtual and augmented reality or the machinations of competition between the digital giants, the purpose of this document is to identify the most important aspects of the year ahead as they pertain to advertisers.
SIX AREAS STAND OUT
1 The integrity of the digital media supply chain • The challenge of the stream and the curious case of online
video measurement
2 Meeting the challenge of ad avoidance
3 The unabated rise of the app • The medium is the Messenger
4 E-commerce • Retailers, marketplaces and selling on the edge
5 The economics of television creation and distribution and the role of the advertiser
6 The opportunity and challenges for data-driven advertising and its attendant security
Supply chain integrity—criminal, commercial and critical
In March of 2014 the Wall Street Journal asserted that some 36% of all web traffic was fraudulent: specifically that only 64% of aggregated traffic was viewed by humans rather than by “bot” software designed to inflate the volume of impressions in the market and thus defraud advertisers by charging for impressions that simply did not exist.
Alongside this patently criminal action was the compounding effect of impressions that were served into websites but that never entered the screen space visible to the user.
The purpose of this note
is to identify the most
important aspects of the year ahead as
they pertain to advertisers.
INTRODUCTION

5 | INTERACTION APRIL 2016
Together these factors created a sudden and entirely legitimate loss of confidence in the digital inventory supply chain. The right not to be a victim of crime is self-evidently inalienable.
Advertisers are far from the only victims of fraud. It has been suggested by many authorities that it is providing a significant part of the funding of organized crime and the trafficking of armaments, narcotics and human beings.
The battle against fraud is being waged across the industry and by organizations like the Trustworthy Accountability Group that have made a huge contribution by verifying publisher inventory as authentic and giving advertisers greater confidence that bot traffic can be identified and that they will not be charged for it. Such traffic will never be eliminated completely, but the incentives to the fraudsters can be massively reduced if detection prior to payment is effective.
Viewability is a commercial issue not a criminal one. In less than two years digital media trading on behalf of major advertisers has migrated from ignorance of the issue, to shocked recognition, to a high level of vigilance in both display and video. Many advertisers in the USA in particular now trade exclusively on viewable impressions. The GroupM USA standard is simple. 100% of the ad must appear in the viewable window in order to qualify for payment. In video the same standard applies with the added qualification that at least 50% of the first 15 seconds of video must be viewed, with the sound on. For advertisers familiar with television this seems a modest expectation.
This is not a simple matter, but rapid progress is being made. The technology exists to verify our standard and many publishers have redesigned their sites to maximize viewability. It already seems clear 2016 will be the year in which demand for bad supply will plummet.
It already seems clear that 2016 will be the year in which the demand for bad supply will plummet.
6 | INTERACTION APRIL 2016
GroupM has elected to take a robust stance in North America—and now in markets such as Canada and Australia—abetted by the vociferous support of our clients and by many publishers who believe their inventory to be of premium value. It helps that we confine transactions to about 200 suppliers for the vast majority of our business. Walking in the best-lit neighborhoods is the best way of keeping safe.
By working with those partners and staying away from other inventory we believe that we are succeeding in minimizing the challenges of fraud and viewability. Our goal is to standardize this approach around the world. This is a long but valuable endeavor. Our goal is to drive a behavioral change that reduces the need for rules. If the appropriate incentives can be agreed upon we will succeed. Nowhere is this more important than in programmatic media where velocity must not be allowed to obscure integrity. Programmatic is about the automation of manual processes in trading and data application, not a mechanism for creating the illusion of efficiency.
The challenge of the stream and the curious case of online media measurementThe biggest outstanding challenge remains viewability in “feed-” or “stream”-based environments including Facebook, Twitter and Instagram as well as the vast majority of mobile applications. Given the astonishing growth of mobile media consumption this is of immense significance. Now saturated in terms of device penetration, mobile has overtaken the desktop in almost all aspects of digital media behavior although desktop use itself remains at a four-year average.
Most mobile use is scrolling, in which advertising is inherently ephemeral. Many have adopted verification standards yet three factors concern us:
• First, the speed of the scroll means advertising may pass through the viewable window yet be seen only fleetingly
• Second, the notion that “autoplay” video with a charging event after three seconds “in window” may not represent a reasonable period for advertising effect. This is not to say that it has no effect.
• Third, the propensity for individuals to consume their feeds without sound, a behavior exaggerated by the autoplay factor
The message to video advertisers would appear to be simple: if creative assets do not deliver their goals within three seconds and without sound, the value of in-feed video has, at least, to be questioned. Given the pervasiveness of these platforms new creative forms would seem to be an imperative. It may be time to remove the zero from the 30-second standard that has characterized video advertising for generations. Perhaps those will give rise to a new definition of earned media in which the dividend is calculated by the number of seconds viewed over and above the point at which the advertiser is charged.
It may be time
to remove the zero from the
30-second standard.

7 | INTERACTION APRIL 2016
Irrational exuberance is short-lived in challenging economic times. If advertisers don’t find a creative and economic formula that works they will take their investment elsewhere or simply move still more spend toward trade marketing and promotions at the expense of advertising.
The feed-based publishers have created an outstanding user experience as evidenced by their popularity. They have succeeded equally in creating targeting capabilities using unprecedented volumes of data. The ad units of the past just don’t fit in the containers of the present, and extensive work is underway to prove or disprove the value of very short video interactions. The outcome of that work will be to value feed video to both buyer and seller. This process will have a substantial impact on supply and demand. If the value exists, in terms of long- and short-term recall and effectiveness, at a price above the available yield from other ad units, a substantial source of supply will be created. If not the opposite will apply.
Digital video is further complicated by the metrics available to advertisers. Despite the limitations of television measurement it is possible to assess the role the medium plays in people’s lives both in terms of programming and advertising. Further, it is easy enough to tease out viewing cohorts and their viewing hours and to discover the content to which they pay attention.
Such comparison is not available in feed or some other digital-only environments. The early days of the internet promised the most accountable media ever. It became apparent quickly that there was a large difference between accountable and countable. Countable, unfortunately, is only of value if those in control of what appear to be perfect data choose to share, and have verified, that data. Thus far this has not been forthcoming. Instead partial metrics such as time spent per average monthly unique user and aggregated video hours seem to be the limit of disclosure.
The early days of the internet promised the most accountable media ever.

8 | INTERACTION APRIL 2016
There are far more illuminating metrics such as video views, initiated video views (as opposed to autoplay) and advertising (as opposed to content) views among particular cohorts. In the United States, for example, Nielsen reports that 89% of all online video is consumed by 11% of households. Absent more disclosure from the platforms concerned we can only speculate. One piece of speculation may be this: if Facebook users spend on average almost 50 minutes per day on the company’s platforms it’s probable that around one-tenth is spent with video, most of which is autoplay. Given Facebook’s desire to put the user first it’s unlikely that more than one-tenth of the videos to which the user is exposed are advertising—yielding a maximum of 50 seconds of ad exposure per user per day. If that is true the number of ads that are watched for 10 seconds or more may be less than one per user per day. We offer this calculation not as “a truth” but as an informed speculation absent actual proof.
This is not an issue exclusive to Facebook, but as the market leader (by far) in feed-based advertising it seems reasonable to ask the company to publish such data at a level of granularity that allows its sole source of revenue, the advertiser, to make informed decisions. If that happens, Twitter and Snapchat will follow suit by necessity and a clearer picture will emerge. For now we have to draw our own conclusions. Facebook reports 1.6 billion users and 10 billion video views per day: extraordinary numbers, but numbers without the context of time and distribution are numbers of limited meaning. YouTube is barely more of an open book, but at least autoplay is not an issue and we believe that Google will begin to report more illuminating data soon.
The tools to verify and measure audiences exist. In almost all cases these tools are also deployed. However, until that deployment yields relevant
The tools for both verification and
measurement of audiences exist.

9 | INTERACTION APRIL 2016
and actionable reporting the advertiser will continue to be uneasy. This unease is exaggerated by the resistance to third-party adserving into some apps. Advertisers fought a long battle for the right to do this on the desktop and for the right to pay on independent “counts.” If 2015 raised the demand for truth across the entire media ecosystem, 2016 will be the year of reconciliation or consequence for failure. By mid-2016 results from Moat verification in Facebook and Twitter’s feed will be available at usable scale; our expectation is of high (if short) viewability and low (if any) fraud. The key as mentioned above is how this translates into effectiveness.
Adblocking: cause, effect and resolutionI can’t see you, so you can’t see me.
Adblocking has alarmed both publishers and advertisers. For the former it means that total impressions served are not reflected in the amount of ad inventory available for sale. For the latter, the cost takes the form of lost potential reach rather than a direct financial penalty. There are many competing theories that purport to explain the rise of adblocking: latency of site performance, the cost of data for rendering ads, the clutter of sites, a resistance to ad tracking, irritation at being retargeted with a product already purchased and so on. Some or all of these are true some of the time.
There is also the broader “because I can” theory. Simply, if the content is available without ads it’s a superior consumer experience. The “covert” contract between user and publisher that called for the acceptance of advertising in exchange for content has been breached.
The range of responses to the problem are as varied as its causes. Some publishers warn the user with an adblocker installed that, in addition to ads, content will also be blocked.
Other publishers have engaged in aggressive site redesign to make for a better experience that includes ads. In doing that they are being more selective about the ads they run, the targeting engines that place them and the load / latency implications of both the ads themselves and the multiple tags they contain for verification, tracking and attribution.
Advertisers and the entities that place their ads have always sought relevance and engagement; the consumer has chosen to set a higher bar. Advertisers and the buyers of media have a further responsibility.
Until now, we have assumed almost all data are worth having. But however much he gathers, no advertiser commands complete, continuous data. This creates a risk that the advertiser’s left hand may not know what his right hand is doing. A customer who has already made a purchase may be bombarded with redundant repeat ads wherever he roams: what we might call the phenomenon of “repetitive irrelevance.” Even worse, several advertisers may be sharing the same data and using performance-oriented media, multiplying
Other publishers have engaged in aggressive site redesign to make for a better experience that includes ads.
10 | INTERACTION APRIL 2016
the “repetitive irrelevance.” Tracking and targeting intended to make advertising welcome makes it a nuisance. It is dysfunctional. The advertiser damages his reputation and pays to do so.
This brief analysis suggests that a partial solution to adblocking is a combination of design, technology, common sense and the ability to establish the point, across channels and vendors, at which the application of a particular data point becomes the poison of marketing rather than the antidote to ineffectiveness.
Others have alternatative solutions. The creation of “paid inclusion” adblocker beaters seems insidious and tantamount to the use of the superhighway by superhighwaymen. The notion that approval of ads and advertisers by anyone other than the advertiser, publisher or consumer seems absurd.
Reports of the penetration and usage of adblockers and its cost to the digital advertising economy vary widely and wildly. Initially the received wisdom was that this was a desktop problem restricted to young male gamers in Central Europe. The logic was clear: gaming works best with minimal latency; ads add to that latency; so they block them. This diagnosis proved hopeful more than helpful. We now believe the problem to be widespread if not catastrophic; however, we believe the tide can be stemmed.
The last fortress against adblocking is the mobile app ecosystem, but it would be unwise to assume that this is a permanent redoubt. Today this security is created by the inability of third parties to insert the necessary code into any given application, but betting against the ingenuity of those who seek to change that seems risky at best.
The adblocking conundrum raises a further challenge to advertisers. The part of the digital experience served by the publisher’s content management system is readily accepted by users, but the part served by the ad management system is not. In consequence access to the former stream becomes an imperative.
Most commonly referred to as native advertising or content marketing, this precious real estate calls for a higher bar as the publisher has to consider the value of transparently-sponsored content to the user. This demands the creation of advertiser funded “stories” that are legitimately editorially relevant to the user. This should lead to a developing practice in “story finding” as opposed to story telling. Simply defined, story finding is the process of finding “authentic” editorial themes to which brands can attach their own narrative. Doing this requires close vendor collaboration and disclosure to the user. The approach is clearly going mainstream as vendors as diverse as Conde Nast, The Guardian, New York Times, Vice and Refinery29 have all invested heavily in content studios to satisfy this demand.
The last fortress against
adblocking is the mobile app
ecosystem.

11 | INTERACTION APRIL 2016
Delivering this solution repeatedly and at scale will be onerous, but like so much in digital marketing nothing turns out to be as easy as it might have seemed.
All change; there’s an app for that.Apps are familiar to any smartphone or tablet user. Increasingly they are familiar to smart TV and watch owners and to the buyers of new cars, home automation systems and household appliances. In the absence of precise data, certainly at a global level, it is estimated that 90% of time spent with a smartphone is mediated by an app. Most users have 30 to 50 apps installed. Of those, less than 10 represent 90% of aggregate usage. Those are dominated by Facebook (including Instagram, Messenger and WhatsApp) and Google (Gmail, search, maps and YouTube) along with Amazon and others. Users also, subject to the cost of data, will use a range of communication, entertainment, commerce and service apps (banking for example) and many, albeit a narrower group, will use health and gaming apps. Locally the names change but while some apps are near-global, regional analogs tell the same story. The dominant apps are united by ease of use, frequency of use and value. It is easier for a camel to pass through the eye of a needle than it is for a new application to break into the top 10.
The rise of the app ecosystem challenges two familiar narratives of the digital age. The first is that fragmentation is an exponential curve of fractured media control. It’s not. All the evidence in the app environment suggests a consolidation of both usage and ownership. The second is that digital evolution has been described as “broadcast to desktop to mobile” when more accurately it can be characterized as “channels” (many), to sites (very very many) to apps (many created, many installed but remarkably few used with any frequency).
Channels to sites to apps.

12 | INTERACTION APRIL 2016
For advertisers, the creation of persistent relevance in the major apps is a challenge for now and the coming years. It may be that advertising is simply not enough, and that a new focus on content supporting a brand narrative and services that attract frequent engagement through utility will become a priority. This will not be cheap, easy or quick, but nor was the path to dominance by certain companies in commercial television. The general rule is that if your ambition is to deliver a return on scale you have to leverage that scale in the market; the ultimate dividend is persistent competitive advantage.
The medium is the MessengerEvery generation or two has its communications channel of choice: from letters, to the telegram, to the telephone, email, SMS and now instant- messaging platforms. From WeChat and Line to WhatsApp, Facebook Messenger and Snapchat there are now in excess of two billion unduplicated users of messaging platforms. Far from being simply the IP version of SMS, messenger platforms are increasingly enriched by content, services, payments and commerce. The implications are substantial and have the potential to vaporize SMS as a revenue stream and disrupt activities as diverse as customer service and banking. Messaging has also enabled the rebirth of ancient language; hieroglyphics have been reinvented as emojis.
Messenger services succeed because they are instant, intimate and require minimal bandwidth and device capability. This drives adoption among the young, the time-starved and those to whom fiber-to-the-home is far from a near-term reality. Facebook’s dominant position in the sector is a partial explanation for its commitment to internet.org, which will deliver sufficient bandwidth to many so far untouched by the internet. The unduplicated users of Facebook’s two messenger platforms now match those of Facebook itself.
Messenger services succeed
because they are instant,
intimate and require
minimal bandwidth and device capability.
13 | INTERACTION APRIL 2016
E-commerce. Retailers, e-tailers, marketplaces and selling on the edge
The rush to digital retailing is speeding up. Amazon continues its dominance in the West and Alibaba in the Far East. The companies are notable for their contrasting business models; Amazon, a conventional retailer that buys and holds stock, and Alibaba, a platform that connects buyers (millions) and sellers (tens of thousands). The Uber of e-commerce? They are not alone. China’s No. 2 player JD.com follows the Amazon model, and Flipkart in India and MercadoLibre in Latin America follow Alibaba.
It’s dangerous to predict the future, but there is a sense that the newer entrants will follow the marketplace connection model. Wish for example is a platform based in Europe that connects thousands of (mostly) Chinese merchants to markets across the world and uses nothing more complex than the postal service for fulfillment of goods that perform necessary functions and are rarely adorned with name brands. By contrast Flipkart, another marketplace, is likely to bet heavily on a logistics ground war in India. It will use that to fill the gaps in Indian infrastructure and is likely to license this asset beyond its own uses. This could be the world’s first “ground cloud.”
Interestingly, Wish and others are also key revenue drivers of Google and Facebook and are joining the top five advertisers on each of those platforms alongside online travel bookers and others. It’s fairly certain that the Facebook and Google Top 100 look less and less like the Ad Age Top 100 every day.
Of course every retailer and every brand owner is prioritizing digital sales channels as consumer behavior shifts. That shift is accelerated by mobile adoption and that in turn is fueling the idea of “commerce at the edge.” This idea follows the same logic as off-platform content distribution. As publishers can no longer rely on every user to visit their own destination they look to Facebook Instant Articles and elsewhere to spread their reach. Similarly merchants and brand owners are looking to make as many interactions as possible shoppable by taking commerce opportunities beyond their owned-and-operated properties. Media space is becoming shelf space. That the only commerce model is the “everything store” is no longer true as opportunities open up for more and more brands to sell directly to consumers rather than through either traditional or digital store intermediaries.
For many brand owners e-commerce sales still represent a tiny fraction of total volume, but all recognize that’s a short-term situation and that “selling everywhere” is key to their future. In many cases brand owners who contemplate owned-and-operated commerce solutions do so in part for sales but also for the potential to collect first-party data that fuels targeting on the broadest array of platforms.
That media space is becoming shelf space is no longer a matter for conjecture.

14 | INTERACTION APRIL 2016
A whole bundle of problems for television (as we know it)
Amazon and Netflix made aggregate profits of less than $500 million in 2015. In 2016 they will spend $10 billion creating content. The Walt Disney Company, by contrast, reported profits of $8.4 billion for the year (may the force be with it). Netflix and Amazon have almost no barriers to market entry anywhere in the world that has enough affordable bandwidth and enough people that can pay each party $100 per year for service. On its own this may be enough to catalyze long-term disruption. Clearly both companies need the tide of revenue and profit to rise sooner rather than later. An economic cold snap in the manner of 2009 could make services like Netflix seem like a “nice to have” addition to free-to-air television but not a necessity. Equally, a significant rise in energy costs could inflate Amazon’s already immense fulfillment costs and impact margins to a level that induces unease among its investors. The current bet is that Amazon video drives adoption of Prime and Prime breaks down the barrier of instant gratification across categories.
Assuming no such calamities, these companies represent an existential threat to the status quo in any country where the concept of “bundled subscription content” is the norm and where those bundles are prescribed by the provider of cable, satellite or broadband access. The bundle supports three things. First, a persistent and significant subscription revenue stream; second, the ability of many sub-prime channels to gain household distribution; and third, the mixed economy of subscription and advertising. In “Interaction 2012” we commented that Netflix was unlikely to be able to make and acquire content at sufficient speed to become a primary choice for consumers. We were wrong and the arrival of Amazon Instant Video in multiple markets merely amplifies the error in our analysis.
The implications are far-reaching. On the one hand Amazon and Netflix represent a new market for creators and producers and a new enticement for broadband for the unconnected and poorly connected. At the same time they represent a threat to suppliers of a connection and content bundle as the temptation to choose from the a la carte menu over the prix fixe increases. The greater threat is to those channel owners that are a component of the bundle that are paid for by many but watched by fewer. In an a la carte world the value of either Netflix or Amazon’s service seems superior to most competitors. Outside of the most basic subscription packages the adhesive in the bundle is live sport and the economic ramifications for sports broadcasters and rights holders of so called “cord cutting” are substantial. Incidentally “cord cutting” is a rather inaccurate descriptor. The broadband cord remains central, it’s the bundle that goes with it that does not.
There is no good news for advertisers in this series of developments. Netflix and Amazon, like HBO and other super-premium services, neither rely on nor pursue advertising as a significant revenue source and its
A more competitive
market in the communication channel that is most effective
at building brands.
15 | INTERACTION APRIL 2016
growth clearly reduces the amount of screen time available for advertising, particularly among younger and more affluent audiences. This leaves advertisers with a more competitive market in the communication channel that they know is most effective at building brands. Falling supply together with this usage imperative combines to increase costs for reaching an audience; an audience that is already compromised by non-live viewing and the fragmentation of attention caused by concurrent device usage. While there may be some mitigation of effect through the deployment of synchronous and asynchronous application of “second screens” it would appear that the tide does not favor the advertiser.
It’s absurd to declare that either television or television advertising are dead and equally absurd not to recognize the role of the most familiar media brands in creating innovative advertising opportunities in both linear and non-linear environments.
The availability of data and the application of technology have refined the use of television. Where addressability to the set-top box is available, first- and third-party data sets are matched with subscriber files allowing delivery to only those homes that match the targeting requirement. Campaigns are reported on true set-top data enabling the advertiser to establish a direct link to sales or other events. In the USA we expected 50% of television households to be addressable by the end of the first quarter of 2016. At this scale, many large advertisers will adopt addressable advertising. Additionally almost all the legacy players have OTT (over the top) solutions accessible via broadband as opposed to the cable bundle. We believe that these parties could further advantage both themselves and the advertiser against their native digital competitors by collective action in respect of user data. If the advertiser had full visibility across all available inventory and associated transaction data we believe that ad-supported, on-demand, professional content would increase its share of the available video market. Television has moved significantly to embrace the potential of data yet there is little sign of market-level collaboration.
The availability of data and the application of technology have refined the use of television.

16 | INTERACTION APRIL 2016
The effects of this evolution will play out over time and at different speeds around the world. In some markets, like China, advertisers are already advanced in the migration from television to digital video. In that case there is less of a commercial legacy to disrupt. In western markets the change will be slower but may redraw the economic landscape of television more dramatically.
Data—the story unfolds bit by bit It is now accepted that the CMO and CIO positions are interdependent in the business of managing customer data in pursuit of generating demand and growth. The simple notion is that the more data signals that can be harvested and applied to segmentation and media targeting the more effective the investment will be. It follows then that the CIO needs to create a platform for deployment by the CMO to the greatest effect.
One fundamental benefit to the smart data user is an advantage against both competitors and the suppliers of media inventory that comes from knowing something about a customer or a prospect or even an ad impression that the other party does not know. We might refer to this as achieving “data asymmetry,” perennially a key factor in media trading.Achieving the advantage of asymmetry applied to external markets requires organizations to achieve symmetry inside the organization. This in turn requires alignment on the right Data Management Platform, one that ingests and values data and keeps it secure while allowing it to be applied outside the organization.
One way to address the priorities of the CIO and CMO is to place data into two containers: 1. Data you own, typically about the customer you know • CRM, loyalty, transaction data, email databases and site-side analytics
For many advertisers that
dividend has taken longer
to arrive than many hoped or expected.

17 | INTERACTION APRIL 2016
2. Data you rent or buy or accrue as the consequence of other actions such as an ad campaign, typically about the customer you would like to know
• Third-party, campaign-level and social-community data that tends to be more ephemeral and often available to others or indeed controlled by others
The challenge is to conjoin that data for deployment and to increase the scale and value of the first container to reduce dependence on the second container over time. In so doing the dividend of data will be accrued most successfully. For many advertisers that dividend has taken longer to arrive than many hoped or expected. It’s becoming clear that all data is not born equal; a hierarchy of data will emerge with transaction and first-party data at the top and loosely-inferred behaviors far behind. This will be as true in the programmatic application of data as it was in the days of purely manual processes.
To date the application of data has become most refined closest to a binary event, such as a sale. Its value as part of the fundamental evolution of marketing will depend on the ability to identify events or measures that are proxies for future sales and lifetime customer value. Omnichannel attribution including non-digital channels is central to the achievement of this goal.
As such it is inappropriate to rely on attribution by companies that are funded all or in part by advertising and whose value is imputed from how successfully they generate revenue. This makes imperative the creation of independent “data spines” that have the capability to connect people to devices and both people and devices to actions. Further, these data spines need to cross categories as the richest portrait comes from understanding holistic consumer behavior rather than behavior in isolated use cases.
Data spine development will be a key part of the strategies of leading marketing services companies and also of the giants of marketing technology as both assemble assets that endow the ability to segment and address audiences based on fact as well as faith.
GroupM and WPP have taken the view that the corporate end-game is to have the capability to apply “all the data, to all the inventory, all the time and in real time.” Once equipped with this universe, we can refine the skill to apply the right data to the right inventory at the time of maximum opportunity. In pursuit of this goal we have determined that a meta-solution is superior to a rigid tech stack; simply put, this means having access to secured client data, our own data and third-party data and conjoining these for application to private (well-lit, high-quality) inventory sources via a broad range of interfaces unified on the desktops of our planners and analysts.
GroupM and WPP have taken the view that the corporate end game is to have the capability to apply “all the data, to all the inventory, all the time and in real time.”
18 | INTERACTION APRIL 2016
We have commented before that digital channels and their addressable nature have enabled micro-segmentation and even audience delivery at the individual level. We concluded that the distribution side of advertising was well advanced in this regard but the creative or manufacturing side was not. Our conclusion has not changed. Advertisers are under pressure in creative terms from two sides. The first is to create messaging of sufficient relevance and specificity to exploit its granular delivery and the second is the need for platform-specific assets. The range of formats has exploded. Video that works on television does not work on YouTube and much less on Facebook, Twitter and Instagram. We believe that 2016 will be the year in which digital creative strategy and dynamic asset management needs to be as central to the success of digital marketing as media allocation, execution and measurement.
Immutable truths amid theconstancy of change
1. The integrity of the digital supply chain encompassing fraud, viewability and meaningful measurement are of existential importance to the digital advertising economy
2. Advertising stops working when it is avoided. Better design, greater value to the consumer, and the responsible use of data both in terms of cost to the consumer’s data plan and privacy are essential
3. The app ecosystem represents both challenge and opportunity. The opportunity is for brand participation in the fast-growing mode of media consumption; the challenge is for brands to create impact and value and earn the attention of the consumer.
4. Selling everywhere rather than somewhere will be the new normal for retailers and brand owners. Where intent exists so does the need to satisfy it.
5. Consumers love video. They love it in short and long formats and increasingly they love it on demand and often free of advertising. Technology enables this. It also enables precision and relevance in targeting that will drive efficiency for advertisers and maintain “free video” as a key platform of marketing communication. This is just one part of the evolving economics of what we have traditionally referred to as television.
6. Data has changed advertising. It has not unequivocally changed it for the better. Our collection and application of data needs to be responsible in targeting and holistic in respect of attribution. Only then we will combine respect for the individual with true understanding of behavior.
We live in an era in which the discovery of content is as important as its delivery. The distribution systems of media are highly evolved and it’s
Brand owners must crack the
code of persistent presence in these
environments.
19 | INTERACTION APRIL 2016
time for a creative renaissance that produces assets that are discoverable, valuable, relevant and specific to the environment of their intended consumption.
And finally2016 won’t be a good year for the faint of heart. Despite the cyclical effect of the Olympics, Euro 2016 and the U.S. presidential election there are substantial headwinds. Persistent low economic growth, a dent in the Chinese dream and slow realization of the potential of Latin America and Africa all conspire to create a tense business environment. Today businesses are extra-cautious and many fear the disruption of activist investors who believe that management is failing to unlock sufficient shareholder value. In response many commentators observe that budgets are increasingly zero-based, new product development has slowed and with it the cycle of slow growth is repeated. There appears to be more rationalization of brand portfolios than product innovation.
The key issues we have identified for 2016 (and 2017) are, we believe, united by this; a day, a month or a year of reckoning is upon us. We are at the end of the beginning of digital marketing. We are not now, nor have ever been, at anything like a “steady-state,” but we believe that a more profound sense of responsibility and transparency between business partners together with collective vigilance is an essential ingredient of re-engaging consumers with brand communications.
Innovation in communications remains of extreme importance, but perhaps some emphasis will shift from “do it because we can” to “do it because we should” and, as a consequence, produce results that drive profitable outcomes and contribute to a new wave of product development and economic growth. n
2016 won’t be a good year for the faint of heart.

20 | INTERACTION APRIL 2016
A Short Walk Through the Numbers

21 | INTERACTION APRIL 2016
A Short Walk Through the Numbers
A SHORT WALK THROUGH THE NUMBERSThe media dayThis year we asked our contributors to be more specific about whether “time online” was for online users only, or averaged for the whole population. We have still not quite got to the bottom of this, but it is clear we were over-reporting online in the past. There are in any case reporting oddities, such as Italy and Germany recording only desktop time online, or China’s sample of 36 cities. We try to adjust for these. Country-by-country figures showing our calculations are all in the electronic version.
Linear TV’s share of the media day seems to be declining one percentage point a year, but of course some of this is retrieved online. A majority, perhaps: we will find out as measurement improves in the coming years. Legacy print and radio continue to donate share to online too, though these too may find a floor with digital variants.
The world’s media day weighted by population
Agg avg. hours 2013 2014 2015 2016
Online 2.17 2.45 2.55 2.67
TV 3.40 3.36 3.33 3.28
Print 0.60 0.58 0.54 0.52
Radio 1.50 1.61 1.59 1.56
Total 7.67 8.00 8.00 8.02
Shares 2013 2014 2015 2016
Online 28 31 32 33
TV 44 42 42 41
Print 8 7 7 6
Radio 20 20 20 19
Total 100 100 100 100
Avg. minutes 2013 2014 2015 2016
Online 130 147 153 160
TV 204 202 200 197
Print 36 35 32 31
Radio 90 97 96 93
Total 460 480 480 481
The world’s media day weighted by local media investment
Agg avg. hours 2013 2014 2015 2016
Online 2.05 2.43 2.58 2.72
TV 3.81 3.70 3.65 3.58
Print 0.60 0.56 0.52 0.50
Radio 1.63 1.66 1.65 1.62
Total 8.09 8.34 8.41 8.43
Shares 2013 2014 2015 2016
Online 25 29 31 32
TV 47 44 43 42
Print 7 7 6 6
Radio 20 20 20 19
Total 100 100 100 100
Avg. minutes 2013 2014 2015 2016
Online 123 146 155 163
TV 229 222 219 215
Print 36 34 31 30
Radio 98 100 99 97
Total 485 501 505 506
22 | INTERACTION APRIL 2016
The UK again has easily the highest per-user e-commerce at USD 3,715 [Stg 2,666] expected in 2016, followed by Denmark at USD 3,266 (DKr 22,153). The UK has however lost its claim to be the most-digital ad economy. We think digital media will comprise 49% of total UK ad investment in 2016, fractionally behind Denmark and China, with Sweden leading on 52%.
The World Bank tells us household final consumption was USD 43tn in 2014, or 66% of global GDP. If we assume half this is retail, then total retail in 2016 should be in the order of 33% x US 72tn or USD 24tn. E-commerce of USD 1.805tn in 2016 would represent 8% of this, roughly a point higher than 2015.
Programmatic and videoFor present purposes “programmatic” means any online display investment which is transacted automatically as opposed to being a manual “insertion order.” We asked our correspondents to estimate what percentage of local digital display ad investment was automated. The result is a global average in 2015 of 37% (2014 = 21%). Excluding the USA, this is 16% (10%). We also asked what percentage online video comprised of local digital display. The global answer: 22% (20%), or 12% (13%) ex USA. Individual values appear in each country entry. n
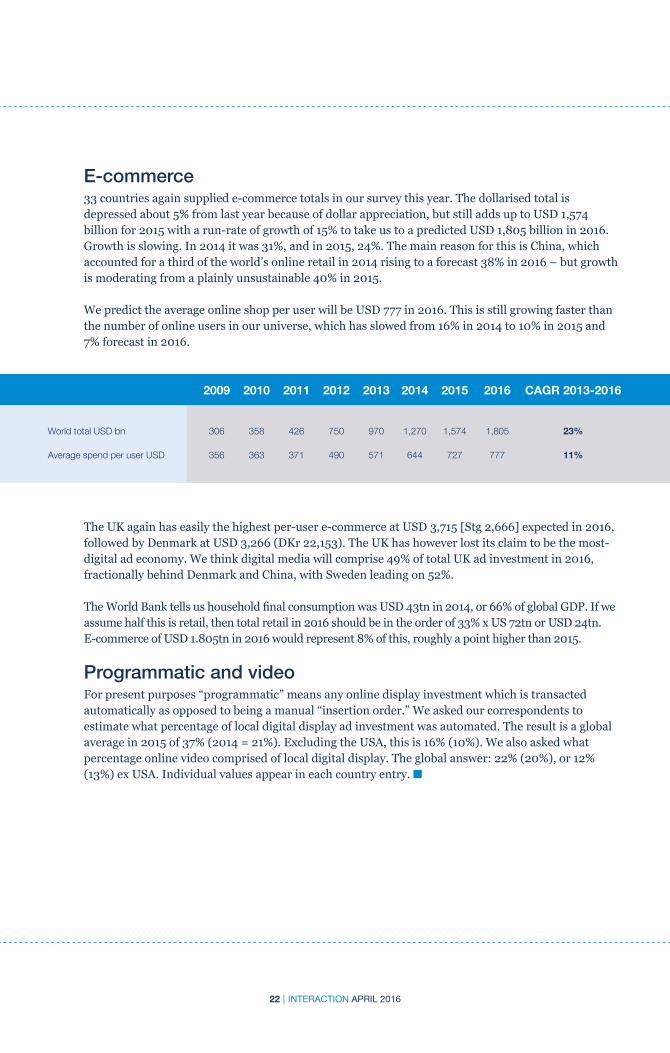
E-commerce33 countries again supplied e-commerce totals in our survey this year. The dollarised total is depressed about 5% from last year because of dollar appreciation, but still adds up to USD 1,574 billion for 2015 with a run-rate of growth of 15% to take us to a predicted USD 1,805 billion in 2016. Growth is slowing. In 2014 it was 31%, and in 2015, 24%. The main reason for this is China, which accounted for a third of the world’s online retail in 2014 rising to a forecast 38% in 2016 – but growth is moderating from a plainly unsustainable 40% in 2015.
We predict the average online shop per user will be USD 777 in 2016. This is still growing faster than the number of online users in our universe, which has slowed from 16% in 2014 to 10% in 2015 and 7% forecast in 2016.
2009 2010 2011 2012 2013 2014 2015 2016 CAGR 2013-2016
World total USD bn 306 358 426 750 970 1,270 1,574 1,805 23%
Average spend per user USD 356 363 371 490 571 644 727 777 11%

23 | INTERACTION APRIL 2016
Ad Fraud

24 | INTERACTION APRIL 2016
Ad fraud is theft of the advertisers’ money and reputation. No legitimate advertiser would want any part in what is a serious and organized global crime.
“Impression fraud” is ghost sites and malicious non-human traffic. “Non-impression fraud” includes ad stacking, pixel-stuffing, low-quality inventory (e.g., unsafe pages, poor viewability, ad clutter) and insertion-order infringements (e.g., disregarding blacklists or geographical limitation; or serving autoplay video ads when the advertiser specifies user-initiated). This overlaps with brand safety.
In open societies, it is unrealistic to expect government or law enforcement to stop ad fraud, much of which originates from a few rogue countries. The solution therefore lies in the free market, self-regulation and sharing best practices.
Attitude to fraud varies around the world. This might be because local prevention technology is still evolving (e.g., India, Czech Republic), or because it is regarded rightly or wrongly as less of a risk. In Brazil, advertisers think of fraud as something agencies fix, if they think of it at all. In South Korea, a famously advanced digital economy, independent verification is still not universal. In Taiwan, local advertisers are reluctant to pay third parties to validate publishers’ claims. Spreading best practices is our priority. As GroupM Spain puts it: “The most powerful remedy is to follow internal and international GroupM practice guidelines.”
The view from the front lineGroupM USA has been working with leading verification providers like DoubleVerify and Integral Ad Science since 2010. These partners detect both automated bot fraud and human-based “site-fraud” tactics. We can deploy these tools programmatically to pre-filter suspect domains or IP addresses, and we also use them to block server calls to fraudulent domains post-bid or in reserve buys. Coupled with clear contractual protections confirming that our clients didn’t pay for fraud, GroupM ensures that our clients’ ads are seen by real human beings who are in our target in an appropriate editorial environment.
The company you keepGroupM Italy observes “Protection from non-human traffic is mainly a planning issue.” Choosing trusted suppliers is the single most effective measure. The UK adds, “Set yourself hard-to-fake outcomes; know what realistic prices are; and investigate anomalies. If something is too good to be true, it probably is.”
Wherever it operates, GroupM has preferred partners or “Trusted Market Places.” The membership changes all the time and is kept under constant scrutiny. Lithuania praises its local news portals for averaging only 0.6% suspicious traffic. Australia remarks that “premium publishers may yield
Attitude to fraud varies around
the world.
AD FRAUD
25 | INTERACTION APRIL 2016
only one or two percent non-human, ad-fraud traffic. Much traffic from ad exchanges is fraudulent. One 2015 case was 60% fraudulent, from fake sites. We recovered all funds.” GroupM Latin America has a standing preference for “above the fold” placements (i.e., in view on the first page load).
Whitelisting: pre-emption is better than cureIt is especially important to practice safe selection when shopping for impressions in open markets in which you know little or nothing about the quality of the inventory. Russia: “In RTB buying we run fraud checks by default for all campaigns.” These controls are mostly pre-bid or post-reporting. Pre-bid cannot always detect fake impressions, but advances in machine-learning improve certainty in discriminating real from fake. This feeds back into DSPs to eliminate future purchases on the fraudulent networks.
Japan: “Our data science team in conjunction with planners routinely use adserving verification reports and client Google Analytics referrer/Adobe session data to identify outlier traffic patterns from suspect countries and IP addresses. We then actively extinguish inventory from suspicious sources.” SAD stands for “suspicious activity detection.” Methods include detecting poor viewability, bots, ad stacking and pixel stuffing, but as Denmark points out, monitors do not reveal too much of their methods to avoid informing the fraudsters.
Pre-bid cannot always detect fake impressions, but advances in machine-learning improve certainty in discriminating real from fake.

26 | INTERACTION APRIL 2016
In some countries it is common
for contracts to specify no payment for
non-compliant impressions and heavy penalties for brand safety
violations.
Verification tools Sizmek ranked top in our informal name-recognition survey in last year’s Interaction. Other often-cited names include DoubleVerify, Integral Ad Science, comScore, Moat and trusted DSPs of which the largest is Google’s DoubleClick. China has RTBAsia, a local provider that has become global. One weakness in today’s technology is that different methods produce different results. South Africa remarks that it is possible to mitigate this by using multiple systems in conjunction.
Sweden: “These systems are not 100% but do spot the majority of fraud.” Brazil: “Today, with the massive use of display networks and programmatic buying, we have greater confidence in the process made by these vendors to choose which sites will be part of their networks.”
Contracts shape behaviorIn some countries it is common for contracts to specify no payment for non-compliant impressions and heavy penalties for brand safety violations. We have even heard of an employment contract which provides for dismissal if a violation limit is exceeded. One also finds arrangements to compensate clients with make-good inventory for non-human traffic. Publishers may offer reputable controls, but your contract should allow you to use any third-party verification you wish. New Zealand: “We retain the right to audit ad server logs, sites and network logs to identify suspicious behavior.” n

27 | INTERACTION APRIL 2016
Online Brands Advertising On TV

28 | INTERACTION APRIL 2016
Do online brands spend a lot on TV advertising?
UK TV trade body Thinkbox uses Nielsen data to compile a non-standard ‘“Online” ad category comprising all the big American tech names, comparison sites and other B2C online services. This represented 7% of all UK TV ad investment in 2015, making it the No. 2 ad category behind Food at No. 1. This was a repeat of 2014, except the Online category grew 14% in 2015 while total TV grew 7%. TV accounts for 60% of the big names’ ad budgets, well above TV’s normal 40% share of UK display investment.
22 countries in this report say online brands are big on TV, and another four describe this as a rising trend.
The main reasons given for upweighting TV are the ones you would expect: good reach, good awareness and a reasonable price – ideal for product launches and market penetration. Mainstream TV does however have high entry costs, which is one reason smaller online brands often confine themselves to digital options. This fixed-cost/benefit problem may also explain why online brands are less common on TV in small, rich countries like Finland, Norway and Sweden.
Malaysia quoted the highest TV share of online category investment at 85%, which is especially remarkable given print is still the dominant medium there. More in line with the U.K. figure are Spain at 70% and The Netherlands at 48%. TV’s ‘“natural” share of global ad budgets is 41%. Japan and China are examples of highly digitized economies in which online brands upweight TV. Japan cites the attractiveness of TV’s naturally older profile (reflecting its aging society) and China values its mass coverage. A Chinese online used-car dealer, Youxin, paid RMB30m (USD4.6m) for a single spot in the popular variety show “Voice of China.” In Germany, some online brands are negotiating joint-venture and equity deals in exchange for airtime.
Our network picked out e-commerce as the most competitive online subcategory on TV, with travel, finance and fashion also mentioned. n
22 countries in this report say online brands are big on TV,
and another four describe
this as a rising trend.
ONLINE BRANDS ADVERTISING ON TV

29 | INTERACTION APRIL 2016
Traditional TV Brand Advertising Online
30 | INTERACTION APRIL 2016
Turkey, Japan and India
specifically mentioned the lack of a “gold
standard” as holding back
advertising on video.
Do traditional TV advertisers spend a lot on digital video?
Most “TV” ad campaigns are actually “audio-visual” campaigns these days. Advertisers augment TV with digital video mainly to compensate for TV’s falling reach of younger viewers. Sometimes there is a price advantage. Some mainstream broadcasters incentivize advertisers to use their online channels. Entry cost to video might be lower than for mainstream TV.
The main constraint is the generally poor measurement of audiences away from the main TV screen. If advertisers knew more they would probably spend more: without all the facts, it is impossible to reckon either cost-per-impression or incremental value as accurately as one can on broadcast TV. Ad tech has spotted this gap in the market and devised useful synthetic measures based on inference, samples and modelling, but none is a “gold standard” for trading.
Turkey, Japan and India specifically mentioned the lack of a “gold standard” as holding back advertising on video. The USA has made the most progress toward deduplicated multiscreen measurement, but cannot yet predict with certainty when a single trading currency will emerge. Similar initiatives are underway in Europe, Latin America and Asia.
Advertiser investment in video is rising despite the lack of measurement. Canada is typical, reporting video budgets having grown 30% over three years to reach 12% of the total A/V investment. At the very high end we find FMCG and pharmaceutical advertisers in Italy devoting nearly half their A/V investment to video, and media & entertainment clients typically 35% or more. Denmark has instances of 33%. Chile reports 20% as typical.
Most countries report video allocation around 10% of the A/V appropriation, ranging 5%-20% according to the individual advertiser and the job in hand. Some advertisers are naturally more committed to digital, and others more conservative. Considerations include the body of established proof relating to TV; the solitary nature of the digital audience versus collective viewing to TV; screen size; and the digital risks of ‘value, viewability and verification.’ And of course the allocation will also be affected by the state of supply. Audience to premium video is often limited, sold out and unpredictable. n
TRADITIONAL TV BRAND ADVERTISING ONLINE

31 | INTERACTION APRIL 2016
Adblocking

32 | INTERACTION APRIL 2016
How serious is adblocking in your market?
Our network reported the figures below in February 2016. As GroupM Australia says, “There is definitely a lack of hard facts around the impact of adblocking. It remains an area we continue to investigate and monitor.” The numbers below mix estimates, sources and definitions and are intended only to give an idea of the problem.
USERS WITH ADBLOCKING INSTALLED %
Turkey 3
Latvia 15
Spain 15
Canada 16
Denmark 17
Brazil (midpoint estimate) 20
Greece 20
Hungary 20
Netherlands 20
UK 20
Argentina 23
Czech Republic (midpoint estimate) 25
Germany 25
USA (midpoint estimate) 25
Chile 26
Italy (any device) 27
France (desktop) 30
Poland 30
Austria (any device) 32
Average of above 22
The industry distinguishes
between “global” and “local” in
publishing and ad serving and
verification.
ADBLOCKING

33 | INTERACTION APRIL 2016
USERS WITH ADBLOCKING INSTALLED %
Lithuania all 18
Lithuania under-35 30
Australia 16 to 24 mobile 41
Australia 25 to 34 mobile 42
Australia 35 to 44 mobile 34
Australia 45 to 54 mobile 25
Australia 55 to 64 mobile 20
Australia female mobile 33
Australia male mobile 40
France 16-24 desktop 53
France 25-34 desktop 39
UK all using (November 2015) 18
UK men using 23
UK women using 13
UK 18-24 using 35
UK 25-34 using 20
UK 35-44 using 16
UK 45-54 using 16
UK 55+ using 13
UK PC using 47
UK laptop using 71
UK tablet using 19
UK smartphone using 23
Norway desktop 23
Norway mobile 9
Norway tablet 8
As GroupM Australia says, “There is definitely a lack of hard facts around the impact of adblocking.”
More detailed information from a few countries suggests young men are the keenest blockers.

34 | INTERACTION APRIL 2016
ESTIMATED LOSS OF INVENTORY %
China mobile (midpoint estimate) 4Australia 8China PC (midpoint estimate) 11India (midpoint estimate) 13Russia 25France 30
The UK IAB study found 61% of users would prefer
to have free content with
ads than having to pay.
Estimates of inventory lost to adblocking are scarce, but rates seem lower than adblocker penetration.
Adblocking is less common in Asia, though this may just be a matter of time: South Korea reports the recent arrival of blocking technology with Western-style consequences. Japan explains that the big blockers have not yet climbed over the language barrier. China points to lower awareness about blockers, and suggests they are less effective because most ads are served by publishers rather than third parties. Singapore reports little impact so far but remains alert. Taiwan also mentions low awareness. Indonesia remarks that its internet traffic is 70% mobile, so structurally less vulnerable. Hong Kong’s advertisers take the positive view that adblocking is about improving the user experience and are ready to switch to video and native if necessary.
GroupM Italy surveyed 2,000 users in early 2016 and found 55% knew about adblocking, 27% had installed it, and 25% intended to install it soon. Contrary to signals elsewhere, it found 35-44s the heaviest installers, and women of 25 the most likely to install. The reasons for blocking were, in order, excessive intrusion; slow loading; and privacy. These are typical. The UK IAB found users would be most likely to block less “if the ads don’t interfere with what I’m doing.” GroupM Italy’s most interesting finding was that many users were not actually against advertising, but wanted ads to be more “coherent with the key characteristics of the web: a simple user experience, customized contents and low cluttering.” The UK IAB study found 61% of users would prefer to have free content with ads than having to pay. There would seem to be the makings of a compromise in there somewhere.
The USA has taken the initiative in the form of two IAB programs. LEAN ads (light, encrypted, ad choices supported, non-invasive) are voluntary standards for responsible ad formats and data collection that do not eat mobile data plans and do not cause “page latency” and other nuisances. The other is a publisher program called DNCC (detect, notify, choice constrain). This so-called “user choice” engine is code enabling publishers to detect ad blockers, deliver a message to those users about the free internet, give them the choice to turn off the blocker in exchange for free content, sometimes in an “ad-lite” format or deny content if they don’t comply. n

35 | INTERACTION APRIL 2016
The Young TV Audience

36 | INTERACTION APRIL 2016
Australia The average 16-34 audience shrank 13% in 2015.
Belgium 2013-2015
16-34 viewing fell 10 minutes a day, and reach fell two percentage points (a fall of 4%). Viewing to other screens has gained one to two share points.
Brazil 2010-2015
Young adult viewing has fallen 16%, but 60% are heavy video users.
Canada 2013-2015
16-34 ratings shrunk 7% in total, and average weekly hours are 11% down.
Chile Since 2011 20-34s free-to-air viewing hours are down 18%, but pay-TV hours are up 44%.
Finland Recent fall in double digits
Hong Kong 2013-2015
The average prime-time 16-34 rating fell from 15.3 to 12.6 and claimed daily reach fell from 93% to 89%. From 2013 to 2014 the percentage of 16-34s claiming to watch TV on a mobile device rose from 17% to 26%.
Hungary 2011-2015
16-34 TV reach dropped 5% and average daily hours by 15 minutes, but reach and hours are still substantial. Internet usage rose 10%.
Ireland Down 7% in a year
Italy 15-34s shrank 7% in 2015, continuing in 2016, and affecting reach—though good weather reduced viewing generally. Viewing to other screens is not measured.
A few countries report their young adult TV audience is stable, but with volume and reach dispersed over more and smaller channels. This is the best one can hope for. GroupM offices in the countries below put the loss in numbers.
THE YOUNG TV AUDIENCE

37 | INTERACTION APRIL 2016
Japan Between 2010 and 2015, according to NHK, the numbers of viewers in their 20s claiming never to watch TV rose from 8% to 16% and those in their 30s from 8% to 13%. Those in their 20s claiming “less than one hour a day” rose from 40% to 56% and those claiming to “prefer digital to terrestrial TV” rose from 49% to 56%.
Latvia The 16-34 audience declined about 7% in 2015.
Lithuania 16-34 TV hours are about half the average, and 12% do not watch TV at all.
Malaysia 2014-2015
15-34s using other media including digital rose from 78% to 92%. Free-to-air viewership has fallen in recent years, but pay-TV is stable.
Netherlands Hours fell 18% in 2015
Norway 2010-2015
Average daily minutes fell from 162 to 112 (31%).
Russia 16-34 reach is in slow steady decline amounting to several points over recent years.
Spain 2011-2015
The total typical TV audience 1% smaller, and the 16-34 part 22% smaller. Average 16-34 hours down 9%. These falls are for free and pay-TV.
Sweden 19-29s average 100 min/day online video of which YouTube ~40, Netflix ~20 and catch-ups ~25.
UK2011-2015
All-adult ad impressions (free and pay) are unchanged, but 16-34s are down 11%.
USA The 18-49 prime-time cable and broadcast audience shrank 11% in Q1 2015 vs. the prior-year period. The loss rate decelerated across the year and in Q1 2016 stood at -8% in broadcast and -3% in cable.

38 | INTERACTION APRIL 2016
This year we will see if these loss rates continue, or stabilize owing to saturation of choice. Evidence from the UK suggests the generation to follow will however wreak more disruption. Over half the TV viewing of UK 12-18s is now non-linear. Analyst Decipher makes these observations of 20 “Millennials” (here meaning 12-18s), which offer hope for TV advertising if we can keep up with the audience:
• The big screen in the living room is still the dominant device for millennials, despite them rarely having control in this environment;
• Millennials are as engaged as ever with content, personalities and stories. Their definition of what constitutes “TV” is extremely broad;
• Young people are showing a growing loyalty to program brands, which they want to consume whenever, wherever and on whichever device;
• Millennials’ willingness to move between devices and services is unprecedented, as is their openness to experimenting with new video formats and services;
• Millennials’ TV and video viewing continues to be an important part of their social interaction with friends and family.
Source: www.itvmedia.co.uk/news/television-and-12-18s-millennials-speak
Over half the TV viewing of
UK 12-18s is now non-linear.

39 | INTERACTION APRIL 2016
Viewability

40 | INTERACTION APRIL 2016
In December 2014 the US IAB encouraged marketers to aim for 70% viewability in 2015, meaning 70% of ads served would meet Media Research Council (MRC) criteria for viewable impressions. This is a demanding target.
The MRC published its viewability criteria in June 2014, running to 14 pages of extensive detail. In the simplest terms, they specify at least 50% of an ad’s pixels must be in view for at least one continuous second and two seconds for video ads. Pending specific mobile standards (expected 2016) the MRC suggests applying the same standards to ads in mobile browsers. It notes that ads served in apps “are currently generally assumed to be viewable.”
Most countries use this baseline. An international benchmark is practical: The MRC is therefore the de facto global standard. American leadership and clarity is therefore highly desirable, although advertisers, publishers and agencies are of course free to negotiate different terms in private.
Brazil makes the important point that its local IAB advises, not compels. It is all very well for experienced buyers and sellers to make their own arrangements, but we support the adoption of rules and conventions for everyone, and seek industry-wide consensus to shape these. For example, GroupM in India is currently working to make 100% pixels the norm.
Quality and quantityStandards should not limit expectations. GroupM in Germany remarks that quality is an important differentiator of agency service. We compete by aiming for the maximum achievable, both pixels-per-impression and impressions-per-campaign, and not settling for the minimum. To do this we find ways to relax the constraints on what publishers can deliver, and what technology can verify, and what auditors can see. GroupM has the scale to test all global and local verification.
For example, GroupM
in India is currently
working to make 100%
pixels the norm.
VIEWABILITY
41 | INTERACTION APRIL 2016
Awareness of and tolerance for viewability problems varies from country to country.
The world is not flatAwareness of and tolerance for viewability problems varies from country to country. We find the same with ad fraud. U.S. and European multinational advertisers expect and therefore promulgate consistency. It is local advertisers where the differences show up. Latin America has generally not acknowledged the North American standards: GroupM Argentina describes viewability more as something to be negotiated than as a quality control. There is similar disinterest in viewability in South Korea and Taiwan. Local advertisers in Japan took notice only in November after Google said it would charge only for viewable impressions.
GroupM Japan acted early, setting an internal standard that 65% of impressions be satisfactorily viewable. It achieves 70% with Xaxis video, which is now its general target for all automated buys. GroupM Hong Kong likes ads to load “above the fold,” so the audience can see it without scrolling. The market in Lithuania recognizes the MRC criteria, but for local portals GroupM mostly applies what it calls “inscreen buying,” which pays only if the whole ad is showing. GroupM USA similarly, and for video it requires evidence of a human audience that initiated the ad to play, with audio.
WYSIWYGGroupM Denmark typically achieves 45% campaign viewability on mobile video; 70% on static desktop; and 80% on desktop video. In mid-2014 it found the industry average for all display was around 40% and set itself a target of 70%, which it achieved in a few months and has since sustained. For video, it is normal to see a “completion rate” specified, meaning watched all the way to the end. GroupM USA works to 50%; Finland expects at least 75%. Sometimes you might agree some form of pro-rata pricing for “viewing persistence.” GroupM Turkey mentioned it sometimes requires two seconds’ dwelltime for static ads.
To beat the average for viewability means being fussy about the suppliers you deal with. Ask your agency how viewability scores compare between, say, Google, Facebook, Microsoft and Xaxis. One question will always lead to another!
Put it in writingGroupM guidance is to contract only for viewable impressions, and preferably only for those with 100% of pixels in view for the desired duration. Measurement discrepancies between sources are inevitable, so the small print should provide for reasonable tolerances. It’s not all about money: all data are a potential source of insight.
Famous namesThe industry distinguishes between “global” and “local” in publishing and ad serving and verification. Global server/verifier names our correspondents mentioned were AppNexus, Integral Ad Science, Adform, Sizmek, Rubicon, Improve Digital, Moat, Weborama and DoubleClick. n

42 | INTERACTION APRIL 2016
2013 2014 2015 2016e
Smartphone penetration % 21 25 31 35 Tablet penetration % 10 13 15 18 E-commerce in ARS bn (excluding travel) 18.2 30.1 45.1 51.1E-commerce per adult internet user ARS 728 1,111 1,555 1,715
Adult media usage (hours per day in decimals) Online (15+, ex mobile) 0.65 0.62 0.70 0.64TV (18+) 3.40 3.20 3.15 3.60Print (18+) 0.62 0.60 0.60Radio (18+) 5.70 5.30 5.30 5.90Total 9.75 9.74 9.75 10.74
Adult media usage (percentages) Online 7 6 7 6TV 35 33 32 34Print 0 6 6 6Radio 58 54 54 55Total 100 100 100 100
Argentina
Historic sources: Emarketer, Euromonitor, comScore, TGI
68%2016e INTERNET USERS %
1122016e E-COMMERCE PER ADULT INTERNET USER USD
20-30%2015e AUTOMATED % OF ONLINE DISPLAY
SNAPSHOT
*ex mobile
Top websites UNIQUE 000s AV MINUTES (DEC 2015)* PER MONTH Google search 15,243 29 Facebook 15,102 426 YouTube 12,436 338Outlook.com 9,315 115Clarin.com 7,586 49
Top apps USERS 000s AV MINUTES (DEC 2015) PER MONTH
Dropbox App 1,271 9 Spotify App 1,022 7 WhatsApp 772 3Stream App 504 11
OTT SVOD ESTIMATED HOMES DAILY MINUTES PER 000s SUBSCRIBER HH
Netflix 417 32Cablevisión on Demand 88 N/ADirecTV On Demand 79 N/A
Streaming audio ESTIMATED USERS MONTHLY UNIQUE 000s VISITORS
Spotify 1,552SoundCloud 595Mimp3.me 174Last.fm 148Goear.com 126
43 | INTERACTION APRIL 2016
2013 2014 2015 2016e
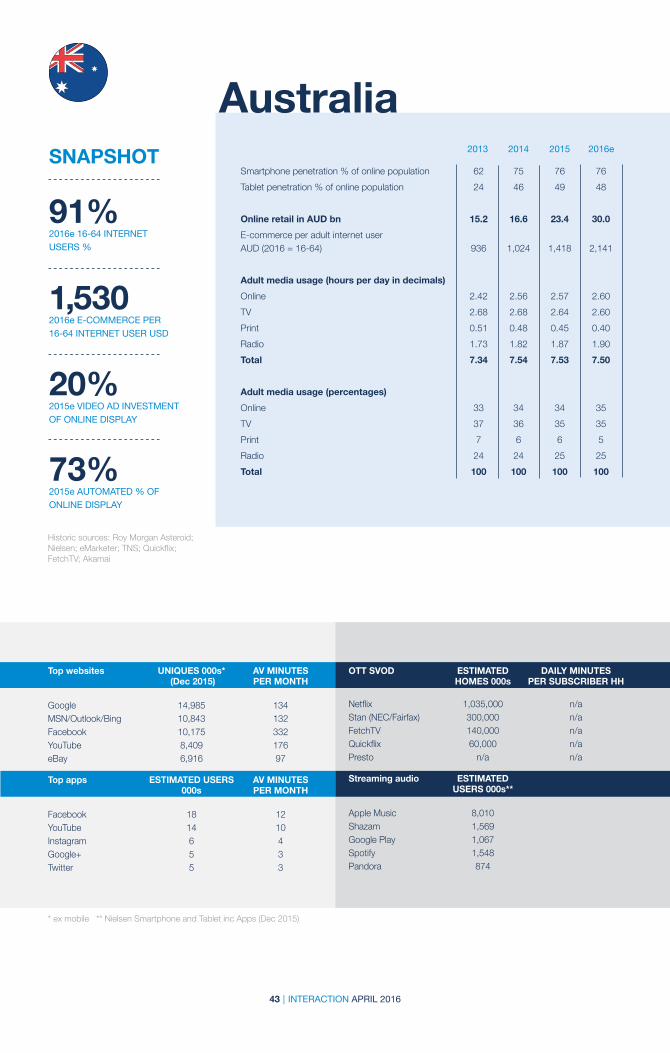
Smartphone penetration % of online population 62 75 76 76Tablet penetration % of online population 24 46 49 48 Online retail in AUD bn 15.2 16.6 23.4 30.0E-commerce per adult internet user AUD (2016 = 16-64) 936 1,024 1,418 2,141
Adult media usage (hours per day in decimals) Online 2.42 2.56 2.57 2.60TV 2.68 2.68 2.64 2.60Print 0.51 0.48 0.45 0.40Radio 1.73 1.82 1.87 1.90Total 7.34 7.54 7.53 7.50
Adult media usage (percentages) Online 33 34 34 35TV 37 36 35 35Print 7 6 6 5Radio 24 24 25 25Total 100 100 100 100
Australia
Historic sources: Roy Morgan Asteroid; Nielsen; eMarketer; TNS; Quickflix; FetchTV; Akamai
91%2016e 16-64 INTERNET USERS %
1,5302016e E-COMMERCE PER 16-64 INTERNET USER USD
20%2015e VIDEO AD INVESTMENT OF ONLINE DISPLAY
73%2015e AUTOMATED % OF ONLINE DISPLAY
SNAPSHOT
Top websites UNIQUES 000s* AV MINUTES (Dec 2015) PER MONTH Google 14,985 134MSN/Outlook/Bing 10,843 132Facebook 10,175 332YouTube 8,409 176eBay 6,916 97
Top apps ESTIMATED USERS AV MINUTES 000s PER MONTH
Facebook 18 12YouTube 14 10Instagram 6 4Google+ 5 3Twitter 5 3
OTT SVOD ESTIMATED DAILY MINUTES HOMES 000s PER SUBSCRIBER HH Netflix 1,035,000 n/aStan (NEC/Fairfax) 300,000 n/aFetchTV 140,000 n/aQuickflix 60,000 n/aPresto n/a n/a
Streaming audio ESTIMATED USERS 000s** Apple Music 8,010Shazam 1,569Google Play 1,067Spotify 1,548Pandora 874
* ex mobile ** Nielsen Smartphone and Tablet inc Apps (Dec 2015)

44 | INTERACTION APRIL 2016
2013 2014 2015 2016e
Smartphone penetration % 44 59 63 65 Tablet penetration % 27 37 40 41 Adult media usage (hours per day in decimals) Online 0.90 0.97 3.14 3.29TV 2.30 2.42 3.14 3.14Print 0.60 0.51 0.82 0.79Radio 3.00 3.18 3.39 3.39Total 6.80 7.08 10.48 10.61
Adult media usage (percentages) Online (average for whole 14+ population) 13 14 30 31TV 34 34 30 30Print 9 7 8 7Radio 44 45 32 32Total 100 100 100 100
AustriaSNAPSHOT
Top websites UNIQUES 000s* willhaben.at 2,567derstandard.at 1,803gmx.at 1,568krone.at 1,539herold.at 1,387
OTT SVOD ESTIMATED HOMES 00s Netflix (last 4 weeks) 345YouTube (last 4 weeks) 4,247My Video (last 4 weeks) 27
Top apps ESTIMATED USERS 000s
All apps together 3,693WhatsApp Messenger 1,800Facebook Messenger 1,400Facebook 1,100Snapchat 600
Streaming Audio ESTIMATED USERS 000s
Spotify (last 4 weeks) 329
Historic sources: Media Analyse, Media Server; ÖWA; AIM; Appanie
83%2016e 14+ INTERNET USERS %
25%2015e VIDEO AD INVESTMENT OF ONLINE DISPLAY
*ex mobile. Unique sites (not network aggregates)
SNAPSHOT
45 | INTERACTION APRIL 2016
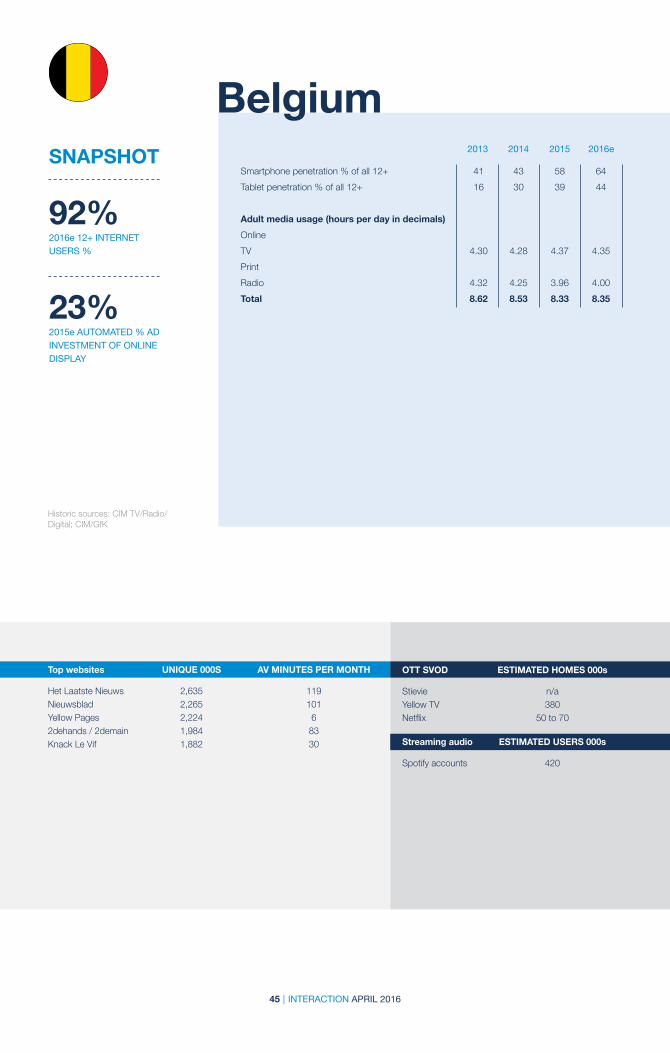
92%2016e 12+ INTERNET USERS %
23%2015e AUTOMATED % AD INVESTMENT OF ONLINE DISPLAY
2013 2014 2015 2016e
Smartphone penetration % of all 12+ 41 43 58 64Tablet penetration % of all 12+ 16 30 39 44
Adult media usage (hours per day in decimals) Online TV 4.30 4.28 4.37 4.35Print Radio 4.32 4.25 3.96 4.00Total 8.62 8.53 8.33 8.35
Historic sources: CIM TV/Radio/Digital; CIM/GfK
BelgiumSNAPSHOT
Top websites UNIQUE 000S AV MINUTES PER MONTH Het Laatste Nieuws 2,635 119Nieuwsblad 2,265 101Yellow Pages 2,224 62dehands / 2demain 1,984 83Knack Le Vif 1,882 30
OTT SVOD ESTIMATED HOMES 000s
Stievie n/aYellow TV 380Netflix 50 to 70
Streaming audio ESTIMATED USERS 000s
Spotify accounts 420

46 | INTERACTION APRIL 2016
2013 2014 2015 2016e
Smartphone penetration % of phone users 27 34 38 43 Tablet penetration % of whole population 3 13 17 20 E-commerce in BRL bn (excluding travel) 30 39 41 46E-commerce per adult internet user BRL 322 381 361 384
Adult media usage (hours per day in decimals) Online (per online user) 3.00 3.40 3.49 3.75
Online (average for all 15+) 1.83 2.25 2.53 2.83 TV 4.70 4.60 4.45 4.35Print 1.00 1.00 1.01 1.00Radio 2.50 2.50 2.48 2.45Total 10.03 10.35 10.47 10.63
Adult media usage (percentages) Online 18 22 24 27TV 47 44 42 41Print 10 10 10 9Radio 25 24 24 23Total 100 100 100 100
BrazilSNAPSHOT
Historic sources: TGI Ibope; comScore; ABComm; PwC; Anatel; eMarketer; Euromonitor
3%2015e AUTOMATED % OF ONLINE DISPLAY
75%2016e 15+ INTERNET USERS %
962016e E-COMMERCE PER ADULT INTERNET USER USD
Top websites UNIQUES AV MINUTES 000s PER MONTH Google Sites 89,968 1,103Facebook 81,101 1,817R7 Portal 70,625 35Globo 65,581 102UOL 64,120 64
Top apps ESTIMATED USERS 000s
WhatsApp 45,663Facebook 38,789YouTube 29,460Instagram 18,167Twitter 6,874
OTT SVOD Not reported. Netflix said to have ca. 4 million homes
47 | INTERACTION APRIL 2016
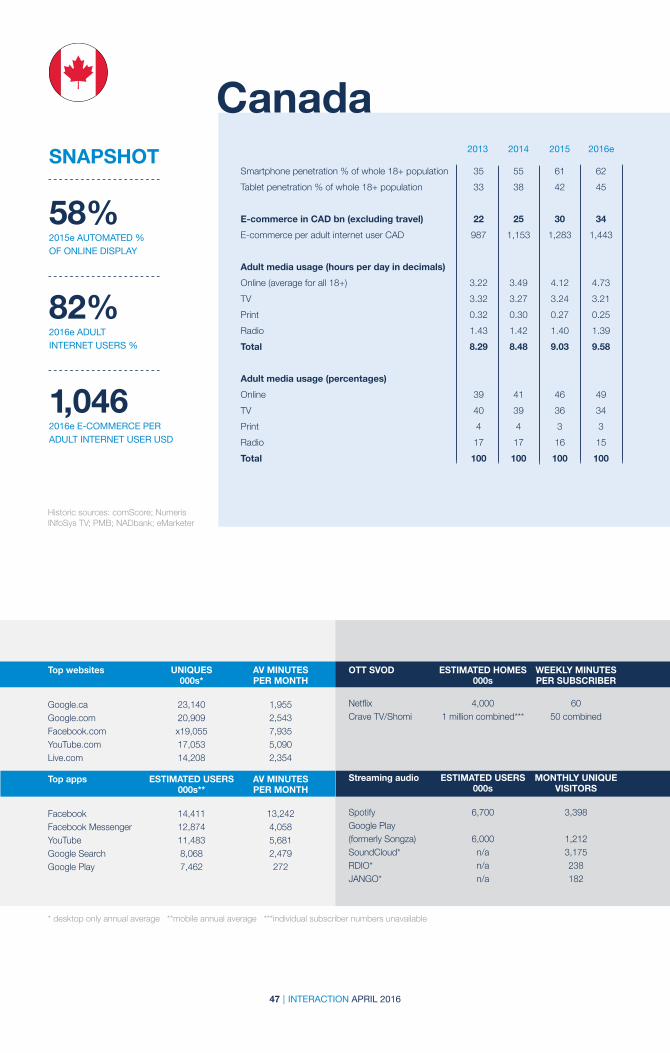
58%2015e AUTOMATED % OF ONLINE DISPLAY
82%2016e ADULT INTERNET USERS %
1,0462016e E-COMMERCE PER ADULT INTERNET USER USD
2013 2014 2015 2016e
Smartphone penetration % of whole 18+ population 35 55 61 62 Tablet penetration % of whole 18+ population 33 38 42 45 E-commerce in CAD bn (excluding travel) 22 25 30 34E-commerce per adult internet user CAD 987 1,153 1,283 1,443
Adult media usage (hours per day in decimals) Online (average for all 18+) 3.22 3.49 4.12 4.73TV 3.32 3.27 3.24 3.21Print 0.32 0.30 0.27 0.25Radio 1.43 1.42 1.40 1.39Total 8.29 8.48 9.03 9.58
Adult media usage (percentages) Online 39 41 46 49TV 40 39 36 34Print 4 4 3 3Radio 17 17 16 15Total 100 100 100 100
CanadaSNAPSHOT
Top websites UNIQUES AV MINUTES 000s* PER MONTH Google.ca 23,140 1,955Google.com 20,909 2,543Facebook.com x19,055 7,935YouTube.com 17,053 5,090Live.com 14,208 2,354
Top apps ESTIMATED USERS AV MINUTES 000s** PER MONTH
Facebook 14,411 13,242Facebook Messenger 12,874 4,058YouTube 11,483 5,681Google Search 8,068 2,479Google Play 7,462 272
OTT SVOD ESTIMATED HOMES WEEKLY MINUTES 000s PER SUBSCRIBER Netflix 4,000 60Crave TV/Shomi 1 million combined*** 50 combined
Streaming audio ESTIMATED USERS MONTHLY UNIQUE 000s VISITORS
Spotify 6,700 3,398Google Play (formerly Songza) 6,000 1,212SoundCloud* n/a 3,175RDIO* n/a 238JANGO* n/a 182
Historic sources: comScore; Numeris INfoSys TV; PMB; NADbank; eMarketer
* desktop only annual average **mobile annual average ***individual subscriber numbers unavailable
48 | INTERACTION APRIL 2016
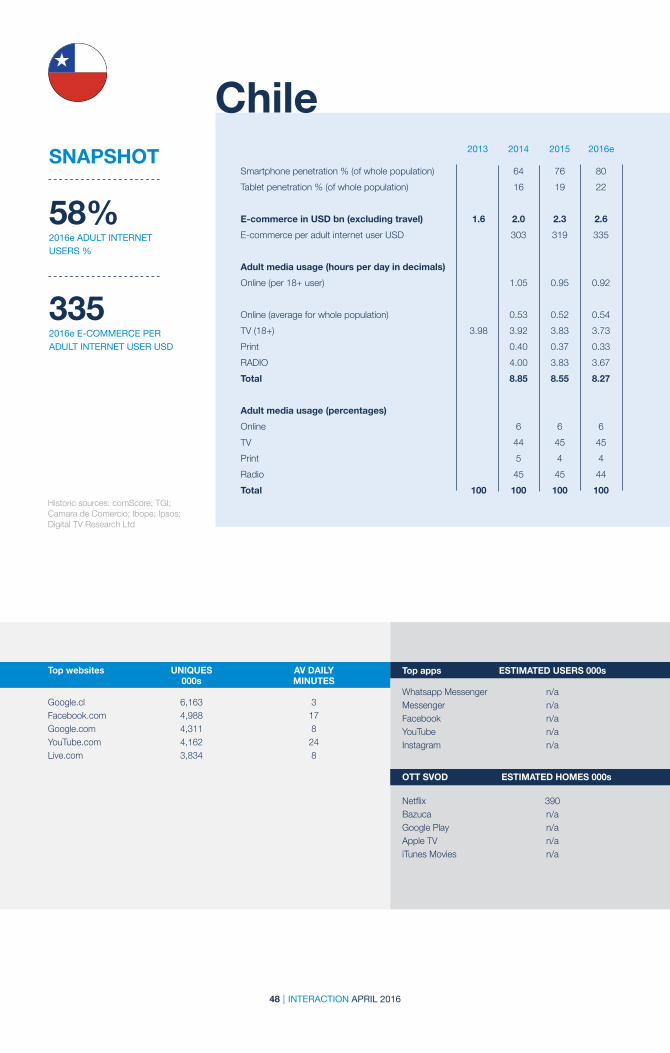
2013 2014 2015 2016e
Historic sources: comScore; TGI; Camara de Comercio; Ibope; Ipsos; Digital TV Research Ltd
ChileSNAPSHOT
58%2016e ADULT INTERNET USERS %
3352016e E-COMMERCE PER ADULT INTERNET USER USD
Smartphone penetration % (of whole population) 64 76 80Tablet penetration % (of whole population) 16 19 22 E-commerce in USD bn (excluding travel) 1.6 2.0 2.3 2.6E-commerce per adult internet user USD 303 319 335
Adult media usage (hours per day in decimals) Online (per 18+ user) 1.05 0.95 0.92 Online (average for whole population) 0.53 0.52 0.54TV (18+) 3.98 3.92 3.83 3.73Print 0.40 0.37 0.33RADIO 4.00 3.83 3.67Total 8.85 8.55 8.27
Adult media usage (percentages) Online 6 6 6TV 44 45 45Print 5 4 4Radio 45 45 44Total 100 100 100 100
Top websites UNIQUES AV DAILY 000s MINUTES Google.cl 6,163 3Facebook.com 4,988 17Google.com 4,311 8YouTube.com 4,162 24Live.com 3,834 8
Top apps ESTIMATED USERS 000s
Whatsapp Messenger n/aMessenger n/aFacebook n/aYouTube n/aInstagram n/a
OTT SVOD ESTIMATED HOMES 000s
Netflix 390Bazuca n/aGoogle Play n/aApple TV n/aiTunes Movies n/a

49 | INTERACTION APRIL 2016
52%2016e 20+ INTERNET USERS %
1,2512016e ONLINE SHOPPING PER 20+ INTERNET USER USD
9%2015e VIDEO AD INVESTMENT OF ONLINE DISPLAY
2013 2014 2015 2016e
Historic sources: China National Resident Survey; CNNIC; iResearch China Online Shopping reports; MIT; iResearch 2015 media hours are January-June only
ChinaSNAPSHOT
Smartphone penetration % of phone users 33 45 60 70Tablet penetration % of whole population 13 17 16 18 E-commerce in CNY billion (including B2B, 10,116 13,100 15,900 18,500travel, O2O, excluding group buying)(online shopping only) 1,892 2,785 3,900 4,500(online shopping via PCs) 1,618 1,844 1,900 1,500(online shopping via mobile devices) 274 941 2,000 3,000 (online shopping only) per adult internet user CNY 4,130 5,686 7,459 8,182
Adult media usage (hours per day in decimals) Ages 15-69 36 cities Online (per online user) 3.26 3.58 3.37 3.42TV (per viewer) 2.70 2.61 2.61 2.55Print (per reader) 0.64 0.61 0.56 0.53Radio (per listener) 0.81 1.11 1.04 0.92Total 7.41 7.91 7.57 7.42
Adult media usage (percentages) Online 44 45 44 46TV 36 33 34 34Print 9 8 7 7Radio 11 14 14 12Total 100 100 100 100
Top websites UNIQUE AV MINUTES 000s* PER MONTH qq.com [腾讯] 458,426 123baidu.com [百度] 469,445 103360.cn [360安全中心] 311,046 27haosou.com [好搜] 340,344 24taobao.com [淘宝网] 324,606 112
Top apps ESTIMATED USERS AV MINUTES 000s** PER MONTH
WeChat [微信] 543,039 492QQ 500,987 471iQIYI [爱奇艺] 273,024 517Mobile Taobao [手机淘宝] 235,103 119Sogou Input [搜狗手机输入法] 214,216 n/a (input apps run in parallel)

50 | INTERACTION APRIL 2016
2013 2014 2015 2016e
Historic sources: MML-TGI; NetMonitor;Mediaresearch; APEK
Czech Republic
77%2016e ADULT INTERNET USERS %
3452016e E-COMMERCE PER ADULT INTERNET USER USD
12%2015e VIDEO AD INVESTMENT OF ONLINE DISPLAY
5%2015e AUTOMATED % OF ONLINE DISPLAY
SNAPSHOT Smartphone penetration % of phone users 11 33 45 50 Tablet penetration % of phone users 2 13 18 22 E-commerce in EUR bn (excluding travel) 1.6 1.9 2.1 2.2 E-commerce per adult internet user EUR 240 274 301 314
Adult media usage (hours per day in decimals) Online (per 15+ user) 1.86 2.40 2.70 2.80
Online (average for whole population) 1.37 1.84 2.08 2.17TV 3.58 3.68 3.70 3.50Print 0.31 0.20 0.20 0.18Radio 2.17 2.28 2.40 2.25Total 7.43 8.00 8.38 8.10
Adult media usage (percentages) Online 18 23 25 27TV 48 46 44 43Print 4 2 2 2Radio 29 28 29 28Total 100 100 100 100
Top websites UNIQUES AV MINUTES 000s PER MONTH seznam.cz 5,749 814 novinky.cz 4,063 124 idnes.cz 3,690 107 super.cz 3,217 59 heureka.cz 2,810 34
OTT SVOD ESTIMATED HOMES 000s
O2 TV 200Netflix n/a UPC Horizon Go n/a

51 | INTERACTION APRIL 2016
97%2015e ADULT INTERNET USERS %
3,2662016e E-COMMERCE PER ADULT INTERNET USER USD
2013 2014 2015 2016e
Historic sources: Danskernes mdievaner; Danish Chamber of Commerce; Gemius; eMarketer; Bloomberg
DenmarkSNAPSHOT
Smartphone penetration % 60 73 81 83Tablet penetration % 41 58 69 73 E-commerce in DKr bn excluding travel 58.7 69.7 87.8 95.5E-commerce per adult internet user DKr 14,379 16,607 20,845 22,153
Adult media usage (hours per day in decimals) Online 1.57 1.62 1.70 1.81TV 2.26 2.21 2.19 2.18Print 0.52 0.46 0.45 0.43Radio 1.35 1.33 1.32 1.31Total 5.70 5.62 5.66 5.73
Adult media usage (percentages) Online 28 29 30 32TV 40 39 39 38Print 9 8 8 8Radio 24 24 23 23Total 100 100 100 100
Top websites UNIQUES AV MINUTES 000s PER MONTH dr.dk 1,850 n/a tv2.dk 1,500 n/a ekstrabladet.dk 1,300 n/a bt.dk 1,000 n/a krak.dk 1,350 n/a
Top apps ESTIMATED USERS AV MINUTES 000s PER MONTH
TV 2 Nyhedscenter n/a 33,400,807TV TID n/a 40,997,940DBA n/a 49,596,562TV 2 Vejrcenter n/a 1,962,961Bilbasen n/a 11,074,348
OTT SVOD ESTIMATED DAILY MINUTES HOMES 000s PER SUBSCRIBER HH Netflix 494 15 Viaplay 156 14 Tv2 Play 130 13 YouBio 78 12 Tv3 Play 78 11
Streaming audio ESTIMATED USERS 000s
Spotify 400 Tidal 150 TDC Play 50 Deezer 25 Napster 20
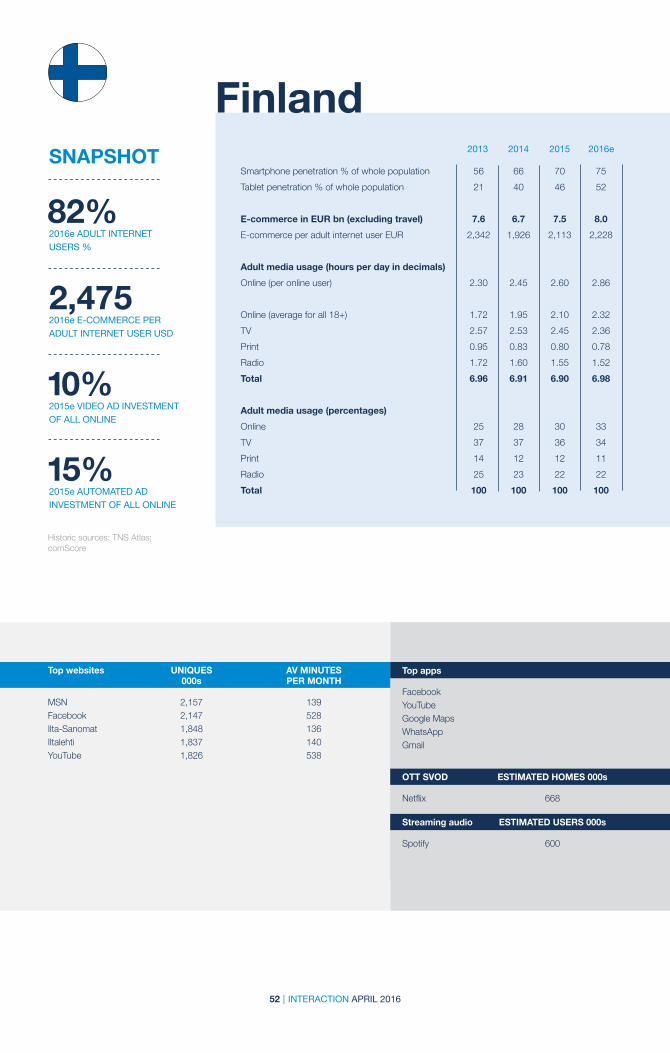
52 | INTERACTION APRIL 2016
2013 2014 2015 2016e
FinlandSmartphone penetration % of whole population 56 66 70 75Tablet penetration % of whole population 21 40 46 52 E-commerce in EUR bn (excluding travel) 7.6 6.7 7.5 8.0 E-commerce per adult internet user EUR 2,342 1,926 2,113 2,228
Adult media usage (hours per day in decimals) Online (per online user) 2.30 2.45 2.60 2.86
Online (average for all 18+) 1.72 1.95 2.10 2.32TV 2.57 2.53 2.45 2.36Print 0.95 0.83 0.80 0.78Radio 1.72 1.60 1.55 1.52Total 6.96 6.91 6.90 6.98
Adult media usage (percentages) Online 25 28 30 33TV 37 37 36 34Print 14 12 12 11Radio 25 23 22 22Total 100 100 100 100
Historic sources: TNS Atlas; comScore
82%2016e ADULT INTERNET USERS %
2,4752016e E-COMMERCE PER ADULT INTERNET USER USD
10%2015e VIDEO AD INVESTMENT OF ALL ONLINE
15%2015e AUTOMATED AD INVESTMENT OF ALL ONLINE
SNAPSHOT
Top websites UNIQUES AV MINUTES 000s PER MONTH MSN 2,157 139Facebook 2,147 528Ilta-Sanomat 1,848 136Iltalehti 1,837 140YouTube 1,826 538
Top apps
Facebook YouTube Google Maps WhatsApp Gmail
OTT SVOD ESTIMATED HOMES 000s
Netflix 668
Streaming audio ESTIMATED USERS 000s
Spotify 600

53 | INTERACTION APRIL 2016
Top websites* UNIQUES AV MINUTES 000s PER MONTH Google 39,353 2.27 Facebook 25,011 4.90 YouTube 22,589 2.52 Amazon 21,118 0.58 Orange 18,451 2.40
Top apps** ESTIMATED USERS 000s Samsung Apps 13,262 Game center 9,052 Deezer 3,886 Waze 3,698 Orange 3,520
OTT SVOD*** ESTIMATED USERS 000s Netflix 2,192 CanalPlay 2,154 iTunes 2,154 myTF1vod 1,928 Google Play 1,663
Streaming audio* ESTIMATED USERS 000s Deezer 3,339 Dailymotion Music 1,507 NRJ 1,144 La coccinnelle du Net 723 SoundCloud 605
2013 2014 2015 2016e
France
Historic sources: Médiamétrie, 126 000, NetRatings, Media In Life (GroupM); IP; Les Echos; ARCEP; SRI UDECAM
78%2016e 12+ INTERNET USERS %
1,7582016e E-COMMERCE PER ADULT INTERNET USER USD
30%2015e VIDEO AD INVESTMENT OF ONLINE DISPLAY
40%2015e AUTOMATED AD INVESTMENT OF ONLINE DISPLAY
SNAPSHOT Smartphone penetration % of whole population 53 56 58 62Tablet penetration % of whole population 19 36 38 45 E-commerce in EUR bn (including travel) 50.0 57.0 65.0 70.0E-commerce per 12+ internet user EUR 1,182 1,317 1,479 1,582E-commerce excluding travel is not available
Adult media usage (hours per day in decimals) Online 1.48 1.61 1.77 1.88TV 4.03 3.85 3.88 3.92Print 0.80 0.78 0.75 0.72Radio 2.47 2.38 2.37 2.40Total 8.78 8.62 8.77 8.92
Adult media usage (percentages) Online 17 19 20 21TV 46 45 44 44Print 9 9 9 8Radio 28 28 27 27Total 100 100 100 100
*MNR/Mediametrie/Desktop **MNR/ Mediametrie/Mobile *** GroupM Panel/November 2015

54 | INTERACTION APRIL 2016
Top websites* UNIQUES 000s T-Online 31,360gutefrage.net 21,470eBay.de 21,300FOCUS Online 19,450Web.de 19,370Bild 19,120
Top apps** ESTIMATED USERS 000s
Web.de 3,560Wetter.de 3,450GMX 2,860Mobile.de 2,800TV Spielfilm 2,540
OTT SVOD ESTIMATED HOMES 000s
Amazon Prime 9,083 Maxdome 5,109 Netflix 3,690 Watchever 1,987 Snap by Sky 1,703
Streaming audio ESTIMATED USERS 000s
Spotify 12,600 Google Play Music 3,600 Deezer 2,800 Napster 2,200 Simfy 1,600
2013 2014 2015 2016e
Historic sources: ZDF/ARD; Statista.de; AGOF; Goldmedia; Bitkom
* AGOF October 2015 **AGOF
Germany
84%2016e 10+ INTERNET USERS %
8362016e E-COMMERCE PER ADULT INTERNET USER USD
25%2014e VIDEO AD INVESTMENT OF ONLINE DISPLAY
SNAPSHOT Smartphone penetration % 41 50 55 61Tablet penetration % 25 33 38 43 E-commerce in EUR bn (excluding travel) 33.1 37.1 41.7 42.5 E-commerce per10+ internet user EUR 637 667 743 752
Adult media usage (hours per day in decimals) Online (desktop only, whole population) 1.91 1.80 1.78 1.60TV 3.68 3.68 3.47 3.40Print 0.46 0.48 0.50 0.50Radio 2.28 2.50 2.89 2.89Total 8.33 8.46 8.64 8.39
Adult media usage (percentages) Online 23 21 21 19TV 44 44 40 41Print 6 6 6 6Radio 27 30 33 34Total 100 100 100 100

55 | INTERACTION APRIL 2016
64%2016e INTERNET USERS % OF 13-70s
2013 2014 2015 2016e
Historic sources: TGI; FocusBari; Web-id; Ened; Google Analytics
GreeceSNAPSHOT
Smartphone penetration % of phone users 35 45 52 55Tablet penetration % 5 11 15 18 Adult media usage (hours per day in decimals) Online 2.20 2.35 2.35TV 2.50 2.50 2.50Print 0.59 0.50 0.50Radio 1.90 1.90 1.90Total 7.19 7.25 7.25
Adult media usage (percentages) Online 31 32 32TV 35 34 34Print 8 7 7Radio 26 26 26Total 100 100 100 100
Top websites UNIQUES 000s Newsbomb.gr 4,597,280Lifo.gr 4,124,339Protothema.gr 4,028,107iEfimerida.gr 3,966,362Newsit.gr 3,952,248
Streaming Audio ESTIMATED USERS 000s
Spotify 650,000

56 | INTERACTION APRIL 2016
2013 2014 2015 2016e
Historic sources: Nielsen Media Index; comScore
Hong Kong
89%2016e ADULT INTERNET USERS %
SNAPSHOT
Top websites UNIQUE AV MINUTES 000s PER MONTH Yahoo.com.hk 3,655 7.2Google.com.hk 3,272 3.9Yahoo.com 2,465 5.1Facebook.com 2,405 13.7Google.com 2,402 7.5
Top apps ESTIMATED USERS AV MINUTES 000s PER MONTH Next Media Interactive Ltd. 3,989 78.6Oriental Press Group 2,415 14.5Yahoo Sites 2,295 20.7HKET Holdings 1,987 10.9OpenRice 1,977 27.9
OTT SVOD
Netflix launched Jan 2016LeEco
Smartphone penetration % 53 62 80 85Tablet penetration % 21 24 34 40
Adult media usage (hours per day in decimals) Online 2.40 2.43 2.85 2.95TV 2.75 2.23 2.15 2.11Print 1.17 1.12 1.10 1.07Radio 1.10 1.05 1.02 1.01Total 7.42 6.83 7.12 7.14
Adult media usage (percentages) Online 32 36 40 41TV 37 33 30 30Print 16 16 15 15Radio 15 15 14 14Total 100 100 100 100

57 | INTERACTION APRIL 2016
2013 2014 2015 2016e
Historic sources: Gemius-Ipsos; Nielsen; Millward Brown TGI; Ipsos/GfK; IAB
Hungary
64%2015e 18+ INTERNET USERS %
3072016e E-COMMERCE PER ADULT INTERNET USER USD
30%2015e AUTOMATED % OF ONLINE DISPLAY
SNAPSHOT Smartphone penetration % of whole population 24 31 41 55Tablet penetration % of whole population 6 11 15 18 E-commerce in HUF bn (including travel) 210 273 355 447 E-commerce per adult internet user HUF 44,322 54,688 69,690 86,628
Adult media usage (hours per day in decimals) Online (per online user) 1.71 1.90 2.55 3.10 Online (average for all adults) 0.99 1.17 1.60 1.97TV 5.02 5.02 4.98 4.95Print 0.36 0.35 0.35 0.35Radio 2.95 2.85 3.00 3.00Total 9.32 9.39 9.93 10.27
Adult media usage (percentages) Online 11 12 16 19TV 54 53 50 48Print 4 4 4 3Radio 32 30 30 29Total 100 100 100 100
Top websites UNIQUE AV MINUTES 000s PER MONTH origo.hu 1,409 26blog.hu 1,294 4arukereso.hu 1,180 5index.hu 1,158 50jofogas.hu 1,120 21
Top apps ESTIMATED USERS 000s
Facebook 2,000 Facebook Messenger 1,500 YouTube 1,000 Viber 800 Instagram 600
OTT SVOD ESTIMATED HOMES 000s
Netflix 50
Streaming audio ESTIMATED USERS 000s
Spotify 150 Deezer 90 SoundCloud 80
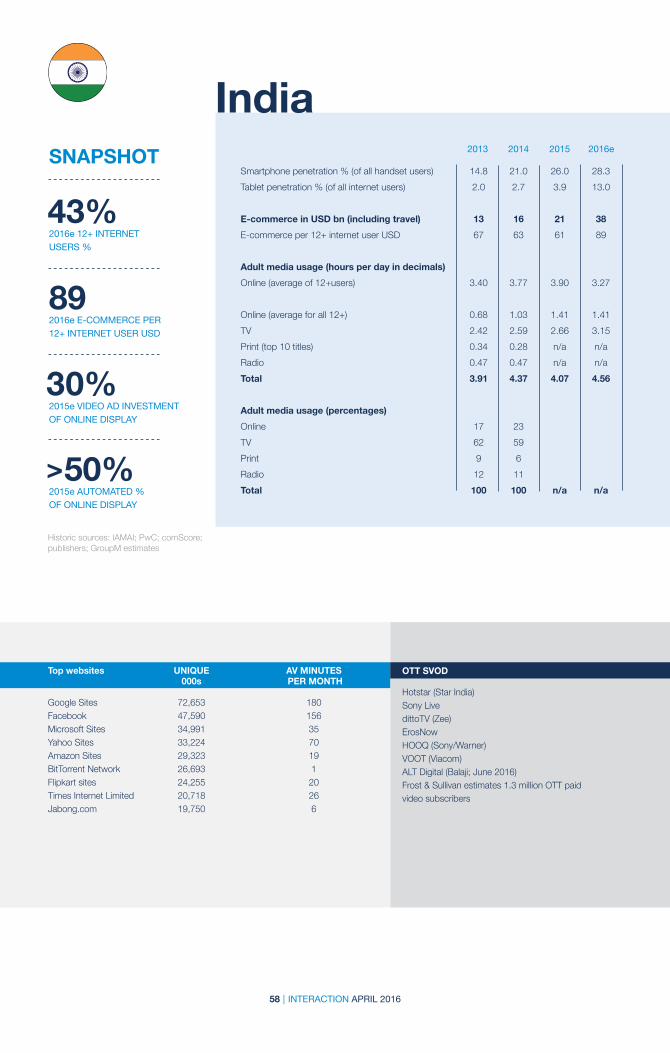
58 | INTERACTION APRIL 2016
2013 2014 2015 2016e
India
Top websites UNIQUE AV MINUTES 000s PER MONTH Google Sites 72,653 180Facebook 47,590 156Microsoft Sites 34,991 35Yahoo Sites 33,224 70Amazon Sites 29,323 19BitTorrent Network 26,693 1Flipkart sites 24,255 20Times Internet Limited 20,718 26Jabong.com 19,750 6
OTT SVOD
Hotstar (Star India) Sony Live dittoTV (Zee) ErosNow HOOQ (Sony/Warner) VOOT (Viacom) ALT Digital (Balaji; June 2016) Frost & Sullivan estimates 1.3 million OTT paid video subscribers
Smartphone penetration % (of all handset users) 14.8 21.0 26.0 28.3Tablet penetration % (of all internet users) 2.0 2.7 3.9 13.0 E-commerce in USD bn (including travel) 13 16 21 38 E-commerce per 12+ internet user USD 67 63 61 89
Adult media usage (hours per day in decimals) Online (average of 12+users) 3.40 3.77 3.90 3.27 Online (average for all 12+) 0.68 1.03 1.41 1.41TV 2.42 2.59 2.66 3.15Print (top 10 titles) 0.34 0.28 n/a n/aRadio 0.47 0.47 n/a n/aTotal 3.91 4.37 4.07 4.56
Adult media usage (percentages) Online 17 23 TV 62 59 Print 9 6 Radio 12 11 Total 100 100 n/a n/a
Historic sources: IAMAI; PwC; comScore; publishers; GroupM estimates
43%2016e 12+ INTERNET USERS %
892016e E-COMMERCE PER 12+ INTERNET USER USD
30%2015e VIDEO AD INVESTMENT OF ONLINE DISPLAY
>50%2015e AUTOMATED % OF ONLINE DISPLAY
SNAPSHOT

59 | INTERACTION APRIL 2016
2013 2014 2015 2016e
Historic sources: eMarketer; comScore; Technasia, Jakarta Post; Merdeka.com
Indonesia
40%2016e iNTERNET USERS %
602016e E-COMMERCE PER INTERNET USER USD
SNAPSHOT Smartphone penetration % of phone users 17 24 29 40Tablet penetration % of whole population 2 8 10 13 E-commerce in USD bn (excluding travel) 1.1 1.6 3.4 6.2E-commerce per internet user USD 15 19 36 60
Top websites UNIQUE AV MINUTES 000s PER MONTH Google Sites 22,057 209Facebook 16,006 151Yahoo sites 10,941 53Lazada Sites 10,158 4WordPress.com 7,319 2
Top apps ESTIMATED USERS AV MINUTES 000s PER MONTH Whatsapp n/a 180BBM 55,000 690Instagram n/a n/aFacebook n/a n/aLINE 30,000 150
Streaming audio AVG. VISIT (JAN 2015)
Deezer 555,808 Spotify.com 171,949 Melon.co.id 62,295 langitmusik.co.id 53,055 Guvera 24,696

60 | INTERACTION APRIL 2016
2013 2014 2015 2016e
IrelandSmartphone penetration % of phone users 64 70 74 80Tablet penetration (% of pop. having access to a tablet) 21 29 31 49 E-commerce in EUR bn 4.6 5.3 6.0 7.0 E-commerce per adult internet user EUR 1,390 1,558 1,744 2,034
Adult media usage (hours per day in decimals) Online (per online user, ex streaming) 3.39 Online (average for all 18+, ex streaming) 2.02 2.40 2.50 3.15TV 2.81 2.60 2.55 2.28Print 0.83Radio 2.22 2.42 2.42 1.74Total 7.05 7.42 7.47 8.00
Adult media usage (percentages) Online 29 32 33 39TV 40 35 34 29Print 0 0 0 10Radio 31 33 32 22Total 100 100 n/a n/a
Historic sources: Eir Household Survey; GWI; Ecommerce Europe; GroupM; comScore
*ex mobile
93%2016e ADULT INTERNET USERS %
2,2602016e E-COMMERCE PER ADULT INTERNET USER USD
27%2015e VIDEO AD INVESTMENT OF ONLINE DISPLAY
20%2015e AUTOMATED % OF ONLINE DISPLAY
SNAPSHOT
Top websites UNIQUE AV MINUTES 000s* PER MONTH RTE.ie 807,000 20Inpdependent.ie 748,000 33Irish Times 732,000 19Wikipedia 728,000 14BBC 709,000 23
Top apps ESTIMATED USERS AV MINUTES 000s PER DAY Color Switch n/a FB Messenger n/a 18Whatsapp n/a 13Snapchat n/a 8Facebook n/a 45
OTT SVOD ESTIMATED HOMES 000s
Netflix 150,000Google Play Sky Go BBC iPlayer Vimeo
Streaming audio
iTunesSpotifyApple MusicGoogle Play MusicSoundCloud

61 | INTERACTION APRIL 2016
2013 2014 2015 2016e
Italy
Top websites UNIQUES AV MINUTES 000s PER MONTH Google 25,340 245Facebook 22,602 766YouTube 20,038 101Amazon 15,980 44Yahoo 14,835.5 46
Top apps UNIQUES AV MINUTES 000s PER MONTH WhatsApp 16,955 586Google Play 15,397 29Facebook 15,168 752Google Search 14,111 61Facebook Messenger 12,212 94
OTT SVOD ESTIMATED USERS 000s
Sky Go (active unique users) 2,400Sky Ondemand (mysky connected) 2,000Netflix (unique users websites) 1,277Premium Play (subscription hh) 950Infinity (unique users websites) 875Sky online (unique users websites) 672 Streaming audio ESTIMATED USERS 000s Spotify 3,334SoundCloud 451Jango Music 418Deezer 308Cubomusica 267
Historic sources: Eurisko; Audipress; Audiweb; Auditel; Politecnico di Milano; Mobile Next; Sinottica/TSSP; comScore Mobilens; Ookla Net Index
54%2016e 15+ INTERNET USERS %
3942016e E-COMMERCE PER ADULT INTERNET USER USD
25%2015e VIDEO AD INVESTMENT OF INTERNET DISPLAY
21%2015e AUTOMATED % OF ONLINE DISPLAY
SNAPSHOT Smartphone penetration % of all 15+ 45 48 57 66Tablet penetration % of households 16 23 24 25 E-commerce in EUR bn (excluding travel) 6.6 7.5 8.8 10.2E-commerce per adult internet user EUR 262 288 322 355
Adult media usage (hours per day in decimals) Online (average for all adults) 0.64 0.85 0.90 0.97TV 4.45 4.45 4.32 4.28Print 0.28 0.25 0.23 0.22Radio 2.17 2.20 2.20 2.20Total 7.54 7.75 7.65 7.67
Adult media usage (percentages) Online 8 11 12 13TV 59 57 56 56Print 4 3 3 3Radio 29 28 29 29Total 100 100 100 100

62 | INTERACTION APRIL 2016
Top websites UNIQUE AV MINUTES 000s PER MONTH Google 55,363 99Yahoo Japan 54,959 360LINE Corp 38,241 26FC2.com 37,888 32Amazon.co.jp 34,864 48Rakuten 32,690 72
Top apps ESTIMATED USERS 000s LINE 39,479 Facebook 25,663 Twitter 16,809 Yahoo Japan 13,740
OTT SVOD ESTIMATED HOMES 000s
dTV 4,600,000 Hulu 1,000,000 U-NEXT 160,000 Netflix n/a Amazon Prime n/a
Streaming audio
Amazon Prime Music Google Play Music Apple Music AWA LINE Music
2013 2014 2015 2016e
JapanSmartphone penetration % 37 40 41 44Tablet penetration % 18 24 27 29 E-commerce in JPY tn (excluding travel) 6.4 7.5 8.6E-commerce per adult internet user JPY 62,684 72,394 81,818E-commerce in JPY tn (total) 9.4 10.7 12.0E-commerce in JPY tn (travel only) 3.0 3.2 3.4
Adult media usage (hours per day in decimals) Online 2.19 2.31 2.45 2.51TV 2.53 2.52 2.55 2.52Print 0.64 0.64 0.55 0.52Radio 0.52 0.52 0.48 0.47Total 5.88 5.99 6.03 6.01
Adult media usage (percentages) Online 37 39 41 42TV 43 42 42 42Print 11 11 9 9Radio 9 9 8 8Total 100 100 100 100
Historic sources: Video Research; Nielsen; comScore; Hakuhodo; eMarketer
Note: awareness is low for SVOD and streaming audio
95%2016e ADULT INTERNET USERS %
7302016e ONLINE SHOPPING PER ADULT INTERNET USER USD
10%2015e VIDEO AD INVESTMENT OF ONLINE DISPLAY
46%2015e AUTOMATED % OF ONLINE DISPLAY
SNAPSHOT
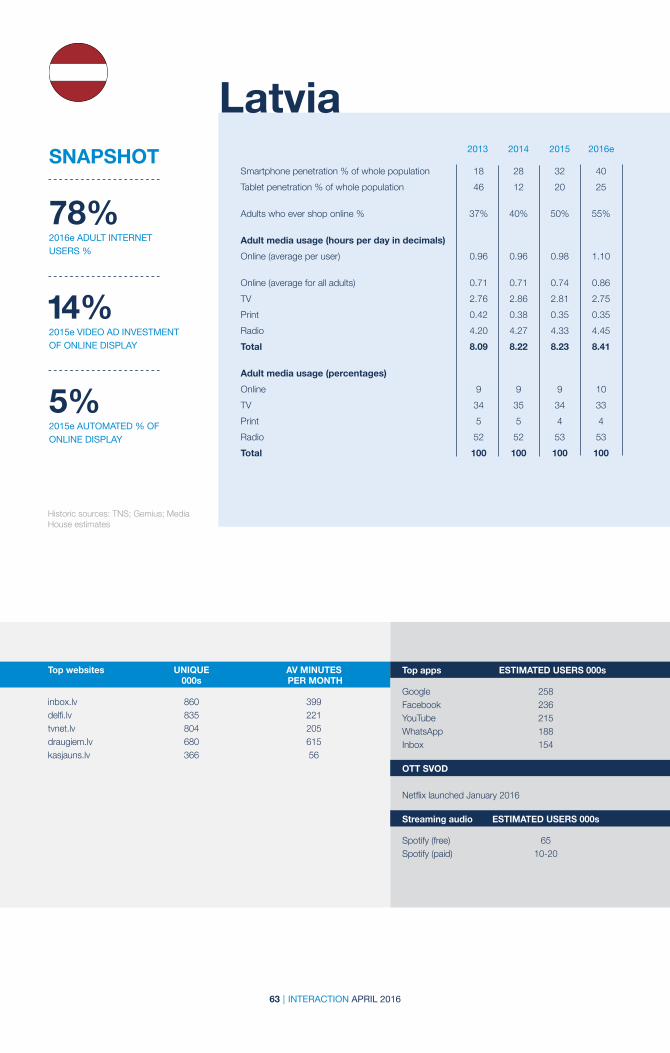
63 | INTERACTION APRIL 2016
Top websites UNIQUE AV MINUTES 000s PER MONTH inbox.lv 860 399 delfi.lv 835 221 tvnet.lv 804 205 draugiem.lv 680 615 kasjauns.lv 366 56
Top apps ESTIMATED USERS 000s
Google 258 Facebook 236 YouTube 215 WhatsApp 188 Inbox 154 OTT SVOD
Netflix launched January 2016 Streaming audio ESTIMATED USERS 000s Spotify (free) 65 Spotify (paid) 10-20
2013 2014 2015 2016e
Historic sources: TNS; Gemius; Media House estimates
Latvia
78%2016e ADULT INTERNET USERS %
14%2015e VIDEO AD INVESTMENT OF ONLINE DISPLAY
5%2015e AUTOMATED % OF ONLINE DISPLAY
SNAPSHOT Smartphone penetration % of whole population 18 28 32 40Tablet penetration % of whole population 46 12 20 25
Adults who ever shop online % 37% 40% 50% 55%
Adult media usage (hours per day in decimals) Online (average per user) 0.96 0.96 0.98 1.10
Online (average for all adults) 0.71 0.71 0.74 0.86TV 2.76 2.86 2.81 2.75Print 0.42 0.38 0.35 0.35Radio 4.20 4.27 4.33 4.45Total 8.09 8.22 8.23 8.41
Adult media usage (percentages) Online 9 9 9 10TV 34 35 34 33Print 5 5 4 4Radio 52 52 53 53Total 100 100 100 100
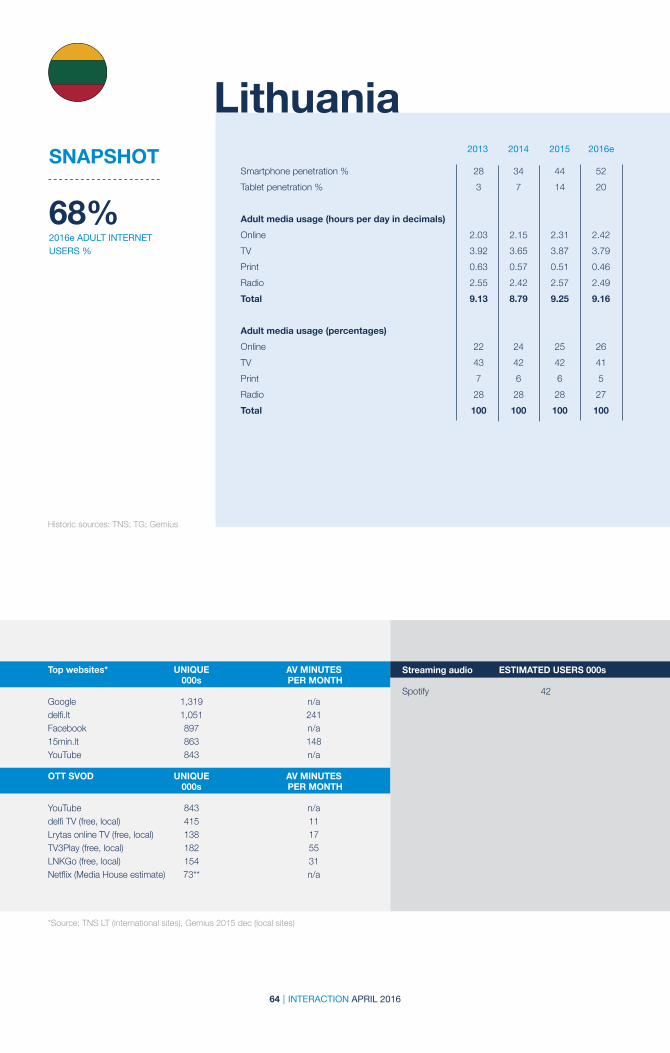
64 | INTERACTION APRIL 2016
2013 2014 2015 2016e
Historic sources: TNS; TG; Gemius
Lithuania
68%2016e ADULT INTERNET USERS %
SNAPSHOT Smartphone penetration % 28 34 44 52Tablet penetration % 3 7 14 20 Adult media usage (hours per day in decimals) Online 2.03 2.15 2.31 2.42TV 3.92 3.65 3.87 3.79Print 0.63 0.57 0.51 0.46Radio 2.55 2.42 2.57 2.49Total 9.13 8.79 9.25 9.16
Adult media usage (percentages) Online 22 24 25 26TV 43 42 42 41Print 7 6 6 5Radio 28 28 28 27Total 100 100 100 100
Top websites* UNIQUE AV MINUTES 000s PER MONTH Google 1,319 n/adelfi.lt 1,051 241Facebook 897 n/a15min.lt 863 148YouTube 843 n/a
OTT SVOD UNIQUE AV MINUTES 000s PER MONTH YouTube 843 n/adelfi TV (free, local) 415 11Lrytas online TV (free, local) 138 17TV3Play (free, local) 182 55LNKGo (free, local) 154 31Netflix (Media House estimate) 73** n/a
Streaming audio ESTIMATED USERS 000s
Spotify 42
*Source: TNS LT (international sites), Gemius 2015 dec (local sites)

65 | INTERACTION APRIL 2016
2013 2014 2015 2016e
Historic sources: MCMC Q2 2015 Pocket Book Of Statistics; 3D Malaysia; comScore; App Annie
*2014 drop explained as a reduction in average dwelltime on free-to-air channels
Malaysia
82%2016e INTERNET USERS %
24%2015e VIDEO AD INVESTMENT OF ONLINE DISPLAY
20%2015e AUTOMATED % OF ONLINE DISPLAY
SNAPSHOT
Top websites* UNIQUES MILLION MINUTES 000s PER MONTH Google.com 10,883 1,253Facebook.com 8,917 3,080YouTube.com 7,583 2,236Google.com.my 5,411 172Yahoo.com 4,117 377
Top apps TOTAL DOWNLOADS AV TIME PER USER 000s PER MONTH WhatsApp Messenger 16,129 18:09:35Facebook 10,568 18:20:40WeChat 9,568 7:55:11Facebook Messenger 9,143 26:11Instagram 5,448 4:24:39
OTT SVOD ESTIMATED HOMES 000s
Total all providers 950
Streaming audio** ESTIMATED USERS 000s
SoundCloud 745Spotify 458Joox 33PandoraBeats 22MixCloud 17
Smartphone penetration % (of all 15-54) 57 65 79 84Tablet penetration % (of all 15-54) 8 12 13
Adult media usage (hours per day in decimals) Online (average per user) 2.71 2.72 2.45 2.47 Online (average per person) 1.76 1.82 1.94 2.03TV* 3.35 1.88 1.89 1.19Print 0.56 0.82 0.49 0.68Radio 1.63 1.57 0.95 0.84Total 7.30 6.09 5.27 4.74
Adult media usage (percentages) Online 24 30 37 43TV 46 31 36 25Print 8 13 9 14Radio 22 26 18 18Total 100 100 100 100
*comScore Media Metrix Jan 2016 ** Source: comScore Media Metrix Jan 2016

66 | INTERACTION APRIL 2016
2013 2014 2015 2016e
MexicoSmartphone penetration % of whole population 19.2 25.0 38.0 53.2Tablet penetration % of whole population 4.3 8.0 12.0 14.4
E-commerce in USDbn (all B2C) 7.9 9.8 11.4 13.5 E-commerce per adult internet user USD 172 207 224 245 Adult media usage (hours per day in decimals) Online (average per user) 2.50 2.40 2.50 2.75 Online (average for all 6+) 1.09 1.07 1.18 1.38TV 2.67 2.53 2.45 2.33Print 0.60 0.60 0.50 0.40Radio 0.59 0.56 0.70 0.74Total 4.95 4.75 4.83 4.85
Adult media usage (percentages) Online 22 22 24 28TV 54 53 51 48Print 12 13 10 8Radio 12 12 14 15Total 100 100 100 100
Historic sources: INEGI/MODUTIH 2014; allpago; comScore; GroupM
50%2016e 6+ INTERNET USERS %
2452016e B2C ECOMMERCE PER INTERNET USER USD
25%2015e VIDEO AD INVESTMENT OF ONLINE DISPLAY
20%2015e AUTOMATED % OF ONLINE DISPLAY
SNAPSHOT
Top websites UNIQUE AV MINUTES 000s PER MONTH Google.com.mx 21,094,000 3.8Facebook.com 17,657,000 17.2Live.com 17,284,000 7.1MSN.com 15,590,000 2.5Youtube.com 15,280,000 30
OTT SVOD ESTIMATED USERS DAILY MINUTES 000s PER SUBSCRIBER HH Netflix 4,300 3.44Claro 1,500
Top apps ESTIMATED DOWNLOADS 000s
Spotify 3,575,000Shazam 2,011,000Disney apps 595,000
Streaming audio ESTIMATED USERS 000s
Apple Music 11,000 Spotify 10,000Deezer 6,000

67 | INTERACTION APRIL 2016
2013 2014 2015 2016e
Netherlands
Historic sources: IAB; MMS; GfK; Thiuswinkel.org; SKO; NLO
89%2016e ADULT INTERNET USERS %
1,1962016e E-COMMERCE PER ADULT INTERNET USER USD
18%2015e VIDEO AD INVESTMENT OF ONLINE DISPLAY
27%2015e AUTOMATED % OF ONLINE DISPLAY
SNAPSHOT Smartphone penetration % of whole population 67 76 80 81Tablet penetration % of whole population 53 61 65 66 E-commerce in EUR bn (excluding travel) 6.7 8.7 11.9 14.0E-commerce per 13+ internet user EUR 531 681 925 1,076
Adult media usage (hours per day in decimals) Online (average for whole population) 1.89 2.00 2.16 2.18TV 3.38 3.47 3.32 3.38Print 0.37 0.35 0.33Radio 3.12 2.97 2.93 2.91Total 8.39 8.81 8.76 8.80
Adult media usage (percentages) Online 22 23 25 25TV 40 39 38 38Print 0 4 4 4Radio 37 34 33 33Total 100 100 100 100
Top websites* UNIQUES AV MINUTES 000s PER MONTH Facebook 11,055 22 Google Search 10,383 4 YouTube 9,579 13 WhatsApp Messenger 7,552 13 Bol.com 7,508 5
Top apps ESTIMATED USERS AV MINUTES 000s PER MONTH Facebook, App 8,172 19 WhatsApp Messenger, App 7,552 13 YouTube, App 6,894 15 Facebook Messenger, App 6,250 11 Google Search, App 5,855 2
ON-DEMAND AND OTT MUSIC AND VIDEO % WHO USED THE FOLLOWING SERVICES LAST MONTH
Netflix 16Spotify 16Google Play 14RTL XL 10iTunes 9SoundCloud 5Google Play Music 3Apple music 3Vimeo 3Videoland 3Deezer 3
BBC iPlayer 2Amazon video 2Hulu 2Rdio 2HBO Go 2Musify 2Pandora 1Tidal 1Audible 1Crackle 1
*sites and apps; all platforms

68 | INTERACTION APRIL 2016
2013 2014 2015 2016e2013 2014 2015 2016e
Norway
Historic sources: Advantage; Interbuss; Postnord; Forbruker & Media/TNS Gallup
88%2016e ADULT INTERNET USERS %
1,4002016e E-COMMERCE PER ADULT INTERNET USER USD
7%2015e VIDEO AD INVESTMENT OF ALL ONLINE
20%2015e AUTOMATED % OF ONLINE DISPLAY
SNAPSHOT Smartphone penetration % of whole population 80 84 87 89Tablet penetration % of whole population 47 63 66 70 E-commerce in NOK bn (exc. travel and events) 27.0 32.3 38.3 45.0E-commerce per adult internet user NOK 7,955 8,820 10,379 12,195
Adult media usage (hours per day in decimals) Online (average for whole population) 1.70 2.12 2.60 2.65TV 2.90 2.89 2.88 2.90Print 0.48 0.76 0.72 0.68Radio 2.15 2.15 2.17 2.15Total 7.23 7.92 8.37 8.38
Adult media usage (percentages) Online 24 27 31 32TV 40 36 34 35Print 7 10 9 8Radio 30 27 26 26Total 100 100 100 100
Top websites* UNIQUES AV MINUTES 000s PER MONTH startsiden.no 350,000 870NRK.no 1,050,000 690sol.no 181,233 660VG Nett 1,300,000 600Tekniks Ukeblad.no 33,000 570
Top apps
Vipps by DNBSnapchatMessengerInstagramFacebook
OTT SVOD ESTIMATED HOMES 000s
Netflix 723Tv2 Sumo 203Viaplay 158HBO 158
Streaming audio ESTIMATED USERS 000s
Spotify 1,800,000WiMP 740,000Apple Music 370,000
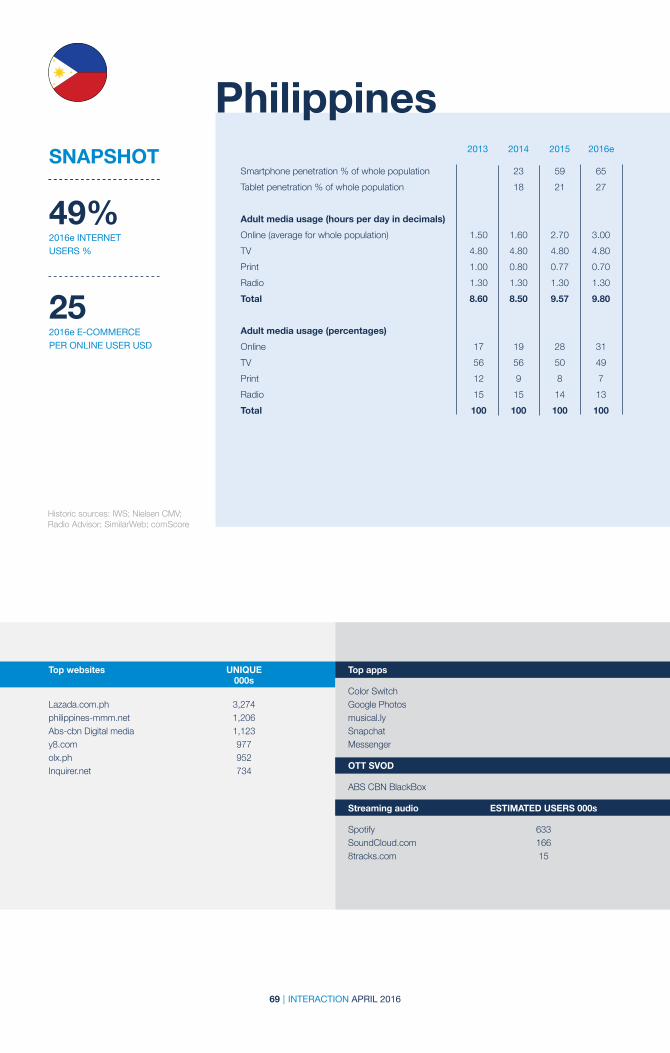
69 | INTERACTION APRIL 2016
2013 2014 2015 2016e
PhilippinesSNAPSHOT
Smartphone penetration % of whole population 23 59 65Tablet penetration % of whole population 18 21 27 Adult media usage (hours per day in decimals) Online (average for whole population) 1.50 1.60 2.70 3.00TV 4.80 4.80 4.80 4.80Print 1.00 0.80 0.77 0.70Radio 1.30 1.30 1.30 1.30Total 8.60 8.50 9.57 9.80
Adult media usage (percentages) Online 17 19 28 31TV 56 56 50 49Print 12 9 8 7Radio 15 15 14 13Total 100 100 100 100
SNAPSHOT
Historic sources: IWS; Nielsen CMV; Radio Advisor; SimilarWeb; comScore
49%2016e INTERNET USERS %
252016e E-COMMERCE PER ONLINE USER USD
Top websites UNIQUE 000s Lazada.com.ph 3,274philippines-mmm.net 1,206Abs-cbn Digital media 1,123y8.com 977olx.ph 952Inquirer.net 734
Top apps
Color SwitchGoogle Photosmusical.lySnapchatMessenger
OTT SVOD
ABS CBN BlackBox
Streaming audio ESTIMATED USERS 000s
Spotify 633 SoundCloud.com 166 8tracks.com 15
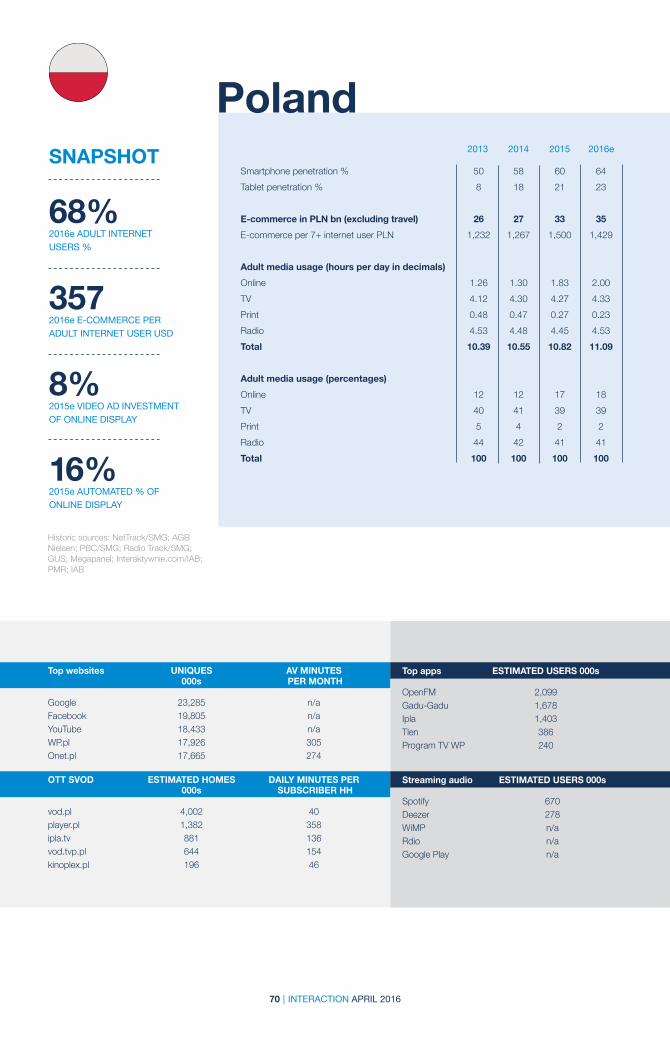
70 | INTERACTION APRIL 2016
2013 2014 2015 2016e2013 2014 2015 2016e
Poland
Historic sources: NetTrack/SMG; AGB Nielsen; PBC/SMG; Radio Track/SMG; GUS; Megapanel; Interaktywnie.com/IAB; PMR; IAB
68%2016e ADULT INTERNET USERS %
3572016e E-COMMERCE PER ADULT INTERNET USER USD
8%2015e VIDEO AD INVESTMENT OF ONLINE DISPLAY
16%2015e AUTOMATED % OF ONLINE DISPLAY
SNAPSHOT Smartphone penetration % 50 58 60 64Tablet penetration % 8 18 21 23 E-commerce in PLN bn (excluding travel) 26 27 33 35E-commerce per 7+ internet user PLN 1,232 1,267 1,500 1,429
Adult media usage (hours per day in decimals) Online 1.26 1.30 1.83 2.00TV 4.12 4.30 4.27 4.33Print 0.48 0.47 0.27 0.23Radio 4.53 4.48 4.45 4.53Total 10.39 10.55 10.82 11.09
Adult media usage (percentages) Online 12 12 17 18TV 40 41 39 39Print 5 4 2 2Radio 44 42 41 41Total 100 100 100 100
Top websites UNIQUES AV MINUTES 000s PER MONTH Google 23,285 n/aFacebook 19,805 n/aYouTube 18,433 n/aWP.pl 17,926 305Onet.pl 17,665 274
OTT SVOD ESTIMATED HOMES DAILY MINUTES PER 000s SUBSCRIBER HH vod.pl 4,002 40player.pl 1,382 358ipla.tv 881 136vod.tvp.pl 644 154kinoplex.pl 196 46
Top apps ESTIMATED USERS 000s
OpenFM 2,099 Gadu-Gadu 1,678 Ipla 1,403 Tlen 386 Program TV WP 240
Streaming audio ESTIMATED USERS 000s
Spotify 670Deezer 278WiMP n/aRdio n/aGoogle Play n/a

71 | INTERACTION APRIL 2016
2013 2014 2015 2016e
Historic sources: Bareme Internet; MRW TGI; Netpanel; MMW Telereport; MMW Radioreport; MMW Multimeios
Portugal
62%2015e ADULT INTERNET USERS %
25%2015e VIDEO AD INVESTMENT OF ONLINE DISPLAY
15%2015e AUTOMATED % OF ONLINE DISPLAY
SNAPSHOT Smartphone penetration % of whole 15+ population 40 50 59 65Tablet penetration % of whole 15+ population 15 28 40 45 Adult media usage (hours per day in decimals) Online (average of home users) 0.71 0.78 0.67 0.75 Online (average over whole poplulation) 0.42 0.47 0.41 0.47TV 5.10 5.07 4.85 5.00Print n/a Radio 3.22 3.27 3.18 3.20Total 8.74 8.80 8.45 8.67
Adult media usage (percentages) Online (from home) 5 5 5 5TV 58 58 57 58Print 0 0 0 0Radio 37 37 38 37Total 100 100 100 100
Top websites* UNIQUE AV MINUTES 000s PER MONTH google.pt 5,117 143facebook.com 5,039 1,167google.com 4,989 208youtube.com 4,957 566sapo.pt 4,723 248

72 | INTERACTION APRIL 2016
2013 2014 2015 2016e2013 2014 2015 2016e
Historic sources: TNS Web Index, ComScore, TNS TV Index, PaloMARS, Galileo
Russia
81%2016e URBAN 16-64 INTERNET USERS %
3392016e E-COMMERCE PER ADULT INTERNET USER USD
SNAPSHOT Smartphone penetration % of whole population 35 42 45 47Tablet penetration % of whole population 15 24 28 29 E-commerce in RUB bn (payments, retail, content, games) 800 1,150 1,430 1,500E-commerce per adult internet user RUB 18,908 25,732 31,066 26,128
Individual 10+ media usage (urban; hours per day in decimals) Online (desktop only, average for whole population) 2.26 2.16 2.13 2.20TV 2.61 2.70 2.71 2.80Print 0.28 0.26 0.25 0.20Radio 1.99 1.91 1.90 1.85Total 7.14 7.04 6.99 7.05
Media usage (percentages) Online 32 31 30 31TV 37 38 39 40Print 4 4 4 3Radio 28 27 27 26Total 100 100 100 100
Top websites* UNIQUES AV MINUTES 000s PER MONTH Mail.ru Sites 75,249 16VK.com 57,759 30Odnoklassniki 49,157 29Yandex Sites 66,233 29Google Sites 55,381 18
Top apps** ESTIMATED USERS AV MINUTES 000s PER MONTH (DAILY) YouTube 10,105 18VK.com 10,054 36Google 8,920 3WhatsApp 8,806 11Viber 7,451 8
*comScore, December 2015, urban 6+

73 | INTERACTION APRIL 2016
2013 2014 2015 2016e
Historic sources: We Are Social/ eMarketer; Telmar/3D; SingStat/Google/Nielsen; Alexa; Netindex
Singapore
79%2016e ADULT INTERNET USERS %
6562016e E-COMMERCE PER ADULT INTERNET USER USD
SNAPSHOT Smartphone penetration % 78 87 90 95Tablet penetration % 42 45 50 54 E-commerce in SGD bn 1.2 1.7 2.5 3.7 E-commerce per adult internet user SGD 345 472 625 925
Adult media usage (hours per day in decimals) Online 7.33 7.33 7.45TV 2.33 2.20 2.10Print 0.33 0.30 0.27Radio 0.25 0.25 0.25Total 10.24 10.08 10.07
Adult media usage (percentages) Online 72 73 74TV 23 22 21Print 3 3 3Radio 2 2 2Total 100 100 100 100
Top websites* UNIQUE AV MINUTES 000s PER MONTH Google Sites 3,849 1,358 Yahoo Sites 3,046 290 Microsoft Sites 2,664 278 Facebook 2,403 604 SPH Digital 1,626 60
Top apps
EndGodsColor SwitchSG LiveGrabWhatsApp
OTT SVOD
StarHub GoNetflixToggleHOOQ
Streaming audio
SpotifyGuveraDeezerLastfm8tracks

74 | INTERACTION APRIL 2016
2013 2014 2015 2016eSNAPSHOT 2013 2014 2015 2016e
Historic sources: MML; TNS; AIMonitor; TNS PMT
Slovak Republic
88%2016e ADULT INTERNET USERS %
2312016e E-COMMERCE PER ADULT INTERNET USER USD
Smartphone penetration % 30 60 62 64Tablet penetration % 16 20 26 E-commerce in EUR bn (excluding travel) 0.6 0.7 0.7 0.8E-commerce per adult internet user EUR 201 197 203 210
Adult media usage (hours per day in decimals) Online 1.50 1.32 1.18 1.25TV 3.50 3.94 3.85Print 0.41 0.10 0.09Radio 2.86 2.29 2.03Total 1.50 8.09 7.51 7.22
Adult media usage (percentages) Online 16 16 17TV 43 52 53Print 5 1 1Radio 35 30 28Total 100 100 100 100
Top websites WEEKLY UNIQUES AV MINUTES 000s PER WEEK www.azet.sk 2,638 58www.zoznam.sk 2,265 24www.sme.sk 1,858 21
Top apps ESTIMATED USERS 000s
Instagram 300WhatsApp Snapchat 60
Streaming audio ESTIMATED USERS 000s
Spotify 95Deezer n/a

75 | INTERACTION APRIL 2016
2013 2014 2015 2016e
Historic sources:GWI, Worx
South Africa
49%2016e INTERNET PENETRATION % OF 16-64S (000S)
302016e E-COMMERCE PER 16-64 USER USD
SNAPSHOT Smartphone penetration % of phone users 85 85 85Tablet penetration % of phone users 43 53 53 E-commerce in ZAR bn (excluding travel) 6.0 6.0 8.0 E-commerce per adult internet user ZAR 359 354 471
Adult media usage (hours per day in decimals) OOnline (average of users) 4.95 4.92 4.85 Online (average of all 16-64) 2.43 2.41 2.36TV 2.37 2.34 2.32Print 0.74 0.69 0.70Radio 2.08 1.98 2.01Total 7.61 7.42 7.39
Adult media usage (percentages) Online 32 33 32TV 31 32 31Print 10 9 9Radio 27 27 27Total 100 100 100 100
Top websites UNIQUE AV MINUTES 000s PER MONTH News24 6,204 36Gumtree.co.za 5,360 17Timeslive.co.za 2,953 31iol.co.za 2,746 9msn.co.za 2,185 37
Top apps ESTIMATED USER S 000s
WhatsApp 11,251Facebook 10,620Google Maps 8,196YouTube 7,999Facebook Messanger 7,222
OTT SVOD
NetflixAmazon VideoHuluHBO Go
Streaming audio
Google Play MusicSoundCloudApple MusicRdioSpotify

76 | INTERACTION APRIL 2016
2013 2014 2015 2016eSNAPSHOT
Historic sources: Korea Communications Commission; Statistics Korea; KISA; Korea Online Shopping Assoc.; Nielsen Korean-click; Akamai; Xaxis; HRC Media Index
South Korea
76%2016e ADULT INTERNET USERS %
1,8002016e E-COMMERCE PER ADULT INTERNET USER USD
Smartphone penetration % 80 85 86 87Tablet penetration % 12 14 18 20 E-commerce in KRW bn (excluding travel) 54,750 58,664 67,463 74,209 E-commerce per adult internet user KRW 000s 1,744 1,799 2,045 2,221
Adult media usage (averaged from monthly) Online (average of 12+ users) 3.85 4.18 4.31 4.50 Online (average all 12+) 2.77 3.11 3.23 3.41TV 3.11 2.83 2.79 2.75Print 0.49 0.49 0.49 0.49Radio 1.07 1.07 1.08 1.07Total 7.44 7.50 7.60 7.72
Adult media usage (percentages) Online 37 41 42 44TV 42 38 37 36Print 7 7 6 6Radio 14 14 14 14Total 100 100 100 100
Top websites UNIQUES AV MINUTES 000s* PER MONTH naver.com 30,603 329daum.net 23,478 161tistory.com 17,698 11gmarket.co.kr 12,890 2411st.co.kr 12,755 22
Top apps ESTIMATED USERS AV MINUTES 000s** PER MONTH
Google Play Store 29,283 70Kakao Talk 29,039 809YouTube 20,407 505Naver (search) 20,170 703Google (search) 15,803 44
OTT SVOD ESTIMATED DAILY MINUTES PER HOMES 000s SUBSCRIBER HH skbtv.co.kr 2,541 182pooq.co.kr 1,179 327tving.com 1,137 97netflix.com 346 38watcha.net 55 2
Streaming audio ESTIMATED USERS 000s
Melon 7,099Genie (KT Music) 1,769Mnet 1,325Bugs 1,035Soribada 320

77 | INTERACTION APRIL 2016
OTT SVOD ESTIMATED DAILY MINUTES PER HOMES 000s SUBSCRIBER HH skbtv.co.kr 2,541 182pooq.co.kr 1,179 327tving.com 1,137 97netflix.com 346 38watcha.net 55 2
Streaming audio ESTIMATED USERS 000s
Melon 7,099Genie (KT Music) 1,769Mnet 1,325Bugs 1,035Soribada 320
Spain2013
Historic sources: EGM; CNMC; GWI; comScore
75%2016e + INTERNET USERS %
5852016e E-COMMERCE PER ADULT INTERNET USER USD
18%2015e VIDEO AD INVESTMENT OF ONLINE DISPLAY
13%2015e AUTOMATED % OF ONLINE DISPLAY
SNAPSHOT Smartphone penetration % of all 14+ 37 59 70 75Tablet penetration % of all 14+ 15 26 32 35 E-commerce in EUR bn (excluding travel) 8.4 9.7 12.6 16.0E-commerce per 16+ internet user EUR 330 353 436 527
Adult media usage (hours per day in decimals) Online (average per online user) 1.48 1.65 1.69 1.74 Online (average for whole 16+ population) 0.96 1.13 1.21 1.30TV 4.07 3.98 3.98 3.94Print 1.10 1.01 0.92 0.84Radio 1.86 1.82 1.77 1.73Total 8.00 7.94 7.88 7.82
Adult media usage (percentages) Online 12 14 15 17TV 51 50 51 50Print 14 13 12 11Radio 23 23 22 22Total 100 100 100 100
2014 2015 2016e
Top websites UNIQUES AV MINUTES 000s PER MONTH Google 21,952 170 YouTube 20,734 522 El Pais 16,629 24 Facebook 15,180 322 El Mundo 14,654 30
Top apps ESTIMATED USERS 000s
WhatsApp 15,536 Facebook 15,399 YouTube 12,331 Google Maps 9,452 Facebook Messenger 7,409
App usage EsTIMATED AV MINUTES USERS 000s PER MONTH Spotify 3,512 84 Shazam 3,360 10 Marca 1,652 125 Elmundo.es 317 96 Expansión 83 62
OTT SVOD ESTIMATED HOMES 000s Wuaki.TV 1,400Yomvi 700Vodafone 500TV Orange 150TotalChannel 100
Streaming audio ESTIMATED USERS 000s
Spotify 6,000SounCloud 1,300GoEar 300Deezer 100

78 | INTERACTION APRIL 2016
2013 2014 2015 2016e
Historic sources:
91%2016e 16-80 INTERNET USERS %
SNAPSHOT 2013 2014 2015 2016e
Historic sources: Orvesto Konsument; E-barometern; KIA-index; Twitter; Google; Internetstatistik; IRM; iis.se
Sweden
9472016e E-COMMERCE PER 16-80 INTERNET USER USD
Top websites UNIQUES AV MINUTES 000s PER VISIT aftonbladet.se 5,244 13expressen.se 3,400 8blocket.se 2,296 -hitta.se 2,046 -dn.se 1,808 12
OTT SVOD WEEKLY HOMES REACH %
Netflix 13SVT play 9Viaplay 5TV4 play 3
Top apps Penetration % 2015
Chrome 88Facebook 76Kamera 71BankID 65Gmail 65Messenger 53YouTube 53Instagram, Maps (47%) 47Maps 47Hangout 41Spotify 41Snapchat 35Tradera 35
Streaming audio ESTIMATED USERS 000s
Spotify (paid) 2,385Spotify (free) 1,431
Smartphone penetration % 65 74 76 78Tablet penetration % 36 53 55 58 E-commerce in SEK bn (excluding travel) 37.3 42.9 50.0 56.0 E-commerce per adult internet user SEK 5,468 6,173 7,194 8,076
Adult media usage (averaged from monthly) Online 1.12 1.75 1.80 2.09TV 1.82 1.95 2.10 2.35Print 0.45 0.44 0.42 0.66Radio 0.93 0.94 0.94 1.49Total 4.32 5.08 5.26 6.58
Adult media usage (percentages) Online 26 34 34 32TV 42 38 40 36Print 10 9 8 10Radio 22 19 18 23Total 100 100 100 100

79 | INTERACTION APRIL 2016
2013 2014 2015 2016e2013 2014 2015 2016e
Taiwan
Historic sources: Nielsen; UDN.com; twnic.net.tw; comScore; DMA
78%2016e 12+ INTERNET USERS %
2,4822016e E-COMMERCE PER 12+ INTERNET USER USD
15%2015e VIDEO AD INVESTMENT OF ONLINE DISPLAY
3%2015e AUTOMATED % OF ONLINE DISPLAY
SNAPSHOT Smartphone penetration % of all 12+ 27 65 71 76Tablet penetration % of all 12+ 16 29 33 35 E-commerce in NTD bn (excluding travel) 637 883 1,069 1,362E-commerce per 12+ internet user NTD 38,601 54,422 65,988 82,545
Adult media usage (hours per day in decimals) Online (average for whole population 12+) 2.87 2.75 3.00 3.00TV 2.65 2.48 2.51 2.50Print 0.61 0.33 0.34 0.35Radio 0.69 0.65 0.68 0.64Total 6.82 6.21 6.52 6.49
Adult media usage (percentages) Online 42 44 46 46TV 39 40 38 39Print 9 5 5 5Radio 10 11 10 10Total 100 100 100 100
Top websites UNIQUES AV MINUTES 000s* PER MONTH Yahoo.com.tw 12,820 272Google.com.tw 10,579 83Facebook 9,483 439Google.com.tw 8,381 69Yahoo 7,699 21
Top apps ESTIMATED USERS AV MINUTES 000s PER MONTH
AppleDaily Taiwan 1,183 177104 452 26Shazam 422 7Twitch 293 433SoundHound 269 5
OTT SVOD ESTIMATED DAILY MINUTES PER HOMES 000s SUBSCRIBER HH CHT MOD 1,298 30
Streaming audio ESTIMATED USERS 000s
Shazam 422SoundHound 269Spotify 229SoundCloud 100TuneIn Radio 91
*three-month average 4Q 2015
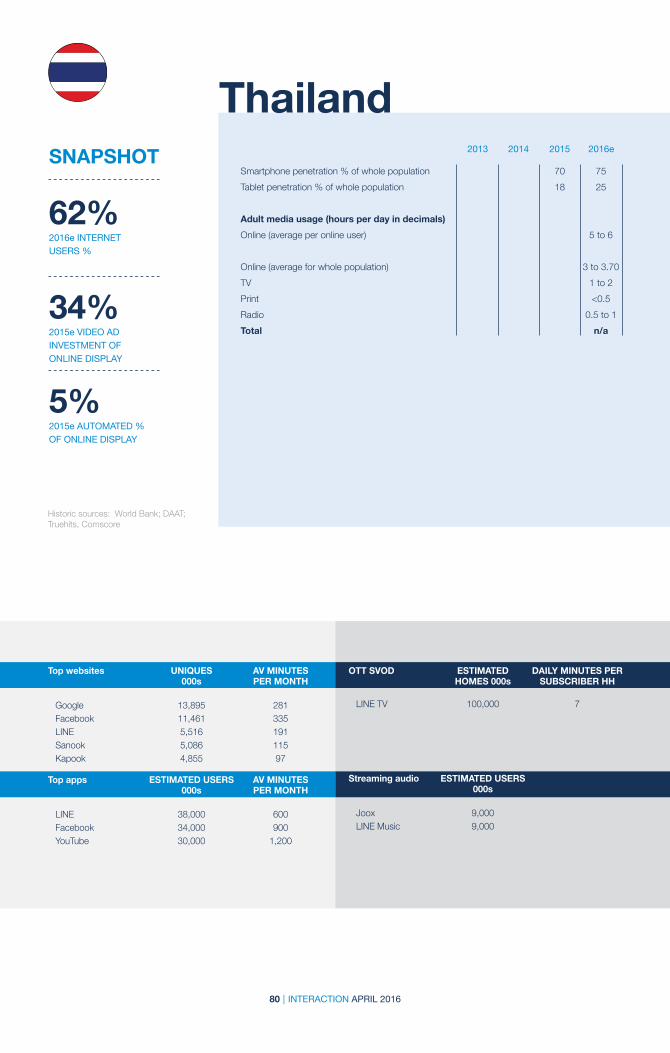
80 | INTERACTION APRIL 2016
2013 2014 2015 2016e
Historic sources: World Bank; DAAT; Truehits, Comscore
62%2016e INTERNET USERS %
34%2015e VIDEO AD INVESTMENT OF ONLINE DISPLAY
5%2015e AUTOMATED % OF ONLINE DISPLAY
SNAPSHOT 2013 2014 2015 2016e
ThailandSmartphone penetration % of whole population 70 75Tablet penetration % of whole population 18 25 Adult media usage (hours per day in decimals) Online (average per online user) 5 to 6 Online (average for whole population) 3 to 3.70TV 1 to 2Print <0.5Radio 0.5 to 1Total n/a
Top websites UNIQUES AV MINUTES 000s PER MONTH Google 13,895 281 Facebook 11,461 335 LINE 5,516 191 Sanook 5,086 115 Kapook 4,855 97
Top apps ESTIMATED USERS AV MINUTES 000s PER MONTH
LINE 38,000 600 Facebook 34,000 900 YouTube 30,000 1,200
OTT SVOD ESTIMATED DAILY MINUTES PER HOMES 000s SUBSCRIBER HH LINE TV 100,000 7
Streaming audio ESTIMATED USERS 000s
Joox 9,000 LINE Music 9,000
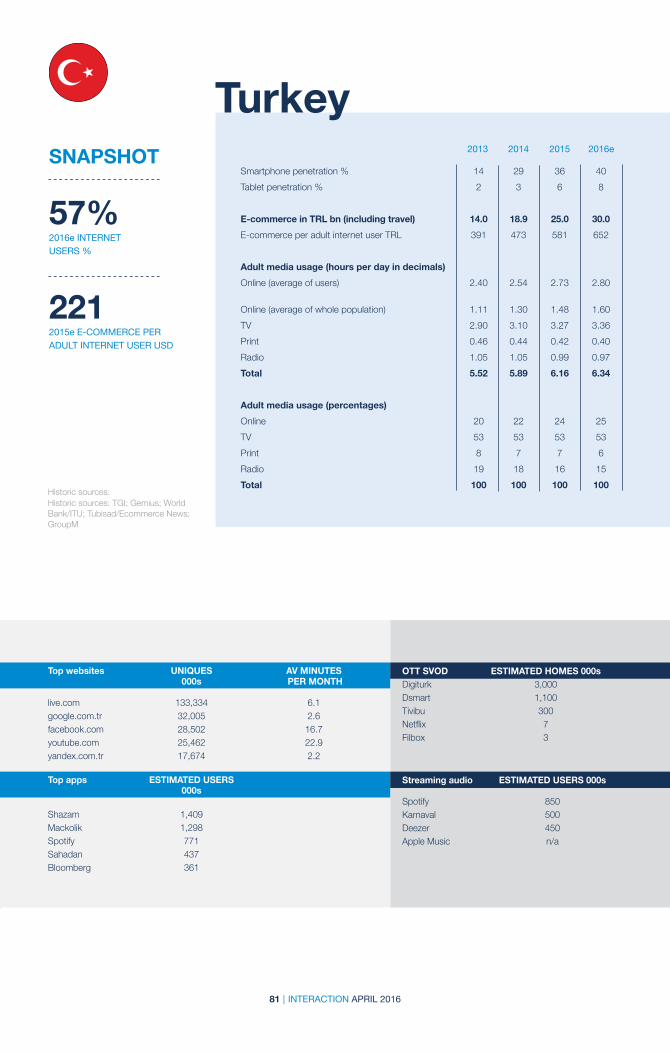
81 | INTERACTION APRIL 2016
2013 2014 2015 2016e
Historic sources:
2212015e E-COMMERCE PER ADULT INTERNET USER USD
SNAPSHOT 2013 2014 2015 2016e
Historic sources: TGI; Gemius; World Bank/ITU; Tubisad/Ecommerce News; GroupM
Turkey
57%2016e INTERNET USERS %
Top websites UNIQUES AV MINUTES 000s PER MONTH live.com 133,334 6.1 google.com.tr 32,005 2.6facebook.com 28,502 16.7youtube.com 25,462 22.9yandex.com.tr 17,674 2.2
Top apps ESTIMATED USERS 000s
Shazam 1,409Mackolik 1,298Spotify 771Sahadan 437Bloomberg 361
OTT SVOD ESTIMATED HOMES 000sDigiturk 3,000Dsmart 1,100Tivibu 300Netflix 7Filbox 3
Streaming audio ESTIMATED USERS 000s
Spotify 850Karnaval 500Deezer 450Apple Music n/a
Smartphone penetration % 14 29 36 40Tablet penetration % 2 3 6 8 E-commerce in TRL bn (including travel) 14.0 18.9 25.0 30.0E-commerce per adult internet user TRL 391 473 581 652
Adult media usage (hours per day in decimals) Online (average of users) 2.40 2.54 2.73 2.80 Online (average of whole population) 1.11 1.30 1.48 1.60TV 2.90 3.10 3.27 3.36Print 0.46 0.44 0.42 0.40Radio 1.05 1.05 0.99 0.97Total 5.52 5.89 6.16 6.34
Adult media usage (percentages) Online 20 22 24 25TV 53 53 53 53Print 8 7 7 6Radio 19 18 16 15Total 100 100 100 100

82 | INTERACTION APRIL 2016
2013 2014 2015 2016e2013 2014 2015 2016e
United Kingdom
Historic sources: IMRG Cap Gemini; ONS; Ofcom; IPA Touchpoints; comScore; TGI
*Averaged Mon-Fri and Sa-Su
90%2016e 16+ INTERNET USERS %
3,7152016e E-COMMERCE PER ADULT INTERNET USER USD
23%2015e VIDEO AD INVESTMENT OF ONLINE DISPLAY
52%2015e AUTOMATED % OF ONLINE DISPLAY
SNAPSHOT Smartphone penetration % of all 16+ (q1) 51 61 66 70Tablet penetration % of households (q1) 22 44 54 57 E-commerce in GBP bn (including travel) 91 104 114 126E-commerce per 16+ internet user GBP 2,047 2,273 2,451 2,666
Adult media usage (hours per day* in decimals) Online 2.12 2.52 3.32TV 3.87 3.45 3.62 3.61Print 0.37 0.35 0.33Radio 1.52 1.60 1.67Total 3.87 7.46 8.09 8.94
Adult media usage (percentages) Online 28 31 37TV 46 45 40Print 5 4 4Radio 20 20 19Total 100 100 100 100
Top websites UNIQUES 000s AV MIN AV MIN PER VISITOR PER VISIT
Google.co.uk 43,914 113 2Google.com 40,677 104 3Facebook.com 39,994 881 8Youtube.com 41,911 602 24BBC.co.uk 35,750 45 3Amazon.co.uk 32,179 57 5
OTT SVOD ESTIMATED HOMES DAILY MINS 000S BY VIEWER
Netflix 3,611 51Amazon Prime 1,795 39Now TV 951 n/aBlinkbox 493 20
Top app genres USERS (000) LAST 4 WEEKS
Games 16,475Social Networking 14,906Instant Messaging 12,394
Streaming audio ESTIMATED USERS 000s
Spotify 9,184SoundCloud 2,589Google Play Music 2,259Tune in Radio 1,542Last FM 1,463
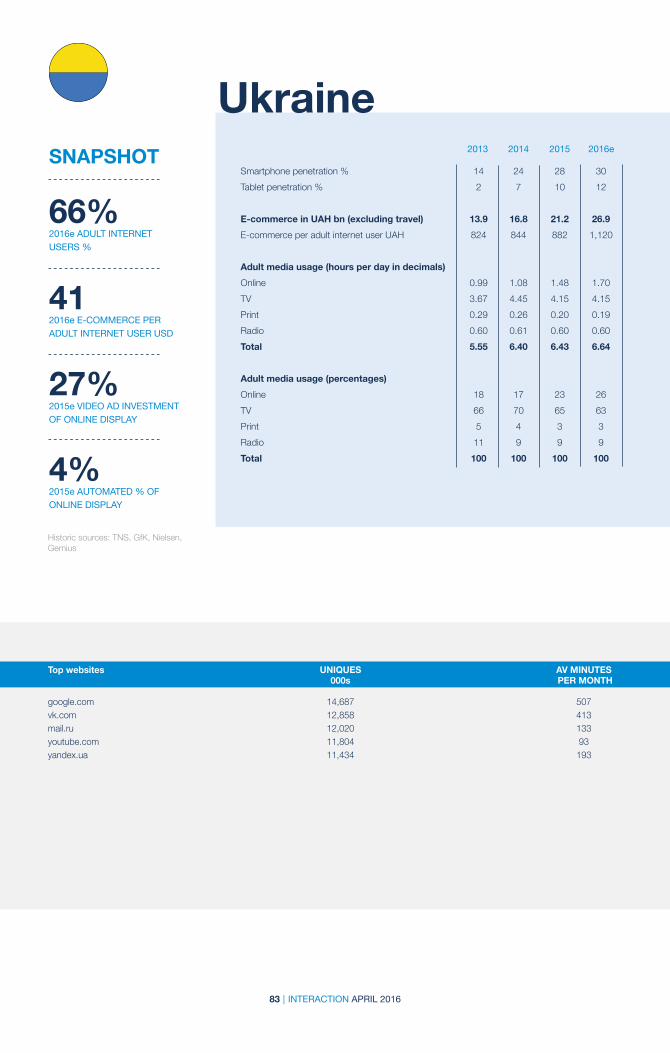
83 | INTERACTION APRIL 2016
2013 2014 2015 2016e2013 2014 2015 2016e
Ukraine
Top websites UNIQUES AV MINUTES 000s PER MONTH google.com 14,687 507vk.com 12,858 413mail.ru 12,020 133youtube.com 11,804 93yandex.ua 11,434 193
Historic sources: TNS, GfK, Nielsen, Gemius
66%2016e ADULT INTERNET USERS %
412016e E-COMMERCE PER ADULT INTERNET USER USD
27%2015e VIDEO AD INVESTMENT OF ONLINE DISPLAY
4%2015e AUTOMATED % OF ONLINE DISPLAY
SNAPSHOT Smartphone penetration % 14 24 28 30Tablet penetration % 2 7 10 12 E-commerce in UAH bn (excluding travel) 13.9 16.8 21.2 26.9E-commerce per adult internet user UAH 824 844 882 1,120
Adult media usage (hours per day in decimals) Online 0.99 1.08 1.48 1.70TV 3.67 4.45 4.15 4.15Print 0.29 0.26 0.20 0.19Radio 0.60 0.61 0.60 0.60Total 5.55 6.40 6.43 6.64
Adult media usage (percentages) Online 18 17 23 26TV 66 70 65 63Print 5 4 3 3Radio 11 9 9 9Total 100 100 100 100
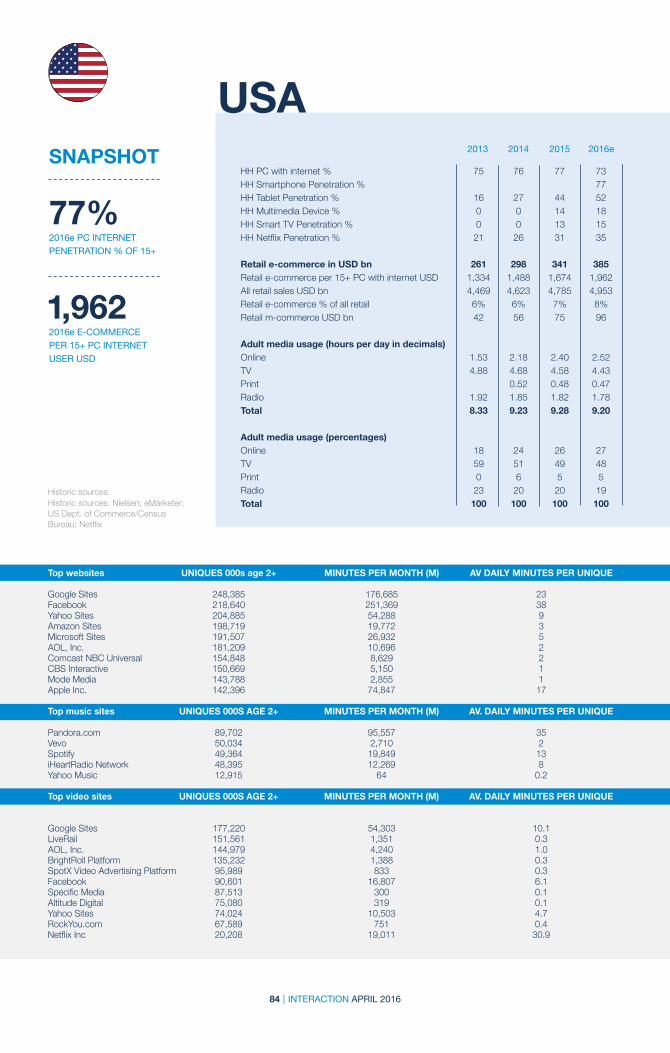
84 | INTERACTION APRIL 2016
2013 2014 2015 2016e
Historic sources:
1,9622016e E-COMMERCE PER 15+ PC INTERNET USER USD
SNAPSHOT 2013 2014 2015 2016e
Historic sources: Nielsen; eMarketer; US Dept. of Commerce/Census Bureau; Netflix
USA
77%2016e PC INTERNET PENETRATION % OF 15+
HH PC with internet % 75 76 77 73HH Smartphone Penetration % 77HH Tablet Penetration % 16 27 44 52HH Multimedia Device % 0 0 14 18HH Smart TV Penetration % 0 0 13 15HH Netflix Penetration % 21 26 31 35 Retail e-commerce in USD bn 261 298 341 385Retail e-commerce per 15+ PC with internet USD 1,334 1,488 1,674 1,962All retail sales USD bn 4,469 4,623 4,785 4,953Retail e-commerce % of all retail 6% 6% 7% 8%Retail m-commerce USD bn 42 56 75 96
Adult media usage (hours per day in decimals) Online 1.53 2.18 2.40 2.52TV 4.88 4.68 4.58 4.43Print 0.52 0.48 0.47Radio 1.92 1.85 1.82 1.78Total 8.33 9.23 9.28 9.20
Adult media usage (percentages) Online 18 24 26 27TV 59 51 49 48Print 0 6 5 5Radio 23 20 20 19Total 100 100 100 100
Top websites UNIQUES 000s age 2+ MINUTES PER MONTH (M) AV DAILY MINUTES PER UNIQUE Google Sites 248,385 176,685 23Facebook 218,640 251,369 38Yahoo Sites 204,885 54,288 9Amazon Sites 198,719 19,772 3Microsoft Sites 191,507 26,932 5AOL, Inc. 181,209 10,696 2Comcast NBC Universal 154,848 8,629 2CBS Interactive 150,669 5,150 1Mode Media 143,788 2,855 1Apple Inc. 142,396 74,847 17
Top music sites UNIQUES 000S AGE 2+ MINUTES PER MONTH (M) AV. DAILY MINUTES PER UNIQUE Pandora.com 89,702 95,557 35Vevo 50,034 2,710 2Spotify 49,364 19,849 13iHeartRadio Network 48,395 12,269 8Yahoo Music 12,915 64 0.2
Top video sites UNIQUES 000S AGE 2+ MINUTES PER MONTH (M) AV. DAILY MINUTES PER UNIQUE Google Sites 177,220 54,303 10.1LiveRail 151,561 1,351 0.3AOL, Inc. 144,979 4,240 1.0BrightRoll Platform 135,232 1,388 0.3SpotX Video Advertising Platform 95,989 833 0.3Facebook 90,601 16,807 6.1Specific Media 87,513 300 0.1Altitude Digital 75,080 319 0.1Yahoo Sites 74,024 10,503 4.7RockYou.com 67,589 751 0.4Netflix Inc 20,208 19,011 30.9

85 | INTERACTION APRIL 2016
2013 2014 2015 2016eSNAPSHOT 2013 2014 2015 2016e
Historic sources: comScore; AGB Nielsen; GSMA
Venezuela
59%2016e ADULT INTERNET USERS %
15%2015e AD INVESTMENT OF ONLINE DISPLAY
5%2015e AUTOMATED % OF ONLINE DISPLAY
Smartphone penetration % 30Tablet penetration % n/a
Adult media usage (hours per day in decimals) Online 1.01 1.03 1.03TV 1.32 1.27 1.23 1.22Print Radio Total 1.32 2.28 2.26 2.25
Top websites UNIQUES AV DAILY 000s MINUTES Google Sites 10,805 11 Facebook 8,991 19 Microsoft Sites 5,419 7 MercadoLibre 4,869 10 Yahoo Sites 4,620 4
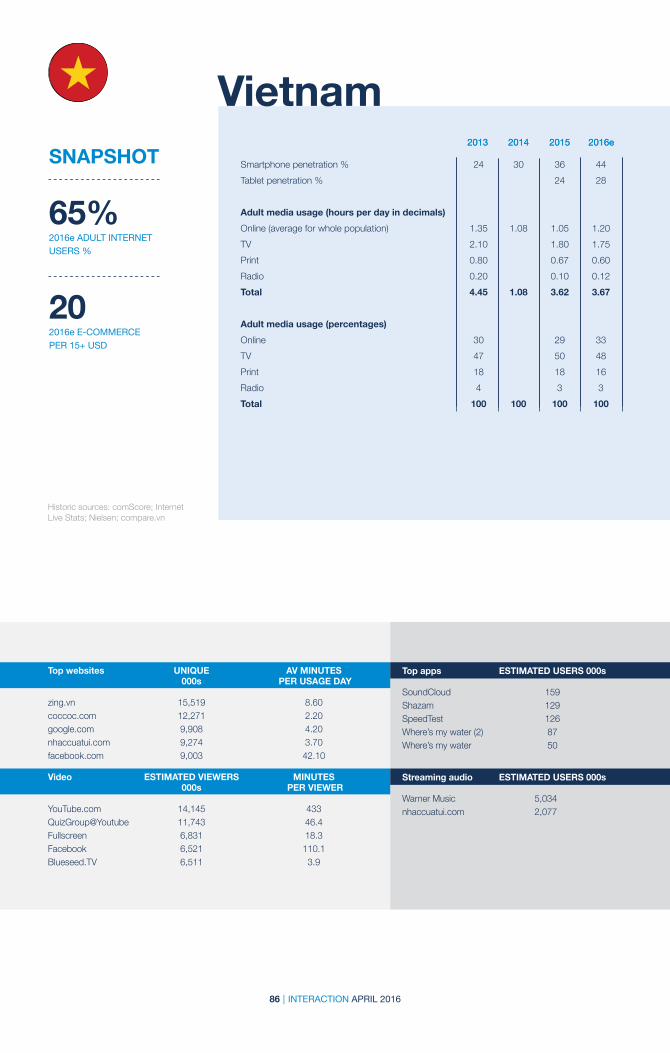
86 | INTERACTION APRIL 2016
2013 2014 2015 2016e
SNAPSHOT 2013 2014 2015 2016e
Historic sources: comScore; Internet Live Stats; Nielsen; compare.vn
Vietnam
65%2016e ADULT INTERNET USERS %
202016e E-COMMERCE PER 15+ USD
Smartphone penetration % 24 30 36 44Tablet penetration % 24 28 Adult media usage (hours per day in decimals) Online (average for whole population) 1.35 1.08 1.05 1.20TV 2.10 1.80 1.75Print 0.80 0.67 0.60Radio 0.20 0.10 0.12Total 4.45 1.08 3.62 3.67
Adult media usage (percentages) Online 30 29 33TV 47 50 48Print 18 18 16Radio 4 3 3Total 100 100 100 100
Top websites UNIQUE AV MINUTES 000s PER USAGE DAY zing.vn 15,519 8.60coccoc.com 12,271 2.20google.com 9,908 4.20nhaccuatui.com 9,274 3.70facebook.com 9,003 42.10
Video ESTIMATED VIEWERS MINUTES 000s PER VIEWER YouTube.com 14,145 433QuizGroup@Youtube 11,743 46.4Fullscreen 6,831 18.3Facebook 6,521 110.1Blueseed.TV 6,511 3.9
Top apps ESTIMATED USERS 000s
SoundCloud 159Shazam 129SpeedTest 126Where’s my water (2) 87Where’s my water 50
Streaming audio ESTIMATED USERS 000s
Warner Music 5,034nhaccuatui.com 2,077

87 | INTERACTION APRIL 2016
Appendices

88 | INTERACTION APRIL 2016
2013 2014 2015f 2016f2013 2014 2015f 2016f
Digital Ad Investment USD m(from This Year Next Year December 2015)
NORTH AMERICA 41,506 46,539 51,883 56,016Canada 2,643 2,987 3,435 3,813USA 38,862 43,552 48,448 52,203 LATIN AMERICA 1,930 1,948 3,005 3,768Argentina 333 481 673 761Brazil 925 700 1,451 1,957Chile 92 115 132 151Colombia 69 83 85 102Dominican Republic Ecuador Mexico 399 471 565 678Peru 31 38 47 64Puerto Rico 16 23 28 32Uruguay 16 19 22 23Venezuela 48 18 2 1 WESTERN EUROPE 23,952 26,503 29,445 32,553Austria 519 580 661 727Belgium 395 434 447 473Denmark 712 794 873 950Finland 257 284 312 343France 2,996 3,108 3,264 3,421Germany 4,190 4,466 4,913 5,454Greece Ireland 155 176 195 211Italy 1,571 1,690 1,860 2,018Netherlands 1,347 1,499 1,605 1,732Norway 643 693 754 828Portugal 76 91 100 108Spain 962 1,027 1,119 1,231Sweden 1,066 1,229 1,433 1,629Switzerland 638 718 778 840UK 8,427 9,713 11,131 12,590 CENTRAL & EASTERN EUROPE 2,618 2,923 3,146 3,339Bulgaria 16 17 19 21Croatia 16 18 21 21Czech Republic 140 145 143 139Estonia 14 17 18 21Hungary 114 135 146 155Latvia 13 11 13 14Lithuania 12 14 16 16Montenegro 2 3 3 4Poland 615 646 677 710Romania 33 39 45 50Russia 1,079 1,274 1,373 1,451Serbia 15 17 19 21Slovak Republic 64 73 79 84Slovenia 13 13 14 15Turkey 385 411 460 509Ukraine 87 90 101 109
ASIA-PACIFIC (all) 31,328 40,036 50,908 62,792Australia 2,939 3,414 3,876 4,381Bangladesh 2 4 9 19India 382 516 706 947Japan 7,631 8,556 9,639 10,454New Zealand 305 382 420 428Pakistan 6 11 14 16Sri Lanka 5 6 7 8 NORTH ASIA 19,725 26,627 35,455 45,436China 17,268 24,106 32,761 42,589Hong Kong 335 414 522 614South Korea 1,706 1,615 1,569 1,538Taiwan 416 492 604 695 ASEAN 334 519 781 1,104Indonesia 95 136 193 269Malaysia 89 125 161 205Philippines Singapore Thailand 118 170 226 286Vietnam 31 88 202 343 MIDDLE EAST & AFRICA 1,104 1,470 1,594 1,706Egypt GCC and Pan Arab Israel 1,000 1,330 1,400 1,450Jordan Kenya Lebanon Nigeria 33 55 86 121South Africa 71 85 108 135 WORLD 102,436 119,421 139,981 160,173

89 | INTERACTION APRIL 2016
2013 2014f 2015f 2016f2013 2014f 2015f 2016f
Digital Ad Investment Change Year-On-Year %
NORTH AMERICA 9.8 12.1 11.5 8.0Canada 14.3 13.0 15.0 11.0USA 9.5 12.1 11.2 7.8 LATIN AMERICA 30.9 1.0 54.2 25.4Argentina 58.9 44.4 39.8 13.0Brazil 26.6 -24.2 107.1 34.9Chile 22.3 24.7 15.2 14.0Colombia 45.9 20.1 2.0 20.0Dominican Republic Ecuador Mexico 42.8 18.0 20.0 20.0Peru 55.0 22.0 24.3 36.2Puerto Rico 25.5 43.8 21.7 14.3Uruguay 33.3 18.8 15.8 4.5Venezuela -44.8 -63.7 -89.0 -65.7 WESTERN EUROPE 10.0 10.7 11.1 10.6Austria 21.1 11.9 13.8 10.0Belgium 14.0 10.0 3.0 5.7Denmark 10.7 11.5 10.0 8.8Finland 7.5 10.8 9.9 10.0France 3.4 3.8 5.0 4.8Germany 8.0 6.6 10.0 11.0Greece Ireland 22.9 13.9 11.0 7.9Italy 2.7 7.6 10.0 8.5Netherlands 8.4 11.3 7.0 8.0Norway 16.2 7.8 8.8 9.8Portugal 14.8 18.9 10.0 8.0Spain 1.8 6.7 9.0 10.0Sweden 14.3 15.3 16.6 13.6Switzerland 12.2 12.6 8.4 7.8UK 14.1 15.3 14.6 13.1 CENTRAL & EASTERN EUROPE 21.9 11.7 7.6 6.1Bulgaria -0.7 10.2 10.0 10.0Croatia 15.0 11.3 17.2 0.7Czech Republic 5.0 4.1 -1.5 -3.0Estonia 10.4 20.8 6.3 13.5Hungary 14.1 18.7 8.1 5.9Latvia 6.1 -9.7 11.0 9.0Lithuania 14.7 17.9 8.8 3.4Montenegro 20.0 38.9 28.0 9.4Poland 6.4 5.0 4.8 5.0Romania 22.7 18.5 15.6 12.4Russia 27.4 18.0 7.8 5.7Serbia 16.7 14.3 9.0 10.0Slovak Republic 46.3 13.3 8.8 5.4Slovenia 0.0 4.2 4.0 7.7Turkey 29.4 6.6 12.0 10.7Ukraine 201.5 3.2 11.9 7.9
ASIA-PACIFIC (all) 28.7 27.8 27.2 23.3Australia 20.8 16.2 13.5 13.0Bangladesh 30.0 169.2 114.3 100.0India 30.0 35.0 37.0 34.1Japan 8.1 12.1 12.7 8.5New Zealand 28.7 25.1 10.0 1.9Pakistan 0.2 100.0 25.0 13.3Sri Lanka 15.4 13.3 17.6 18.0 NORTH ASIA 40.0 35.0 33.2 28.1 China 46.1 39.6 35.9 30.0Hong Kong 32.9 23.7 26.0 17.8South Korea 2.5 -5.3 -2.8 -2.0Taiwan 17.9 18.3 22.8 15.0 ASEAN 57.1 55.6 50.4 41.3 Indonesia 48.6 43.7 41.3 39.6Malaysia 40.0 40.2 28.0 28.0Philippines Singapore Thailand 91.9 44.0 33.0 26.7Vietnam 35.0 180.0 130.0 70.0 MIDDLE EAST & AFRICA 6.5 33.2 8.4 7.0Egypt GCC and Pan Arab Israel 3.8 33.0 5.3 3.6Jordan Kenya Lebanon Nigeria 103.1 69.2 54.5 41.2South Africa 23.0 19.6 27.0 25.0 WORLD 15.6 16.6 17.2 14.4
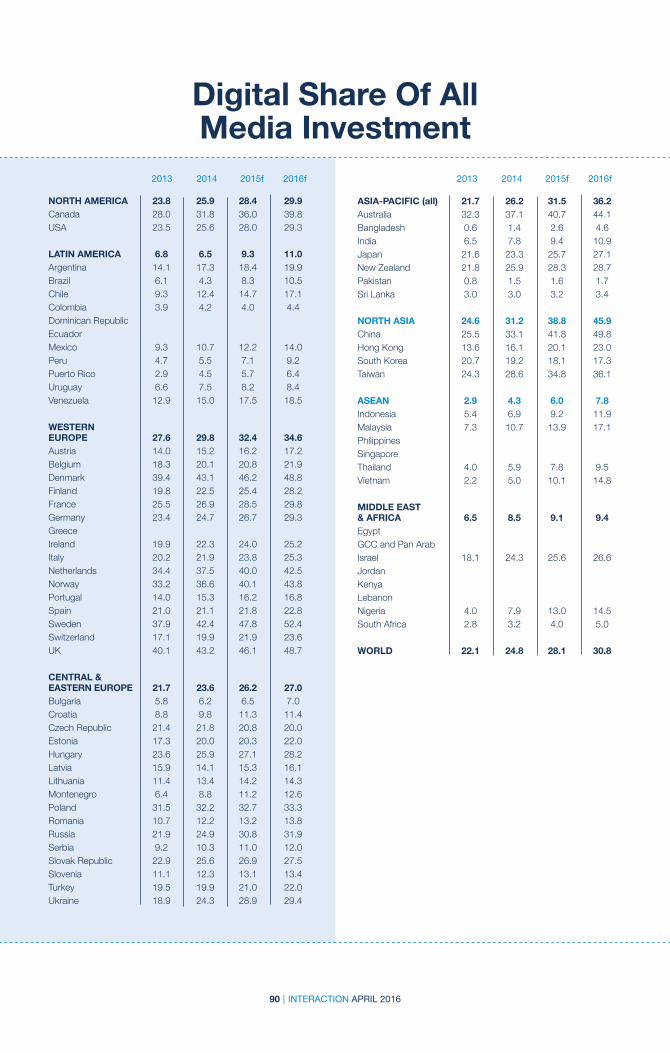
90 | INTERACTION APRIL 2016
2013 2014 2015f 2016f2013 2014 2015f 2016f
Digital Share Of All Media Investment
NORTH AMERICA 23.8 25.9 28.4 29.9Canada 28.0 31.8 36.0 39.8USA 23.5 25.6 28.0 29.3 LATIN AMERICA 6.8 6.5 9.3 11.0Argentina 14.1 17.3 18.4 19.9Brazil 6.1 4.3 8.3 10.5Chile 9.3 12.4 14.7 17.1Colombia 3.9 4.2 4.0 4.4Dominican Republic Ecuador Mexico 9.3 10.7 12.2 14.0Peru 4.7 5.5 7.1 9.2Puerto Rico 2.9 4.5 5.7 6.4Uruguay 6.6 7.5 8.2 8.4Venezuela 12.9 15.0 17.5 18.5 WESTERN EUROPE 27.6 29.8 32.4 34.6Austria 14.0 15.2 16.2 17.2Belgium 18.3 20.1 20.8 21.9Denmark 39.4 43.1 46.2 48.8Finland 19.8 22.5 25.4 28.2France 25.5 26.9 28.5 29.8Germany 23.4 24.7 26.7 29.3Greece Ireland 19.9 22.3 24.0 25.2Italy 20.2 21.9 23.8 25.3Netherlands 34.4 37.5 40.0 42.5Norway 33.2 36.6 40.1 43.8Portugal 14.0 15.3 16.2 16.8Spain 21.0 21.1 21.8 22.8Sweden 37.9 42.4 47.8 52.4Switzerland 17.1 19.9 21.9 23.6UK 40.1 43.2 46.1 48.7 CENTRAL & EASTERN EUROPE 21.7 23.6 26.2 27.0Bulgaria 5.8 6.2 6.5 7.0Croatia 8.8 9.8 11.3 11.4Czech Republic 21.4 21.8 20.8 20.0Estonia 17.3 20.0 20.3 22.0Hungary 23.6 25.9 27.1 28.2Latvia 15.9 14.1 15.3 16.1Lithuania 11.4 13.4 14.2 14.3Montenegro 6.4 8.8 11.2 12.6Poland 31.5 32.2 32.7 33.3Romania 10.7 12.2 13.2 13.8Russia 21.9 24.9 30.8 31.9Serbia 9.2 10.3 11.0 12.0Slovak Republic 22.9 25.6 26.9 27.5Slovenia 11.1 12.3 13.1 13.4Turkey 19.5 19.9 21.0 22.0Ukraine 18.9 24.3 28.9 29.4
ASIA-PACIFIC (all) 21.7 26.2 31.5 36.2 Australia 32.3 37.1 40.7 44.1Bangladesh 0.6 1.4 2.6 4.6India 6.5 7.8 9.4 10.9Japan 21.6 23.3 25.7 27.1New Zealand 21.8 25.9 28.3 28.7Pakistan 0.8 1.5 1.6 1.7Sri Lanka 3.0 3.0 3.2 3.4 NORTH ASIA 24.6 31.2 38.8 45.9China 25.5 33.1 41.8 49.8Hong Kong 13.6 16.1 20.1 23.0South Korea 20.7 19.2 18.1 17.3Taiwan 24.3 28.6 34.8 36.1 ASEAN 2.9 4.3 6.0 7.8Indonesia 5.4 6.9 9.2 11.9Malaysia 7.3 10.7 13.9 17.1Philippines Singapore Thailand 4.0 5.9 7.8 9.5Vietnam 2.2 5.0 10.1 14.8 MIDDLE EAST & AFRICA 6.5 8.5 9.1 9.4 Egypt GCC and Pan Arab Israel 18.1 24.3 25.6 26.6Jordan Kenya Lebanon Nigeria 4.0 7.9 13.0 14.5South Africa 2.8 3.2 4.0 5.0 WORLD 22.1 24.8 28.1 30.8

91 | INTERACTION APRIL 2016
2013 2014f 2015f 2016f2013 2014f 2015f 2016f
Digital Ad Investment Per User USD
NORTH AMERICA 191 209 229 255Canada 121 136 149 162USA 199 217 238 266 LATIN AMERICA 12 10 14 17Argentina 13 18 23 26Brazil 10 7 13 16Chile 17 18 19Colombia Dominican Republic Ecuador Mexico 9 10 11 12Peru Puerto Rico Uruguay Venezuela 2 0 0 WESTERN EUROPE 98 104 112 121Austria 98 98 110 116Belgium 59 65 50 53Denmark 175 189 207 220Finland 79 81 88 96France 71 72 74 77Germany 81 80 88 97Greece Ireland 47 52 57 61Italy 63 65 68 70Netherlands 107 117 124 133Norway 190 189 204 224Portugal 14 17 18 19Spain 38 37 39 41Sweden 156 177 206 235Switzerland UK 190 212 239 266 CENTRAL & EASTERN EUROPE 20 20 20 20Bulgaria Croatia Czech Republic 21 21 21 20Estonia Hungary 24 27 29 30Latvia 10 9 10 11Lithuania 8 9 10 10Montenegro Poland 29 30 31 29Romania Russia 26 29 30 25Serbia Slovak Republic 23 22 22 22Slovenia Turkey 11 10 11 11Ukraine 5 5 4 5
ASIA-PACIFIC (all) 33 35 39 44Australia 196 220 239 270Bangladesh India 2 2 2 2Japan 75 84 93 100New Zealand Pakistan Sri Lanka NORTH ASIA China 38 49 63 77Hong Kong 74 94 121 139South Korea 54 50 48 46Taiwan 25 30 37 42 ASEAN Indonesia 2 2 3Malaysia 5 6 7 8Philippines Singapore Thailand 4 5 6 7Vietnam 1 2 5 7 MIDDLE EAST & AFRICA Egypt GCC and Pan Arab Israel Jordan Kenya Lebanon Nigeria South Africa 5 6 8 WORLD 60 61 65 69

92 | INTERACTION APRIL 2016
2013 2014 2015 2016f2013 2014 2015 2016f
E-commerce Per USD
NORTH AMERICA Canada 714 834 927 1,043USA 1,334 1,488 1,674 1,962 LATIN AMERICA Argentina 48 73 102 112Brazil 81 95 90 96Chile 243 222 206Colombia Dominican Republic Ecuador Mexico 172 207 224 245Peru Puerto Rico Uruguay Venezuela WESTERN EUROPE Austria Belgium Denmark 2,120 2,449 3,074 3,266Finland 2,577 2,119 2,324 2,451France 1,301 1,449 1,627 1,740Germany 701 734 818 828Greece Ireland 1,529 1,715 1,919 2,238Italy 288 317 354 391Netherlands 584 749 1,017 1,184Norway 912 1,011 1,189 1,397Portugal Spain 363 388 480 580Sweden 641 724 844 947Switzerland UK 2,853 3,168 3,416 3,715 CENTRAL & EASTERN EUROPE Bulgaria Croatia Czech Republic 264 301 331 345Estonia Hungary 157 194 247 307Latvia Lithuania Montenegro Poland 310 319 378 360Romania Russia 245 333 403 339Serbia Slovak Republic 221 216 223 231Slovenia Turkey 133 161 198 222Ukraine 30 31 32 41
ASIA-PACIFIC (all) Australia 728 766 1,034 1,328Bangladesh India 67 63 61 89Japan 0 561 648 732New Zealand Pakistan Sri Lanka NORTH ASIA China 632 870 1,141 1,252Hong Kong South Korea 1,413 1,458 1,657 1,800Taiwan 1,161 1,636 1,984 2,482 ASEAN Indonesia 19 36 60Malaysia Philippines Singapore 245 335 443 656Thailand Vietnam MIDDLE EAST & AFRICA Egypt GCC and Pan Arab Israel Jordan Kenya Lebanon Nigeria South Africa 23 23 30 Mean 571 644 727 777 Median 473 388 480 656

93 | INTERACTION APRIL 2016
2013 2014 2015 2016f2013 2014f 2015f 2016f
Total E-commerce in USD (Billions)
NORTH AMERICA Canada 16 18 21 25USA 261 298 341 385 LATIN AMERICA Argentina 1 2 3 3Brazil 8 10 10 12Chile 2 2 2 2Colombia Dominican Republic Ecuador Mexico 8 10 11 14Peru Puerto Rico Uruguay Venezuela WESTERN EUROPE Austria Belgium Denmark 9 10 13 14Finland 8 7 8 9France 55 63 72 77Germany 36 41 46 47Greece Ireland 5 6 7 8Italy 7 8 10 11Netherlands 7 10 13 15Norway 3 4 4 5Portugal Spain 9 11 14 18Sweden 4 5 6 7Switzerland UK 127 145 159 176 CENTRAL & EASTERN EUROPE Bulgaria Croatia Czech Republic 2 2 2 2Estonia Hungary 1 1 1 2Latvia Lithuania Montenegro Poland 7 7 8 9Romania Russia 10 15 19 19Serbia Slovak Republic 1 1 1 1Slovenia Turkey 5 6 8 10Ukraine 1 1 1 1
ASIA-PACIFIC (all) Australia 11 12 17 22Bangladesh India 13 16 21 38Japan 0 57 67 77New Zealand 0 0 0 Pakistan Sri Lanka NORTH ASIA China 290 426 597 689Hong Kong South Korea 44 48 55 60Taiwan 19 27 32 41 ASEAN Indonesia 1 2 3 6Malaysia Philippines Singapore 1 1 2 3Thailand Vietnam MIDDLE EAST & AFRICA Egypt GCC and Pan Arab Israel Jordan Kenya Lebanon Nigeria South Africa 0 0 1 WORLD USD bn 970 1,270 1,574 1,805

94 | INTERACTION APRIL 2016
2013 2014 2015 2016f2013 2014 2015 2016f
Adult Internet Users (Thousands)
NORTH AMERICA 217,338 222,303 226,754 219,829Canada 21,893 22,001 23,101 23,563USA 195,445 200,302 203,653 196,266 LATIN AMERICA 164,081 193,654 212,575 224,031 Argentina 25,000 27,100 29,000 29,800Brazil 93,081 102,387 113,700 119,800Chile 6,593 7,208 7,764Colombia Dominican Republic Ecuador Mexico 46,000 47,400 51,000 55,000Peru Puerto Rico Uruguay Venezuela 10,174 11,667 11,667 WESTERN EUROPE 245,035 255,810 263,099 268,158Austria 5,296 5,938 6,032 6,273Belgium 6,700 6,700 8,871 9,000Denmark 4,079 4,197 4,213 4,311Finland 3,256 3,489 3,550 3,591France 42,287 43,290 43,950 44,250Germany 51,923 55,600 56,100 56,500Greece 4,934 5,002 5,033 5,120Ireland 3,309 3,401 3,440 3,441Italy 25,062 26,052 27,355 28,734Netherlands 12,629 12,785 12,900 13,010Norway 3,394 3,662 3,690 3,690Portugal 5,423 5,480 5,604 5,700Spain 25,465 27,517 28,901 30,346Sweden 6,822 6,950 6,950 6,934Switzerland UK 44,456 45,746 46,510 47,258 CENTRAL & EASTERN EUROPE 133,108 144,196 153,465 170,740Bulgaria Croatia Czech Republic 6,657 6,940 6,974 7,009Estonia Hungary 4,738 4,992 5,094 5,160Latvia 1,271 1,242 1,251 1,270Lithuania 1,552 1,594 1,570 1,586Montenegro Poland 21,111 21,539 22,000 24,500Romania Russia (urban) 42,310 44,691 46,032 57,410Serbia Slovak Republic 2,743 3,306 3,547 3,806Slovenia Turkey 35,831 39,985 43,000 46,000Ukraine 16,895 19,907 23,997 24,000
ASIA-PACIFIC (all) 939,330 1,139,078 1,292,700 1,422,704 Australia 14,976 15,546 16,236 16,207Bangladesh India 189,000 260,000 350,000 426,000Japan 101,228 102,100 103,600 104,500New Zealand Pakistan Sri Lanka NORTH ASIA 510,655 543,028 576,383 604,309China 458,244 489,806 522,880 550,000Hong Kong 4,509 4,395 4,318 4,404South Korea 31,400 32,602 32,985 33,405Taiwan 16,502 16,225 16,200 16,500 ASEAN 123,470 218,403 246,481 271,688 Indonesia 83,700 93,400 102,800Malaysia 19,200 20,140 24,209 25,418Philippines 36,035 39,471 47,100 50470Singapore 3,480 3,600 4,000 4,000Thailand 28,900 34,900 38,000 42,000Vietnam 35,855 36,592 39,772 47,000 MIDDLE EAST & AFRICA Egypt GCC and Pan Arab Israel Jordan Kenya Lebanon Nigeria South Africa 16,705 16,928 17,000 WORLD (million) 1,699 1,972 2,166 2,322

95 | INTERACTION APRIL 2016
GroupM is the leading global media investment management company serving as the parent to WPP media agencies including Mindshare, MEC, MediaCom, Maxus, and Essence, as well as the programmatic digital media platform, Xaxis, each global operations in their own right with leading market positions. GroupM’s primary purpose is to maximize performance of WPP’s media agencies by operating as leader and collaborator in trading, content creation, sports, digital, finance, proprietary tool development and other business-critical capabilities. GroupM’s focus is to deliver unrivaled marketplace advantage to its clients, stakeholders and people. Discover more about GroupM at www.groupm.com.
For further information about this report please contact [email protected]
GroupM Central Saint Giles1 St Giles High StreetLondon WC2H 8ART +44 (0) 20 7969 4083 F +44 (0) 20 7896 4714
A WPP Company